1 minute read
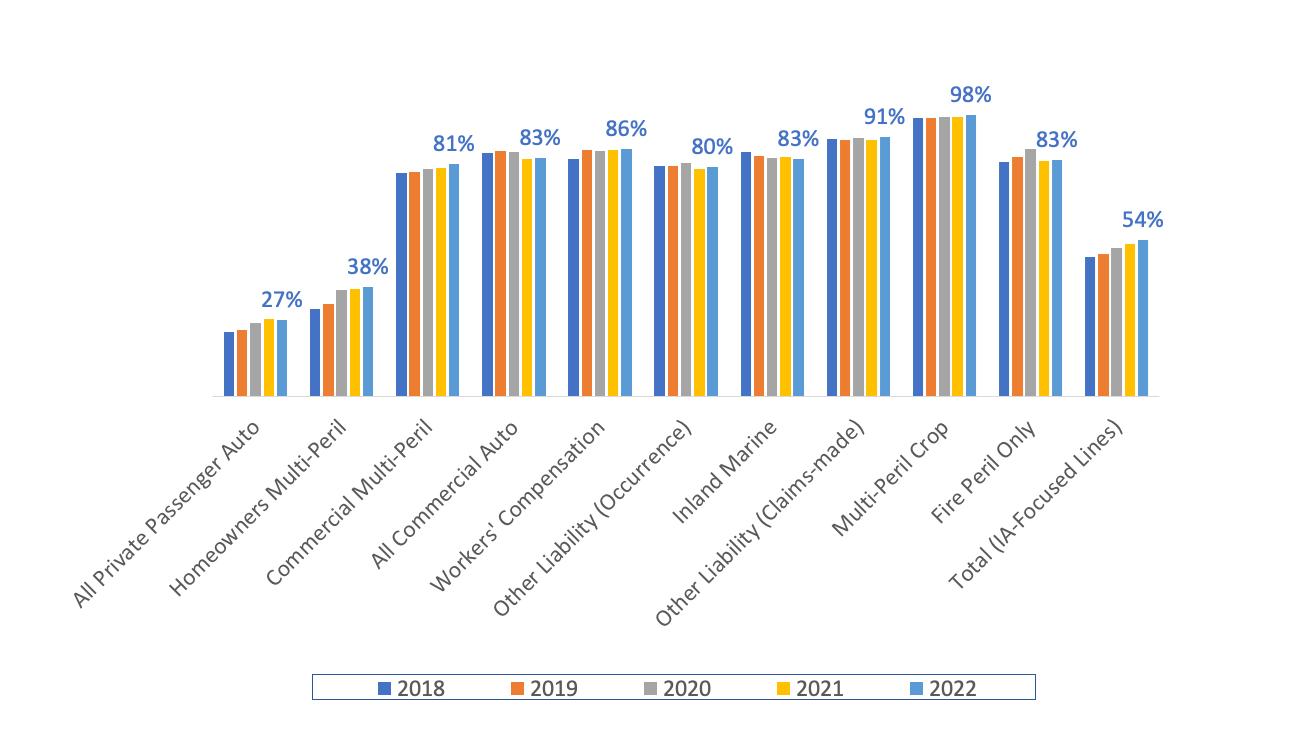
Kentucky Premium Growth Rates
Source: © A.M. Best Company — Used by Permission. (International not shown, as less than five years is available.)
The above bar chart shows the percentage change in direct written premiums for the 26 P&C lines of business focused on by independent agents. The 1-year growth rate is the percentage change in premiums from 2021 to 2022. The 5-year growth rate is the constant percentage from the first year to the last year, so the first year (2018) premium exactly equals the direct written premium in 2022. The Total (IA-Focused Lines) shown last is the average growth rates for the 26 P&C lines of business focused on by independent agents.
Advertisement
© 2023, Big I Kentucky. All rights reserved.


