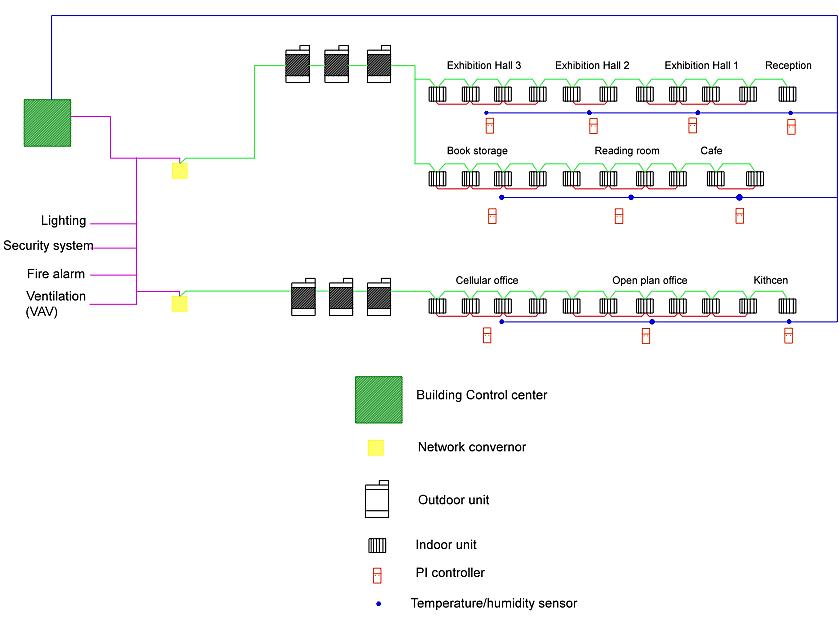
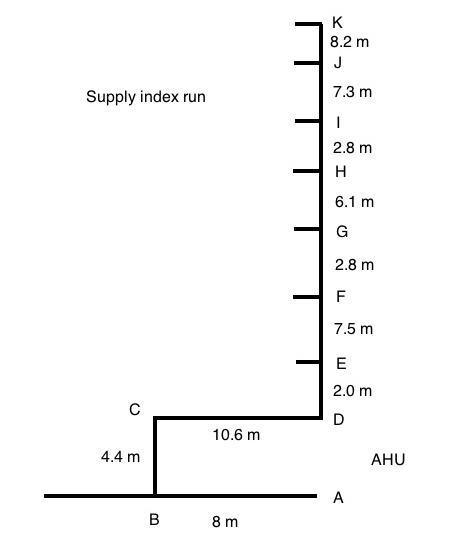
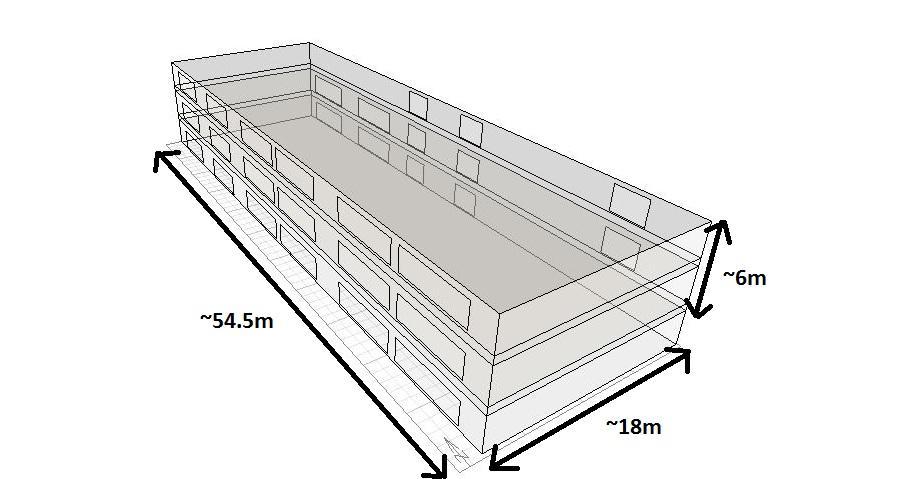
Figure 18 Schematics of index runs
2. Fresh air supply rate for the ground floor was known. It was split between zones
according to the area and it was assumed that each supply/extract point in a zone provides the same amount of airflow. 3. Velocities in ducts were chosen: 7 m/s for main ducts and 5 m/s for branches.
CIBSE Guide B, 2005, Table 3.2 suggest using 6.0 m/s for branches and 7.5 m/s for mains ducts in general offices. However, lower velocity reduces noise and reduces energy consumption (by both reducing fan power required and heat gains from the fan). 4. Diameter of the ducts and pressure drop per unit length were found using duct
sizing chart. 5. Pressure drop due to friction in ducts was found by multiplying known length of a
duct and pressure drop per unit length. 6. Total friction pressure drop was found by adding up all the pressure drops in the
index run.
Afterwards pressure drop due to the components was found. 1. Velocity pressure was found using formula: 0.5ρv2. ρ - density of air, v - known velocity in the duct. 2. Component loss coefficients were determined. 0.15 for branch fittings, 1.0 for exits, 1.7 for 90* branches and 0.67 for mitre bends. 3. Pressure drop due to components was found by multiplying velocity pressure and component loss coefficient. 34