LEILA BAHRAMI
URBAN ECOLOGY & ENVIRONMENTAL DESIGN
PORTFOLIO 2021


LEILA BAHRAMI
URBAN ECOLOGY & ENVIRONMENTAL DESIGN
PORTFOLIO 2021

LANDSCAPE RESTORATION, NJ
SEAGRASS RESTORATION IN KELP FORESTS
REVOLUTIONARY INDUSTRIES
GROWING TOGETHER
1st Place Winner, EPA Competiton


THE CAP
GREEN NEW DEAL
ECOLOGICL EXPERIMENT
PREDICTED FLOOD INUNDATION IN CALGARY
PREDICTION OF 2020 DEVELOPMENT
DEMAND IN DVR
ENVIRNMENTAL JUSTICE
SOIL INFILTRATION CALCULATION
Tell: +1(215)866-7997
lbahrami@design.upenn.edu
lbahrami69@gmail.com
Linkdin.com/in/profile
Philadelphia, PA, USA
GREEN X BLUE REDEFINERY
THE FARMTOWN IN CITY
VANDERBILT RESIDENTIAL COMPLEX
BRIDESBURG PARK
Award of Excellence, ASLA Leila Bahrami Leila Bahrami Urban Ecology and Environmental Planning professionalI am a Ecological Researcher and Environmental Planner with +5 years of higher education spanning environmental analytics, ecological restoration, GIS mapping, and visual communication, as well as hands-on experience in Urban Design and Resillient Landscape. In the past three years, I have collaborated with multiple research and design teams with diverse background on very different projects from remote sensing analysis to ecological restoration implementation and resillient landscape to solve environmental, ecological and socio-economic dilemmas in a fast-paced, enthusiastic environment.
I always have curiosity, passion and collaborative spirit to work in an innovative field and contribute my skills to improve ecology in natural and built environment and preserve the environmental balance for future generations.
University of Pennsylvania, Philadelphia, PA
Dec 2020
• Master of Landscape Architecture and Regional Planning
(Merit based Scholarship)
• Certificate in GIS and Spatial Analysis
University of ETH Zurich
• Online Certificate in Smart Cities
Shahid Beheshti University, Tehran, Iran
• Master of Landscape Architecture
University of Tehran, Tehran, Iran
• Bachelor of Architecture
Aug 2018
May 2017
Environmental Modeling Lab, University of Pennsylvania
Ecological & Remote Sensing Analyst
Sep 2020- Now
• Landcover Classification for non-classified wetland areas derived from remotely sensed images
• Created a series of maps to analyze the factors associated with deteriorating coastal wetlands in New Jersey using ArcGIS.
•Vegetation analysis through remote sensing techniques to locate and calculate the amount of endangered marsh species for future protect ion ans restoration.
Resillience Youth Network
Educatuional Chair, Founding memebr
May 2014
• Ecological skills: Environmental Restoration, LandUse and Environmental Planning, Hydrology, Climate Resilince,Sustainability
• Spatial Analysis& Cartography: ESRI ArcGIS Software Suite (Vector, Raster, ModelBuilder, ArcGIS Online) , Google Earth Engine, Environmental Modeling, QGIS
• Satellite Imagery, Remote Sensing: ArcGIS Spatial Analytics Toolbox, Image Processing ( ENVI, ArcGIS, Python)
• Programming Languages: JavaScript, Python, R Studio
• Graphic Design: Adobe Suite, Adobe Creative Cloud, Rhino, Grasshopper, Autocad, Google Sketchup, 3DSMax, Vray,Lumion
• First Place winner in 2020 Campus RainWorks Challenge Results in Demonstration Project Category
Growing Together, A community food forest for stormwater management at Andrew Hamilton School at Philadelphia, PA
• ASLA Student Award - Award of Excellence in Student Collaboration
Designing a Green New Deal
• Winner of the ISF Graduate Scholarship based on excellent qualification
• Winner of the merit-based scholarship of the University of Pennsylvania, Weitzman School of Design based on excellent qualification
•National full Scholarship for graduate studies
•National full Scholarship for undergraduate studies
Aug 2021 - Now
• Promote action to plan for natural risks to improve climate resilience in communities and the built environment.
• Raise awareness of built environment disasters though connecting with expets in climate resillience.
• Research and work on climate adoptation scenarios in urban design projects.
University of Pennsylvania
Teaching Assitant
Aug 2019- June 2021
• Co-taught Natural Systems with Prof. Sally Willing for 60+ students with non-environmental background through practical experiments.
• Organized outdoor workshops for 40+ students with non-ecology background to teach built environment and ecology as well as native plants.
• Taught 60 students in collaboration with Dr. Dana Tomlin, the founder of Map Algebra, in Google Earth Engine JavaScripts API, Python in ArcGIS(Arcpy Module) and ArcGIS API for Python.
Julia Watson Studio
Junior Urban Designer
March 2021- June 2021
• Develope nature-based technologies to bring creative and interdisciplinary thinking to urban projects and create resilient landscapes.
• Prepared proposals and site analysis regarding LO-TEK technologies for incorporated companies intrested in systematic and sustainable changes.
Viridian Landscape Studio
Landscape Architecture Intern
June 2019- Aug 2019
• Assisted in Educational Design Projects through converting final drafted plan into 3model using Rhino and SkethUp.
Lindy Institute for Urban Innovation / Drexel University
Volunteer Urban Planner
Oct 2017- Dec 2017
• Designed and developed planning framework for urban projects implementation.
May. 2021
Provide landcover classification for non-classified wetland areas to identify and protect endangered species
Land cover data derived from remotely sensed images are an important feature of environmental impact studies, policy formulations, and flood and watershed management and modeling. Landscape architects frequently use thematic data such as that provided by the National Land Cover Database (NLCD); however, this data comes prepackaged after it has undergone many levels of interpretation and decision-making. Knowing more about these datasets allows to develop literacy about the environmental information that they often take for granted.
Mentor: Keith Vandersys
“Finding” water is a key step in most land cover datasets. Making material distinctions using multispectral imagery involves a great deal of interpretation as it is dependent on the detection index, satellite schedule, and tidal variation. This series of images shows different boundary locations between land and water depending on which classification method is used.
Multispectral imagery set within New Jersey coastal context.

The position and area of land/ water changes depending on the water detection method. This image compares the outcomes of three of the most widely used indices: mNDWI; TCW; and NDVI.
Existing wetland datasets are woefully insufficient for accurate modeling of vulnerable coastal conditions. This set of images shows the difference in a model created with NLCD (Right) and site-collected data (Left).


TWI Wetland Classing


Image comparing existing landcover data (NLCD) and custom high-resolution wetland landcover data created by using UAV multispectral imaging.


INTERNATIONAL LANDCOVER CLASSIFICATION

NLUD Land Cover Classification (1000 m)

EU Land Cover Classification (500 m)

India Land Cover Classification (100 m)
The application of different international landcover classification standards to the same image clearly demonstrates how the spatial and thematic structure of various classification systems frame our understanding of the landscape. A comparison among the legends shows similarities and differences in how land cover themes are defined.
The application of different international landcover classification standards to the same image clearly demonstrates how the spatial and thematic structure of various classification systems frame our understanding of the landscape.


A comparison among the legends shows similarities and differences in how land cover themes are defined.
China Land Cover Classification (1000 m)
Coastlines are migrating upland faster than at any point in recorded history. As dunes and coastal marshes disappear, the need for littoral adaptation increases. In recognition of this, the United States Army Corps of Engineers (USACE) has placed an increasing importance on developing sediment placement strategies for restoring deteriorating coastal wetlands. These strategies, however, are still experimental and need to be monitored to track their performance. This project’s goal is monitoring and analyzing a recent sediment placement on Sturgeon Island in the Great Sound Bay of New Jersey.

Composite image comparing the land/ water boundaries of five different water detection indices.


Seagrasses are all being lost globally, contributing to fewer carbon stocks on bed and in turn blue carbon emissions. Seagrass restoration has become a common management tool for recovering the ecological functions and services lost due to habitat fragmentation and degradation. The intervention phase is divided into two parts. Firstly, to avoid seagrass loss by improving water quality. Specific methods include reducing eutrophication, managing urban water systems by adding treating ditches and ponds, and supervising the industrial infrastructure applied on the site in order to formulate a protected water shoreline. Secondly, it comes the phase of restoring the disappearing seagrass. It’s important to improve sediment instability caused by excessive bioturbation before planting.

 Soil De-eutrophication
Sediment Modification Manual Transplanting
Urban Sewage Treat Systam
Total site area: 5.96 km x 3.15 km = 18.774km/2 = 18775000 m*2
Restored Shoreline Kelp Bed: 3.4% x Site area = 635000 m2 = 63.5 Ha (Sediment Modification Area+ Mechanical Micropropagation Area)


Carbon intake = Total C sequestration = The hectares of patches transplanted x 0.89 Mg C Ha-1 yr-1 = 56.5 Mg C / yr
Relocated Inland Seagrass Marsh: 0.9% x Site area = 179000 m2 = 17.9 Ha (Goleta Slough Manual Transplanted Area + Urban Water Purified Area)
Carbon intake = Total C sequestration = The hectares of patches transplanted x 0.89 Mg C Ha-1 yr-1 = 15.9 Mg C / yr

Mitigation Potential: 72.4 Mg C / yr

Uncertainty: standard error of seagrass decline rate, unstable emission rate of kelp
The intervention is expected to imrove the long-term water quality, air conditions and biodiversity. When seagrass is successfully propagated, the amount of sea urchins decline which will in turn attract sea otters. The return of otters and other native animals will further contribute to the revival of seagrass meadow ecological system.
Moreover, the anti-trawler actions along some parts of the shore and lucid water will make more regional natural resources alive. Residents and students nearby acquire a better living environment and a space for ecological education. The carbon export to adjacent ecosystems through direct transport of seagrass detritus and through the spread of faecal matter takes energy to fisheries, stimulating their productivity.
Unintened consequences include excessive sediment management, sulfide concentration as well as huge cost.
177,044 gallons of gasoline consumed = 1,733,660 Pounds of coal burned
= 26016 trees seedlings grown for 10 years

ASLA Award of

Excellence

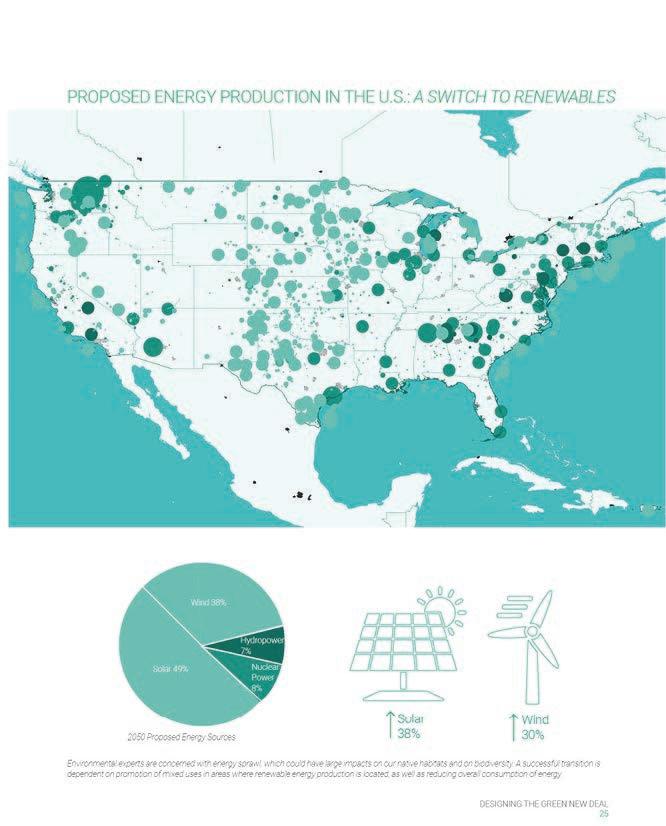






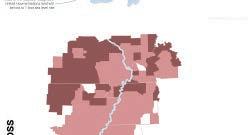


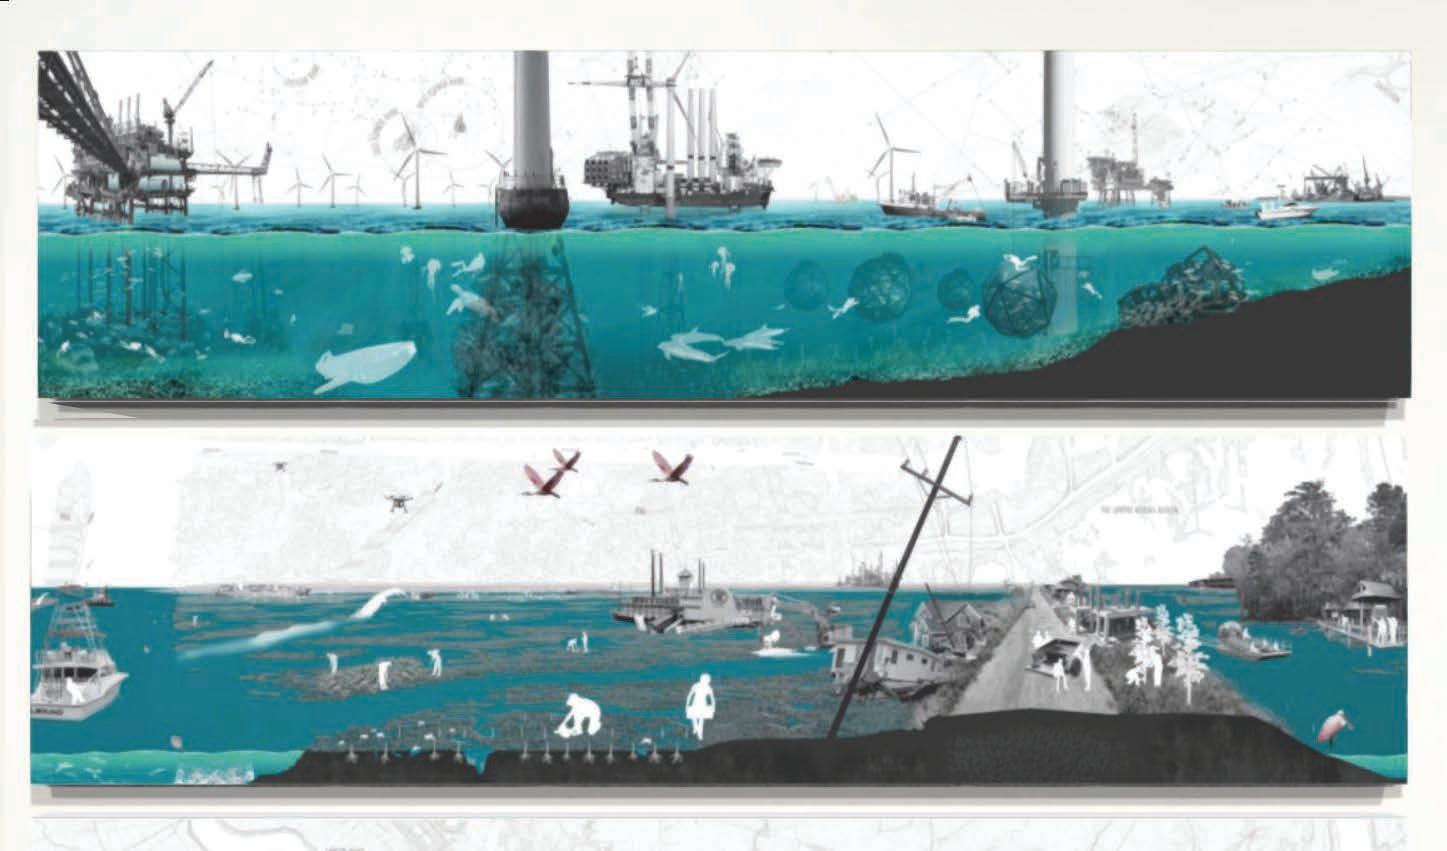
The Delta region’s legacy of dispossession and natural resource extraction is the starting point for our vision of the Green New Deal in the Delta, which builds upon the strong foundation of organizing and resistance in the South.

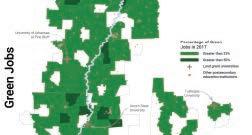


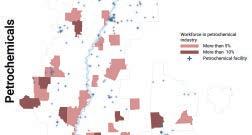


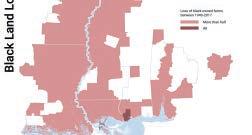


A massive public investment in housing offers people liv ing in vulnerable areas the opportunity to live in safe and connected communities. A restored coast gives rebirth to a once-thriving fishing industry and reinvigorates the re

Restored coastal marshes sequester carbon from the atmosphere. Oil rigs are decommissioned and replaced by wind turbines, which support new coral reef growth. These remediation efforts create opportunities for high-wage jobs while building ecological buffers against future storms.

Urban Ecology
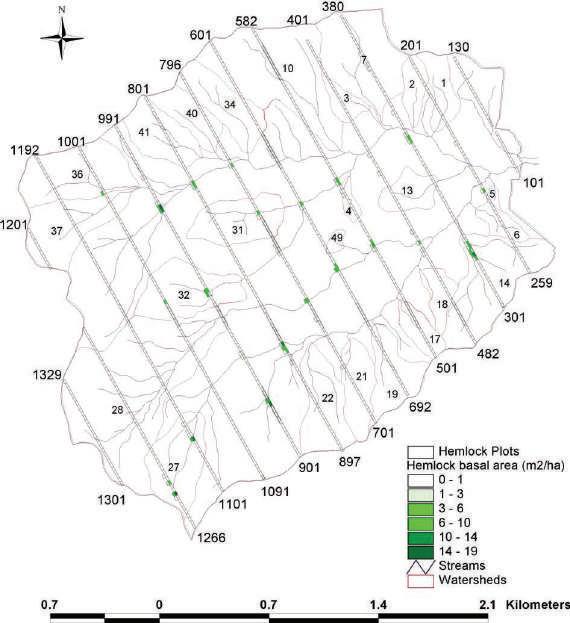
Long-term changes in manged and unmanaged forests in Coweeta Hydrologic Lab

Dec. 2020
The experiment site located in southern Appalachian forests. Coweeta Hydrologic lab is part of the Coweeta LTER dedicated to developing process understanding of ecological dynamics in mountain deciduous forests. In this study, the experiment explored the influences of large-scale disturbances and vegetation responses on ecosystem processes.
The study question focuses on changes in vegatation patterns influenced by natural and managed disturbances and then described the linkages between long-term vegetation measurements and water yields and quality responses.

Sampling Plots
• plot size:
• numbers:
• suitable sites: human-populated
- within Yellowstone National Park
- near Yellowstone Lake
- near roads
- near trails
- near rangelands / pasture lands
- near lakes or rivers


• Plot size: 8 hectares
• Number: 10 plots
• Suitable sites:
- higher elevation areas
- near hotsprings
- near animal habitats
- near grasslands/shrublands
• Plot size: 8 hectares
• Number: 10 plots
• Suitable sites:
- less natural disturbance

- protected areas as soil, water..
- less animal accessiblends
Treatments Timeline

Usually, a combination of these treatements needs to be applied at a given site for removal to be effective.
These methods are recommended to be applied at different times across the span of 10 years to truly see effects. This timeline would indicate how this experimental study would apply a cocktail of these methods to the Reference Plots to eradicate invasive species.
Measure & Time: Disturbed Plots
Human Disturbed Plots
Installation of sampling plots are

Recordings of existing on-site invasives native species and wildlifes are taken Invasive
Naturally Disturbed Plots
rapid
some non-native animal species are already present due to the existing nvasive species as ood source
already present due to the existing nvasive species as ood source
spread of some invasive species some native plants are displaced by invasives
invasives appear along roads some invasives can become more palatable or wildlife this stresses plants that are not adapted to grazing
more invasives appear along roads not adapted to grazing
with no known competition plants more invasives colonize the site invasives change the soil condition this in turn, changes the plant community and growth of native plant species
no known competition plants more invasives colonize the site
native species convert to eed on invasive species
some
Observation of influecne of vegetation change on wildlife, nutrients,soil and the other function of ecosystem Year 0 Observation and selection of sample plots in higher elevation and upland of yellowstone headwater watershed observation of invasive species and native plants
Year 3 Year 5 Year 10
Observation of the pattern and rate of spreading of invasive species in the site and it’s short-term effects of on native plants plant community
more non-native animals appear on site Study the long-term effects of invasive plants on ecosystem as reduce bio diversity, Increased frequency of wildfires Water shortages
some native wildlife species are orced out due to lack of ood source
Data Visualization




Arc GIS R

Calgary, CA
Flooding is a common type of natural disaster which could cause huge economic and social damages. In this project, we built a model using logistic regression to predict the flooding inundation of Calgary.
In the feature engineering phase, we took three different categories of variables, including Geographical and census data, spatial, and hydrological data as predictive variables to capture the characters of flooding locations. For instance, we included Flow Accumulation,, Flow Length, Basins, and Distance to water bodies to represent the hydrological condition of Calgary. These variables then, have been put on fishnet to determine their association with flood in 2013.


March. 2020 Group Work with Haitian Wang
CPLN675
Mentor: Ken Steif
Hydrological
Flow Accumulation Flow length Basin Distance to water bodies
The next step for our model process is split data randomly into 70% training set and 30% test set and then build the model on training set and validate the model on test set. The dependent variable for our regression model is flood inundation ranges from 0 to 1. 0 for non inundation areas and 1 for inundation areas.


As the result of logistic regression, we can see that “The variables are statistically significant in our model at a 90% confidence interval except for four variables: tree density, flow accumulation,basin, and flow length. After modeling the logistic regression. Our AUC was 0.9617, which indicates that our model is very good at discriminating between flooded and non-flooded.


We also performed a Cross validation presenting a 0.9650 accuracy, which means our model is quite solid in prediction. As observed, the predicted flooding area fits in the trend of actual flooding area while presenting a larger coverage with both severely and mildly affected areas. This is because our model is based on many hydrological variables .

 Logistic Regression
Model Validation - Class Probability
Model Validation - AUC Curve
Cross- Validation
Data Visualization


Arc
The study adopted a quantitative approach, along with regression analysis to predict future development.

The change of land cover from 2001 to 2011 indicates major developments in the decade.


Delaware, USA
May. 2020 Group Work with Haitian Wang CPLN675
Mentor: Ken Steif
The DVR as core urban clusters of the Greater Philadelphia Region connects five adjacent states. While population grew from 5.1 million to 5.6 million, the developed area expanded by 1.5 times, signaling significant urban sprawl. The DVR region is forecasted to receive over 658,000 residents and more than 372,000 job opportunities from 2015 to 2045. (DVRPC, 2017) The region will face severe environmental damage if urban clusters continue sprawling at the preceding speed. Therefore, a projection study of future development demand will help observe development patterns and strategically alleviate sprawl through formulation of policy instruments.
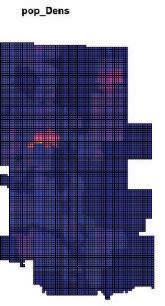
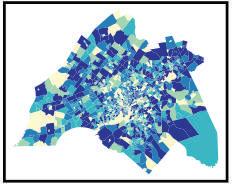
Population is the foremost driving factor in development since an increase in population will bring about growth of density and employment. Intensive population growth has been observed in the north of Philadelphia.



In view of the high level of auto-dependency and consequently highway-oriented development patterns, our assumption is that development demand is likely to occur near highways to access better connection to destinations.


To achieve a level of accuracy, the study used the roughly one-acre grids as units of analysis. By spatial join data including land cover change, population distribution and distance to highway to the grids of both 2000 and 2010, we used logic regression analysis to study the development patterns. Based on the hypothesis that future development demand shares continuity of current development, the patterns learned from the previous decade would serve as the model of development demands in the upcoming decades.


The spatial lag (i.e. the calculation of spatial weighted average) to 2001 development illustrates development probabilities. Higher chance of development occurs in the periphery of the region and close to certain sections of the highway networks. Land cover change also indicated positive correlation with population change from 2000 to 2001. Among different types of land cover, farmland has the highest conversion rate, follow by developed land and forests, at 1.16%, 1.07%, and 0.67% respectively.


2010 prediction was based on analysis of six logic regression models. As observed, most developments have been predicted with probabilities of lower than 20%. The model failed to provide robust results. For example, 5% threshold correctly predicts a lower number of new development areas (Sensitivity) whereas incorrectly predicts a higher number of not changed areas (Specificity). Similarly, all counties demonstrate higher numbers of incorrect 5 predictions of not


ARC GIS + HECGEOHMS
calculate runoff potential using soil and land use data with ArcGIS and HEC-GeoHMS extensions
In this study it has been tried to use ArcGIS to wrangle the land use data and then relate it to the soil database and calculate curves using a specialized extension.


HYDGRP – stands for soil hydrologic group. Ranges from A,B,C,D. Based on grouping of soil types that have the same run off potential.
A are soils having high infiltration rates; chiefly sands or gravel.
B moderate infiltration.
C slow infiltration.
D very low infiltration like clay
May. 2020
CPLN675
Mentor:
Ken Steif
Using HEC-GeoHMS extension in ArcGIS for taking land cover and soil type as inputs and creating a curve number (CN) based on a set of assumptions about how the two inputs interact to produce a certain amount of runoff given a certain volume of rainfall. The HEC-GeoHMS extension essentially relates these categories of information in ArcGIS and calculates CN figures using a database called “ssurgo” (a national soil survey) and an algorithm that is used to estimate runoff.
This curve number can be used as a parameter in other models to understand how much of a landscape in a given watershed will drain overland into a water body or into a sewer system. This is important for understanding the degree to which runoff may cause risk of flooding.
In the last step union the soil data shapefile data to landuse polygons and get rid of geographic artifacts and then creating a table with data related to Curve Numbers to understand the relationship between landuse and soil type with respect to run off.
Add the Soil Data and associate each geometry a measure of soil typ.
Classify the polygons based on the percentage of soil type by adding 4 percent fields.


Generating CN Grid using HEC-GeoHMS extension and then comapre it in the table left.

Landscape Planning
NEW PROPOSAL FOR RESILLIENCY BY CREATING NEW JOB OPPORTUNITIES THROUGH ATTRACTING ART-BASED INDUSTRIES IN ATLANTIC CITY
Atlantic City NJ, USA
New Jersey’s Urbanism relies alot on coastal’s industries. In recent decades, coatal areas suffered severely from sea level rise and storm surge during rapid climate change. The inequalities of climte change has affected these industries drasrically and therefore has created strong social and economic divides along these coastal communities.

Dec. 2018
Individual Work
LARP 601
This proposal sets up a strategic framework on smart landuse and focusing investement and development on new industries in Atlantic city as the cultural capital of New Jersey state with the emphasis on creating new job opportunites for the indigenous people as well as strengthening the tourism attraction and making money.
Mentor: Ellen Neises
In this propsal, Landscape is the bridge to tie tourists, local residents and industries back to the envirnment. It provieds opportunities for a resillient and sustainable development framework.


Atlan�c
Great
: Median Income, Low Poverty rate, Stable Economy, High Flood Risk


Toms River : High Income, Low Poverty rate, Strong Economy, High Flood Risk


Physical Vulnerability
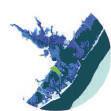
Sea level rise 2050


With 3ft SLR the coast and lower central parts sink under water

Sea level rise 2100

with 6ft SLR about 90% of the city sink under water
Construction history
old housing in high risk areas in vulnerable to climate change.
wide range of ameni�es and entertainment within the city
The rich history within the urban context of the city
poten�al of developing new indus�es in vacant lands within a�rac�ons

poten�al of flood protec�on wi�hin natural features Tourism a�rac�on
Boradwalk limita�on
limited access to water
less liveliness
Not enough tourism a�rac�on within in the city
phusical and social vulnerability
severe damages all over the city due to frequesnt floods
Renewable Enrgies Mangroves Boardwalk


In order to save the city from bankrupcy and unwanted commiunity migration, the new propsal refers to developing revolutionary industries, art-based industries, as a new tourism attraction which help not only to improve stagnant tourism industry in the city but also to highlight cultural values of AC and help to flourish the city.


tourism attraction

new as artbase industries portable structure for holding temporary events

redesign the vacant lots to fit new industries


Find opportunities for Adoptive reuse of vacant hotels and vacant lands for developing new industries

survive the city from bankruphighlight cultural and historical values of the city making money through new industries


mangrove as flood protection buffer wind power energy very old and vulnerable housing
large amount of vacant lands casino and hotels gambling as one of the main industry gambling as one of the main industry


redesign vacant lands holding events on roof tops
reuse of vacant hotels for events
reuse of lower floors for events


coast line



vacant
historical/cultural landmarks proposed open space for event

Existing green space
potential of holding events
different quality of space
Functional open space in different time


Rainwork Challenge
Competition Philadelphia, PA Dec.2020 Team work
With a lack of green space, access to fresh and healthy foods, and stormwater management systems, Andrew Hamilton School is in need of sustainable and food-producing green stormwater infrastructure (GSI) that would benefit both the students and the community of West Philadelphia. Our design will lower the school’s stormwater fee, mitigate flooding in the community, alleviate the urban heat island effect, and provide access to fresh healthy food for students and the surrounding community.
Mentor: John Miller
We propose a plan that will incorporate a green roof, rain gardens, raised beds, a food forest, and permeable pavers. To improve students’ engagement with GSI, our project will also incorporate educational signage, the development and implementation of both hands-on watershed-focused and nutrition-oriented curricula, and a mural created by the school’s students depicting the role of water in urban sustainability and resilience.

The school had to pay $13,000 every year in stormwater fees. After redesigning, the school will save $10,560/yr
Total Investment: $120,166
Net Present Value: $131, 698
Investment Return: 8.798 %
Green Spaces Signage
Reduction in Overall Impervious Area: 20,020 sq. ft


Reduction in Directly connected impervious area: 12,455 sq. ft


Percentage increase in CO2 Sequestered (lbs CO2/yr): 873%
Area of Protected/restored native species: 25,675 sq. ft

Annual Groundwater recharge: 29,339 gallons
Roof Area Shaded by Vegetation: 15, 500 sq ft.
Surface Run-Off Rainwater Garden


New York, NY, USA May. 2019 Group Work with Zipping Zheng LARP 602
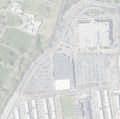
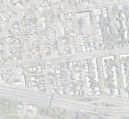
The concept of Tri-boro line was introduced by RPA as the infrastructure investment that directly links the the east borough with the Manhattan-centric subway system. Based on the study of the Tri-boro line, the studio elaborates the dirct impacts of this potential on the neighborhood adjacant to the propsed station stops.
The selected site is in Queens, New York City. It Lies next to St. Michael Cemetery and close to La Guardia Airport and M, R Train Northern Blvd Station. Because of its location within the regional context, our site has great potential to be developed in the future which provide new housing, new working space, new business, and new connections through Tri-Boro line and subway.
Mentor: Nicholas Pevzner
This is a sustainable urban design project that emphasize on greater mobulity, better access to jobs, and opportunities for transit oriented development.
It reconnects the isolated districts and establishes a continues network of public realm and amenities and change it into a destination for both New York city and surrounding neighborhood.

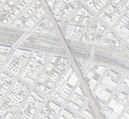
Brooklyn queen expressway as Barrier Grand central Parkway as Barrier


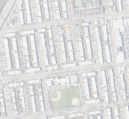
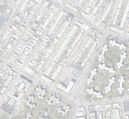








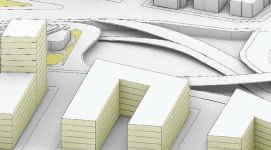
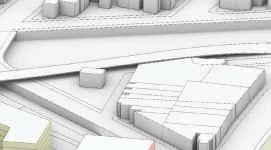
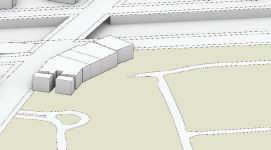

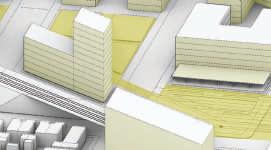

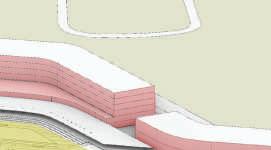



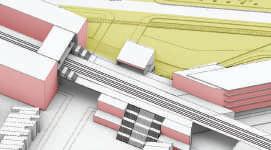


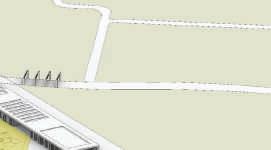


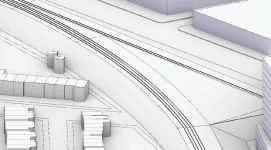
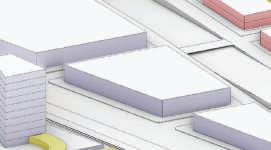
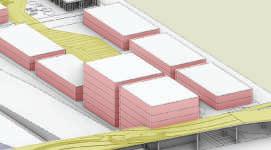


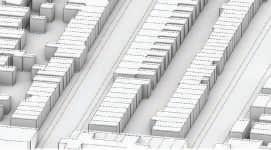


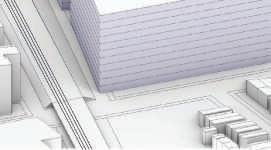


Grand Central Parkway Capping Park - Mixed Use Residential District Development


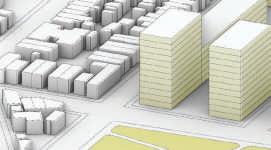
Cap park connecting isolated neighborhoods by highway.
Cap park creating central public ralm in middle at the heart of the walking system at top of the highway
Plaza Daily use
Mixed Use Development on top of BQE Capping - New Gateway of St.Michael Cemetery


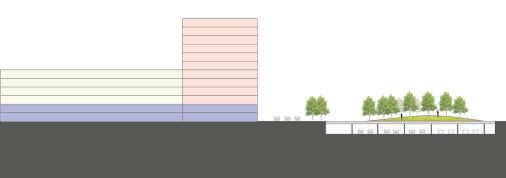

Bridging Park - Auto Industry Cluster - Mixed Use Development - Commercial District
Bridge park over haighway connecting neighborhoods
Plaza Event Time
flexible open space for big events
corridor +green area corridor+entrance Outdoor seating area stairs+seating area
Central Public Realm and different activity

briding park over the highway
flexible open space for big events seating area
dedicated bike lane continues pathwalk
corridor toward the cemetary station big plaza mix-use station buiding
Year 1
Remove solid pavement; excavate wetland; refill peatland; build solid riverbank sow grass and legume sow forest (too small in the begining)
Year 5
Mature wetland; mature peatland; mature grassland; half matured forest to clean air pollution
Year 15
Expanded wetland; richer peatland; shrunk grassland with trees
Philadelphia Energy Solutions’ Refinery Complex Competition

Philadelphia, PA
Given the 1300-acre Philadelphia Energy Solutions (PES) Refinery site located along the Schuylkill River in southwest Philadelphia, we reinvisioned the site as a GreenXBlue hub to bring livability to the city as well as creating resiliency in this highly polluted site.
Dec.2020 Team work
The design elements are as follows: Preserve Philadelphia’s post-industrial character through industrial-to-park adaptive reuse approach to transfer NIMBY use into public accessible open space, and interactive wetland parks. Enhance community involvement in the planning procedure of post-industrial transition, bring equity and transparency to the public in the nearby neighborhoods.
Establish an urban framework and transportation network to better connect to nearby neighborhoods and enhance inter-neighborhood circulation. Provide building space for value-added industries, manufacturing and logistics that will enhance Philadelphia’s comparative advantages, boost economy and provide job opportunities for refinery workers and other Philadelphia’s essential workers.


San Jose, CA, USA
May. 2020
Individual Work
LARP 702
Mentor:
Marcel Wilson
Ryan Buckley
Katy Martin
Historically known as the valley of Heart Deligent, San Jose produced a significant amount of fruits and vegetables for nearly two centries until 1960s. The emergence of tech companies accelerated the urbanization and contributed to the rapid decrease of farmlands. Today, City of San Jose is faced with many social and envirnmental problems that came along with rapid urbanization, such as food insecurity, lack of public open spaces and homeless issues. The proposal transforms the 238-acer neglected green space into a vibrant urban park through promoting a wide range of recreataional and agicultural activitesin the park. The proposal includes a framework to revitalize the neighborhood and enhance the connection between the park and its surrounding neighborhoods. The new park circulation is defined to make a continiues connection among the three main activity zones in the park as well as connection with the city.









22% 18%
employment population growth median Age
11% 82%


Much of the land today has been transferred to urban footprint, though it is the most productive and high-quality land for food production.




Before the arrival of computers and information technology, San Jose hada200-yearhistory of prosperous agricultural output.




Creating different quality of space in the park for different groups of users from daily office workers to family and young childrens to have fit their needs in different time


 Entrance Plaza View
Riverside View
Multi-Purpose Amphitheater View
Native Vegetated Mounds
Dedicated Boarwalk
Vegetated Terraced Riverside
purifying Plants Along the River
Professional experience
SO LLC
NewYork City, NY
May.2021
Individual work
During my experience in Julia Watson LLC, I had the chance to practice collaborative work in real context and become skillful and experienced enough to prioritize and manage design and research projects with proficiency. Venderbilt project is a residential complex which a wide range of variety in landscape naming as Rood terraces, Courtyards, Circulation gardens... We collaborated with architecs to design the most suitable landscape for the places. I worked on preparing detailed sections introcing ecotones, plant species and quality of spaces and then prepared rendering in Rhino and Vary for some areas. In Julia Watson studio, I had the chance to research and work with Julia Watson, a leading expert of Lo—TEK nature-based technologies for climate-resilience, to develop creative and conceptual, interdisciplinary thinking to urban projects and corporate clients interested in systemic and sustainable change.


07 Workshop

Philadelphia, PA
Dec.2019 Team work
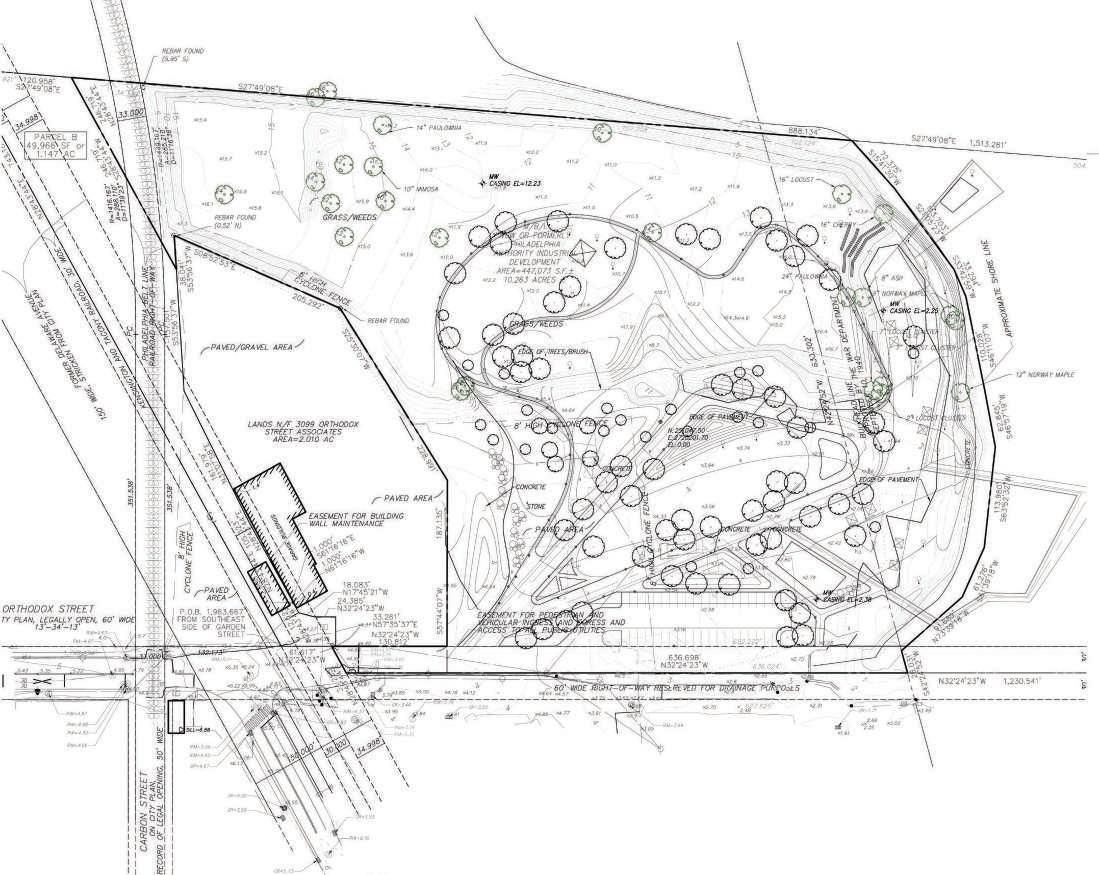
The riverfront community park located in Philadelphia has been selected to practice design and provide construction detail for implementaion over the course adavanced workshop. The main points are as follows: Work on technical aspects of site design, with an emphasis on site grading, site engineering, and landscape performance. Functional consideration related to landscape and associated systems were explored as vital and integral components of landscape design, from concept to execution.


Grading Plan

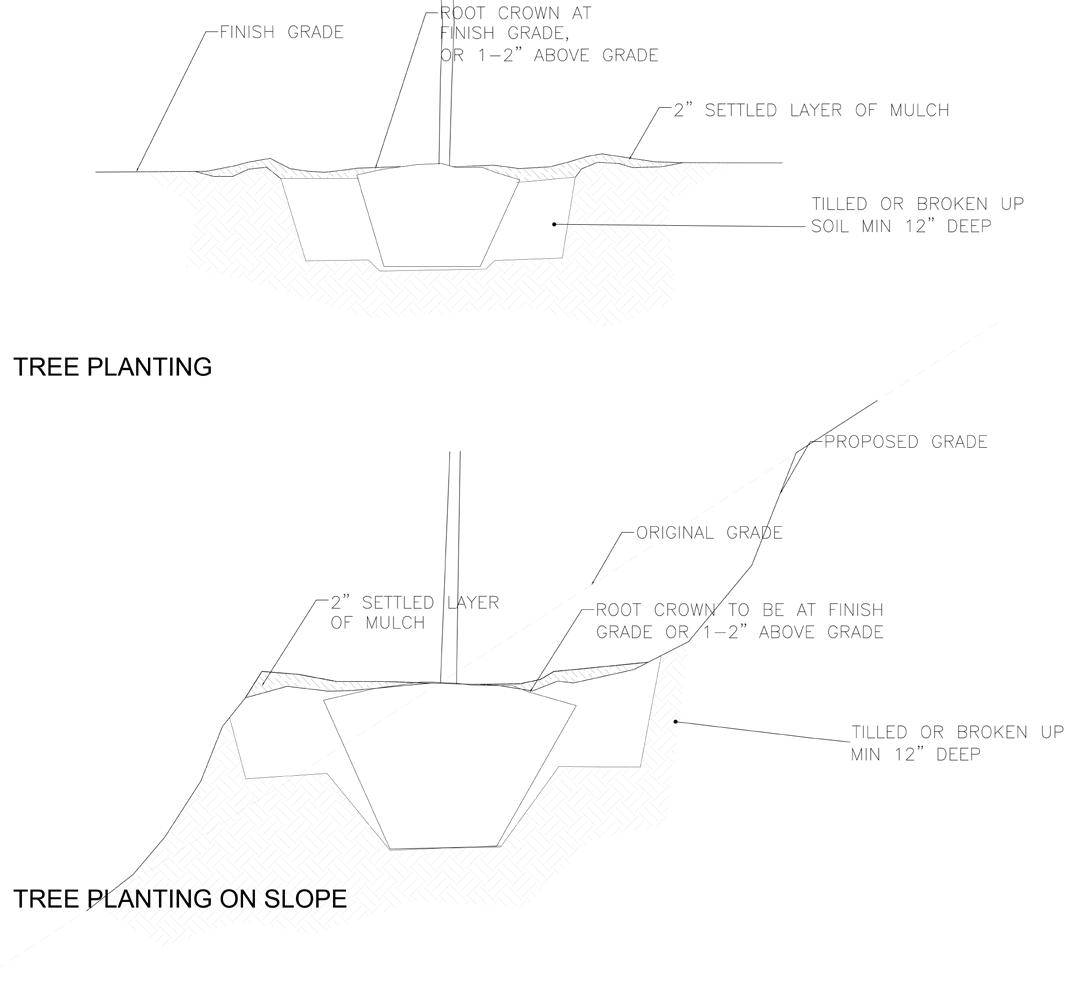


 Planter Section Scale 3/4” = 1’
Plarking Lot Section Scale 3/16” = 1’
Enlargement Planting Plan
Enlargement Planting Plan
Enlargement Material Plan