20 minute read
INCREASING SURGICAL PRODUCTIVITY AT ERASMUS MEDICAL CENTER


MAARTJE ZONDERLAND AND AD BOGERS
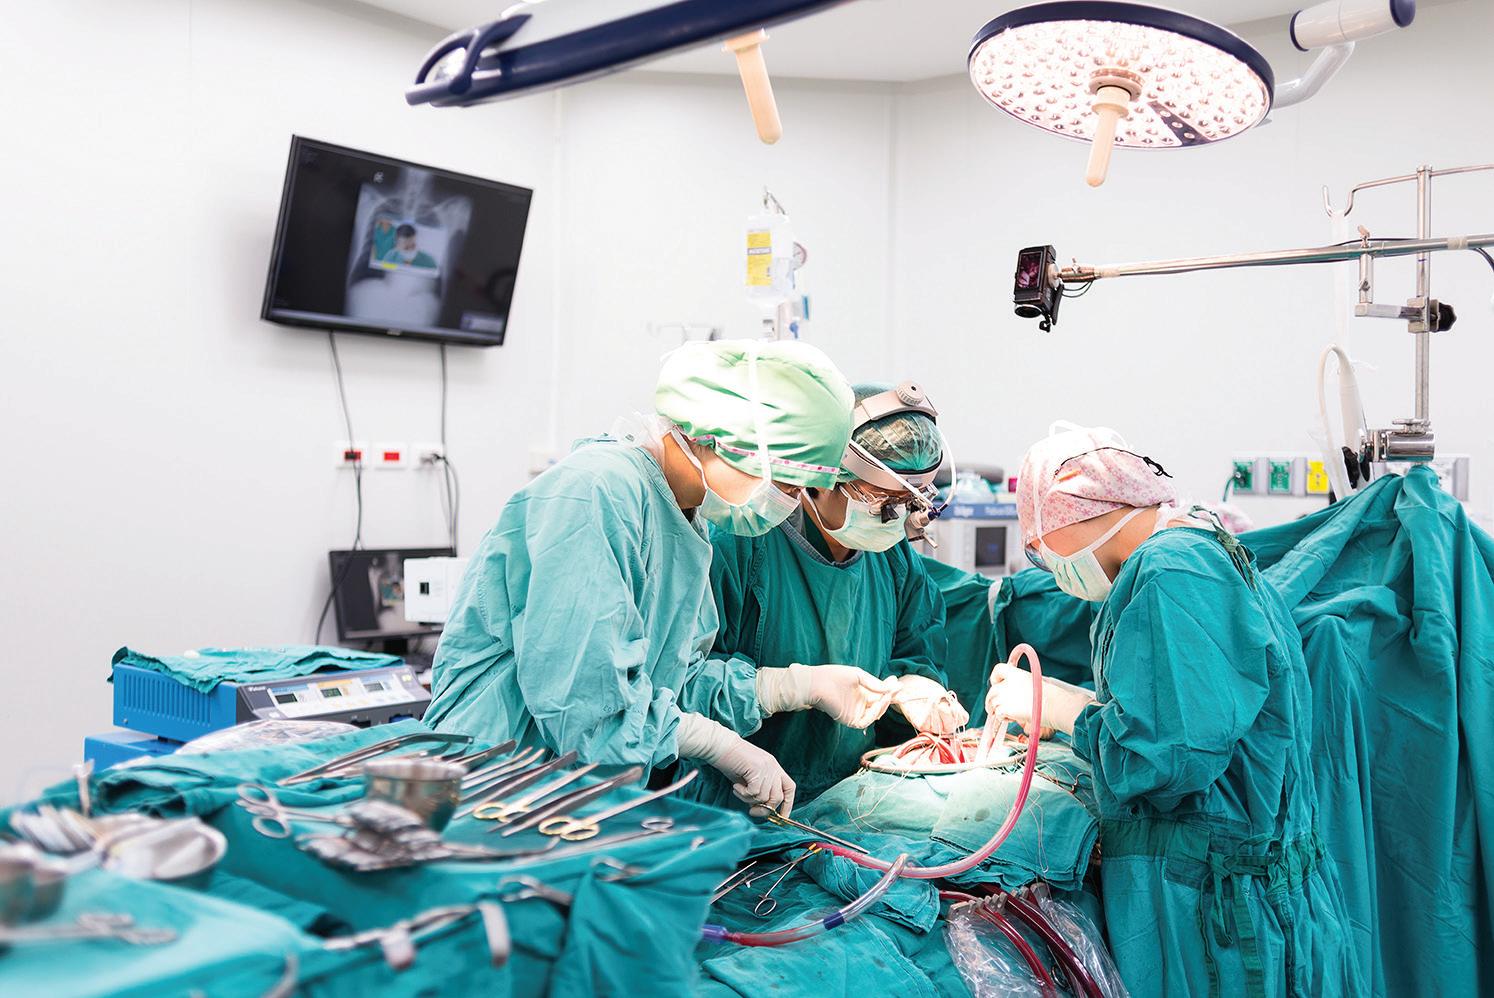
ERASMUS MEDICAL CENTER (EMC) is one of the largest hospitals in the Netherlands, situated in the densely populated region of RotterdamRijnmond. During the first wave of the COVID-19 pandemic early 2020, EMC served as the national crisis centre from which hospital capacity in the Netherlands was centrally coordinated. As a tertiary university hospital, EMC’s Thoraxcenter is a supra-regional referral centre for
© Aerovista Luchtfotografie/Shutterstock

cardiology and cardio-thoracic surgery. The Thoraxcenter experiences fierce competition, since eight other cardiac surgery centres are situated within an 80km radius. In order to attain economy of scale and to be able to provide the necessary regional cardiac surgical service, the EMC decided to increase the number of open heart surgeries (989 in 2015) with 150 extra in 2016, 2017 and 2018 (450 in total). After successful budget negotiations with EMC’s prevalent healthcare insurer, for 2016 a goal of 150 additional surgeries was indeed set. Here we describe how we were able to increase surgical productivity. For more detail, please see Zonderland et al (2020).
THE CHALLENGE: INCREASE MARKET SHARE AND INTRODUCE CAPACITY MANAGEMENT As in many hospitals, paradoxically staff experience high work pressure, while at the same time a significant part of capacity is unused. Long and highly variable surgery durations, many (10%) urgent patients and the intensive surgical preparation of patients (for example: dental sanitation, additional diagnostics, physiotherapy sessions and adjustment of medication) is typical for this patient cohort, thus introducing additional patient flow issues. Also, EMC’s market share for open heart surgery was only around 50% within EMC’s catchment area, compared to 85% for other cardiac surgery centres in their catchment area. Increasing EMC’s market share to 85% would mean an additional 450 open heart surgeries per year. In addition to attracting the additional referrals required to receive these additional patients, capacity management was required to increase utilisation, reduce work pressure and improve operating room (OR) patient planning. Also, the long access time (defined as the time between the request for surgery and the day the surgery takes place) of 12–14 weeks had to be decreased to 2–3 weeks.
THE APPROACH: INTERVENTIONS ON SEVERAL LEVELS, COMBINED WITH STRICT PROJECT MANAGEMENT Two external consultants were hired for project management, problem analysis and implementation of necessary interventions. The project started with a thorough examination of the waiting list. Patients who weren’t eligible for surgery anymore were removed from the list. As a result, the waiting list was reduced by 15%. For a sustainable increase in the surgical production, more referrals were required. This was achieved by the cardiac surgeons reaching out actively to referring cardiologists in the hospitals surrounding the EMC and discussing the advantages of referring cardiac patients to the Thoraxcenter.
From a capacity management perspective, the most important intervention was increasing capacity by extending OR opening hours. This was enabled by hiring additional OR staff and anaesthesiologists. The extension of opening hours had two main advantages: long surgeries (more than eight hours) could more often be finished within regular working hours, thus reducing the probability of staff working in overtime. Also, with an average surgery duration of almost five hours, the original 8-hour shift was usually too short to perform two surgeries. With the new 10-hour shift, this problem was eliminated and thus capacity was used more efficiently.
To improve the scheduling of urgent cases, a queueing model (see Zonderland et al (2010)) was used to calculate the required number of OR slots for this patient category. Using this model, a trade-off between cancellations of elective patients on the one hand and unused OR time due to excessive reservation of OR time for
urgent cases on the other hand can be made. As a consequence, one (out of four) ORs was earmarked for urgent patients. When no urgent patients were present, two elective patients were placed in so-called ‘open-ticket beds’ on the Medium Care Unit (this is a ‘stepdown’ unit, where patients are placed who need close monitoring of their vital functions, but do not need the high-complex care that is provided on the Intensive Care Unit). These patients were awaiting and ready for surgery. Thus, empty slots in the earmarked OR would be used for elective surgeries, creating high accessibility for both urgent and elective patients, and optimal usage of capacity at the same time.
Another important intervention was the introduction of the new role of ‘surgeon of the day’ (SOTD). All cardiac surgeons were regularly scheduled for the SOTD role, being the central point of communication for referring cardiologists, having the mandate to decide upon the final OR schedule of that day. Introducing this new role, with a clear mandate, reduced the fuzzy communication between the surgeons, anaesthesiologists, planning office and OR staff about changes in the schedule and the scheduling of urgent patients significantly. The SOTD also hosted a daily planning meeting at 10.00am, where the progress of ongoing surgeries and possible changes in the schedule were discussed with the anaesthesiologist on call and coordinators from the OR and clinical wards. This also improved the decision-making process.
Finally, patient preparation was improved by concentrating all preoperative preparation activities at the outpatient clinic and scheduling them on the same day if possible. The number of times patients would need to visit the hospital decreased, and the overview of the process was improved.
The implementation of these measures was accompanied by strict project management, involving a weekly project group meeting and bi-monthly steering group meeting with all stakeholders represented. Four workshops were organised to align patient flow in the cardio-thoracic care chain. Member of the project group: “I liked the clear analysis of the problem and transparent communication. There was good interaction with people on the shop floor so we could implement change.”
THE RESULTS FOR 2016: AN INCREASE IN SURGICAL PRODUCTIVITY AND DECREASE IN ACCESS TIME In all months of 2016, a higher production than in 2015 was achieved. The total increase in the number of open-heart surgeries performed in 2016 was 165 (+17%), more than originally intended. As the total number of surgeries performed increased by 186 (+12%), most of the increase was related to the increase in the number of open-heart surgeries (89% of the total increase). Access time decreased from 12–14 weeks to 2–3 weeks in the first quarter of 2016 and remained relatively stable in the remainder of the year.
REFLECTION: A CONSTANT DIALOGUE WITH STAFF AND THE INVOLVEMENT OF CLINICAL LEADERSHIP IS CRITICAL Four critical success factors can be identified that determined the success of this project (see Figure 1). The required process changes could only be implemented since there were two surgeons in the project group who were closely involved in the decisionmaking process and in turn discussed
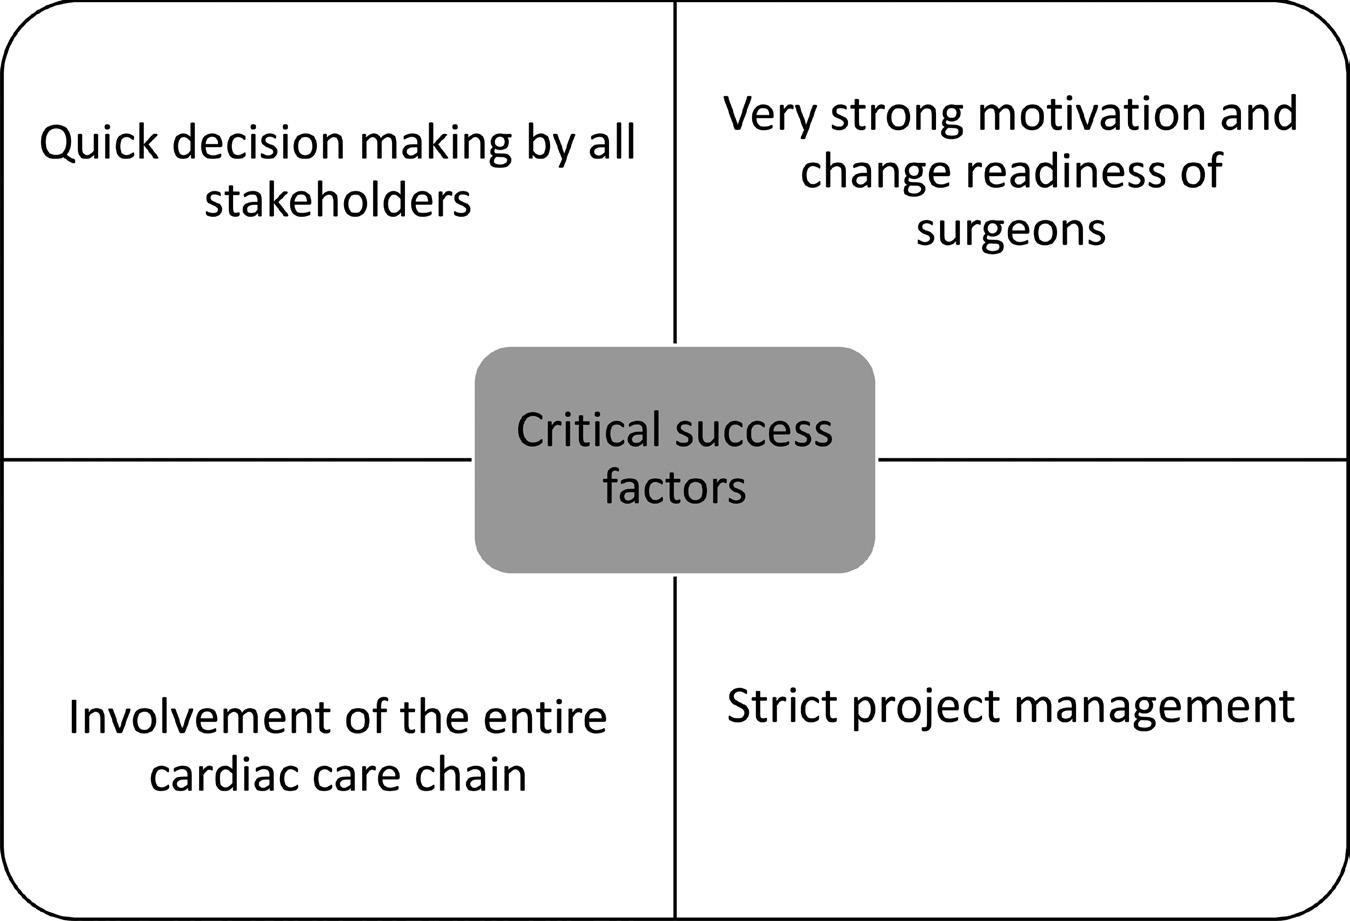
FIGURE 1 CRITICAL SUCCESS FACTORS.
the required interventions with their fellow staff members. Having a dedicated project team, in which all stakeholders are represented (and involved!), was essential in the success of this project. The quick decision making in the weekly project group meetings and the involvement of the two external consultants continuously fed the sense of urgency perceived. As one team member said: “Good project management skills and leadership. I like that they can take over work that keeps us from doing our daily jobs and provide us with the tools to resolve issues.” Since the interventions were discussed thoroughly, they were easy to understand and easy to implement. During 2020 and into 2021, the demands for heart surgery have decreased because of the COVID-19 pandemic, but the schedules implemented will enable to Thoraxcenter to scale up again when demand increases.
Maartje Zonderland is an expert in the optimisation of healthcare processes using quantitative modelling and data science techniques. She holds a PhD degree in Operations Research and Statistics and works currently as a selfemployed management consultant, serving healthcare organisations throughout Europe.
Ad Bogers is professor of Cardiothoracic Surgery and head of the department of Cardiothoracic Surgery in the Erasmus MC Rotterdam.
FOR FURTHER READING
Zonderland, M.E., J. Bekkers, J. van Bommel, M. ter Horst, W. van Leeuwen, F. van den Wall Bake, W. Wiegersma and A.J.J.C. Bogers (2020). Increasing cardio-thoracic productivity at Erasmus MC. Health Systems. DOI: 10.1080/20476965.2020.1848357
Zonderland, M.E., R.J. Boucherie, N. Litvak and C.L.A.M. VleggeertLankamp (2010). Planning and scheduling of semi-urgent surgeries. Health Care Management Science 13: 256–267.
WHAT CAN SYSTEM DYNAMICS DO FOR YOU?
STEPHAN ONGGO
AS I WALKED TOWARDS ANOTHER HALL AT THE MANCHESTER ART GALLERY, I stumbled upon ‘The Desert’, a painting by Edwin Henry Landseer (1802–1873). At first, I was too close to the painting and could only see the detailed brushstrokes. As I walked backwards, the details gradually disappeared and, finally, I found the sweet spot where I could see the beauty of the painting. What an amazing piece of art!
Have you ever been in a situation where you observe the signs of a problem and after some thinking and research, you feel that you are drowning in too many details and too much information that makes you fail to see the problem? I certainly have. Is there a tool that can help us to see the bigger picture instead of the details? Can we predict the pattern or behaviour at the system level (such as organisation, nation) that would emerge from the interaction of the smaller components within the system as much as Landseer predicted how the interaction of his many brushstrokes would produce such a beautiful painting? A more difficult question is which of the interactions between smaller components can explain the pattern or behaviour that we observe at the system level (such as the number of sales of a new product or the growth and the decline of manufacturing in a region). One of the tools that we can use to answer these questions is System Dynamics.
System Dynamics (SD) is a computer-based simulation approach. Other approaches include DiscreteEvent Simulation and Agent-Based Simulation. An SD model can be used as both a qualitative and a quantitative tool. To illustrate this, let us consider that we want to model the spread of an infectious disease in a population.
QUALITATIVE SYSTEM DYNAMICS As a qualitative tool, a SD model is used to capture the causality and feedback loops of a system that is being studied. On causality, we say that P causes Q when, other things being equal (also known as ceteris paribus), a change in P causes Q to change. The change can move in the same direction (for example, both P and Q increase) or in different directions (for example P increases and Q decreases). As can be seen in Figure 1, an increase in the number of new infections causes the number of infectious people to increase. The positive sign at the arrowhead indicates that the change moves in the same direction. Likewise, the negative sign at the arrowhead between the number of new infections and the number of susceptible (who have not been infected) people indicates that the increase in the number of new infections reduces the number of susceptible people.
Feedback loops exist when the causality relations form a cycle in which a change in a component travels through a loop and eventually returns to its point of origin. This
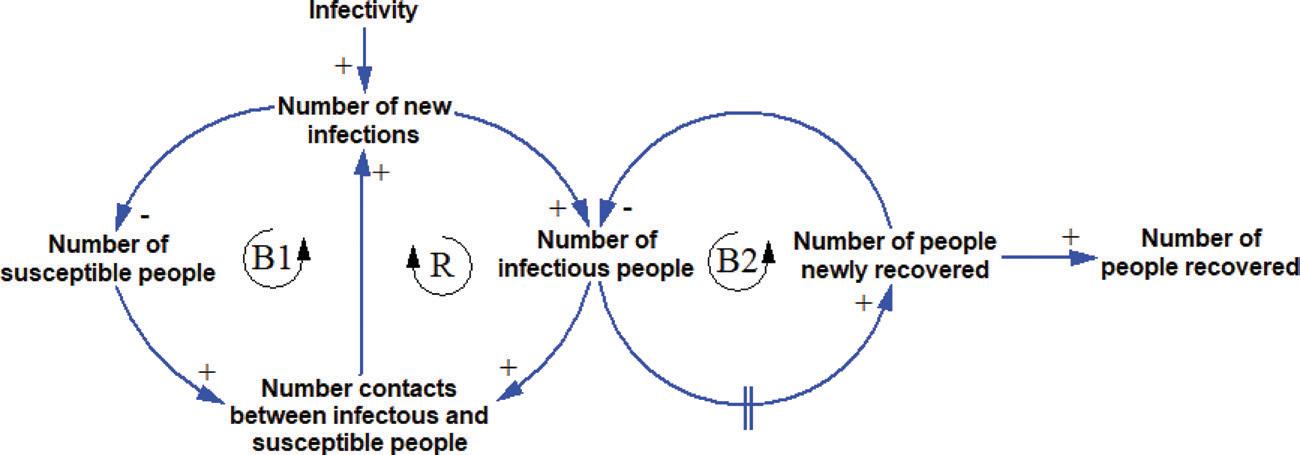
FIGURE 1 THE CAUSALITIES AND FEEDBACK LOOPS IN THE SPREAD OF AN INFECTIOUS DISEASE
suggests that an action done by a part of the system will generate a chain of reactions that eventually affect the part. For example, in Figure 1, an increase in the number of contacts between susceptible and infectious people would increase the number of new infections. Subsequently, it will increase the number of infectious people. Other things being equal, the increase in the number of infectious people will increase the number of contacts between them and the susceptible people. Hence, this loop tends to reinforce the initial change. To indicate the reinforcing loop, we put an ‘R’ inside the loop indicator. To take another example, the increase in the number of new infections will reduce the number of susceptible people. Other things being equal, the decrease in the number of susceptible people will decrease the number of contacts between them and the infectious people. Subsequently, it will reduce the number of new infections. In this case, the loop tends to oppose the direction of the initial change which will create a balancing effect. To indicate the balancing loop, we put a ‘B’ inside the loop indicator. After some delay the infected people will recover. The delay is represented by the delay mark (double vertical line) on the arrow. Capturing the key causalities and feedback loops of a system is important when using SD as a qualitative tool.
The diagram in Figure 1 is useful for decision makers. It helps us to see the bigger picture by clearly visualising how the different components in the system interact and influence each other. With experience, an SD modeller will learn how to move the lens not so close as to be confused by the details, but not so far away as to miss the critical components that form the key causalities and feedback loops in the system. This is very much the same as me trying to find the sweet spot to be able to see the beauty of the painting in the gallery. Too close, I will only see detailed brushstrokes; too far away, I will not see the important features depicted in the painting. It is at this very sweet spot where we can find the useful insights into the structure of the system that determines its dynamic behaviour.
Having seen the bigger picture by visualising how the different feedback loops interact, can we predict the pattern or behaviour of the system that would emerge from the interaction of feedback loops? I will use Figure 2 to illustrate this. In the beginning of an epidemic, there is only a handful of infectious people. Hence, the number of contacts between infectious and susceptible people is relatively low and generates only a few new infections. However, very soon the number of infectious people will increase exponentially (as how compound interest works). This is the period in which the reinforcing loop R dominates the system. Over time, the number of susceptible people will decrease, and the number of infectious people will increase. Because there are fewer people who can be infected, the number of new infections will gradually decrease. At the same time, some infectious people will start to recover. This is the period where the balancing loop B1 dominates the system. The tipping point happens when the number of new infections is the same as the number of newly recovered (at the peak in Figure 2). After this point, the balancing loop B2 will dominate the behaviour of the system. This is shown by the rapid decline in the number of infectious people because the number of people newly recovered is much greater than the number of new infections. As the number of infectious people is declining, the number of newly recovered people will decrease. This shows that we can use SD to predict the behaviour of a system even before we collect some data. This is because we know that some feedback structures will produce certain behaviours such as exponential growth, S-shape growth, goal seeking, oscillation and collapse.
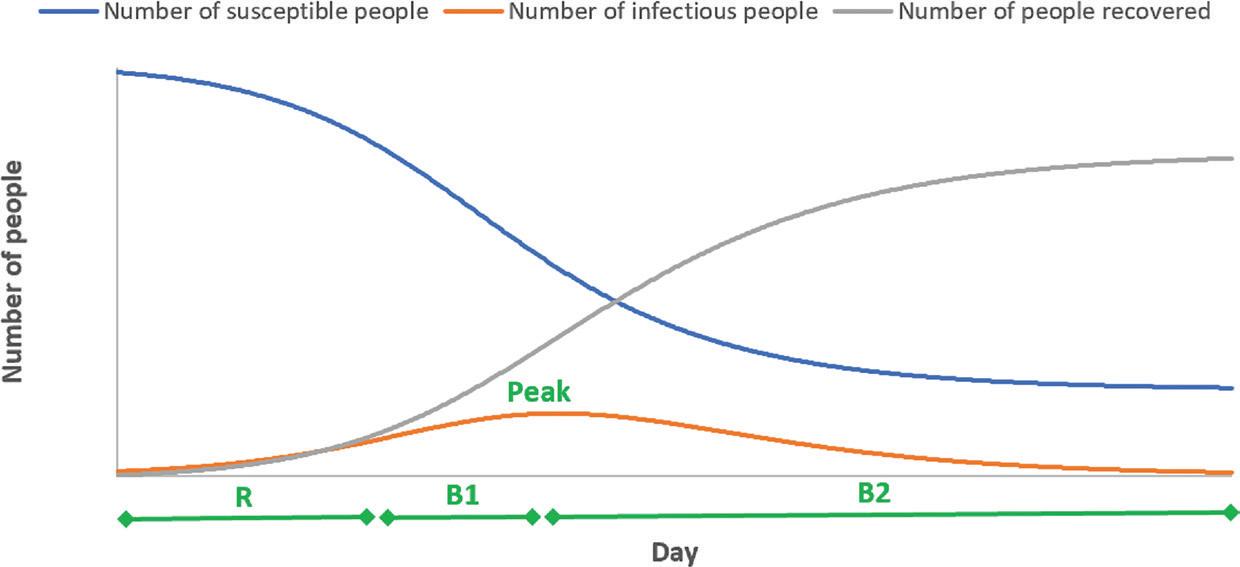
FIGURE 2 THE SHIFT IN THE LOOP DOMINANCE OVER TIME
QUANTITATIVE SYSTEM DYNAMICS When the number of feedback loops in a system is small, we may be able to predict the system behaviour qualitatively. However, it is virtually impossible to do this when the number of feedback loops in the system is moderate to high. For example, if we add variables to the diagram to represent interventions so that we estimate their impact, it will lead to a more detailed model with more feedback loops. An example of such model can be seen on page 14 in this issue. In a complex system, it is common to find many interacting feedback loops. In this situation, we need to use SD as a quantitative tool so that we can simulate the dynamic behaviour of the system. To do this, we need to collect data to quantify how a component affects another component in the system.
To use SD as a quantitative tool, we can view a system as a collection of stocks and flow. To illustrate this, we can use a simple analogy of a tank into which water flows and from which it may flow. The tank is a stock which is an accumulation (of people, assets, etc). The water level in the tank is controlled by the inflow and outflow rates. We can connect one tank to another through a pipe controlled by a flow. Hence, in the SD model, the world is seen as a network of tanks in which the water can flow from one tank to another.
Using the infectious disease example, the stocks in the systems are the number of susceptible people, the number of infectious people and the number of people recovered. Let us consider that we want to simulate the daily spread of the disease. The movement from susceptible to infectious is controlled by the number of new infections on that day (or infection rate). Likewise, the movement from infectious to recovered is controlled by the number of newly recovered on that day (or recovery rate). Hence, we can visualise the system in a stock-and-flow diagram shown in Figure 3. The blue fonts are additional parameters to the causal loop diagram in Figure 1 that we need to run the simulation. In general, a causal loop diagram can be converted into a stock-and-flow diagram, and vice versa. The ‘infectivity’ parameter’s value indicates how contagious the disease is.
Hidden beneath the stock-and-flow diagram is a set of differential equations that will need to be solved numerically to produce the simulation result. This shows the two front ends of an SD model. For a lay person, the model shown in a stockand-flow diagram is intuitive. It allows an effective communication between modellers and decision makers about the structure of the system. For a modeller or mathematician, the model can be shown as a set of differential equations.
To illustrate how this model can be useful for decision making, the model is run under a specific combination of parameter values. The result is shown in Figure 4. This is a scenario in which we let the disease spread in the population to achieve herd immunity. The number of infectious people will reach the peak at roughly 150,000 people around 130 days after the first infection case. When the epidemic ends, roughly 80% of the population will have been infected and gained immunity. This is the reason why, for herd immunity to work, a significant proportion of the population will need to be infected and gain immunity. If 1% of the infectious people would need
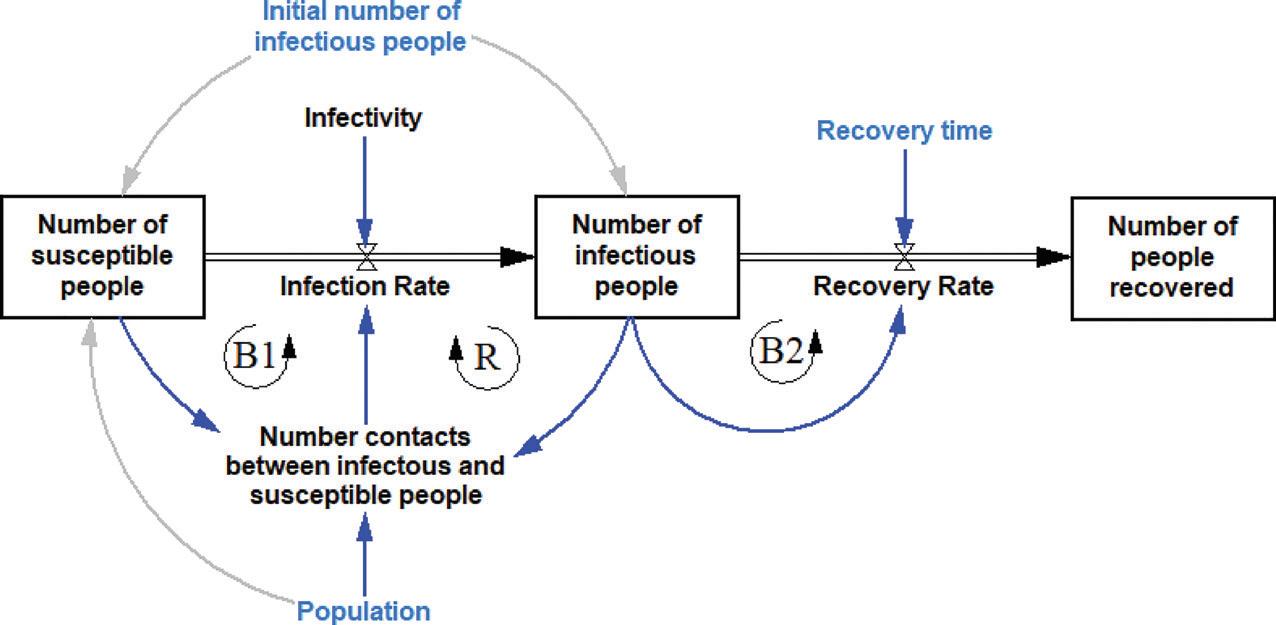
FIGURE 3 THE STOCKS AND FLOWS IN THE SPREAD OF AN INFECTIOUS DISEASE
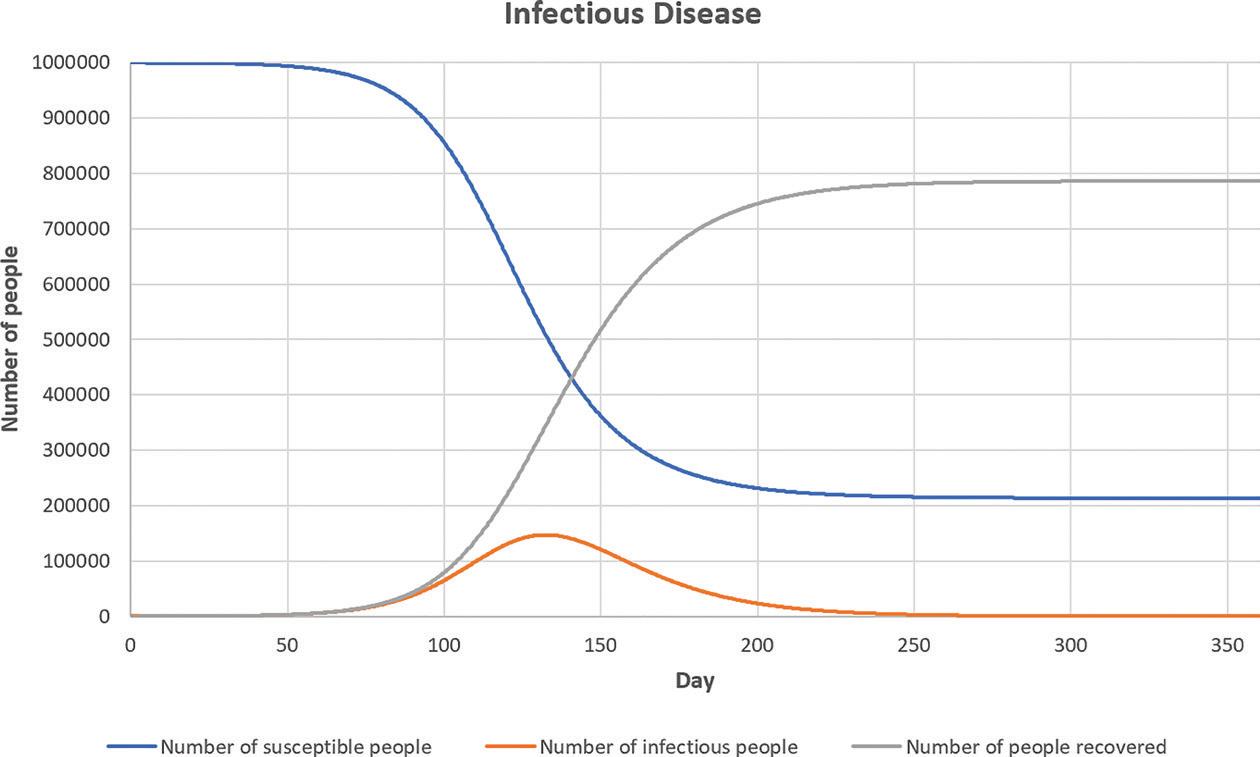
FIGURE 4 THE SIMULATION RESULT
ICU beds, then 1,500 ICU beds would be needed at the peak of the epidemic. If the region has only 70 ICU beds for the population of 1,000,000 people, then clearly the hospitals in the region will not be able to cope with the demand for ICU beds. Hence, while waiting for the vaccines, non-pharmaceutical interventions are needed to flatten the curve (the orange curve in Figure 4).
The quality of prediction depends on the quality of data that we have. In practice, this model is often used to make decisions at the beginning of an epidemic when the data is limited. In our example, it depends on our estimation on how contagious the disease is. Even when the data has become available as the epidemic progresses, it is difficult to know the exact number of infectious people and how they get infected. This is especially difficult for diseases like COVID-19 in which some people are asymptomatic. However, in our case, the model is still useful for decision making because we are more interested in whether our health care system would be able to cope with the epidemic instead of the exact number of infectious people at the peak.
CONCLUSION So far, I have not defined what System Dynamics (SD) is. From the above explanation, we can view SD as a modelling approach that is used to model the behaviour of a complex system based on the causalities, feedback loops and delays in the system. Therefore, SD is arguably the best tool to support decisions that require us to consider broad system boundaries to capture important feedback loops relevant to the problem and to anticipate possible unintended consequences.
These are typically strategic management decisions. For example, Decision Analysis Services Ltd is currently developing an SD model to support nursing workforce planning decision in England (see ‘For Further Reading’ for detail). Other examples include strategic policy decisions on sustainable agriculture policy, renewable energy, sustainable transportation, water resource management and health and social care.
To use SD as a quantitative tool needs special training. However, I would argue that as a qualitative tool, SD is reasonably easy to use. Drawing a diagram that captures the causalities and feedback loops in a system helps us to structure our understanding about the system. Furthermore, the diagram can be developed together by a group of stakeholders so that different perspectives about the structure of the system can be discussed to achieve a common understanding. The diagram can show who will be affected by a certain change in the system by following the causalities and feedback loops. This exercise can be very useful before we make a policy decision that is intended to solve a problem in the system that affects multiple stakeholders. This reminds me of the temporary removal of Waterhouse’s masterpiece Hylas and the Nymphs from Manchester Art Gallery to seek feedback from the public that would inform how the painting should be displayed and contextualized in this modern world, especially in the context of race, gender, and sexuality.

Stephan Onggo is an Associate Professor of Business Analytics at Southampton Business School and a member of the Centre for Operational Research, Management Sciences and Information Systems (CORMSIS). He teaches Simulation Modelling including System Dynamics, Agent-Based Simulation and Discrete-Event Simulation. Currently, he is leading an EPSRC funded project researching on the design of relief food supply chains for natural disaster using simulation optimisation and advising Decision Analysis Services Ltd on the nursing workforce planning project.
FOR FURTHER READING
Cave, S., E. Woodham, D. Exelby, K. Derbyshire, R. Wildblood and N. Shembavnekar (2020). Nurse supply model: Progress so far. https://www. health.org.uk/publications/nurse-supply-model-progress-so-far Currie, C.S.M., J.W. Fowler, K. Kotiadis, T. Monks, B.S.S. Onggo, D.A. Robertson and A.A. Tako (2020). How simulation modelling can help reduce the impact of COVID-19. Journal of Simulation, 14: 83–97. Gary, M.S., M. Kunc, J.D.W. Morecroft and S.F. Rockart (2009). System dynamics and strategy. System Dynamics Review 24: 407–429. Morecroft, J.D.W. (2015). Strategic Modelling and Business Dynamics: A Feedback Systems Approach, 2nd ed. Chichester: John Wiley & Sons. Warren, K.D. (2007). Strategic Management Dynamics. Chichester: John Wiley & Sons. The System Dynamics Society provides good resources for learning more about System Dynamics. https://systemdynamics.org/


