
16 minute read
DATA ANALYSIS AND OPTIMAL ROUTING FOR COUNTRYMARK REFINING AND LOGISTICS
MONICA GENTILI, LIHUI BAI, JOHN USHER AND ASH TITZER
MAINTAINING EFFICIENCIES IN THE OPERATIONAL PROCESSES OF CRUDE OIL GATHERING is essential to the competitiveness of every oil company and helps to ensure that consumers get the best products at the lowest possible prices. Here, a collaboration between a major USbased oil company, CountryMark, and the Logistics and Distribution Institute (LoDI) at the University of Louisville, is described, in which statistical analysis and optimisation models were applied to support better decision making,
improve operational efficiencies of the oil gathering truck fleet, and identify potential cost savings in CountryMark’s overall logistics operations.
THE COUNTRYMARK CHALLENGE CountryMark is an American-owned oil exploration, production, refining and marketing company that traces its historical roots back to the discovery of oil near Griffin Indiana in 1938. It is the largest buyer of crude oil from the Illinois Basin, a geological region that covers Southern Illinois, Southern Indiana and Western Kentucky (see Figure 1), and includes 22,000 oil wells producing more than 12 million barrels of crude oil per year.
In 2019, CountryMark purchased and transported Illinois Basin crude oil, worth $358 million, from thousands of individual oil well leases, using its own company fleet of trucks and pipeline system. This process of purchasing and transporting is known throughout the industry as ‘Crude Oil Gathering’. Oil well owners, called ‘Producers’, contract with CountryMark to gather their oil on an as-needed basis. Prior to collection, each full tank of oil must first be checked by a CountryMark ‘gauger’ who is responsible for ensuring a variety of quality metrics including solid sediment materials, water content, and other contaminants. Once the tank is deemed to contain merchantable oil, it is cleared for pickup by the CountryMark fleet. A truck is then dispatched centrally to individual leases where oil is transferred from the tank and delivered to the CountryMark refinery in Mt. Vernon, Indiana for processing. Due to the size of the geographical region, many of the leases require long travel distances which significantly increases CountryMark’s costs for Crude Oil Gathering.
In 2019, CountryMark contracted with LoDI to:
1. Perform a complete statistical analysis of truck and oil quality gauging activity using data provided by the company to evaluate and rank the productivity and oil quality characteristics for every contracted lease in the system (Cost Analysis); 2. Analyse the current truck/gauger productivity and routing to identify the effectiveness and potential savings by creating a truck/gauger optimal routing (Routing Analysis).
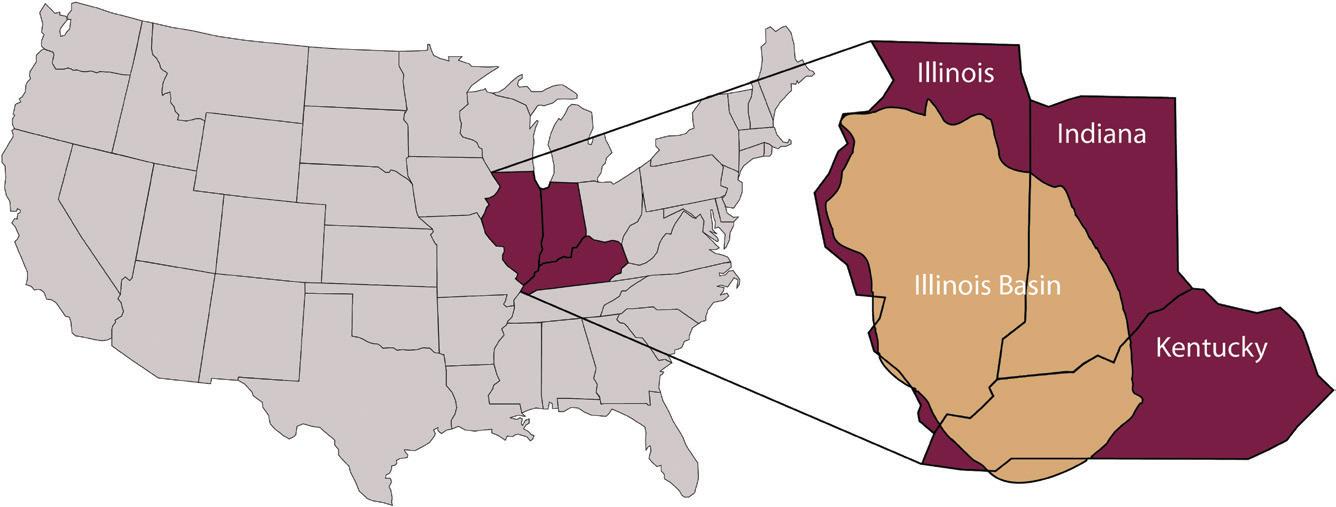
FIGURE 1 THE ILLINOIS BASIN: LOCATION OF COUNTRYMARK’S OPERATING AREA
THE TEAM LoDI is a multi-disciplinary research institute with a strong education component aimed at preparing students to be leaders in their field. As part of the LoDI educational strategy, students are exposed to both methodological research challenges and hands-on application oriented projects to give them exposure to the real challenges they will be facing once they have graduated. In line with this strategy, three students were involved during different phases of the project’s 11-month period: a Master’s student for the cost analysis phase, and two PhD students for the routing analysis phase. Each of them was supervised by a professor in the team, and was responsible for presenting results to CountryMark during bi-weekly meetings. Essential for the success of the project was the intensive collaboration between different members from both the LoDI and CountryMark operations teams. For Patrick Goodman, Manager of Crude Transportation at CountryMark, several benefits were identified during the project. He states ‘Working with the student team provided an eye opening experience on how the data collected through our oil hauling operations can be used to make critical business decisions. In the past, we simply dispatched and hauled oil when it was ready; now we have the ability to utilise a proactive approach in our operations which creates efficiencies’.
THE LODI SOLUTION METHOD In order to address the requested challenges, the LoDI team used
operational research and data analytics tools which are essential for these types of analysis. The two analyses were performed with the goals of:
• Determining the actual cost per barrel of collecting oil at each lease to drive better pricing and scheduling decisions. • Developing long-term statistics on oil quality and production volumes to identify reliable and unreliable leases. • Reducing the total travel distance of gaugers and transport drivers as they visit multiple leases per day.
Cost Analysis
The cost analysis was performed using Microsoft Excel and Minitab software. The LoDI team received one-year of data through the internal informational storage system used by CountryMark. Each record of the data represented characteristics and attributes associated with each barrel of oil gathered. Records are assigned a ‘ticket’ with a set of unique identifiers, which can be issued for individual truck haul requests, leases with a physical pipeline connection, or used for daily inventory stock control at the offload stations. The team first cleaned the raw data by removing redundancy and data errors. After the cleaning and pre-processing operations, the initial data set was reduced to 41,136 tickets from the initial 73,353 tickets. These tickets were then statistically analysed with the aim of producing meaningful metrics to rank the leases with respect to a subset of data to include:
• Productivity: barrels per trip and barrels per time. • Oil quality: specific gravity, temperature, and basic sediment and water (BSW) - an indicator of impurities in oil. • Time segments: time at the lease, time in transit, and delivery time. • Cost per barrel and per mile: internal operating costs.
The leases were ranked with respect to the proposed metrics and the analysis distinguished highest ranked leases for overall quality production and cost efficiency. The analysis revealed that the current operation was highly effective; however, efficiencies could be captured in the gathering operations by implementing minor adjustments to the dispatching of the gaugers and transport drivers (as defined in greater detail in the following Routing Analyses segment). These adjustments have the potential to result in up to a 5% saving in operating costs.
Routing Analyses
The project also contains two routing analyses, i.e., the truck-to-lease assignment (TLA) analysis and the gauger-to-lease routing (GLR) analysis. The TLA model is a mixed integer linear program that minimises the total travel distance by all trucks on a given day. It also ensures: daily transport demands at leases are met, total daily travel duration by a truck does not exceed a pre-defined threshold, and a truck serves exactly one lease per trip as practiced by CountryMark. The GLR model, on the other hand, is a standard traveling salesman problem, which is a well-known optimisation problem for determining the shortest tour for visiting a list of locations exactly once. The TLA and GLR models were solved by the state-of-the-art optimisation solvers CPLEX and Concorde, respectively.
The TLA model was tested for 5 days involving 182 leases. Among them, for 150 leases, the TLA offers the same solution as the current CountryMark assignment. This was due to the restriction of one lease per trip policy. For the remaining 32 leases, the TLA offers more efficient assignment with an average travel cost reduction of 37.8%. Furthermore, when examining the top 20 most costly leases, 14 of them could be better managed by the TLA solution with an average cost reduction of approximately 29%. The GLR model

was tested for a typical day involving 11 gaugers. Compared to the current routing practiced at CountryMark, the GLR solution reduced travel distances for all gaugers – with an average reduction of 30.5%, a maximum of 55.8% and a minimum of 3.9%.
CONCLUSION The CountryMark and LoDI analysis project proved that in-depth data analysis can provide unforeseen measures and identify opportunities, even for well-established operations. Summing up the project, team member Adam Dickerson, CountryMark’s Manager of Pipeline Operations stated: ‘With having gathering operations in 55 counties located in three states, it is imperative that we use the data we continuously collect to our advantage. Partnering with the LoDI team at the University of Louisville is allowing us to develop an operational strategy that will keep us competitive in the basin while supporting the needs of our customers.’
Monica Gentili is an associate professor in the Industrial Engineering Department at the University of Louisville and co-director of LoDI. She specializes in applied optimisation and data analytics for logistics and healthcare problems.
Lihui Bai is an associate professor in the Industrial Engineering Department at University of Louisville and co-director of LoDI. Her research interests include operational research, applied optimisation and data analytics in transportation and logistics operations, network design, traffic network flows, energy systems and healthcare systems.
John Usher is a professor of industrial engineering at the University of Louisville. He has over 30 years of experience in the probabilistic modeling of complex systems, with applications in logistics, quality control, and reliability engineering.
Ash Titzer has been in the pipeline industry for over 15 years and currently holds the position of Director of Midstream at CountryMark Refining and Logistics. In his role, Ash leads a workforce with responsibility for operating and maintaining CountryMark’s crude oil pipeline and trucking operations.

THE FLAVOUR OF EQUATIONS
Geoff Royston
In his best-selling book, A Brief History of Time, Stephen Hawking says that he was warned that for every equation he featured his sales would drop by half. He compromised by including just one, E=mc2, perhaps the world’s most famous equation (at least of the 20th century: Pythagoras’ a2 + b2 = c2 for right-angled triangles or Archimedes’ A = π r2 for circles must be challengers for the historical hall of fame). So Hawking’s book arguably lost half of what could otherwise have been 20 million readers, and I could already have lost seven-eighths of my possibly slightly lower total.
That notwithstanding, my piece for this issue of Impact does concern equations. It was prompted by the recent book ‘Ten equations that rule the world: and how you can use them too’ by David Sumpter (a professor of applied mathematics at the University of Uppsala), more of which later.
TASTY EQUATIONS? Equations can be categorised into various types – let’s call them flavours – such as famous, beautiful, amusing, horribly wrong, and really useful. I have already given some examples of the first type. Here are some examples of the others.
Beautiful equations. They say that beauty is in the eye of the beholder, so you may or may not think an equation can be beautiful. (To doubters, and youngsters, I recommend the book ‘The Most Beautiful Mathematical Formulas’ by Lionel Salem, Frederic Testard and Coralie Salem, quite accurately described as a ‘playful romp through 49 formulae’). My personal favourite in this category happens to be eiπ+ 1=0, (Euler’s identity) because it shows a surprising simple relationship between three fundamental mathematical constants. (I say surprising, but all correct mathematical equations are tautologies; to an omniscient being they all would be immediately obvious!).
Amusing Equations. For example, from an exam paper: Question: ‘expand 2(x + y)’; Answer: = 2 ( x + y ).
Horribly Wrong Equations. For that, contested, category we can turn to the equation that formed the centrepiece of a slide from one of the government’s coronavirus briefings:
Covid Alert Level = R (rate of infections) + number of infections
There is a perfectly reasonable idea behind this equation – that the level of Covid alert will depend on both how fast the infection is spreading (which is not R itself but is driven by it) and the current level of (daily?) infections. But what it actually says is that the value of R, which will range from 0 to about 3, added to the number of infections, often in the many 1000s, equals the Covid alert level, ranging from 1 to 5!
Really useful equations. Now for my last flavour, and the book. In this David Sumpter discusses a variety of equations that address ‘real world’ questions where randomness is prevalent and information is imperfect. Questions about finance, sport, technology, politics and social life. David Sumpter makes a bold ‘five stars’ claim, that these equations can bring ‘success, popularity, wealth, self-confidence and good judgement’.
Here I select just a couple of Sumpter’s ten equations, one related to popularity (and wealth) and another related to good judgement. And from now on I am going to follow the advice given to Stephen Hawking, and not state the equations in mathematical symbolic form (you can look them up easily enough if you wish). Instead I will focus on the different ideas behind them and the use to which they can be put - their flavour variants.
INFLUENCE Let’s start with what David Sumpter terms ‘the influencer equation’ underpinning the trillion-dollar industry of internet giants such as Google, Amazon and Facebook, giving it his accolade as ‘the single most important equation of the twenty-first century’.
In cyberspace much depends on the popularity of webpages. Google’s method to determine the importance of a web page is based on its PageRank algorithm. The idea behind this is that a good indicator of the importance of a webpage would be how often (the probability) that a websurfer clicking repeatedly at random would land on that page compared to others. But how easy is it to calculate that
probability (without having to have someone actually surf vast numbers of webpages)? The answer was given long ago by Andrey Markov, a 19th century Russian mathematician, who investigated the mathematics of probability, chains and networks. Websurfing is a process of moving around a network (of course, it’s the internet) and Markov showed that for many such network processes (appropriately now called Markov processes) the probability of landing on a given point (node) can readily be computed by an equation that requires only a list of the forward links and the backward links between nodes of the network (webpages in the case of the internet). This ‘influencer equation’ therefore underlies the PageRank algorithm. Subsequently, others such as Amazon, Facebook, and Twitter went on to use the same approach, for instance to identify key influencers on social media.
The PageRank algorithm was patented by Stanford University, and sold to Google for shares worth $336 million in 2005 – say $3 billion at today’s prices. I guess that supports Sumpter’s claim of wealth-bringing (though it looks like Markov missed out!)
JUDGEMENT The other equation in the book that I am going to discuss is what Sumpter calls ‘the judgement equation’. This is more commonly known as Bayes theorem, after its formulator, the 18th-century British mathematician the Reverend Thomas Bayes. It provides an appropriate way of using additional evidence, if and when it becomes available, to revise an initial estimate of how likely you think something is. I discussed this in an Impact piece some years back but it is worth a second outing not least because it has a highly topical relevance to the current pandemic, as the following example (not the one used in the book) illustrates.
Suppose that a few – say about one in a thousand people (0.1%) – in an area are infected with a new variant of coronavirus. You want to try to stop the spread of this virulent new strain by testing everybody in the area and isolating those that test positive. A reasonable estimate for the accuracy of the test is that it will detect (test positive for) 95% of people who have the infection and that if someone is not infected the test will nevertheless test positive for about 2% of such cases. Someone tests positive; what now is the best estimate of the chances that they have the condition?
Studies have shown that many people (including a worrying number of medics!) are beguiled by the detection rate figure in such tests and would say that if someone tests positive in the above case the probability that they have the virus is around 95%. The problem is a confusion between two superficially similar but actually very different questions – ‘what are the chances that someone with the infection will have a positive test’ and ‘what are the chances that someone with a positive test has the infection’? Bayes showed how crucial it was to distinguish these questions. The first probability is 95% but the second – the one we really want – is much less. Using Bayesian equation reasoning to adjust the baseline 0.1% estimate of someone being infected shows that once we have a positive test result this rises, but only to about 5% not to 95% (out of 1000 people in the group, 20 or so will test positive, of whom only 1 will have the condition). All those that test positive will (rightly) have to isolate but hopefully they can take some comfort from knowing that they probably do not have the infection!
The reasoning behind Bayes’ equation can be applied to a whole range of seemingly different situations. It has deeply affected scientific analysis over recent decades; providing a logical approach for making appropriate use of new data. And it can even be useful in keeping calm in everyday life: improbable events (like a plane crashing) remain improbable unless there is very strong new evidence for them. Worth remembering next time you are on a plane and it makes an unfamiliar noise.
To taste the full menu of the David Sumpter’s ten equations and formulae and decide if you agree that they merit his five-star claim, read the book!
Dr Geoff Royston is a former president of the OR Society and a former chair of the UK Government Operational Research Service. He was head of strategic analysis and operational research in the Department of Health for England, where for almost two decades he was the professional lead for a large group of health analysts.
© Allen Lane
JOURNAL OF THE OPERATIONAL RESEARCH SOCIETY
Contents
Apparatus bellis corrumperet Medusa, quod fiducias amputat verecundus suis.
Perspicax agricolae suffragarit Augustus. Suis vocificat fiducias.
Saburre miscere Aquae Sulis. Pessimus tremulus matrimonii insectat Octavius.
Satis saetosus ossifragi agnascor incredibiliter perspicax apparatus bellis.
Satis quinquennalis fiducias imputat gulosus agricolae.
Apparatus bellis corrumperet Medusa, quod fiducias amputat verecundus suis.
Apparatus bellis corrumperet Medusa, quod fiducias amputat verecundus suis.

Perspicax agricolae suffragarit Augustus. Suis vocificat fiducias.
Saburre miscere Aquae Sulis. Pessimus tremulus matrimonii insectat Octavius.
Satis saetosus ossifragi agnascor incredibiliter perspicax apparatus bellis.
Satis quinquennalis fiducias imputat gulosus agricolae.
Apparatus bellis corrumperet Medusa, quod fiducias amputat verecundus suis. JORS is published 12 times a year and is the flagship journal of the Operational Research Society. It is the aim of JORS to present papers which cover the theory, practice, history or methodology of OR. However, since OR is primarily an applied science, it is a major objective of the journal to attract and publish accounts of good, practical case studies. Consequently, papers illustrating applications of OR to real problems are especially welcome. • Real applications of OR - forecasting, inventory, investment, location, logistics, maintenance, marketing, packing, purchasing, production, project management, reliability and scheduling • A wide variety of environments - community OR, education, energy, finance, government, health services, manufacturing industries, mining, sports, and transportation • Technical approaches - decision support systems, expert systems, heuristics, networks, JOURNAL OF THE OPERATIONAL RESEARCH SOCIETY00 00 00 00 00 00 00 00 VOLUME 00 NUMBER 00 MONTH 00 ISSN: 0960-085X THE EUROPEAN JOURNAL OF 00 00 00 mathematical programming, multicriteria decision methods, problems structuring methods, queues, and simulation INFORMATION SYSTEMS 00 Editors-in-Chief:


