
10 minute read
A brighter outlook?


The US tight oil industry was hit particularly hard in 2020, a year that was one of the most disruptive for global oil and gas markets. The rig count – generally viewed as an overall barometer of US onshore activity – and horizontal oil-focused drilling in the country, the main driver of the US’s oil production growth in 2017 – 2019, collapsed by approximately 75% through 2Q20. The downturn in 2020 was unprecedented and so was the plunge in rig activity levels, which was far more severe than any of the previous corrections. As oil prices recovered towards US$40/bbl in 3Q20, the oil rig count bottomed out and many producers cautiously started to redeploy them. The gradual recovery trend has become more visible in recent months, with the horizontal oil-focused rig count surpassing 270 units as of 12 February 2021, 80% higher than the 2020 low of 149 touched in August (Figure 1). Gas-focused drilling in the Appalachia and Haynesville regions also experienced a severe decline of approximately 60% through 2H19 and 1H20. The gas rig count stabilised in 3Q20 and select Haynesville producers have marginally increased their activity in the last few months.
Fracking activity
While the recovery in rig activity could at best be characterised as gradual, fracking activity – a more important indicator of short-term production potential – saw a robust rebound in 2H20 (Figure 2). Fracking activity declined faster than drilling in 2Q20 as many producers were able to ‘freeze’ or delay their pressure pumping contracts at no additional cost. That resulted in an abnormal bulge in the country’s drilled but uncompleted (DUC) well inventory, as many wells that were drilled in 4Q19 and 1Q20 were not completed on schedule in 2Q20. Hence, the cumulative DUC inventory provided the industry with ample flexibility in 2H20 and many producers were able to increase their frac activity, while maintaining a conservative rig programme. The existing anomaly in the DUC inventory will provide significant support to nationwide fracking deep into 1H21.
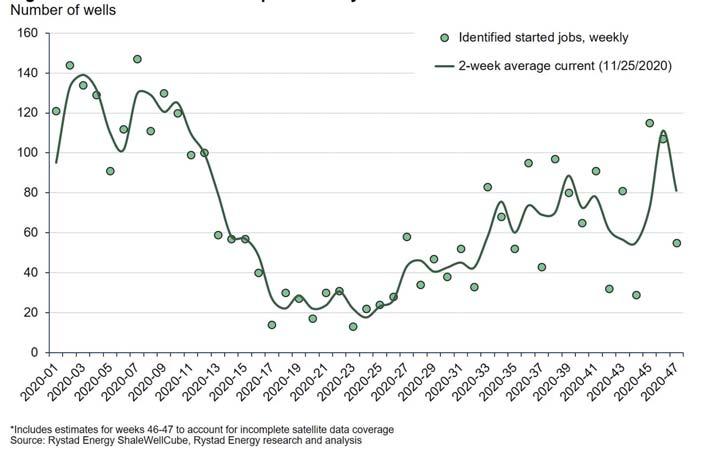
Rystad Energy has identified 909 started frac operations in North America for January, as of the week ended 12 February. Rystad estimates that there are at least 50 frac operations that it has not yet detected through satellite imagery analysis or the FracFocus registry, for a total of 959 jobs. As for February 2021, Rystad have already identified 201 jobs, 200 of which were identified exclusively by satellite analysis. Activity in the Permian Basin was strong in January, with 438 identified fracs, a large increase from the 249 recorded in December. In other US core oil plays, however, there was a stagnation, as the frac count stayed at close to 200. There was a slight decline in South Texas’ Eagle Ford, to 70 in January from 83 in December, which was, however, offset by an addition of 10 fracs in the Niobrara and five fracs in the Bakken regions. Further to the identified frac jobs, Rystad estimate an additional 28 jobs in the Permian, eight in the Eagle Ford, and 14 in other basins for January 2021.


The weekly job count in major oil regions other than the Permian – the Eagle Ford, Bakken, Niobrara and Anadarko combined – hovered around 40 jobs per week in September and October, but the run rate of activity increased to 60 jobs per week in November, due to the unusual spike in activity in early November in the Niobrara region.
Tight oil
After the period of curtailment in 2Q20, nearly all tight oil volumes were restored by the end of 3Q20 as total US tight oil production from horizontal wells returned to 7.4 million bpd, a 1.1 million bpd decline compared to the output recorded in March. Meanwhile, conventional production rebounded only to 1.7 million bpd and saw little incremental recovery in August and September. Given the much shallower decline rates for conventional operations, the fact that conventional oil output from the Lower 48 states, excluding the Gulf of Mexico, remained 200 000 bpd below the level in March indicated that approximately 150 000 bpd of US conventional production remained shut in at the end of 3Q20. This might present a potential upside for US supply in the short-term if oil prices justify reactivating those mature, less economic wells with high water-to-oil ratios.
With an addition of approximately 2.8 million bpd expected in December from 2020 tight oil vintage wells, the industry cannot offset the record-high base decline of approximately 3.8 million bpd between December 2019 and December 2020. US tight oil production was therefore set to lose approximately 1.05 million bpd of supply through 2020, a process which is now largely completed. The base production, at the time of writing, was much more mature than it was at the start of 2020. The first-month horizontal base decline across major liquid basins – the Permian, Eagle Ford, Bakken, Niobrara and Anadarko combined – fell from approximately 630 000 bpd in 1Q20 to 410 000 bpd in 4Q20. Moreover, the average new well performance showed a misleading trend in the second and third quarters because of the curtailments, which affected even new vintages. The latest well results from the third quarter put on production (POP) activity suggested another upward shift in the average new well productivity. A typical horizontal well in major liquids basins delivers approximately 750 bpd of oil in its peak production month – an increase of 6% to 7% from the average new well productivity level recorded in 4Q19. This is the result of a continuous increase in the average lateral length and a new wave of high-grading since the start of the COVID-19 pandemic.
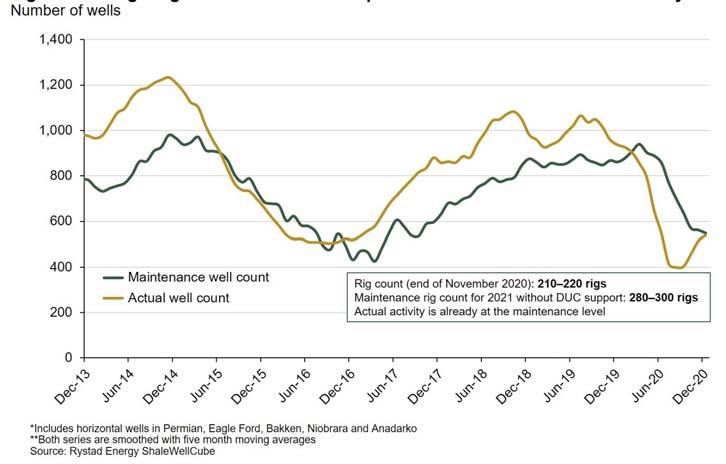
Considering the maturation of base production and the record-high new well productivity, Rystad Energy expects the number of wells needed to keep tight oil production flat to drop rapidly. This maintenance activity requirement fell from approximately 900 horizontal wells per month in 1Q20 to 550 horizontal wells per month in 4Q20, and is likely to keep falling towards 500 wells per month by the end of 2021, if the industry stays in a maintenance mode from 4Q20. Such horizontal well activity requires 280 to 300 horizontal-focused rigs in major oil regions combined. The current rig activity level as of late November, even after the significant increase in the past few weeks, remained below the number needed to maintain production, at 210 to 220 horizontal rigs. Rystad Energy expects the industry to keep adding oil-focused rigs in 2Q21 to reach maintenance requirements by the time the existing DUC inventory is depleted. In the short-term, however, over the last three months of 2020 and 1Q21, the abnormally large DUC inventory is expected to be sufficient to meet maintenance well activity requirements. In fact, as illustrated by Figure 3, actual activity is right now about to catch up with maintenance requirements.
Maintaining stable production in 2021, with a continuous focus on free cash flow generation and balance sheet improvement, was the main theme in the 3Q20 earnings of tight oil producers. Indeed, select public producers (Figure 4), who offered a broad outline for 2021, largely plan to remain disciplined, targeting to spend only the amount they need to maintain flat output for 2021 at the level of 4Q20 production.

Figure 1. US land horizontal rig count by main hydrocarbon type.
Figure 2. Permian started frac operations by week in 2020.
Figure 3. US light tight oil maintenance requirements and actual new well activity. Includes horizontal wells in Permian, Eagle, Ford, Bakken, Niobrara and Anadarko.
Against that backdrop, Rystad Energy expects 2021 full-year onshore oil production to shrink slightly by 1.9%, while D&C CAPEX will be considerably lower at 12.9%, compared to their 2020 plan, based on a group of 23 oil-focused operators. The included peer group accounts for approximately 41% of 2020’s US tight oil production. The decline may be slower, at 8 – 10%, if the estimated CAPEX of larger producers (e.g. supermajors) are added in.
That comes as companies maintain an unrelenting, never-before level of focus on balancing their budgets and generating free cash flow, driven by that blurry macro backdrop. 3Q20 showed an underspending of close to US$3.6 billion by shale producers when comparing their CAPEX budgets with cash flows from operations (Figure 5). Companies managed to further reduce their CAPEX from the lows seen in 2Q20, to US$3.4 billion from US$4.5 billion, while more than doubling the cash generated from operating activities, to US$7 billion. The number of operators that balanced their budgets in 3Q20 reached 89%, a level that has never been achieved before in the shale industry’s history. The spread between CFO and CAPEX also reached an all-time high of US$3.6 billion.

Figure 4. 2021 outlook for US tight oil producers vs 2020.

Figure 5. Quarterly CFO vs CAPEX for peer group of 39 dedicated public US shale oil producers.
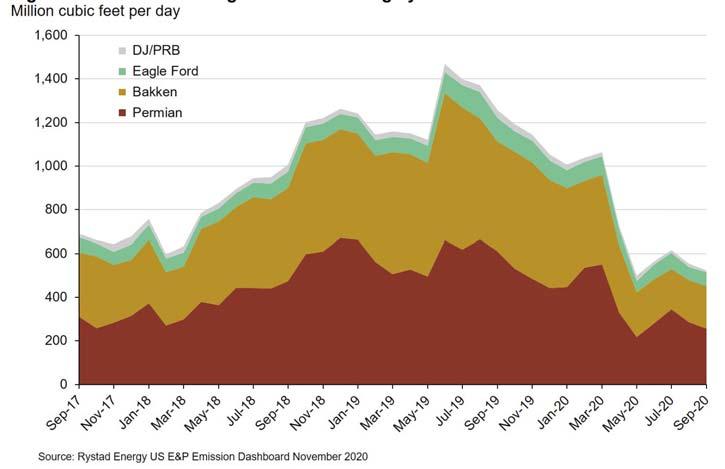
Figure 6. US land natural gas wellhead flaring by oil basin and month.
Environmental performance
While 2020 was a challenging year for tight oil producers’ economics, it has helped the industry achieve structural improvements in the environmental domain. Gas flaring in the Permian and Bakken basins was one of the biggest ESG challenges for operators in 2018 – 2019, especially in the context of the global energy transition and a fundamental shift in the significance of ESG within the investor community. Driven predominantly by high activity levels and a lack of integrated project planning, wellhead gas flaring across major oil basins peaked above 1.4 billion ft3/d during the summer of 2019 (Figure 6). A significant volume of gas was also flared at gas processing plants in West Texas at that time.
As the downturn came in, wellhead gas flaring declined rapidly, too. In fact, wellhead gas flaring across major US oil basins remained close to the multi-year low of approximately 520 million ft3/d as of September 2020. Permian wellhead gas flaring increased from approximately 220 million ft3/d in May 2020 to 345 million ft3/d in July 2020, but declined again to 255 million ft3/d in September 2020, a level that was lower than in June 2020. Wellhead gas flaring in the Bakken Shale declined from more than 500 million ft3/d in late-2019 to around 200 million ft3/d in May 2020 and has stayed below that mark since. Flaring levels in the Eagle Ford and DJ/PRB basins usually are not as significant as the Permian and Bakken, but the Eagle Ford region has seen a less pronounced decline between 4Q19 and 2Q20 in relative terms.
While some operators were already at very low flaring intensity levels in 2019, many others made significant improvements between 2H19 and 3Q20. This is a clear illustration of a structural shift in the industry’s attitude toward the environmental aspect of their operations, establishing a good foundation for responsible development in the next up cycle, in 2021 – 2022.
Conclusion
Despite the many financial and operational improvements achieved by the industry since the downturn, ample headwinds still exist, including the macro uncertainty on the long-term impact the pandemic may have on the global economy. As a result, oilfield service companies are still fine tuning their budgets and outlook for 1Q21 as operators are at times changing their plans, with some companies pushing out finalising their budgets into early 2021. Service companies are working on their plans almost on a month-to-month basis due to the ongoing market uncertainty.
Heading into 2021, the shale industry’s outlook will, in part, hinge on oil price expectations. Much, of course, depends on the OPEC+ meeting on 3 – 4 March 2021. Rystad estimates that OPEC+ could bring back as much as 1.3 million bpd in April 2021 and still keep the market balanced, but instead expect the group will stick to the deal it made in December 2020 to limit monthly supply increases by 500 000 bpd.


