
7 minute read
More logging, less guesswork

Rob Shoup, Justin Boltz, Matthue Ellis and Stephen Forrester,
Gyrodata, USA, demonstrate how wellbore tortuosity logging can take the guesswork out of improving artificial lift equipment placement and optimising production.
With crude oil prices settling in the high US$60/bbl range at the time of writing, operators in all parts of the world are feeling the pressure to get more value out of their wells and deliver a better return to investors. In past cycles, it was typical to look at times of higher commodity prices as an opportunity to ramp up drilling and production; fortunately, this behaviour has been curtailed with continued calls for financial discipline and the realities of supply and demand. What is more important than ever now, and what will certainly define how well companies do moving forward, is the ability to get more out of existing wells rather than constantly drilling new ones. Many innovations on the equipment and technology side have aimed to address this need in some form or fashion, but more focus must be placed on wellbore quality if the industry is to advance. The MicroGuide wellbore tortuosity logging system, developed by Gyrodata, is one answer for those operators seeking to better
Technology
MicroGuide generates wellbore tortuosity logs in conjunction with a gyroscopic surveying tool, or another service that provides comparable data. The system defines reference lines for the wellbore path based on survey data, and determines displacements of the wellbore path from the reference lines. Through a series of calculations based on this information, the wellbore shape can be represented and visualised in 3D, allowing an operator to make critical decisions on well development and placement for artificial lift and other equipment in line with areas of low tortuosity.
Wellbore tortuosity has a significant impact on the design and installation of artificial lift equipment. The well path and tortuosity is commonly determined from data based on measurement while drilling (MWD) technology and stationary directional surveys at stand-length intervals. By collecting high-density, high-resolution data at 1 ft log intervals, MicroGuide technology reveals areas of high side loading or side force and high friction that would be otherwise invisible. Making decisions on optimised artificial lift system placement with previous solutions involved so many assumptions and so much guesswork that it ultimately resulted in a substantial number of unpredicted failures.
Case studies
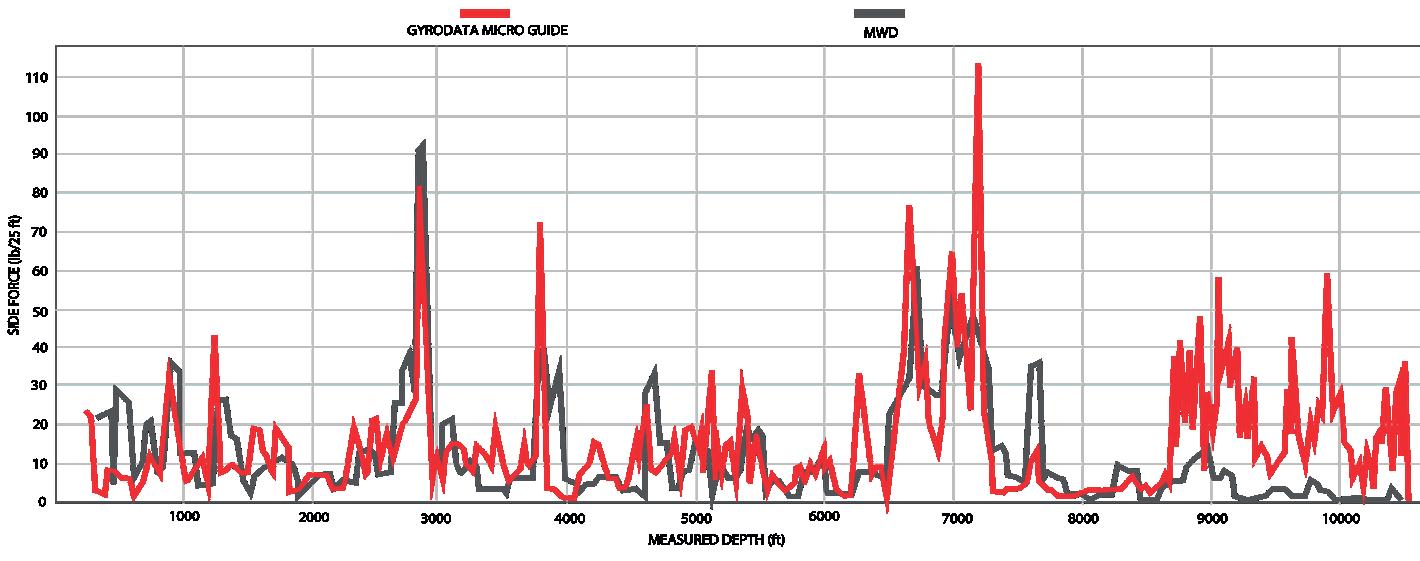
Figure 1. The data from the wellbore tortuosity logs revealed tortuosity spikes in several areas that were undetected with MWD equipment. In addition, the system highlighted an area of helical buckling from 8700 to 10 560 ft.
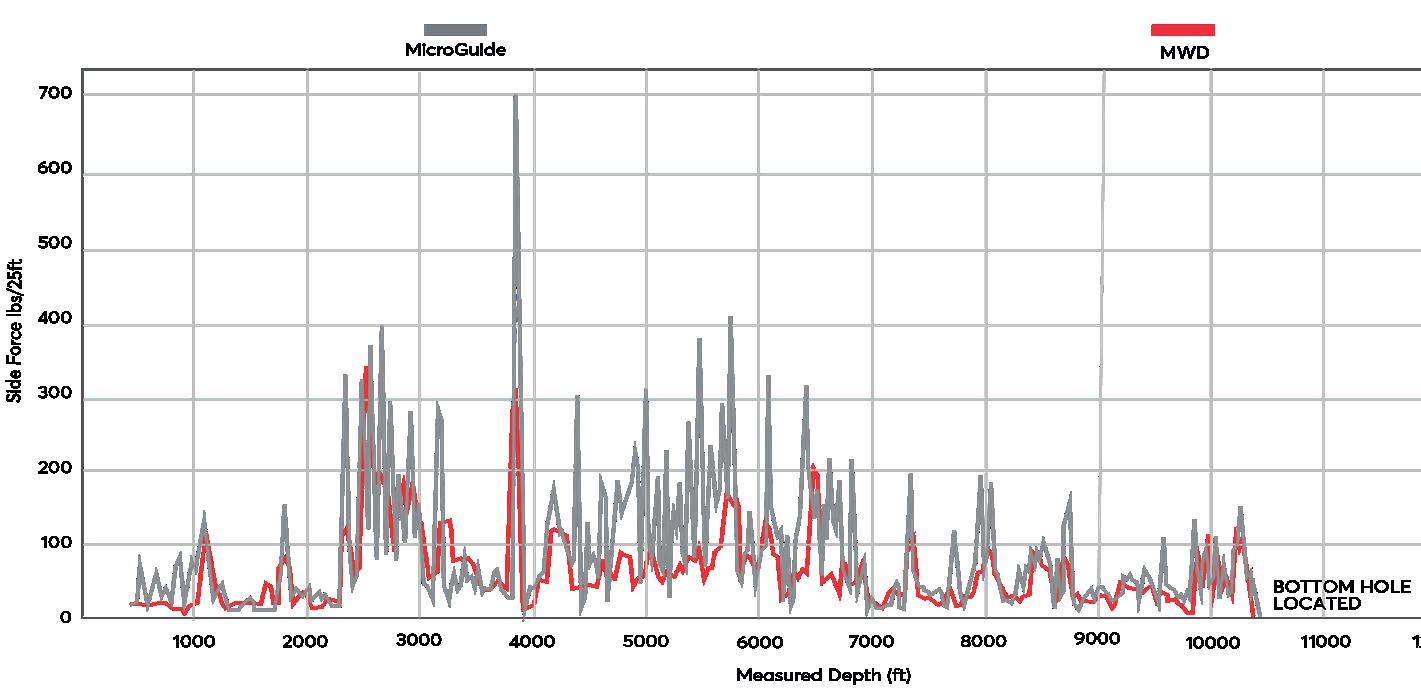
Figure 2. The wellbore tortuosity analysis revealed elevated side force from 2400 to 6500 ft that was not clear in the MWD data, including an extreme spike at 4000 ft.
Figure 3. The MWD survey had an erroneous azimuth reading at approximately 3220 ft measured depth, causing a spike in calculated dogleg severity when no such spike was present in the well. Bakken Shale
An operator in the Bakken Shale, US, was experiencing repeated issues with rod failures in one of their wells. Though there were several areas of concern throughout the well, the primary trouble spot was in the last 1900 ft, where repeated failures were causing the project to exceed authorisation for expenditure (AFE). To better understand the issue and identify a means of rectifying it, the operator decided to run wellbore tortuosity logs to obtain information on true downhole conditions.
The MicroGuide analysis revealed several spikes in side force against the tubing that were not previously visible with MWD data (Figure 1). The analysis showed that the casing was helically buckled from 8700 to 10 560 ft, which was causing the increased side force throughout the section as well as the issue with rods parting. Without the wellbore tortuosity logs, the operator would have had inadequate data on the bottomhole to properly make decisions on the best artificial lift method.
In another project in the Bakken, an operator was having issues with their electrical submersible pumps (ESPs) prematurely failing. After trying to determine a better downhole placement based on the existing MWD survey data, the operator realised that they did not have enough information to make this decision. As such, they requested that Gyrodata run its wellbore tortuosity logs to obtain more detailed information on downhole conditions and wellbore geometry.
The MicroGuide logs revealed previously unseen tortuosity from approximately 2400 to 6500 ft (Figure 2), allowing the operator to place the ESP in an optimised location without risk of premature failure. The data also showed that in the upper part of the
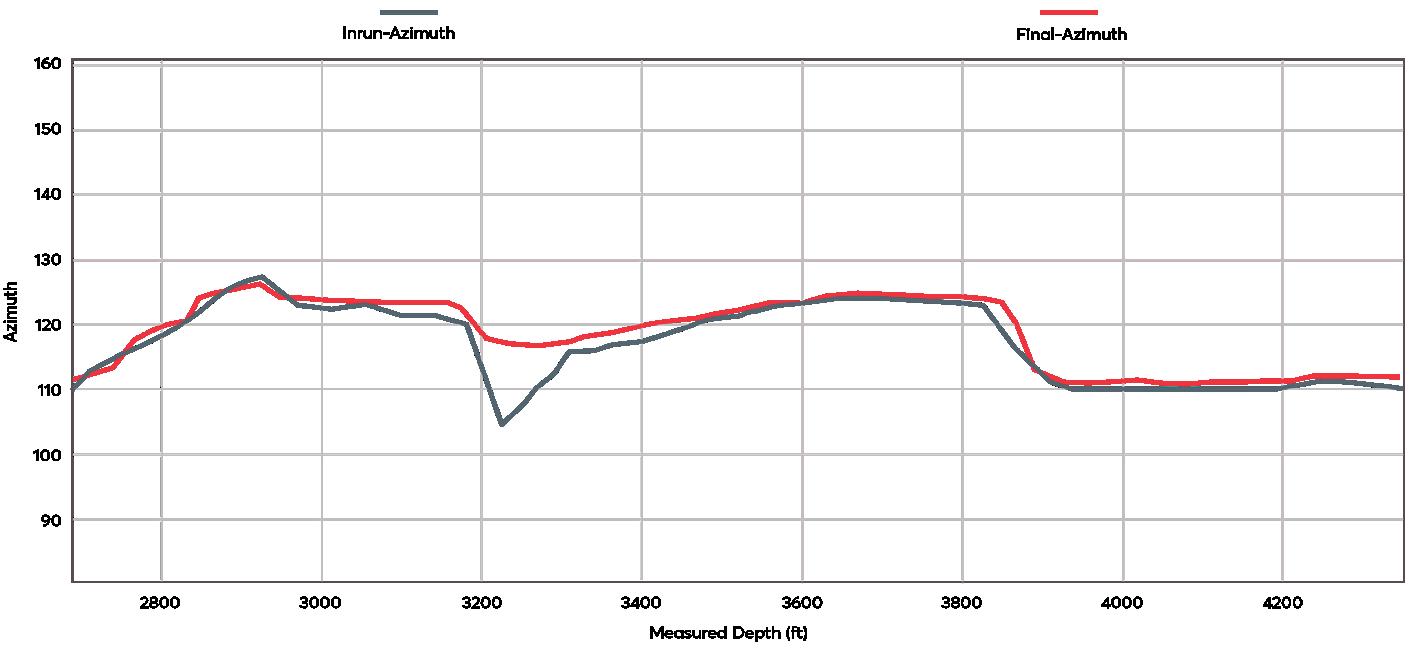
well there was an erroneous azimuth reading on the MWD survey (Figure 3) that caused an incorrect spike in dogleg severity. Had the operator used this information, they would have incorporated specialised equipment at extra cost to traverse the section, even though there was no reason to do so. To ensure that the operator could quickly shift from ESP to rod lift when production declined, they were also provided with a modelled rod guide analysis.
Permian Basin
An operator in the Permian Basin, US, drilled a well and, after deciding to put the well on an ESP for production, determined a set depth for the pump with the limited information they had. The operator and ESP provider intended to place the pump at a shallower depth – potentially sacrificing production – due to their inability to determine a deeper placement with standard MWD data. To help the operator understand true downhole conditions and place the pump where production would be optimised, Gyrodata performed a comprehensive wellbore tortuosity analysis.
The MicroGuide data revealed that the first 5000 ft of the well were without tortuosity, but that immediately thereafter there were several bends of approximately 1.7˚ each. The proposed ESP set depth of 6958 ft was proven acceptable – as the location had no notable tortuosity or excessive bending – but based on completion design, this depth would not be optimal to achieve the highest possible production level.
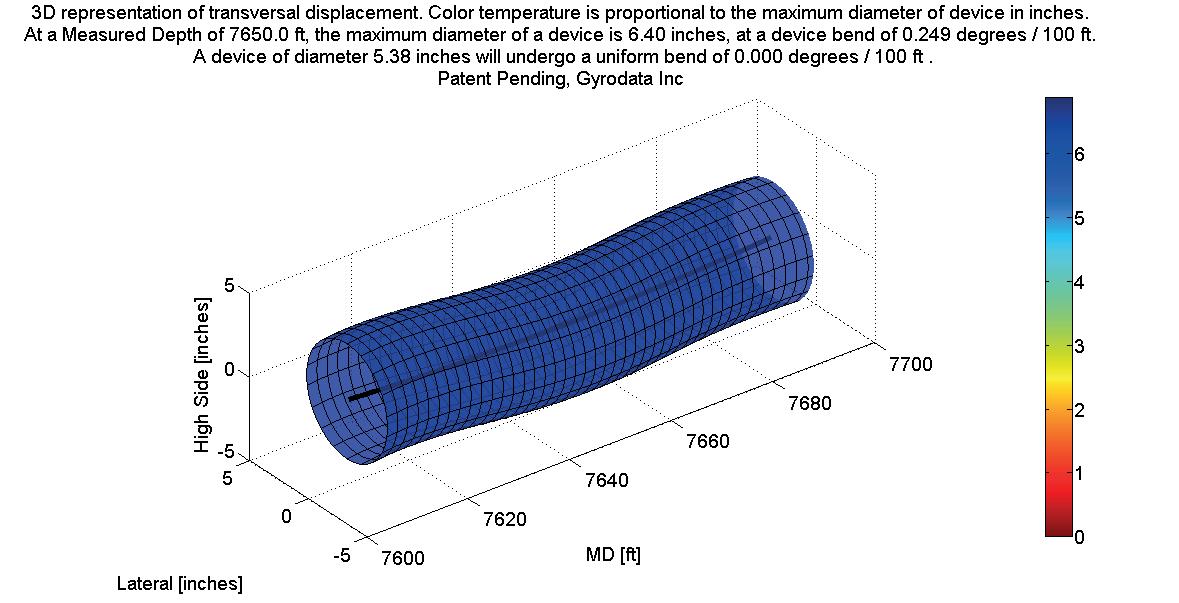
Gyrodata recommended a deeper set depth at 7650 ft (Figure 4) to reach higher production output, noting two areas of significant tortuosity at 7135 and 7535 ft that would make traversing the pump to the new depth difficult. In addition, there was an area at 7557 ft where a 4˚ bend would necessitate cable clamps to pass the pump through. This would have been impossible to determine with typical MWD data and dogleg severity information; significant equipment damage would have occured had the operator proceeded as normal.
In another project in the Permian, an operator drilled a well and used a gyro tool from another company for wellbore surveying. When preparing to put the well on rod lift for production, the operator requested that Gyrodata perform wellbore tortuosity logging to ensure the accuracy of the existing gyro surveys and highlight any discrepancies with the placement of the wellbore and tortuosity severity throughout the well.
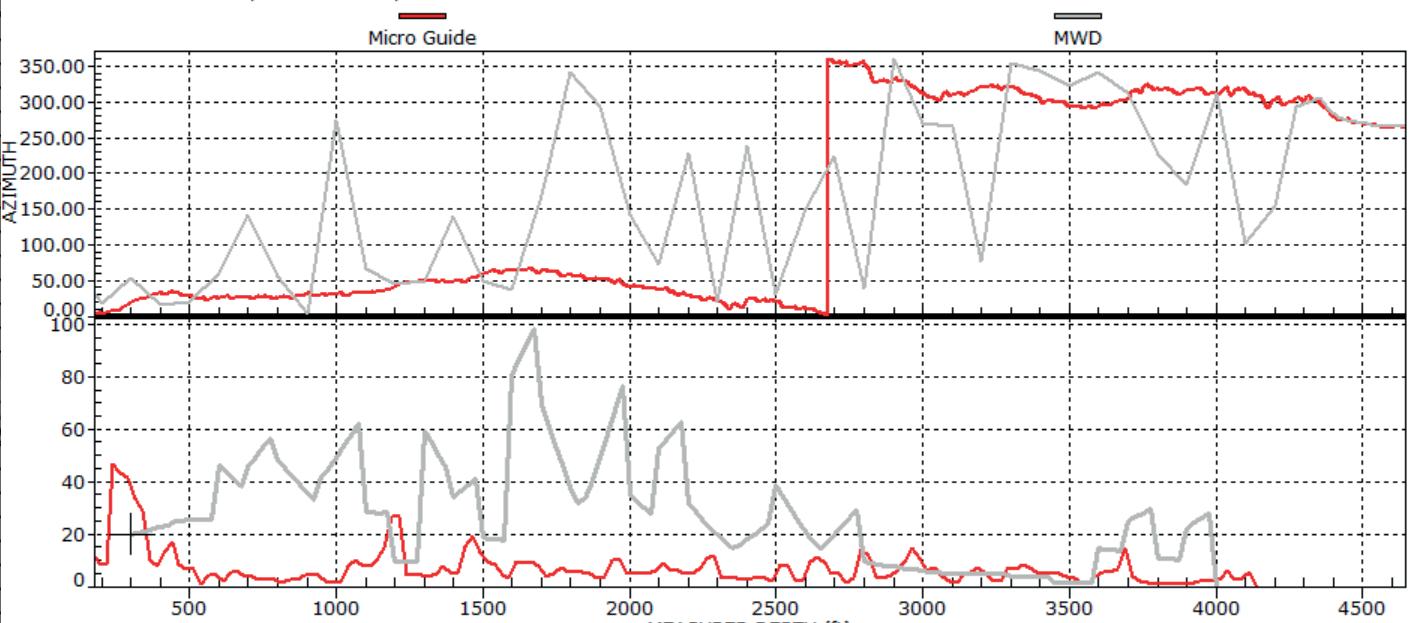
The wellbore tortuosity analysis showed that the well was straight down to the kickoff point and that were was no bending down to approximately 4370 ft. The original survey data from the previous gyro provider had more than a dozen incorrect azimuth readings (Figure 5, top), the use of which would have led to the operator taking a costly and unnecessary approach to placing the rod guides. The data also showed a significant variance in tortuosity versus the previous gyro surveys, with the MicroGuide logs revealing incorrect tortuosity spikes in every instance (Figure 5, bottom). With regards to improving wellbore placement for reservoir access, Gyrodata found that there was a lateral discrepancy of 27 ft compared to what the original surveys had stated. In other words, the hole was 27 ft to the north of where the operator thought it was. Such variances, even when small, can have a large effect on reservoir access and production levels.
Figure 4. At the new set depth of 7650 ft, there were no wellbore quality issues that would impact the production capability of the pump, and the deeper location allowed greater reservoir access. Figure 5. The azimuth data from gyro surveys, shown in grey, gave false appearance of tortuosity in the well (top). The analysis showed that the side force measurement calculated with the previous gyro was incorrect. Had the operator used this information they could have wrongly implemented specialised tools to place the production equipment (bottom).
Conclusion
As the industry trudges through the mire of ongoing pandemic-related troubles, there is little doubt that operators will continue to be asked to do more with less. When it comes to production, achieving the best possible output with the least risk is paramount. Looking at wellbore quality issues and challenges with downhole production equipment placement reveals that there is no substitute for having relevant data presented in a clear, understandable way. By providing operators with clarity on where their ESP or rod lift system goes, artificial lift failures and low production levels will hopefully become things of the past.


