8 minute read
Pipeline integrity insights that go deeper

Michael Jefferson, Tracerco, UK, explores how pipeline inspection techniques have adapted to the challenges facing pipeline operators.
As economical oilfields in shallow waters have depleted over time, operators have turned their attention to more challenging fields. The challenges facing these operators vary but typically include deepwater fields, low flow rates, high risk of hydrate formation and high pressures. These pose a particular problem for the inspection and maintenance of pipelines, given that modern pipeline systems are required to operate in more and more challenging conditions, resulting in complex design solutions and previously unencountered corrosion and failure mechanisms. To ensure the ongoing safety and integrity of these pipeline systems, advanced inspection techniques have been developed. One such technique is Tracerco’s DiscoveryTM, a computed tomography (CT) scanner that was developed to tackle such challenges and designed to ensure it is compatible with pipeline integrity management systems.

Background
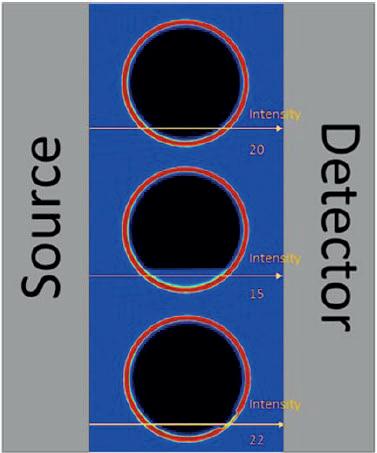
The scanner was specifically designed to provide operators with an enhanced understanding of a pipeline and its coating together with the process fluid, all whilst the pipeline remained operational. The principle behind Discovery is relatively straightforward – the CT beam passes through a material and the density of this material can then be calculated by how much the beam is weakened, known as the attenuation coefficient of the material (Figure 1).
The advantage of CT over other inspection techniques is that it can generate information about the pipeline wall thickness and integrity, the product flowing conditions and the condition of any coating applied to the pipeline, all in a single scan. This information can then be fed into a combined integrity management system, where an operator can view the actual condition and operation of their pipeline network. This, in turn, can help to improve the future integrity of the pipeline.
Discovery is similar or better to tolerances achieved by other non-destructive testing techniques, such as magnetic flux leakage (MFL). MFL is the most used method of pipeline in-line inspection (ILI). Operators using the scanner for local scan inspections are therefore confident that the results are as accurate as those that can be achieved by other, traditional inspection techniques. In addition, the scanner provides a direct measure of the wall thickness available, which is a simple process to compare results produced by other inspection techniques – for example, as part of a corrosion growth assessment. The standard tolerances according to the defect classes, as laid out by the Pipeline Operators Forum ‘Specifications and Requirements for Intelligent Pig Inspection of Pipelines’, are provided in Table 1.
Fast screening technique
A continued difficulty facing operators is the amount of useful inspection data available to them. In many systems, conventional
inspection techniques, such as ILI, may not be practical or even possible. In such cases, operators may be forced to limit themselves to performing localised inspections at potential ‘hotspots’. Depending on the results of inspections performed at these ‘hotspots’, further inspections may be required, which can be a costly process.
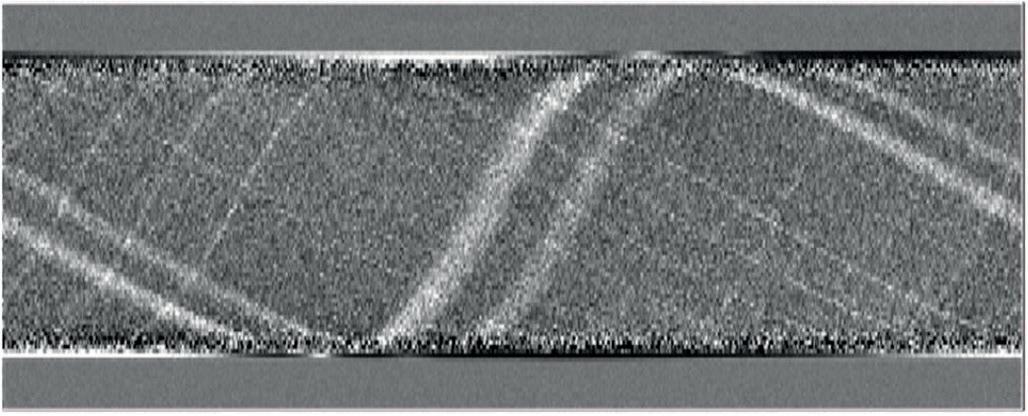
Building on experience whilst working with similar technologies, Tracerco was able to determine that defects or damage in a pipeline wall had a unique characteristic that is typically identifiable within a minute of the scan commencing (Figure 2). If this characteristic is not present, then the scan can be terminated and moved to the next position. The advantage of such an approach is that it helps maximise the amount of useful data collected whilst minimising the overall project time and therefore cost. The overall reduction in scan time is generally between 50% and 80%, depending on the extent of any damage in the pipeline.
This technique, known as ‘fast scanning’, provides swift defect identification during CT scanning, allowing operators of deepwater systems to obtain the maximum amount of valuable data from a single inspection campaign (Figure 3).
The area to be scanned is split into separate sections and a suitable interval for full duration scans is determined. These full duration scans will be performed irrespective of the presence (or lack of presence) of any anomalies or defects, and are to enable general wall thickness measurements and deposit assessments to be performed. For the remainder of the section, quick screening scans are performed. Provided no anomaly characteristics are identified, Discovery moves on at the end of the fast scan time. However, if an anomaly is identified, the scan is extended to a full duration scan to enable accurate sizing of the anomaly.

Figure 1. Density measurement.
Table 1. Comparison of calculated data and field data
Discovery
Minimum depth (at 90% PoD) 2 mm
Depth accuracy (at 80% certainty) -1 to -2 +/-1.5 mm
Width accuracy (at 80% certainty) 3 to 8 +/- 13 mm
Length accuracy (at 80% certainty) +/- 15 mm (considered = to CT slice thickness

Figure 2. Detail of a ‘fast screen’ performed by Discovery, showing characteristic defect traces.
Asset integrity inspection
Preferential weld corrosion
Case study As part of a life extension programme, the scanner was deployed to determine the integrity of a concrete weight-coated pipeline. The pipeline was approaching the end of its original design life and a physical inspection of the pipeline was required. Prior to the campaign, the operator located the highest risk of failure areas to inspect as it was aware of several potential failure mechanisms, such as preferential weld corrosion. Also, the operator worked with a restricted timescale due to various operational issues.
Due to the limited timescale, Tracerco agreed with the operator that its Discovery ‘fast screening’ technique (Figure 3) was best suited for this campaign, as it can reduce the overall scan time by a factor of five.
During the campaign, it was quickly identified that corrosion was occurring inside the pipe close to the seam weld. As there are no mechanical updates needed to change the scanner from a ‘fast screening’ to a full duration scan, it was possible upon identification of a defect to continue the scan to determine the defect sizing (Figure 4).
Consequently, the scanning campaign was successfully completed within the timescale available, resulting in a project time saving of almost 80% and a cost saving of approximately 35% for applying the ‘fast screening’ technique. With valuable information collected by the scanner, the operator has been able to perform the necessary measures to ensure the pipeline can continue to operate safely.
Wall loss detection
Case study The scanner also uses a wall loss feature in which wall loss can be detected in the inner surface of one of the outermost pipes in a pipe-in-pipe system. It is only since Discovery was released to the market that operators now have the tools to enable them to easily inspect the inside of the external pipe of a pipe-in-pipe system, making the identification of previously unknown features in a pipeline easily detectable.
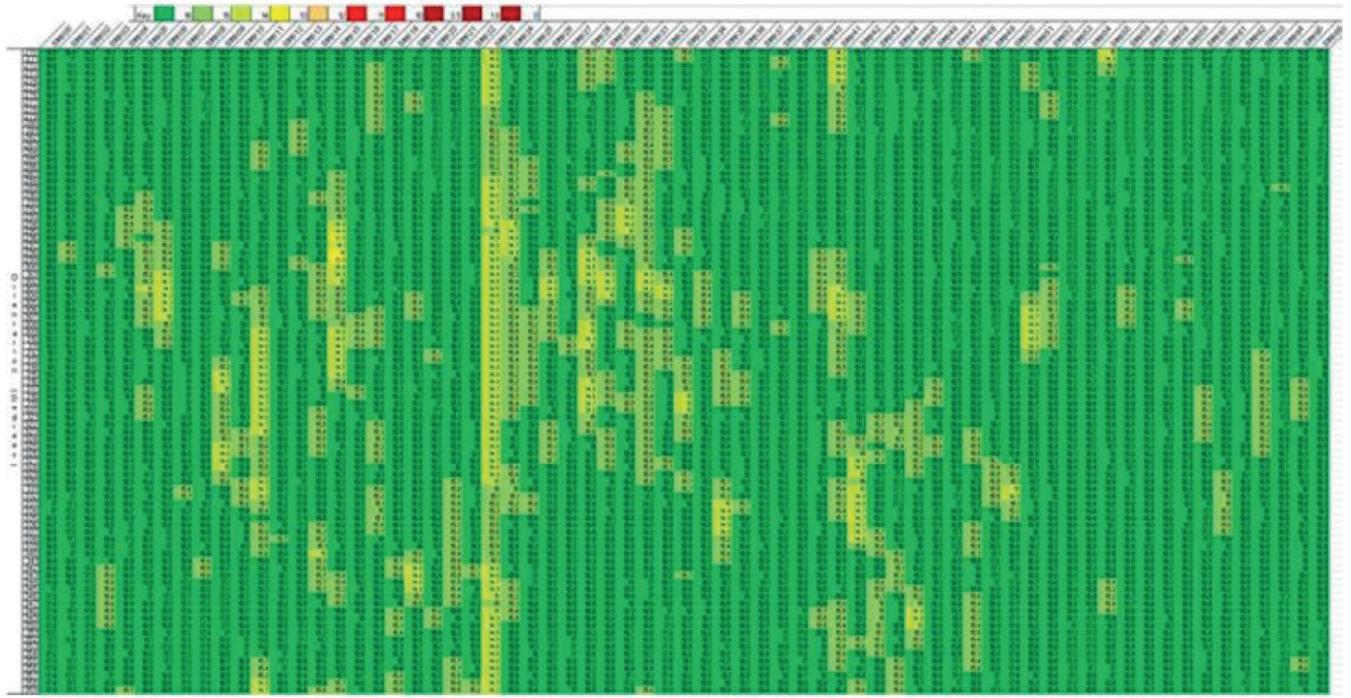
An example of a typical wall map produced by Discovery is provided in Figure 5. In this image, an area of slightly reduced wall thickness – likely due to preferential weld corrosion – is visible.
Flow assurance
Internal deposits
An operator of a pipeline system utilised the scanner in a combined integrity and flow assurance project. The operator required accurate wall thickness measurement as part of a life extension programme, and had identified three areas where they expected the highest level of corrosion or most extreme operating conditions would be. These areas were: Ì Close to the pipeline end termination (PLET): identified for inspection as it had the highest corrosion potential. Ì At the riser base: identified as it is the area where liquid most likely accumulates. Ì On the riser: the thickest pipe wall.
These areas were the same as areas where volumetric wall thickness measurements had been obtained 1 year previously by using pulsed eddy current (PEC). However, clarity on the actual wall thickness values was now required.
Most of the findings from the inspection were positive; the most significant wall loss in the scanned locations was found to be localised corrosion up to 14% wall thickness at the PLET.
On this basis, the operator’s integrity management team was able to conclude that there was no evidence of accelerated corrosion and the life extension would be safe.
The inspection, however, identified one additional and unexpected threat to the pipeline’s integrity. Material with a density consistent with barium sulfate scale had formed inside the pipe and was reducing the bore (Figure 6). Following the completion of the Discovery inspection campaign, this diagnosis was confirmed when routine maintenance was performed on the choke – which also identified a thin build-up of barium sulfate. Working with a chemical vendor, the information provided by Discovery helped the operator to identify the most suitable inhibitor for the line, to remove the costs of ineffectual remediation, reduce the build-up and help prevent new growth. Figure 3. Discovery fast scanning.


Figure 4. Metal loss identified by fast screening, sized by full scan.
Figure 5. Sample wall thickness map produced by Discovery.
Figure 6. Flow assurance results from the riser, riser base and PLET (left to right).
Conclusion
As pipelines are now required to operate in extreme conditions, the challenges facing these pipelines can be outside what is possible to inspect using conventional pipeline inspection techniques. These challenges range from high-temperature operations resulting in localised coating failure to corrosion developing under previously unknown deposits. Consequently, pipeline inspection techniques have been required to adapt to inspect them.
Technologies, such as Discovery, have been developed to provide operators with valuable inspection data on the entire pipeline. This information can be used as part of a combined integrity management strategy, helping an operator to refine and improve their existing pipeline models as well as develop improved inspection and monitoring strategies, all of which can improve the operational efficiency of the pipeline.


