

URBANISM Urbanismo

96

WHAT DOES VOID MEAN?
¿Qué significa el vacío?
We recognize the word void as a lack of something, in it´s simplest definition. Considering only this as reference, urban voids can be understood as unused land, unclear terrain, gaps and wasted space. It sounds quite simple, but it can be conceived as a much more complex matter. Voids can shape cities, depending on the use it is given.
Los vacíos más allá de solo ser asuencia, pueden moldear ciudades dependiendo del uso que se les da. Tienen la capacidad de evolucionar más allá de solo ser un baldío, espacio en desuso o abandonado.
VOIDS IN INDUSTRIAL VALLEJO
Vacíos en Industrial Vallejo
The specific shape that Industrial Vallejo has, with large solid spaces comes from an Industrialization period in which large industrial ships were ideal for technological improvement. As the city grew and the context quickly evolved, this settlements remained trapped in the development, changing it´s original planning. Despite of this, it remained as a well located zone in which a great amount of companies still manage activities in.
This small context helps us have a better understanding of the voids found in Industrial Vallejo, as there are only a few gaps that aren´t completely closed by companies. The most visually obvious seems to be the streets, that are also occupied by large trucks.
La forma de Industrial Vallejo tiene mucho que ver con la época de la Industrialización, en la que había grandes naves y la planeción era que se creara una zona Industrial de alta tecnología. Cuando fue pasando el tiempo, la ciudad creció y absorbió la zona.
Esto nos ayuda a entender un poco mejor los vacíos que existen en Vallejo, o más bien la falta de ellos, pues a primera vista, lo más obvio en vacío son las calles.
97
EMPTINESS DOES NOT EQUAL EMPTY


SUBUTILIZED
1.79% 32.76% PARKING
1. Gráfico de creación propia con datos de la alcaldía de Azcapotzalco sobre usos de suelo en Industrial Vallejo.
WHAT HAPPENS IN VOIDS TODAY?
¿Qué sucede en los vacíos?
At present, about 32.8% (Plan Mestro Vallejo, 2020) of the land use goes to parking and operational yard for trucks, as seen in the map. This creates large gaps inside of the businesses constructions, but these gaps never connect as they are surrounded by strong and tall walls.
Another type of void, is subutulized land and wasteland, this represents about 1.8% (Plan Mestro Vallejo, 2020) of the land use in Vallejo. In this category we can clasify spaces like dumps, the old unused railway, abandoned companies, and land that can still absorb.
En la actualidad, alrededor del 32,8% del uso del suelo se destina a estacionamiento y patio operativo de camiones, como se observa en el mapa.
Otro tipo de vacío, son los terrenos subutulizados y baldíos, esto representa alrededor del 1.8% del uso del suelo en Vallejo.
WHAT CAN HAPPEN?
¿Qué puede suceder?
We can conclude that Industrial Vallejo has this gaps in its morphology, as every attempt of perfect planning still leaves residues. Still, the opportunity of creating new dynamics exists. According to Clément´s “Third Lanscape”, (2007) this spaces that remain have the great capability of transforming into spaces of nature, leisure and unprodution, creating powerful interactions that impact in the colective.
As defined by Clément (2007), “a space that expresses neither power nor the submission of power”. A sacred space where diversity is considered a gift.
Podemos concluir que Industrial Vallejo presenta estos vacíos en su morfología, pues todo intento de perfecta planificación aún deja residuos. Aún así, existe la oportunidad de crear nuevas dinámicas. Según el “Tercer Paisaje” de Clément, estos espacios que quedan tienen la gran capacidad de transformarse en espacios de naturaleza, ocio e inproducción, creando poderosas interacciones que impactan en lo colectivo.
Cristian Rodrigo Rojas Espino Daniel Alberto Cortés Ávila Luis Alfredo Álvarez Rodríguez. (2022). Hacia el reciclamiento de zonas industriales inmersas en ciudades contemporáneas en proceso de transmutación. UNAM. Clément, G. (2007). El Tercer Paisaje. GG. de Azcapotzalco, A. (2020). Plan Mestro Vallejo i.
99
MOBILITY URBAN CONCLUSIONS


Through analysis of the different transport possibilities that exist within Vallejo, we concluded that even though there are 2 bus routes and 2 metro stops, mobility inside vallejo is still very unaccesible, as the walkability is very unsafe and long, in addition to the lack of bicycle lanes, El transporte aunque existe, tanto lineas de autobus como 2 paradas de metro, sigue siendo inaccesible pues no conecta gran parte del poligono.
To this day, even though the train tracks remain abandoned or unused, they still connect Vallejo better.
Las vías abandonadas del tren siguen conectando el polígono mejor
ACCESIBILITY
100 MA N POINTOFCONCENT R A T I NO TROPSNARTFO 25 min 45 min 17 min 38 min
FIGURE 1. MAP OF ACTUAL MOBILITY POSSIBILITIES
TRAIN TRACKS
.
LAND USE


The unexpected presence of housing in an industrial land use, and the existence of industrial residue as a material for construction seems like an oportunity to create new cycles and oportunities.
La inesperada presencia de vivienda en un uso de suelo industrial y la existencia de residuos industriales como material de construcción parece una oportunidad para crear nuevos ciclos y oportunidades.
The existence of housing inside the industrial area can be due to the lack of good, accesible mobility, as it can be expensive and take a great deal out of a workers salary. As a result, the creation of homes near work became a better solution.
La existencia de viviendas dentro de la zona industrial puede deberse a la falta de una buena movilidad accesible, ya que puede resultar costosa y restar mucho salario a los trabajadores. Como resultado, la creación de viviendas cerca del trabajo se convirtió en una mejor solución.
101 HOU INDUSTRY INFOR MAL ING S
FIGURE 2. PIECES THAT DONT FIT
HOUSING AND RESIDUE
HOUSING AND MOBILITY
AGGLOMERATION

Dentro de Vallejo existen diferentes tipos de industria, sin embargo identificamos algunos clusters que contienen empresas similares que podrían estar ayudándose entre sí y por eso están ubicadas cerca.
Cuanto más grande es la industria o el cluster, mayores son el espacio y las necesidades de almacenamiento, excepto cuando no hay suficiente espacio, las calles se convierten en una posibilidad.
Within Vallejo, there are different types of industry, however we identified some clusters that contain similar enterprises that could be helping each other and due to that be located near.
As we analyzed deeper the agglomeration of these industries, one of the factors that were affected by this were the streets. The bigger the industry or the cluster, the bigger the storage space and needs, except when there is not enough space, the streets turn into a possibility.
Trucks are parked outside, limiting space, and complicating good pedestrian life.


102 SPACE FOR PEDESTRIANS SPACE
SPACE FOR CARS WHAT SHOULD ACTUALLY BE THERE?
FOR PEDESTRIANS
FIGURE 3. MAP OF CLUSTERS AND AGGLOMERATION
VOIDS

Through Vallejo there are several voids distributed, when we mark axis, we can start creating more visible connections along them. There can be different interventions that activate along the axis.
A lo largo de Vallejo se distribuyen varios vacíos, cuando marcamos ejes, podemos empezar a crear conexiones.
The shapes marked in the map are voids near one another, that joined create this amoeba shapes that start to grow and connect to others. This can reactivate different spaces within the area.
Las formas marcadas en el mapa son vacíos cerca uno del otro, que unidos crean nuevas formas y posibilidades.
Mobility can also mark connections, as certain spots contain greater movement of people and with certain program it can help major use, permeability and permanence.
La movilidad también puede marcar conexiones, ya que ciertos puntos contienen mayor movimiento de personas.
103
AXIS CONNECTIONS MOBILITY
FIGURE 3. MAP OFVOIDS AND CONNECTIONS
URBAN OPPORTUNITIES
Social:
ey become unsafe spaces because they are abandoned.
Politics:
pace management depends on several factors, such as right-of-way well used.

Energy infrastructure: It is a permeable space.
104
Economy:
ere is no longer any revenue generated by the train

Urban: e Vallejo train tracks are underused
Environmental: Unused train tracks become garbage spaces.
105
3.4. ENVIRONMENTAL
ENVIRONMENTAL
Ambiental
108
Map 1: Made based on (Instituto Nacional De Estadística Y Geografía (INEGI), n.d.)
Polluting emissions and quality of life
Emisiones contaminantes y calidad de vida
Our focus is on Vallejo, which is one of the most important regions of Mexico City, specifically due to its industrial zone.
Industries are sources of very varied polluting emissions. (Cómo Es Una Zona Industrial | CISAC, 2021)
Some of these main polluting emissions are: PM2.5, PM10, O3 and CO2
According to (Cómo Es Una Zona Industrial | CISAC, 2021) exposure to high levels of air pollution can cause a variety of adverse health outcomes: it increases the risk of respiratory infections, heart disease, stroke and lung cancer, affecting quality of life.
Nuestro foco está en Vallejo, que es una de las regiones más importantes de la Ciudad de México, específicamente por su zona industrial.
Las industrias son fuentes de emisiones contaminantes muy variadas. (Cómo Es Una Zona Industrial | CISAC, 2021)
Algunas de estas principales emisiones contaminantes son: PM2.5, PM10, O3 y CO2
Según (Cómo Es Una Zona Industrial | CISAC, 2021)
La exposición a altos niveles de contaminación del aire puede causar una variedad de resultados adversos para la salud: aumenta el riesgo de infecciones respiratorias, enfermedades cardíacas, accidentes cerebrovasculares y cáncer de pulmón, afectando la calidad de vida.
AQ I ( AI R Q UA LI TY I N D E X )
AQI (AIR QUALITY INDEX)
1: Made based on (Caracterización De La Calidad Del Aire En El Sector Industrial Y Propuesta De Herramientas De Medida, n.d.)
109
0 10 20 30 40 50 60 70 80 90 100 110 120 130 140 150
U N GEALTH Y 1 0 11 5 0 MODERA T E 5 11 0 0 DATES MODERATE 51-100 UNGEALTHY FOR SENSITIVE GROUPS 101-150 UNGEALTHY 151-200 VERY UNGEALTHY 201-300 M T W T F S S M T W T F S S T W T F S S M T W T F S S
AZCAPOTZALCO
Graph
AZCAPOTZALCO
Polluting emissions and quality of life Emisiones contaminantes y calidad de vida
PM2.5: These particles can come from cars, trucks, factories, wood burning, and other activities. (¿Qué Son Las Partículas PM 2.5? | S&P, 2020)
PM10: Can be defined as those solid or liquid particles of dust, ash, soot, metal particles, cement or pollen, dispersed in the atmosphere. (Partículas PM10, n.d.)
O3: These primary pollutants come from traffic, combustion facilities or the chemical industry.
CO2: It is the main greenhouse gas that is emitted as a result of activities related to transportation, electricity and industry. (El Caso Específico Del Ozono Como Fuente De Contaminación, n.d.)
PM2.5: Estas partículas pueden provenir de automóviles, camiones, fábricas, quema de madera y otras actividades. (¿Qué Son Las Partículas PM 2.5? | S&P, 2020)
PM10: Pueden definirse como aquellas partículas sólidas o líquidas de polvo, cenizas, hollín, partículas metálicas, cemento o polen, dispersas en la atmósfera.(Partículas PM10, n.d.)
O3: Estos contaminantes primarios provienen del tráfico, las instalaciones de combustión o la industria química.
CO2: Es el principal gas de efecto invernadero que se emite como consecuencia de actividades relacionadas con el transporte, la electricidad y la industria.(El Caso Específico Del Ozono Como Fuente De Contaminación, n.d.)


110
(16M2
65.8HA DEFICIT 8.2KM DETOUR ON LY WALKABLE PATH TO NEARE ST PARK YEARLYPM2.5CONCENTRATION( G/M3) 4.4KM TO NEAREST HOSPITALS ONLY PHARMACY VALLEJO AREA 17.5 WHO LIMIT 5
PER PERSON)
Diagram 1: Made based on INEGI, 2024
Indicators Indicadores
According to data obtained from the (National Institute of Statistics and Geography (INEGI), s.f.), around 16,515 people work in this field, exposing themselves to these emissions every work day.
In addition to this, in order to measure quality of life, research was carried out on quality of life indicators that are related to it.
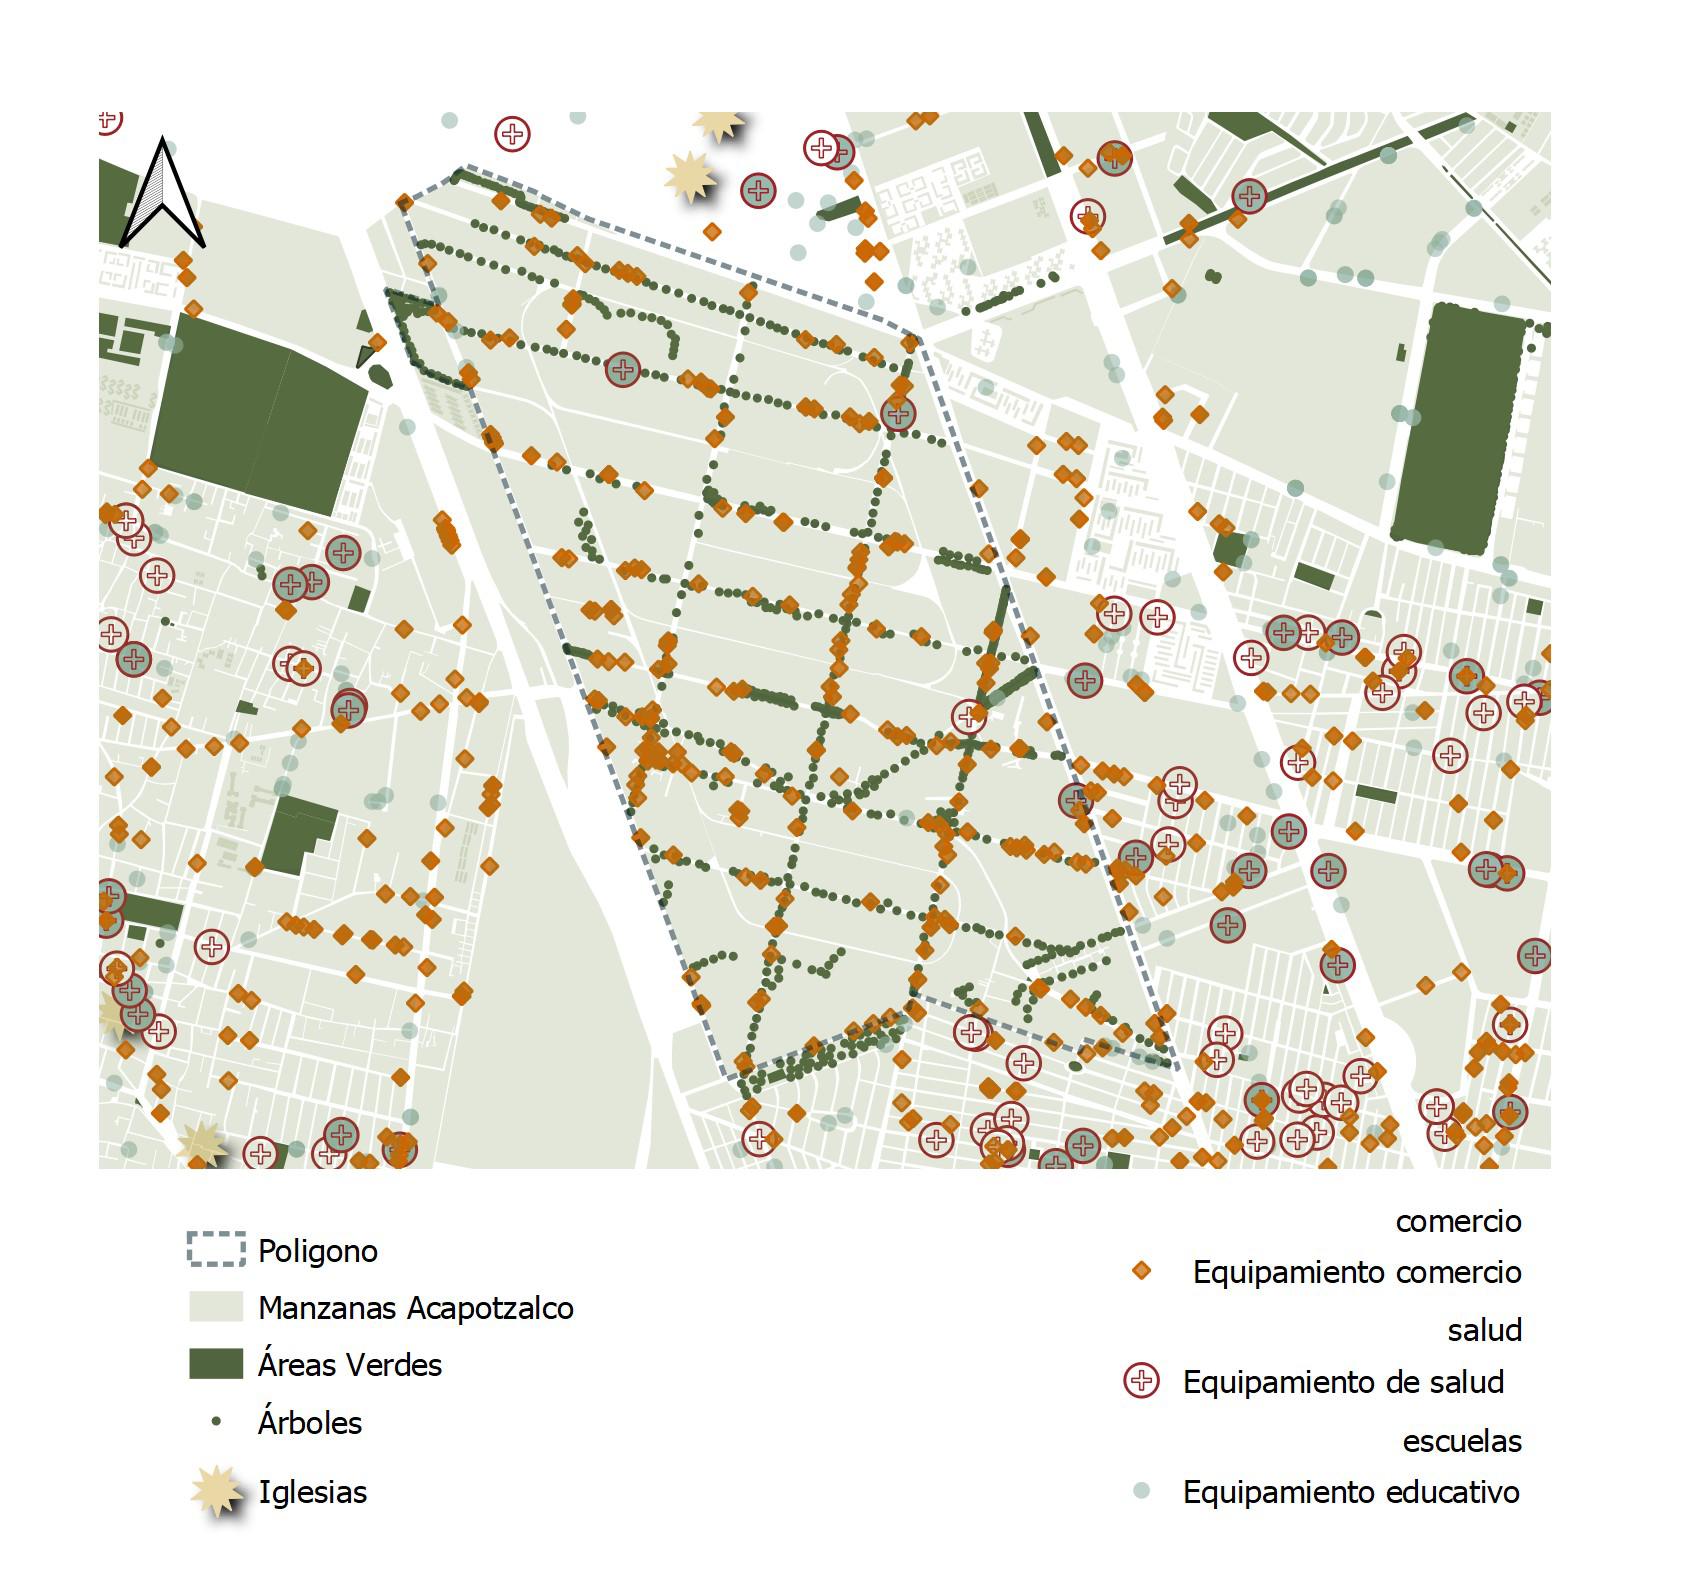
These indicators are people with access to health services, relating it to diseases caused by poor air quality. In addition, a mapping of hospitals in the area was carried out to show the proximity of health services. Another indicator is homes with dirt floors, since dust is a particle that also affects health. The next index is that of overcrowding because the agglomeration of people increases Co2 emissions, mentioning homes that have this condition, and places such as schools and churches that are closed places where people gather. (Mexico City ANNUAL REPORT ON THE SITUATION OF POVERTY AND SOCIAL LAW 2024, s.f.)
Lastly, the number of trees in the area, which can help clean the air. (National Institute of Statistics and Geography (INEGI), s.f.)
These factors and indicators show us that the quality of the air and the conditions in which people live in the area directly affect their health and, therefore, their quality of life.
Según datos obtenidos del (Instituto Nacional de Estadística y Geografía (INEGI), s.f.), alrededor de 441,846 personas laboran en este ramo, exponiéndose a estas emisiones cada día laboral.
Sumado a esto, para poder medir la calidad de vida se realizaron investigaciones sobre indicadores de calidad de vida que están relacionados con esta.
Estos indicadores son: Personas con acceso a servicios de salud, servicios, viviendas con piso de tierra y árboles existentes.
Estos factores e indicadores nos muestran que la calidad del aire y las condiciones en las que viven las personas en la zona afectan directamente a su salud y, por tanto, a su calidad de vida.
Vallejo
1458 Total Inhabitants
50 People with quality living spaces
509 People working in the area
17 People without access water
67 People with overcrowded
79 People with homes with dirt floor
Diagram 2: Made based on (Ciudad De México INFORME ANUAL SOBRE LA SITUACIÓN DE POBREZA Y REZAGO SOCIAL 2024, n.d.)
111
Air quality in Mexico
Clean air is considered a basic requirement for human health and well-being. However it’s pollution continues to represent a threat throughout the world. That’s why the World Health Organization (WHO) established air quality guidelines, which have the aim to provide guidance on how to reduce the effects of air pollution on health. They also provide a guide to the expected amounts of PM2.5 and PM10 annually and every 24 hours. According to the guidelines, the measurements of PM2.5 are: 10 g/m3, annual average and 25 g/m3 24 hour average. On the other hand, PM10 mesurements are: 20 g/m3, annual average and 50 g/m3, 24 hour average. In 2022 Mexico’s average of air quality was considered “moderate”. With a concentration of PM2.5 of 3.9 times the WHO annual air quality guideline value.
El aire limpio se considera un requisito básico para la salud y el bienestar de los humanos. Sin embargo su contaminación sigue representando una amenaza en todo el mundo. Es por eso que la Organización Mundial de la Salud (OMS) estableció guías de calidad del aire, que tienen como objetivo brindar orientación sobre cómo reducir los efectos de la contaminación del aire en la salud. También proporcionaron una guía de las cantidades esperadas de PM2,5 y PM10 anualmente y cada 24 horas. Según los lineamientos, las medidas de PM2.5 son: 10 g/m3, media anual y 25 g/m3 media de 24 horas. Por su parte, las mediciones de PM10 son: 20 g/m3, media anual y 50 g/m3, media de 24 horas. En 2022 el promedio de calidad del aire en México se consideró “moderado”. Con una concentración de PM2,5 de 3,9 veces el valor guía anual de calidad del aire de la OMS.
Percentage of pollutant in the air.

The graphic takes into account the amount of ozone, PM2.5 and PM10 in Mexico City over the years (1990-2017) and its evident reduction in the concentration of these pollutants.
112
Taking into account the guides provided by the WHO, we analyze the cities of Mexico. We use our study city, Azcapotzalco, as a reference to compare it with the cleanest and most polluted city in terms of air quality.
It currently meets the annual value of the WHO air quality guidelines.

Tomando en cuenta las guías proporcionadas por la OMS, analizamos las ciudades de México. Usamos como referencia la ciudad de estudio, Azcapotzalco, para poderla comparar con la ciudad más limpia y más contaminada en temas de calidad de aire.
It is currently 2.8 times higher than the WHO annual air quality guideline value.
AIR QUALITY

METEPEC

It is currently 4.4 times higher than the WHO annual air quality guideline value.
A determining factor of air quality for cities is their geography. On one hand, Metepec is one of the cities in Mexico with the worst air quality because of it’s location. Mexico City is a valley, which prevents air and particles from flowing through it. On the other hand, San Jose del Cabo is a coastal city with a lot of air currents, which allows particles to flow and clean the air.
Un factor determinante de la calidad del aire en las ciudades es su geografía. Por un lado, Metepec es una de las ciudades de México con peor calidad del aire debido a su ubicación. Es un valle, lo que impide que el aire y las partículas fluyan a través de él. Por otro lado, San José del Cabo es una ciudad costera con corrientes de aire, lo que permite el flujo de partículas.
113 AZCAPO T Z A LCO S A N J O S E DEL CABO C i ud ad d e M e x i c o BajaCaliforniaSur CiudaddeMexico PM 2.5
16.9*
g/m³ PM 2.5
µ
1*
µg/m³
23.1*
PM 2.5
µg/m³
SOLAR POTENTIAL
Potencial solar
Mexico City displays advantageous environmental conditions for solar energy generation; this is due to its location amid Mexico’s semidesert valley. A reliable instrument to calculate solar potential is the Global Horizontal Irradiance (GHI) index, and Vallejo’s borough, Azcapotzalco, falls into the regional GHI range of 5-6 kW/m 2 , which is greater than other cities boasting great solar infrastructure such as Berlin and Barcelona with 2.6 and 4.6kW/m 2 (SEDECO, 2022).
There is one public project aimed to provide solar energy generation to the city, which is the CEDA Photovoltaic Power Plant. It is currently unfinished, and expexcted to generate only 18MW. There are 35 commerces relating to solar energy generation in the city, but no apparent interest in the development of large scale infrastructure, which begs the question:
What more is needed for this city to harness the sun?
La Ciudad de México muestra condiciones ambientales favorables para la generación de energía solar debido a su ubicación en el semidesierto. Tiene un valor considerable de Radiación Global Horizontal (entre 5-6 kW/m2) , mayor al de ciudades con infraestructura solar considerable como Berlín o Madrid. (SEDECO, 2022).
La Central Fotovoltaica de la Central de Abastos es la única iniciativa pública dirigida a proveer energía solar a la ciudad. Está inacabada, y buscará proveer apenas 18MW.
Aunque hay 35 empresas del sector de generación de energía solar en la ciudad, no se ha mostrado interés por el desarrollo de infraestructura a gran escala, generando la pregunta:
¿Qué más le falta a la ciudad para aprovechar al sol?
SINCE 2014: 95% RENEWABLE ELECTRICITY IN ALL COSTA RICA
2025: BARCELONA GAINS 10.5MW CAPACITY OF SOLAR POWER IN MUNICIPAL BUILDINGS
FEBRUARY: CEDA OPENED WITH 18MW CAPACITY
JANUARY: CEDA PROJECT ANNOUNCED, COMPLETION SET FOR DECEMBER

INDONESIA ACHIEVES 30% RENEWABLE ENERGY MIX
COSTA RICA REACHES 100% RENEWABLE ENERGY
8 CEDA PLANTS CAN POWER 38,544 HOMES IN BARCELONA FOR A YEAR
6 CEDA PLANTS CAN POWER 22.2% OF THE CITY’S METRO SYSTEM FOR A YEAR
YEAR 4,201: 4,358 CEDA PLANTS CAN POWER ALL OF MEXICO CITY FOR A YEAR USING 2022’S TOTAL CONSUMPTION
SANTIAGO, CHILE ACHIEVES 100% EVs IN PUBLIC TRANSPORT
MEXICO BECOMES NET ZERO (?)
114 2022 2024 2026 2034 2038 2050
0 2040
2030
PROJECTION FOR MEXICO CITY’S SOLAR ENERGY PRODUCTION FOLLOWING HYPOTHETICAL 26.5GW/H GROWTH EVERY 2 YEARS BASED ON THE CEDA PLANT, COMPARED TO GLOBAL GOALS

AVERAGE DAILY GLOBAL HORIZONTAL IRRADIANCE (GHI) IN MEXICO CITY (SOLARGIS, 2019)
(KW/M2)
5 6.5
COMMERCE RELATED TO SOLAR GENERATION (DENUE, 2022)
CONTOUR LINES (200M)
LA CRUZ DEL MARQUÉS HILL (3,930 MASL)
VALLEJO INDUSTRIAL ZONE (2,240 MASL)
CEDA PHOTOVOLTAIC POWER PLANT
STATE BORDERS
MEXICO CITY’S BOROUGH BORDERS
115
GHI INDEX
1:350,000 - EPSG 4326
MORELOS
0 7.5 15 22.5 30
STATE OF MEXICO
WIND POTENTIAL
Potencial eólico
Mexico City’s eolic potential is limited. This energy source requires an average wind speed above 5m/s, but according to Global Wind Atlas, the vast majority of the city only experiences highs of 3m/s. Only a few hills and volcanoes in southern zones reach the minimum. No public eolic projects were found. Nevertheless, 60 eolic commerces are based in the city. Just like solar, most are located in the Miguel Hidalgo borough near Vallejo.
This could be interpreted knowing that wind has a larger percentage in the country’s total energy pool. Taking into account solar and wind potentials in the city, there could be an opportunity in co-generation systems employing both energies in varying scales.
El potencial eólico de la Ciudad de México es limitado, porque se requieren vientos de velocidad promedio mayor a 5m/s. La mayoría de la ciudad llega hasta 3m/s; sólo algunos cerros y volcanes sureños alcanzan el mínimo.
Hay 60 comercios de generación eólica en la ciudad, la mayoría en la alcaldía Miguel Hidalgo, cerca de Vallejo. Tomando en cuenta los potenciales renovables de la ciudad, puede existir una oportunidad dentro de sistemas co-generaradores que emplean ambas energías a distintas escalas.
3M/S STARTING SPEED
7-11M/S OPTIMAL GENERATION
10-20M TOWER HEIGHT ABOVE OBSTACLES
2H DISTANCE AWAY FROM OBSTACLES
ONE-WAY ROTOR
3-70KW POWER RANGE BY MODEL
3.8-15.6M DIAMETER RANGE
5Ø / 10Ø SPACING ACROSS / BEHIND
150W-7KW POWER RANGE BY MODEL
1.5M/S STARTING SPEED
OMNIDIRECTIONAL ROTOR 1.5M AVERAGE DIAMETER 4Ø SPACING BETWEEN VAWT
24/7 OPERATION
CLOUD-FRIENDLY
RAIN CLEANS PANELS
COMPARISON BETWEEN HORIZONTAL AND VERTICAL AXIS WIND TURBINES BENEFITS OF CO-GENERATION ENERGY SYSTEMS
116

AVERAGE WIND SPEED 10M HIGH IN MEXICO CITY (GLOBAL WIND ATLAS, 2024)
1 3 WIND SPEED (M/S)
COMMERCE RELATED TO WIND GENERATION DOMINANT WINDS DUE NORTHEAST
LA CRUZ DEL MARQUÉS HILL (3,930 MASL)
VALLEJO INDUSTRIAL ZONE (2,240 MASL)
CONTOUR LINES (200M) STATE BORDERS
MEXICO CITY’S BOROUGH BORDERS
117
1:350,000 - EPSG 4326 0 7.5 15 22.5 30
MORELOS
STATE OF MEXICO
WASTE & ITS POTENTIAL
Residuos y su potencial
The Project of the General Territorial Planning Program of Mexico City (PGOT) is the main planning instrument that addresses rural, urban and conservation land, aligning with the search for a city of rights established in the Constitution (Article 16) and the General Development Plan. Furthermore, the population growth in Mexico City highlights the importance of managing waste, and the Ministry of the Environment develops public policy instruments to address this complexity.
This waste specifically produced by industries, companies, factories and homes is carried out through rigorous transportation, depending on the waste, until it is recycled or final used in:
El Proyecto del Programa General de Ordenamiento Territorial de la Ciudad de México (PGOT) es el principal instrumento de planificación que aborda el suelo rural, urbano y de conservación alineándose con la búsqueda de una ciudad de derechos establecida en la Constitución (Artículo 16) y el Plan General de Desarrollo. Además, el crecimiento poblacional en la Ciudad de México destaca la relevancia de gestionar residuos, y la Secretaría del Medio Ambiente elabora instrumentos de política pública para abordar esta complejidad.
Estos desperdicios específicamente realizados por industrias, empresas, fábricas y hogares son llevados a un traslado riguroso, dependiendo del residuo, hasta llegar a su reciclaje o uso final:


118
Image 1. Diagram of the Classification of waste according to the industry and where they take it
SSIV NSUME INDU AL USE ORGA INORG A N Examplesthatwefindinhomes: • ElectrónicadeconsumoyTIC • EquiposdeIluminación • ElectrónicadeconsumoyTIC • Herramientaseléctricas•Jugueteseléctricos • Pilasyacumuladores •Electricequipment Extrawastegeneratedby
•MachineryandPowerTools •ElectromedicalDevices •SurveillanceandControlInstruments •Vendingmachines Some
•
•
•
•
•
Inthevoluminousarea we can fi n d : •Televisions
ri geratorssh i n gMach i nes ters
1 RCDMachinery • 1 Bio a d d i t i v e P l a nt • 3 Compaction Plants • VOLUMINO U S 12 Tr a n s f e r S t a t ions • 3 Selection Plants • 8 C o m p o s t P l a n t s • 8 iF n a l D i s p o s a l S it e s CDMX URBAN SPECIAL
factories:
examplesoforganicwasteare:
VegetableLeftovers
FruitandSeedShells
Bones, ShellsandSkin
Dairy
GardenWaste Inorganic NOTreusable:•CigaretteButts, MetalWrappers
Ref
Diapers,SanitaryTowels andToiletPaper Recyclable inorganics: •Paper,Cardboard,PET, MetalandGlass
SYMBOLS
Industrial_Vallejo_Blocks
Blocks_Azcapotzalco
Waste_Stations
Recycling_Stations Near Far
0 500 1,000m
1. Map of waste plants and dumps located near Vallejo, Azcapotzalco , CDMX (INEGI, 2024)
119 1:45,000 - EPSG 4326
Map
EXAMPLE STUDY CASE
Caso de Estudio
CEDIS Azcapotzalco or CEDIS AzcapoPark is a distribution center in charge of the supply chain and through which commercial chains make greater efficiency efforts to fulfill the promise of bringing the product at the right time, quantity and place to satisfy the needs. needs of a much more demanding consumer when it comes to being at the point of sale or “Cross Docking”, defined as a distribution system where products are received on a preparation platform and are not stored, but prepared to be sent from immediately to the stores of the different commercial chains that carry out this practice.
The “Cross Docking” strategy contemplates: General warehouse warehouse (fiscal warehouse), has UVA (Accredited Verification Unit), for labeling, placing labels on wines and preparing opinions and certificates of compliance with the NOMs, performs picking, kitting, conditioning, labeling operations , packaging, direct and indirect crossdocking and inventory control at all levels. (GRUPO LOGISTICS, 2024)
CEDIS Azcapotzalco o CEDIS AzcapoPark es un Centro de distribución encargado de la cadena de suministro y a través de los cuales, las cadenas comerciales realizan esfuerzos de mayor eficiencia para cumplir con la promesa de llevar el producto en el momento, cantidad y lugar adecuados para satisfacer las necesidades de un consumidor mucho más exigente a la hora de encontrarse en el punto de venta o “Cross Docking”, definido como un sistema de distribución donde son recibidos los productos en una plataforma de alistamiento y no son almacenados, sino preparados para ser enviados de manera inmediata a las tiendas de las diferentes cadenas comerciales que llevan a cabo esta práctica.
La estrategia de “Cross Docking” contempla: Almacén General de depósito (depósito fiscal), dispone de UVA (Unidad de Verificación Acreditada), para el etiquetado, colocación de marbetes en vinos y elaboración de dictámenes y constancias del cumplimiento de las NOMs, realiza operaciones de picking, kitting, acondicionamiento, etiquetado, embalajes, crossdocking directo e indirecto y control de inventario en todo nivel. (GRUPO LOGISTICS, 2024)
CEDIS Azcapotzalco: Puri cation and water bottling
“Cross Docking Type” Production or a system where products are received on a platform enlistment and not stored, but prepared immediately for shipment to stores of di erent chains commercials that use this practice. The objective is to ful ll with the promise to deliver products at the moment, appropriate quantity and location to meet the demands of an increasingly consumer demanding at the point of sale.


120 CEDIS - AZCAPOTZALCO CASE STUDY - WASTE FLOW COMPARIES THEY MANUFACTURE
FOR:
COMMERCE CONSUMER WASTE SYSTEM FLOW: COLLECTION SERVICE SEPARATION PLANTS CONTROLLED DISPOSAL EDUCATIONAL PROGRAMS ENVIRONMENT GATHERING CENTERS COLLECTORS PLANTS It is the responsibility of the three levels of government for the comprehensive management of plastic waste: in addition to being emphasized in constitutional article 115. PACKAGING PLANTS SUPPLIERS: RECYCLING PLANTS AND FOREIGN RECYCLERS RAW MATERIAL Companies and Administers associated to the National Plan Private Collective Waste Management of Post Consumer PET Packaging, HDPE, LDPE, BOPP, Aluminum and other materials SEMARNAT (PM-ROTR-008-2013) such as Mexico City CDMX-SEDEMA-PMRCL-L008/2016
Diagram 1. Case Study System Flow


There are 3 sectors located in the zone
The number of 3 sectors are located in Azcapotzalco 4 sectors can be found in the zone
Today, we can find 4 sectors in Azcapotzalco
CEDIS, despite being the largest manufacturer of water purification and bottling for larger companies and its transportation, is actually the responsibility of the three levels of government for the comprehensive management of plastic waste. The waste is the responsibility of the consumers to be correctly taken to a recycling or waste container and the government who disposes of it from the industries, in addition to being reflected in Constitutional Article 115, and I quote ‘the cleaning service or comprehensive management of waste. Municipal solid waste corresponds to municipalities or mayors’ offices. (ECOCE, 2024).
The participation and cooperation of industrial and commercial companies to help recycle their end-of-life products is implemented through the operation of an organization that fulfills these obligations at the national level on behalf of its member companies. They facilitate the recovery and recycling of packaging waste in the most economical and ecological way. Point out that responsibility is not only the responsibility of the industry, but also the responsibility of all sectors of society.
An example of these organizations is ECOCE, which is “an A.C. non-profit, focused on collecting and recycling post-consumer waste from containers and packaging of consumer products. They are the mechanism for associated companies to carry out the Shared Responsibility established by the LGPGIR. (ECOCE, 2024).
Although this information is recognized, it is not truly recognized whether this company truly complies with the indicated article, but it is important to recognize that there are institutions and laws that establish the care and recycling of resources, mainly biomass.
Only 1 sector can be found
CEDIS a pesar de ser la mayor manufactura de purificación y embotellado de agua para empresas mayores y su transporte en realidad, es responsabilidad de los tres órdenes de gobierno para el manejo integral de los residuos plásticos. Los residuos son responsabilidad de los consumidores de ser correctamente llevados a un envase de reciclaje o desecho y el gobierno quien desecha lo de las industrias, además de estar plasmado en el Artículo 115 Constitucional, y cito ‘el servicio de limpia o manejo integral de los residuos sólidos urbanos corresponde a los municipios o alcaldías’. (ECOCE, 2024).
La participación y cooperación de empresas industriales y comerciales para ayudar a reciclar sus productos al final de su vida útil se implementa a través del funcionamiento de una organización que cumple estas obligaciones a nivel nacional en nombre de sus empresas miembros. Facilitan la recuperación y el reciclaje de residuos de envases de la forma más económica y ecológica. Señalar que la responsabilidad no es sólo responsabilidad de la industria, sino también responsabilidad de todos los sectores de la sociedad.
Un ejemplo de estas organizaciones es ECOCE que son “una A.C. sin fines de lucro, enfocada en acopiar y reciclar residuos Postconsumo de envases y empaques de productos de consumo. Son el mecanismo de las empresas asociadas para llevar a cabo la Responsabilidad Compartida marcada por la LGPGIR. (ECOCE, 2024).
Pese a que se reconoce esta información, no se reconoce verdaderamente si esta empresa de verdad cumple con el artículo indicado, pero es importante reconocer que existen instituciones y leyes que establezcan el cuidado y reciclaje de los recursos, principalmente biomasa.
121
Wine, Drinks & Food sector
Paper Sector Pharmaceutical and Chemical Sector
Textile Sector Wood Sector
Industries with Biomass Potential
Image 2. Diagram of Industries with biomass potential and the amount
ENVIRONMENTAL CONCLUSIONS
• Mexico City fails to fully harness its formidable solar potential even after considering its new large public photovoltaic plant.
• Wind potential is lower but significantly wasted.
• Even if pollutant numbers have decreased in Mexico City since the 90s, Azcapotzalco can reach double the air pollution limits imposed by WHO than of Metepec (the Mexican city with worst air quality) due to industrial emissions.
• Air pollution directly impacts the quality of life for Vallejo’s largest user group (workers), whose respiratory health is compromised by the total lack of green spaces, low availability of health services within the site, and housing conditions.
• Even when governmental regulations are present, local industries lack transparency regarding their sustainable waste management cycle
• Citizens cannot effectively partake in this cycle due to a lack of incentives and infrastructure.
Conclusiones ambientales
• La Ciudad de México no logra aprovechar su enorme potencial solar aún con su nueva planta fotovoltaica pública.
• El potencial eólico es menor pero significadamente desaprovechado.
• Aunque los contaminantes aéreos han disminuido desde los años 90, Azcapotzalco llega a alcanzar el doble de los límites permitidos por la OMS que Metepec, la ciudad mexicana con peor aire
• La contaminación aérea impacta directamente la calidad de vida de los usuarios principales de Vallejo (trabajadores), cuya salud respiratoria peligra por la ausencia de espacios verdes, baja disponibilidad de equipamiento de salud y características mejorables de las viviendas.
• A pesar de las normativas gubernamentales presentes, existe una falta de transparencia por parte de las industrias locales sobre su manejo sustentable de residuos..
• Los ciudadanos no pueden empoderarse en el ciclo de reuso de residuos, por la falta de incentivos e infraestructura.
GLOBAL HORIZONTAL IRRADIANCE (KWH/M2) VERSUS PUBLIC SOLAR GENERATION (MW)
EXQUISITE BUT UNTAPPED SOLAR POTENTIAL, WIND LOW & NEGLECTED
GWH
122
4,358 BARCELONA 4.6 VALLEJO 0 5.5
27.7
MAXIMUM YEARLY GENERATION 504 HA VALLEJO SURFACE AREA FULL COVERAGE SCENARIO
26.5
CEDA PLANT YEARLY GENERATION
GWH VALLEJO’S
ONLY WALKABLE PATH TO NEAREST PARK
SOCIAL DISRUPTIONS IN WASTE CYCLE
4.4KM
123 WEAK INCENTIVES REDUCED EMPOWERMENT LOW ACCOUNTABILITY LACK OF TRANSPARENCY
MODERATE AIR QUALITY,
GREEN
LACKING ACCESIBLE
& MEDICAL INFRASTRUCTURE 8.2KM DETOUR
YEARLY PM2.5 CONCENTRATION (μG/M3)
ONLY 1 PHARMACY LARGE SCALE PUBLIC WASTE MANAGEMENT PLANT (16M2PERPERSON) 65.8HADEFICIT VALLEJO AREA 17.5 WHO LIMIT 5
TO NEAREST HOSPITALS
ENVIRONMENTAL OPPORTUNITIES

Lack of green areas to mitigate air pollution.
Falta de áreas verdes para mitigar la contaminación del aire.


Lack of accessible hospital medical equipment within the polygon.
Falta de equipamiento médico hospitalario accesible dentro del polígono.
Waste of energy potential (solar and wind).
Desaprovechamiento del potencial energético (solar y eólico).
124


Deregulation of housing and lack of access to basic services.
Desregularización de las viviendas y falta de acceso a servicios básicos.
The current cycle of sustainable waste management is fractured between its main actors (government, industry, companies and citizens), preventing interrelated functioning.
El ciclo actual de manejo sostenible de residuos está fracturado entre sus actores principales (gobierno, industria, empresas y ciudadanos) impidiendo un funcionamiento interrelacionado.
There are only 2 medium-scale industrial waste collection centers in Vallejo.
Existen sólamente 2 centros de acopio de residuos industriales de escala media en Vallejo.
125
3.5. ENERGY
ELECTRICAL NETWORK
RED ELÉCTRICA
The National Electric System is composed of Electric Power Plants of different technologies, the National Transmission Grid (NTG), and the General Distribution Grids (GDG), which deliver the electricity produced in the plants to Basic Service Users (BSU) and Market Users (MU) (CONAHCYT, 2020).
The following graphic shows the Electric Power Plants and how the electrycity is transmited to the various users conected to the network, and by which user is the one that access the different electric routs.
The lowest KV station are reserved for housing and low cosumption users, soy that is the network that the housing in Vallejo are conected to.

El Sistema Eléctrico Nacional incluye centrales de distintas tecnologías, la Red Nacional de Transmisión y las Redes Generales de Distribución, que distribuyen electricidad a usuarios básicos y de mercado (CONAHCYT, 2020). Un gráfico muestra estas centrales y cómo se conectan a los usuarios, con estaciones de menor KV reservadas para viviendas y consumidores de bajo consumo, como las de Vallejo.

128

Substation coverage of housing and low consuming comerce

129
INDUSTRIAL INFRASTRUCTURE
INFRAESTRUCTURA IDUSTRIAL

Given the industrial character of Vallejo, comprehending its electricity infrastructure becomes pivotal. Azcapotzalco, a part of the Northern Valley of Mexico, largely draws its electricity supply from the Tula Power Plant, situated approximately 72 kilometers to the north. Notably, a 230 KV substation serves as a critical link, catering specifically to the medium consumption industries operating within the Vallejo Zone. Understanding this network is essential for ensuring reliable and efficient power distribution to sustain the industrial activities vital to Vallejo’s economic landscape.
130

Dado el carácter industrial de Vallejo, comprender su infraestructura eléctrica se vuelve crucial. Azcapotzalco, parte del Valle del Norte de México, obtiene en su mayoría su suministro eléctrico de la Planta de Energía Tula, ubicada aproximadamente a 72 kilómetros al norte. Destacadamente, una subestación de 230 KV sirve como un eslabón crítico, atendiendo específicamente a las industrias de consumo medio que operan dentro de la Zona de Vallejo. Comprender esta red es esencial para garantizar una distribución de energía confiable y eficiente que sustente las actividades industriales vitales para el paisaje económico de Vallejo.
131
AVAILABILITY OF RENEWABLE ENERGY
DISPONIBILIDAD DE
ENERGÍA ELÉCTRICA
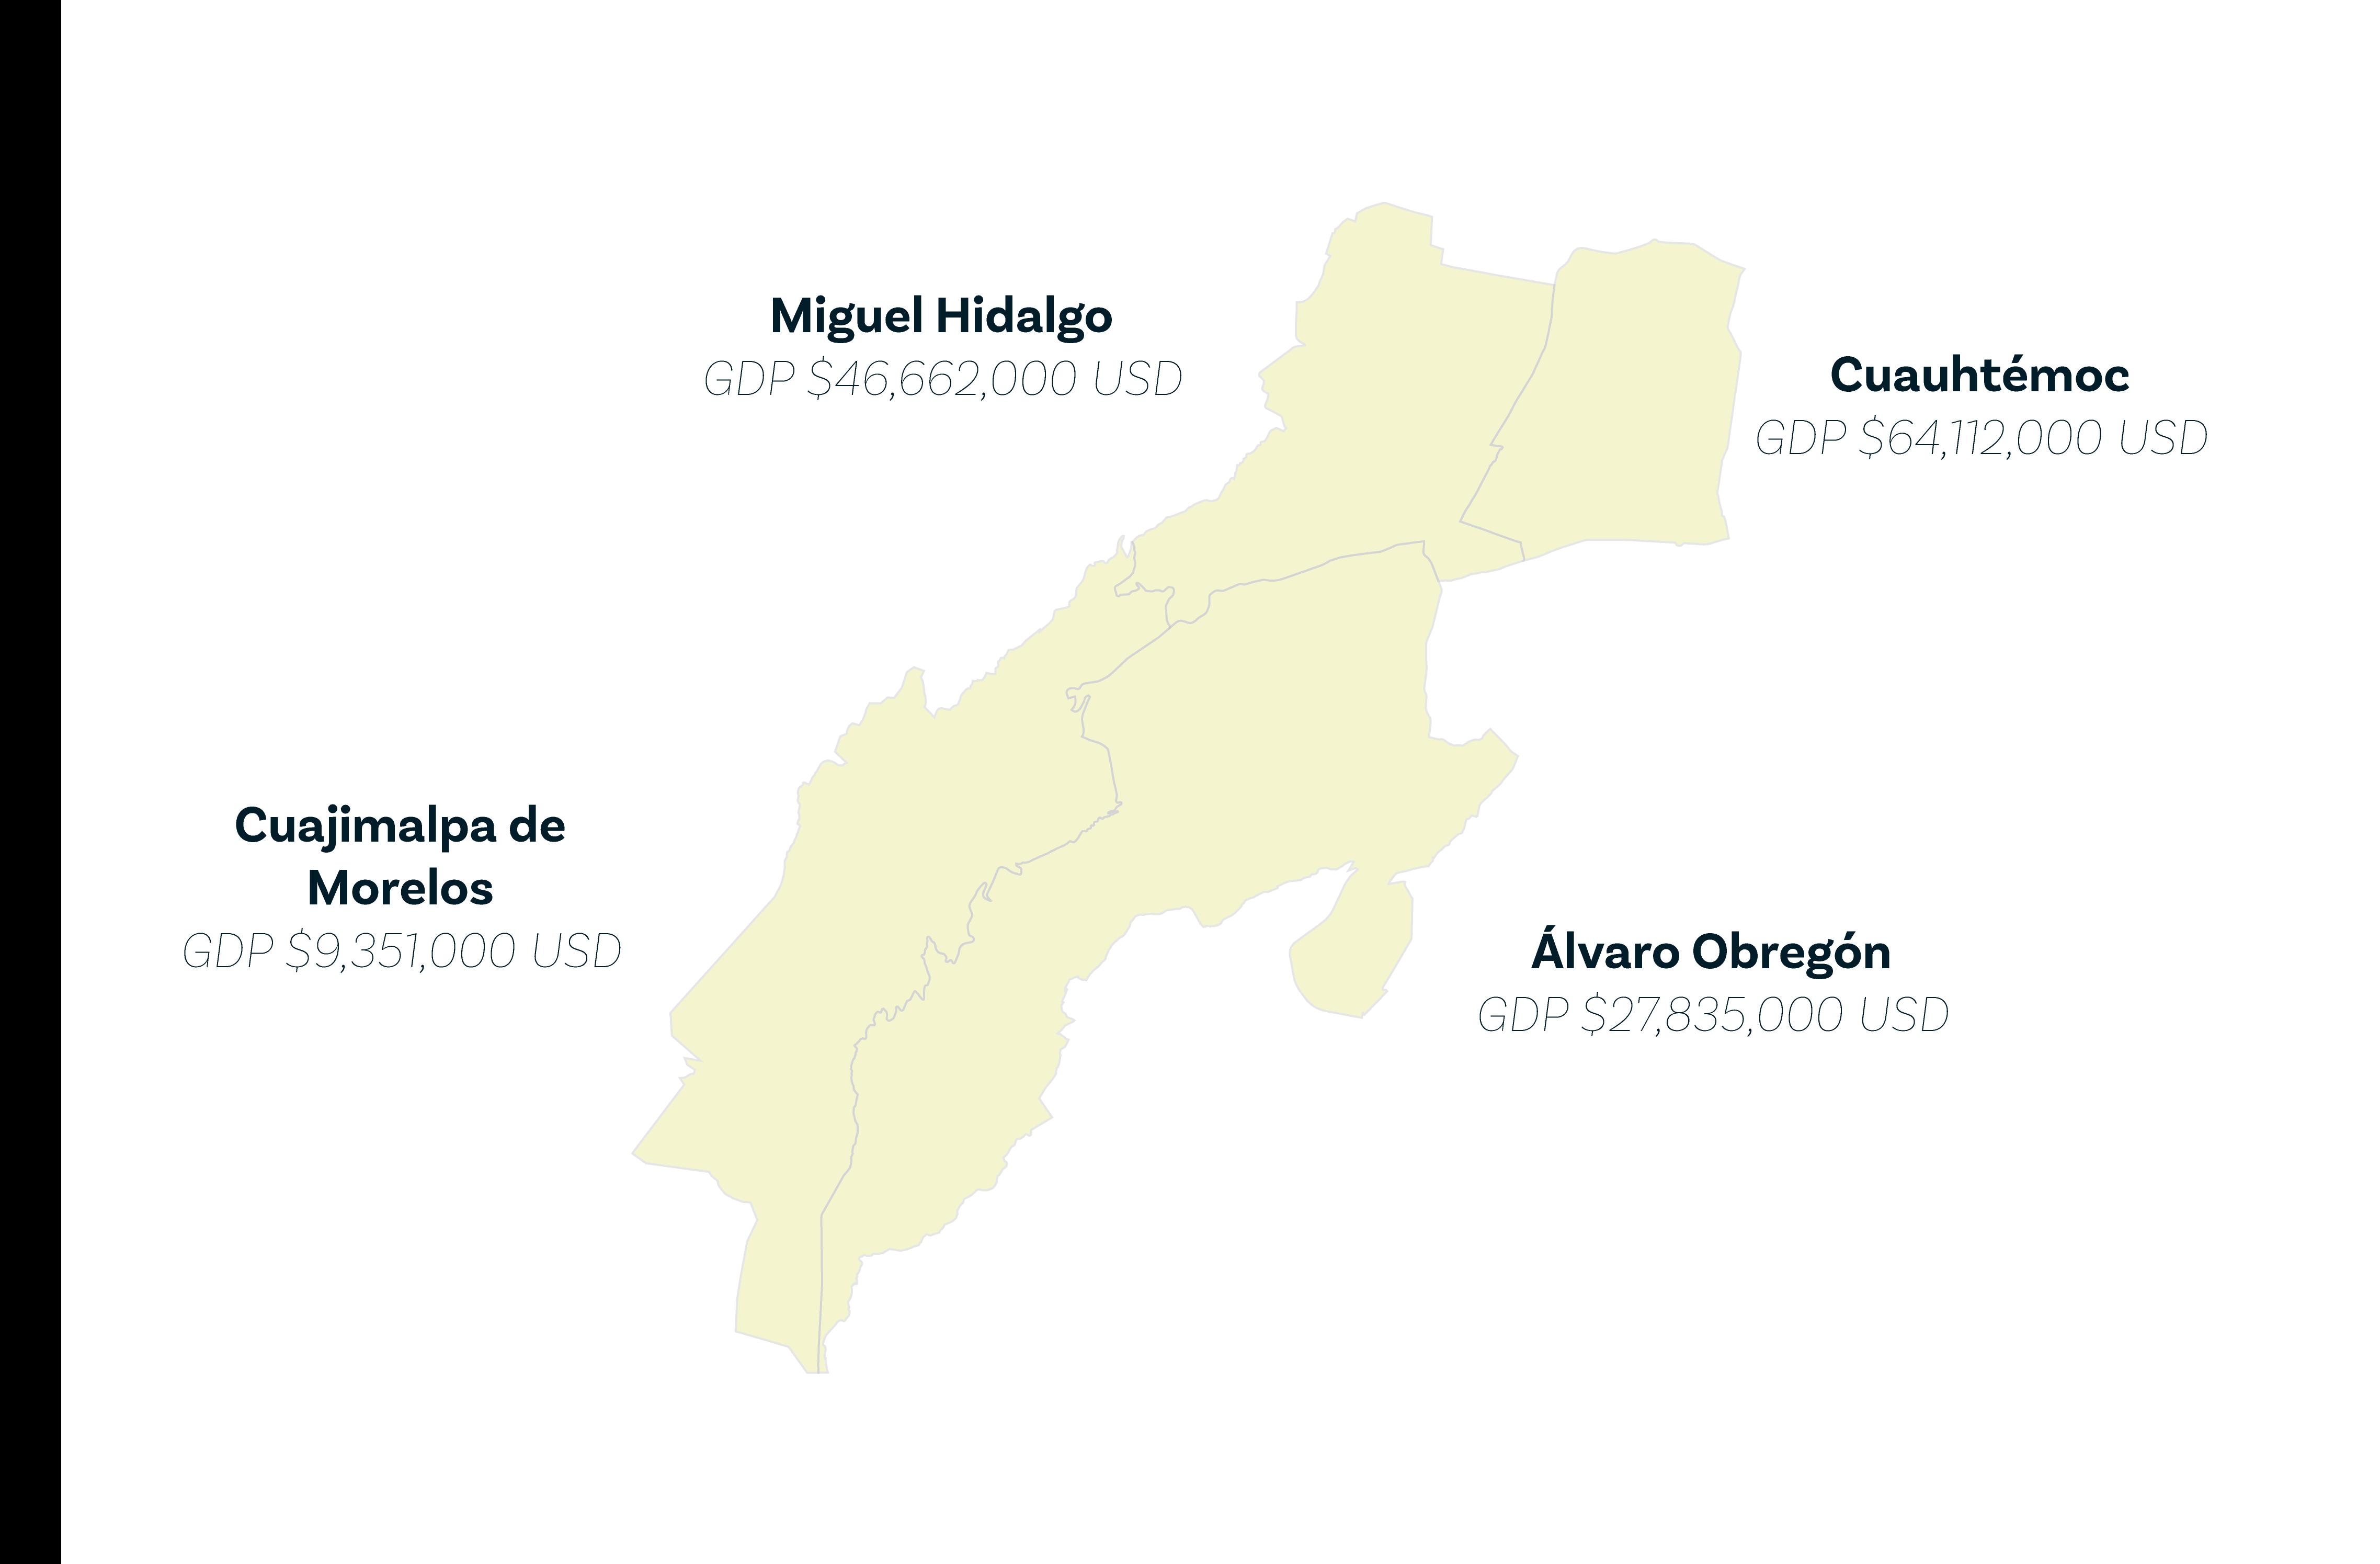
In Mexico City, there is a significant disparity in the availability of renewable energy. While less privileged areas primarily rely on fossil fuels for electricity, options for renewable energy are scarce. It’s concerning to note that only in the four municipalities with the highest GDP in the city can one purchase electricity from renewable sources (Gobierno de México, 2022).
This situation creates marked economic inequality in the electrical sourcing realm. Those in less privileged areas are limited to a source of costly and polluting energy, while residents of more prosperous municipalities have access to more sustainable and often more affordable options. This disparity not only impacts quality of life but also deepens income gaps and social inequity in the city.
En la Ciudad de México, existe una disparidad notable en cuanto a la disponibilidad de energía renovable. Mientras que en las zonas menos privilegiadas, la electricidad proviene principalmente de combustibles fósiles, las opciones de energía renovable son escasas. Es preocupante observar que únicamente en los cuatro municipios con el PIB más alto de la ciudad es donde se puede adquirir electricidad de fuentes renovables (Gobierno de México).
Esta situación genera una marcada desigualdad económica en el suministro eléctrico. Aquellos en áreas menos privilegiadas se ven limitados a una fuente de energía contaminante y costosa, mientras que los residentes de los municipios más prósperos tienen acceso a opciones más sostenibles y, en muchos casos, más asequibles. Esta disparidad no solo afecta la calidad de vida, sino que también profundiza las brechas de ingresos y la inequidad social en la ciudad.
132

133
ENERGY CONSUMPTION
We have become more dependent on energy as the years have gone by. To the point of considering energy as a basic need, since it is involved in most of our day-to-day life as a society. This growth in energy demand is related to different factors such as economic growth, population increase and also climate change, which with the drastic changes in temperatures forces us to acquire thermal energy.
The main problem with this is that the main energies we use, such as electricity, gasoline and gas, are obtained from polluting methods such as the burning of fossil fuels. In Mexico alone, 70% of electricity is obtained by this method.
In these next four maps we will be analyzing the electricity consumption and CO2 production in these 6 municipalities of the capital, which were chosen to check the relationship of the increase in energy consumption with the population number. The maps are also ordered from least to highest production, with yellow producing the least and red producing the most.
Cada vez nos volvemos más dependientes de la energía, puesto que la hemos involucrado hasta en nuestras actividades del día a día, hasta el grado de considerar una necesidad básica como sociedad. El principal problema de esto es que las principales energías que utilizamos diariamente, como es la electricidad, la gasolina y el gas, estan producidas por la quema de combustibles fósiles lo cual es un método muy contaminante y en México el 70% de la electricidad es proveniente de este método. En los siguientes cuatro mapas estaremos analizando el consumo de la electricidad y producción de Co2 en estas 6 prinicipales alcaldías de la capital, se escogieron estas principalmente para comprobar la relación del consumo de energía con el incremento poblacional. Los mapas están ordenados del área que menos produce Co2 a la que más produce, siendo el amarillo el que menos produce y el rojo el que más produce.

Iztapalapa Population 1,829, 576
Gustavo A. Madero Population 1,168,027
Tlalpan Population
686,234
Azcapotzalco Population
412,979
Iztacalco Population
398,584
Milpa Alta Population
126,881
134


A plane going from New York to Madrid and back produces 1,350 T of CO2.
135
IN
2017
ELECTRICITY CONSUMPTION
SERVICES
INDUSTRY 2017

A plane going from New York to Madrid and back produces 1,350 T of CO2.
136
ELECTRICITY CONSUMPTION IN LARGE-SCALE

A plane going from New York to Madrid and back produces 1,350 T of CO2.
137
IN RESIDENTIAL 2017
ELECTRICITY CONSUPTION

A plane going from New York to Madrid and back produces 1,350 T of CO2.
138
ELECTRICITY CONSUPTION IN AVERAGE INDUSTRY
ELECTRICITY CONSUPTION CONCLUSION
A finding when making these maps is that Iztapalapa is the one that consumes the most electricity in the four sectors, this can be seen related to the level of population that it has and the production of goods that it carries out since its main sales are in the sector of technology production. In addition to this, Iztapalapa has the largest supply center, in which the solar city project is currently being carried out to reduce the 1,526 tons it produces per year.
In the case of Azcapotzalco, we can note that there is a relationship between its population level and its consumption position in the residential and service sectors, with residential production producing the most CO2 between these two. But in the case of industry, there is a greater predominance in the medium-sized industry sector, which is the most dominant sector in all categories, in which Azcapotzalco produces almost the same as Iztapalapa when it beats it in population and territory.
But in the case of industry, there is a greater predominance in the medium-sized industry sector, this being the most dominant sector in all categories, in which Azcapotzalco produces almost the same as Iztapalapa when it beats it in population and territory. This may be due to its main production focus, which is electrical wires and cables made of copper, which is a most polluting area in the world and one of the most harmful to health.
Un hallazgo al realizar estos mapas es que Iztapalapa es el que más energía eléctrica consume en los cuatro sectores, esto se puede ver relacionado con el nivel de población que tiene y la producción de bienes que lleva a cabo ya que sus principales ventas son en el sector de producción de tecnología. Añadiendo a esto, Iztapalapa cuenta con la central de abastos más grande, en el que actualmente se lleva a cabo el proyecto de ciudad solar para reducir las 1,526 toneladas que produce al año.
En el caso de Azcapotzalco, podemos notar que existe una relación entre su nivel poblacional y su posición de consumo en los sectores residencial y de servicios, siendo la producción residencial la que más CO2 produce entre estos dos. Pero en el caso de la industria, hay un mayor predominio en el sector de la mediana industria, que es el sector más dominante en todas las categorías, en el que Azcapotzalco produce casi lo mismo que Iztapalapa cuando este le supera en población y territorio. Esto puede deberse a su principal foco de producción, que son los alambres y cables eléctricos de cobre, que es una de las zonas más contaminantes del mundo y una de las más dañinas para la salud.
Gobierno de México, (S.f). Productos 2022. Imagen. https://www.economia. gob.mx/datamexico/es/profile/geo/azcapotzalco?redirect=true#economy

139
FUEL EXPENDITURE
Consumo de combustibles
The following graph will analyze the production of CO2 in the six municipalities selected in the area of motorized means of transport, as well as their preference between traditional gasoline and diesel, also using the comparison of how many flights from NY to Madrid are equivalent. In the following graph we can see that the largest municipality with the highest consumption continues to be Iztapalapa and consumes 3 times more than Azcapotzalco. We can also note that in all of them there is a preference for traditional gasoline, but between the mayor’s offices of Iztapalapa and Azcapotzalco we can notice that Iztapalapa gives more opportunity to Diesel than Azcapotzalco, being between them a difference of 3,476 T of CO2 consumed or 2.6 flights from NY to Madrid.
En el siguiente gráfico se analizará la producción de Co2 en las seis alcaldías seleccionadas en el área de medios de transportes motorizados, como también su preferencia entre gasolina tradicional y Diesel, también se usa la comparación de cuantos vuelos de NY a Madrid equivalen. En el siguiente gráfico podemos ver que la mayor alcaldía con más consumo sigue siendo Iztapalapa y consume 3 veces más que Azcapotzalco. También podemos notar que en todas existe una preferencia por la gasolina tradicional, pero entre la alcaldía de Iztapalapa y la de Azcapotzalco podemos notar que Iztapalapa le da más oportunidad al Diesel que Azcapotzalco, siendo entre ellas una diferencia de 3,476 T de Co2 consumidas o 2.6 vuelos de NY a Madrid.

140
Road Transport Motor gasoline Diesel Simbology
GAS EXPENDITURE
Consumo de gas
In the case of gas consumption, we can see that there is a notorious relationship between consumption and the level of population that each municipality has, taking into account that each one consumes 0.02 T of CO2 per capita. Azcapotzalco is in the fourth with the highest consumption among all the municipalities.
En el caso del consumo de gas, podemos ver que hay una relación notoria entre el consumo y el nivel de población que tiene cada alcaldía teniendo en cuenta que cada una consume 0.02 T de Co2 per capita. Azcapotzalco esta en la cuarta con mayor consumo de entre todas las alcaldías.

Bibliography.
Plataforma Nacional de Energía, Ambiente y Sociedad. (s. f.). Plataforma Nacional de Energía, Ambiente y Sociedad. https://energia.conacyt.mx/planeas/electricidad/demanda Gobierno de México [Data México]. (s. f.). Azcapotzalco Municipio de Cuidad de México. Data México. https:// www.economia.gob.mx/datamexico/es/profile/geo/azcapotzalco?redirect=true Gobierno de México [Data México]. (s. f.-b). Iztapalapa Municipio de la Ciudad de México. Data México. https:// www.economia.gob.mx/datamexico/es/profile/geo/iztapalapa?timeNetTradeSelector=Year#economy https://dataportalforcities.org/
141
ENERGY POVERTY
IN MEXICO CITY
Pobreza energética en Ciudad de México
Energy poverty encompasses social, environmental and public health problems, affecting those who cannot meet their basic energy needs due to low income.
Over the past two decades, Mexico has significantly improved electricity system coverage, with 99% of the population having access to electricity in their homes. However, energy poverty persists, affecting millions of people in urban areas, including Mexico City. About 19.2% of households in the city lack access to hot water, 6% do not have a refrigerator and 3% do not have an electric or gas stove for cooking, according to the National Survey of Income and Expenditures of the Homes 2020.
La pobreza energética abarca problemas sociales, medioambientales y de salud pública, afectando a aquellos que no pueden satisfacer sus necesidades básicas de energía debido a bajos ingresos.
En las últimas dos décadas, México ha mejorado significativamente la cobertura del sistema eléctrico, con el 99% de la población teniendo acceso a la electricidad en sus hogares. Sin embargo, la pobreza energética persiste, afectando a millones de personas en áreas urbanas, incluida la Ciudad de México. Cerca del 19.2% de los hogares en la ciudad carecen de acceso a agua caliente, el 6% no posee un refrigerador y el 3% no cuenta con una estufa eléctrica o de gas para cocinar, según la Encuesta Nacional de Ingresos y Gastos de los Hogares 2020.


142

SIMBOLOGÍA

143
DE VIVIENDAS EN POBREZA 0 %-18% 18%-34% 34%-50% 50%-70% 70%-100%
PORCENTAJE
Sin Viviendas Habitadas Sin Información