


OFFICE BEARERS AND COUNCIL FOR THE 2023/2024 SESSION
Honorary President
Nolitha Fakude
President, Minerals Council South Africa
Honorary Vice Presidents
Gwede Mantashe
Minister of Mineral Resources and Energy, South Africa
Ebrahim Patel
Minister of Trade, Industry and Competition, South Africa
Blade Nzimande
Minister of Higher Education, Science and Technology, South Africa
President
W.C. Joughin
President Elect
E. Matinde
Senior Vice President
G.R. Lane
Junior Vice President
T.M. Mmola
Incoming Junior Vice President
M.H. Solomon
Immediate Past President
Z. Botha
Honorary Treasurer
E. Matinde
Ordinary Members on Council
W. Broodryk M.C. Munroe
Z. Fakhraei S. Naik
R.M.S. Falcon (by invitation) G. Njowa
B. Genc
S.J. Ntsoelengoe
K.M. Letsoalo S.M. Rupprecht
S.B. Madolo
A.T. van Zyl
F.T. Manyanga E.J. Walls
K. Mosebi
Co-opted Council Members
M.A. Mello
Past Presidents Serving on Council
N.A. Barcza C. Musingwini
R.D. Beck S. Ndlovu
J.R. Dixon J.L. Porter
V.G. Duke M.H. Rogers
I.J. Geldenhuys D.A.J. Ross-Watt
R.T. Jones G.L. Smith
A.S. Macfarlane W.H. van Niekerk
G.R. Lane – TP Mining Chairperson
Z. Botha – TP Metallurgy Chairperson
K.W. Banda – YPC Chairperson
S. Nyoni – YPC Vice Chairperson
Branch Chairpersons
Botswana Vacant
DRC Not active
Johannesburg N. Rampersad
Limpopo S. Zulu
Namibia Vacant
Northern Cape I. Tlhapi
North West I. Tshabalala
Pretoria Vacant
Western Cape A.B. Nesbitt
Zambia J.P.C. Mutambo (Interim Chairperson)
Zimbabwe Vacant
Zululand C.W. Mienie
*Deceased
* W. Bettel (1894–1895)
* A.F. Crosse (1895–1896)
* W.R. Feldtmann (1896–1897)
* C. Butters (1897–1898)
* J. Loevy (1898–1899)
* J.R. Williams (1899–1903)
* S.H. Pearce (1903–1904)
* W.A. Caldecott (1904–1905)
* W. Cullen (1905–1906)
* E.H. Johnson (1906–1907)
* J. Yates (1907–1908)
* R.G. Bevington (1908–1909)
* A. McA. Johnston (1909–1910)
* J. Moir (1910–1911)
* C.B. Saner (1911–1912)
* W.R. Dowling (1912–1913)
* A. Richardson (1913–1914)
* G.H. Stanley (1914–1915)
* J.E. Thomas (1915–1916)
* J.A. Wilkinson (1916–1917)
* G. Hildick-Smith (1917–1918)
* H.S. Meyer (1918–1919)
* J. Gray (1919–1920)
* J. Chilton (1920–1921)
* F. Wartenweiler (1921–1922)
* G.A. Watermeyer (1922–1923)
* F.W. Watson (1923–1924)
* C.J. Gray (1924–1925)
* H.A. White (1925–1926)
* H.R. Adam (1926–1927)
* Sir Robert Kotze (1927–1928)
* J.A. Woodburn (1928–1929)
* H. Pirow (1929–1930)
* J. Henderson (1930–1931)
* A. King (1931–1932)
* V. Nimmo-Dewar (1932–1933)
* P.N. Lategan (1933–1934)
* E.C. Ranson (1934–1935)
* R.A. Flugge-De-Smidt (1935–1936)
* T.K. Prentice (1936–1937)
* R.S.G. Stokes (1937–1938)
* P.E. Hall (1938–1939)
* E.H.A. Joseph (1939–1940)
* J.H. Dobson (1940–1941)
* Theo Meyer (1941–1942)
* John V. Muller (1942–1943)
* C. Biccard Jeppe (1943–1944)
* P.J. Louis Bok (1944–1945)
* J.T. McIntyre (1945–1946)
* M. Falcon (1946–1947)
* A. Clemens (1947–1948)
* F.G. Hill (1948–1949)
* O.A.E. Jackson (1949–1950)
* W.E. Gooday (1950–1951)
* C.J. Irving (1951–1952)
* D.D. Stitt (1952–1953)
* M.C.G. Meyer (1953–1954)
* L.A. Bushell (1954–1955)
* H. Britten (1955–1956)
* Wm. Bleloch (1956–1957)
* H. Simon (1957–1958)
* M. Barcza (1958–1959)
* R.J. Adamson (1959–1960)
* W.S. Findlay (1960–1961)
* D.G. Maxwell (1961–1962)
* J. de V. Lambrechts (1962–1963)
* J.F. Reid (1963–1964)
* D.M. Jamieson (1964–1965)
* H.E. Cross (1965–1966)
* D. Gordon Jones (1966–1967)
* P. Lambooy (1967–1968)
* R.C.J. Goode (1968–1969)
* J.K.E. Douglas (1969–1970)
* V.C. Robinson (1970–1971)
* D.D. Howat (1971–1972)
* J.P. Hugo (1972–1973)
* P.W.J. van Rensburg (1973–1974)
* R.P. Plewman (1974–1975)
* R.E. Robinson (1975–1976)
* M.D.G. Salamon (1976–1977)
* P.A. Von Wielligh (1977–1978)
* M.G. Atmore (1978–1979)
* D.A. Viljoen (1979–1980)
* P.R. Jochens (1980–1981)
* G.Y. Nisbet (1981–1982)
A.N. Brown (1982–1983)
* R.P. King (1983–1984)
J.D. Austin (1984–1985)
* H.E. James (1985–1986)
H. Wagner (1986–1987)
* B.C. Alberts (1987–1988)
* C.E. Fivaz (1988–1989)
* O.K.H. Steffen (1989–1990)
* H.G. Mosenthal (1990–1991)
R.D. Beck (1991–1992)
* J.P. Hoffman (1992–1993)
* H. Scott-Russell (1993–1994)
J.A. Cruise (1994–1995)
D.A.J. Ross-Watt (1995–1996)
N.A. Barcza (1996–1997)
* R.P. Mohring (1997–1998)
J.R. Dixon (1998–1999)
M.H. Rogers (1999–2000)
L.A. Cramer (2000–2001)
* A.A.B. Douglas (2001–2002)
S.J. Ramokgopa (2002-2003)
T.R. Stacey (2003–2004)
F.M.G. Egerton (2004–2005)
W.H. van Niekerk (2005–2006)
R.P.H. Willis (2006–2007)
R.G.B. Pickering (2007–2008)
A.M. Garbers-Craig (2008–2009)
J.C. Ngoma (2009–2010)
G.V.R. Landman (2010–2011)
J.N. van der Merwe (2011–2012)
G.L. Smith (2012–2013)
M. Dworzanowski (2013–2014)
J.L. Porter (2014–2015)
R.T. Jones (2015–2016)
C. Musingwini (2016–2017)
S. Ndlovu (2017–2018)
A.S. Macfarlane (2018–2019)
M.I. Mthenjane (2019–2020)
V.G. Duke (2020–2021)
I.J. Geldenhuys (2021–2022)
Z. Botha (2022-2023)
Editorial Board
S.O. Bada
R.D. Beck
P.den Hoed
I.M. Dikgwatlhe
B.Genc
R Hassanalizadeh
R.T. Jones
W.C. Joughin
A.J. Kinghorn
D.E.P. Klenam
J.Lake
H.M. Lodewijks
D.F. Malan
C.Musingwini
S.Ndlovu
P.N. Neingo
S.S. Nyoni
M.Phasha
P.Pistorius
P.Radcliffe
N.Rampersad
Q.G. Reynolds
I.Robinson
S.M. Rupprecht
K.C. Sole
T.R. Stacey
D.Vogt
F.Uahengo
International Advisory Board members
R.Dimitrakopolous
R.Mitra
A.J.S. Spearing
E.Topal
D.Tudor
Editor /Chairperson of the Editorial Board
R.M.S. Falcon
Typeset and Published by
The Southern African Institute of Mining and Metallurgy PostNet Suite #212 Private Bag X31 Saxonwold, 2132
E-mail: journal@saimm.co.za


JournalComment:Awindowintotheramificationsofjournalpublication byR.M.S.Falcon iv
President’sCorner:theSAIMMandESGS byW.C.Joughin
v-vi
Advertising Representative
Barbara Spence
Avenue Advertising
THE INSTITUTE, AS A BODY, IS NOT RESPONSIBLE FOR THE STATEMENTS AND OPINIONS ADVANCED IN ANY OF ITS PUBLICATIONS.
Copyright© 2024 by The Southern African Institute of Mining and Metallurgy. All rights reserved. Multiple copying of the contents of this publication or parts thereof without permission is in breach of copyright, but permission is hereby given for the copying of titles and abstracts of papers and names of authors. Permission to copy illustrations and short extracts from the text of individual contributions is usually given upon written application to the Institute, provided that the source (and where appropriate, the copyright) is acknowledged. Apart from any fair dealing for the purposes of review or criticism under The Copyright Act no. 98, 1978, Section 12, of the Republic of South Africa, a single copy of an article may be supplied by a library for the purposes of research or private study. No part of this publication may be reproduced, stored in a retrieval system, or transmitted in any form or by any means without the prior permission of the publishers. Multiple copying of the contents of the publication without permission is always illegal. U.S. Copyright Law applicable to users In the U.S.A. The appearance of the statement of copyright at the bottom of the first page of an article appearing in this journal indicates that the copyright holder consents to the making of copies of the article for personal or internal use. This consent is given on condition that the copier pays the stated fee for each copy of a paper beyond that permitted by Section 107 or 108 of the U.S. Copyright Law. The fee is to be paid through the Copyright Clearance Center, Inc., Operations Center, P.O. Box 765, Schenectady, New York 12301, U.S.A. This consent does not extend to other kinds of copying, such as copying for general distribution, for advertising or promotional purposes, for creating new collective works, or for resale.
Honorary Legal Advisers
M H Attorneys
Auditors
Genesis Chartered Accountants
Secretaries
The Southern African Institute of Mining and Metallurgy 7th Floor, Rosebank Towers, 19 Biermann Avenue, Rosebank, 2196
PostNet Suite #212, Private Bag X31, Saxonwold, 2132 E-mail: journal@saimm.co.za
Telephone (011) 463-7940 . E-mail: barbara@avenue.co.za
ISSN 2225-6253 (print) . ISSN 2411-9717 (online)

Printed by Camera Press, Johannesburg Directory


Treatment of chromium (VI) waste solutions with clay-based adsorbents after reduction with acid mine drainage by S. Mxinwa, M.T. Golela, and S.W. Robertson
A study was conducted to find a low-cost adsorbent that is capable of achieving sufficient Cr removal from waste solutions generated by scrubbing the furnace dusts in water. The test work focused on the evaluation of different clay minerals as adsorbents for Cr after prereduction with e.g. ascorbic acid. bentonite, attapulgite, and kaolinite clays. It was found that acid mine drainage (AMD) can potentially be used as a reducing agent in a Cr removal process if it is available on site.
A practical approach to determine the role of rockbolts in stoping gullies by J.P. Gouvea and T.R. Stacey
Underground mining requires the installation of support for the excavations to remain open and stable for their required lifespan. Research was carried out on a mine in the Vaal River region of South Africa (Witwatersrand Basin) to evaluate the effect that two particular aspects of rockbolt support have on the mine’s gully support system. These include the angle of inclination of the bolt relative to the rock surface and the protruding length of the bolt. A keyblock analysis approach indicated that these factors do not have an adverse impact on the stability of the strike gullies. This was confirmed by extensive empirical data collected from the case study mine.
Lean construction: Implementing the Last Planner System on mining projects by T. Govindasamy and M.C. Bekker .........................................................................
The the potential benefits of implementing the Last Planner system (LPS) on mining infrastructure projects in South Africa were explored. The first part of the research involved measuring the impact of LPS application. The second part sought to establish the lean construction success factors leading to improvement in construction performance. The results revealed a positive correlation between LPS application and planned percentage complete. However, the observed performance was not sustained. The study’s findings are expected to guide construction stakeholders to better define performance measures and focus on factors required to make LPS implementation more effective in the South African mining sector.
Mining corporate boardrooms still a male club? Experiences and challenges faced by South African women by N.V. Moraka
Although gender diversity and equal representation on -mining boards has improved, little is known about women directors’ experience in boardrooms. This research investigated the experiences of South African women on male-dominated mining boards. The findings show that irrespective of their qualifications and experience, women’s contributions are often ignored, and they are directed to more social roles. Regardless of race, all women experienced gender stereotyping. It is advocated that gender and identity should be studied in relation to post-colonial history in African countries, and that strategies be implemented to overcome barriers through appropriate diversity management programmes.
1
7
15
25
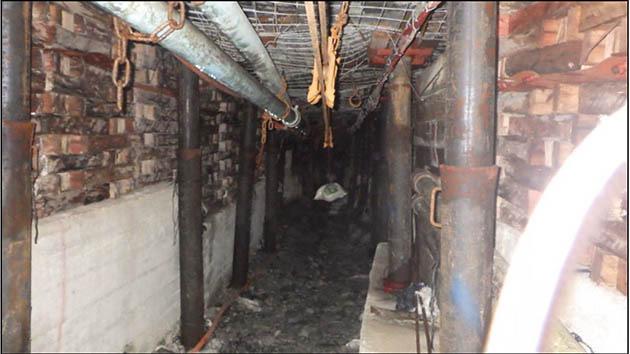
Zimbabwe’s coloured gemstone endowments – A regional geological overview by A. Mamuse, B.P. von der Heyden, and T. Blenkinsop 33
Zimbabwe hosts a varied array of gemstone deposits and occurrences, few of which have received detailed attention from the scientific or mineral exploration communities. This contribution seeks to summarize the status of knowledge of the gemstone deposits and occurrences in Zimbabwe. Synthesis of this regional geology approach reveals that there may be significant exploration potential for further gemstone occurrences, particularly in the extensive pegmatite fields and in Al-enriched orogenic belts. Further socio-economic and developmental initiatives will aid in optimizing the value generation from this important sub-sector.


A window into the ramifications of journal publication
he SAIMM Journal is an accredited international publication which enjoys respect and recognition worldwide. There are very few international journals focussed on mining and metallurgy, and therefore the SAIMM Journal makes a very important contribution in these fields.
Because there are relatively few ‘academic/research’ personnel in mining and metallurgy compared to the numbers in the diverse avenues of industry, the academic readership of such journals will be relatively small, hence there will be limited numbers of citations. The impact factor of our Journal is correspondingly lower than some specialist international journals published abroad. This may be a negative factor as far as research performance of academic individuals is concerned, as proof of performance is required for advancement in academia. However, this could be considered a false indication of true value of the information published because the application of ‘new knowledge’, when presented in such a journal, is often of inestimable value to those working in industry (‘in the trenches’). In this manner, new concepts, designs, operations, or developments will reach a wider and more appreciative audience and, as such, new information is more likely to see the light of day in growth and implementation in the mining or metallurgical workplace.
Material submitted to the SAIMM Journal for potential publication is assessed by reviewers drawn from a panel that includes both local and international experts. The review process is as stringent as in all other international journals. Material received is reviewed by at least two, but often three or four reviewers. Based on the reviewers’ comments, decisions on publication are taken by the SAIMM Publications Committee. Many submissions are rejected for various reasons, including inadequate English, technical inadequacies, lack of original material, inappropriateness, and so forth. Therefore, as is the case with other international journals, only approved material is published in this Journal. If authors of rejected material do not agree with the publishers’/reviewers’ opinion, they are free to submit their material to other journals or media – that is their choice.
The range of subjects published in the SAIMM Journal covers the full value chain in the mining and metallurgical fields. This ranges from the implications of geological factors on mining, through all branches of mining to current and advanced metallurgical processing and a wide range of associated fields. These include occupational health and safety, environmental aspects, forms of energy, and, more recently, ESG, computational modelling, and digitalization and AI in the workplace.
As is illustrated in this month’s Journal edition, one paper highlights the potential for gemstone mineral extraction in Zimbabwe while two cover mining aspects. One explores the potential benefits of the Last Planner system on infrastructure projects in the South African mining industry, while the other mining paper evaluates the role of rockbolts in stoping gullies as one of the important components of rock support in underground mines. The metallurgical paper deals with methods to remove Cr from waste solutions for one of the largest Cr-related industries in the world. and the final paper investigates the experiences of South African women on male-dominated mining company boards. The intention in future is to have special themes for specific Journal editions while continuing to run general editions with varying topics, as is the case in this instance.
R.M.S. Falcon


am sure many of you are aware that the SAIMM established the ESGS Committee a little over two years ago. The Committee deals with Environmental, Social and Governance (ESG) and Sustainability (S). ESG and Sustainability have become increasingly important for mining companies in recent years.
Climate change and rising global temperatures are affecting biodiversity and leading to droughts, floods, and wildfires around the world. The need to decarbonize is imperative, and has increased the demand for critical minerals required for decarbonization, as well as necessitated the responsible sourcing of these minerals with minimal ESG impacts.
Public perception of the mining industry is extremely unfavourable, to say the least. This is largely due to legacy issues associated with human rights abuses, damaging environmental incidents, and fatal accidents. While mining companies have progressed and improved over many years on all these fronts, more work is required to both meet the expectations of investors, lenders, governments, and the public in general – and, importantly, to update the perceptions of stakeholders. Responsible mining is not only ethically correct, but is now also essential to remain in business.
As far back as the 1990s, the concept of sustainability was institutionalized to address global challenges such as poverty, inequality, climate change, and environmental degradation. The United Nations (UN) has proposed 17 Sustainable Development Goals (SDGs) for 2030, which have been translated into laws and standards. ESG can be interpreted as how a company responds to sustainability imperatives, and provides evidence to its stakeholders about its commitments, targets, and performance. The term ESG has become popular in recent years and is incorporated into the six UN Principles of Responsible Investment (PRI). These principles include incorporating ESG into investment analysis and decisionmaking, ownership policies and practices, and transparent reporting of ESG issues.
The International Council on Mining and Metals (ICMM) has defined 10 principles for sustainable development. ESG is broad-reaching, constantly evolving, and as a result, there is no universally accepted definition. The explosion of new standards in recent years makes it challenging for all industries, and there is a need to rationalize and consolidate standards.
Building ESG into all aspects of the business requires innovative ways of thinking. Policies and practice must be holistic, minimizing environmental impact and improving the welfare of all stakeholders. This highlights the importance of the role of professionals in the mining industry in bringing their knowledge, skills, and experience to create new ideas and approaches to addressing ESG impacts and risks. Our goal should be to create a positive impact on the planet and ensure the wellbeing and success of future generations.
The SAIMM ESGS Committee’s mission is to ‘To build member capability, to influence professional behaviour and enable industry dialogue on Sustainability and responsible mining through Environmental, Social and Governance related matters’. The purpose is to create awareness, understanding, and competence in ESG and Sustainability issues. More information about the ESGS Committee is available on our website. In meeting its objectives, the Committee has presented webinars, a podcast, and a paper.
➤ Webinar: Launch of the SAIMM ESGS Committee. Mike Solomon, the Chairperson of the ESGS Committee, introduced the ESGS Committee and highlighted the requirement for and purpose of the Committee. https://www.youtube.com/watch?v=8BB5OAWLUzQ
➤ Webinar: Decarbonizing the Mining Sector by 2040. In this webinar, Mike Solomon provides some insights into decarbonization, and some of the programmes implemented by mining companies to decarbonize the sector by 2040. https://www.youtube.com/watch?v=quFs86HwfTs
➤ Webinar and Journal paper: Assessing coal mine closures and mining community profiles for the ‘just transition’ in South Africa. Megan Cole, Mzila Mthenjane, and Andrew van Zyl explain the expected coal mine closures and associated community vulnerabilities and local governance challenges in South Africa. These discussions highlight the realities in South Africa and the importance of ensuring an effective transition which maintains energy security while addressing the welfare of the affected communities. https://www.saimm.co.za/Journal/v123n6p329.pdf and https://www.youtube.com/watch?v=oyXoT3YCcFY
➤ Webinar: Mine Closure Risks and Opportunities for South Africa. Megan Cole, James Lake, and Nikisi Lesufi describe the new mine closure risk rating system and explore post-closure land use opportunities. https://www.youtube.com/watch?v=-1r8UdbtEtk
➤ Podcast on the Crucible: The extra S in ESG. In this podcast, Gordon Smith explains the link between sustainability and ESG, and the importance of including these principles in company strategies and developing creative solutions. He provides some insights into the ESGS Committee and elaborates on our objectives. The extra S in ESG. https://www.saimm.co.za/publications/podcasts
The SAIMM ESGS Committee is planning to host the first ESG conference ESG in the Minerals Industry - Challenges and Opportunities from 16-17 October 2024. The purpose and focus of this conference are to influence professional behaviour, and foster industry dialogue on sustainability and responsible mining through Environmental, Social, Governance, and Sustainability-related matters.
I invite our members to join the ESGS Committee or participate in ESGS events. Becoming involved in SAIMM initiatives enables you to continuously grow and learn and share your ideas. The SAIMM has also opened up membership to ESGS practitioners and experts and we encourage our members to actively recruit ESGS experts into the SAIMM. Together we can create a positive legacy for the mining industry.
W.C. Joughin President, SAIMM

Affiliation:
1Process Design Group, Biometallurgy Division, Mintek, Randburg, South Africa.
Correspondence to: S. Mxinwa
Email: sibabalwem@mintek.co.za
Dates:
Received: 25 Oct. 2022
Revised: 18 Jul. 2023
Accepted: 17 Oct. 2023
Published: January 2024
How to cite:
Mxinwa, S., Golela, M.T. and Robertson, S.W. 2024
Treatment of chromium (VI) waste solutions with clay-based adsorbents after reduction with acid mine drainage.
Journal of the Southern African Institute of Mining and Metallurgy, vol. 124, no. 1. pp. 1–6
DOI ID:
http://dx.doi.org/10.17159/24119717/2418/2024
by S. Mxinwa1, M.T. Golela1, and S.W. Robertson1
Synopsis
South Africa has one of the largest Cr-related industries in the world and generates large amounts of Cr-containing smelter dusts. It is normal practice to scrub Cr from the furnace off-gas in water, and to recover the Cr by adsorption, followed by recycling of the loaded adsorbent into the furnace. A study was conducted to find a low-cost adsorbent that is capable of removing sufficient Cr from the solutions generated by scrubbing. The test work focused on the evaluation of different clay minerals (attapulgite, bentonite, and kaolinite) as adsorbents for Cr. Cr(VI) could only be adsorbed after prereduction with e.g. ascorbic acid (ASA). An 80% removal of Cr(VI) could be achieved from a solution containing 20 mg/L Cr using bentonite clay after reduction with ASA. Attapulgite and kaolinite adsorbed less than 55% Cr after reduction with ASA. Both ASA and ferrous salts were found to be suitable reducing agents. The use of acid mine drainage (AMD) was also investigated as a low-cost alternative reducing agent, as AMD usually contains iron. The Cr(VI) reduction potential of the AMD was determined by redox titration against a solution containing 50 mg/L Cr(VI). Studies show that AMD can potentially be used as a reducing agent in a Cr removal process if it is available on site.
Keywords
acid mine drainage, adsorbent, chromium, clay minerals, reduction.
Introduction
South Africa possesses approximately 70-80% of the world's viable chromite (FeCr2O4) reserves (Coetzee, Bansal, and Chirwa, 2018). The country is the world's leading producer of ferrochrome (FeCr), which is an important contributor to the gross domestic product. FeCr is a relatively crude iron-chromium alloy, used predominantly in the production of stainless steel. Despite the economic importance of the ferrochrome industry, there are concerns relating to waste generation. According to data from 2015, the South African ferrochrome smelting industry generated over 3.59Mt of ferrochrome with smelter charges containing 4854% Cr (International Chromium Development Association, 2016). An enormous quantity of chromiumbased waste was demonstrated to contain Cr(VI) concentrations above the maximum acceptable risk authorized for dumping (up to 3.5–4.5% chromium as Cr2O3), both in liquid and solid form as chromium sludge (Georgaki and Charalambous, 2023). Certain Cr(VI) species are considered to be highly toxic, mutagenic, and carcinogenic. In particular, exposure to airborne Cr(VI) has been known to cause cancer of the respiratory system (Adhikari et al., 2022). An environmentally friendly, cost-effective treatment for chromium–bearing waste materials is required to reduce the environmental impact.
The main Cr reserves of South Africa are located in the Bushveld Complex, and are strongly associated with platinum group metal (PGM) ores. After PGM extraction, the fine by-product material is physically upgraded to > 40% Cr2O3 (> 27% Cr) before being used as smelter feed. The non-valuable material is exposed to oxidative conditions in waste dumps with large surface areas. Table I shows the amount of Cr(VI) contained in the smelter dusts from a local ferrochrome plant.
These values represent a high pollution potential and the capture and safe immobilization of chromium therefore deserves attention. It is normal practice to scrub chromium from furnace off-gas in water, and to recover the chromium by adsorption, followed by recycling of the loaded adsorbent into the furnace. This can also add value by improving overall process recoveries.
The dust generated by ferrochrome plants typically consists of coarse dust from the cyclones (which is lower in grade since the feed material is upgraded in the cyclone) and fine (normal) dust from the open, submerged arc furnace, which is captured by the baghouse filters (Sedumedi et al., 2009). The cyclone and furnace dusts are sent to the slimes dam. The dried clay from the slurry is the slimes dust (du Preez et al., 2023). These dusts are classified as hazardous wastes by the US Environmental Protection Agency,
Table I
Typical total Cr(VI) content (g/t) in ferrochrome smelter dusts from a local ferrochrome plant (Sedumedi et al., 2009)
Sample
as they contain hexavalent chromium, Cr(VI) (Sedumedi et al., 2009). The fine dust mostly consists of agglomerated particles that comprise oxide, metallic, and carbon-based phases, while the coarse dust mainly consists of oxide and carbon-based particles that are irregular in shape (Sedumedi, 2009).
Furthermore, Cr(VI) is formed in small quantities as an unintended by-product during production of FeCr (Coetzee, Bansal, and Chirwa, 2018; Beukes, Dawson, and van Zyl, 2012; Govender-Ragubeer, 2012). The remediation of Cr(VI) from mining activities is accomplished through landfilling in licensed and managed landfills, recycling, solidification, and stabilization. Prior to post-treatment activities, the pollutants in processed and leachate water are required to be reduced to environmentally safe levels. The commonly used effective reducing agents include ferrous sulphate, sulphur dioxide, or sodium disulphite, to reduce soluble and mobile Cr(VI) to Cr(III), which is deemed less toxic (Minas, Chandravanshi, and Leta, 2017). However, these chemicals are expensive and may contribute to water pollution.
Adsorbents that have been tested include zeolites, as well as clay minerals such as attapulgite, bentonite, and kaolinite. The benefits of using clay minerals such as attapulgite and kaolinite as adsorbents include their large specific surface area, cation exchange capacity, and the fact that they do not swell (Murray, 2000). Mankge and Govender-Ragubeer (2014) evaluated the treatment of Cr(VI) by fresh ferrous salts and ascorbic acid. The results revealed that it would be cheaper to reduce Cr(VI)-containing dust with ferrous salts than ascorbic acid. However, the addition of fresh ferrouscontaining salts poses environmental risks. Ascorbic acid (ASA) is more expensive, but is biodegradable and environmentally benign.
In an attempt to find a cheaper reductant with minimal environmental consequences, it was proposed to investigate acid mine drainage (AMD). AMD is particularly problematic in South Africa in gold and coal mining areas in the Witwatersrand Basin and Witbank Coalfield (Sakala et al., 2021; Minnaar, 2020). However, chrome mines and the majority of platinum mines do not generate acid-producing wastes.
The reduction of Cr(VI) by Fe(II) and AMD is described by Equations [1] to [3]. The standard redox potential for the overall reaction (Equation []) is 0.56 V against the standard hydrogen electrode (SHE) scale (Mankge and Govender-Ragubeer, 2014).
The aim of this study was to investigate the adsorption of Cr(VI) from oxidized solutions by clays.The pre-eduction of Cr(VI to Cr(III) with ASA and Fe(II) salt was also investigated. The use of AMD as a novel reductant was subsequently tested.
Experimental procedure
Clay adsorption of Cr(VI) from oxidized solutions
Potassium dichromate (K2CrO7) was used to produce the synthetic Cr(VI) solutions (20 or 100 mg/L). For comparison, Cr(III) solutions (20 or 100 mg/L) were also prepared using Cr (III) nitrate nonahydrate (Cr(NO3)3·9H2O). Experimental conditions are summarized in Table II. All tests were carried out at 25°C over a period of 24 hours in Erlenmeyer flasks at an adsorbent dosage of 94 g/L. Samples were periodically collected and analysed by ICP-OES (inductively coupled plasma-optical emission spectroscopy). Redox potential was measured using a Crison ELP 21 Eh meter against a Ag/AgCl reference electrode (3 M KCl). The pH was measured using a Metrohm 713 pH meter. The attapulgite ((Mg,Al)2Si4O10(OH)∙4H2O) used in this study was sourced from Matutu clay mine and two samples, A (-300 µm) and B (–1400+ 500 µm), were received from Incubex Minerals.
Table II
Experimental conditions: chromium adsorption with attapulgite from Cr(VI) and Cr(III) solutions
Attapulgite Chromium species
Tests
Table III
Test matrix for adsorption of reduced Cr(VI) to Cr(III) using attapulgite
1
2 0.03 20 X
3 0.03 20 X
4 0.03 20 X
5 0.03 20 X X
6
Clay adsorption of Cr(III) from reduced solutions (ASA and Fe(II) salts)
Previous studies (Mankge and Govender-Ragubeer, 2014; Govender-Ragubeer, 2013) indicated that ascorbic acid could reduce Cr(VI) to Cr(III) within 15 minutes, with > 99% reduction. In this study, Cr(VI) solutions were prereduced with ascorbic acid, followed by adsorption in shake flasks with attapulgite, kaolinite, and bentonite. The test matrix is summarized in Table III. Control tests were conducted by soaking kaolinite and bentonite in water, in order to allow for a possible increase in pore size prior to the start of the experiment. The tests were run over a 24-hour period, at an adsorbent dosage of 94 g/L. The powdered bentonite (Al2O3∙4SiO2∙H2O) and kaolinite (Al2O3∙2SiO2∙2H2O) were purchased from Sigma Aldrich South Africa.
Four tests were conducted in order to determine the effect of surface modification on the capability of bentonite to adsorb chromium. During the preparation of the surface-modified bentonite, 9.38 g of bentonite was added to 100 mL solutions containing either 0.5 M and 1 M Fe(II) or ascorbic acid solution.
Table IV
Test matrix for chromium adsorption using surface-modified bentonite
Synthetic Fe(II) was prepared from ferrous sulphate (FeSO4·7H2O). The mixtures were placed in a shaking incubator operated at 110 r/ min at room temperature (25°C) for 24 hours. After 24 hours the modified bentonite was dried in an oven (30°C) for 24 hours. The test matrix used in this study is summarized in Table IV.
Additional tests were carried out to investigate AMD as a novel and unconventional reducing agent. AMD was sourced from a gold mine water purification plant in Randfontein. The pH of the AMD solution was adjusted from 6.52 to 1.71 using sulphuric acid (H2SO4) to prevent iron precipitation. The pH of AMD close to mining sites is typically highly acidic (pH 2 to 4) (Yuan et al., 2022). The corresponding redox potential was 400 mV (vs. AgCl/AgCl, 3 M KCl). A sub-sample was submitted for analysis by ICP-OES for Al, As, Ca, Co, Cr, Cu, Fe, Mg, Mn, Mo, Ni, Pb, S, Si, and Zn, and for Fe(II) by potassium dichromate titration (Table V). The Fe concentration was 460 mg/L, similar to that reported by Moyo (2019) for a Witbank AMD sample. A 25 mL sub-sample was measured out and poured into a 200 mL beaker for redox titration. A 50 mg/L Cr(VI) solution was then added to the AMD sample. Both pH and redox potential were recorded at each Cr(VI) addition. This was continued until the redox potential plateaued. The point at which the redox potential plateaus is considered the end-point.
Clay adsorption of Cr(VI) from oxidized solutions
The results of the clay adsorption tests on the Cr(VI) and Cr(III) synthetic solutions are summarized in Figure 1. Attapulgite could not adsorb Cr(VI) at either 20 or 100 mg/L, hence these curves are not shown. Maximum adsorptions of > 99% were observed in the tests with Cr(III) at both 20 and 100 mg/L concentrations; however, desorption started occurring after 5 hours
Table V


A 50 mg/L Cr(VI) titrant was added to a 25 mL AMD sample in order to determine the amount of Cr(VI) that can be reduced to Cr(III) ion by the Fe(II) in the AMD.
Figures 4 to 6 show the chromium-ferrous ion titration curves at different pH levels. Plotted on the primary x-axis is the cumulative volume of titrant (50 mg/L Cr(VI)) added. The corresponding amount of Cr(VI) in moles calculated from the titrant volume added is plotted on the secondary y-axis. The redox potential of the solution mixture is plotted on the primary y-axis. The end-point is identified by the plateau of the redox curve. Hence the ratio of Cr(VI) added in moles to the moles of Fe(II) in the original AMD solution can be determined and is plotted on the secondary x-axis.

Clay adsorption of Cr(III) from solutions reduced using ASA and Fe(II)
The potential use of the clay minerals as adsorbents for reduced Cr(VI) was evaluated (Figure 2). Clay minerals usually possess high surface area (Murray, 2000) which is beneficial for the adsorption of heavy metals such as Cr from solution. In this study, the ability of attapulgite, kaolinite, and bentonite to adsorb Cr(VI) reduced with ASA was tested. The results are illustrated in Figure 2.
Although complete Cr removal was not obtained, bentonite was capable of adsorbing between 76-85% of the reduced Cr(VI). Soaking of kaolinite and bentonite in water prior to the tests did not result in a marked difference (< 5%) in the adsorption capability of the clay minerals.
Cr(VI) reduced to Cr(III) with ASA could be easily adsorbed by bentonite since bentonite has a strong cation exchange capacity and adsorption capacity. Similar results were observed by Zhao (2008) and Muhammad (2004), and bentonite has been shown to be the best adsorbent for metal ions (Tahir and Naseem, 2007; Kaya and Oren, 2005).
It was therefore decided to combine Cr(VI) adsorption with bentonite and reduction in the same process. Four tests were conducted in order to determine the effect of Fe(II) and ASA surface modification on the capability of bentonite to adsorb chromium. The results indicate that the use of ASA during surface modification was more effective than Fe(II) (Figure 3). It is speculated that the ASA was first adsorbed into the bentonite pore structure, where it reduced Cr(VI) to Cr(III).


Figure 6—Chromium-ferrous ion titration at 50 mg/L Cr(VI), pH 8
The redox potential was plotted against cumulative 50 mg/L Cr(VI) for pH values of 1.8, 4.5, and 8. The respective end-point reaction ratios (mol Fe(II) : mol Cr (VI)) are 3.45, 3.12, and 3.20. These are the inverse of the ratios shown on the secondary x-axis. The average reaction ratio is 3.26, which is close to the theoretically expected value of 3 as indicated by Equation [3].
Conclusions,
The results indicate that attapulgite, bentonite, and kaolinite could not adsorb Cr without prereduction of Cr(VI) to Cr(III). Bentonite adsorbed 80% Cr(III), whereas attapulgite and kaolinite achieved less than 55% adsorption after 24 hours. Surface modification of bentonite by 1 M ascorbic acid resulted in 62% Cr(VI) removal. It was not possible to achieve sufficient loading (of the same order of Cr content as chromite furnace feed) to be able to consider this process for Cr recycle to FeCr furnaces. Although promising results were obtained using bentonite for removal of reduced Cr(VI), the clay-based material presented handling challenges after the adsorption process, which will need to be addressed if the process were to be scaled up.
The local gold mine acid mine drainage contained 460 mg/L ferrous ion (470 mg/L total iron) and less than 2 mg/L chromium. The average equilibrium Fe(II) to Cr(VI) molar ratio required for Cr(VI) reduction was 3.26, which is close to the stoichiometric ratio of 3. It can be concluded that AMD is a potential reducing agent for the treatment of Cr(VI)-containing dust if it is available on site.
The authors wish to thank Mintek for research project funding and permission to publish this article.
References
Adhikari, S., Marcelo-Silva, J., Beukes, J.P., van Zyl, P.G., Coetsee, Y., Boneschans, R.B., and Siebert, S.J. 2022. Contamination of useful plant leaves with chromium and other potentially toxic elements and associated health risks in a polluted mining-smelting region of South Africa. Environmental Advances, vol. 9. https://doi.org/10.1016/j.envadv.2022.100301
Beukes, J.P., Dawson, N.F., and van Zyl, P.G. 2010. Theoretical and practical aspects of Cr (VI) in the South African ferrochrome industry. Journal of the Southern African Institute of Mining and Metallurgy, vol. 110, no. 12. pp. 743–750.
Chen, H. and Wang, A. 2007. Kinetic and isothermal studies of lead ion adsorption onto palygorskite clay. Journal of Colloid and Interface Science, vol. 307, no. 2. pp. 309–316.
Chmielewská, E. 2019. Natural zeolite: Alternative adsorbent in purification or post-treatment of waters. Modified Clay aZeolite Nanocomposite Materials:
Environmental and Pharmaceutical Applications. Eslsevier, Amsterdam. pp. 87–112.
Coetzee, J.J., Bansal, N., and Chirwa, E.M.N. 2018. Chromium in environment, its toxic effect from chromite-mining and ferrochrome industries, and its possible bioremediation. Exposure and Health, vol. 12. pp. 51–62.
Du Preez, S.P., van Kaam, T.P.M., Ringdalen, E., Tangstad, M., Morita, K., Bessarabov, D.G., van Zyl, P.G., and Beukes, J.P. 2023. An overview of currently applied ferrochrome production processes and their waste management practices. Minerals, vol. 13, no. 6. p. 809. https://doi.org/10.3390/ min13060809
Georgaki, M.N. and Charalambous, M. 2023. Toxic chromium in water and the effects on the human body: a systematic review. Journal of Water and Health, vol. 21, no. 2. pp. 205–223.
Govender-Ragubeer, Y. 2013. Biological and chemical reductions of Cr(VI). Mintek, Randburg, South Africa.
Haney, E.B., Haney, L.R., Hossner, L.R., and White, G.N. 2006. Neutralization potential determination of siderite (FeCO3) using selected oxidants. Journal of Environmental Quality, vol. 35. pp. 871–879.
Kaya, A. and Oren, A.H. 2005. Adsorption of zinc from aqueous solutions to bentonite. Journal of Hazardous Material, vol. 125. pp. 183–189.
Mankge, E. and Govender-Ragubeer, Y. 2014. Cr(VI) reduction using ascorbic acid. Mintek, Randburg, South Africa.
Minas, F., Chandravanshi, B.S., and Leta, S. 2017. Chemical precipitation method for chromium removal and its recovery from tannery wastewater in Ethiopia. Chemistry International, vol. 3. pp. 291–305.
Minnaar, A. 2020. Water pollution and contamination from gold mines: acid mine drainage in Gauteng Province, South Africa. Water, Governance, and Crime Issues. Springer, Cham, Switzerland. pp. 193–219.
Moyo, A., Amaral Filho, J.R.D., Harrison, S.T.L., and Broadhurst, J.L. 2019. Implications of sulphur speciation on the assessment of acid rock drainage generating potential: A study of South African coal processing wastes. Minerals, vol. 9, no. 12. p. 776.
Muhammad, N. 2004. Hydraulic, diffusion, and retention characteristics of inorganic chemicals in bentonite. PhD thesis, University of South Florida.
Murray, H.H. 2000. Traditional and new applications for kaolin, smectite, and palygorskite: a general overview. Applied Clay Science, vol. 17. pp. 207–221.
Sakala, E., Fourie, F., Gomo, M., and Madzivire, G. 2021. Natural attenuation of acid mine drainage by various rocks in the Witbank, Ermelo and Highveld Coalfields, South Africa. Natural Resources Research, vol. 30. pp. 557–570.
Sedumedi, H.N. 2009. Chromium contamination in the vicinity of Xstrata ferrochrome plant. M. Tech thesis, Department of Chemistry, Tshwane University of Technology, South Africa.
Sedumedi, H.N., Mandiwana, K.L., Ngobeni, P., and Panichev, N. 2009. Speciation of Cr(VI) in environmental samples in the vicinity of the ferrochrome smelter. Journal of Hazardous Materials, vol. 172, no. 2-3. pp. 1686–1689.
Tahir, S.S. and Naseem R. 2007. Removal of Cr(III) from tannery wastewater by adsorption onto bentonite clay. Separation and Purification Technology, vol. 53. pp. 312–321.
Weber, P.A., Thomas, J.E., Skinner, W.M., and Smart, R.S.C. 2004. Improved acid neutralisation capacity assessment of iron carbonates by titration and theoretical calculation. Applied Geochemistry, vol. 19, no. 5. 687–694.
Weber, P.A., Thomas, J.E., Skinner, W.M., and Smart, R.S.C. 2005. A methodology to determine the acid-neutralization capacity of rock samples. Canadian Mineralogist, vol. 43, no. 4. pp. 1183–1192.
Yuan, J., Ding, Z., Bi, Yunxiao, Ji, J., Wen, S., and Shaojun, B. 2022. Resource utilization of acid mine drainage (AMD): A review. Water, vol. 14, no. 15. https://doi.org/10.3390/w14152385
Zhao, D.L., Feng S.J., Chen, S.H., Xu, D., and Wang X.K. 2008. Adsorption of thorium(IV) on MX-80 bentonite: Effect of pH, ionic strength and temperature. Applied Clay Science, vol. 41. pp, 17–23. u

Department: Faculty of Engineering and the Built Environment – School of Mining Engineering
Position: Senior Lecturer in Mining Engineering (Mine Surveying/Engineering Surveying)
Description:
The School of Mining Engineering at the University of the Witwatersrand, Johannesburg, is regarded as Africa’s largest mining engineering school and currently ranks among the top mining engineering schools worldwide on the QS World University Rankings by subject area. It has a capacity for about 550 undergraduate and 200 postgraduate students, with 23 Academic and 12 Technical and Administrative staff positions. The school has a good research record and support system for the personal development of academic staff.
The school is seeking a suitably qualified and experienced mining engineer/civil engineer/quantity surveyor for a Senior Lecturer position in Mining Engineering who can teach Mine Surveying and/or Engineering Surveying.
Requirements:
Senior Lecturer:
Applicants must possess a Doctorate degree in Engineering or the Built Environment. Evidence of postgraduate supervision and/or co-supervision to successful completion is also required. Advantages include: Registration as a professional with a relevant statutory body in Engineering or the Built Environment; Teaching experience at university level; Research experience as evidenced by an NRF rating, peer-reviewed publications, local and/or international collaborations; Evidence of any academic citizenship and service such as internal/external examiner of postgraduate Masters/Doctoral research, awards by scientific societies/organisations/associations, membership of editorial boards of recognised journals, membership of voluntary scientific societies/organisations/associations, contributions to the profession or any type of community engagement.
Duties:
Duties will include undergraduate lecturing in Mine Surveying and/or Engineering Surveying and postgraduate courses; undertaking personal research; supervision and/or co-supervision of postgraduate research students; participation in administrative activities of the school.
Enquiries only:
Professor Cuthbert Musingwini, Head of the School of Mining Engineering, E-mail: Cuthbert.Musingwini@wits.ac.za
To apply:
All applications must be submitted via the University’s online application system. External applicants should apply on https://irec.wits.ac.za. The application must include (i) a covering letter, (ii) the applicant’s curriculum vitae (CV) with names, addresses (including email addresses) of at least three referees, and (iii) copies of qualifications and identity documents.
Note: Applications that are incomplete or do not meet job requirements will not be considered.
Closing date for applications: 29th February 2024.
The University is committed to employment equity and preference may be given to appointable applicants from underrepresented designated groups in terms of the relevant employment equity plans and policies of the University. The University reserves the right to verify all information provided by candidates. The university can continue searching after the closing date until the position is filled. Correspondence will only be entered into with shortlisted candidates. Shortlisted applicants must be available for an interview on a date decided by the School. The University also reserves the right not to make an appointment nor to re-advertise.
Affiliation:
1Northam Platinum Holdings, South Africa.
2University of the Witwatersrand, South Africa.
Correspondence to:
J.P. Gouvea
Email: gunjaba@gmail.com
Dates:
Received: 25 Nov. 2019
Revised: 10 May 2022
Accepted: 17 Oct. 2023
Published: January 2024
How to cite:
Gouvea, J.P. and Stacey, T.R. 2024
A practical approach to determine the role of rockbolts in stoping gullies.
Journal of the Southern African Institute of Mining and Metallurgy, vol. 124, no. 1. pp. 7–14
DOI ID:
http://dx.doi.org/10.17159/24119717/1030/2024
ORCID:
J.P. Gouvea
http://orcid.org/0000-0003-2970-6691
by J.P. Gouvea1 and T.R. Stacey2
Synopsis
A research project was carried out on a gold mine in the Vaal River region of South Africa (Witwatersrand Basin) to evaluate the effect of two particular aspects of rockbolt installation – the angle of inclination of the bolt relative to the orientation of the rock surface, and the protruding length of the bolt – on the mine’s gully support system. A keyblock analysis approach indicated that these factors do not have an adverse impact on the stability of the strike gullies. This was confirmed by extensive empirical data collected from the case study mine. While safety is the primary concern, cost saving opportunities can be realized through reconsidering historically inherited support standards that are perceived to be correct and appropriate. The research described in this paper sets forth a practical approach, that is easy to implement and repeatable, to evaluate the role of rockbolts in stoping gullies.
Keywords stope gully, rockbolts, support design, protrusion, flat angle, key block.
South Africa has been one of the world’s primary gold producers since the late 19th century, and mines have had to develop to greater depths than ever before. Excavations of different sizes and shapes created in underground mining require the installation of support in order to remain open and stable for their required lifespan. Rockbolts represent one of the components of rock support and are widely applied throughout the mining and civil engineering sectors. Historically, rockbolt support in South African mines was required to be installed at an angle between 70° to 90° to the excavation periphery or strata. In addition, mine standards have generally specified that rockbolts protruding by more than 30 cm should be replaced. These historical standards were quite logical, since they originated from early end-anchored rockbolts that had only 30 cm of thread for tensioning or re-tensioning. If such a bolt protruded by more than 30 cm, it was impossible to re-tension it and thus replacement was required. Furthermore, if the bolts were installed at an angle of less than 70° to the rock surface, the thickness of the supported rock arch would be less than the designed thickness, which could allow rockfalls to occur.
Since then, more sophisticated rockbolt designs and gully support systems have been developed, However, many mining operations have continued to ‘accept’ and religiously enforce historically inherited standards related to rockbolting. The reconsideration of these standards is the subject of the research described in this paper.
Since this paper involves the consideration of current support procedures, it is appropriate to review the industry’s performance in combatting rockfalls and rockbursts.
Falls of ground have accounted for most of the fatalities and injuries in the South African mining industry. On average, a third of the fatalities reported each year have been due to uncontrolled falls of ground. Most of these fatalities were recorded in the gold and platinum mining sectors, which typically employ labour-intensive, conventional methods in hard-rock, narrow tabular excavations. These statistics are not necessarily directly comparable with other commodity sectors since physical and geotechnical conditions differ significantly both locally and internationally.
The health and safety of mineworkers remain the highest priority for all stakeholders across the mining industry.

The fundamental support functions of rockbolts have remained consistent throughout the years (refer to Figure 1):
➤ Reinforce the rock mass
➤ Contain fractured rock
➤ Retain the deformation compatible surface support
➤ Facilitate connection between rockbolts and surface support with non-failing connection elements (nuts, plates, strapping, rope lacing etc.).
Surface and reinforcement support elements are typically combined to interact with each other to create an integrated support system. Each support element interacts differently with the rock mass and therefore performs a different function within a system. Li et al., (2016) reported that the overall performance of a support system is lower than the sum of individual support elements. This emphasizes that each support element reacts differently to the behaviour of a rock mass and does not provide the same support characteristics at different stages throughout this process. Consequently, the role of rockbolts within a support system must be carefully considered in relation to the conditions in which the bolts are installed.
Understanding the fundamentals of a rockbolt support unit, its interaction with the rock mass, and its role relative to other support units in a support system, is imperative in determining the effects that installation angle and length of protrusion may have on support performance. Rockbolts subjected to different loading conditions do not behave similarly, making the selection of a bolt type important.
A challenge experienced in the industry is that the choice of rockbolts is often dictated not by their supporting capability, but by their ability not to interfere with other mining activities, and by their compatibility with other mining engineering operations.
Underground excavations may expose joints, bedding planes, other geological discontinuities, and blasting-induced fractures, that play a significant role in the stability of excavations (Li, 2017). Displacements can take place along these discontinuities, resulting in instability if support is inadequate. The influence of discontinuities is exacerbated at shallow mining depths where clamping forces are typically limited.
The basic requirement of a rockbolt installed in low stress conditions is that its capacity should exceed the load applied on it by the surrounding rock mass (Li, 2017). The loads are typically determined by the height of potential rock mass instability
(‘deadweight’ or tensile dome). Rockbolts develop tensile and shear support resistance as the rock mass surrounding an excavation deforms. In low stress environments, closure rates in excavations are generally slow, and yielding support capabilities are not required.
However, the rockbolts are usually pre-stressed to offer a high initial load and provide active support to the rock mass.
Combinations of loading imposed on a rockbolt (not necessarily only under the influence of gravity) have a significant impact on the overall performance of the bolt. Rockbolts usually experience a combination of tensile and shear loading. Double shear laboratory tests conducted by Ayres and Gardner (2014) to quantify the effect of different installation angles on the performance of rockbolts indicated that failure loads were higher as the shear component decreased relative to the tensile component. Similarly, Li et al., (2016) reported that the variation in rockbolt installation angle relative to discontinuities affects both the peak support load and the rigidity of the support (Figure 2). They found that a higher initial stiffness is achieved by installing a rockbolt perpendicular to a weakness plane rather than at an acute angle. However, in contrast, a higher peak shear load is achieved by installing rockbolts at an acute angle to discontinuity planes owing to the tensile component.
Rock failure is unavoidable in high stress conditions (Bhatt, Meena, and Badhwar, 2018). Therefore, dynamically capable ground support, such as yielding rockbolts, should be installed to maximize the absorption of strain energy released during a seismic event, and restrict the displacement of rock around excavations.
Owing to the depth and absence of weathering, discontinuity planes tend to be less frequent at increased depths, and spacings between weakness planes tend to be greater. Consequently, a higher quality rock mass is often exposed in deeper mining operations owing to the reduced number of open, unclamped discontinuity planes. However, large-scale deformations associated with elevated stress levels can pose a significant risk to the stability of excavations. Rock squeezing (in soft rock) and rockbursting (in hard rock) are two typical loading mechanisms found in deeper mining operations in high stress conditions.
Large deformations (squeezing) can be anticipated in weak and soft rock subjected to high stress conditions. Rock squeezing is influenced by geological structure as well as rock type. The surrounding rock mass is typically weak, frequently jointed, and fractured where squeezing takes place. A critical strain is defined on the periphery of an excavation at which squeezing takes place (Bhatt, Meena, and Badhwar, 2018). The information is utilized to locate tunnels in favourable conditions in order to avoid squeezing


(if possible) and/or to inform a designer where to implement energy-absorbing support. Typically, rockbolts in a high stress environment prone to squeezing are utilized to limit rock mass deformations (high support resistance), while also having the ability to be more ductile to cater for large deformations. The support can entail one rockbolt type satisfying both functions, or different types within a support system being utilized to achieve the goal.
In deep-level, hard rock environments, seismic events can pose considerable risks to mining operations (Figure 3). The selection of suitable rockbolt support units in burst-prone conditions is reliant on the appropriate identification of likely rockburst damage mechanisms (Ortlepp and Stacey, 1994). Each mechanism influences a support system differently and as such, should be considered separately (combination loading is also possible). Owing to the difficulty of predicting the location and magnitude of seismic events and the direction of loading, the demand on support is unknown. Furthermore, the capacities of support systems are also unknown, resulting in a situation of design indeterminacy.
A potential solution is to install a conservative amount of support that is then likely to prevent, or at least limit, rockburst damage (Stacey, 2011).
To evaluate the influence of protruding rockbolts and bolts installed at an acute angle, it was decided to examine a case study in detail.
The evaluation mainly considered stope gullies situated on the reef horizon, where rockbolts were being systematically installed. The following assessments were conducted:
➤ An analytical approach to support design based on the 95% cumulative fallout height of recorded falls of ground
➤ A probabilistic keyblock analysis based on geotechnical data mapped underground
➤ An analysis of the mine’s database on fall-of-ground accidents and incidents
➤ An observational approach based on actual underground observations.
The case study mine is situated in the Klerksdorp Goldfield of the Witwatersrand Basin. The mine accesses the conglomerate reefs, the most important of which is the Vaal Reef (VR), through a twin shaft system with a maximum depth of 2 334 m below surface

(intermediate to deep). Shaft sinking was initiated in 1977 and completed by 1981, with production commencing in 1984. The main working levels are situated between 1 300 m and 2 064 m below surface, resulting in typical virgin stress levels ranging between 35 MPa and 55 MPa.
The narrow tabular orebody, 1 m thick on average, dips at some 21° towards the south. Owing to a combination of faulting and intrusions in the area, a conventional scattered mining method (Hamrin, 1980) is used. The operation is a marginal mine (low grade) with a large footprint as shown in Figure 4.
The main sources of seismic activity at the mine are:
➤ Geological features (faults and dykes), particularly at their intersections
➤ Remnants and/or isolated pillars, particularly when intersected or bounded by seismically active geological features.
True facebursts are rare and do not demonstrate a trend. In most cases, minimal or no damage has occurred to the workings following events of magnitude less than 2.0. Events larger than this, and any unusual seismic occurrences, are investigated individually to determine their impact in order to verify the site response. Figure 5 illustrates a 5-year history of seismic events of various magnitudes
Number of Events


that took place within the operation’s boundaries. Although the mine is seismically active, dynamic loading of rockbolts was not a major consideration in the case study.
Historically, timber packs were installed on both sides of stope gullies (Figure 6). These gullies are not used only for travelling purposes, but also to move broken rock from the panel face on a cyclical basis. In 2002, stope gullies were classified as the second highest risk excavations in the South African hard rock mining industry (Naidoo, Leach, and Spencer, 2002).
Soon after the SIMRAC report was published (Naidoo, Leach, and Spencer, 2002), the study site adopted the support recommendations in the report, which included the introduction of welded mesh and rockbolts along the gully hanging wall (Figure 7).
The introduction of welded mesh and rockbolt support at in-stope gullies was well intended, but it unfortunately had unexpected ramifications. Since the inherited principles pertaining to the installation angle and protrusion of rockbolts appeared in the mine support standards, these aspects became auditable by the Department of Mineral Resources. Frequent non-compliance with the standards resulted in mine-wide stoppages. To avoid further stoppages by mining regulators, elaborate mesh and rockbolt rehabilitation strategies were implemented, at unsustainable cost (Figure 8).
The rehabilitation costs, in the range of R7 000 to R12 000 per linear metre, were significant considering the strike length of the stope gullies. In spite of these efforts, the study site still experienced stoppages.

It is reiterated that this paper does not aim at justifying substandard practises. On the contrary, it challenges the origin and validity of historical mining standards with regard to stoping gully rockbolts. More importantly, by means of sound geotechnical assessments, the role and effectiveness of gully rockbolting is quantified and classified for the case study site.
The 95% cumulative fallout height of observed falls of ground on the mine is used to determine the support requirements (13.6 kN/m2 required as dictated by the mine Code of Practise). Pack support is a major factor when assessing the role that rockbolts play in gully stability. Packs are installed on gully shoulders, with rockbolts between them along the hangingwall of the gully. Support resistance calculations in the gully area, based only on the loads generated by the pack support, for various distances from the face, are shown in Table I (tributary area method). The mine standard requires that packs are installed a maximum of 3.2 m from the panel face and systematically on both sides of the gully shoulders towards the back area (note the change in pack support area).
As stope closure increases, the support resistance provided by gully packs progressively increases. Based on the mine’s 95% cumulative fallout height of observed falls of ground and the support resistance provided by the pre-stressed packs, a stable factor of safety was achieved. For example, at a distance of 5 m from the panel face, the support resistance generated by pack support on the gully shoulders is 63.3 kN/m2. This resulted in a factor of safety well above 1.6, which well satisfied the static loading requirements of the mine.

Geotechnical data and probabilistic keyblock analysis
A database detailing the presence, orientation, and condition of rock mass discontinuities was compiled to gain an understanding of the mining conditions and assess likely failure mechanisms. Geotechnical mapping of the hangingwall was conducted at 11 workplaces across the enire study site (scan line mapping), totalling 312 m in length. To characterize the rock mass and avoid bias, the exposed hangingwall was mapped in both dip and strike directions, as not all joints will be visible in only one excavation orientation. Core recovered from geological boreholes was also used to create a complete three-dimensional model of the surrounding rock mass. Mapping included measurement of the orientation, frequency, persistence, and contact surface condition of joints present in the host rock.
Stereonets were used to assess the orientations of discontinuity planes recorded during mapping (635 readings). This sample size was considered to be adequate to identify all discontinuity sets and to quantify the distributions of their orientations. The joint parameters were assessed on a continuous basis for quality control purposes. The quality control procedures included visual inspection of data, identification of anomalous data trends, comparison with underground observations, and assessment of the validity of the data.
Figure 9 depicts the selection of discontinuities for the quantification of joint sets.
Three joint sets, and a random joint set, can be observed from the stereonet projection. Joint set 1 was considered as two separate joint sets (J1 and J1i) due to the variability in dip direction. Most of the identified joint sets are steep dipping (J1, J1i, and J2), with one flat dipping joint set (J3 - bedding planes). Joint sets J1 and J2 are orthogonal and when interacting with the flat dipping joint set J3 can create key blocks. For each discontinuity mapped, the following parameters were recorded:
➤ Ends of joints (one, two, or no ends visible)
➤ Joint length or persistence
➤ Joint spacing.
When evaluating joint trace lengths underground, it is often not possible to determine the actual joint length if joints terminate beyond the excavation boundaries. While gathering the data, it was therefore important to note whether both ends of a joint were visible

(E2), only one end was visible (E1), or both ends terminated into the excavation boundaries (E0). The E0 type joints may participate in the formation of numerous key blocks due to the long trace lengths. Note that there is uncertainty in respect of the persistence of type E1 joints due to only one end of the trace being visible.
From a statistical analysis of joint persistence and applying engineering judgement, the descriptive statistical parameters for each joint set, namely maximum, minimum, and mean joint persistence, were calculated. J1appears to be the most prominent joint set; however, this conclusion may be slightly biased due to the orientation of the bedding planes relative to the scan lines. Set J3 is characterized by the longest trace lengths. Set J2 is marginally less persistent and less prominent than the others. Joint spacings were measured for each scan line, and a spacing adjustment applied to correct for the bias introduced by the scan line orientation. Based on the joint characteristics and orientations, only one ground control district (GCD) could be identified.
JBlock, a keyblock stability model (Esterhuizen, 2003), was utilized in the comparative assessment, rather than to provide absolute answers. JBlock is a probabilistic approach to keyblock analysis, providing qualitative or comparative analyses relating to falls of ground and support layouts (Esterhuizen and Streuders, 1998). JBlock has been shown to be useful in estimating the relative hazard of rockfalls in tabular mining layouts in South Africa (Joughin et al., 2012a; 2012b). The model geometry for the JBlock analyses was derived from the study site’s mine standards booklet as depicted in Figure 10.
The stope can be divided into zones of interest, since personnel exposure and the remediation strategies will differ in each of these zones. For the purposes of this study, the zones of interest were the gullies where rockbolts are being installed.
A total of 12 simulations had to be run to cater for the number of permutations created by the variability in influencing factors (rockbolt installation angle and rockbolt length) and different mining directions. Two different mining directions were evaluated (East – azimuth 70° and West – azimuth 250°) since, based on observations in other projects, the formation of key blocks was expected to be dependent on mining direction. The effects of rockbolt protrusion length (0.6–1.5 m) and installation angle (–90°), as well as the effect of not installing rockbolts (‘no rock bolts installed’) in gullies, were assessed.

Table II
JBlock simulations
The current mine support standard was compared with the scenarios in Table II.
In addition to the block filtering routine that is implemented while creating synthetic blocks, subsequent block filtering is applied prior to evaluating the influence of artificial support. The purpose of this stage of filtering is to simulate the effect of natural support mechanisms such as clamping stress in the hangingwall, which acts on key blocks that exceed a certain threshold aspect ratio and mid-height.
Figures 11 and 12 compare the current support standard (MD70_90deg and MD250_90deg) and the effectiveness of the

11—Comparison between simulations for an East mining direction

12—Comparison between simulations for a West mining direction

Figure 13—Schematic of fall of ground accident locations
support system in the cases of protruding rockbolts and bolts installed at an acute angle. In the graphs, the green bar (far left) represents the current support standard and the blue bars (the second and subsequent bars) represent the performance of the support system when protruding rockbolts and bolts installed at an acute angle are prevalent. For comparison purposes, the numbers of falls of ground have been normalized relative to the exposed face area in the model. A value of 10 000 m2 of exposed gully face area was used for normalizing.
A very low probability exists for failures in gullies. On average, 187 rockfalls were simulated per 10 000 m2 of exposed gully face area mined for the current mine support standards. The numbers of rockfalls increase to 223 per 10 000 m2 mined, on average, when no rockbolts are installed. The failures indicated by the keyblock analysis were at the gully face, prior to installation of the packs along the gully shoulders. Such failures were not observed underground, nor recorded in the mine’s fall of ground database: they may take place during blasting, and/or are controllably removed during barring activities. The conclusion from the keyblock modelling is that protruding rockbolts and bolts installed at an acute angle in gullies at the study site did not contribute significantly to the rockfall hazard in the stoping gullies.
All the mine’s accident and incident reports over a five-year period
were assessed. Falls of ground were responsible for 14% of accidents on the mine. This percentage was deemed significant considering the severity of such accidents. Figure 13 indicates the general locations of falls of ground in the period that was assessed.
The majority of fall of ground accidents occurred in the stoping environment, as expected. Fall of ground number 2, as depicted in Figure 13, is situated in a gully where rockbolts were being installed. However, the fall was not a result of protruding rockbolts or rock installed at an acute angle.
Underground observations of rockfalls
Underground inspections were carried out at 24 workplace gullies across the mine. A total distance of 1240 linear metres was inspected to identify protruding rockbolts and bolts installed at an acute angle. Most of the rockbolts were installed at an angle less than 70° to the hangingwall (68%), and many were protruding by more than 30 cm (11%). Rockbolts were installed at an average angle of 45o to the hangingwall. However, in the 1240 m inspected in the 24 workplaces, no instabilities were observed relating to protruding rockbolts, nor to bolts installed at a flat angle (refer to Figures 14 and 15).
Some of the underlying reasons for the acute installation angles and protruding gully rockbolts were practical and/or situational constraints. Congestion with broken rock restricts the height of the gullies and results in operators adjusting the angle of


installation to suit the required tools and equipment (hand-held drilling). Installation angles were normally flatter in the direction of advance, which under these circumstances can be considered favourable. Protruding rockbolts were not mainly attributed to the fallout of small rocks from the hangingwall of the stope gully, but to undulating or uneven hangingwall conditions. The loading interaction between the welded mesh and rockbolt faceplate prevents the faceplate from being pushed flush against the rock wall.
The choice of support systems in South African hard-rock tabular mines has historically been based on cost considerations, empirical knowledge, engineering judgement, and past practices. In a changing mining industry of emerging technologies, past practices may become obsolete, and the lack of rigorous reviews of support designs may result in support systems that are not optimized, nor effective. In this study, past practices (standards) relating to rock bolt support units were investigated:
➤ Rockbolts should be installed between 70° to 90° to the excavation periphery or strata
➤ Rockbolts protruding by more than 30 cm should be replaced. These standards were evaluated regarding the support installed in stope gullies in a medium- to deep-level gold mine. Four approaches were followed. Firstly, based on the mine’s 95% cumulative fallout height of observed falls of ground, and on the support resistance provided by the pre-stressed packs, a stable factor of safety was achieved.
Secondly, a probabilistic keyblock analysis method, JBlock, was used to conduct a comparative analysis. To provide the required input data, a geotechnical database was created through underground geotechnical scanline mapping. In the JBlock analyses, the mine’s current support standard was compared with scenarios in which rockbolts were installed at an acute angle, bolts were protruding, and where no rockbolts were installed in gullies. The results indicated that:
➤ A very low probability exists for failures in gullies.
➤ Rockbolts installed at an acute angle, and protruding rockbolts, do not have a significant impact on the stability of gullies
➤ The main purpose of gully hangingwall rockbolts, on the specific operation is not to increase the resistance of the support system, but in conjunction with welded mesh, to maintain the stability of small key blocks. This is the stable beam building function of rockbolt support.
Thirdly, all the mine’s accident and incident reports over a fiveyear period were reviewed. The majority of events occurred in the stoping environment, and none of the instabilities was directly or indirectly related to protruding rockbolts or rockbolts installed at an acute angle.
Lastly, underground inspections were carried out at 24 workplaces at depths ranging between 1200 m and 2100 m below surface, in different geotechnical areas across the mine. A total distance of 1240 linear metres was inspected for protruding rockbolts and bolts installed at an acute angle. Most of the rockbolts observed underground were installed at an angle less than 70° to the hangingwall (68%), and a smaller number of bolts protruded more than 30 cm (11%). Rockbolts were installed at an average angle of about 45° to the hangingwall. However, despite the deviations from the prescribed ‘standard’, no instabilities were observed.
In summary, the results of the investigation confirmed that the prevalence of protruding rockbolts and bolts installed at an acute angle does not have a detrimental impact on the stability of stoping gullies. This was mainly attributed to the reinforcing nature or role
of the rockbolts being installed. This also supported the notion that past practices or standards may be obsolete and can be optimized to benefit mining operations without affecting safety. Alternatively, it can be deduced that surface support provides sufficient areal coverage to cater for the majority of potential instabilities in gullies. As a result, rockbolts merely fixing mesh to the hangingwall of gullies can be deemed appropriate and would be more cost-effective by providing same support effect with fewer support drilling metres.
The results of the investigation showed that the deviation from historical standards did not result in a significant increase in rockfalls. This finding justified the revision of historical mine standards, with consequent cost-saving opportunities, and without compromising safety. It is noted that, although the study was conducted in stope gullies, it can be expected that the approach followed will be equally applicable to tunnels and other mining excavations. However, it is recommended that this is confirmed by additional research and case studies.
It is important to note that, despite the indications from the research, the authors do not advocate omitting rockbolts and welded mesh from stope gullies. The advantages of such a support system are well documented. The role that rockbolts serve in stoping gullies should be duly considered and historical (or inherited) support standards adjusted to maintain their effectiveness.
Ayres, N.L. and Gardner, L.J. 2014. Testing tendon support units under a combination loading scenario. Journal of the Southern African Institute of Mining and Metallurgy, vol. 114, no, 10. pp. 829–834.
Bhatt, H., Meena, M., and Badhwar, M. 2018. Design principle of rockbolting. Verdant College of Engineering and Technology. Rajasthan, India. pp. 363-368.
Cai, M. and Kaiser, P. 2012. Principles of rock support in burst-prone ground. Tunnelling and Underground Space Technology, vol. 36. pp. 33–46.
Esterhuizen, G.S. 2003. JBlock User Manual. Department of Mining Engineering, University of Pretoria.
Esterhuizen, G.S. and Streuders, S.B. 1998. Rockfall hazard evaluation using probabilistic key block analysis. Journal of the South African Institute of Mining and Metallurgy, vol. 98. pp. 59–64.
Hamrin, H. 1980. Guide to underground mining methods and applications. Atlas Copco, Stockholm, Sweden.
Joughin, W., Jager, A., Nezomba, E., and Rwodzi, L. 2012a. A risk evaluation model for support design in Bushveld Complex underground mines: Part I –Description of the model. Journal of the South African Institute of Mining and Metallurgy, vol. 112, no. 2. pp. 83–94.
Joughin, W., Jager, A., Nezomba, E., and Rwodzi, L. 2012b. A risk evaluation model for support design in Bushveld Complex underground mines: Part II – Model validation and case studies. Journal of the South African Institute of Mining and Metallurgy, vol. 112, no. 2. pp. 95–104.
Li, C. 2017. Principles of rockbolting design. Journal of Rock Mechanics and Geotechnical Engineering, vol. 9, no. 3. pp. 396–414.
Li, L., Hagan, P.C., Saydam, S., Hebblewhite, B., and Li, Y. 2016. Shear resistance contribution of support systems in double shear test. Tunnelling and Underground Space Technology, vol. 56. pp. 168–175.
Naidoo, K., Leach, A.R., and Spencer, D. 2002. Stope gully support and sidings geometry at all depths and at varying dip. Safety in Mines Research Advisory Committee, Johannesburg.
Ortlepp, W.D. 1997. Rock fracture and rockbursts – An illustrative study. Monograph Series, no. 9. South African Institute of Mining and Metallurgy, Johannesburg.
Ortlepp, W.D. and Stacey, T.R. 1994. The need for yielding support in rockburst conditions, and realistic testing of rockbolts. Proceedings of the International Workshop on Applied Rockburst Research, Santiago, Chile. Sociedad Chilena de Geotecnia, Santiago. pp. 265–275.
Stacey, T.R. 2011. Support of excavations subjected to dynamic (rockburst) loading. Keynote Paper, Proceedings of the 12th International Congress of the International Society of Rock Mechanics, Beijing. CRC Press/Balkema. pp. 137–145. u
Affiliation:
1Graduate School of Technology
Management, University of Pretoria, Pretoria, South Africa.
Correspondence to: G. Bekker
Email: giel.bekker@up.ac.za
Dates:
Received: 22 Oct. 2021
Revised: 30 Oct. 2023
Accepted: 30 Oct. 2023
Published: January 2024
How to cite:
Govindasamy, T. and Bekker, M.C. 2024
Lean contruction: Implementing the Last Planner System on mining projects. Journal of the Southern African Institute of Mining and Metallurgy, vol. 124, no. 1. pp. 15–24
DOI ID:
http://dx.doi.org/10.17159/24119717/1695/2024
by T. Govindasamy1 and M.C. Bekker1
Synopsis
The potential benefits of implementing the Last Planner System (LPS) on mining infrastructure projects were explored through two case studies in the South African mining industry.
The first part of the study involved measurement of the impact of LPS through earned value techniques on secondary project data. The second part sought to establish the lean construction success factors leading to improvements in construction performance. This was done by means of a research questionnaire distributed to the project owner’s teams, contracted parties, and the LPS facilitators.
The results revealed a positive correlation between LPS application and planned percentage complete. However, the performance achieved during the LPS pilot was not sustained. The success factors and benefits considered most evident in the case study pilot differed among the three stakeholder groups.
The findings are expected to guide construction stakeholders to better define performance measures and focus on factors required to make LPS implementation more effective in the South African mining sector.
Keywords
Last Planner System (LPS), success factors, earned value management (EVM), construction.
Introduction
Completing construction projects within time and budget remains elusive, with only 25% of large construction projects achieving these goals (Abbas, Din, and Farooqui, 2016). Abbas, Din, and Farooqui (2016) refer to a study by Project Management South Africa (PMSA) which reveals that ‘out of 300 global megaprojects with budgets of over $1 billion, 65% failed to meet the objectives established at final investment stage’.
A project’s performance can be viewed from two perspectives. Firstly from a business perspective, which is normally the project owner’s view, and secondly from an execution efficiency perspective associated with the contractor’s interest (Enshassi, Mohamed, and Abushaban, 2009). The ability to complete projects on time is an indicator of efficiency in the construction process, which is subject to many variables and unpredictable factors related to: theperformance of different parties, availability of resources, environmental conditions, and contractual relationships (Assaf and Al-Hejji, 2006).
Monyane et al., (2019), with reference to Koskela (1992), suggest that lean construction ‘is an innovative construction method to mitigate the poor performance on construction projects. Lean concepts are designed to improve the efficiency and effectiveness of project execution by improving productivity and reliability, better quality and customer satisfaction, improved forecasting, shortened schedules, waste minimization, cost-effective[ness], and improved safety. Unfortunately, after an extensive literature search no verifiable evidence could be found suggesting that the South African construction industry has adopted lean concepts for performance improvement’.
According to Sarhan et al., (2017), a variety of lean tools and techniques can be found within the lean construction domain. These include the Last Planner System (LPS), Value Stream Mapping (VSM), the 5S process, Kaizen, Total Quality Management (TQM), Increased Visualization, Fail Safe for Quality and Safety, Daily Huddle Meetings, the Five Why’s, Just in Time (JIT), Pull ‘Kanban’ system, and Error Proofing (Poka-yoke). Porwal et al., (2010) state that LPS is one of the most widely used lean construction tools. In a project-orientated environment LPS addresses the creation of a predictable work flow among various stakeholders to achieve more reliable results. Hamzeh (2011) references Ballard and Kim (2007), Hamzeh (2009), and Viana (2010) to suggest that the despite the many benefits of LPS, research has shown that many organizations find it difficult to implement successfully.
Research objective
The objective of the study was to seek empirical evidence to illustrate the benefit of implementing LPS on infrastructure projects in the mining sector, in the hope of gaining valuable insights for the application of lean construction in the industry.
Research was conducted to assess whether the implementation of LPS had a positive impact on construction performance in two case study projects. Construction performance was measured using earned valued management indices of schedule and cost performance. The research also aimed to determine the impact LPS had on planning reliability during construction. Ballard (2000) describes Percent Plan Complete (PPC) as the number of planned activities completed, divided by the total number of planned activities, expressed as a percentage. A focus on plan realization diminishes the risk of variability spreading to downstream flows and tasks (Ballard, 2000). Further objectives were to understand the perceived critical success factors required, and benefits achieved, through the application of LPS on the two projects from the perspectives of three stakeholder groups.
Literature review
Lean production was developed by Toyota engineer Taichii Ohno. His idea behind the concept is the elimination of inventory and waste through small batch production with reduced set-up time and collaboration with suppliers for just-in-time deliveries (Ningappa, 2011).
Aziz and Hafez (2013) state that Koskela (1992) first proposed adaptation of lean production for construction whereby production is presented in the three elements of transformation, flow, and value generation. To achieve lean construction, Bashir et al., (2011) reference Koskela (1992) to identify the following le construction principles:
➤ Reduce variability
➤ Reduce cycle timesminimize the number of steps
➤ Focus control on the complete process
➤ Balance flow improvement with conversion improvement
➤ Increase output flexibility
➤ Increase process transparency.
In order to contextualize the LPS approach in construction, the following paragraphs outline the background to LPS, challenges and success factors for implementation, as well as potential benefits.
Dos Santos and Tokede (2016) reference Grenho (2009) to indicate that LPS was introduced in construction projects by Glen Ballard in 1993. With LPS, Ballard focused on improving weekly work plans and controlling work flow of design and construction on projects. Tayeh et al., (2019) reference Porwal, et al, (2010) to describe LPS as a planning, monitoring, and control tool based on lean construction principles of ‘just-in-time’ (JIT) delivery, value stream mapping (VSM), and pull scheduling (also known as reverse phase scheduling). Dos Santos and Tokede (2016) reference Ballard (2000) to indicate that the project master plan objectives are taken to a lower level of planning which is referred to the ‘look-ahead schedule and weekly work plans’. The look-ahead schedule involves the following process steps:
➤ Identify the assignments that can be completed in the next work period
➤ Consult with production experts to confirm that the assignment can be completed within the specified period
and that the material and equipment is in place for the assignment to proceed
➤ Identify assignments that cannot be completed and amend the look-ahead schedule.
Dos Santos and Tokede (2016) cite Ballard (2000) to indicate that the weekly work plan is derived from the look-ahead plan by identifying and sequencing what work needs to be completed each day of the specified assignment, whereby the person or team who translates the objectives into assignments for implementation is said to hold the ‘last planner position’. The planner investigates if all constraints to an assignment can be removed; if not, then the assignment must be postponed.
The PPC metric of measure will depend on the type of activity being executed. Examples of the PPC metric used during the LPS pilot included tons of steel installed per day for planned steel installations and tons of concrete poured per day for the planned construction of a silo. Alarcón, Diethelm, and Rojo (2002), in assessing the impact of lean construction using a database of 77 construction projects in Peru, found that after LPS was implemented, the collective PPC metric increased on average 6% year on year over a three-year period. Vignesh (2017), in a case study of implementing LPS in a district of Tamil Nadu of India, found that the PPC metric increased from a baseline of 38% to an average of 85% after implementation.
Samorow et al., (2018) suggest that lack of appropriate education and training on LPS is likely to lead to LPS being implemented incorrectly, and thus ineffectively. Alarcón, Diethelm, and Rojo (2002) identified the following inhibitors that prevents successful LPS implementation: lack of time to implement change, lack of training, poor organizational role definition, inadequate understanding of LPS concepts, weak administration, poor communication, and a lack of integration. To counter this it is suggested that LPS teams work together to plan effectively and share knowledge around the planning of tasks.
Hamzeh (2011) suggests that LPS implementation challenges the old practice of developing schedules during the early feasibility phases of the project without input from the implementation team. Instead, there is an emphasis on collaborative planning and constraint analysis in a continuous learning environment. The author asserts that meaningful participation of all parties is crucialfor successful LPS implementation.
Tayeh et al., (2018) state that commitment to planning and coordination between the different participants is most critical for LPS success. They also listed other factors that support LPS implementation (Table I).
In a review to determine the impact of LPS on 77 Chilean construction projects, Alarcón et al., (2011) found that LPS improved the reliability of planning , yielded an improvement in PPC, and (over time) an improvement in management control, greater involvement of middle management, and a reduction in urgent procurement requests was observed.
AlSehaimi, Tzortzopoulous, and Koskela (2009), Dave, Hämäläinen, and Koskela (2015), and Koskela, Stratton, and Koskenvesa (2010), as mentioned by Tayeh et al., (2019), indicate that recognized benefits of LPS are ‘minimize variability in
No Critical Success Factors (CSFs)
1 Top management support
2 Commitment to promises
3 Involvement of all stakeholders
4 Communication between parties to achieve team work
5 Robust relationship with suppliers
6 Push employees to create change
7 Coordination and cooperation between parties
8 Manage resistance to change
9 Definition of roles and responsibilities
10 Involvement of project manager
11 Increased support and monitoring of management
12 Failed to update and meet the program daily
13 Lack of defined roles and responsibilities for monitoring LPC implementation
14 The project does not have all the subcontractors, implementing LPS through the different stages
15 Lacking greater commitment by management for LPS implementation
16 Lack of integration among subcontractors
17 Managers lacked participation
workflows, foresee work plans, push toward improving the productivity, compressing time of a project, minimize project cost, maximize co-operation and confidence among team members’.
LPS and project performance
According to Novinsky et al., (2018), EVM and LPS can support a holistic mechanism to measure project progress accounting for economic and process quality in terms of collaboration and work flow. The authors explain that EVM determines project progress by measuring variance between planned and actual values for schedule and budget. LPS enhances planning with the PPC metric measuring reliability of achieving planned commitments (Novinsky et al., 2018). The authors further indicate that only a few studies have been completed on the combined application of EVM and LPS and the benefits to construction.
In a field test implementing LPS, Kim and Ballard (2010) found that the PPC improved from 54% to 94%, and the Schedule Variance (SV) index improved by 10%. In a review of 18 projects Ballard et al., (2007) found an improvement of more than 10% on CPI, which supports other researchers‘findings on the relationship between planning reliability and project performance. Leal and Alarcón (2010), in assessing the impact of LPS on industrial mining projects, found that there was a correlation between PPC and EVM indices of SPI and CPI with a significant relationship between the variables. Novinsky et al., (2018) suggest that organizations intending to implement EVM and LPS establish a standard that supports the application of the concept as well as consider a long pre-planning phase. They indicate that if standards are set and processes are controlled the application of EVM and LPS can improve project performance. In a study to quantify the impact of implementing LPS on industrial mining projects, Leal and Alarcón (2010)
Figure 2 depicts the conceptual model for this research. Before LPS implementation the construction performance baseline is derived using EVM indices such as Schedule Performance Index (SPI) and Cost Performance Index (CPI). The construction Table I
monitored performance measures such as schedule variance, profit margin variance, project productivity index, labour efficiency index, and project safety indicators for projects that had implemented LPS and projects that had not.
Project process model
This study focuses on the transformative process of planning, controlling, and executing a project.. Tayeh et al., (2019) mention Munje and Patil (2014), who suggest that traditionally, construction allocates effort and resources to the planning stage of a project, to guide personnel during the execution as well as the control function. Tayeh et al., (2019) propose that this approach tends to overlook the flow and value considerations in the transformative process (Figure 1).

1—Project process model

performance during and post LPS implementation was derived using the same EVM indices. The quantified benefit is the difference in performance from the baseline. The benefit achieved through LPS must be viewed systematically and consider the Critical Success Factors (CSFs) required to support LPS implementation.
The primary research questions are focused on the impact LPS has on construction planning reliability, construction performance, and the CSFs required for successful LPS implementation. The research questions are stated as follows.
1. What is the construction performance trend prior to and post LPS implementation?
2. How does construction performance compare to the PPC performance during LPS implementation?
3. Rank the CSFs for LPS Implementation from the perspective of the owner’s team, contracted parties, and the LPS facilitators.
We used a descriptive case study method to establish a comparison in construction performance related to the use of LPS. Zainal (2007) states that a case study method is descriptive when it sets out an accurate account of the characteristics within a selected data-set. Yin (2013), as referenced by Easterby-Smith, Thorpe, and Jackson (2015), views the case study method as subject to criticism as it does not have the rigour of scientific designs and rarely allows the conclusions from the case study to be extended to the general population. Brent and Pretorius (2009) cite Flyvbjerg (2006), that a case study can be employed, in specific circumstances to formulate general propositions and theories. The authors argue that the practical knowledge generated by a case study can be equal to or of greater value than theoretical knowledge (Brent and Pretorius, 2009).
This research was based on two mining infrastructure projects. In both cases the project scope included construction, installation, and commissioning of new mining and plant infrastructure required to support mining operations. Two types of data were obtained, namely primary data through a questionnaire and secondary data from the actual project data.
To address the third research objective, primary data was collected through a survey which was completed by the project
owners' teams, construction contractors, and LPS process facilitators. Saunders, Lewis, and Thornhill (2016) state that using a questionnaire is economical as it allows the researcher to collect standardized data from a specified population. The survey questionnaire was developed using the success factors obtained from the literature review on LPS implementation.
The questionnaire consisted of 17 questions with 43 variables and was distributed electronically to selected respondents. The questionnaire consisted of four parts:
➤ Demographic information about the respondents and their role on the construction project
➤ Success factors required for LPS implementation
➤ benefits of using LPS
➤ Relative importance (ranking) of factors that support LPS implementation.
A five-point Likert scale was used to capture and process the responses.
According to Sørensen, Sabroe, and Olsen (1996) the main advantage of using secondary data is its accessibility. The secondary data used related to project data generated for reporting, performance management, and control purposes for the respective case study projects. The specific secondary data sources relevant to this case study were as follows.
➤ Baseline project master schedule and budget
➤ Progress updates to master schedule and project cash flows, including budget forecast
➤ LPS implementation data, including PPC performance tracking data generated by the project under review.
A construction performance baseline before and after LPS implementation was evaluated using the EVM cost and schedule performance indices. Linear correlation was used to determine if a change in the PPC trend had an impact on the SPI and CPI indices. The primary and secondary data was analysed with Microsoft Excel, using descriptive statistics: mode, frequency, correlation, and linear regression.
Eighty-four invitations were sent to selected project team members. A total of t34 were returned, with one incomplete (Table II). This resulted in a response rate of 39% from the three targeted groups.
The project owner’s team had the highest response rate of 72%, followed by the LPS facilitator group with 71%. A poor response was received from the contracted parties group, mainly due to
Table II
Table III
Cronbach's Alpha for variables in selected groups Select
some contractors having completed work on the project. Prior to distribution, the survey content was validated by piloting the questionnaire with two respondents.
Zikmund (2003) defines validity as the ability of a scale or measuring instrument to measure what it is intended to measure, and states that a pilot study is any small-scale exploratory research technique that uses sampling but does not apply rigorous standards. Zikmund (2003) defines reliability as the degree to which measures are free from error and thus yield consistent results. The calculated Cronbach’s alpha assesses the internal consistency among the test variables. Murguia (2019) indicates that a threshold score of 0.70 as a minimum is an acceptable value to measure the factor for cases studies.
Table III depicts the Cronbach’s alpha score for each of the specified groups. The scores across the three groups are above 0.70, which indicates a good internal consistency of the items in the scale.
The secondary data for the case study review was selected to align with the LPS pilot duration. The LPS pilot on both projects was six months, therefore for comparison purposes a six-month period prior to the LPS pilot was selected for baseline performance and six months post the pilot to evaluate if the performance attained during the pilot period was sustainable. The data-set was screened to obtain the planned and actual construction progress as well as the construction budget and actual costs on a monthly basis.
The SPI and CPI for each project were derived using the formulae in Table IV (Novinsky et al., 2018). The evaluation dataset references a specific period during the construction phase of each project, therefore to validate the SPI and CPI trends it was compared to the historical reporting trend for each of the projects.
The PPC data-set for both projects was obtained from tracking reports compiled during the LPS pilot phase. For Project A, the LPS pilot was four months and for Project B it was seven months. For comparative purposes an equal prediction period of a sixmonth LPS phase was determined in the middle of the two project life-cycles. For Project A the PPC performance was predicted for six months using the linear regression equation derived from the four-month data-set. For Project B the same was applied from the seven-month data-set. With the durations of the PPC measurement periods equally normalized, some comparisons could be made indicating the impact of LPS application on both projects. The PPC metric was tracked on a weekly basis on each of the projects and
Table IV
EVM metrics and indices (Novinsky et al., 2018)
Metrics
Planned
Value = PV
Earned
Value = EV
Actual cost = AC
Alternative designations
Budgeted cost of work
Scheduled = BCWS
Budgeted cost of work
Performed = BCWP
Actual cost of work
Performed = ACWP
Interpretation
Indicates how much work should be done to date
Actual project progress is measured against the PV.
The value of work performed expressed in terms of the approved budget assigned to that work.
Are the total costs that have actually incurred in a given time to accomplish a cetain amount of work.
Variance or index Formula Interpretation
Scheduled variance = SV SV = EV – PV
Schedule performance
Index = SPI
Cost variance = CV
Cost performance index =CPI
SPI = EV / PV
CV = EV – AC
CPI = EV – AC
Measures deviations from schedule
Indicates overall time efficinecy and how efficient time is used by the project team.
Measures deviations from budget
Indicates overall cost effeciancy and how efficient financial resources are used

was averaged to provide a monthly PPC performance that could be compared to the monthly SPI and CPI of each project.
Project SPI, CPI, and PPC performance trends
Figure 3 presents Project A’s SPI and CPI trend for the 18-month period. The PPC trend for six months represents the LPS pilot duration. The project objective for implementing LPS was to accelerate the project schedule by six months. To achieve this objective the project team focused on delays in construction of bulk earthworks (i.e. terraces, roads, dams, and office blocks). To keep the bulk earthworks construction on track and not adversely impact the targeted project completion, LPS was implemented with the construction contracted parties involved.
The SPI and CPI trends for Project A are consistently above unity for the 18-month observation period. This indicates that the project was on track to be completed within budget and on time. In the period before LPS the CPI was trending just below at 0.97 for four consecutive months, while the SPI was averaging 1.05 for the six-month period. During the LPS phase the SPI was stable with an average SPI index of 1.04. The CPI increased to an average index of 1.12. The PPC trend for the six-month average performance was 67%. Post the LPS phase the SPI was on average 1.02 and the CPI index averaged 1.06. The SPI and CPI trend closer to unity as the project nears completion.
Figure 4 presents the SPI and CPI trends for Project B for the 18-month period. Again, the PPC trend is captured for six months which represent the LPS pilot duration. The project faced many challenges related to changes in scope arising from unforeseen site conditions and poor construction productivity due to financial distress of the main contractor on the project. The project implemented LPS to improve the poor productivity of some construction teams to help improve the overall progress of the project.
The SPI an CPI trends for Project B indicate an overall deterioration over the 18-month observation period. The project’s current status is over budget and behind schedule. In the period before LPS the SPI index averaged 0.87. The CPI is trending at an average of 1.14; this is a result of costs increasing through site instructions early in the construction work without an adjustment to the schedule. It is evident that the integration between schedule and cost is not optimal on this project. During the LPS phase there is a slight decline in the SPI with an average of 0.84, and a bigger decline in CPI with an average of 0.97. The PPC during this phase averaged 63%. Post the LPS phase the SPI increased slightly and averaged 0.88% while the CPI further declined to an average of 0.79.
Project PPC correlation with and regression to SPI and CPI
During the LPS pilot the observed PPC trend and the SPI and CPI indices were analysed to determine if there was any correlation between the different variables. The correlation coefficient measures how well the relationship between two or more variables can be described by a straight line (Page and Meyer, 1999). A correlation coefficient is measured on a scale from +1 through to –1, where +1 is an indication of a positive correlation between variables, zero indicates no correlation, and –1 indicates a negative correlation. Page and Meyer (1999) state that the p-value indicates if there is a significant relationship between the variables.
➤ If p ≤ 0.05, there is a significant relationship between the variables.
➤ If p ≥ 0.05, there is no significant relationship between the variables.
Table V depicts the correlation coefficients and p-values for the PPC-SPI and PPC-CPI for the case study projects. For Project A the PPC–SPI correlation coefficient is 0.479, which indicates a positive relationship between the variables. The PPC–CPI correlation coefficient is 0.834, which also indicates a positive relationship. The p- value for PPC–SPI is greater than 0.05 and therefore indicates that there is no significant relationship between the variable. The p-value for PPC-CPI is less than 0.05 and therefore indicates a significant relationship between the variables.
For Project B the PPC–SPI correlation coefficient is 0.377, which indicates a positive relationship between the variables. The PPC–CPI correlation coefficient is 0.073 which indicates a negative relationship between the variables. The p-values for PPC-ISP and PPC- CPI are greater than 0.05 and therefore there is no significant relationship between the variables.

Table V
PPC metric correlation and regression with SPI & CPI indices
Correlation and Regression PPC - SPI
Quantifying SPI and CPI performance per phase
Table VI illustrates the difference (delta) in SPI and CPI from the baseline before LPS to performance during LPS, as well as the SPI and CPI performance post-LPS for both projects. The results reveal some variation. On Project A the SPI declined by 1% during implementation, while the CPI increased by 13% during the LPS phase. The performance declined on both SPI and CPI post the LPS pilot. Project B shows a decline in SPI of 4% during implementation, while the CPI declined by 17% during the LPS pilot. The performance on the SPI improved by 4%, and CPI declined by 23%, post the LPS pilot.
Survey results
The survey respondents were asked to rate their perceived experience from the LPS pilot using a five-point Likert scale according to the following coding: (1) strongly disagree; (2) disagree; (3) neutral; (4) agree; and (5) strongly agree.
Ranking ot critical success factors
The respondents were asked to rank the success factors for LPS implementation, using a scale from 1 (least important) to 8 (most important). The mode was used to define the most frequently occurring rank for each success factor per respondent group. According to Boone and Boone (2012), Likert-type ranks, which distinguish a greater-than relationship but do not quantify the relationship, comprise an ordinal measurement scale. The authors recommend the use of the mode or median for central tendency in ordinal-scale date, and frequencies for variability.
Table VII depicts the modes of the critical success factors asranked by the three stakeholder groups, arranged in descending order according to the project owner’s team ranks. The rankings of
of subsequent groups, the contracted parties and LPS facilitators, is reflected alongside the project owner’s team for comparison purposes. It is evident that the three stakeholder groups have different perceptions of the critical success factors required for LPS implementation. The LPS facilitators ranking differed from the two comparison groups, although three of the top four factors selected by this group were among the top four factors ranked by the project owner’s team. The most important success factor for LPS implementation differed among the three stakeholder groups. The project owner‘s team ranked integration and communication, contracted parties ranked good leadership and management commitment, and LPS facilitators ranked human capital as the most important success factor.
Benefits observed during LPS implementation
Table VIII represents the perceived benefits of LPS implementation by the three stakeholder groups. Tthe project owner’s team agreed that benefits were perceived during the LPS pilot, and strongly agreed that LPS helped management to better visualize the planned work. The LPS process facilitators also agreed or strongly agreed that the LPS benefits were observed during the LPS pilot, but were neutral on whether LPS helped minimize project costs. The contracted parties’ observation on benefits contrasted with that of the other two groups. The contractor team was neutral or disagreed that benefits was observed during the LPS pilot, with the exception of enhance co-operation and confidence among project team members.
Discussion
The research model aimed to determine the impact of LPS on construction performance and understand the critical success
Success factors ranked per stakeholder group
Project Owners Team Contracted Parties LPS Facilitator LPS Benefits
Allows better understanding of project controls and planning
Enhances co-operation and confidence among project team members
Improve predictability of work plans
Minimize variability in work flow
Enables accurate predication of resource requirements
Shorten project time on certain tasks
3.00 4.00
Minimize related project cost 4.00 2.00 3.00
Improves productivity on construction site 4.00 3.00 5.00
Improved site management
Allows management an opportunity to better visualize work planned
factors for LPS ranked by the three stakeholder groups. A secondary aim was to explore the perceived benefits observed during LPS implementation.
LPS impact on construction performance
During the LPS pilot the PPC metric had a positive trend and improved during the implementation period on both projects. This supports the findings of Vignesh (2017) and Alarcón et al., (2011), who found a distinct improvement in planning reliability.
The PPC and EVM indices show a positive linear correlation on both projects, which supports the findings of Leal and Alarcón (2010). There was a positive correlation between PPC and SPI for projects A and B, and a positive correlation between PPC and -CPI for Project A. However, the correlation between PPC and CPI for Project B was negative. The correlation for Project A PPC-CPI showed the only significant p-value. This is in contrast to Leal and Alarcón‘s (2010) findings of a significant p-value tfor both PPC-SPI and PPC-CPI.
The EVM indices suggest that there was no visible impact on construction performance from the LPS pilot. The SPI trend for Project A during LPS implementation presents a slightly more consistent performance compared to the period before LPS, suggesting that LPS had a positive impact on construction. The LPS impact for Project B is not apparent and the EVM indices do not reflect any improvements. This could be a result of underlying factors impacting the project that the LPS pilot could not adequately address. Project B suffers from poor productivity from contractors, which is exacerbated by financial distress. Poor productivity affecting construction performance is consistent with factors cited by Tayeh et al., (2018).
The delta values for project SPI performance observed during and post LPS pilot on Project A did not show an improvement, while on Project B the SPI performance declined during the LPS pilot but improved post the pilot. The results suggest that while the PPC performance on both projects improved during the LPS pilot period, the improvement in planning reliability is not visible in the project SPI and CPI performance.
The aim was to explore the opinions of the three stakeholder groups participating in the LPS pilot on the critical success factors
3.00 4.00
important for LPS implementation. The results depict a varied opinion among the three groups regarding the ranking of success factors, and differ from the sequence of success factors ranked by Tayeh et al., (2018) and Murguia (2019). This is to be expected as the implementation of LPS is specific to the environment and organizational culture in which the project is executed. The varying opinion on success factors required for LPS implementation among the three stakeholder groups could have led to challenges experienced during the pilot phase. Evidence for this is indicated by answers to the open question: ‘What should be changed or stopped when using the short-term planning process?’ It is worth mentioning that the Lean Construction Last Planner System (LPS) process was referred to as the ‘short-term planning process’ within the organizations during the pilot phase. The responses were varied and are summarized in Table IX, highlighting that some of the success factors were not well implemented in the case study pilot. There was no clear indication of what planning took place before the LPS pilot on the projects and no evidence of how success was to be measured during this phase. Therefore, the benefits could not be measured using secondary project data.
The study’s primary aim was to investigate whether the lean construction tool LPS had a positive impact on construction performance. The proposition was that an improvement in planning reliability observed from the PPC metric will have a positive impact on the construction EVM indices. The case study results indicate that the PPC performance measured during the LPS pilot period had a positive upward trend. The delta SPI and CPI performance for the three distinct evaluation phases of before, during, and after the LPS pilot did not show consistent percentage improvement in the EVM indices. There was a positive correlation between PPC and SPI and PPC and CPI for the case study projects,although the correlation was not significant.
The study’s secondary objective was to explore the factors required for successful LPS implementation. A questionnaire was utilized to survey the opinions of the three stakeholder groups (project
Response Question: What should be changed or stopped when using the short term planning process?
1 Add project administrators to enable data collection
2 A dedicated war room is required Must not get bogged down into too much organisational matters, focus rather on planning
3 Have the contractual agreement for short-term planning process
4 Contract the short-term planning process and implement before the contractors starts construction
5 It should be set up from the start of the project and not introduced midway. It must be a way of doing work and not a paper exercise
6 this should be done when contractors are awarded and to be implemented at site establishment, should be part of requirements in tender phase
7 All construction needs to be put on hold to ensure everyone can participate in training
8 Automate the control tower dashboards supporting visualisation of performance
9 'Fire fighting' mindset - people were busy and never shifted to planning ahead to avoid issues, rather focused on solving the current issues
10 Should be integrated with project and no parallel processes
11 It doesn't work for construction projects. Should only be used in software development as per PMBOK
owner’s team, contracted parties, and LPS facilitators) related to the important factors for LPS implementation and perceived benefits of using LPS as a lean tool on the project. The critical success factor ranking among the three groups differed, with minor alignment in ranking of factors related to integration and communication, clear roles and project structures, and contractual support for suppliers. The variability in the success factor rankings by the three stakeholder groups points to possible challenges experienced during LPS implementation in this case study. The project owner’s team and the LPS facilitators indicated agreement with the perceived benefits of LPS implementation, while the contracted parties generally disagreed that the perceived benefits were observed in the case study.
The research sought to find empirical evidence that the application of the lean tool LPS on infrastructure projects in the mining sector will improve construction performance. Implementing lean construction will help improve poor planning, poor site management, coordination problems, and chronic problems with waste (Tayeh et al.,, 2018). The study contributes to the knowledge of applying lean construction in the mining sector as follows.
➤ A positive PPC trend was observed, indicating an improved planning reliability on the case study projects.
➤ A positive correlation was observed on PPC and EVM indices of SPI and CPI. However, the actual causation could not be validated with the information available. Although not part of this research, the various factors that may have caused the correlation should also be investigated to indicate the cause-and-effect influencing factors.
➤ The study provides a perspective on the perceived important success factors and benefits associated with LPS implementation from the perspective of the three stakeholder groups.
Alarcón, L.f., Diethelm, S., and Rojo, O. 2002. Collaborative implementation of lean planning systems in Chilean construction companies. Proceedings of Table IX
➤ The study failed to show a clear and definitive improvement in construction performance during and post the LPS pilot phases. This could be attributed to the following:
• Poor planning. Performance baselines; and how benefits will be measured werwas not defined.
• LPS was implemented after construction started, which may have contributed to implementation challenges.
• Construction performance was measured on the project master level, instead of the work package level.
The case study is limited to two mining infrastructure projects, and hence the results are exploratory. The contractor participants in the study consisted solely of contractors involved in the two case study projects, and therefore the findings of the study cannot be generalized.
Based on the results and conclusions, the value of this research lies in improving the approach to implementing Lean Construction principles on projects in the mining industry. It is suggested that in future studies, different construction performance metrics should be utilized, which have a better correlation with PPC.
The final recommendation is that the use of an implementation framework should be considered to make LPS successful in mining projects. Hamzeh (2011) suggests that the meaningful participation of all parties in construction is a key factor for successful LPS implementation because LPS changes the way people think and execute work. Thus, managing LPS implementation issues in advance could help construction teams adapt to the new way of working (Hamzeh, 2011). To achieve this aim in a consistent and repeatable manner, the authors suggest an LPS implementation framework be used to facilitate the organizational change required for successful LPS implementation.
Abbas, A., Din, Z.U., and Farooqui, R. 2016. Achieving greater project success & profitability through pre-construction planning: A case-based study. Procedia Engineering, vol. 145. pp. 804–811.
the Tenth Annual Conference of the International Group for Lean Construction (IGLC-10), Garmado, Brazil, August 2002. https://leanconstruction.org.uk/wpcontent/uploads/2018/10/Alarcon-et-al.-2002-Collaborative-Implementationof-Lean-Planning-Systems-in-Chilean-Construction-Companies.pdf
Alarcón, L.F., Diethelm, S., Rojo, O., and Calderón, R. 2011. Assessing the impacts of implementing lean construction. Revista ingeniería de construcción, vol. 23. pp. 26–33.
Assaf, S.A. and Al-Hejji, S. 2006. Causes of delay in large construction projects. International Journal of Project Management, vol. 24. pp. 349–357.
Aziz, R.F and Hafez, S.M. 2013. Applying lean thinking in construction and performance improvement. Alexandria Engineering Journal, vol. 52. pp. 679–695.
Ballard, H.G 2000. The last planner system of production control. PhD thesis, University of Birmingham. https://etheses.bham.ac.uk/id/eprint/4789/1/ Ballard00PhD.pdf
Ballard, G., Tommelein, I., Koskela, L., and Howell, G. 2007. Lean construction tools and techniques. Design and Construction. Routledge.
Bashir, A.M., Suresh, S., Proverbs, D., and Gameson, R. 2011. A critical, theoretical, review of the impacts of lean construction tools in reducing accidents on construction sites. Proceedings of the 27th Annual ARCOM Conference, Bristol, UK. Association of Researchers in Construction Management. pp. 5–7.
Boone, H.N. and Boone, D.A 2012. Analyzing likert data. Journal of Extension, vol. 50. pp. 1–5.
Brent, A.C. and Pretorius, M.w. 2009. Investigation into behaviours in and performances of a R&D operating unit. Proceedings of the R&D Management Conference 2009, Viernna, Austria, 21-24 June. Fraunhofer. https://researchspace.csir.co.za/dspace/bitstream/handle/10204/3496/Brent_ d1_2009.pdf?sequence=1&isAllowed=y
Dos Santos, G. and Tokede, O. 3026. Last Planner System – from theory to implementation. ICEC 2016: Proceedings of the 10th Cost Engineering, Quantity Surveying & Project Management World Congress. International Cost Engineering Council. pp. 305–318.
Easterby-Smith, M., Thorpe, R., and Jackson, P.R. 2015. Management and Business Research. Sage.
Enshassi, A., Mohamed, S., and Abushaban, S. 2009. Factors affecting the performance of construction projects in the Gaza strip. Journal of Civil Engineering and Management, vol. 15. pp. 269–280.
Hamzeh, F.R. 2011. The lean journey: implementing the last planner system in construction. Proceedings of the 19th Annual Conference of the International Group for Lean Construction (IGLC 19). International Group for Lean Construction. pp. 379–390.
Kim, Y-W. and Ballard, G. 2010. Management thinking in the earned value method system and the last planner system. Journal of Management in Engineering, vol. 26. pp. 223–228.
Leal, M. and Alarcón, L. 2010. Quantifying impacts of Last Planner™ implementation in industrial mining projects. Proceedings of the 18th Annual Conference of the International Group for Lean Construction, Haifa, Israel. https://iglcstorage.blob.core.windows.net/papers/attachment-d5d9bfaf-19cf438c-83f9-cf463f018722.pdf
Monyane, T., Emuze, F., Awuzie, B., and Crafford, G. 2019. Challenges to Lean Construction implementation in South Africa. Proceedings of the Construction
Industry Development Board Postgraduate Research Conference, 2019. Springer. pp. 337–344.
Murguia, D. 2019. Factors influencing the use of Last Planner System methods: An empirical study in Peru. Proceedings of the 27th Annual Conference of the International. Group for Lean Construction (IGLC), Dublin, Ireland. Pasquire, C. and Hamzeh, F.R. (eds), pp. 1457–468.
Ningappa, G.N 2011. Use of Lean and Building Information Modeling (BIM) in the construction process; does BIM make it leaner? Georgia Institute of Technology.
Novinsky, M., Nesensohn, C., Ihwas, N., and Haghsheno, S. Combined application of earned value management and last planner system in construction projects. Proceedings of the 26th Annual Conference of the International Group for Lean Construction, Chennai, India. González, V.A. (ed.). pp, 775-785. https://iglcstorage.blob.core.windows.net/papers/attachment4b57bcae-e782-429e-9a9c-dcd57a6ed884.pdf
Page, C. and Meyer, D. 1999. Applied Research Design for Business and Management. McGraw-Hill Higher Education.
Porwal, V., Fernandez-Solis, J., Lavy, S., and Rybkowski, Z.K 2010. Last planner system implementation challenges. Proceedings of the 18th Annual Conference of the International Group for Lean Construction, Haifa, Israel . pp. 548–54. https://iglcstorage.blob.core.windows.net/papers/attachment-044f2268-53fb4c76-8aa0-919acdd12487.pdf
Samorow, D., Davies, K., Puolitaival, T., and Kestle, L. 2018. Last Planner System: Views of main contractors and subcontractors within the New Zealand construction industry. Proceedings of the 42nd Australasian Universities Building Education Association (AUBEA) Conference: Educating Building Professionals for the Future in the Globalised World. Vol. 1: Innovation. Do, K., Sutrisna, M., Cooper-Cooke, B., and Olatunji. O. (eds). pp. 269–278. https://www. researchbank.ac.nz/bitstream/handle/10652/4400/Samorow%2c%20D.%20 %282018%29.pdf?sequence=3&isAllowed=y
Sarhan, J.g., Xia, B., Fawzia, S., and Karim, A. 2017. Lean construction implementation in the Saudi Arabian construction industry. Construction Economics and Building, vol. 17, no, 1. pp. 46–69.
Saunders, M., Lewis, P., and Thornhill, A. 2016. Research Methods for Business Students. (7th edn). Pearson Education, Harlow.
Sørensen, H.t., Sabroe, S., and Olsen, J. 1996. A framework for evaluation of secondary data sources for epidemiological research. International Journal of Epidemiology, vol. 25. pp. 435–442.
Tayeh, B.A., Al Hallaq, K., Al Faqawi, A.H., Alaloul, W.S , and Kim, S.Y 2018. Success factors and barriers of last planner system implementation in the Gaza Strip construction industry. Open Construction & Building Technology Journal, vol. 12. pp. 389–403. doi: 10.2174/1874836801812010389
Tayeh, B.A., Hallaq, K.A., Zahoor, H., and Al Faqawi, A.H. 2019. Techniques and benefits of implementing the last planner system in the Gaza Strip construction industry. Engineering, Construction and Architectural Management, vol. 26, no. 7. pp. 1424–1436.
Vignesh, C. 2017. A case study of implementing Last Planner system in Tiruchirappalli district of Tamil Nadu - India. International Journal of Civil Engineering and Technology, vol. 8, no. 4. pp. 1918–1927
Zainal, Z. 2007. Case study as a research method. Jurnal Kemanusiaan, vol. 5, no. 1. https://jurnalkemanusiaan.utm.my/index.php/kemanusiaan/article/ view/165/158 u
Affiliation:
1School of Management Sciences, Unisa, South Africa.
Correspondence to: N.V. Moraka
Email: moraknv@unisa.ac.za
Dates:
Received: 1 May 2023
Accepted: 13 Nov. 2023
Published: January 2024
How to cite:
Moraka, N.V. 2024
Mining corporate boardrooms still a male club? Experiences and challenges faced by South African women.
Journal of the Southern African Institute of Mining and Metallurgy, vol. 124, no. 1. pp. 25–32
DOI ID:
http://dx.doi.org/10.17159/24119717/2789/2024
ORCID:
N.V. Moraka
http://orcid.org/0000-0002-1490-089X
by N.V. Moraka1
Synopsis
Calls for transformation in the mining sector are legislated. Whilst the composition of boards in terms of gender diversity and equal representation has improved, little is known on how women directors experience boardrooms. This research investigated the experiences of South African women in male-dominated mining boards. It questions why women remain marginalised in boardrooms, even when they are qualified as the men in their respective fields.
The experiences of South African women on male-dominated mining boards were investigated by means of a multiple case study using a qualitative research methodology. Interviews were conducted with 16 women and 12 men serving across six JSE-listed South African mining companies. The findings show that irrespective of their qualification and experience, women,s, contributions are often ignored, and they are assigned to more social roles. Regardless of race, all women experienced gender stereotyping. Strategies are required to ensure that board cultures embrace female talent, where women can effectively contribute to decision-making and maximize their talent. It is argued that gender and identity should be studied in relation to post-colonial history in African countries. Women have multiple, varying identities, and their experiences require a unique investigation that would enable strategies to overcome barriers, through the implementation of an appropriate diversity management programme.
Keywords women on boards, gender, identity, intersectionality, discrimination.
Introduction
The attraction and retention of women to positions in the mining industry is still a challenge (Makgala, 2020). The segregation of women in South Africa can be traced back to decades of colonialism followed by apartheid, which in combination with the system of mining exploration, largely excluded women from partaking in economic activities and meaningful occupations (Rungan, Cawood, and Minnit, 2005). Mining is a male-dominated space with deeply ingrained gender roles (Lahiri-Dutt, 2012). Mining played a major role in establishing gender roles and positions of power and influence in the South African economy. Since 2002, the industry has been forced by quota legislation (the Mining Charter) to transform its gender composition to include women at all levels, from underground to boardrooms. The recommendations of the Mining Charter suggest that female talent should be developed and nurtured in areas such as geology and mining engineering to improve female representation in these fields.
Despite the moral and business imperative, only a few companies have made significant strides in improving the number of women at board level, while many have no women, or only one or two woman board members (Moraka, 2018). Due to the slow progress, the Johannesburg Stock Exchange (JSE) has established a policy for gender representation as part of their listing requirements to extend pressure on compliance. As it stands, mining companies have just between 12−19% female representation on their boards. This may imply that there is some resistance to greater representation of women.
In the South African and African context there is little research that explores how women experience being board members, and in particular the reception given to women who are recruited to maledominated company boards. The purpose of the research reported here was to question why women remain marginalized on mining boards, to understand the experiences of women post recruitment, and how their identities affect their contribution to decision-making in boardrooms. Against this background, the project sought to determine the challenges that women of different races face in male-dominated sectors in a postapartheid and post-colonial environment. Moreover, appropriate research methodologies or approaches added value in studying the conditions of women as intersectionality issues are considered.
Intersectionality recognizes the importance of studying gender identities in a triad of ‘race-class-gender’, and
regards how the triad impacts and intersects (Dlamini, 2013). In the same light, Patricia Hill Collins called for the realization that race, class, and gender are interrelated structures of oppression (Collins, 1998). To study oppression by considering intersectionality, Nkomo and Ngambi (2009) proposed that post-colonial theory, graphically depicted in Figure 1 as a conceptual frameworks, should apply a meso-level analysis to consider the unique socio-historical, political, economic, and cultural context in which to study gender and identity.
Intersectionality offers a dimension in that the research opportunity should take cognisance of the traditional roles men and women play, and how these roles affect gender identities and social constructions. It has thus become imperative for a diverse country, such as South Africa, to recognize that gender intersects with class, race, and ethnicity, and therefore requires intersectional analysis (hooks, 1981; Collins 1998; Dlamini, 2013, 2016; Nag, Arena, and Jones, 2022) to understand how this affects gender studies and the experiences of women (Nag, Arena & Jones 2022; Nkomo and Ngambi, 2009).
Exploring intersectionality is a suitable approach to understanding the construction roles of men and women in a unique South African context (Nkomo and Ngambi, 2009), and to study how these constructions have changed, or not, in boards of directors. A research gap signifies that little attention has been paid to women’s experiences in management (Nienaber and Moraka, 2016), the experiences of women in leadership positions (Dlamini, 2016; Nkomo and Ngambi, 2009), and women on boards (Moraka, 2018). The minimal representation of women on mining boards has provided the opportunity to investigate why women remain marginalized in leadership positions and why those appointed are not deemed to be contributing to the effectual change of board compositions. Intersectionality sees the social construction of identities as being affected by the uniqueness of each country and its cultural expectations. In the case of boards, social identity theory has been applied to gain an understanding of board dynamics and how different members relate to others from diverse groups.
Social identify theory (SIT) provides a benchmark for the study of board dynamics and how each member of the group may integrate with or disengage from other board members. SIT (Tafjel and Turner, 1979) holds that group members compare themselves with others along demographic lines, and that the extent to which they identify with the group depends on how much they have in common with other members.

Gender is one salient feature that is associated with different groups and is used to place persons into different categories (Rothbart and John, 1985). However, race and class are paramount to categorize people or form the basis of their identities, and cannot be separated from gender (Dlamini, 2016; Nkomo and Ngambi, 2009). SIT further argues that in-group members are expected to have shared interests and objectives, and therefore cooperative behaviour should follow (Joshi and Jackson, 2003). The assumption of SIT is that male board members may demonstrate similar behaviour consistent with their individual interests. Consequently, out-groups, such as female board members, may easily be marginalized within the group, and the majority (male board members) may have a stronger influence by virtue of their greater number (Asch, 1955). Torchia, Calabró, and Huse (2011) maintain that members of the out-group, usually women, may be referred to as tokens, and as members of the out-groups or tokens, women may be doubted, or even mistrusted. As a result of such labelling, female directors may feel uncomfortable, isolated, and full of selfdoubt (Mathisen, Ogaard, and Marnburg, 2013) and not able to exert much influence in the boardroom. According to SIT, there will typically be a tendency to listen more to the majority’s (in-group) views and reject the ideas that come from minority representatives (out-group). The same as ‘who has a voice and who not’, and the fact that people identify with people like themselves, in line with SIT. In efforts to deal with their out-group status, some women may build alliances with other directors (Huse and Solberg, 2006) or simply disengage. Since out-group tendencies are hard to break, as women are generally separated from the inner circle, for example, decisions are made before meetings, on the golf course, or at a dinner party with just the ‘boys’ attending. This makes it difficult for women directors to influence board decisions (Konrad, Kramer, and Erkut, 2008:154).
Studies on women in leadership positions or on boards have predominantly followed quantitative research methods in a quest to determine the financial impact of gender diversity (Nkomo and Ngambi, 2009). Qualitative research was regarded as suitable for this study, as it aimed to investigate the challenges and experiences of women serving on mining boards. As substantiated by Scott (2010, pp. 234−235), qualitative research is important for understanding people’s experiences of discrimination in particular settings and for probing women’s own interpretations and understanding of their situations. Qualitative research is also invaluable for exploring the policy contexts that influence the opportunities and constraints that shape people’s lives. Thus, qualitative research can help inform the way that quantitative researchers (some of whom are feminists) interpret what they write. The research method undertaken in this study comprised in-depth interviews, and the approach was a qualitative methodology using a multiple case study design, where women and men from different mining companies formed part of the sample.
Stanley (1990, p. 12) suggests that every possible method available should be used for investigating the state of women in marginalized societies. Qualitative methods are particularly favoured for their in-depth interview strategy, which is believed to achieve an ‘equal’ relationship between the researcher and the respondent (Letherby, 2015). In-depth interviews allowed the respondents to share their experiences in their own words (Stanley and Wise, 1983); becoming actively involved in the research process, thereby reducing the power imbalance between the interviewer
and interviewee (Stanley and Wise, 1983). Various researchers have further noted the significance of in-depth interviews, which encourage different questions that place women’s voices at the centre of the research (Hesse-Biber, 2014) and ensure that research is undertaken for women, rather than about women (Oakley, 1981). Research placing women at the centre of development allows the methodology and the research process to be transparent and ensures that the findings are clearly presented and open to critical analysis (Hesse-Biber, 2014).
A non-probability purposive sampling strategy was used to select companies and participants in this research. This strategy was useful as it enabled the researcher to use own judgement in the selection process (Hesse-Biber, 2014). Eisenhardt’s (1989, p. 545) recommendation of cases (companies) between four and ten was used as a guideline for ensuring representativity of the population. To eliminate the difficulties of an unmanageable study in generating theory and ensuring empirical grounding (Perry, 2001, p. 313) six listed mining companies were selected. JSE-listed mining companies are leaders globally in terms of representations of women on boards (PWC, 2014). Thus, listed mining companies provided sound sources of information to include the best and worst performers that could be contrasted and compared in a quest for vigorous theoretical replication and thorough insight.
Three listed mining companies with three or more women on their boards were regarded as data-rich cases from which collect best-practice results (see Patton, 1990). The other three mining companies with no, one, or two women directors were considered as contrast cases. This multiple case study design allowed comparison of results within and contrasts between these two groups (Saunders, Lewis, and Thornhill, 2012).
The average size of a mining company board in South Africa is eight, and for this research three to six board members per company were interviewed. Board Chairs and CEOs granted permission for their boards to partake in the research. The selection criteria were based on availability of board members in the chosen companies and snowballing sampling was used to secure access to members. Informed consent was obtained for each respondent to partake in the research (Hesse-Biber, 2014) and anonymity and confidentiality of their responses were assured. The multiple-case study approach is illustrated diagrammatically in Figure 2.
A total of 16 women participated in the study (11 Black, 1 Indian, 2 White, and 2 Mmxed race) and 12 men (6 Black, 1 Indian, 3 White, and 2 mixed race). The total racial and gender profile consisted of 17 Blacks (women = 11, men = 6), 2 Indians (1 woman and 1 man), 5 Whites (women = 2, men = 3) and 4 mixed race (women = 2, men = 2) (Tables I and II).

Table II
Position profile of respondents
Positions
Board Chair
Chief Executive Officer
Independent Non-Executive Director
Senior Executive
Executive Director
Data analysis adhered to the measures of trustworthiness prescribed for qualitative research, which implies ensuring the dependability, credibility, construct validity, transferability, and conformability of the findings, data, and research process (Lincoln and Guba, 1985).
The interview transcript data was interpreted through thematic coding exercising member checking, which entails categorizing, analysing, and recording themes by organizing the data, and in describing it in rich detail (Braun and Clarke, 2006, p. 79). Coding was used to assign codes into categories and the respondents’ answers were clustered into a limited number of categories (Cooper and Schindler, 2008, p. 424).
The coding process followed Hesse-Biber’s (2014, p. 320) suggestion of the necessity of co-coding research to preserve conventional objectivity, while at the same time giving a voice to women or any oppressed groups. The co-coding process involved having others, who were not involved in the study hypothesis, code the responses (Hesse-Biber, 2014, p. 320). An independent qualitative analyst, who is a professor in psychology and nursing, a different field to that of the authors, whose expertise is in business management and sociology, became involved in co-coding the data from the nine initial interviews, which resulted in coding triangulation using two coding methods. Some coding was done electronically in Atlas.ti, while during the qualitative analysis, the transcripts were manually coded, after which they were independently studied and general themes were formulated.
All 28 interview transcripts were uploaded into Atlas.ti for thematic coding and to identify emerging themes. This process was done both electronically and manually, in conjunction with a peercoding partner as explained earlier.
Race and gender
3 men (Black), 2 women (mixed race, Black)
4 men (2 White, 1 Indian, 1 Black]
9 women (8 Black, 1 White), 2 men (Black, mixed race)
3 women (2 Black, 1 White), 1 man (mixed race)
2 women (Indian, mixed race)
2 men (Black)
The main objective of thematic coding was to formulate brief expressions of sufficient accuracy to remain grounded in the text, and sufficient constructs to provide a conceptual understanding. The development of themes was grouped collectively relating to the conceptual connections. A theme is an expression of the latent content of text whereby a condensed meaning unit, a code, or a category can fit into more than one theme (Graneheim and Lundman, 2004, p. 107). This phase involved identifying patterns in the emerging themes and creating a structure that would be necessary to identify converging ideas. Pseudonyms were used to protect the identity of participants, in accordance with research ethics, when reporting quotes in the findings and discussion session.
It was found useful to employ the thematic structure of the mesolevel framework of Nkomo and Ngambi (2009), as discussed earlier, to present the themes. This model was not discussed with any interviewees, and the structured questions for each interview were not drawn from the framework. The personal experiences of female and male leaders were investigated using their experiences post recruitment to the boardroom. The framework illustrated in Figure 3 confirms that the themes that emanated from the analysis did not contradict the meso-level framework.
Nkomo and Ngambi’s (2009) proposed that social issues be considered in studying gender and identity and that the sociohistorical, political, cultural, and economic context of a country be included. This was found to be of importance in the current study, as the themes that emerged were strongly ingrained with patriarchal

views and gender stereotypes. Mining, historically, was (and still is) largely male-dominated, thus women are likely to be confronted with stereotyping and this must be investigated (Moraka and Jansen van Rensburg, 2015). At board level, where woman leaders are expected to contribute at a cognitive and strategic level, it was found that the stereotypes of gender and race also existed. The extent of those stereotypes is discussed in theme 1 below, which is related to the position of women at a social level.
Theme 1: Patriarchal views and gender stereotypes
Patriarchal views and gender stereotypes are reported in the context in which men positioned women in terms of their professional skills, inter alia what they could or could not do (Lari, Al-Ansari, and El-Maghraby, 2022). Stereotypes imply that women may be expected to perform only certain roles in society. Cotterill, Jackson, and Letherby (2007) affirmed the probability that women in male-dominated professions were likely to face a ‘double-bind’ position. Data supports this, as women are expected to be efficient professionals with a high level of expertise but are simultaneously expected to act ‘womanly’ by demonstrating feminine compassion, care, and support, while showing subordination to male board members. The double-bind position reaffirms the arguments of the social role theory, which holds that men and women would act according to the stereotypes and beliefs associated with the social roles they occupy (Eagly, 1987; Lari, Al-Ansari, and El-Maghraby, 2022). However, not all women conform to the attributes of the stereotypical expectation of feminine qualities. For example, at the time of the interview, Olivia (Black female) did not intend to marry and have a family and did position men as in need of care, which she was not willing to provide.
‘I am not married; I don’t have children. In life you make choices, and you must embrace the consequences of those choices and like I always say that I hardly have time to go do my nails, where am I going to get the time to look after a human being who depends upon me, because men can be like babies. I find that in relationships and marriages it’s mostly the woman who sacrifice a lot. She must dim her life somewhat so that she doesn’t blind the man, chase the man away and I’m not sure if I’m prepared to do that, with the children, with kids as I say, I’m selfish with my time and my career because I’m just growing so much, and I don’t want to sacrifice the opportunities to grow’ (Olivia).
Regardless of Olivia’s position on choosing a career and remaining unmarried, it was clear that the men on boards who participated in the study still expected women to maintain stereotypical views and accept stereotypical roles. The quote below by Kate (Black female) explains how men in boardrooms perceive women in terms of societal role expectations.
‘The woman is either the cleaner or the PA. Men in boardrooms have never experienced a woman in power or in [an executive] position. They tend to think we’re good for HR and others, not in a technical role, not in a mining engineering role, not in an accounting role, not in a legal role’ (Kate).
Jago and Vroom (1982) cautioned on the different expectations related to the behaviour of men and women in boardrooms. It was found that men held women to their expectations, although they did not expect the same from themselves. The quote below by John (Indian male) clearly demonstrates that women were considered ‘good’ if they contributed to effective team management, while also behaving in a womanly manner. Yet their contributions in boardrooms was mainly overlooked.
‘Their ability to deal with crisis is much better, I notice. They are quite calm. They are very good managers of their teams, and they stand by their teams, and they fight for the team, and they are more prone to speak their minds’ (John)
While the assertions made by John may be regarded as the inherent strengths of women, these expectations reinforce the stereotypical roles that men are rational, aggressive, dominant, and confident, while women are emotional (Diekman and Schneider, 2010; Hochschild, 1990). This undermines the ability of women to be regarded as confident and able to contribute at a cognitive level. The following quote from Busi, a Black woman, shows that the responsibilities of and expectations from women differ from those of men on boards. Furthermore, she demonstrates that women have socially constructed responsibilities which they are expected to execute, but it can be ‘cautioned’ that these responsibilities stereotypically define women as emotional, and therefore, not rational.
‘Even on the health and safety side there’s kind of ideas we bring forward other than the ideas around safety that have to do with technical aspects of safety. [Women] bring a more humane aspect of safety, how you get your board into safety consciousness by the miners and so on’ (Busi)
These findings demonstrate that women are often associated with the social role they occupy, and are expected to accept their ‘talent’, which further reduces their board presence as value-adding members. Commonly, despite the male participants reporting that they expect women to display their talent in the boardroom, most women felt that their contributions were ignored (as discussed later). Women faced a double bind, because irrespective of being assertive (which men said they expected from them) or less assertive, they were assessed negatively. Letherby (2015) opined that women should be regarded as value-adding board members, and not just because of the roles associated with stereotypical gendered emotion and work. The results demonstrated that women are placed in contradictory role expectations, which may ultimately affect their personal and professional lives should they fail to even attempt the two simultaneously.
Nkomo and Ngambi (2009) recommend that gender studies in Africa should consider individual identities, such as personal characteristics, attitudes, behaviours, and cultural and gender identity. Although unique characteristics were identified in each board member in the sample, similar characteristics were identified among the male members (even between White and Black males), consistent with the SIT. Despite their race, male board members appeared to display similarities in thinking, attitudes, and behaviours. Combined with these attitudes was the board composition that had men as the majority (the in-group), which automatically rendered women as an out-group. Thematic description demonstrated that most women were appointed as tokens to boardrooms. Most Black women believed their appointment to be a response to legislation, and the disregard of their talent reinforced their belief of being categorizsed as token appointees.
Regardless of their numerical representation in companies, even in companies with a critical mass (three or more women), the thematic analysis demonstrated that women across cases, particularly Black women whose quotes appear in this theme, had similar experiences
and feelings regarding tokenism, which was confirmed by how men related to them and treated them on boards.
Khanyi, a Black woman, provided evidence of how women are labelled token appointees. She explained how male directors dismissed their skills and contributions because men put women on these boards to increase numerical representation.
‘They don’t care about your skills … but for me I believe I need to put that away because I’ve got a skill and I’ve got a contribution to make not because I am just a woman’ (Khanyi)
A Black female, Grace, mentioned that she did not even know why she was chosen for the appointment, although she possessed extensive experience on boards (10 years). By implication, she felt that she was not suitably and appropriately qualified for a position in the mining sector.
‘I was quite upfront to them to say I don’t know what made you guys decide to get a candidate of my stature because I’m not going to lie to you and say I understand your business, I don’t. But I will try my level best to do what I can …’ (Grace).
It was found that SIT acted as an enabler of token appointments to boards, mainly so that men can retain their in-group status. According to tokenism theory, if any board appoints one or two directors especially to comply with legislation, this can be regarded as tokenism (Arfken, Bellar, and Helms, 2004; Branson, 2007). The underlying argument of tokenism is that it is hard to believe that the appointment of just one woman is made so that she was able to contribute (Broome, 2008).
The literature suggests that tokens on boards face various challenges, such as being ignored and their contributions being dismissed by the men (Glass and Cook, 2016). This was reported by Grace, a Black woman, who described that despite her 15-years’ board experience, she still felt undermined on boards, where her opinions and suggestions were disregarded in meetings, and she felt that she was there to tick a box.
‘I felt that the was that tendency of condescending, where two members of the board who are the executive board members feel that the board is there just rubber stamp what they’ve done and what they are doing. When you then start questioning things then it becomes an irritation. When you come up with suggestion, there is no follow-through on the suggestion. All those kinds of things and I felt frustrated every time there was going to be a board meeting because I truly feel that we are not taken seriously as board members and there is this element to [ensure that] we’ve ticked the box. We have black people in the board, it’s not really a business imperative. I didn’t see us adding value and that became the key factors that made it possible for me to say I just don’t care at this point but I’m not going to see myself sitting in this board forever’ (Grace)
These assertions describe in a powerful way the lack of talent recognition of women, poor talent management, and how appointing women as tokens enables men to hold power as dominants and upholds their ability to influence decisions and retain power and influence (Penner, Torro-Tulla, and Huffman, 2012). It thus become obvious that the attitudes of men in boardrooms affects the retention of female talent, talent that is disregarded.
Efforts to conduct research for women and other marginalized groups with the aim of finding the subdued groups’ voices and investigating ways of thinking that have been undervalued by
dominant, patriarchal forms of knowledge, while encouraging social change and justice (Hesse-Biber, 2014) are imperative. Findings demonstrate that the way of thinking of men on boards was generally intended to silence women’s voices and undermine their talent (Moraka, 2018). The women participants reported on how important it was to them for their contribution to count in boardroom decisions. According to Mary (a Black woman), the dismissal of the voice of women was apparent. The disregard of women’s inputs to board decisions contributed to low morale and their confidence was affected by the culture of resistance.
‘It is just people being undermined; that happens a lot. That is a big problem because there are undertones in the boardroom, some people are more respected that others and some people when they speak, they are not respected. Some views are more important than others. The bullies win more than the people that are not bullies. Women who are not confident cannot succeed in the boardroom, so confidence as a big thing. If you do not have it, it is a big thing for you as a person because of the nuances and the undertones. There are people, directors who are extremely dominant. All the boards, there are directors who dominate more than others. You’re going to find that in everybody, because [when] you speak, they don’t know what you were going to talk about and then they just chop you down. They do that, they undermine you and they cut you to sizes’ (Mary).
Findings affirm that, on boards, men have the privilege of voice, and silence women by being unreceptive to their contributions. This is still the case 30 years after Eagly (1987) reported that although women were recruited to boards, they were still denied their voice, which affected their retention as board members. Afrikaansspeaking (White) men seemed to be the most powerful, most dominant, and influential individuals in boardrooms. This explains why Black women felt like they had to earn the trust of White men. Although Black men also ignored the talent of women, for most Black women, working hard to earn the trust of White men was paramount to being accepted as members of the in-group (men –who were dominantly White). Helen, a Black female explains this: ‘In a mining space – it is a boy’s club. Sometimes it is difficult for them to accept they are wrong coming from a Black woman who is not a miner. Those guys have been in that industry for 50 years and they feel there’s nothing you can tell them. You also come from an environment that was oppressive to women. African culture is not supportive of strong women’. (Helen)
These findings demonstrate that women who break the glass ceiling only find another layer of unreceptive behaviour from men, who can exercise their right of voice and remain dominant. While women are there as token members, men have the autonomy to use their power (Eagly, 1987; Motshegwa, 2013).
Nkomo and Ngambi (2009) proposed that organizational levels of studying gender and identity should encompass institutional structures, and practical organizational structures.
We found that the organizational outlook of each mining company was linked to the overall industry history as a male-dominated space. Another revelation was that the mining industry’s historical legacy was used purposively to delay transformation, inferring that little representation of women on boards was to be expected and that no attention was given to talent management.
‘It’s a male-dominated space and white male, for that matter. That did not bother me because for as long as I remember being in private space, I have always been one woman, 13 men. It’s always been like that; I just believe that most top positions in the country are still male dominated. Ask me why, I can’t tell you, but that’s the nature of the beast’- (Grace).
While findings suggest that boards of mining companies are similar to others in terms of composition, Caroline (mixed-race) and Mary (Black woman) took it further, explaining that the mining sector is preconditioned with its own indoctrinated mind-set that influences how women behave and face performance pressures from a hostile environment.
‘We swear, we could shout at each other across the table’ (Caroline).
‘The culture is male and steep[ed] in all traditions. When I came here, I became very confused because to a very large extent I felt my brain was clouded by the environment. It was not even clouded; it was polluted’ (Mary)
It was found that women were deeply affected by the culture of mining, which impacted mostly the confidence of Black women and influenced their ability to effectively utilize their talent. Indeed, many studies have proved that the confidence of women entering previously male-dominated industries would be affected (Budhwar and Sparrow, 2002; Mathisen, Ogaard, and Marnburg, 2013). However, this does not explain how and why they were affected.
Nkomo and Ngambi (2009) found that while African women in leadership positions are substantially affected by gender-related social and structural organizational hurdles in their careers, they are also affected by race. Conversations with respondents in this research showed that race, class, and gender intersect and affect women and men in different ways. Much has been reported on Black women’s experiences, more than women of any race, regarding subtle discrimination, and sometimes overt discrimination. A Black woman, Busi, reported that White women had closer relationships with other White board members (including men). Busi believes that these relationships provided White women with an edge over Black women. It could then be assumed that White women did not experience race discrimination, but experienced gender discrimination and stereotyping.
‘The relationship that the white board members have [with] the white executives, they have very robust kind of special relations, whereas I know them very well, I have a good relationship with them, but they will not invite me to their home’. (Busi).
Black women felt they worked harder than any other group to earn respect from their colleagues. According to Juliet, Black women face these challenges regardless of the industry in which they are appointed. Findings demonstrate that Black women’s identities were still subjected to different expectations and stereotypes. It was also noted that the confidence of Black women was negatively affected in the process.
Various scholars (hooks, 1981; Collins, 1998; Dlamini, 2016; Hekman, 2015; Nag, Arena, and Jones 2022) have reported that Black women have not yet experienced freedom and equality, and consequently, even if they are appointed to boards, they are still exposed to inequalities even though they are suitably qualified for the job. These findings support a strong suggestion that Black women face triple oppression as a result of their gender, race, and class (Collins, 1998; Dlamini, 2017).
This article contributes in three ways, namely theoretically, methodologically, and through it’s implications for management. Theoretical contributions are made to research on women on boards, particularly in Africa, an area which is sorely lacking (Nienaber and Moraka, 2016). The investigation into the experiences of women in leadership positions shows that the talents of women, regardless of their qualifications and experience, are not optimally used. This adversely affects their confidence, and they are classed as minorities where their voices are limited, or are forced to become congruent to the men who are in the majority, in fear of marginalization. The theoretical contribution of this article highlights that women are also categorized in classes, and race plays a big role, although all women are affected by gender stereotyping.
Stanley (1990) recommends that the situation of women in a patriarchal society should be studied using every means possible. As such, this study adopted an approach that presents the unique methodological contribution of investigating women’s issues, considering how South African history has affected gender identities and behavioural patterns. Indeed, the historical domination of the mining industry by men would affect how male leaders relate to women. Indeed, it was found that among all races, Black women cited perpetual inequalities, which they attributed to their race, gender, and class.
In practice, regarding managerial implications it can be suggested that the representation of women on mining boards should be improved. The pool of women ready to serve on boards is available, and opportunities should be made available for women to apply for board positions. This research showed that women want to contribute, they want to be valued and feel like they are contributing.
This research suffered from several limitations. Firstly, with Black board members formed most of the sample, with limited participation from other racial groups. Had more White, Indian, and mixed-race women participated in the study, other interesting findings could have been established. Care was taken not to assume that women on all boards face similar prejudice. Thus, future research should focus on the experiences of White women and of other races who did not comment about the extent of prejudice in boards.
Low female representation on boards across the world suggests that the talents of women are untapped, and this may leave societies impoverished (Nienaber and Moraka 2016). This article shows that although a few women are recruited to South African mining boards in the pursuit of balanced representation, women still face structural inequalities, as well as gender discrimination. These women are merely token appointees to satisfy the pressure for inclusion which is required by legislation. A rhetorical statement that the industry has been historically male-dominated, and that it is to be expected that women would face gender stereotyping, perpetuates the industry bias and inequalities.
The inequalities are further perpetuated by social expectations, which determine gender-role stereotypes, whereby the expectations are higher for women. A double--ind position women face is that they are expected to be experts as well as emotional beings, yet their expertise is ignored. The intersectionality of gender, particularly with race, was evident in this study where male counterparts regarded Black women as part of the lower class on boards. These factors further pressurized Black woman directors to assimilate to
the male culture, specifically to earn the respect of White males, and this validation-seeking made them feel that they had to work harder than the rest, again perpetuating inequalities.
It is suggested that the barriers to the development and retention of women on boards can be eradicated through a comprehensive gender diversity management programme that encompasses ‘an equality culture’ related to the recruitment, development, and retention of directors. The culture of equality should be reinforced in the following manner.
1. Women should be appointed on merit and not to satisfy social pressures
2. Women should insist on be ‘heard’ in board decisions and should participate in recruitment to ensure the entry of more women
3. There should be a focus on the development of female board members where they are empowered post-recruitment. Retention gets a lot of attention when development is planned, so that women can overcome the barriers that exclude them from participating
4. Diversity workshops should be held to encourage the acknowledgement of varying viewpoints and differences in race and culture
5. Women’s support programmes should be established
6. Identity and self-mastery workshops should be held where each individual board member may recognize their strengths and have the confidence to contribute to boardroom. decision-making.
It is also important for individual board members to view all women as value-adding members in the boardroom.
References
Arfken, D., Bellar, S., and Helms, M. 2004. The ultimate glass ceiling revisited: The presence of women on corporate boards. Journal of Business Ethics, vol. 50, no. 4. pp. 177–186.
Asch, S.E. 1955. Opinions and social pressure. Scientific American, vol. 193, no. ??. pp. 31–35.
Bell Hooks. 1981. Ain’t I a Woman: Black Women and Feminism. South End Press, Boston, MA.
Branson, D.M. 2007. No seat at the table: How corporate governance and law keep women out of the boardroom. New York University Press, New York.
Braun, V. and Clarke, V. 2006. Using thematic analysis in psychology. Qualitative Research in Psychology, vol. 3, no. 2. pp. 77–101.
Broome, L.L. 2008. The corporate boardroom: Still a male club. Journal of Corporation Law, vol. 33. no. 3. pp. 665–680.
Budhwar, P. and Sparrow, P. 2002. An integrative framework for understanding cross-national human resource management practices. Human Resource Management Review, vol. 12, no. 3. pp. 377–403.
Catalyst. 2021. Quick take: Women on corporate boards. https://www.catalyst.org/ research/women-on-corporate-boards/ [accessed 19 July 2022].
Collins, P.H. 1998. Fighting words: Black women and the search for justice. University of Minnesota Press, Minneapolis, MN.
Cooper, D.R. and Schindler, P.S. 2008. Business Research Methods. 10th edn. McGraw-Hill, New York.
Cotterill, P., Jackson, S., and Letherby, G. 2007. Challenges and Negotiations for Women in Higher Education. Springer, Dordrech.
Diekman, A.B. and Schneider, M.C. 2010. A social-role theory perspective on gender gaps in political attitudes. Psychology of Women Quarterly, vol. 34, no. 4. pp. 486–497.
Dlamini, N.J. 2013. The impact of the intersection of race, gender and class on women’s CEO’s lived experiences and career progression: Strategies for gender transformation at leadership level in corporate South Africa. PhD thesis, Graduate School of Business Leadership, University of South Africa.
Dlamini, N.J. 2016. Equal but Different, Women Leaders’ Life Stories. Overcoming Race, Gender, and Social Class. Sifiso Publishers, Johannesburg.
Eagly, A.H. 1987. Sex Differences in Social Behaviour: A Social-role Interpretation. Lawrence Erlbaum, Hillsdale, NJ.
Eisenhardt, K.M. 1989. Building theories from case research. Academy of Management Review, vol. 14, no. 4. pp. 532–550.
Glass, C. and Cook, A. 2016. Leading at the top: Understanding women’s challenges above the glass ceiling. Leadership Quarterly, vol. 27, no. 1. pp. 51–63.
Graneheim, U.H. and Lundman, B. 2004. Qualitative content analysis in nursing research: Concepts, procedures, and measures to achieve trustworthiness. Nurse Education Today, vol. 24, no. 2. pp. 105–112.
Hekman, S. 2015. Simone de Beauvoir and the beginnings of the feminine subject. Feminist Theory, vol. 16, no. 2. pp. 137–151.
Hesse-Biber, S.N. 2014. Feminist Research Practice: A Primer. 2nd edn. Sage, Thousand Oaks, CA.
Hochschild, A.R. 1990.The Second Shift. Piakus, London.
Huse, M. and Solberg, A.G. 2006. Gender related boardroom dynamics: How women make and can make contributions on corporate boards. Women in Management Review, vol. 21, no. 2. pp. 113–130.
Jago, A.G. and Vroom, V.H. 1982. Sex differences in the incidence and evaluation of participative leader behaviour. Journal of Applied Psychology, vol. 67. pp. 776–783.
Joshi, A. and Jackson, S.E. 2003. Managing workforce diversity to enhance cooperation in organizations. International Handbook of Organizational Teamwork and Cooperative Working. West, M.A., Tjosvold, D., and Smith, K. (eds). Wiley, London. pp. 277–296.
Konrad, A.M., Kramer, V.W., and Erkut, S. 2008. The impact of three or more women on corporate boards. Organizational Dynamics, vol. 37, no. 2. pp. 145–164.
Lahiri-Dutt, K. 2012. Digging women: Towards a new agenda for feminist critiques of mining. Gender, Place and Culture. A Journal of Feminist Geography, vol.19, no. 2. pp. 193–212.
Lari, N., Al-Ansari, M., and El-Maghraby, E. 2022. Challenging gender norms: women’s leadership, political authority, and autonomy. Gender in Management: An International Journal, vol. 37, no. 4. pp. 473–493.
Letherby, G. 2015. Gendered-sensitive method/ologies. Introducing Gender and Women’s Studies. Robinson, C. and Richardson, D. (eds). Palgrave, London. pp. 76–92.
Lincoln, Y.S. and Guba, E.G. 1985. Naturalistic Inquiry. Sage, Beverly Hills, CA. Makgala, T. 2020. WiMSA shines a light of the future of women in mining. Mail & Guardian, 7 August 2020. shines-a-light-on-the-future-of-women-in-mining/https://mg.co.za/special-reports/2020-08-07-wimsa[accessed 4 April 2023].
Mathisen, G.E., Ogaard, T., and Marnburg, E. 2013. Women in the boardroom: How do female directors of corporate boards perceive boardroom dynamics. Journal of Business Ethics, vol. 116, no. 1. pp. 87–97.
Moraka, N.V. 2018. An African feminist study of talent management practices applied to improve gender equality in JSE-listed South African mining boards: A multiple case analysis. PhD thesis, University of South Africa.
Motshegwa, L. 2013. Women vital for the future of mining. http://www.cnbcafrica. com/insights/special-reports/mining/women-in-mining-make-good-businesssense/ [accessed 12 July 2014].
Nag, D., Arena, D.F., and Jones, K.P. 2022. How promotion loss shapes expectations of discrimination: A intersectional approach Gender in Management: An International Journal, vol. 37, no. 4. pp. 441–456.
Nienaber, H. and Moraka, N.V. 2016. Feminism in management research: A route to justly optimise talent. Acta Commerci, vol. 16, no. 2. pp. 139–163.
Nkomo, S.M. and Ngambi, H.C. 2009. African women in leadership: Current knowledge and a framework for future studies. International Journal of African Renaissance Studies, vol. 4, no. 1. pp. 31–48.
Oakley, A. 1981. Interviewing women: a contradiction in terms. Doing Feminist Research. Roberts, H. (ed.). Routledge, London.
Patton M.Q. 1990 Qualitative Research and Evaluation. 2nd edn. Sage,.ewbury Park, CA.
Penner, A.M., Toro-Tulla, H.J., and Huffman, M. 2012. Do women managers ameliorate gender differences in wages? Evidence from a large grocery retailer. Sociological Perspectives, vol. 55, no. 2. pp. 365–381.
Perry, C. 2001. Case research in marketing. The Marketing Review, vol. 1, no. 3. pp. 303–323.
PWC. 2014. Mining for talent: A study of women on boards in the mining industry by WIM (UK) and PWC. https://www.pwc.com/gr/en/publications/assets/ mining-for-talent.pdf [accessed 6 November 2015].
Rothbart, M. and John, O.P. 1985. Social categorization and behavioural episodes: A cognitive analysis of the effects of intergroup contact. Journal of Social Issues, vol. 41, no. 3. pp. 81–104.
Rungan, S.V., Cawood, F.T., and Minnitt, R.C.A. 2005. Incorporating BEE into the new mineral law framework for the South African mining industry. Journal of the South African Institute of Mining and Metallurgy, vol. 105, no. 11. pp. 735–744.
Saunders, M.N.K., Lewis, P., and Thornhill, A. 2012. Research Methods for Business Students. 6th edn. Pearson, Harlow.
Scott, J. 2010. Quantitative methods and gender inequalities. International Journal of Social Research Methodology, vol. 13, no. 3. pp. 223–236.
Stanley, L. and Wise, S. 1983. Breaking Out: Feminist Consciousness and Feminist Research. Routledge, London.
Stanley, L. 1990. Feminist Praxis: Research, Theory and Epistemology in Feminist Sociology. Routledge, London.
Tajfel, H. and Turner, J.C. 1979. An integrative theory of intergroup conflict. The Social Psychology of Intergroup Relations. Austin, W.G. and Worchel, S. (eds). Brooks/Cole, Belmont, CA. pp. 3–47.
Torchia, M., Calabró, A., and Huse, M. 2011. Women directors on corporate boards: From tokenism to critical mass. Journal of Business Ethics, vol. 102. pp. 299–317. u
Affiliation:
1Department of Geosciences, Midlands State University, Gweru, Zimbabwe.
2Department of Earth Sciences, Stellenbosch University, Stellenbosch, South Africa.
3School of Earth and Environmental Sciences, Cardiff University, Wales.
Correspondence to: A. Mamuse
Email: mamusea@staff.msu.ac.zw
Dates:
Received: 30 Jan. 2023
Revised: 25 Aug. 2023
Accepted: 23 Oct. 2023
Published: January 2024
How to cite:
Mamuse, A., von der Heyden, B.P., and Blenkinsop, T. 2024
Zimbabwe’s coloured gemstone endowments – A regional geological overview.
Journal of the Southern African Institute of Mining and Metallurgy, vol. 124, no. 1. pp. 33–42
DOI ID:
http://dx.doi.org/10.17159/24119717/2600/2024
ORCID:
B.P. von der Heyden
http://orcid.org/ 0000-0002-4006-9278
by A. Mamuse1, B.P. von der Heyden2, and T. Blenkinsop3
Synopsis
Zimbabwe hosts a varied array of coloured gemstones. With the exception of emerald deposits and several world-class pegmatites, few of the gemstone occurrences have received detailed attention from the scientific or mineral exploration communities. In the present contribution we summarize the status of knowledge of the gemstone deposits and occurrences in Zimbabwe, paying particular attention to the geological settings in which they were formed. Synthesis of this regional geological approach reveals that there may be significant exploration potential for further gemstone occurrences, particularly in the extensive pegmatite fields and in Al-enriched orogenic belts that have undergone greenschist to granulite facies metamorphism. Further socio-economic and developmental initiatives will aid in optimizing the value generation from this important subsector.
Keywords
Zimbabwe, coloured gemstones, pegmatites.
Introduction
A gemstone is a mineral, rock, or other material that is prized for its beauty, durability, and rarity. Coloured gemstones are gemstones other than diamond (GIA, 1999); an alternative definition to the older subdivision that recognized precious (superior) versus semi-precious (inferior) gemstones (GIA, 1999; Lurie, 2000). Diamond, emerald, ruby, sapphire, and pearls were considered precious and the rest of the gemstones such as amethyst, tourmaline, aquamarine, citrine, and garnet were designated semi-precious (Lurie 2000). In the newer, preferred GIA (1999) definition, gemstones other than diamond include amber, ivory, and coral, which are organic materials (GIA, 1999; Lurie, 2000), thus gemstones need not necessarily be inorganic and crystalline.
Although Zimbabwe has a significant gemstone endowment, the country is better known for its platinum group metals, chromite, gold, diamond, and coal resources (Bartholomew 1990). There is less awareness of the country’s non-diamond (coloured) gemstone endowment. A notable exception is the global acclaim of the exquisite green Sandawana emeralds, discovered in 1956 (Tyndale-Biscoe, 1968; Bartholomew, 1990), which firmly established the country as one of the emerald capitals of the world. Zimbabwean aquamarine and alexandrite have also earned global recognition, and are mentioned in international general gemmology textbooks such as Cipriani and Borelli (1986) and Read (2005). Other coloured gemstones, including amethyst, ruby, sapphire, tourmaline, garnet, citrine, and iolite, are regarded as the lesser known gemstones of Zimbabwe. Most classes of coloured gemstones, but particularly these lesser known examples, have received only cursory scientific and industrial attention. For example, a search on Scopus using keywords Zimbabwe AND gemstones returns only four results, whereas a search for Zimbabwe AND pegmatites (a major gemstone host lithology) returns 32 results – most focusing on the economically important Bikita, Kamativi, and Sandawana pegmatites.
The most extensive documentation of Zimbabwean gemstones is Hawadi and Mafara (2018), which contains fundamentals of gemmology, an alphabetical listing of the gemstones with historical production figures, geological descriptions of the occurrences, and geographic coordinates, as accumulated over the years by the Zimbabwe Geological Survey. Although this work covers most known occurrences, it does not provide a systematic overview of the regional geology or metallogeny of these deposits. Metallogeny broadly refers to the study of regional to global distributions of mineral resources in a context of petrological,
temporal, and tectonic frameworks. Because metallogenic approaches provide scientific underpinning to promote sound mineral exploration practice, their application to Zimbabwean coloured gemstone endowment is an important step towards encouraging renewed exploration activity in this neglected sector. Towards this end, the present contribution considers each of the main geological provinces within Zimbabwe in the context of its coloured gemstone endowment. Because geological provinces are characterized by discrete ages and tectonic settings, correlating these to gemstone endowment represents an important first step in forming a metallogenic understanding of the local coloured gemstone occurrences. Specific emphasis is placed on the Pfungwe and Mwami gemstone clusters, which represent rich and important gem occurrences in the Pfunzi and Magondi orogenic belts, respectively, which themselves may represent prospective metallogenic settings.
Through our insights and understanding we seek to provide a scientific basis for future exploration for new gemstone discoveries in Zimbabwe. However, for the sector to fully flourish, exploration needs to be augmented with further development of capabilities in gemmological characterization and gemstone beneficiation within the local economy. Discussion and recommendations related to these key considerations are provided in order to further promote future development of Zimbabwe’s coloured gemstone exploration sector and downstream value chain.
A brief overview of the main geological provinces of Zimbabwe
Zimbabwe has a geological history that spans over 3.5 billion years (Ga), and has been recently summarized by Blenkinsop (2019), in which more extensive references can be found. Figure 1 provides an overview of the geological evolution of Zimbabwe, with more details provided in following sections devoted specifically to gemstone occurrences within the different geological provinces. Briefly, the oldest rocks on the Zimbabwe craton are found in the Tokwe segment and comprise Sebakwian greenstones that are older than 3.2 Ga (e.g. Moorbath, Wilson, and Cotterill. 1976). The remainder of the Archean Eon saw the development of an extensive granitegreenstone cratonic block with interspersed gneissic lithologies. The greenstone volcanosedimentary sequences comprise the
Belingwean, Bulawayan, and Shamvaian Supergroups separated by marked unconformities, whereas the granitic component comprises the 2.7 Ga Sesombi Suite granites and other older granites and granitoids and the 2.6-2.54 Ga Chilimanzi Suite granites (Wilson, Nesbitt, and Fanning, 1995). The late Archean was marked by a period of compressional tectonics giving rise to the Pfunzi orogenic belt (formed during the Ngarwe Orogeny) on the northern margin of the craton (Barton et al., 1991; Vinyu et al., 2001), with the contemporaneous development of migmatitic gneisses in the Northern Marginal Zone of the Limpopo belt (Kamber and Biino, 1995). The next major geological event was the intrusion of the PGE- and chromium-rich Great, Dyke mafic-ultramafic body at 2.58 Ga (Oberthür, Davis, and Blenkinsop, 2002). This intrusion may mark the final cratonization of the Zimbabwe craton.
A period of probable rifting took place from around 2.2 Ga onwards resulting in deposition of the Magondi Supergroup, which was subsequently deformed into a low-grade metasedimentary sequence during the Magondi Orogeny around 1.9 Ga (Treloar, 1988; Master, 2010). This was coeval with the development of the Triangle Shear Zone and Central Zone of the Limpopo Belt (Kamber et al., 1995). The next period of sedimentation is recorded by the Umkondo Group in the east of the country (Stocklmayer, 1981) (Figure 1). Sedimentation is constrained to around 1.1 Ga and was closely followed by the outpouring of the Umkondo Large Igneous Province (LIP) (Hanson et al., 1998).
Pan-African deformation events affected Zimbabwe during the assembly of Gondwana, specifically manifesting as the Zambezi and Mozambique orogenic belts in the northern and eastern parts of the country respectively, in part overprinting the deformation incurred during the Magondi Orogeny and the much earlier Ngarwe Orogeny (Dirks and Jelsma, 2006; Munyanyiwa et al,. 1997). The final major lithostratigraphic unit is the Karoo Supergroup, which represents a significant sedimentary succession deposited prior to 180 Ma (Johnson et al., 1996). Around 180 Ma, Karoo flood basalts were extruded over large parts of the south of the country (Jourdan et al., 2005), swarms of mafic dykes, alkali ring complexes, and other plutonic rocks were emplaced. Since then, the Zimbabwean land surface has been subject to geomorphological sculpting during formation of the so-called ‘African erosional surfaces’ (Lister, 1987) and has been covered by relatively thin veneers of Cenozoic sediment belonging to the Kalahari Group (Munyikwa et al., 2000).


Figure 2—Distribution of gemstone occurrences on the Zimbabwe craton and within orogenic belts. The orogenic belts, numbered 1-5 on the map are: 1. Limpopo Belt, 2. Magondi Belt, 3. Zambezi Belt, 4. Mozambique Belt, and 5. Pfunzi Belt. The gemstone data-points are overlain on a simplified geological map of Zimbabwe (after Blenkinsop 2019, with slight modification) and are further detailed in Table I. ‘Other’ gemstones are aventurine (Av), fluorite (Fl), iolite (Io), and unakite (Un)
Coloured gemstones in the major geological provinces
Figure 2 shows the distribution of the gemstone occurrences within the various geological and/or metallogenic units that make up Zimbabwe’s landmass. Metallogenic approaches have only been sparingly applied to gemstone distributions elsewhere (e.g., Chen and Xing, 2011; Miladinović et al., 2016; Li et al., 2021), and to the best of our knowledge, have not been applied to the distribution of Zimbabwean gemstones. All gemstone occurrence data (N = 173) reported herein was collated from Bartholomew (1990) and Hawadi and Mafara (2018), complemented by Cipriani and Borelli (1986) and the Gemmology Institute of America (1999) to develop the gemstones classification scheme proposed in Table I. The data is being incorporated into an interactive online map of Zimbabwe’s mineral occurrences (https://tblenkinsop.github.io/Atlas-ofIndustrial-Minerals-and-Gemstones-in-Zimbabwe/).
Despite the prominence of the Great Dyke in Zimbabwean geology (in terms of both its geological uniqueness and its economic importance for chromium and PGE mining), the only recorded gemstone occurrences in the Great Dyke are those of mtorolite (a chromium-rich chalcedony) and chrysoprase (Ni-rich chalcedony). Mtorolite was named after its type locality in the Mutorashanga area in the northern part of the Great Dyke. The Umkondo Group (including the Umkondo Large Igneous Province) rocks are similarly devoid of recorded coloured gemstones, although a notable black diamond placer concentration is located in the basal conglomerates of this foreland sedimentary sequence (Smit et al., 2018; McKechnie, 2019). The Phanerozoic aged rocks (Karoo sedimentary sequences and younger) have formed under an extensional tectonic regime, and the only recorded gemstone occurrences are minor euhedral quartz (including varieties citrine, amethyst, rose quartz, and smoky quartz) and agate which commonly form as cavity fillers in Karoo basalts and are found in the alluvial and elluvial deposits derived therefrom (Bartholomew,
1990). The remainder of this section thus focuses on the geological settings in which coloured gemstones feature more prominently, viz. on the granite-greenstone cratonic block, and within the four bounding orogenic or metamorphic belts.
The granite-greenstone cratonic block
The most notable gemstone occurrences located on the southern extent of the cratonic block are clusters of emerald deposits (Figure 1), several of which have been mined and some of which are currently in production. The most famous of these is the Sandawana emerald cluster (formerly the Zeus mine) which is known internationally for its small but exceptionally bright green gemstones (Zwaan, Kanis, and Petsch, 1997; Zwaan, 2006). Emerald is the green variety of beryl (Be3Al2Si6O18), in which the colouration derives from incorporation of trace amounts of Cr and/or V. It is a rare mineral, since its formation requires a geochemical interaction between Cr and Be, both of which are relatively sparsely distributed in the Earth’s crust (Groat et al., 2008). Mafic, and especially ultramafic, rocks are characterized by an enrichment of Cr relative to more felsic rocks, whereas Be is typically associated with pegmatites. Since ultramafic and komatiitic rocks formed prevalently during the Archean when the Earth was hotter than today, the greenstone units of the cratonic block should be prospective for these rock types, and for emerald deposits in areas where subsequent pegmatite intrusion has occurred. This model applies to the Sandawana emerald cluster, where Zwaan (2006) suggests that shearing, hydrothermal fluid flow, and Na-F metasomatism occurred at the contact between pegmatites and komatiites during the Limpopo orogeny (a convergent event between the Zimbabwe and Kaapvaal cratons at ca. 2.6 Ga) that generated some of the world’s oldest emeralds. In the northern regions of the cratonic block, the gemstone distributions include 13 occurrences of quartz varieties, four of aquamarine, and one each of corundum, garnet, and euclase (Figure 1).
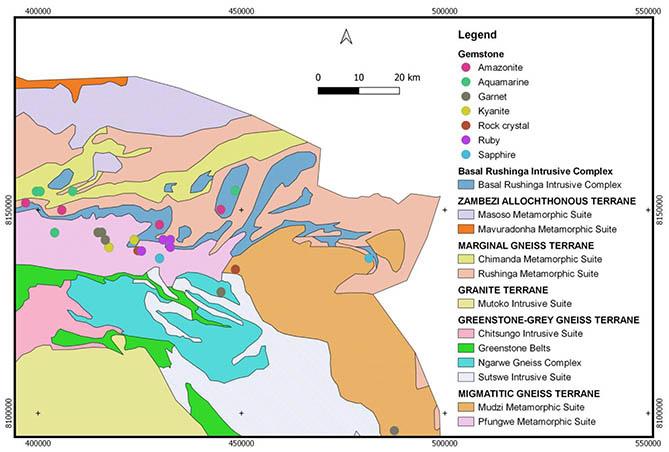
The Pfunzi Orogenic Belt: Case study using the Pfungwe gemstone cluster
Figure 3 shows the distribution of gemstone occurrences in the Pfungwe gemstone cluster, which is located within the bounds of the Pfunzi Orogenic Belt, a metacratonic margin of the Zimbabwe Craton that formed before and during the Ngarwe Orogeny (ca. 2.6 Ga; Vinyu et al., 2001). The Pfungwe cluster is located within an area spanning approximately 60 km by 40 km and is centred on a geological unit known as the Pfungwe Metamorphic Suite of the Migmatitic Gneiss Terrane (Figure 3). These rocks comprise high metamorphic grade biotite and hornblende gneisses (including paragneisses of metasedimentary origin), granitic leucogneisses, and migmatites (Barton et al., 1991). Eight deposits or occurrences (three of garnet, and one each of kyanite (Al2SiO5), quartz (SiO2), ruby (Al2O3), sapphire (Al2O3), and aquamarine (Be3Al2(Si16O18)) are contained within the Pfungwe Metamorphic Suite. Several of these gems are metamorphic minerals (e.g., garnet, kyanite, and corundum), and their presence thus highlights the importance of elevated pressure and temperature conditions associated with the development of an orogenic belt. For example, the gem corundum (ruby, sapphire) stability field occurs at pressures in excess of 3 kbar and temperatures ranging between 500°C and 800°C in silica-poor protolith rocks (Ohnenstetter, Fallick, and Fagan, 2014). The primary lithological hosts for these gemstone occurrences are the aluminous quartz-biotite gneisses (garnet, ruby, sapphire, kyanite) and pegmatites (rock crystal, aquamarine). To the east of the Pfungwe Metamorphic Suite lies the Mudzi Metamorphic Suite (Figure 3), which formed during the Ngarwe Orogeny (Barton et al., 1991; Vinyu et al., 2001), and comprises predominantly tonalitic to granitic orthogneisses (Vinyu et al., 2001). Despite having experienced similar pressure and temperature conditions during regional metamorphism, this unit is conspicuously devoid of recorded gemstones except for one sapphire and one garnet occurrence. This highlights the importance of the interplay between P-T conditions and the bulk geochemistry of the protolith rocks. The sapphire occurrence is hosted within biotite augen gneiss in
the eastern part of the belt, and the garnet within a porphyroblastic granitic gneiss in the southern part of the eastern N-S arm of the suite towards the Mozambique Belt.
The Magondi Orogenic Belt: Case study using the Mwami gemstone cluster
The Mwami cluster of 21 known gemstone occurrences is located towards the northern extremity of Zimbabwe (Figure 1), predominantly within the metapelitic rocks of the Piriwiri Group, which forms part of the Magondi Supergroup. Figure 4 depicts the distribution of these occurrences, which fall within an area roughly 25 × 35 km. Aquamarine (Be3Al2Si6O18) occurrences predominate, with at least ten sites identified where berylbearing pegmatites crosscut a range of country rocks including staurolite, staurolite-kyanite, and sillimanite schists. These rocks also host single occurrences of topaz (Al2SiO4(F,OH)2), euclase (BeAlSiO4(OH)), and almandine garnet (Fe3Al2(SiO4)3). The higher metamorphic grade sillimanite gneisses to the west of the cluster show a prevalence of chrysoberyl (BeAl2O4) occurrences, although instances of euclase and amethyst are also noted (Figure 4). To form most of these phases, Be must be added into the system, and this is typically ascribed to pegmatite intrusions or interactions with late-stage magmatic fluids (Groat, 2008 and references therein). Field relationships suggest that the pegmatite intrusions represent the important mechanism for Be addition, and based on available geochronological data for pegmatite emplacement (1.06–0.98 Ga; Glynn, 2017), the mineralization likely occurred relatively late in the Magondi Belt’s ca. 2 Ga geological history. From the gem mineral chemistry, the other crucial element is aluminium, which is expected to be in excess in the metapelitic units of the deep-marine facies Piriwiri Group.
Other orogenic belts: Limpopo, Zambezi, and Mozambique belts
The Limpopo Belt formed approximately contemporaneously with the northern Pfunzi Belt and relates to the convergent tectonics
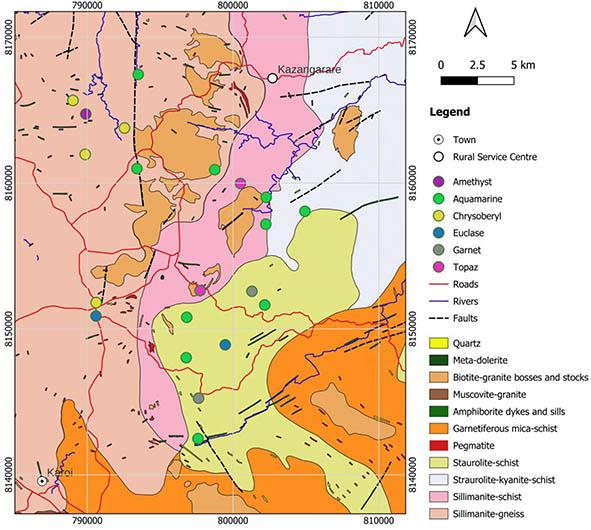
Town
Rural Service Centre
Amethyst
Aquamarine
Chrysoberyl
Euclase
Garnet
Topaz
Roads
Rivers
Faults
Quartz
Meta-dolerite
Biotite-granite bosses and stocks
Muscovite-granite
Amphibolite dykes and sills
Garnetiferous mica-schist
Pegmatite
Staurolite-schist
Straurolite-kyanite-schist
Sillimanite-schist
Sillimanite-gneiss


Figure 5—Example specimens of Zimbabwean coloured gemstones. (a) Aquamarine from Hurungwe, Magondi Belt, (b) iolite from Zambezi Belt, NE of Kariba, (c) amethyst from the Karoo near Chiredzi, and (d) host rock (ore) containing large pyrope garnets, from the gneisses of the Pfunzi Belt, northern Zimbabwe. Images (a) and (b) are courtesy of Steffen Kalbskopf, and (c) and (d) are of gemstones collected in the field during this study
between the Zimbabwean cratonic block and Kaapvaal Craton around 2.77–2.57 Ga (Kamber and Biino, 1995). In southern Zimbabwe, the Limpopo Belt is subdivided into the Northern Marginal Zone and the Central Zone. The Northern Marginal Zone seemingly comprises cratonic granite-greenstone rocks that have experienced high-grade metamorphism (Blenkinsop, 2019), and is largely devoid of any coloured gem occurrences, except for three occurrences of aventurine (quartz with fuchsitic inclusions; Figure 1). The Central Zone of the Limpopo Belt comprises a variety of gneisses (Broderick, 1979) which have experienced a complex deformation history, including low-to-medium pressure granulite facies metamorphism prior to 2.56, Ga and a high-
grade tectonometamorphic overprint between 2.08 and 1.85 Ga (Holzer et al., 1998). The Central Zone hosts a variety of gem occurrences including three instances of iolite (gem cordierite: (Mg,Fe)2Al4Si5O18), one of garnet, one of epidote, two unakite (epidotized granite) occurrences, and three gem quartz occurrences. The presence of metamorphic minerals (garnet and cordierite) and metasomatic minerals (epidote) again highlights the importance of the dynamic processes operating during orogenic belt development.
The Zambezi and Mozambique belts are Pan-African orogenic belts formed during three periods of deformation between 1 and 0.5 Ga. The Zambezi Belt is located beyond the northern margin of the Zimbabwe Craton and is separated from the Pfunzi Belt by the Basal Rushinga Intrusive Complex (approx. 830 Ma) (Vinyu et al., 1999) (Figures 2, 3). Known gemstone occurrences here are limited to aquamarine and amazonite (KAlSi3O8), both of which were formed in pegmatites. The Mozambique Belt occurs to the east of the Zimbabwe Craton and manifests as a sub-greenschist facies metamorphic belt in the Umkondo sedimentary sequence. This is known as the Zimbabwe facies of the Mozambique Belt and is devoid of any notable coloured gem occurrences, which can be explained in part perhaps by the fact that sub-greenschist metamorphism is not sufficient to form metamorphic gem minerals such as garnet, corundum, kyanite, sillimanite, or cordierite. Further east, the Mozambique Belt is represented by an allochthonous terrane known as the Mozambique facies, which has experienced amphibolite facies metamorphism and in which kyanite is known to be present (Watson, 1969; Blenkinsop, 2019).
Discussion
Despite the significant efforts of past workers (e.g., Hawadi and Mafara, 2018), the total coloured gemstone endowment within Zimbabwe and the prospectivity for future occurrences, remain poorly constrained. This is in part due to the limited number of dedicated exploration efforts except perhaps for pegmatites during the early phases of the nuclear era (e.g., Wiles, 1961; Gallagher, 1967, UK Atomic Energy investigations), academic investigations, and a few formal attempts to apply metallogenic principles towards understanding the local gem mineral distributions (e.g., Mugumbate, 2014). Our detailed regional geological analysis of coloured gemstone occurrences serves to improve on the current status of knowledge. Importantly, the work has highlighted two main metallogenic settings in which there is high prospectivity for discovering new gem mineral occurrences viz. pegmatite belts and orogenic belts which have experienced greenschist to granulite
facies metamorphic conditions. It should also be noted that at the time of writing there was a resurgence in pegmatite exploration in Zimbabwe in the search for and characterization of lithium deposits.
Pegmatite belts
The formation of pegmatites has been ascribed to both late stage magmatic fluids derived predominantly from granitic intrusions and crustal-scale anatectic processes. These processes generally concentrate a range of rare and incompatible elements (e.g., Be, Li, Ta, and REE, among others), some of which can react to form gem quality minerals, particularly within miarolitic cavities or in reaction zones with the country rocks into which they intrude (Simmons et al., 2012; London and Kontak, 2012). Zimbabwe hosts several notable pegmatites and pegmatite belts, including Bikita the world’s largest Cs and petalite deposit (Dittrich et al., 2019), Sandawana (world-class green emeralds, Zwaan et al.,1997, Zwaan, 2006), Kamativi (Sn, Ta, and Li resource, Shaw et al., 2019; Gallagher, 1975 and references therein). Generally, scientific studies focus on individual pegmatites, and even these are relatively sparsely studied in the available scientific literature. Published regional studies on pegmatite belts are similarly limited in number, the most notable being the early work by Wiles (1961) focused on the Mwami mica field in the Magondi Orogenic Belt and the investigation of Li-Be pegmatites by Gallagher (1975). This general dearth in available information is detrimental to exploration efforts to find new pegmatite-hosted coloured gem occurrences. A detailed country-wide overview study is strongly recommended (as has been done for mafic dyke swarms by Söderlund et al., 2010), which can be complemented with regional-scale studies on pegmatite prospectivity (e.g., von der Heyden et al., 2023).
Orogenic belts represent compressional zones in which pre-existing rocks undergo variable degrees of metamorphism and possible intrusion by igneous rocks and pegmatites. These belts have formed around Zimbabwe’s main cratonic block during convergence events (e.g., Ngarwe Orogeny (ca. 2.6 Ga), Magondi Orogeny (ca. 1.9 Ga), and the Pan-African Mozambique and Zambezi orogenies; Figure 1). This broad tectonic environment provides elevated temperature and pressure conditions which, when combined with precursor lithologies that are ‘fertile’ with respect to gem-forming elements, are highly prospective for high P-T gem minerals (e.g., corundum, garnet, cordierite). Figure 6 compares the relative proportions of the gem-forming cationic elements (normalized per unit oxygen)
50 occurrences (17 quartz polymorphs)
25 occurrences (2 quartz polymorphs)
32 occurrences (6 quartz polymorphs)
12 occurrences (6 quartz polymorphs)

between the different orogenic belts found within Zimbabwe using the mineral stoichiometry and the number of mineral occurrences per geological unit derived from Table I. Given that the tabulated list of coloured gemstones is not exhaustive, the pie charts in Figure 6 should be deemed as semi-quantitative representations. The figure highlights the importance of Al, Be, and to a lesser extent Fe in the whole-rock chemistry of orogenic belts that are well mineralized in coloured gemstones aside from the quartz polymorphs. High Al contents are important for the formation of gem minerals such as kyanite, cordierite, topaz, and ruby/sapphire, and the most fertile rocks with respect to Al are pelitic protoliths. This is well demonstrated by the comparisons in the Pfungwe area where the paragneissic Pfungwe Metamorphic Suite is well endowed with gem occurrences, whereas the adjacent and contemporaneously-formed Mudzi orthogneisses are not mineralized. The endowments of these ‘fertile’ orogenic belts contrast with the cratonic block where, outside of the famous emerald clusters, most of the gem mineral occurrences comprise relatively low-value quartz polymorphs (Figure 6).
The importance of developing the Zimbabwean coloured gemstone sector
Despite the prevalence of coloured gemstone occurrences discussed above, Zimbabwe has not yet developed significant value addition capacity in the sector. More generally, there is a disconnect between the country’s natural mineral endowment and its mineral beneficiation capacity. Thus Zimbabwe has yet to genuinely benefit from its mineral resources, including coloured gemstones, and that opportunities therein remain largely under-developed and underexplored. With the estimation that the world produces US$2–3 billion worth of rough coloured gemstones annually (Shortell and Irwin, 2017), mostly from developing countries in the global south (Cross, van der Wal, and de Haan, 2010; Collet, Curtze, and Reed, 2013), these countries, including Zimbabwe, should implement more significant value addition to claim a greater stake within the coloured gemstones sub-sector.
Our recommendations to unlock the value of Zimbabwe’s coloured gemstone subsector are as follows.
1. Stimulate exploration efforts to further establish the formal Zimbabwean gemstones sub-sector
The current contribution suggests a regional geology framework that can be used in the early stages of any exploration initiative. This constitutes a step towards developing a formalized metallogenic framework for coloured gemstone exploration in Zimbabwe, and should be followed up with dedicated ‘boots-on-the-ground’ type exploration efforts by private companies and governmental entities.
2. Capacity building in the small-scale coloured gemstones subsector
Artisanal mining generally plays an important role in sustaining livelihoods within local communities in Africa (e.g., Hilson, 2009; Hilson and Maconachie, 2020) and accounts for the bulk of coloured gemstone production in Africa (Africa Union, 2009) and worldwide (Collet, Curtze, and Reed, 2013). Small-scale miners also play a significant role in the discovery of gemstones, which sometimes culminates in gemstone rushes, but they are generally underresourced, and work intermittently or seasonally so that no proper exploration is undertaken. Their mining methods are
not always optimal or safe. Cutting and polishing operations (value addition), where they exist, are small informal, illicit, or backyard operations. For these workers to optimize their efforts, there is a need for their capacitation through training, including fundamentals of book-keeping, geology, gemmology, environment, and mine health and safety. Technical support from government departments in these fields can further enhance the safety and productivity of small-scale gemstone mining and processing enterprises. In Zimbabwe, marketing of gemstones has to be done via the Minerals Marketing Corporation of Zimbabwe (MMCZ), which also helps identify marketing opportunities for minerals including gemstones. However, due to bureaucratic bottlenecks and price distortions in some cases, illicit trade in gemstones may happen outside the official channels.
3. Local gemstone value addition through cutting and polishing The value of Zimbabwe’s gemstone endowment can be further unlocked through innovative beneficiation strategies based on greater understanding of the gemstones’ physical characteristics. Polished gemstones carry a many-fold value addition relative to unpolished or raw gemstones, with some studies (Thomas, 2008) putting the value of the gemstone embodied in the finished product (jewellery) at 11 times that of the original rough material. However, Zimbabwe currently lacks the required research and valueaddition capacity and the gemstones themselves are yet to be adequately studied, profiled, quantified, and evaluated. There is therefore need to build local capacity for modern gemmological training, research, and value addition. This can be initiated through collaborations with established gemmological centres and laboratories, with clear terms for technological transfer, including the establishment of well-equipped gemmological research and training facilities in Zimbabwe. The Zimbabwe School of Mines has recently initiated gemmological training courses and has started construction of a gemmological centre. Lessons can also be learned from countries that have earned world acclaim in managing their gemstone sub-sectors, such as India, which has established itself as a world gemstone cutting and polishing centre. Such an effort must be supported by a dedicated marketing drive to develop a brand around Zimbabwean polished gemstones.
The authors would like to thank the two anonymous reviewers and the handling editor for the insights that were provided and which helped to strengthen the manuscript. This work was made possible by the financial assistance from the Royal Academy of Engineering (UK) through the Higher Education Partnerships for sub-Saharan Africa (HEPSA) programme.
Author contributions:
AM collated the datasets and wrote a draft version of the manuscript, BvdH wrote the final draft of the manuscript. TGB provided project oversight and manuscript polishing. All authors were responsible for editing and figure generation.
References
African Union. 2009. Africa Mining Vision. 47 pp. https://au.int/sites/default/files/ documents/30995-doc-africa_mining_vision_english_1.pdf
Bartholomew, D.S. 1990. Base metal and industrial mineral deposits of Zimbabwe. Mineral Resources Series 22. Zimbabwe Geological Survey, Harare. 154 pp.
Table I
Classification of Zimbabwean coloured gemstones (compiled from Cipriani and Borelli (1986), Bartholomew (1990), GIA (1999) and Hawadi and Mafara (2018))
Gemstone Group Gemstone species Gemstone Varieties
Location in Zimbabwe
Host geology
Silica Quartz Rock crystal Masvingo, Mudzi, Mutare, Nyanga Pegmatites
Smoky quartz Marondera, Beitbridge, Hurungwe, Gweru Pegmatites
Rose quartz Marondera, Hurungwe, Beitbridge
Amethyst Nyamandlovu, Hurungwe, Hwange, Lupane, Makonde Karoo basalt cavities (Hwange, Nyamandlovu), zoned pegmatites (Hurungwe), quartz veins in granite (Makonde)
Citrine Marondera, Goromonzi, Harare
Tiger’s eye Zvishavane, Kwekwe
Chalcedony
Agate Nyamandlovu, Chivhu, Lupane
Mtorolite Mutorashanga, Mutare
Carnelian Kadoma (river gravels)
Jasper Hurungwe, Kwekwe, Nyamandlovu
Chrysoprase Great Dyke, Mutare
Sard
Onyx Bloodstone Victoria Falls
Opal Common opal Great Dyke, Mutare
Quartz monzonites (adamellites)
Replacement of crocidolite by silica
Karoo basalts cavities
Green chalcedony in narrow veins in ultramafic rocks
Feldspar
Microcline
Amazonite
Orthoclase Noble orthoclase
Adularia
moonstone
Plagioclase Albite
moonstone
Nyamandlovu, Hurungwe, Rushinga
Peristerite Hurungwe, Beitbridge
Labradorite Beitbridge
Andesine Beitbridge
Veins in serpentinites of greenstone belts and Great Dyke.
Pegmatites intruding Zambezi Belt metamorphic rocks
Pegmatite in serpentinized dunite
Pegmatite in serpentinized dunite
Beryl Beryl Emerald Gutu, Masvingo, Insiza, Mberengwa, Hurungwe Be-bearing pegmatites intruding ultramafic rocks.
Aquamarine Hurungwe, Mt. Darwin, Rushinga
Morganite Hurungwe, Pfungwe, Mudzi
Golden beryl Hurungwe, Pfungwe, Mudzi
Heliodor Hurungwe, Pfungwe, Mudzi
Bixbite
Garnet Garnet Almandine
Tourmaline
Tourmaline
Corundum Ruby Sapphire
Mudzi, Rushinga, Marondera, Beitbridge, Hurungwe
Pyrope Mudzi, Rushinga
Rhodolite
Spessantine
Grossular
Hessonite
Andradite
Demantoid
Schorl Hurungwe, Mudzi
Rubellite Hurungwe, Mudzi
Green tourmaline Hurungwe, Mudzi
Dravite
Achroite
Indicolite
Siberite
Goromonzi, Marondera, Mudzi, Rushinga, Beitbridge Somabula gravels. Mudzi
Aluminosilicate Kyanite Kyanite Nyanga, Mudzi, Rushinga, Hurungwe
Silimanite Silimanite Hurungwe
Andalusite Andalusite Masvingo, Karoi, Mudzi
Chiastolite Karoi, Masvingo
Pegmatites
Pegmatites
Pegmatites
Pegmatites
Regionally metamorphosed Al-rich schists
Metamorphism of Al-rich inclusions in igneous rocks; desilication of acid igneous rocks in contact with more basic material; hydrothermal alteration and metamorphism of ultramafic rocks.
High pressure, high temperature metamorphism of Al-rich rocks
High temperature metamorphism of aluminous rocks.
In carbonaceous phyllites (Masvingo)
Gemstone Group Gemstone species Gemstone Varieties
Chrysoberyl Chrysoberyl (Golden)
Chrysoberyl
Alexandrite
Cymophane/ Cat’s eye
Jade (amphibole)
Tremoliteactinolite
Jade (pyroxene) clinopyroxene
Cordierite Cordierite
Nephrite
Jadeite
Iolite
Location in Zimbabwe
Masvingo, Gutu, Rushinga
Masvingo, Somabula gravels
Masvingo, Gutu, Rushinga
Mashava
Makuti, Beitbridge, Chimanimani, Rushinga
Topaz Topaz Topaz Karoi, Hurungwe, Mutare
Somabula Blue Somabula gravels
Titanite Titanite Shene Makuti, Rushinga, Goromonzi
Other Fuchsite quartzite Aventurine Mashava, Beitbridge, Nyamandlovu
Unakite Unakite
Lepidolite Lepidolite
Beitbridge, Gweru, Bulawayo, Nyamandlovu
Chegutu, Harare, Goromonzi, Rushinga, Wedza, Nyanga
Barton, C.M., Carney, J.N., Crow, M.J., Dunkley, P.N., and Simango, S. 1991.
The geology of the country around Rushinga Nyamapanda. Bulletin 92. Zimbabwe Geological Survey, Harare. Blenkinsop, T.G. 2019. The geology of Zimbabwe. Mining in Zimbabwe from the 6th to the 21st Centuries. Prendergast, M.D. and Hollaway, J. (eds). Chamber of Mines of Zimbabwe. 37 pp.
Bonsu, W.A. 2012. Pricing and marketing of minerals from small-scale mining operations: The case of gemstones. Doctoral dissertation, University of Zambia. Broderick, T.J. 1979. Explanation of the geological map of the country south of Nuanetsi, Nuanetsi and Beitbridge districts. Short Report 46. Rhodesia Geological Survey. 108 pp.
Chen, J.L. and Xing, C.X. 2011. Metallogeny of the gem deposits in basalt in Baishan area, Jilin Province. Geology and Resources, vol. 20, no. 4. pp. 255–257.
Collet, L., Curtze, L., and Reed, K. 2013. Responsible sourcing of colored gemstones. Applied Research Seminar Report, Graduate Institute of Geneva. 67 pp.
Chigumira, G., Mamuse, A., Dube, C., Chiwunze, G., Mudzonga, E., and Manamike, I. 2016. Benchmark practices for supporting artisanal and smallscale mining in Zimbabwe, ZEPARU, Harare. 65 pp.
Cipriani, C. and Borelli, A. 1986. Simon & Schuster’s guide to gems and precious stones. Simon & Schuster, New York. 384 pp.
Cross, J., van der Wal, S., and de Haan, E. 2010. Rough Cut: Sustainability Issues in the coloured gemstone industry. SOMO, Amsterdam. 44 pp. https://www. somo.nl/wp-content/uploads/2010/02/Rough-Cut.pdf [accessed 1 May 2020].
Dirks, P.H.G.M. and Jelsma, H.A. 2006. The structural-metamorphic evolution of the northern margin of the Zimbabwe Craton and the adjacent Zambezi belt in northeastern Zimbabwe. Processes on the Early Earth. Reimold, W.U. and Gibson, R.L. (eds). Geological Society of America. pp. 291–313.
Dittrich, T., Seifert, T., Schulz, B., Hagemann, S., Gerdes, A., and Pfänder, J. 2019. Archean rare-metal pegmatites in Zimbabwe and Western Australia: Geology and metallogeny of pollucite mineralisations. Springer. 134 pp. Gallagher, M.J. 1967. Phosphates and other minerals in pegmatites of Rhodesia and Uganda. Mineralogical Magazine and Journal of the Mineralogical Society, vol. 36 , no. 277. pp. 50–59.
Gallagher, M.J. 1975. Composition of some Rhodesian lithium-beryllium pegmatites. South African Journal of Geology, vol. 78, no. 1. pp. 35–41. GIA (Gemmological Institute of America). 1999. Coloured stones essentials. Course notes. Gemmological Institute of America. 22 pp.
Glynn, S.M., Master, S., Wiedenbeck, M., Davis, D.W., Kramers, J.D., Belyanin, G.A., Frei, D., and Oberthur, T. 2017. The Proterozoic Choma-Kalomo Block, SE Zambia: Exotic terrane or a reworked segment of the Zimbabwe Craton? Precambrian Research, vol. 298. pp. 421–438.
Host geology
Phlogopite schist in serpentinite cut by Be-bearing pegmatites
Phlogopite schist in serpentinite cut by Be-bearing pegmatites
Phlogopite schist in serpentinite cut by Be-bearing pegmatites
Aplite intrusions in serpentinite
High-grade argillaceous metasediments; Al-rich igneous rocks;
Calc-silicate rocks (Makuti), epidote veins (Rushinga), biotite-muscovite-sillimanite gneisses (Goromonzi).
Quartz mica schists/ quatzites in which fuchsite occurs in minute inclusions
Epidotisation (metamorphism/ hydrothermal alteration) of plagioclase in granite
Pegmatites
Gochero, P. and Boopen, S. 2020. The effect of mining foreign direct investment inflow on the economic growth of Zimbabwe. Journal of Economic Structures, vol. 9, no. 1. pp. 1–17.
Groat, L.A., Giuliani, G., Marshall, D.D., and Turner, D. 2008. Emerald deposits and occurrences: A review. Ore Geology Reviews, vol. 34, no. 1-2. pp. 87–112.
Hanson, R.E., Martin, M.W., Bowring, S.A., and Munyanyiwa, H. 1998. U– Pb zircon age for the Umkondo dolerites, eastern Zimbabwe: 1.1 Ga large igneous province in southern Africa/East Antarctica and possible Rodinia correlations. Geology, vol. 26. pp. 1143–1146.
Hawadi M.T. and Mafara, L.S. 2018. Gemstone deposits of Zimbabwe. Mineral Resources Series 30. Zimbabwe Geological Survey, Harare. 161 pp.
Hilson, G. 2009. Small-scale mining, poverty and economic development in subSaharan Africa: An overview. Resources Policy, vol. 34, no. 1–2. pp. 1–5.
Hilson, G. and Maconachie, R. 2020. Artisanal and small-scale mining and the Sustainable Development Goals: Opportunities and new directions for subSaharan Africa. Geoforum, vol. 111. pp. 125–141.
Holzer, L., Frei, R., Barton, J.M., and Kramers, J.D. 1998, Unravelling the record of successive high grade events in the Central Zone of the Limpopo Belt using Pb single phase dating of metamorphic minerals. Precambrian Research,vol. 87. pp. 87–115. doi:10.1016/S0301-9268(97)00058-2
Johnson, M.R., van Vuuren, C.J., Hegenberger, W.F., Key, R., and Shoko, U. 1996. Stratigraphy of the Karoo Supergroup in southern Africa: an overview. Journal of African Earth Sciences, vol. 23. pp. 3–15.
Jourdan, F., Féraud, G., Bertrand, H., Kampunzu, A.B., Tshoso, G., Watkeys, M.K., and Le Gall, B., 2005. Karoo large igneous province: Brevity, origin, and relation to mass extinction questioned by new 40Ar/39Ar age data. Geology, vol. 33. pp. 745–748.
Kamber, B.S. and Biino, G.G. 1995. The evolution of high-T-low-P granulites in the Northern Marginal Zone sensu-stricto, Limpopo Belt, Zimbabwe - The case for petrography. Schweizerische Mineralogische Und Petrographische Mitteilungen, vol. 75, no.3. pp. 427–454.
Kamber, B.S., Kramers, J.D., Napier, R., Cliff, R.A., and Rollinson, H.R. 1995, The Triangle Shear Zone, Zimbabwe, revisited: New data document an important event at 2.0 Ga in the Limpopo Belt. Precambrian Research, vol. 70. pp. 191–213, doi:10.1016/0301-9268(94)00039-T.
Li, Y., Chen, R., Yang, Z., Lin, M., Wang, Y., and Zhao, F. 2021. Discussion on several problems of metallogenic geological condition and genesis of Shoushan stone. Journal of Gems & Gemmology, vol. 23, no. 1. pp. 1–11.
Lister, L.A. 1987. The erosion surfaces of Zimbabwe. Bulletin 90. Zimbabwe Geological Survey, Harare. 173 pp.
London, D. and Kontak, D.J. 2012. Granitic pegmatites: Scientific wonders and economic bonanzas. Elements, vol. 8, no. 4. pp. 257–261.
Lurie, J. 2000. Short course in gemmology. Technikon Witwatersrand, Johannesburg. 86 pp.
Mahonye, N. and Mandishara, L. 2015. Mechanism between mining sector and economic growth in Zimbabwe, is it a resource curse? Environmental Economics, vol. 6, no. 3. pp. 81–92.
Malinga, W. 2018. From an agro-based to a mineral resources-dependent economy’: A critical review of the contribution of mineral resources to the economic development of Zimbabwe. Forum for Development Studies, vol. 45, no. 1. pp. 71–95.
Master, S., Bekker, A., and Hofmann, A. 2010. A review of the stratigraphy and geological setting of the Palaeoproterozoic Magondi Supergroup, Zimbabwe - Type locality for the Lomagundi carbon isotope excursion. Precambrian Research, vol. 182. pp. 254–273.
McKechnie, W.F. 2019. Diamond exploration and mining in southern Africa: Some thoughts on past, current and possible future trends. Journal of the Southern African Institute of Mining and Metallurgy, vol. 119, no. 2. pp, 123–131.
Miladinović, Z., Simić, V., Jelenković, R., and Ilić, M. 2016. Gemstone deposits of Serbia. Geologica Carpathica, vol. 67, no. 3. pp. 211–222. doi: 10.1515/geoca-2016-0014
Moorbath, S., Wilson, J., and Cotterill, P. 1976. Early Archaean age for the Sebakwian group at Selukwe, Rhodesia. Nature, vol. 264. pp. 536–538.
Muchaendepi, W., Mbowa, C., Kanyepe, J., and Mutingi, M. 2019. Challenges faced by the mining sector in implementing sustainable supply chain management in Zimbabwe. Procedia Manufacturing, vol. 33. pp. 493–500
Mugumbate, F. 2014. Overview of Zimbabwe's mineral resource potential - Tip of the Iceberg? Zimbabwe Geological Survey, Harare. Munyanyiwa, H., Hanson, R.E., Blenkinsop, T.G., and Treloar, P.J. 1997. Geochemistry of amphibolites and quartzofeldspathic gneisses in the PanAfrican Zambezi belt, NW Zimbabwe: evidence for bimodal magmatism in a continental rift setting. Precambrian Research, vol. 81. pp. 179–196.
Munyikwa, K., Haute, P. Vandenberghe, D., and Corte, F.D.E., 2000. The age and palaeoenvironmental significance of the Kalahari Sands in western Zimbabwe: a thermoluminescence reconnaissance. Journal of African Earth Sciences, vol. 30, no. 4. pp. 941–956.
Ohnenstetter, D., Fallick, A.E., and Fagan, A. 2014. The geology and genesis of gem corundum deposits. Mineralogical Association of Canada Short Course 44, pp. 29–112.
Oberthür, T., Davis, D.W., and Blenkinsop, T.G. 2002. Precise U–Pb mineral ages, Rb–Sr and Sm–Nd systematics for the Great Dyke, Zimbabwe — constraints on late Archaean events in the Zimbabwe craton and Limpopo belt. Precambrian Research, vol. 113. pp. 293–305.
Read, P.G. 2005. Gemmology.. Elsevier, London. 324 pp. Shangahaidonhi, T. and Gundani, B., 2014. The feasibility of value addition in the mining sector in the wake of the indigenization policy in Zimbabwe. Journal of Emerging Trends in Economics and Management Sciences, vol. 5, no. 2. pp. 128–137.
Shortell, P. and Irwin, E. 2017. Governing the gemstone sector: Lessons from global experience. Natural Resources Governance Institute. 68 pp. https:// resourcegovernance.org/sites/default/files/documents/governing-thegemstone_sector-lessons-from-global-experience.pdf [accessed 1 May 2020]).
Simmons, W.B., Pezzotta, F., Shigley, J.E., and Beurlen, H. 2012. Granitic pegmatites as sources of colored gemstones. Elements, vol. 8, no. 4. pp. 281–287.
Smit, K.V., Myagkaya, E., Persaud, S., and Wang, W. 2018. Black diamonds from Marange (Zimbabwe): a result of natural irradiation and graphite inclusions. Gems & Gemmology, vol. 54, no. 2. pp. 132–148.
Söderlund, U., Hofmann, A., Klausen, M.B., Olsson, J.R., Ernst, R.E., and Persson, P-O. 2010. Towards a complete magmatic barcode for the Zimbabwe craton: Baddeleyite U-Pb dating of regional dolerite dyke swarms and sill complexes. Precambrian Research, vol. 183. pp. 388–398.
Spiegel, S.J. 2009. Resource policies and small-scale gold mining in Zimbabwe. Resources Policy, vol. 34, no. 1-2. pp. 39–44.
Stocklmayer, V.R. 1981. The Umkondo Group. Precambrian of the Southern Hemisphere. Hunter, D.R. (ed.). Elsevier, Amsterdam. pp. 556–562.
Thomas, A. 2008. The Gemstones Handbook. New Holland, UK. 256 pp.
Treloar, P.J. 1988. The geological evolution of the Magondi Mobile Belt, Zimbabwe. Precambrian Research, vol. 38. pp. 55–73.
Vinyu, M.L., Hanson, R.E., Martin, M.W., Bowring, S.A., Jelsma, H.A., Krol, M.A., and Dirks, P.H.G. 1999. U–Pb and 40Ar/39Ar geochronological constraints on the tectonic evolution of the easternmost part of the Zambezi orogenic belt, northeast Zimbabwe. Precambrian Research, vol. 98. pp. 67–82.
Vinyu, M.L., Hanson, R.E., Martin, M.W., Bowring, S.A., Jelsma, H.A., and Dirks, P.H.G.M., 2001. U-Pb zircon ages from a craton-margin Archaean orogenic belt in northern Zimbabwe. Journal of African Earth Sciences, vol. 32, no. 1. pp. 103–114.
Von der Heyden, B.P., Todd, C., Mayne, M., and Doggart, S. 2023. Zipf rank analysis highlights the exploration potential for lithium-caesium-tantalum -type pegmatites in the Northern Cape, South Africa. Journal of African Earth Sciences, vol. 197. 104769.
Watson, R.L.A. 1969. The geology of the Cashel, Melsetter and Chipinga areas. Bulletin no. 60. Rhodesia Geological Survey. 85 pp.
Wiles, J.W. 1961. The geology of the Miami Mica field (Urungwe district). Bulletin no. 51. Southern Rhodesia Geological Survey. 246 pp.
Wilson, J.F., Nesbitt, R.W., and Fanning, C.M. 1995. Zircon geochronology of Archaean felsic sequences in the Zimbabwe craton: a revision of greenstone stratigraphy and a model for crustal growth. Special Publication 95. The Geological Society, London. pp. 109–126.
ZGS (Zimbabwe Geological Survey). 1994. Geological map of Zimbabwe (1:1million). Harare.
Zwaan, J.C., 2006. Gemmology, geology and origin of the Sandawana emerald deposits, Zimbabwe. Scripta Geologica, vol. 131. 211 pp.
Zwaan, J.C., Kanis, J., and Petsch, E.J., 1997. Update on emeralds from the Sandawana mines, Zimbabwe. Gems and Gemology, vol. 33. pp. 80–100. u
8-9 February 2024 — SANCOT/AITES/ITA Workshop 2024
Cape Town, South Africa
Contact: Gugu Charlie
Tel: 011 538-0238, E-mail: gugu@saimm.co.za
Website: http://www.saimm.co.za
12-13 March 2024 — GMG Kiruna Forum | Tomorrow’s Mining: Innovating to Improve the Way We Mine
Contact: Camielah Jardine
E-mail: camielah@saimm.co.za
Website: https://gmggroup.org/gmg-kiruna-forumtomorrows-mining-innovating-to-improve-the-way-wemine/
11-14 March 2024 — Southern African Pyrometallurgy
2024 International Conference
Sustainable Pyrometallurgy - Surviving Today and Thriving Tomorrow
Misty Hills Conference Centre, Johannesburg, South Africa
Contact: Camielah Jardine
Tel: 011 538-0237, E-mail: camielah@saimm.co.za
Website: http://www.saimm.co.za
19-25 April 2024 — World Tunnel Congress 2024 Shenzhen, China
Website: https://www.wtc2024.cn/
24-25 April 2024 — Drilling and Blast Online Short Course 2024
Sustainable Pyrometallurgy - Surviving Today and Thriving Tomorrow
Misty Hills Conference Centre, Johannesburg, South Africa
Contact: Camielah Jardine
Tel: 011 538-0237, E-mail: camielah@saimm.co.za
Website: http://www.saimm.co.za
20-23 May 2024 — The 11TH World Conference on Sampling and Blending 2024 Hybrid Conference
Misty Hills Conference Centre, Johannesburg, South Africa
Contact: Camielah Jardine
Tel: 011 538-0237, E-mail: camielah@saimm.co.za
Website: http://www.saimm.co.za
27-31 May 2024 — Nickel-Cobalt-Copper LithiumBattery Technology-REE 2024 Conference and Exhibition
Perth, Australia
Website: https://www.altamet.com.au/conferences/alta2024/
11-13 June 2024 — 15TH International Conference on Industrial Applications of Computational Fluid Dynamics
Trondhedim, Norway
E-mail: Jan.E.Olsen@sintef.no
Website: https://www.sintef.no/projectweb/cfd2024/
18-20 June 2024 — Southern African Rare Earths 2ND International Conference 2024 Swakopmund Hotel and Entertainment Centre, Swakopmund, Namibia
Contact: Camielah Jardine
Tel: 011 538-0237, E-mail: camielah@saimm.co.za
Website: http://www.saimm.co.za
3-5 July 2024 — 5TH School on Manganese Ferroalloy Production Decarbonization of the Manganese Ferroalloy Industry Boardwalk ICC, Gqeberha, Eastern Cape, South Africa
Contact: Gugu Charlie
Tel: 011 538-0238, E-mail: gugu@saimm.co.za
Website: http://www.saimm.co.za
5-7 August 2024 — 2nd Battery Materials Conference 2024 The Arena, Emnotweni Casino, Mbombela, Mpumalanga
Contact: Camielah Jardine
Tel: 011 538-0237, E-mail: camielah@saimm.co.za
Website: http://www.saimm.co.za
21-22 August 2024 — Mine Closure Conference 2024
Johannesburg, South Africa
Contact: Camielah Jardine
Tel: 011 538-0237, E-mail: camielah@saimm.co.za
Website: http://www.saimm.co.za
1-3 September 2024 — Hydrometallurgy Conference 2024
Hydrometallurgy for the Future
Hazendal Wine Estate, Stellenbosch, Western Cape, South Africa
Contact: Camielah Jardine
Tel: 011 538-0237, E-mail: camielah@saimm.co.za
Website: http://www.saimm.co.za
18-21 September 2024 — Infacon XVII 2024
17TH International Ferro-Alloys Congress Beijing, China
Website: https://www.infacon17. net/?sid=2178&mid=577&v=108
16-17 October 2024 — ESGS Conference 2024
ESG in the minerals industry challenges and opportunies Johannesburg, South Africa
Contact: Camielah Jardine
Tel: 011 538-0237, E-mail: camielah@saimm.co.za
Website: http://www.saimm.co.za
28-29 October 2024 — SANCOT Symposium 2024
Lesotho Highlands, Lesotho
Contact: Camielah Jardine
Tel: 011 538-0237, E-mail: camielah@saimm.co.za
Website: http://www.saimm.co.za
11-12 November 2024 — Mintek@90 Conference 2024
Sandton Convention Centre, South Africa
Contact: Camielah Jardine
Tel: 011 538-0237, E-mail: camielah@saimm.co.za
Website: http://www.saimm.co.za
The following organizations have been admitted to the Institute as Company Affiliates
3M South Africa (Pty) Limited
A and B Global Mining (Pty) Ltd
acQuire Technology Solutions
AECOM SA (Pty) Ltd
AEL Mining Services Limited
African Pegmatite (Pty) Ltd
Air Liquide (Pty) Ltd
Alexander Proudfoot Africa (Pty) Ltd
Allied Furnace Consultants
AMEC Foster Wheeler
AMIRA International Africa (Pty) Ltd
ANDRITZ Delkor(pty) Ltd
Anglo Operations Proprietary Limited
Anglogold Ashanti Ltd
Anton Paar Southern Africa (Pty) Ltd
Arcus Gibb (Pty) Ltd
ASPASA
Aurecon South Africa (Pty) Ltd
Aveng Engineering
Aveng Mining Shafts and Underground
Axiom Chemlab Supplies (Pty) Ltd
Axis House Pty Ltd
Bafokeng Rasimone Platinum Mine
Barloworld Equipment -Mining
BASF Holdings SA (Pty) Ltd
BCL Limited
Becker Mining (Pty) Ltd
BedRock Mining Support Pty Ltd
BHP Billiton Energy Coal SA Ltd
Blue Cube Systems (Pty) Ltd
Bluhm Burton Engineering Pty Ltd
Bond Equipment (Pty) Ltd
Bouygues Travaux Publics
Caledonia Mining South Africa Plc
Castle Lead Works
CDM Group
CGG Services SA
Coalmin Process Technologies CC
Concor Opencast Mining
Concor Technicrete
Council for Geoscience Library
CRONIMET Mining Processing
SA Pty Ltd
CSIR Natural Resources and the Environment (NRE)
Data Mine SA
DDP Specialty Products South Africa (Pty) Ltd
Digby Wells and Associates
DRA Mineral Projects (Pty) Ltd
DTP Mining - Bouygues Construction
Duraset
EHL Consulting Engineers (Pty) Ltd
Elbroc Mining Products (Pty) Ltd
eThekwini Municipality
Ex Mente Technologies (Pty) Ltd
Expectra 2004 (Pty) Ltd
Exxaro Coal (Pty) Ltd
Exxaro Resources Limited
Filtaquip (Pty) Ltd
FLSmidth Minerals (Pty) Ltd
Fluor Daniel SA ( Pty) Ltd
Franki Africa (Pty) Ltd-JHB
Fraser Alexander (Pty) Ltd
G H H Mining Machines (Pty) Ltd
Geobrugg Southern Africa (Pty) Ltd
Glencore
Gravitas Minerals (Pty) Ltd
Hall Core Drilling (Pty) Ltd
Hatch (Pty) Ltd
Herrenknecht AG
HPE Hydro Power Equipment (Pty) Ltd
Huawei Technologies Africa (Pty) Ltd
Immersive Technologies
IMS Engineering (Pty) Ltd
Ingwenya Mineral Processing (Pty) Ltd
Ivanhoe Mines SA
Kudumane Manganese Resources
Leica Geosystems (Pty) Ltd
Loesche South Africa (Pty) Ltd
Longyear South Africa (Pty) Ltd
Lull Storm Trading (Pty) Ltd
Maccaferri SA (Pty) Ltd
Magnetech (Pty) Ltd
Magotteaux (Pty) Ltd
Malvern Panalytical (Pty) Ltd
Maptek (Pty) Ltd
Maxam Dantex (Pty) Ltd
MCC Contracts (Pty) Ltd
MD Mineral Technologies SA (Pty) Ltd
MDM Technical Africa (Pty) Ltd
Metalock Engineering RSA (Pty)Ltd
Metorex Limited
Metso Minerals (South Africa) Pty Ltd
Micromine Africa (Pty) Ltd
MineARC South Africa (Pty) Ltd
Minerals Council of South Africa
Minerals Operations Executive (Pty) Ltd
MineRP Holding (Pty) Ltd
Mining Projections Concepts
Mintek
MIP Process Technologies (Pty) Limited
MLB Investment CC
Modular Mining Systems Africa (Pty) Ltd
MSA Group (Pty) Ltd
Multotec (Pty) Ltd
Murray and Roberts Cementation
Nalco Africa (Pty) Ltd
Namakwa Sands(Pty) Ltd
Ncamiso Trading (Pty) Ltd
Northam Platinum Ltd - Zondereinde
Opermin Operational Excellence
OPTRON (Pty) Ltd
Paterson & Cooke Consulting
Engineers (Pty) Ltd
Perkinelmer
Polysius A Division of Thyssenkrupp
Industrial Sol
Precious Metals Refiners
Rams Mining Technologies
Rand Refinery Limited
Redpath Mining (South Africa) (Pty) Ltd
Rocbolt Technologies
Rosond (Pty) Ltd
Royal Bafokeng Platinum
Roytec Global (Pty) Ltd
RungePincockMinarco Limited
Rustenburg Platinum Mines Limited
Salene Mining (Pty) Ltd
Sandvik Mining and Construction
Delmas (Pty) Ltd
Sandvik Mining and Construction
RSA(Pty) Ltd
SANIRE
Schauenburg (Pty) Ltd
Sebilo Resources (Pty) Ltd
SENET (Pty) Ltd
Senmin International (Pty) Ltd
SISA Inspection (Pty) Ltd
Smec South Africa
Sound Mining Solution (Pty) Ltd
SRK Consulting SA (Pty) Ltd
Time Mining and Processing (Pty) Ltd
Timrite Pty Ltd
Tomra (Pty) Ltd
Trace Element Analysis Laboratory
Traka Africa (Pty) Ltd
Trans-Caledon Tunnel Authority
Administarator
Ukwazi Mining Solutions (Pty) Ltd
Umgeni Water
Webber Wentzel
Weir Minerals Africa
Welding Alloys South Africa
Worley
DATE: 16-17 OCTOBER 2024

Environmental, Social, and Governance (ESG) considerations have become increasingly important in the business world, as it contributes to long-term sustainability and responsible corporate behaviour.
In the minerals industry, ESG considerations are particularly important due to the sector’s significant environmental and social impacts. Mining operations involve land use, energy and water consumption, and waste generation, which have lasting effects on ecosystems. Additionally, the industry faces challenges related to labour practices, community engagement, and the impact on indigenous populations.
An ESG-driven strategy is not only a responsible approach to business but also a strategic imperative for long-term success. It can contribute to risk mitigation, enhances reputation, attracts capital, and fosters innovation, making it a competitive advantage in today’s business landscape. In the mining industry, ESG considerations are crucial for addressing environmental and social challenges and ensuring the industry’s sustainable development.
The role of the Southern African Institute of Mining and Metallurgy (SAIMM) in the promotion of ESG is based on the premise that sustainability, and the contribution of the mining and minerals industry to society, is dependent on the professional and ethical conduct of minerals industry professionals – our members.
On this basis, the purpose and focus of this conference is to influence professional behaviour, and foster industry dialogue on sustainability and responsible mining through Environmental, Social, Governance, and Sustainability-related matters.
We invite you to share your knowledge and experience with an audience of like-minded individuals to inspire growth and change.


21-23 MAY 2024
MISTY HILLS CONFERENCE CENTRE
MULDERSDRIFT, JOHANNESBURG SOUTH AFRICA


The World Conference on Sampling and Blending (WCSB), to be held in South Africa, 21-23 May 2024, is the eleventh such conference to promote the Theory of Sampling (TOS). The WCSB conference provide a meeting place for professionals interested in sampling theory, practice, experience, applications, and standards.
The Conference will provide understanding and insights for academics, manufacturers, engineering firms and practitioners aiming to achieve representative sampling. TOS effectively identifies the source of sampling variability and provides valuable solutions for minimising each source of sampling uncertainty.
The aim of WCSB11 is to invite and encourage the diverse international sampling community to adopt and disseminate the concepts and ideas for a standardized approach to sampling embodied in the TOS. The Conference will also offer a forum for fruitful discussions between statisticians committed to ‘Measurement of Uncertainty’ (MU) and proponents of the TOS by offering a unifying foundation for development of better and more general standards. While the Theory of Sampling had its historical origins in the mining industry, today it also applies to sampling of a broad range of bulk materials, minerals, agricultural raw materials and products, the food, feed, and pharmaceutical industries, as well as sampling for environmental applications. WCSB11 is an event of global significance that aims to improve sampling practices in all sectors of science, technology, and industry, for consultants, managers, sampling and quality control staff, researchers, engineers, and manufacturers operating in many industries, The opportunity to meet,
exchange ideas, and share practical experiences will be a significant benefit for attendees.
The proceedings of the Conference will be published in electronic format with a strict adherence to an editorial and peer review policy that will allow academics to attract the publication subsidy for published academic research. Adherence to these standards will enable the wider dissemination of the TOS in international scientific, technological, and industrial sectors. WCSBs have helped to promote the teaching of TOS at universities, with postgraduate courses in TOS being taught in some countries. The Pierre Gy Gold Medal is awarded at each WCSB conference to individuals who have been most effective and successful around the world in disseminating and promoting TOS. This achievement will again be celebrated at WCSB11. The medallists are a unified body of champions capable of teaching, promoting, and researching aspects of sampling theory and practice, supporting the efforts of original equipment manufacturers to uphold TOS rules of sample representativeness. WCSB conferences aim to develop a unified vision for specific quality control protocols for sampling and blending activities, with participation and collaboration of industry professionals.
The theme of sustainable science, technology, and industry introduced at WCSB10 is upheld, with emphasis on the UN World Development Goals number 9 and 12, addressing sustainable industry, innovation, and infrastructure, and responsible production and consumption. Topics around societal, industrial, and environmental aspects of particulate sampling in mining,
FOR FURTHER INFORMATION, CONTACT:
Camielah Jardine, Head of Conferences and Events