

OFFICE BEARERS AND COUNCIL FOR THE 2023/2024 SESSION
Honorary President
Nolitha Fakude
President, Minerals Council South Africa
Honorary Vice Presidents
Gwede Mantashe
Minister of Mineral Resources and Energy, South Africa
Ebrahim Patel
Minister of Trade, Industry and Competition, South Africa
Blade Nzimande
Minister of Higher Education, Science and Technology, South Africa
President
W.C. Joughin
President Elect
E. Matinde
Senior Vice President
G.R. Lane
Junior Vice President
T.M. Mmola
Incoming Junior Vice President
M.H. Solomon
Immediate Past President
Z. Botha
Honorary Treasurer
E. Matinde
Ordinary Members on Council
W. Broodryk M.C. Munroe
Z. Fakhraei S. Naik
R.M.S. Falcon (by invitation) G. Njowa
B. Genc
S.J. Ntsoelengoe
K.M. Letsoalo S.M. Rupprecht
S.B. Madolo
A.T. van Zyl
F.T. Manyanga E.J. Walls
K. Mosebi
Co-opted Council Members
M.A. Mello
Past Presidents Serving on Council
N.A. Barcza C. Musingwini
R.D. Beck S. Ndlovu
J.R. Dixon J.L. Porter
V.G. Duke M.H. Rogers
I.J. Geldenhuys D.A.J. Ross-Watt
R.T. Jones G.L. Smith
A.S. Macfarlane W.H. van Niekerk
G.R. Lane – TP Mining Chairperson
Z. Botha – TP Metallurgy Chairperson
K.W. Banda – YPC Chairperson
S. Nyoni – YPC Vice Chairperson
Branch Chairpersons
Botswana Vacant
DRC Not active
Johannesburg N. Rampersad
Limpopo S. Zulu
Namibia Vacant
Northern Cape I. Tlhapi
North West I. Tshabalala
Pretoria Vacant
Western Cape A.B. Nesbitt
Zambia J.P.C. Mutambo (Interim Chairperson)
Zimbabwe Vacant
Zululand C.W. Mienie
*Deceased
* W. Bettel (1894–1895)
* A.F. Crosse (1895–1896)
* W.R. Feldtmann (1896–1897)
* C. Butters (1897–1898)
* J. Loevy (1898–1899)
* J.R. Williams (1899–1903)
* S.H. Pearce (1903–1904)
* W.A. Caldecott (1904–1905)
* W. Cullen (1905–1906)
* E.H. Johnson (1906–1907)
* J. Yates (1907–1908)
* R.G. Bevington (1908–1909)
* A. McA. Johnston (1909–1910)
* J. Moir (1910–1911)
* C.B. Saner (1911–1912)
* W.R. Dowling (1912–1913)
* A. Richardson (1913–1914)
* G.H. Stanley (1914–1915)
* J.E. Thomas (1915–1916)
* J.A. Wilkinson (1916–1917)
* G. Hildick-Smith (1917–1918)
* H.S. Meyer (1918–1919)
* J. Gray (1919–1920)
* J. Chilton (1920–1921)
* F. Wartenweiler (1921–1922)
* G.A. Watermeyer (1922–1923)
* F.W. Watson (1923–1924)
* C.J. Gray (1924–1925)
* H.A. White (1925–1926)
* H.R. Adam (1926–1927)
* Sir Robert Kotze (1927–1928)
* J.A. Woodburn (1928–1929)
* H. Pirow (1929–1930)
* J. Henderson (1930–1931)
* A. King (1931–1932)
* V. Nimmo-Dewar (1932–1933)
* P.N. Lategan (1933–1934)
* E.C. Ranson (1934–1935)
* R.A. Flugge-De-Smidt (1935–1936)
* T.K. Prentice (1936–1937)
* R.S.G. Stokes (1937–1938)
* P.E. Hall (1938–1939)
* E.H.A. Joseph (1939–1940)
* J.H. Dobson (1940–1941)
* Theo Meyer (1941–1942)
* John V. Muller (1942–1943)
* C. Biccard Jeppe (1943–1944)
* P.J. Louis Bok (1944–1945)
* J.T. McIntyre (1945–1946)
* M. Falcon (1946–1947)
* A. Clemens (1947–1948)
* F.G. Hill (1948–1949)
* O.A.E. Jackson (1949–1950)
* W.E. Gooday (1950–1951)
* C.J. Irving (1951–1952)
* D.D. Stitt (1952–1953)
* M.C.G. Meyer (1953–1954)
* L.A. Bushell (1954–1955)
* H. Britten (1955–1956)
* Wm. Bleloch (1956–1957)
* H. Simon (1957–1958)
* M. Barcza (1958–1959)
* R.J. Adamson (1959–1960)
* W.S. Findlay (1960–1961)
* D.G. Maxwell (1961–1962)
* J. de V. Lambrechts (1962–1963)
* J.F. Reid (1963–1964)
* D.M. Jamieson (1964–1965)
* H.E. Cross (1965–1966)
* D. Gordon Jones (1966–1967)
* P. Lambooy (1967–1968)
* R.C.J. Goode (1968–1969)
* J.K.E. Douglas (1969–1970)
* V.C. Robinson (1970–1971)
* D.D. Howat (1971–1972)
* J.P. Hugo (1972–1973)
* P.W.J. van Rensburg (1973–1974)
* R.P. Plewman (1974–1975)
* R.E. Robinson (1975–1976)
* M.D.G. Salamon (1976–1977)
* P.A. Von Wielligh (1977–1978)
* M.G. Atmore (1978–1979)
* D.A. Viljoen (1979–1980)
* P.R. Jochens (1980–1981)
* G.Y. Nisbet (1981–1982)
A.N. Brown (1982–1983)
* R.P. King (1983–1984)
J.D. Austin (1984–1985)
* H.E. James (1985–1986)
H. Wagner (1986–1987)
* B.C. Alberts (1987–1988)
* C.E. Fivaz (1988–1989)
* O.K.H. Steffen (1989–1990)
* H.G. Mosenthal (1990–1991)
R.D. Beck (1991–1992)
* J.P. Hoffman (1992–1993)
* H. Scott-Russell (1993–1994)
J.A. Cruise (1994–1995)
D.A.J. Ross-Watt (1995–1996)
N.A. Barcza (1996–1997)
* R.P. Mohring (1997–1998)
J.R. Dixon (1998–1999)
M.H. Rogers (1999–2000)
L.A. Cramer (2000–2001)
* A.A.B. Douglas (2001–2002)
S.J. Ramokgopa (2002-2003)
T.R. Stacey (2003–2004)
F.M.G. Egerton (2004–2005)
W.H. van Niekerk (2005–2006)
R.P.H. Willis (2006–2007)
R.G.B. Pickering (2007–2008)
A.M. Garbers-Craig (2008–2009)
J.C. Ngoma (2009–2010)
G.V.R. Landman (2010–2011)
J.N. van der Merwe (2011–2012)
G.L. Smith (2012–2013)
M. Dworzanowski (2013–2014)
J.L. Porter (2014–2015)
R.T. Jones (2015–2016)
C. Musingwini (2016–2017)
S. Ndlovu (2017–2018)
A.S. Macfarlane (2018–2019)
M.I. Mthenjane (2019–2020)
V.G. Duke (2020–2021)
I.J. Geldenhuys (2021–2022)
Z. Botha (2022-2023)
Editorial Board
S.O. Bada
R.D. Beck
P.den Hoed
I.M. Dikgwatlhe
B.Genc
R Hassanalizadeh
R.T. Jones
W.C. Joughin
A.J. Kinghorn
D.E.P. Klenam
J.Lake
H.M. Lodewijks
D.F. Malan
C.Musingwini
S.Ndlovu
P.N. Neingo
S.S. Nyoni
M.Phasha
P.Pistorius
P.Radcliffe
N.Rampersad
Q.G. Reynolds
I.Robinson
S.M. Rupprecht
K.C. Sole
T.R. Stacey
D.Vogt
F.Uahengo
International Advisory Board members
R.Dimitrakopolous
R.Mitra
A.J.S. Spearing
E.Topal
D.Tudor
Editor /Chairperson of the Editorial Board
R.M.S. Falcon
Typeset and Published by
The Southern African Institute of Mining and Metallurgy PostNet Suite #212 Private Bag X31 Saxonwold, 2132
E-mail: journal@saimm.co.za


JournalComment:Tickingboxeswon’trevivetheminingindustry byI.Robinson iv
President’sCorner:Mines,Wines,andArtattheMiningIndaba byW.C.Joughin v-vi
Advertising Representative
Barbara Spence
Avenue Advertising
THE INSTITUTE, AS A BODY, IS NOT RESPONSIBLE FOR THE STATEMENTS AND OPINIONS ADVANCED IN ANY OF ITS PUBLICATIONS.
Copyright© 2024 by The Southern African Institute of Mining and Metallurgy. All rights reserved. Multiple copying of the contents of this publication or parts thereof without permission is in breach of copyright, but permission is hereby given for the copying of titles and abstracts of papers and names of authors. Permission to copy illustrations and short extracts from the text of individual contributions is usually given upon written application to the Institute, provided that the source (and where appropriate, the copyright) is acknowledged. Apart from any fair dealing for the purposes of review or criticism under The Copyright Act no. 98, 1978, Section 12, of the Republic of South Africa, a single copy of an article may be supplied by a library for the purposes of research or private study. No part of this publication may be reproduced, stored in a retrieval system, or transmitted in any form or by any means without the prior permission of the publishers. Multiple copying of the contents of the publication without permission is always illegal. U.S. Copyright Law applicable to users In the U.S.A. The appearance of the statement of copyright at the bottom of the first page of an article appearing in this journal indicates that the copyright holder consents to the making of copies of the article for personal or internal use. This consent is given on condition that the copier pays the stated fee for each copy of a paper beyond that permitted by Section 107 or 108 of the U.S. Copyright Law. The fee is to be paid through the Copyright Clearance Center, Inc., Operations Center, P.O. Box 765, Schenectady, New York 12301, U.S.A. This consent does not extend to other kinds of copying, such as copying for general distribution, for advertising or promotional purposes, for creating new collective works, or for resale.
Honorary Legal Advisers
M H Attorneys
Auditors
Genesis Chartered Accountants
Secretaries
The Southern African Institute of Mining and Metallurgy 7th Floor, Rosebank Towers, 19 Biermann Avenue, Rosebank, 2196
PostNet Suite #212, Private Bag X31, Saxonwold, 2132 E-mail: journal@saimm.co.za
Telephone (011) 463-7940 . E-mail: barbara@avenue.co.za
ISSN 2225-6253 (print) . ISSN 2411-9717 (online)

Printed by Camera Press, Johannesburg Directory


Cave mine pillar stability analysis using machine learning by R.J. Quevedo, Y.A. Sari, and S.D. McKinnon ................................................................
A machine learning approach was used to evaluate the influence of operational factors on pillar stability at the Chuquicamata underground cave mine in northern Chile. The main factors contributing to collapse were found to be related to available pillar volume, cave front geometry, and time under abutment stress conditions. Improved control over such operational conditions can significantly reduce the likelihood of pillar collapse.
Predicting the strength, density, and porosity of rocks from roll crusher tests by S. Kahraman, I. Ince, M. Rostami, and B. Dibavar
A study was undertaken to develop prediction equations for compressive strength (UCS), tensile strength (BTS), and density and porosity values from the crushability index (CI) obtained from rock fragments. It was found that UCS, BTS, density, and porosity were strongly correlated with the CI. The CI test is a valuable method for estimating rock properties in drilling projects and in situations where core specimens are not available.
Mineralogical and chemical characterization of an oolitic iron ore, and sustainable phosphorus removal by W. Bendaikha, S. Larbi, and A. Ramdane
Oolitic iron ore from the Gara Djebiletdeposit in southwestern Algeria was characterized by X-ray diffraction, scanning electron microscopy, and energy dispersive spectrosopy. An eco-friendly phosphorus removal test was carried out using sulphurous geothermal water as the lixiviant, assisted by a solar thermal acceleration process. This is a promising ecofriendly and energy-saving approach to upgrading high-phosphorus oolitic iron ores using renewable resources.
Prediction of silicon content of alloy in ferrochrome smelting using data-driven models by A.V. Cherkaev, M. Erwee, Q.G. Reynolds, and S. Swanepoel
During ferrochrome smeltgin in submerged arc furnaces the content of silicon, which is both a contaminant and an indicator of the state of the process, in the alloy needs to be kept within a narrow range. This paper presents a systematic development of a data-driven model for Si content prediction. The most significant predictors were identified, and further analysis using thermodynamic data and models linked these predictors to electrode control and slag chemistry. This analysis lays the foundation for implementing Si content control on a ferrochrome smelter.
Remnants and isolated blocks of ground in the Klerksdorp Goldfield by J.P. Gouvea
The existing modelling criterion for the Klerkdorp Goldfield, derived from back-analysis of two mining-induced tremors in 2011, allowed minimal or no mining of isolated blocks of ground and remnants. While safety is the main consideration, an innovative numerical modelling approach, which includes the application of peak particle velocity designs, was developed to provide practitioners in the goldfield with a suitable criterion to justifiably and safely mine isolated blocks of ground and remnants. This would not always be possible if a conformist approach was used.
43
53
59
67
75


Ticking boxes won’t revive the mining industry
he mining industry, which has been the engine of growth of the South African economy for about 150 years, has stalled. Commodity prices have plunged and production costs risen as the infrastructure within which the mines operate has deteriorated. Production is restricted by erratic power supplies and exports are throttled by Transnet’s lack of capacity and problems at the ports. Mining companies have to spend vast sums both to protect their assets and for personal security. There are few new projects and exploration has dwindled to nearly zero. Beneficiation has moved backwards as more chrome and manganese ore is being exported and less is smelted domestically to produce alloys.
In late February Anglo American Platinum (Amplats) announced that it had initiated a Section 189A process that would result in the retrenchment of 3 700 employees. This followed Arcelor Mittal’s (Amsa’s) threat to close facilities at its Newcastle and Vanderbijlpark steel plants which would involve the loss of 3 500 jobs. Amsa blamed their problems largely on factors beyond their control, citing Transnet’s inability to provide an efficient rail transport service and the erratic supply and high cost of electricity.
Amsa also reported that steel demand had collapsed under the weight of a sluggish economy and a failing state, with the country’s apparent steel consumption declining by 20% over the last seven years to an annual level of about 4 million tons. As demand for steel is a key indicator of industrialization this shows that South Africa has deindustrialized over the last decade.
However, President Ramaphosa struck an upbeat note at the Mining Indaba in Cape Town when he announced that 39% of the South African mining industry is now owned by blacks and the audience responded with rapturous applause. Did that mean that ownership of the industry has now been expanded to a much larger number of blacks or simply that a few wealthy individuals have gained a larger share of the industry? If expansion in black ownership does not equate to an increase in benefits and prosperity for the wider black community then calculating ownership figures according to race is a mere box-ticking exercise.
It also raises the question of foreign ownership. Perhaps the architects of this ownership-by-race analysis could also inform the South African public of the percentage of our mining industry controlled by foreign companies. It would be interesting to know what proportion of the South African mining industry belongs to the Chinese through their ownership of chrome ore and alloy producer Samancor. Or the Russian oligarchs through their involvement in the production of manganese ore and alloys? Or the British through Anglo American? Are these figures available?
Furthermore, foreign owned companies like Samancor and Acerinox, the Spanish company that owns Columbus Stainless Steel, which are not listed on the Johannesburg Stock Exchange (JSE) deny South African citizens of all races any possibility of ownership of projects in their own country.
Evidently not prepared to face up to the really important problems facing the mining industry, MP Sylvia Lucas flippantly remarked during the State of the Nation (SONA) debate in Parliament that load-shedding was not ‘the end of the world’. Perhaps not, but certainly the cause of billions of rands in damage to the national economy.
Also during this debate, the Minister of Mines, Gwede Mantashe proudly asserted the government’s control of the mining industry, saying that ANC cadre deployment would continue and the ANC will continue to deploy ‘capable’ cadres because the party has brought about racial transformation. This may be so but he also needs to ask himself why the South African mining industry over which he presides was rated in May last year for the second time by the prestigious Fraser Institute in Vancouver, Canada, as one of the world’s ten worst destinations for mining investment.
I. Robinson


recently had the privilege of attending, and representing the SAIMM at, the inaugural Mines, Wines and Art, which was held in the Convent Courtyard at the Goodman Gallery in Green Point, Cape Town on Sunday 4 February 2024. This event, occurring on the eve of the ‘Investing in African Mining Indaba’, aims to establish itself as a highlight of the annual Mining Indaba gatherings. The Goodman Gallery showcased a thought-provoking exhibition featuring mining-themed works by esteemed South African artists David Goldblatt, William Kentridge, and Sam Nhlengethwa. Fine wines from estates with direct ties to mining, such as Vergelegen, Steenberg, Gabrielskloof, Wildekrans, and Boschendal, were served. The event was organized by the SAIMM and sponsored by Webber Wentzel.
The guest list included the king and queen of Lesotho, his Majesty, King Letsie III and her Majesty Queen Masenate Mohato Seeiso, along with Lesotho’s Ministers of Energy (Hon. Professor Nqosa Mahao) and Natural Resources (Hon. Mohlomi Moleko) and the Chairman of the Lesotho Highlands Development Agency (Mr Stephen Phakisi). The Royal Bafokeng Nation was represented by Kgosi Leruo Molotlegi. Also in attendance were the British High Commissioner to South Africa (His Excellency Anthony Phillipson), the CEO of the ICMM (Rohitesh Dhawan), the CEO of the Minerals Council (Mzila Mthenjane), Vice Chancellors of the University of the Free State (Professor Francis Pietersen), University of Cape Town (Professor Daya Reddy), University of Stellenbosch (Professor Wim de Villiers), Chairs and CEOs of Anglo American (Duncan Wanblad and Nolitha Fakude) and Seriti Coal (Mike Teke), among many other dignitaries.
The event, led by Michael Solomon as the master of ceremonies, featured brief but insightful addresses from various speakers, including myself, King Letsie III, Professor Daya Reddy (UCT), Professor Francis Petersen (UFS), and Mzila Mthenjane, all on the theme of a just transition in mining. Christo Els of Webber Wentzel delivered the closing remarks.
Overall, the event was a resounding success, offering guests the opportunity to mingle, explore the gallery, and enjoy a splendid dinner paired with delicious wine.
I extended my stay in Cape Town to participate in and deliver a presentation at another event organized by the SAIMM. This workshop, held on the Friday following the Mining Indaba, focused on tunnelling and was conducted in collaboration with the International Tunnelling Association (ITA) and the South African National Committee on Tunnelling (SANCOT). In an upcoming President’s Corner, I look forward to discussing SANCOT and its role within the SAIMM further.
I did not attend the Mining Indaba in person, as it’s more tailored for investors and my erudite colleagues in the mining, exploration, and ESG fields, rather than a specialist rock engineer like myself. However, I followed the event closely as it serves as a valuable indicator of the mining landscape in Africa.
It is encouraging that the South African President, Cyril Ramaphosa, attends the Mining Indaba and re-affirms the government’s commitment to the mining industry. Given that the industry contributes 7.5% towards the national GDP, accounts for 60% of exports by value, and employs approximately 476 000 people, this commitment is essential. The transformation
of black ownership in the industry from 2% in 2004 to the current 39% is truly remarkable. Importantly, the government acknowledges the crippling effects of unstable electricity supply, logistical bottlenecks (mainly port and rail), and illegal mining, cable theft, and other criminal activities on mining in South Africa. However, the implementation of critical interventions by government and business will determine whether meaningful reform takes place, to make South Africa a more attractive investment destination. The implementation of an efficient, transparent, and modern cadastral system for digital management of prospecting and mining rights applications is crucial for the mining industry, and the President announced that a preferred bidder had been selected to implement the system.
Each mining company underscored the critical significance of responsible mining practices, integrating sustainability into their business strategies, and making steadfast commitments to decarbonization. During the discussions, innovative approaches were showcased, such as investing in renewable energies, ensuring a just transition, and recycling. Not only do these approaches contribute to decarbonization efforts, but they also aid in securing energy requirements.
The International Council on Mining and Metals (ICMM) announced its intention to amalgamate responsible mining standards into a unified, globally recognized framework, collaborating with the World Gold Council, Copper Mark, and the Mining Association of Canada. This initiative will hopefully address the multitude of standards currently being applied and simplify the requirements for mine owners. The consolidated standard is intended to serve as a single reliable source of information, adopted throughout the industry.
As ESG pressures continue to mount, the focus on critical minerals such as copper for electricity distribution, as well as nickel, cobalt, and lithium for applications in solar, wind, and hydropower installations, along with the production of battery energy storage systems and electric vehicles, becomes increasingly vital. These minerals play a pivotal role in facilitating the global energy transition. This will undoubtably continue to create opportunities in Africa and contribute to the development of people and communities.
As a final note, I read with interest the recent announcement that a fleet of BMW iX5 hydrogen fuel cell electric vehicles (FCEVs) is now driving on South African roads. They are supported by a green hydrogen refuelling centre in Johannesburg, supplied by Sasol. The initiative was a joint venture between BMW, Sasol, and Anglo American. These luxury SUVs have a 125 kW drive train a 500 km range on 6 kg of fuel. Notably, one significant advantage of FCEVs over battery electric vehicles (BEVs) is their rapid five-minute refuelling time. It’s worth mentioning that the BMW iX5 fuel cell is provided by Toyota, a frontrunner in fuel cell development, who have their own Toyota Mirai, which is the best-selling FCEV in the USA. It will probably take some time for the green hydrogen fuel supply to roll out in South Africa and worldwide, and for FCEVs to become an affordable reality. However, the hydrogen economy holds tremendous potential for South Africa and PGM miners. Platinum and iridium are used in generating green hydrogen and potentially in proton exchange membrane (PEM) electrolysers. Most fuel cells utilize platinum as a catalyst, alongside lesser quantities of ruthenium. Both elements contribute distinctive traits of durability, power density, and efficiency to the fuel cells.
W.C. Joughin President, SAIMM

Affiliation:
1Department of Mining Engineering, Queen’s University, Kingston, Ontario, Canada.
Correspondence to:
R.J. Quevedo
Email:
20rjq@queensu.ca
Dates:
Received: 23 Dec. 2022
Revised: 21 Nov. 2022
Accepted: 23 Nov. 2023
Published: February 2024
How to cite:
R.J. Quevedo, Y.A. Sari, and S.D. McKinnon. 2024
Cave mine pillar stability analysis using machine learning.
Journal of the Southern African Institute of Mining and Metallurgy, vol. 124, no. 2. pp. 43–52
DOI ID:
http://dx.doi.org/10.17159/24119717/2509/2024
by R.J. Quevedo1, Y.A. Sari1, and S.D. McKinnon1
Synopsis
The large scale of cave mines leads to many challenges, including operational logistics and geomechanics design. In current practice, pillar stability assessment relies almost exclusively on stress analysis. However, stability is also affected by other factors including those related to operational aspects of the mining method, the effects of which are difficult to account for during the design stages. In this paper we present a case study of the application of a machine learning approach to evaluate the influence of these operational factors on pillar stability at the Chuquicamata underground cave mine in northern Chile.
Due to the likely multi-factorial damage process leading to collapses and considering the different pillar conditions, a tree-based machine learning method was used and analysed to improve the understanding of the relative importance of the various contributing factors. Unlike stress analysis methods, it does not require any a priori knowledge of failure mechanisms, nor the calibration of associated controlling parameters. The proposed random forest model predicted pillar collapses with 80% accuracy despite limited samples to model from. The main contributing factors to collapses were found to be related to available pillar volume, cave front geometry, and time under abutment stress conditions. The effects and interactions of such factors were also studied, showing that careful and improved control over operational conditions can significantly reduce the likelihood of pillar collapses. These conclusions could not have been obtained from stress analysis alone, illustrating the complementary nature of conventional stress analysis and machine learning approaches.
Keywords cave mining, pillar stability, machine learning, random forest.
Introduction
Cave mines represent the largest type of underground mines, and their scale leads to many challenges, including large capital investment requirements, operational logistics, and geomechanics design. This paper focuses on the latter, and on stability assessment of pillars. Their design, as with virtually all types of pillars, relies almost exclusively on stress analysis. However, there are other factors, including those related to operational aspects of the mining method, that affect stability and these can be difficult to quantify during the design stage. This paper outlines these challenges and presents a case in which machine learning was used to develop a better understanding of the various factors affecting stability so that they can be appropriately accounted for in both the design process and in mining operations.
The case under consideration is pillar stability at the Chuquicamata underground cave mine in northern Chile (Flores and Catalan, 2018). During mining of the first macroblock, severe damage to production level tunnels occurred, leading to pillar collapses. Since all collapses occurred behind the cave front, the collapse process was clearly not only stress-related. Due to the likely multi-factorial damage process, machine learning was selected as the analysis methodology as it had the potential to lead to an improved understanding of the relative importance of the various contributing factors, and does not require any a priori knowledge of failure mechanisms as does numerical modelling, nor the calibration of the associated controlling parameters.
This paper explores the impact that operational, geological, and geotechnical parameters have in pillar collapse development in a real caving scenario as part of an attempt to improve the understanding of this mode of rock mass failure. The traditional methods of pillar stability analysis, alongside machine learning (ML) methods and their characteristics, are discussed. The collapse phenomenon is described, and a treebased ML modelling approach is applied using a set of features based on conjectured contributing factors inferred from detailed observations of the damage process in the mine. The results of the study and the insights gained from the model provide guidelines that can be used to aid operational practice in caving environments.
Background
Mining context
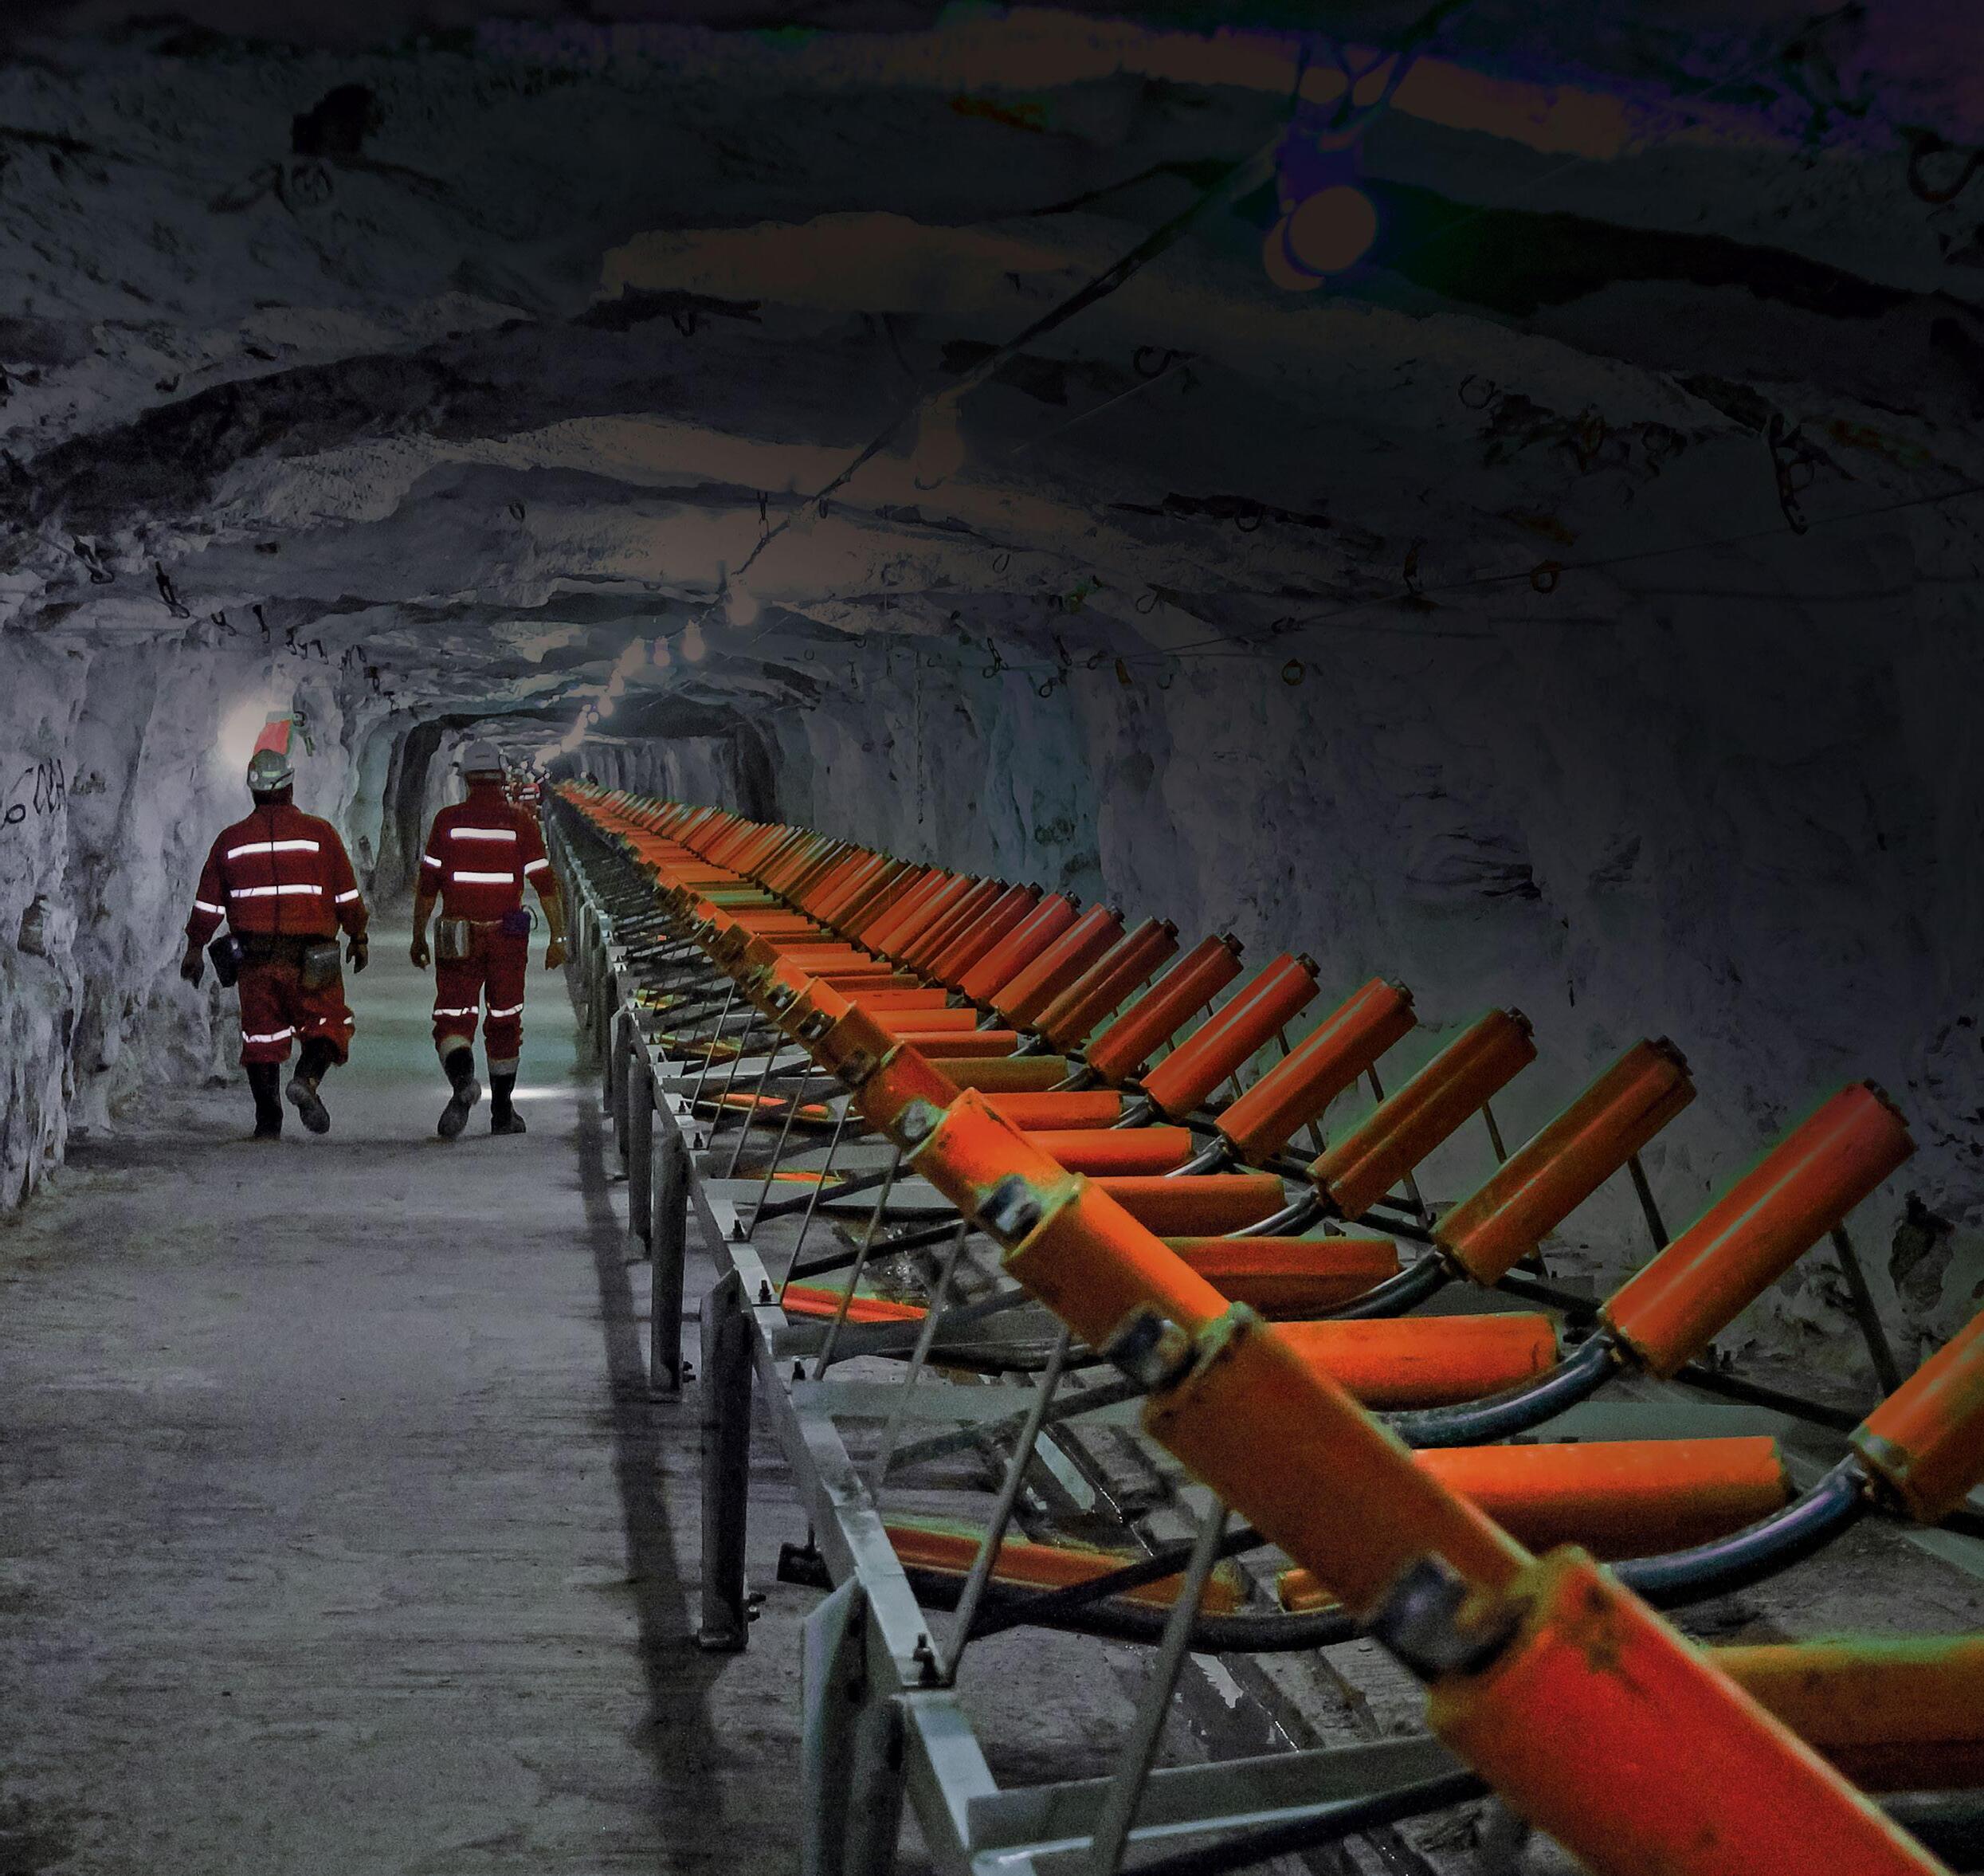
The Chuquicamata underground mine is located in a massive copper porphyry deposit, and is designed to continue exploiting the orebody that has been historically mined by open pit. The underground operation is projected to recover 1760 Mt of copper ore at a grade of 0.7% and rate of 140 000 t/d after achieving full productive capacity, extending the mine life for another 40 years (Flores and Catalan, 2018). The mining method is block caving using a post-undercutting macroblock (MB) variant with multiple levels, located directly underneath the open pit as shown in Figure 1.
Production to date has been principally from the central MB (shown in Figure 1), with MBs to the immediate north and south sequenced to commence production prior to completion of the central MB. Simultaneous extraction from multiple MBs enables the planned production rate to be achieved. Each MB is 280 m long and 128 m wide, and the production and undercut levels use the well-known El Teniente layout (Araneda and Sougarret, 2008), which consists of parallel main haulage tunnels with drawpoints and drawbells offset by 60°. Pillar dimensions are defined by the 32 x 16 m extraction mesh (measured along the sides of pillars), with a height of 18 m between undercut and production levels as shown in Figure 2. The resulting pillar geometry, once the drawbells and production excavations are extracted, is complex.
Although establishment of the production levels and undercut excavations entails a high capital cost, caving methods have low operating costs per ton as high-draw columns cave and fragment


under the combined actions of gravity and induced stresses around the cavity boundary. However, the same stress conditions that favour sustained cavity growth also result in high abutment stresses. Since drawbells are opened ahead of the advancing cave front in the post-undercut method, pillars are subjected to these high abutment stress conditions.
To mitigate stress-related effects, operational guidelines have been established, known as ‘caving rules’, that derive from technical, operational, and empirical knowledge about cave mining (Cavieres and Rojas, 1993; Butcher, 1999). Through the application of these rules, the cave-back and cave-front geometries are monitored and controlled, along with numerous other aspects of the operation, to ensure the safety and stability of the mine by regulating the establishment, initiation, propagation, and breakthrough of the caving process (Cuello and Newcombe, 2018). The implementation of and compliance with these rules has a wide array of impacts on caving performance, ore production rates, and stability as well as construction costs and schedules. Aspects of mine development such as sequencing, undercutting rate, allowable lead-lags, drawbell opening rates, and extraction rates are addressed through these rules (Beard and Brannon, 2018), ultimately controlling the caveback geometry and growth (Cornejo, et al., 2016), on which the development of pillar collapse is considered to be highly dependent (Landeros 2012; Cornejo, 2014).
An important consideration for the Chuquicamata underground mine is that the central MB was the first to be caved. Despite over 100 years of open pit operating experience, the caving process was new; the resulting stress environment and rock mass and excavation stability conditions being completely different from those of an open pit. Similarly, while general aspects of caving rules may apply to any orebody, many aspects of rock mass behaviour depend on specific characteristics of the local geological conditions and stress environment. Uncertainties in behaviour are therefore expected to be most pronounced during the early stages of mining, and this was found to be the case at Chuquicamata.
As undercutting progressed over the footprint of the central MB, damage was observed in the sidewalls of the production level tunnels, initiating ahead of the advancing undercut, with deterioration continuing behind the cave front. The damage appeared to be associated with drawbell opening and the lead-lag of the cave front along adjacent undercut tunnels. Figure 3 shows two examples of this damage, consisting of moderate sidewall fracturing and bulking through to intense fracturing and deformation defined as the collapse state. These levels of deformation occurred over periods of days to weeks, i.e., they were not sudden events. The locations of pillars that had collapsed as of November 2020 are shown in Figure 4.


Collapse is a matter of definition. Previous studies (Pardo et al., 2012) have defined collapses as a gradual failure of the rock mass where deformation slowly develops across drifts, leading to the full closure of the cross-sections in worst-case scenarios. While this definition addresses collapse development and manifestation, it is also relevant to consider other definitions from the perspective of load-carrying capacity, operational function, and safety.
Owing to their complex geometry (Figure 2), pillars in cave mines have a relatively squat shape (high width to height ratio), such that ‘collapse’ may not involve a sudden catastrophic loss of load-bearing capacity. It has been well-known for some time that larger volume pillars may exhibit plastic or even strain hardening post-peak behaviour (Jager and Ryder, 1999), so loss of load-bearing capacity is not an adequate definition of failure in this case.
Considering the level of deformation shown in Figure 3, a more general definition of failure, stated as ‘the inability of a system or component to perform its required functions within specific performance requirements’ (IEEE, 1990) is appropriate. For the design of pillars, the performance requirement limits are best expressed in terms of allowable deformation on the production level, which may be further linked to allowable support deformation limits for safety and infrastructure operational requirements.
In the light of the perspectives from previous studies of the subject, the specific terminology used by the mining company to address these events and the more general definition of failure in terms of functionality of a component in a system, for this case study a ‘collapsed pillar’ refers to a pillar unit that has undergone deformation that resulted in the loss of functionality (i.e. no longer being able to fulfill its original purpose) due to the level of progression reached by the deformations and the complex sidewall fracturing.
In the collapsed pillars, in addition to sidewall fracturing and deformation, other characteristics of the failure process included the complete absence of floor heave, and almost total absence of roof damage. Most importantly, although damage initiated ahead of the cave front, generally within the abutment zone of influence, in every case the collapses occurred behind the cave front. This is particularly notable since loading of pillars by the draw column is believed to be significantly less than the peak (computed) stress magnitude experienced at the cavity abutment (Pierce, 2019). This
observation implies that pillar damage was not purely related to the effects of stress. In this regard, previous studies have linked collapses to factors such as
➤ Cave-front geometry
➤ Relative cave-front position with respect to production level pillars
➤ Presence of remnant pillars in the undercut level associated with deficient blasting during undercutting
➤ Damage in the undercut level caused by increased abutment stress
➤ Reduction of the pillar dimensions in the undercut level by overbreak during construction
➤ Unfavourable global cave-front geometry and extraction angle that conditions the overall cave-back geometry
➤ Geological conditions (e.g. presence of major faults perpendicular to the direction of advancement of the caving). (Gomes, Rojas, and Ulloa, 2016; Cornejo 2014; Landeros, 2012). However, for this case study the factors involved, and their relative importance was not clear.
Pillar stability can be assessed using a variety of methods, among which empirical formulae and numerical modelling are the most frequently employed (Zhou, et al., 2015). The simplest approaches are empirical strength formulae (Salamon and Munro, 1967; Obert and Duvall, 1967; Lunder and Pakalnis, 1997; Martin and Maybee, 2000; Esterhuizen, et al, 2011) that use simple parameters such as width, height, strength, plus calibration constants, and which are still widely used in early stages of design (Sinha and Walton, 2019; Kersten, 2019). While these approaches could oversimplify the stability assessment problem, they can be reliable provided they are calibrated using sufficiently large case databases, accounting for site variability by applying appropriate Factors of Safety. An advantage is that they do not require an understanding of failure mechanisms (Stacey and Wesseloo, 2022; Elmo, et al., 2021), although the factors incorporated in the formulae should be directly related to (or be proxies for) the most important elements controlling the failure process, which in this framework are based on experience and insight.
Despite their widespread use, these formulae only apply to the pillar geometry, rock mass, and stress conditions for which they are calibrated. This precludes their application for cave mine pillar stability assessment for three principal reasons. Firstly, as shown in Figure 2, pillar geometry in cave mines is relatively complex. Subtle variations in this geometry may lead to different failure modes, which are not conducive to the development of case databases that are relevant for application at other mines (Stacey and Wesseloo, 2022). Secondly, the stress conditions applied to pillars in cave mines are complex, depending on many factors including the geometry of the cavity at the time of pillar formation, lead-lag of the cave-front, timing of drawbell opening, and advance rate, to name just a few. These complexities in stress path are difficult to account for empirically. Thirdly, pillar failure has often taken place behind the cave front, suggesting that factors unrelated to stress are at play. These may include progressive deterioration of the rock mass of the pillars that is initially triggered during abutment loading, variability of loading conditions during the ore draw process, and also wearinduced changes in the (pillar) geometry – leading to further changes in the internal stress conditions. Many of these factors are operationally induced, hard to anticipate and quantify, and difficult to account for in stability analysis.
In cave mines, the most extreme pillar loading condition exists in the immediate abutment zone of an advancing cave front (Pierce, 2019), which in conventional undercutting corresponds to the location where drawbells are blasted and the final pillar geometry is formed. Pillar stability is therefore strongly linked to the next (larger) scale of design (i.e. macrosequence) and requires the inclusion of sufficient detail at the panel, block, or mine scale such that stress conditions induced by the large-scale geometry are adequately considered. Empirical methods such as those used for the design of simpler pillars shapes in conventional room-andpillar mining cannot account for all these factors (Maritz, 2014), hence the prevalence of numerical modelling in cave mine design (Hormazabal et al., 2018).
Numerical modelling has many advantages in being able to represent the complex geometrical conditions in cave mining, but still has limitations. Due to the extensive range in scale that must be included in the models, resolution limits arise at the pillar scale, requiring the rock mass to be represented as an equivalent continuum material. This constrains the failure modes that can be represented even when using complex stress-strain constitutive relationships (e.g., strain softening). Therefore, while mapping at the tunnel scale may reveal a rock mass with various discontinuities and lithological inhomogeneities, these typically cannot be incorporated into numerical models, which must be sufficiently spatially extensive to capture the block- or panel- scale geometry and rock mass characteristics. Similarly, experienced miners know that operationally controllable factors such as cave-front advance rate, blasting practice, lead-lags of cave-front geometry, among others, can also affect stability (Ferguson et al., 2017). Having no known constitutive laws, these factors do not fit into this framework, which means that rock mass behaviour is not adequately represented at the pillar scale in numerical modelling, due to not only its implicit constrains, but also to it not accounting for other factors influencing the failure processes.
In this context ML provides a powerful and complementary analysis tool since it incorporates techniques that can be applied, provided sufficient ‘training’ cases exist. These methods are well-suited to finding relationships and patterns (correlations) between various factors and ranking their importance, which is fundamentally different from numerical modelling, which requires a priori inclusion of the constitutive behaviour controlling the failure process. Thus, the ML approach offers the possibility to identify which factors should be investigated and understood so that they may later be incorporated into deterministic methods of analysis based on failure mechanisms.
Machine learning (ML) is a subfield of Artificial Intelligence (AI) composed of analysis methods that can automatically detect patterns in data and use them in behaviour prediction or decisionmaking under uncertainty (Murphy, 2012). These tools make it possible to model functions that map a set of inputs to a given output value by using recorded observations (data-points), which in turn can be used to forecast outcomes and even their respective probabilities.
In general, ML does not require prior knowledge, statistical assumptions, or rule definitions to work with the data, unlike many statistical methods and expert systems (Lawal and Kwon, 2021). ML can handle input complexity and can work with data-sets composed of different variables while still being able to determine interactions between them, which is crucial for interpretation. Furthermore,
certain model types can quantify the relative importance of the inputs based on how they affect their internal parameters
Owing to these advantages, ML methods have gained traction in many scientific fields leading to significant breakthroughs, due to their ability to handle and model complex problems, such as those encountered in rock mechanics (Jordan and Mitchell, 2015; Lawal and Kwon, 2021). Regarding pillar stability analysis, ML algorithms offer ways to capture complex nonlinear relationships between different parameters, numerical model representations, and observed rock mass phenomena, and subsequently conduct more precise sensitivity analyses of the model’s inputs to ensure the mechanics are being captured (Morgenroth, Khan, and Perras, 2019). These methods are being used in geomechanics-related problems such as rockbursts, tunnel deformation, rock mass classification, determination of strength properties, and stress-strain behaviour modelling, but there are few documented examples of applications to pillar collapse phenomena (Quevedo et al., 2019). However, these applications do not focus on the contribution of design and operational factors to the development of this type of rock mass failure, which is further explored in this paper.
Supervised learning (SL) is a branch of ML that aims to model and predict the value of an outcome measure based on a set of given input measures (Zhou, Li, and Mitri, 2015) either as regression of a continuous value or classification in discrete categories. In a classification problem, the output y is defined as y∈{1,…,C} where C is the number of classes. Then, the problem can be expressed in terms of function approximation, where some unknown function f represents the relationship between the inputs and the outputs:

Using the labelled training set, SL algorithmically models the function f such that predictions can be made using y ^ = f ^ (x), where y ^ is the estimate of the output and f^ is the estimate of the function f. It is crucial that f^ estimates the outputs well, not just for the training observations but also for unseen instances, which means that when f^ is obtained after training, f^ should be able to generalize to unseen instances that were not included during the training process. This is a key concept in ML; it ensures that an underlying process is being captured, and it is different from just ‘memorizing’ the input-output pairs in the training set, which would be a case of overfitting. For this reason, the available data-set is typically divided into different portions, one for training and another for testing purposes. Then, the performance of f ^ as an estimation of f would be evaluated over the instances that compose the latter by having been trained on the former.
Tree-based methods are a subset of ML models that rely on decision- ree algorithms, meaning they essentially split observations based on rules learned from their structure in a data-set. They offer flexibility, high predictive power, and have the capacity to detect interactions and nonlinearities contained in the data. They constitute a great baseline approach since they are nonparametric, giving them the advantage of not relying on prior statistical assumptions and not being hypersensitive to outliers or unbalanced data. These characteristics make them popular in many different research fields since they can handle multifaceted data (Carvalho et al., 2018). Tree ensemble methods are built as conglomerates of decision tree algorithms inheriting their properties, that
is, they separate data into subsets by minimizing an impurity function, creating splits on the data-set that aim to isolate the most homogeneous instances contained in the most different sets (Breiman et al., 2017; Hastie, et al., 2009). The conglomerate is composed of simple decision trees that purposely behave as weak function approximators individually, and poorly capture the behaviour of the data by themselves but collectively compensate and help each other, ultimately acting as a robust and powerful function approximator, significantly improving the final performance, in contrast to a model composed of a single base learner (Rincy and Gupta, 2020). This is the basic concept of Ensemble Learning (EL), which can be intuitively understood as averaging different hypotheses and therefore reducing the risk of choosing an incorrect one (Sagi and Rokach, 2018).
For this case study the problem is tackled as a class prediction problem where the goal is to predict whether a pillar collapse will take place given a set of attributes (X), indicated as a value of 1 in case of a collapses and 0 otherwise. The number of classes is two, thus constituting a binary classification problem where f (X) is estimated by learning f^ (X) through the minimization of a cost function C. For decision trees, the minimization of C leads to splits which ultimately separate data-points, organizing portions of the data-set into similar groups, where C takes the shape of

Here C represents the average cost of a tree having a set of observations mt being split into groups m1 and m2 according to an impurity metric I (typically Gini or entropy). By using the values of the features contained in X as thresholds, splits are evaluated at every data-point. In this way a feature value is selected as a split if at that threshold the value of C is minimal.
Random forest (RF) is an EL tree-based approach that implements the above splitting strategy across collections of decision trees. It samples several instances from a data-set through a procedure known as bootstrap aggregation, building a tree on each separate set of randomized bootstrapped instances, making them completely independent from each other. This whole set of trees is called a forest. In addition to the random sampling of instances, random feature sampling can also be incorporated for the bootstrapping process, thus increasing randomness across the trees in the forest by having each tree randomly biased. Since the
forest output is built by averaging outputs from every single tree that composes it (Figure 5), such biases are averaged out and potential overfitting issues are reduced (Breiman, 2001).
Through bootstrapping, some observations of the data-set will not be sampled when building the model even if they are incorporated in the training set. Therefore, this technique provides a set of unsampled instances referred to as out-of-bag (OOB) samples that can be used to estimate the final performance of the RF, similar to having an extra test set. Furthermore, RF models, like other treebased methods, make it possible to obtain relative metrics of the importance of the input features based on their contribution to the impurity reduction process of the learning algorithm.
In this case study, pillar damage is predicted by using a RF model incorporating historical information through the following steps:
➤ Data preprocessing and feature selection to determine the input attributes
➤ Portioning the data-set into training and test sets
➤ Training a RF and measuring its generalization performance on the test set
➤ Analysing the feature effects and interactions.
For every pillar, a series of features related to its operational conditions, geological architecture, local rock mass strength properties, and stress environment was collected. These included operational- and design-related conditions listed in the caving rules, such as the number of drawbells that were opened in its vicinity, maximum lead-lag, time under abutment stress conditions, among others.
A preliminary feature selection process was carried out aiming to keep most conceptually representative and unbiased features and to remove non-informative, correlated, and redundant features. In general, feature selection helps ML algorithms by improving learning efficiency and model performance while also simplifying learning results (Cai et al., 2018). In this case, features were analysed with the Spearman correlation, which is a good proxy for feature redundancy in tree-based models since it detects monotonic relationships that would not be conducive when using this ML model architecture.

The final set of input features after the feature selection process is shown along with their description in Table I.
Modelling
Following the SL approach described earlier, the training and testing sets were obtained considering the sequence of events and information sufficiency of the labelled instances, giving rise to the split shown in Figure 6.
Using this instance separation, the collapse ratios in the sets were 39%, 69%, and 55% for the training set, test set, and the
Features used to characterize pillars in the analysis, with ranges of values
complete data-set respectively. Since these ratios differ significantly, the possibility of the model learning a naive approach that mainly reproduces the ratio of collapses was suppressed, thus success in modelling could be reasonably attributed to the information contained in the selected features and not simply to the replication of an average behaviour. The pillar coordinates (x,y,z) were not included alongside the rest of the features to avoid fitting the model directly to spatial information, instead forcing focus on generalizable parameters of rock mass conditions and operational parameter history.
projected in plan view as a proxy for the total pillar volume
that a pillar is under abutment stress condition
drawpoints
Average number of open drawpoints surrounding a pillar before the cave front reaches its position Inactive drawbell time
Time between drawbell opening and its incorporation in extraction activities under the caving line
compressive strength of pillar
mapped fracture frequency observed on rock mass
curvature of a smoothed projection of the CF in plan view as a measure of concavity or convexity

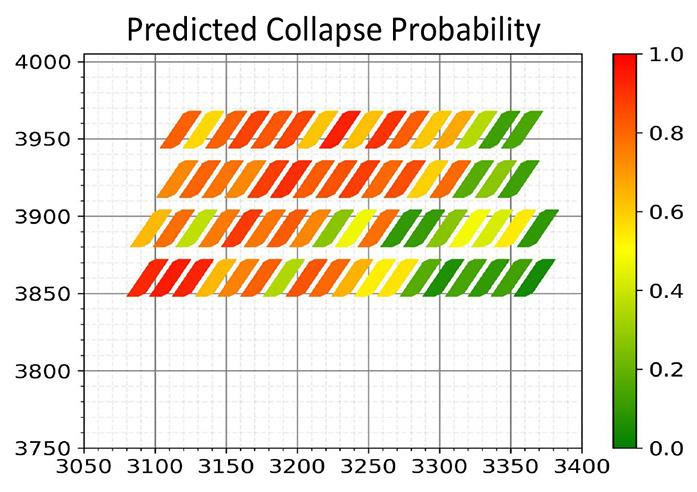
The expected accuracy of the model was estimated using the OOB score that the RF architecture provides, which reached a value of 81% accuracy, indicating a sufficiently good model. The real test set accuracy was measured at 78%, which is close to the expected accuracy obtained from the OOB score and shows consistency in the modelling process. Considering these results and the sampling approach, the model generalization was visualized across the footprint and an adequate representation of the phenomena in the test set was observed, as shown in Figure 7.
Evaluating the modelling results as acceptable and spatially representative of the collapse distribution in the footprint, model analysis was carried out to understand how the selected input features affect the modelled collapse response.
Model and feature effect analysis
Explainability of ML models becomes difficult when implementing flexible but complex architectures such as ensemble methods. This aspect is usually considered as a trade-off and is an active area of research that has resulted in different approaches to interpret the inner workings of ML models (Agarwal and Das. 2020; Goldstein et al., 2015). By using these approaches, feature importance, effects, and interactions were studied.
The feature impacts were first studied via the MDI metric, which represents each feature’s contribution to the generation of splits during the learning algorithm’s process when trees are built in the forest. It is calculated by computing the total loss reduction that a given feature contributes across all the splits generated through it (Li et al., 2019). The feature rankings according to the MDI metric are presented in Figure 8.
The highest ranked features correlate well with those initially hypothesized as being the main drivers of collapses according to expert assessment and previous studies of this type of failure (Landeros, 2012; Cornejo, 2014) where parameters such as pillar area, cave front geometry, and time under abutment stress are highlighted.
Nevertheless, although the MDI metric is commonly used in tree-based models, it is important to complement this featureimportance approach with other techniques since MDI can misrepresent the actual contribution of certain features, for example, by overemphasizing continuous and/or discrete categorical features with high cardinality (Strobl et al., 2007). Moreover, MDI does not provide an explanation of how the values of certain features can affect the output of the model.
To gain a quantitative appreciation of how these features contribute to pillar collapse, their individual and combined effects were analysed through partial dependence (PD) with individual conditional expectation plots (ICE) (Friedman, 2001).


The PD function of a model describes the expected effect of certain features after marginalizing out the effects of all others by taking their average value. Thus, a PD plot (PDP) shows the change in the average predicted value of a model as the selected features vary over their marginal distributions. A PDP helps visualize the average partial relationship between the predicted response and one or more features (Molnar et al., 2021; Elith, et al., 2008; Goldstein et al., 2015). It is important to note that these visualizations do not perfectly represent the effects of each feature in the model but are a useful basis for interpreting their impact when there are strong effects caused by a feature or a combination of them. Also, by disaggregating the PDPs by plotting individual conditional curves that form the average, a series of ICE plots can be obtained to visualize variabilities in the conditional relationships (Goldstein et al., 2015).
The visualizing tool for this exercise was PDPbox (Jianchung, 2018), which allows plotting of ICEs and PDPs simultaneously. The pillar area and time under abutment stress were selected for this analysis since intuitively the best condition for a pillar would be to have a well-preserved volume exposed to adverse conditions for short periods. The individual effects of these parameters are shown in Figure 9. Both features exhibit a behaviour in which they start to significantly affect the model output after they cross a certain threshold, and their combined effect can be appreciated through the PDP interaction visualization shown in Figure 10.
Based on the behaviour of the main features under analysis displayed in Figures 9 and 10, it is observed that low values of ‘pillar area’ significantly increase the probability of a pillar being classified as collapsed, as do high values of ‘time in abutment’.
Figure 9 shows that ‘pillar area’ has a critical influence over the output and a distinct threshold at the 225 (m2) mark can be seen. Values above that threshold significantly diminish the probability


of a pillar being categorized as collapsed. Keeping areas above 230 [m2] can reduce that probability by more than 30%, which can be achieved with careful operational control over drilling and blasting activities during tunnel construction and drawbell opening. On the other hand, high values of ‘time in abutment’ contribute positively to drive the target response to a collapse. The effect accentuates starting from the 3rd month mark and can increase to 15% at the 5th month mark.
Figure 10 shows a region where high ‘pillar area’ values and low ‘time in abutment’ values coexist, and collapse probability is very well restrained. This implies that even when accounting for the other various effects that the mean values of the remaining features have on the model, it should still be possible to mitigate the development of collapses by exerting control over only these two features. Moreover, the individual feature threshold of ‘pillar area’ detected in Figure 9 is also present in Figure 10, showing that under the 225 (m2) threshold it is no longer possible to regulate the outcome by controlling the ‘time in abutment’, as the outcome becomes insensitive to it.
Since ML and complex model architectures can be effective at modelling phenomena without a deep understanding of the inner workings of the data or their algorithms, it is not wise to deploy them without addressing aspect such as input feature selection, interpretation versus complexity trade-offs, and result analysis (Rudinm 2019; Lawal and Kwon, 2021; McGaughey, 2020).
Considering the sampling approach, the model accuracy, and the information extracted from the interpretation approaches alongside
their coherence with expert evaluation, it is possible to state that the selected features contain sufficient information to adequately model the phenomena. It also confirms the validity of concepts contained in the ‘rules of caving’ as being significant parameters that can control overall stability in this caving scenario, which further validates the feature selection. The results also show that even if the loads should not be enough to cause rock mass failure according to stress criteria alone, operational elements do have a significant influence on pillar stability.
In physical terms, the results indicate that a collapse is more likely to develop when pillars are subjected to high loads for long periods. The reduction in rock strength when loaded for long time periods (static fatigue) has been known for some time (Lajtai and Schmidtke, 1986). It has been studied in connection with the underground storage of nuclear waste (Damjanac and Fairhurst, 2010) and is the subject of ongoing investigation (Shirani Faradonbeh, et al., 2022); however, it has not to date been incorporated into the ‘rules of caving’ Although it has been identified as a critical factor in pillar degradation and stability, it cannot yet be strictly generalized as it is dependent on the characteristics of the rock mass in which mining is taking place.
In practical terms, the presence of the threshold at 225 [m2] in ‘pillar area’ shows the dominance of this feature over the general outcome. Since it is an operational parameter, the vulnerability to time-dependent degradation effects can be mitigated through good practices that ensure proper pillar volume preservation. It should be noted that ‘cave front curvature’, which is a cave-back geometry proxy that also controls collapse potential (Pardo et al., 2012; Landeros, 2012; Gomes, et al., 2016), is implicitly related to ‘time in abutment’ as a concept of the overall advancement rate of the cave front in terms of production rate and therefore can also be controlled. In general, the analysis shows that operational-related features have the highest importance for modelling collapse events, in this case particularly the ‘pillar area’ feature.
The machine learning approach presented enables a diverse range of factors to be evaluated for their effect on pillar stability and their contribution to the collapse process to be ranked. It was possible to incorporate both geomechanical and non-conventional factors, such as those related to mining operations and time, that are not accounted for when employing conventional stability analysis methods such as numerical modelling or empirical formulae. It was shown how those factors contributed significantly to the pillar collapse process. This suggests that, at least for this case study, stress analysis alone does not present a feasible way to capture the full complexity of the rock mass damage and failure process, and ML approaches offer a useful and complementary methodology.
Regarding the results obtained from the case study, specific points are as follows.
➤ Operational and design factors exert significant control over the development of collapses in the production level, which can be regulated through careful engineering and operational control, thus reducing the probability of generating this type of instability.
➤ The elements that were accounted for and incorporated as features correlate highly with aspects about caving methods design and implementation that have been widely acknowledged through experience and condensed in the format of ‘rules of caving’.
➤ This work constitutes a first approach to understanding how the elements present in the ‘rules of caving’ affect the outcome of collapses in relative and quantitative terms and can help guide and improve future mine design based on the measured effects the elements have on stability.
➤ The model interpretation methods constitute a framework to support decision-making when two operational or design aspects are locally incompatible by providing a relative measurement of the effect of each of the feature on the probability of collapse.
The authors would like to thank the Natural Sciences and Engineering Research Council of Canada (RGPIN-2020-05449) for supporting this research project. Data, various images, and diagrams utilized in this study were provided by Codelco, División Chuquicamata. Permission to publish this information is gratefully acknowledged. The authors would like to acknowledge Eduardo Rojas of Codelco for arranging use of this information, and for many useful discussions. Similarly, the authors wish to acknowledge the many discussions and insights provided by Marko Didyk and Gavin Ferguson. This study showed that the best results from a machine learning analysis are obtained in combination with expert insight into the mining and rock engineering aspects of the problem.
Agarwal, N. and Das, S. 2020. Interpretable machine learning tools: a survey. Proceedings of the 2020 IEEE Symposium Series on Computational Intelligence (SSCI). pp. 1528–1534. doi: 10.1109/SSCI47803.2020.9308260
Araneda, O. and Sougarret, A. 2008. Lessons learned in cave mining at the El Teniente mine over the period 1997-2007. Proceedings of the 5th International Conference and Exhibition on Mass Mining, Lulea, Sweden. Schunnesson, H. (ed.). Lulea University of Tecjnology. pp. 43–52.
Beard, D. and Brannon, C. 2018. Grasberg Block Cave mine: cave planning and undercut sequencing. Proceedings of the Fourth International Symposium on Block and Sublevel Caving, Vancouver, BC, 15-17 October. Australian Centre for Geomechanics, Perth. pp. 373–384.
Breiman, L. 2001. Random forests. Machine Learning, vol. 45, no. 1. pp. 5–32.
Breiman, L., Friedman, J.H., Olshen, R.A., and Stone, C.J. 2017. Classification and Regression Trees. Routledge.
Butcher, R.J. 1999. Design rules for avoiding draw horizon damage in deep level block caves. Journal of the South African Institute of Mining and Metallurgy, vol. 99, no. 3. pp. 151–155.
Cai, J., Luo, H., Wang, S., and Yang, S. 2018. Feature selection in machine learning: A new perspective. Neurocomputing, vol. 300. pp. 70–79.
Carvalho, J., Santos, J.P.V., Torres, R.T., Santarm, F., and Fonseca, C. 2018. Tree-based methods: Concepts, uses and limitations under the framework of resource selection models. Journal of Environmental Informatics, vol. 32, no. 2, pp. 112–124.
Cavieres, P. and Rojas, E. 1993. Hundimiento Avanzado: Una variante al Método de explotación de Hundimiento por paneles en Mina El Teniente. Departamento de Estudios y Métodos Operacionales. Codelco Chile—Division El Teniente.
Cornejo, J., Pinochet, A., and Caviedes, C. 2016. Geometric control for strategic mine planning at El Teniente mine. Proceedings of the Seventh International Conference & Exhibition on Mass Mining, Sydney, NSW, 9-11 May. Australasian Institute of Mining and Metallurgy, Melbourne. pp. 191–196.
Cornejo, J. and Pardo, C. 2014. Management indicators for the cave geometry control, El Teniente mine. Caving 2014. Proceedings of the Third International Symposium on Block and Sublevel Caving, Santiago, Chile, 5-6 June. Universidad de Chile, Santiago.
Cuello, D. and Newcombe, G. 2018. Key geotechnical knowledge and practical mine planning guidelines in deep, high-stress, hard rock conditions for block and panel cave mining. Proceedings of the Fourth International Symposium on Block and Sublevel Caving, Vancouver, BC, 15-17 October. Australian Centre for Geomechanics, Perth. pp. 17–36.
Damjanac, B. and Fairhurst, C. 2010. Evidence for a long-term strength threshold in crystalline rock. Rock Mechanics and Rock Engineering, vol. 43, no. 5. pp. 513–531.
Elith, J., Leathwick, J.R., and Hastie, T. 2008. A working guide to boosted regression trees. Journal of Animal Ecology, vol. 77, no. 4. pp. 802–813.
Elmo, D., Cammarata, G., and Brasile, S. 2021. The role of numerical analysis in the study of the behaviour of hard-rock pillars. IOP Conference Series: Earth and Environmental Science, vol. 833. doi: 10.1088/1755-1315/833/1/012132
Esterhuizen, G.S., Dolinar, D.R., and Ellenberger, J.L. 2011. Pillar strength in underground stone mines in the United States. International Journal of Rock Mechanics and Mining Sciences, vol. 48, no. 1. pp. 42–50.
Ferguson, G.A., Didyk, M., Zenteno, L.F., San Martin, J.F., and Fowell, R.J. 2017. Cave mining design methodology for use in challenging geomechanics environments. UMT 2017: Proceedings of the First International Conference on Underground Mining Technology, Sudbury, ON, 11-13 October. Hudyma, M. and Potvin, Y. (eds). Australian Centre for Geomechanics, Perth. pp. 281–294.
Flores, G. and Catalan, A. 2018. A transition from a large open pit into a novel ‘macroblock variant’ block caving geometry at the Chuquicamata mine, Codelco Chile. Rock Mechanics and Geotechnical Engineering, vol. 11, no. 3. pp. 549–563.
Friedman, J.H. 2001. Greedy function approximation: A gradient boosting machine. Annals of Statistics, vol. 29, no. 5. pp. 1189–1232. doi: 10.1214/ aos/1013203451
Goldstein, A., Kapelner, A., Bleich, J., and Pitkin, E. 2015. Peeking inside the black box: Visualizing statistical learning with plots of individual conditional expectation. Journal of Computational and Graphical Statistics, vol. 24, no. 1. pp. 44–65.
Gomes, A.R.A., Rojas, E., and Ulloa, J.C. 2016. Severe rock mass damage of undercut and extractio5n level pillars at El Teniente Mine. Geomechanics and Tunnelling, vol. 9, no. 5. pp. 529–533.
Hastie, T., Tibshirani, R., and FriedmanJ.H. 2009. The Elements of Statistical Learning: Data Mining, Inference, and Prediction. Springer.
Hormazabal, E., Alvarez, R., Russo, A., and Acevedo, D. 2018. Influence of the undercut height on the behaviour of pillars at the extraction level in block and panel caving operations. Caving 2018: Proceedings of the Fourth International Symposium on Block and Sublevel Caving, Vancouver, BC, 15-17 October. Australian Centre for Geomechanics, Perth. pp. 351–362.
IEEE. 1990. IEEE Standard Glossary of Software Engineering Terminology (IEEE Std 610.12-1990). Institute of Electrical and Electronics Engineers, New York.
Jager, A.J. and Ryder, J.A. 1999. A Handbook on Rock Engineering Practice for Tabular Hardrock Mines. South African National Institute of Rock Engineering, Johannesburg.
Jianchung, L. 2018. Python partial dependence plot toolbox. https://github.com/ SauceCat/PDPbox
Jordan, M.I. and Mitchell, T.M. 2015. Machine learning: Trends, perspectives, and prospects. Science, vol. 349, no. 6245. pp. 255–260.
Kersten, R.W.O. 2019. An alternative pillar design methodology. Journal of the Southern African Institute of Mining and Metallurgy, vol. 119, no. 5. pp. 471–478.
Lajtai, E.Z. and Schmidtke, R.H. 1986. Delayed failure in rock loaded in uniaxial compression. Rock Mechanics and Rock Engineering, vol. 19, no. 1. pp. 11–25.
Landeros, P., Cuello, D., and Rojas, E. 2012. Caveback management at Reservas Norte Mine Codelco Chile El Teniente Division. MassMin 2012: Proceedings of the 6th International Conference & Exhibition on Mass Mining, Sudbury, ON, 10-14 June 2012. Canadian Institute of Mining, Metallurgy and Petroleum, Montreal.
Lawal, A.I. and Kwon, S. 2021. Application of artificial intelligence to rock mechanics: An overview. Journal of Rock Mechanics and Geotechnical Engineering, vol. 13, no. 1. pp. 248–266.
Li, X., Wang, Y., Basu, S., Kumbier, K., and Yu, B. 2019. A debiased MDI feature importance measure for random forests. Advances in Neural Information Processing Systems, vol. 32. pp. 8049–8059
Lunder, P.J. and Pakalnis, R.C. 1997. Determination of the strength of hard-rock mine pillars. CIM Bulletin, vol. 90, no. 1013. pp. 51–55.
Maritz, J.A. 2014. The presence of shear stresses in pillars and the effect on factor of safety in a room-and-pillar layout. Journal of the Southern African Institute of Mining and Metallurgy, vol. 114, December. pp. 1049–1054.
Martin, C.D. and Maybee, W.G. 2000. The strength of hard-rock pillars. International Journal of Rock Mechanics and Mining Sciences, vol. 37, no. 8. pp. 1239–1246.
McGaughey, J. 2020. Artificial intelligence and big data analytics in mining geomechanics. Journal of the Southern African Institute of Mining and Metallurgy, vol. 120, no. 1. pp. 15–21.
Molnar, C.R., Knig, G., Casalicchio, G., Wright, M.N., and Bischl, B. 2021. Relating the partial dependence plot and permutation feature importance to the data generating process. arXiv preprint arXiv:2109.01433. https://doi. org/10.48550/arXiv.2109.01433
Morgenroth, J., Khan, U.T., and Perras, M.A. 2019. An overview of opportunities for machine learning methods in underground rock engineering design. Geosciences, vol. 9, no. 12. pp. 504.
Murphy, K.P. 2012. Machine Learning: A Probabilistic Perspective. MIT Press, Cambridg, MA.
Obert, L. and Duvall, W.I. 1967. Rock Mechanics and the Design of Structures in Rock. Wiley, New York.
Pardo, Ce, Villaescusa, E., Beck, D., and Brzovic, A. 2012. Back analysis of intensive rock mass damage at the El Teniente Mine. Proceedings of the CRCMining Conference, Queensland University, Brisbane.
Pierce, M.E. 2019. Forecasting vulnerability of deep extraction level excavations to draw-induced cave loads. Journal of Rock Mechanics and Geotechnical Engineering, vol. 11, no. 3. pp. 527–534.
Quevedo, R.J., Quezada, R.F., Zepeda, R.A., Balboa, S.A., Vargas, J.P., and Pérez, S.A. 2019. A data science model on production level pillar stability at El Teniente mine. Mining Goes Digital. Proceedings of the 39th International Symposium 'Application of Computers and Operations Research in the Mineral Industry' (APCOM 2019), Wroclaw, Poland, 4-6 June. CRC Press. pp. 309–322.
Rincy, T.N. and Gupta, R. 2020. Ensemble learning techniques and its efficiency in machine learning: A survey. Proceedings of the 2nd International Conference on Data, Engineering and Applications (IDEA). pp. 1–6. IEEE, New York. doi: 10.1109/IDEA49133.2020.9170675
Rudin, C. 2019. Stop explaining black box machine learning models for high stakes decisions and use interpretable models instead. Nature Machine Intelligence, vol. 1, no. 5. pp. 206–215.
Sagi, O. and Rokach. L. 2018. Ensemble learning: A survey. Wiley Interdisciplinary Reviews: Data Mining and Knowledge Discovery, vol. 8, no. 4. pp. e1249.
Salamon, M.D.G. and Munro, A.H. 1967. A study of the strength of coal pillars. Journal of the South African Institute of Mining and Metallurgy, vol. 68, no. 2. pp. 55–67.
Faradonbeh, R.S., Taheri, A., and Karakus, M. 2022. Fatigue failure characteristics of sandstone under different confining pressures. Rock Mechanics and Rock Engineering, vol. 55, no. 3. pp. 1227–1252.
Sinha, S. and Walton, G. 2019. Numerical analyses of pillar behavior with variation in yield criterion, dilatancy, rock heterogeneity and length to width ratio. Journal of Rock Mechanics and Geotechnical Engineering, vol. 11, no. 1. pp. 46–60.
Stacey, T.R. and Wesseloo, J. 2022. Design and prediction in rock engineering: The importance of mechanisms of failure, with focus on high stress, brittle rock conditions. Rock Mechanics and Rock Engineering, vol. 55, no. 3. pp. 1517–1535.
Strobl, C., Boulesteix, A-L., Zeileis, A., and Hothorn, T. 2007. Bias in random forest variable importance measures: Illustrations, sources and a solution. BMC Bioinformatics, vol. 8, no. 1. pp. 1–21.
Zhou, J., Li, X., and Mitri, H.S. 2015. Comparative performance of six supervised learning methods for the development of models of hard rock pillar stability prediction. Natural Hazards, vol. 79. pp. 291–316 u
Affiliation:
1Hacettepe University, Mining Engineering Department, Ankara, Turkey
2Konya Technical University, Geological Engineering Department, Konya, Turkey
3Graduate School of Science and Engineering, Hacettepe University, Ankara, Turkey.
Correspondence to:
S. Kahraman
Email: sairkahraman@yahoo.com
Dates:
Received: 14 Feb. 2021
Revised: 23 Oct. 2023
Accepted: 28 Nov. 2023
Published: February 2024
How to cite:
Kahraman, S., Ince, I., Rostami, M., and Dibavar, B. 2024
Predicting the strength, density, and porosity of rocks from roll crusher tests.
Journal of the Southern African Institute of Mining and Metallurgy, vol. 124, no. 2. pp. 53–58
DOI ID:
http://dx.doi.org/10.17159/24119717/1528/2024
ORCID:
S. Kahraman
http://orcid.org/0000-0001-7903-143X
I. Ince
http://orcid.org/0000-0002-6692-7584
M. Rostami
http://orcid.org/0000-0001-5411-6939
B. Dibavar
http://orcid.org/0000-0002-2680-4192
by S. Kahraman1, I. Ince2, M. Rostami3, and B. Dibavar3
Synopsis
The density, porosity, and strength of rocks are fundamental in the design of geo-engineering projects. Determining these properties requires the preparation of smooth core samples, which is usually impossible for soft rocks. Besides, only fragmented samples may be available in some projects. A method for predicting rock properties from rock particles such as drilling debris would therefore be useful. This study was undertaken to develop prediction equations for compressive strength (UCS), tensile strength (BTS), density, and porosity values from the crushability index (CI) obtained from rock fragments. The results showed that UCS, BTS, density, and porosity were strongly correlated with the CI. The physical characteristics and strength of rocks may be predicted with the help of the derived equations. The CI test is a valuable tool for estimating rock properties in drilling projects and in situations where core specimens are not available.
Keywords crushability index, rock properties, roll crusher.
Rock engineers make extensive use of the physico-mechanical characteristics of rocks in engineering projects. However, the direct measurement of these properties requires smooth-cut core samples, and the testing process is tedious and time-consuming. Therefore, indirect testing methods such as the Schmidt hammer test, point load test, block punch index test, and sonic velocity test have been applied widely to estimate rock properties, especially for pre-feasibility investigations (Kahraman, 2001; Ulusay, Gokceoglu, and Sulukcu, 2001; Altindag, 2012; Mishra and Basu, 2012; Khandelwal, 2013; Karakul and Ulusay, 2013; Azimian, Ajalloeian, and Fatehi, 2014; Singh, Kainthola, and Venkatesh, 2012; Karaman and Kesimal, 2015). However, core samples or rock blocks might not be available in some cases such as drilling projects. Hence, the prediction of rock properties from small rock fragments (i.e., drilling debris) will be helpful for practitioners.
Several researchers have tried to estimate rock characteristics using easy and practical methods performed on drilling debris (Santarelli et al., 1996; Ringstad et al., 1998; Uboldi, Civolani, and Zausa, 1999; Schei et al., 2000; Meyers et al., 2005; Mateus et al., 2007; Haftani et al., 2015). The crushability index (CI) test may be an alternative for the estimation of the characteristics of rock from such materials. The CI test was first defined by Kahraman and Toraman (2008). In the test, 500 g rock fragments at particle sizes of 19.0−9.52 mm are fed to a jaw crusher with an outlet gap of 4–8 mm. The material that passes through the crusher is screened through a 9.52 mm sieve, and the percentage of undersized material is defined as the CI. Kahraman and Toraman (2008) correlated the CI value with the Los Angeles abrasion loss value and established a good relationship between the two parameters. The predictability of CI from the Protodyakonov index was investigated by Toraman, Kahraman, and Cayirli (2010), and a high inverse correlation was established between the two variables. Kahraman, Toraman, and Cayirli (2018) defined the CI as the percentage of oversized material after crushing by a jaw crusher. They established good linear models between the CI and the unconfined compressive strength (UCS), the Brazilian tensile strength (BTS), and a brittleness concept. Köken and Özarslan (2018) proposed a compressive crushing value (CCV) test method to evaluate the crushability of hard rocks. They found strong correlations between the CCV, the UCS, the brittleness index (S20), and aggregate impact value (AIV). Comakli and Cayirli (2019) investigated the effects of textural properties of rocks on the CI value. They showed that there were strong inverse correlations between textural properties and the CI value. Recently, Comakli (2023) studied the effects of
water saturation on the CI value for nine different rock types. He showed that the influence of water saturation on the CI value was different from its effects on the other mechanical rock properties. Jaw crushers have been used in previous CI experiments. Kahraman, Toraman, and Cayirli (2018) stated that there are several factors controlling the amount of oversize generated, and therefore, influencing the CI parameter obtained by jaw crushing. The open side and closed side discharge settings of the jaw platens and eccentricity control the CI value. The shape of the fragments that are charged also affects CI. Particles with an elongated shape can pass through a jaw crusher despite being coarser than the setting. However, the aforementioned factors controlling CI are not applicable in crushing tests performed using a roll crusher. In this study, CI tests were carried out on igneous rocks using a roll crusher, and the predictability of UCS, BTS, density, and porosity based on the CI was investigated.
Thirty-five types of rocks sampled from various sites or stone processing plants in Türkiye were used in this study. The samples included granite, granodiorite, basalt, syenite, andesite, diabase, limestone, marble, and pyroclastics. The rock types included are listed in Table I along with their properties.
Cylindrical specimens were cored from large boulders for the USC, BTS, density, and porosity tests. The ISRM (2007) suggested methods were followed to conduct the experiments. The UCS and BTS experiments were repeated six or seven times and the average values taken as the strength values.
Crushability index (CI) test
The crushability experiments were carried out using a laboratorytype roll crusher (Figure 1) driven by a 3 kW motor. The rolls had flat surfaces, and their diameters were 25 cm. The rotational speed of the rolls was 160 r/min.
After the coring of the blocks, the remaining pieces were utilized in the CI tests. First, the pieces were broken into small blocks using a hand hammer and charged to a laboratory jaw crusher for primary crushing. The crushed materials were fed into the roll crusher for secondary crushing. The crushed material was sieved for 60 seconds to obtain 100 g samples in the size range of 4.00−5.60 mm for the CI test. Some of the specimens ready for the tests are illustrated in Figure 2. The gap between the two rolls was set to 3 mm, and the fragments were fed slowly by hand to the roll crusher.
Table I
Samples used and their properties


The fragments that passed through the crusher were sieved using a 1 mm screen size for 60 seconds, and the percentage of oversized particles was defined as the CI. The average values of the results of the experiments were accepted as the CI values.
Some relationships should exist among the physico-mechanical characteristics of rocks. For this reason, a general evaluation of the data was first performed by investigating the correlation between the physico-mechanical properties identified in this study. As shown in Figure. 3, very strong correlations were found.
In Figures 3a and 3b, it is seen that the UCS and BTS values differ greatly at density values of 2.5–3.0 g/cm3. Although this may seem abnormal, it is a result of the inherent nature of rocks. There are many different types of rocks with density values ranging from 2.5 to 3.0 g/cm3. Although these rocks have the same or very similar density values, their properties such as brittleness and modulus of elasticity differ, and their strength and CI values also vary accordingly. Burkhardt, Kim, and Nelson (2018) found the same to be true for the UCS-density and BTS-density relationships, based on extensive data (3900 cases for UCS, 490 for BTS). In fact, it has been shown that the strength of gypsum samples with almost the same density values can vary between 4 MPa and 42 MPa.
First, a simple regression analysis was performed to derive the prediction equations for rock properties. The CI was correlated with the strength, density, and porosity parameters. Very strong exponential relationships were established between CI and both strength parameters (Figures 4, 5). The more the CI value increased, the more the UCS and BTS increased. The formulae of the simple regression curves and the correlation coefficients (r) were as follows:
σc = 1 × 10 8
r = 0.87
σt = 1 × 10 9 e0.239CI r = 0.89
3 Correlations between (a) UCS and BTS, (b) UCS and density, (c) UCS and porosity, (d) BTS and density, (e) BTS and porosity, and (f) density and porosity


5 Relationship between CI and BTS
where, σc is the UCS (MPa), σt is the BTS (MPa), and CI is the crushability index (%).
The CI value was strongly correlated with density (Figure 6). The correlation was represented by a linear equation. The equation of the line and the correlation coefficient (r) were as follows:

ρ = 0.11CI − 7.38 r = 0.79
[3] where ρ is the density and CI is the crushability index (%).
The CI value was inversely correlated with the porosity (Figure 7). The relationship was linear, with a good correlation coefficient. The equation of the line and the correlation coefficient (r) were
n = 3.65CI + 348.18 r = 0.84 [4] where n is the porosity (%), and CI is the crushability index (%).
A multiple regression analysis was also performed with the aim of developing stronger equations than the simple regression equations. The CI, density, and porosity values were incorporated into the regression analysis to construct the prediction formulae for UCS and BTS. The developed equations were as follows:
UCS = 4.72CI + 65.61ρ − 494.88 r = 0.88 [5]
UCS = 5.07CI −1.42n − 358.14 r = 0.85 [6]
BTS = 0.36CI + 4.44ρ − 36.65 r = 0.88 [7]
BTS = 0.45CI − 0.08n − 34.29 r = 0.83 [8]
The correlation coefficients of the multiple regression equations were closely similar to those of the simple regression formulae. For this reason, the simple regression equations are recommended for their simplicity.
of the derived equations
Equations [1−4] had strong correlation coefficients. However, a strong correlation coefficient does not always indicate a valid model. Student’s t-test and the F–test are common methods used for the validation of a regression equation. For the t-test, the variables should have a normal distribution. The histogram analysis showed that the variables had a non-normal distribution as shown in the examples in Figures 8 and 9. Therefore, the t-test was not carried out.
The analysis of variance method can be used for checking the significance of regressions. The confidence intervals were selected


Comparison of the tabulated F-ratios with the F-test ratios
as 95% in the analyses. In the F–test, when the test values of the F-ratios are greater than the critical F-ratio found in the standard table, the null hypothesis is rejected, suggesting a significant correlation between the two variables. The calculated F-ratios (F-test) were greater than the critical ratios of F (Table II). For this reason, it may be stated that the constructed formulae are valid.
The experimental data for the 19 different igneous rocks was assessed to investigate the predictability of UCS, BTS, density, and porosity from CI. Very good exponential relationships were established between CI and the strength parameters. Good relationships were also determined between CI and both density and porosity. In conclusion, the UCS, BTS, density, and porosity values of rocks can be predicted from their CI values. The CI test is particularly valuable for drilling projects and situations where block samples are not available for the preparation of cores. However, it should not be forgotten that the results obtained may vary depending on the crusher characteristics.
On behalf of all authors, the corresponding author states that there is no conflict of interest.
References
Altindag, R. 2012. Correlation between P-wave velocity and some mechanical properties for sedimentary rocks. Journal of the Southern African Institute of Mining and Metallurgy, vol. 112. pp. 229–237. http://www.scielo.org.za/ pdf/ jsaimm/v112n3/14.pdf
Azimian, A., Ajalloeian, and Fatehi, L. 2014. An empirical correlation of uniaxial compressive strength with P-wave velocity and point load strength index on marly rocks using statistical method. Geotechnical and Geological Engineering, vol. 32. pp. 205–214. https://link.springer.com/article/ 10.1007/ s10706-013-9703-x
Burkhardt, M., Kim, E., and Nelson, P.P. 2018. EMI database analysis focusing on relationship between density and mechanical properties of sedimentary rocks. Geomechanics and Engineering, vol. 14, no. 5. doi: 10.12989/gae.2018.14.5.491
Comakli, R. and Cayirli, S. 2019. A correlative study on textural properties and crushability of rocks. Bulletin of Engineering Geology and the Environment, vol. 78, no. 5. pp. 1–17. https://doi.org/10.1007/s10064-018-1357-8
Comakli, R. 2023. Investigating the effects of water saturation on the crushability of rocks used in aggregate production. Bulletin of Engineering Geology and the Environment, vol. 82. p. 197. https://doi.org/10.1007/s10064-023-03221-4
Haftani, M., Bohloli, B., Nouri, A., Javan, M.R.M., Moosavi, M., and Moradi, M. 2015. Influence of penetration rate and indenter diameter in strength measurement by indentation testing on small rock specimens. Rock Mechanics and Rock Engineering, vol 48. pp. 527–534. https://link.springer.com/ article/10.1007/s00603-014-0563-3
ISRM. 2007. The Complete ISRM Suggested Methods for Rock Characterization, Testing and Monitoring: 1974-2006. Ulusay, R. and Hudson, J.A. (eds). Commission on Testing Methods, International Society for Rock Mechanics (ISRM), Turkish National Group, Ankara, Turkey. 628 pp.
Kahraman, S. 2001. Evaluation of simple methods for assessing the uniaxial compressive strength of rock. International Journal of Rock Mechanics and Mining Sciences, vol. 38. pp. 981–994. https://www.sciencedirect.com/science/ article/pii/S1365160901000399
Kahraman, S. and Toraman, O.Y. 2008. Predicting the Los Angeles abrasion loss of rock aggregates from crushability index. Bulletin of Materials Science, vol. 31. pp. 173–177. https://www.ias.ac.in/article/fulltext/ boms/031/02/0173-0177
Kahraman, S., Toraman, O.Y., and Cayirli, S. 2018. Predicting the strength and brittleness of rocks from a crushability index. Bulletin of Engineering Geology and the Environment, vol. 77. pp. 1639–1645. https://link.springer.com/ article/ 10.1007/ s10064-017-1012-9
Köken, E. and Özarslan, A. 2018. New testing methodology for the quantification of rock crushability: Compressive crushing value (CCV). International Journal of Minerals, Metallurgy and Materials, vol. 25, no. 11. pp. 1227–1236. https:// doi.org/10.1007/s12613-018-1675-7
Karakul, H. and Ulusay, R. 2013. Empirical correlations for predicting strength properties of rocks from P-wave velocity under different degrees of saturation. Rock Mechanics and Rock Engineering, vol. 46. pp. 981–999. https://link. springer.com/article/10.1007/s00603-012-0353-8
Karaman, K. and Kesimal, A. 2015. A comparative study of Schmidt hammer test methods for estimating the uniaxial compressive strength of rocks. Bulletin of Engineering Geology and the Environment, vol. 74, no. 2. pp. 507–520. https:// link.springer.com/article/10.1007/s10064-014-0617-5
Khandelwal, M. 2013. Correlating P-wave velocity with the physico-mechanical properties of different rocks. Pure and Applird Geophysics, vol. 170. pp. 507–514. https://link.springer.com/article/10.1007/ s00024-012-0556-7
Mateus, J., Saavedra, N-F., Calderón-Carrillo, Z., and Mateus, D. 2007. Correlation development between indentation parameters and unaxial compressive strength for Colombian sandstones. CTyF - Ciencia Tecnología y Futuro, vol. 3. pp. 125–135. http://www.scielo.org.co/ scielo.php?script=sci_ arttext&pid=S0122-53832007000100008
Meyers, A.G., Hunt, S.P., Frick, R., and Behr, S. 2005. Point load testing of drilling debris for the determination of rock strength. Proceedings of the 40th U.S. Symposium on Rock Mechanics, Anchorage, Alaska, 25-29 June 2005. Paper no. ARMA/USRMS 05-712. https://onepetro.org/ ARMAUSRMS/ proceedingsabstract/ARMA05/All-ARMA05/ARMA-05-712/117733
Mishra, D.A. and Basu, A. 2012. Use of the block punch test to predict the compressive and tensile strengths of rocks. International Journal of Rock Mechanics and Mining Sciences, vol. 51. pp. 119–127. https://www.sciencedirect. com/science/article/pii/S1365160912000287
Ringstad, C., Lofthus, E.B., Sonstebo, E.F., Fjær, E., Zausa, F., and Fuh, G-F. 1998. Prediction of rock parameters from micro-indentation measurements: The effect of sample size. Proceedings of EUROCK ’98, Trondheim, Norway, 8–10 July. https://onepetro.org/SPEEROK/proceedings-abstract/98EROK/All98EROK/SPE-47313-MS/190279
Sachapazis, C.I. 1990. Correlating Schmidt hardness with compressive strength and Young’s modulus of carbonate rocks. Bulletin of the International Association of Engineering Geology, vol. 42. pp. 75–83. https://link.springer.com/ article/10.1007/BF02592622
Santarelli, F.J., Marshala, A.F., Brignoli, M., Rossi, E., and Bona, N. 1996. Formation evaluation from logging on cuttings. Proceedings of the SPE Permian Basin Oil and Gas Recovery Conference, Midland, TX, 27-29 March. SPE 36851. https://onepetro.org/REE/article-abstract/ 1/03/238/170144/FormationEvaluation-From-Logging-on-Cuttings?redirectedFrom=fulltext
Schei, G., Fjær, E., Detournay, E., Kenter, C., Fuh, G.F., and Zausa, F. 2000. The scratch test: An attractive technique for determining strength and elastic properties of sedimentary rocks. Proceedings of the SPE Annual Technical Conference and Exhibition, Houston, TX, October 2000. https://onepetro.org/ SPEATCE/proceedings-abstract/00ATCE/All-00ATCE/SPE-63255-MS/ 132202
Singh, T.N., Kainthola, A., and Venkatesh, A. 2012. Correlation between point load index and uniaxial compressive strength for different rock types. Rock Mechanics and Rock Engineering, vol. 45, no. 2. pp. 259–264. https://link. springer.com/article/10.1007/s00603-011-0192-z
Toraman, O.Y., Kahraman, S., and Cayirli, S. 2010. Predicting the crushability of rocks from the impact strength index. Minerals Engineering, vol. 23. pp. 752–754. https://www.sciencedirect.com/science/article/ pii/ S0892687510001123
Uboldi, V., Civolani, L., and Zausa, F. 1999. Rock strength measurements on cutting as input data for optimizing drill bit selection. Proceedings of the SPE Annual Conference and Exhibition, Houston, TX, 3-6 October. SPE, ENI SpA 56441. https://onepetro.org/SPEATCE/proceedings-abstract/99ATCE/All99ATCE/SPE-56441-MS/60114
Ulusay, R., Gokceoglu, C., and Sulukcu, S. 2001. Draft ISRM suggested method for determining block punch strength index (BPI). International Journal of Rock Mechanics and Mining Sciences, vol. 38. pp. 1113–1119. https://www. sciencedirect.com/science/article/pii/S1365160901000788 u

by Jaco Lotheringen, Managing Director, Ukwazi

Twww.ukwazi.com
here has been significant disruption in the mining industry over the last few years. Some of the major disruptions include commodity price volatility, volatility in the R/$ exchange rate, significant cost escalations, logistical problems, uneasy relationships with Environmental, Social and Governance (“ESG”) stakeholders, technical skill shortages and impatient funding mechanisms. However, the market still expects new, fundable, profitable mines, and mine expansions to be developed, and for existing operations to deliver strong financial returns in line with company projections and investor expectations.
How can you develop your project for lowest probability of failure, that not only delivers technically, but are also fundable? By returning to the fundamentals of our industry! Mining projects can, and must be, designed for a reasonable chance of success. Success that results in safe and sustainable operations, off-take agreements, sufficient funding and on-time, on-budget implementation of the right mine and infrastructure for the intended market, and with sustainable stakeholder relationships.
There are numerous codes and standards that serve as a guideline for project development and public reporting of the technical parameters and estimated value of mining projects at various development stages. In the late 1960’s and early 1970’s, the American Association for the Advancement of Cost Engineering International (“AACE”) set out a guideline for project development and cost estimate classification. This methodology has been accepted world-wide to control the development of complex projects. Mining projects certainly fall within the complex, multi-disciplinary category. The guideline starts at a Class 5 opportunity identification, then progress to potentially fundable estimates in the interim, and then to a Class 1 execution estimate. The first stages (Class 5 and Class 4) are the scope development phases. Here, the intension is to investigate WHAT to design. In the design and engineering development stages, you design WHEN and HOW these components will interact and integrate as a cohesive solution to achieve the project objective. The levels of estimate accuracy continuously improve through the development stages, and stage gates regulate progress to the next stage of development. This process represents international best practice.
The development of our own South African code for the Reporting of Exploration results, Mineral Resources and Mineral Reserves (SAMREC) started in 1992, and was first issued in 2000, and adopted by the JSE in their Listing Requirements. Today it (and other international codes) forms the basis of reporting public estimates and should be adopted, even if the estimates are not intended for publication. Public reports must contain the information that a reasonable investor would expect to find and use as a basis for making an informed decision regarding a project. The same principles apply for reports that may find their way into the public domain. It is encouraged that all estimates and reports comply with the relevant Codes, irrespective of the intended audience.
As part of the 2016 SAMREC edition, Table 2 was added to provide further guidance on the project development process, focussing on Class 5, Class 3 and Class 2 estimates, as the Codes provide guidelines on public disclosure. It compares well with the AACE guidelines and is clearer on aspects specifically associated with the mining sector. Reference to the South African Codes include SAMVAL and the SAMESG guideline. The prevalence of studies that does not clearly fall within a defined project development estimate Class, or so-called CPR’s (Competent Persons Reports) that does not conform to the reporting and disclosure requirements of the Codes, has affected the reliance that external funders and funding institutions are prepared to attach to ‘fundable’ reports. This causes confusion and additional perceived risk for traditional and external funding mechanisms, making projects increasingly difficult to fund. For example, a clear and thorough guideline is provided for CPR’s, in addition to the Table 1 reporting requirements; and clear guidelines and requirements are available as part of section 12 of the JSE Listing Requirements. To avoid reporting that could be considered misleading, it is preferable that all study reports are well positioned in terms of the Class of study, and that reports and estimates covering Mineral Resources and Mineral/ Ore Reserves and Mine Valuations, comply to SAMREC, SAMVAL, and the SAMESG guidelines.
Reasonable and Realistic Prospects for Eventual Economic Extraction (RRPEEE) is a critical point to be made. A point that does not receive the emphasis it is supposed to receive in the reporting requirements of technical studies. Amongst other references, Section 4.3 of SAMREC Table 1 covers the minimum requirements of RRPEEE in eight separate points as part of the Estimation and Reporting of Mineral Resources. The minimum technical areas to be considered include physical properties regarding the geology; engineering parameters such as mining method, associated modifying factors, processing and geotechnical requirements; infrastructure in terms of access, water and power; legal, permitting, governmental and statutory requirements; environmental and social aspects; marketing; economic assumptions such as potential costs and commodity prices; and material risks.
Comprehensive Codes and Guidelines are available to not only provide structure to the project development process, but to provide guidance in terms of the public reporting of the project outcomes. These are well structured, and well applied in most cases, but unfortunately not in all. In some cases, non-compliance with these Codes and Guidelines results in difficulty in determining project fundability. Competent and Qualified Persons are encouraged to report and disclose projects results in line with the Codes and Guidelines, irrespective of the intended audience.
Compliance with the reporting codes ensures that the project owner develops the project on an appropriate techno-economic basis. It also empowers the project owner to trigger funding at the appropriate stages of the project and to implement it into a safe and sustainable operation.
Affiliation:
1Centre de développement des Energies
Renouvelables, BP. 62 Route de l’Observatoire Bouzareah, 16340, Algiers, Algeria.
2LGMD- Department of Mechanical Engineering, Ecole Nationale Polytechnique 10, Avenue Hassen Badi, BP 182, El-Harrach, 16200, Algiers, Algeria.
3Scanning Electron Microscope Laboratory, Sonatrach laboratories division DLAB, Boumerdes, Algeria.
Correspondence to: W. Bendaikha
Email: w_bendaikha@yahoo.com o.bendaikha@cder.dz
Dates:
Received: 17 Mar. 2022
Revised: 31 Oct. 2022
Accepted: 11 Dec. 2023
Published: February 2024
How to cite:
Bendaikha, W., Larbi, S., and Ramdane, A. 2024
Mineralogical and chemical characterization of an oolitic iron ore, and sustainable phosphorus removal.
Journal of the Southern African Institute of Mining and Metallurgy, vol. 124, no. 2. pp. 59–66
DOI ID:
http://dx.doi.org/10.17159/24119717/2051/2024
ORCID:
W. Bendaikha
http://orcid.org/0000-0001-5869-1404
S. Larbi
http://orcid.org/0000-0002-4382-4646
A. Ramdane
http://orcid.org/0009-0005-5509-3376
by W. Bendaikha1, S. Larbi2, and A. Ramdane3
Synopsis
An oolitic iron ore from Gara Djebilet, Algeria was characterized by X-ray diffraction, scanning electron microscopy, and energy dispersive spectrosopy and the phosphorus distribution between various phases studied. Two ore types were identified – a haematite-dominated, oolitic type and a more massive, magnetite-dominated type. The haematite-dominated ore had a higher phosphorus content, up to 0.6% in the iron oxide minerals, than the magnetite-dominated type (0.3% P).
Owing to the very fine-grained texture of the gangue minerals, reducing the phosphorus content to levels suitable for steelmaking (below 0.05% P) by conventiobal means would entail an energyintensive process with a high carbon footprint. Preliminary leaching test work using a sulphurous geothermal water as lixiviant, assisted by solar thermal acceleration, gave very promising results, removing 0.13% of the residual P (or 21.7% removal of total P) from the high-phosphorus oolitic ore.
Oolitic iron ore, phosphorus removal, renewable resources, sustainability, sulphurous thermal water, leaching, solar thermal.
Introduction
Algeria holds one of the richest oolitic ironstone deposits in North Africa (Diab et al., 2020). Removal of phosphorus from these ores using conventional beneficiation methods is not possible (Tang et al., 2017), owing to poor selectivity and recoveries, and low economic efficiency (Pownceby et al., 2019). However, the increase in the international iron ore price in recent years has forced steel companies in many countries, such as FERAAL and MANAL in Algeria, to seek domestic sources of iron ore in order to reduce costs (Chen and He, 2014; Chen and Chu, 2014).
Many of the world’s current iron ore resources contain over 0.08 wt% P, and are thus not suitable for iron- and steelmaking (Delvasto et al., 2008; Cheng et al.,1999). Phosphorus increases the hardnessof iron and decreases the solubility of carbon in iron at high temperatures. This decreases its usefulness in making blister steel (cementation), where the speed and amount of carbon absorption is the overriding consideration affecting the economics of the ironmaking process and the quality of the produced steel (Song, 2013).
Previous workers have investigated the adsorption mechanisms of phosphorus and other impurities by goethite-rich iron ores in order to identify a possible removal method. Parfitt and Atkinson (1976) found that phosphate adsorption on synthetic goethite results in the formation of a binuclear complex. Omran et al. (2015) investigated phosphorus removal from three different iron ore samples with varying total iron and P2O5 contents and mineralogical textures, using combined microwave pretreatment and ultrasonic treatment. Their findings indicated that microwave pretreatment increases the efficiency of ultrasonic disintegration of gangue particles by about 20%. Depending on the sample texture and phosphorus distribution about 59% phosphorus removal could be obtained.
Liu et al. (2017) applied the slag ion theory to calculate the distribution ratio of phosphorus in the smelting reduction of high-phosphorus iron ores. They found that the main factors affecting the distribution ratio of phosphorus are ferrous oxide activity, phosphorus capacity of the slag, and the phosphorus activity coefficient in molten iron.
Quast (2018) reviewed the techniques that can be used for economically processing oolitic iron ores containing high levels of impurities, notably phosphorus.
Pownceby et al. (2019) investigated the distribution and association of phosphorus within goethite in a high-P Brockman-type iron ore from the Pilbara region of Western Australia. They concluded that
limited removal of phosphorus by physical separation techniques is possible, but will most likely result in a significant loss of iron units. Chemical leaching is also possible, but this approach is only successful after thermal pretreatment to recrystallizse the goethite as Fe2O3 and consequent concentration of impurities at grain boundaries.
Da Siva et al. (2020) used a kinetic model of heating using microwave energy in the acid baking/leaching process to reduce particulate phosphorus content in iron ores. Their results indicated that with microwave energy as a heating source, 600°C is the optimum temperature for promoting the diffusion of leaching agent within the iron ore particles.
Yehia (2021) investigated the use of a fungal cellulase enzyme to improve the selective separation of apatite from haematite during reverse anionic flotation of a high-phosphorus iron ore. The results showed that the enzyme was adsorbed on the surfaces of both minerals. However, the depressant effect was significant in the case of haematite, but not apatite.
The Gara Djebilet field (Figures 1 and 2) is an important deposit situated in the North African Palaeozoic ironstone belt in southwestern Algeria. It extendeds from Zemmour to Libya and includes ironstones of Ordovician, Silurian, and Devonian age (Guerrak,1988; Diab et al., 2020).
In this investigation we studied the structural, microstructural, and chemical characteristics of this oolitic iron ore in detail in order to identify the nature of phosphorus inclusions in the ore, and carried out leaching tests with sulphurous geothermal water

within a low-temperature solar greenhouse thermal acceleration system.
Sample identification
Representative samples were selected, identified, and classified according to their morphology, weight, and colour. Two types of ore were identified, type A (haematite-dominated) and type B (magnetite-dominated).
The samples were crushed and pelletized in the following steps:
➤ Stagewise crushing in a series of jaw crushers with different slot openings:

• 50−20 mm
• 20–10 mm
• 5 mm.
➤ Roller crusher with an opening of 1 mm
➤ Drying at 105°C
➤ Quartering to obtain representative samples A and B.
After quartering, the representative samples were ground to a particle size of 90−70 µm using a disc mill.
Mineralogical and chemical analysis was carried out using X-ray diffraction (XRD), scanning electron microscopy (SEM), and energy dispersive spectroscopy (EDS) to investigate the structural complexity of each sample and to determine the phosphorus content.
Preliminary geothermal water leaching test
Sulphurous thermal water extracted from Hammam Righa, a geothermal spring located in northern Algeria, was used as a leaching solution in order to reduce the phosphorus content. The chemical composition of the water is given in Table I. A ‘bottle drip leaching’ set-up (Figure 3) was used tor the test, which requires 500 g of material.
Geothermal spring water from the Hammam Righa region is a sulphated-acid water with high concentrations of (SO4)2− and Cl ions.
Figure 4 shows the greenhouse solar heating system used to treat sample A (phosphorus content 0.6%), for a period of 6 hours (from 9 a.m. to 3 p.m. the time of maximum solar insolation) in order to accelerate the geothermal water absorption process, and to dry the sample after soaking prior to grinding in a disc mill. The process was repeated six times.
Results and discussion
X-ray powder diffraction (XRD)
As shown in Figure 5, the minerals present in sample A are haematite (Fe2O3) in association with magnetite (Fe3O4), goethite (FeO(OH)), kaolinite (Al2Si2O5(OH)4), and montmorillonite ((Na, Ca)0,3 (Al, Mg)2 Si4O10(OH)2 nH2O).
Table I
Chemical composition (mg/l) of Hammam Righa geothermal water (Belhai et al., 2016)


Sample B, as shown in Figure 6, is mainly composed of magnetite (Fe3O4) in combination with haematite (Fe2O3), chamosite, which is an iron-rich chlorite ((Mg,Al,Fe)12 [(Si,Al)8O20] (OH)16), and clinochlore ((Fe,Mg,Al)6(Si,Al)4O10(OH)8).
Mineralological analysis
The mineralogical compositions of samples A and B are given in Tables II and III respectively. The polished section of sample A (Figure 7A) is characterized by a massive texture with a nodular or oolitic structure with 60% haematite content, 20% sub-automorphic magnetite, and 5% iron hydroxides in the form of a coating, giving the rock a reddish hue.
Sample B (Figure 7B) is characterized by a massive texture with a granular, nodular, and auto-morphic structure and major mineralogical components consisting of 60% massive automorphic magnetite, 25% oolitic haematite, and traces of xenomorphic pyrite.
Optical microscopy
Observation of the polished section of sample A showed haematite in association with magnetite and goethite. The haematite mineralization (Figure 7A) consists of oolites ranging in size from 0.05 to 10 mm. The oolite cores contain iron hydroxide (goethite) and gangue minerals.
Magnetite crystalline structure is automorphic (Figure 7B) with size ranging from 0.1 to 0.3 mm. Magnetite also occurs as irregularly nodules in the rock. The iron hydroxide is visible as a red coating.
The study of the polished section of sample B shows a rock rich in magnetite and haematite, which are associated with small amounts of pyrite. Figure 8A illustrates magnetite oolite and massive magnetite. Figure 8B shows the magnetite, which represents around 60% of the total volume of the rock. It clearly shows haematite with a goethite core and massive magnetite.
The results give us idea of the intermolecular phosphorus inclusions in haematite, magnetite, and possibly in goethite (Parfitt,1976), as well as in the gangue minerals. In order to determine the location and concentration of the phosphorus inclusions, further analysis using SEM and EDS spectra is required.
SEM analysis
The samples were dehydrated and processed to become electrically
Table II
Mineralogical composition of sample A
Table III
Mineralogical composition of sample B Mineralogical

conductive. The pressure inside the instrument reaches a value of 2.99 10-3 Pa (2.99 10-8 bar). Energy-dispersive X-ray spectroscopy (EDS) analysis was used to determine the elements contained in the iron oxide ore.


8 (A) Microstructure of a magnetite-containing oolitic haematite, showing (1) magnetite oolite and (2) massive magnetite. 20× magnification. (B) Massive magnetite containing (1) hsematite with a goethite core and (2) massive magnetite. 20× magnification
Results of sample A
Sample A was examined at magnifications from 500 μm to 10 μm. The thin section of haematite shown in Figure 9A depicts a regular spherical oolitic form consisting of a core around which concentric shells have developed by chemical (or biochemical) precipitation. The same grain at higher magnification is shown in Figure 9B. Three typical zones were selected: marked as 1 (haematite), 2 (core), and 3 (gangue minerals).
Figure 9C is a view of of zone 2 (Figure 9B), showing (1) haematite, (2) magnetite microinclusions occuring as octahedral crystals bounded by planes and rhombic dodecahedra, and (3) phyllosilicates flakes. Figure 9D shows the core at 10 μm scale; the phyllosilicates flakes are clearly observed.
The EDS analysis of the oolite grain in Figure 9B is shown in Tables IV, V, and VI. It can be seen that the haematite in zone 1
Table IV
EDS results for zone 1
(Table IV) has a composition of about 65.07% iron and 29.78% oxygen by weight. The main impurities are a mixture of 2.31% C, 1.52% Al, 0.7% Si, and 0.6% P.
The results for zone 2, the core (Table V), show that the iron content is lower than in zone 1, with 14.13% Fe and a very high oxygen content (46.71%), which indicates the presence of goethite (FeO(OH)); This zone also contains 0.5% P, 6.84% Si, 12.03% Al, 18.21% C, and 1.13% Mg.
However, in the gangue minerals, zone 3 (Table VI), the phosphorus content is lower than in zones 1 and 2, at only 0.19 %, the iron is 29.23%, and the carbon, calcium, (from hydroxyapatite Ca10(PO4)6(OH)2) and oxygen contents are 42.38%, 0.22%, and 24.32%, respectively.
Results of sample B
SEM observations of sample B reveal a completely different microstructure to sample A, with recrystallization of haematite and apatite within the core. The iron-rich radiating lamellae can be seen in Figure 10A. The three-dimensional microstructure of sample B is illustrated in the SEM image in Figure 10B.

Table V
EDS results for zone 2 Element
C
0.0013
Table VII
EDS results for sample B
Table VI
EDS results for zone 3 Element
0.79 0.49 38.58 6.19 0.0058
K 0.19 0.11 7.57 21.79 0.0015 S K 0.23 0.12 9.28 18.26 0.0019
The EDS spectra show that sample B is mainly composed of iron (62.08%) and oxygen (26.78%), with 7.21% C, 1.04% Al, 0.93% Si, and less phosphorus (0.3%) than in sample A. There are also fewer inclusions of Na (0.39%), Mg (0.39%), S (0.16%), Cl (0.16%), K (0.1%), Ca (0.23%), and Ti (0.22%). It has been observed that when the oxygen content is lower, the phosphorus content is also lower.
Preliminary results of experimental geothermal water leaching
The geothermal springs host several habitats, including thermal water, biofilms, and sediment (Chen et al., 2023). The sulphurous thermal water used In this investigation contains a variety of
dissolved minerals, as shown in Table I, and according to previous studies, it contains elementary sulphur-oxidizing bacteria (Culivicchi., 2005) which facilitate two simultaneous processes:
+ O2 → 2S + 2H2O
2S + 3O2 = 2H2O → 2SO42
These bacteria proliferate at temperatures between 55°C and 85°C (Culivicchi-, 2005), and metabolize oxygen and inorganic phosphorus. Therefore, these essential elements (oxygen and phosphorus) available in this iron ore can be dissolved and eliminated at the same time.
A low-temperature leaching process using water from Hammam Righa was investigated with the aim of reducing the level of harmful phosphorus in oolitic iron ore in an eco-friendly manner.
A 500 g portion of sample A, with a particle size varying between 70 and 90 µm, and an initial phosphorus content of 0.6% (by weight) was used in the test. The sample was contacted with the thermal water for six consecutive days. On each day, the sample was well mixed and placed in the solar thermal heating system for 6 hours, from 9 am to 3 pm (maximum solar insolation). At the end of the experiment, the sample was dry and the temperature inside the solar heating system was approximately 62.5°C. The sample was then finely ground in a disc mill, and contacted again with the thermal water. This process was repeated six times.

Sulphuric acid dissolves phosphorus in the iron-rich minerals and gangue minerals as follows:
Ca3 (PO4)2 + 3H2SO4 + 3nH2O → [3]
2H3PO4 + 3CaSO4 • nH2O ↓
Ca3 (PO4)2 + 2H2SO4 + 2nH2O → [4]
Ca2+ + 2H2PO4–+ 2CaSO4 • nH2O
The Fe in solution is reduced from Fe3+ to Fe2+ (Dong et al., 2019):
H2S + Fe2 (SO4)3 → H2SO4 + 2FeSO4 + S [5]
2H2SO4 + 4Fe (SO4) + O2 → 2Fe2 (SO4)3 + 2H2O [6]
FeS2 + 14Fe3+ + 8H2O → 15Fe2+ + 2H2SO4 + 12H+ [7]
The thermal solution contain iron ions, sulphate ions SO42−and dissolved phosphorus as PO42−.
2(3H+(PO4–)) + Fe3+ + PO43–→ Fe3+ + 6H+ + 3PO42–[8]
The results are summarized in Table VIII. This experiment was repeated three times, and the same results were obtained with a small margin of error.
These preliminary results are encouraging, with 0.13% P removal, representing a removal ratio of 21.7%.
Conclusion and recommendations
The mineralogy, microstructure, and chemical composition of a high-phosphorus oolitic iron ore from Gara Djebilet in Algeria were investigated. Two types of ore were identified, A (haematitedominated) and B (magnetite-dominated), with distinctly different microstructures. Type A ore had the higher phosphorus content, 0.6% compared with 0.3% for type B. The phosphorus content is proportional to the Fe and O contents, indicating that P is largely substituted in goethite.
Preliminary test work to reduce the phosphorus content of the haematite-dominated ore by solar-assisted leaching in sulphurous geothermal water yielded promising results, wirh 21.7% phosphorus removal. The sulphur in the geothermal water is produced by sulphur-oxidizing bacteria at temperatures of 55–85°C. The use of a bioleaching process to improve the P removal ratio is a possible topic for future investigations.
Acknowledgements
The authors would like to thank Mr Yahia Azeri, President General Manager of the National Office of Geological and Mining Research (ORGM, Boumerdès, Algeria) for his interest and his help in carrying out this study. Special thanks are extended to Mr Hassini, Mrs Karima Almouboudi, Mr N. Mendiliand, Mr O. Belgaid, and K. Snoussi, the staff of the National Office of Geological and Mining Research (ORGM, Boumerdès, Algeria) for their assistance with the experimental work.
Belhai, M., Fujimitsu, Y., Bouchareb-Haouchine, F.Z., Haouchine, A., and Nishijima, J. 2016. A hydrochemical study of the Hammam Righa geothermal waters in north-central Algeria. Acta Geochimica, vol. 35. pp. 271–287. https:// doi.org/10.1007/s11631-016-0092-8
Champetier, Y., Hamdadou, E., and Hamdadou, M. 1987. Examples of biogenic support of mineralization in two oolitic iron ores - lorraine (France) and gara djebilet (Algeria). Sedimentary Geology, vol. 51. pp. 249–255. https://doi. org/10.1016/0037-0738(87)90050-9
Cheng, C.Y., Misra, V.N., Clough, J., and Mun, R. 1999. Dephosphorization of Western Australianiron ore by hydrometallurgical process. Minerals Engineering, vol. 9. pp. 1083–1092. https://doi.org/10.1016/S08926875(99)00093-X
Chen, G. and He, S. 2014. Thermodynamic analysis and experimental study of manganese ore alloy and dephosphorization in converter steelmaking. Journal of the Southern African Institute of Mining and Metallurgy, vol.114. pp. 391–399.
Chen, J-S., Hussain, B., Tsai, H-C., Nagarajan,V., Koner, S., and Hsu, B-M. 2023. Analysis and interpretation of hot springs water, biofilms, and sediment bacterial community profiling and their metabolic potential in the area of Taiwan geothermal ecosystem. Science of the Total Environment, vol. 856. pp. 159115. https://doi.org/10.1016/j.scitotenv.2022.159115
Chen, S.Y. and Chu, M.S. 2014. A new process for the recovery of iron, vanadium, and titanium from vanadium titanomagnetite. Journal of the Southern African Institute of Mining and Metallurgy, vol. 114. pp. 481–488.
Culivicchi, G., Lenzi,A., Tarquini,B., and Mariani, S. 2005. Sulfobacteria in geothermal fluids: a preliminary study in the Larderello geothermal area. Proceedings of the World Geothermal Congress, Antalya, Turkey, 24-29 April 2005. International Geothermal Association, Auckland, N.Z. https://www. geothermal-energy.org/pdf/IGAstandard/WGC/2005/0247.pdf
Da Siva, L.M., Nascimento, M., de Oliveira, E.M., de Queiroz, A.V., Fernandes, M.T., and de Castro, J.A. 2020. Evaluation of the diffusional coefficient in the acid baking process using microwave energy to reduce phosphorus content in iron ore particles. Minerals Engineering, vol. 157. pp. 106541. https://doi.org/10.1016/j.mineng.2020.106541
Delvasto, P., Valverde, A., Ballester, A., Muno, J.A., Gonzalez, F., Blazquez, M.L., Igual, J.M., and Garcia-Balboa, C. 2008. Diversity and activity of phosphate bioleaching bacteria from a high-phosphorus iron ore. Hydrometallurgy, vol. 92. pp. 124–129. https://doi.org/10.1016/j. hydromet.2008.02.007
Diab, H., Chouabbi, A., Chi Fru, E., Nacer D., and Krekeler, M. 2020. Mechanism of formation, mineralogy and geochemistry of the ooidal ironstone of Djebel Had, northeast Algeria. Journal of African Earth Sciences, vol. 162. pp. 103736. https://doi.org/10.1016/j.jafrearsci.2019.103736
Dong, Z., Zhu,Y., Han, Y., Gu,X., and Jiang, K. 2019. Study of pyrite oxidation with chlorine dioxide under mild conditions. Minerals Engineering, vol 133. pp. 106–114. https://doi.org/10.1016/j.mineng.2019.01.018
Elzinga, E.J. and Sparks, D.L. 2007. Phosphate adsorption onto hematite: An in situ ATR-FTIR investigation of the effects of pH and loading level on the mode of phosphate surface complexation. Journal of Colloid and Interface Science, vol. 308. pp. 53–70. https://doi.org/10.1016/j.jcis.2006.12.061
Table VIII
Results of leaching tests using geothermal water
Guerrak, S. 1988. Geology of the Early Devonian oolitic iron ore of the Gara Djebilet field, Saharan Platform, Algeria. Ore Geology Reviews, vol. 3. pp. 333–358. https://doi.org/10.1016/0169-1368(88)90026-1
Liu, Y., Zhang, H., Li, Z., Zhang, A., Zhang, X., and Qing, S. 2017. Impact of slag composition activity on the behavior of phosphorus in the smelting reduction process of high-phosphorus iron ores. International Journal of Hydrogen Energy, vol. 42. pp. 24487–24494. https://doi.org/10.1016/j.ijhydene.2017.06.119
Omran, M., Fabritius, T., Elmahdy, A.M., Abdel-Khalek, N.A., and Gornostayev, S. 2015. Improvement of phosphorus removal from iron ore using combined microwave pretreatment and ultrasonic treatment. Separation and Purification Technology, vol.156. pp. 724–737. https://doi.org/10.1016/j. seppur.2015.10.071
Parfitt, R.L. and Atkinson R.J. 1976. Phosphate adsorption on goethite (α-FeOOOH). Nature, vol. 264. pp. 740–742. https://doi.org/10.1038/264740a0
Pownceby, M.I., Hapugoda, S., Manuel, J., Webster, N.A.S., and MacRae, C.M 2019. Characterisation of phosphorus and other impurities in goethite-rich iron ores – Possible P incorporation mechanisms. Minerals Engineering, vol. 143. pp. 106022. https://doi.org/10.1016/j.mineng.2019.106022
Quast, K. 2018. A review on the characterisation and processing of oolitic iron ores. Minerals Engineering, vol. 126. pp. 89–100. https://doi.org/10.1016/j. mineng.2018.06.018
Song, S., Campos-Toro, E.F., and Valdivieso, A.L. 2013. Formation of microfractures on an oolitic iron ore under microwave treatment and its effect on
selective fragmentation. Powder Technology, vol. 243. pp. 155–160. https://doi. org/10.1016/j.powtec.2013.03.049
Tang, H., Fu, X., Qin, Y., and Qi, T. 2017. Iron recovery and phosphorus removal from oolitic high-phosphorus haematite. Journal of the Southern African Institute of Mining Metallurgy, vol. 117, no. 4. pp. 387–395. http://dx.doi. org/10.17159/2411-9717/2017/v117n4a11
Torres-Ceron, D.A., Acosta-Medina, C.D., and Restrepo-Parra, E. 2019. Geothermal and mineralogic analysis of hot springs in the Puracé-La Mina Sector in Cauca, Colombia. Geofluids, vol. 2019. pp. 1–4. https://doi. org/10.1155/2019/3191454
Yehia, A., Abd El-Halim, S., Sharada, H., Fadel, M., and Ammar, M. 2021. Application of a fungal cellulase as a green depressant of hematite in the reverse anionic flotation of a high-phosphorus iron ore. Minerals Engineering, vol. 167. pp. 106903. https://doi.org/10.1016/j.mineng.2021.106903 u
2ND INTERNATIONAL CONFERENCE 2024
18 JUNE 2024 - WORKSHOP 19-20 JUNE 2024 - CONFERENCE
SWAKOPMUND HOTEL AND ENTERTAINMENT CENTRE, SWAKOPMUND, NAMIBIA
Global Impact and Sustainable Supply

Due to their unique chemical, catalytic, electrical, magnetic, and optical properties, rare earth metals are critical materials in high-technology applications with irreplaceable application in areas such as medical devices, electric vehicles, energy-efficient lighting, etc. Recent geopolitical instability/challenges, the supply security of REEs is of global concern. Since the global supply chain is currently concentrated in limited jurisdictions such as China and Australia, the need to diversify the supply of these critical materials creates significant opportunities for African countries. The African
FOR FURTHER INFORMATION, CONTACT: E-mail: camielah@saimm.co.za
Camielah Jardine, Head of Conferences and Events
Tel: +27 538 0237
Web: www.saimm.co.za
continent is endowed with some of the world’s largest REE deposits, and as such, it can play a vital role in meeting the growing demand for these critical materials. However, in order to maximize value, there is need to establish and develop capabilities along the value chain. The conference provides a platform for in-depth discussions on the global role of African REE deposits and is designed to stimulate debate on opportunities to grow the African rare earths industry. Overall, the conference seeks to explore the continent’s role in shaping the future of the REEs industry.
Affiliation:
1Samancor, South Africa.
2Pyrometallurgy Division, Mintek, South Africa.
3Department of Chemical Engineering, Stellenbosch University, South Africa.
Correspondence to: A.V. Cherkaev
Email: Alexey.Cherkaev@SamancorCr.com
Dates:
Received: 31 Aug. 2022
Revised: 11 Dec. 2022
Accepted: 13 Dec. 2023
Published: February 2024
How to cite:
Cherkaev, A.V. Erwee, M., Reynolds, Q.G. and Swanepoel, S. 2024
Prediction of silicon content of alloy in ferrochrome smelting using data-driven models.
Journal of the Southern African Institute of Mining and Metallurgy, vol. 124, no. 2. pp. 67–74
DOI ID:
http://dx.doi.org/10.17159/24119717/2297/2024
ORCID:
A.V. Cherkaev
http://orcid.org/0000-0002-7637-0732
by A.V. Cherkaev1, M. Erwee1, Q.G. Reynolds2,3, and S. Swanepoel1
Synopsis
Ferrochrome (FeCr) is a vital ingredient in stainless steel production and is commonly produced by smelting chromite ores in submerged arc furnaces. Silicon (Si) is a componrnt of the FeCr alloy from the smelting process. Being both a contaminant and an indicator of the state of the process, its content needs to be kept within a narrow range. The complex chemistry of the smelting process and interactions between various factors make Si prediction by fundamental models infeasible. A data-driven approach offers an alternative by formulating the model based on historical data. This paper presents a systematic development of a data-driven model for predicting Si content. The model includes dimensionality reduction, regularized linear regression, and a boosting method to reduce the variability of the linear model residuals. It shows a good performance on testing data (R2 = 0.63). The most significant predictors, as determined by linear model analysis and permutation testing, are previous Si content, carbon and titanium in the alloy, calcium oxide in the slag, resistance between electrodes, and electrode slips. Further analysis using thermodynamic data and models, links these predictors to electrode control and slag chemistry. This analysis lays the foundation for implementing Si content control on a ferrochrome smelter.
Keywords
ferrochrome, silicon content, machine learning, principal component analysis, gradient boosting, mutual information.
Introduction
Ferrochrome (FeCr) is an alloy commonly used as raw material in the production of stainless steel and special steels requiring corrosion and creep resistance. The largest deposits of chromite ore occur in South Africa (Haldar, 2020). Most of the ferrochrome is produced by means of fluxed smelting of chromite ore using quartz and limestone in a submerged arc furnace (SAF). Typically, FeCr produced in this process contains about 50−53% Cr, 4−6% Si, and 6-8% C with the balance being Fe (Gasik, 2013).
The reduction of chromite with carbon in SAFs is quite complex, and has been documented in detail by several authors (Xiao, Yang, and Holappa, 2006; Hayes, 2004; Ringdalen and Eilertsen, 2001; Wedepohl and Barcza, 1983), but the overall reactions can be simplitied as follows:
Typically, slag is tapped at temperatures above 1700°C, with an average in-furnace temperature in the order of 1800°C. At these temperatures, the undesirable reduction of SiO2 (Equation [3]) is thermodynamically favourable and directly in competition with the first two chromite reduction reactions. The alloy thus becomes contaminated with Si. Aside from the quality issue, every 1% increase in Si content adds some 45 kWh per ton alloy to the specific energy requirement for smelting (Ringdalen, Rocha, and Figueiredo, 2015). In contrast, a low Si content in the alloy indicates a lack of active carbon for reduction reactions (Urquhart, 1972). It is for these reasons that understanding how to control Si in SAF smelting of chromite is important.
A target Si content in the alloy of no more than 4.5% is desirable as per general customer specifications. The exact mechanisms that can lead to variation of Si in the alloy are quite complex, and beyond the scope of this paper. The reader is referred to the literature for more information on the topic (see Ranganathan et
al., 2005; Ranganathan and Godiwalla, 2011; Hockaday and Bisaka, 2010; Geldenhuys, 2013; Erwee, Swanepoel, and Reynolds, 2021). A simplistic summary of these effects in SAF smelting of chromite is given in Figure 1. It is important to note that the diagram does not highlight all the interactions between the different causes; these are alluded to in the literature cited above. Due to the complexity of the process, machine learning methods can offer not only insight into the relative importance of the drivers for Si content of the alloy, but also a possible means of control by way of supporting decisionsmade by operators.
Machine learning methods for process monitoring
Machine learning (ML) methods have been applied for process monitoring tasks in various industries for over a decade (McCoy and Auret, 2019) to support decision-making by operators and, where possible, to automate it. At a more technical level, ML models are used for such tasks as data cleaning, missing data imputation, and noise reduction (unsupervised methods that include dimensionality reduction and clustering), and soft sensing and forecasting (supervised methods that include regression and classification). Unsupervised methods are characterized by the absence of the output, or response, variable i.e., the target is unknown. Their aim is to simplify and condense the data. In contrast, supervised methods aim to infer or predict a particular response, e.g., temperature in a reactor, liquid level in a vessel, product composition, etc
The rest of this subsection describes the process of ML model application to industrial data, starting with the terminology as this is quite specific to the ML field.
The data-set used for ML models is a table of entries consisting of M rows and N columns. Each column corresponds to a feature being measured. For example, hearth temperature, current through electrode, type of reductant, etc. A column is referred as a variable. A variable that is aimed to be inferred by an ML model is referred as a target, response, or output variable. Other variables are called predictors or features. The number of columns N determines the dimensionality of the data (target variables are usually excluded from it). Each row of the table corresponds to an individual observation and, thus, the term observation is used to denote a row (James et al., 2017).
Using a probabilistic view, each column is modelled as a random variable (RV). The values in the column provide concrete realizations of this variable. Hence, it is possible to use usual characteristics of RVs such as distribution functions, means, variances, etc. Furthermore, from this viewpoint ML is the same as statistical inference and aims at inferring probabilistic properties of the RVs.
Process monitoring data can be either numerical (temperature, flow rate, pressure, etc.) or categorical (e.g., type of feed). The latter, however, is rarer compared to numerical data. One common feature of all process monitoring data is that each variable is a time series, i.e. the order of observations matters. Therefore, ML models should not only consider present values of the variables, but also (in some form) their past values.
ML model
The following are common steps in a (supervised) ML model application:
➤ Data cleaning: removal of noise, imputing missing values, preselection of the features (usually based on domain knowledge)
➤ Splitting of the data into training and testing data-sets
➤ Transformation of variable values (standardization)
➤ Feature engineering: addition or replacement of variables using statistical or fundamental principles
➤ Dimensionality reduction (data simplification): densification of information content in the data
➤ Application of a regression or classification model.
Depending on the task and context, some intermediate steps may be skipped. Below is a short description of what each of these steps may involve. Step 6 is discussed in more details in the next subsection.
Obvious outliers, resulting from malfunctioning sensors or clerical errors in the case of manual data input, can be and should be removed from the data as they can severely affect model performance. However, identification of such outliers for a complex nonstationary process is a challenge and no general reliable methods exist. Missing values are a common occurrence in process monitoring data, especially in historical data where a particular variable was not measured from the beginning of the recording period. Many ML methods cannot deal with missing values. Thus, it is desirable to replace them with some sensible numeric values. Although several methods of imputation are available (use overall mean, last value carried forward, use some regression model to estimate missing values), each method comes with serious tradeoffs and, thus, imputation is often skipped. There is a danger of information leakage during data cleaning. To avoid it, this step is sometimes performed after step 2.
The ML model is fitted to the data. However, the same data cannot be used to assess model predictive performance. Thus, the data is split into a training set and a testing set. The former is used in learning algorithms, whereas the model predictive powers are examined using the latter. In general, the observations are sampled randomly without replacement to either training or testing parts.

However, in the case of time series data this is not possible since observations are not independent. In that case, observations are split at some time point T, with all the observations preceding T reporting to the training set and the rest to the testing set. As already mentioned, it is advisable to perform this split as early as possible to avoid information leakage.
Many ML methods involve linear combination of features. If the scales of values of variables differ, which is the case when variables correspond, for example, to temperatures, flow rates, or weights, it can mislead model training and skew the results. A few methods of scaling are available. Standardization refers to shifting the values such that their mean is zero and scaling to achieve a standard deviation of unity. Normalization linearly maps the original range of values to a [0,1] or [–1,1] interval. Normalization is useful if values have hard bottom and top values (for example, liquid levels in a tank).
Step 4 augments the data with new features. There can be a physical basis for additional variables. For example, pump gain, defined as a ratio of flow rate to pressure produced, can be added to the data. Statistically based variables are often used to good effect. For example, high-frequency data can be replaced by lowerfrequency observations of the mean, variance, or higher order moments over a time window. Additionally, time-shifted values of existing variables can be incorporated as additional features to capture the process dynamics (time embedding; Marwan et al., 2007). More precisely, for a time series variable Xt an additional set of variables [Xt-h, Xt-2h ,…, Xt-kh] is added in such a way that each (scalar) observation x(t) of Xt is replaced by a vector (x(t), x(t-h), x(t-2h) ,…, x(t-kh)) for some time shift step h and embedding dimensionality k. Such augmentation then naturally leads to autoregressive (AR) type models (Chatfield, 1996). If the embedding is used to capture the process dynamics, it results in each observation becoming independent from others. Thus, if it is done before the training-testing data split, the split can be performed by randomly sampling individual observations.
Dimensionality reduction (step 5) is a common preprocessing task in process monitoring as it helps to remove redundant variables from the data-set. Principal component analysis (PCA) is a standard technique for this due to its simplicity and robustness. PCA finds the set of latent variables, also known as principal components, that are linear combinations of the original variables in such a way that (i) each latent variable is uncorrelated from all others, and (ii) principal components are sorted in the descending order of their variability. Thus, it becomes possible, by selecting only a few first principal components, to account for most of the variability of the predictors. Other techniques for dimensionality reduction include independent component analysis (ICA) (Hyvärinen and Oja, 2000), linear discriminant analysis (LDA), empirical mode decomposition (EMD) (Boudraa and Cexus, 2007), and self-organizing maps (SOMs), to name a few. These methods are usually applied only if PCA fails to produce desirable outcomes or if there is a more specific objective, such as identification and separation of different sources in the signal (ICA) or identification of the clusters (LDA) (James et al., 2017). The main result of step 5 is densification of information content in the data-set, which helps to reduce the complexity of a subsequent regression or classification model (step 6).
In supervised learning there are two main objectives: either to predict a particular value of the target (such as Si content in alloy as
in the present paper) or to classify a target into a particular group (e.g., alarm or no-alarm condition). A commonly used term for the former is regression, and for the latter, classification. Since the model developed in this paper is a regression model, the rest of this subsection is focused on regression.
Linear regression models are among the oldest in ML. Despite their simplicity, they can still produce satisfactory inferences or forecasts for processes that are tightly controlled. To improve model generalization capabilities, its flexibility is sometimes restricted by the method called regularization. LASSO (least absolute shrinkage operator) linear regression is a regularization method that restricts the magnitude of linear regression coefficients in such a way that the coefficients for the predictors that are only weakly correlated with the target are set to zero (James et al., 2017). Thus, it can be used not only to improve model performance, but also to assess variable importance.
Despite their robustness, linear methods can miss noninear effects and variable interactions. Tree-based methods with bagging (random forest) or boosting (gradient boosting) are among the most competitive methods for nonlinear inference and forecasting (Markidakis et al., 2022). A tree-based method uses training data to recursively partition the input space to regions in which the target variable is approximately constant. An individual treebased predictor is very sensitive to slight changes in the input data and tends to over-fit the model (James et al., 2017). Bagging and boosting are two methods that help to overcome this weakness by constructing multiple trees on different portions of data and then aggregating their results. They are known as ensemble methods. Such methods combine multiple weak learners to form a single strong learner. Although both bagging and boosting tend to perform similarly, recent studies are showing that boosting outperforming bagging on a variety of problems (Makridakis et al., 2022). AdaBoost, XGBoost, and LigthGBM are commonly used, freely available implementations of the boosting algorithms. Among them, recently-developed LightGBM provides much shorter training times (Luo and Chen, 2020).
Model analysis: mutual information and variable importance
Typical regression model performance metrics include root mean square error (RMSE)

mean absolute error (MAE)

and coefficient of determination R2

Here, yi is the observed target value, y is the average target value, and y ^i is the inferred (predicted) target value. These metrics give an overall summary of how good the model inference is. However, there are some details that they cannot capture. For example, although they can tell whether model predictions are of ‘good’ or ‘bad’ quality, they cannot tell if the model can be improved (using current data).
Mutual information (MI) is a useful tool to assess the information content of predictors with respect to the response. MI between two random variables X and Y, I[X,Y], is defined as follows:

where integration is performed over the range of values of X and Y and pX, pY, and pXY are probability density functions of X, Y, and their joint distribution respectively (Paninski, 2003). If variables X and Y are independent, it follows that I[X,Y] 0, since pXY = pX pY and the logarithm argument becomes unity. MI reaches a maximum when there is a purely functional relationship between the variables: by observing X one can precisely deduce Y. MI can be used to preselect the predictors or examine how important is the contribution of an individual predictor.
To facilitate the comparison between MI that corresponds to different predictors, it is useful to rescale MI and introduce relative MI, RMI, as follows (Cherkaev et al., 2022):

which ranges from 0 to 1 (or 0% to 100%). Thus, if RMIs between the response and all the predictors are low, it is not expected of any model to provide a useful inference of the response (‘garbage in— garbage out’).
Study objectives
This study aims to predict Si content in the tapped FeCr alloy using the data available up to the point when the tap starts. The methodology is similar to that of (Jonsson and Ingason (1998), but it extends the approach in the following ways:
➤ Si content is predicted per tap, not per day
➤ A wide range of predictors is used. Regularization methods are used to identify important predictors
➤ A nonlinear model is used to improve linear model results
➤ Variable importance is assessed.
The rest of the paper is structured as follows. An overview of the data used for the study is followed by a description of the steps taken for data preparation (steps 1–4 of the ML model framework). Dimensionality reduction and regression model development are sthen shown, followed by an assessment of the model performance and variable importance. Analysis of residuals assesses the possibility of improving the model. Finally, a general discussion and conclusions are presented.
Furnace process monitoring data comprises three distinct aspects: regular process monitoring data (named here tag data), tap data, and recipe and KPI (key performance indicator) data.
The outputs of temperature and electrical signal sensors are recorded at high frequency to tag data. Here ‘high frequency’ means that data is recorded most often. In many operations such data is recorded manually on an hourly basis. In this study, tag data was recorded automatically and sampled every 2 minutes. The recorded data includes hearth and shell temperatures, electrode currents, electrode holder positions, and power attributed to each electrode. Due to malfunction of some of the sensors, the data-set contains a considerable number of missing entries. Overall, it contains 130 variables and 2 412 000 observations.
The results of the analysis of the chemical compositions of tapped slag and alloy are recorded in tap data. Tap data is considered ‘medium frequency’ in this study as it is recorded on average every 3.2 hours. Since the analysis requires some time to perform, this data is not recorded online. The tap data contains 70 variables and 11 648 observations.
Recipeand KPI data (recipes data for short) is recorded daily and summarizes, among other indicators, the amounts and sources of different raw materials (reductant, flux, and ore) used. Since there are many sources and categories of, for example, reductant, recipe data is sparse: 57% of all entries are zero. The recipe data-set contains 156 variables and 1556 observations.
Given the long processing times of a typical SAF, it is expected that not only most recently observed feature values, but also past values of features and the target, will influence future target value. To account for this influence, time embedding (see ML model framework subsection for more details) on the data-set was performed. It requires choosing the time shift step (delay interval) h and dimensionality k of the embedding. Although there are statistical methods to determine these parameters, they rely


heavily on stationarity of the time series. Technical data in the processing industry is rarely stationary in the statistical sense, and these methods often fail. A more reliable way to determine these parameters is to use domain-specific knowledge. For example, it cannot be expected to see the effects of recipe changes past two days. As for the tap data, a study on ferromanganese smelting (Cherkaev et al., 2022) showed that it is not necessary to choose the dimensionality k > 2.
Tag data is not embedded in this study since tag data represents immediate furnace conditions that have only a short-term effect. Tap data is embedded with n = 2, i.e., two previous taps are considered with the current tap entry. Similarly, recipe data is embedded with dimensionality n = 2.
One notable consequence of embedding is the considerable increase in the number of variables. Both, tap data and recipe data increased the number of variables three times for n = 2.
Working with three separate data-sets is not convenient. Thus, the data-sets were combined to form a single set. Tap data was used as the base. Since there are many observations in tag data corresponding to a single entry in tap data, i.e., there are many observations from the previous tap start to the current tap start, these were replaced by a mean value. Furthermore, to account for tag data variability, an additional variable was introduced: the standard deviation of the original variable between the taps. To summarize, each tag variable X with values xn, xn+1 ,…, xn+k between the tap opening times is replaced by two variables:


and each containing a single observation per tap. Recipe data was extended with zero-hold (last value carried forward) to provide one entry per tap.
Finally, current day recipe and current tap entries were excluded from the set of features since they cannot act as predictors for the current tap: they are available either at the end of the day or after the current tap is complete.
As a result of synchronization, dropping the variables that contain too many missing values and dropping the rows with missing tap data, the combined data-set contains 745 variables and 11 511 observations.
The combined data-set was split into training, testing, and final validation sets. Thanks to time embedding performed on tap and recipe data, each entry in the data-set is independent of previous entries. Thus, training and testing samples can be drawn randomly from the data. For the final assessment of the model performance it is, however, more instructive to draw a continuous sample.
First, 200 contiguous observations were drawn from the middle of the data-set for the final validation data; 70% of the rest of the observations were randomly chosen for training, and the remainder were assigned for testing. This resulted in training and testing data having 8057 and 3254 observations respectively.
The training data-set was used to calculate the mean and variance for each variable. These values were used to standardize all data-sets – training, testing, and validation.
This section presents the development of the data-driven model to predict Si content. All the development is done using the training data-set.
The high dimensionality of the data is a serious issue as it causes the variable-space to be only sparsely populated by observations. Furthermore, it is likely that the data contains many correlated variables. PCA was performed on the training set. Since PCA cannot process missing values directly, observations that contain them were removed from the data-set. The dimensionality reduction was performed by retaining the first 124 components that account for 90% of the total variance.
Linear model
Linear models have two attractive properties: they are cheap to train and easy to interpret. Thus, if there is a linear relationship between predictors and the response (Si content), it is advisable to extract it using a specialized linear model instead of relying on more general nonparametric models.
Similarly to PCA, linear models such as ordinary linear least squares (OLS), regularized OLS, or partial least squares (PLS) cannot handle missing values directly. The same approach as for PCA was followed: only the observations without missing values were used for training. LASSO linear regression was chosen as a linear model since it produces a sparse model (reduces the number of predictors), which helps model interpretation. The shrinkage parameter was automatically tuned during the learning procedure. The LASSO model was able to reduce the number of predictors from 124 to 84.
The LASSO model was able to reduce the variance of Si content on the training data-set from 1 (in standardized form) to 0.49. The distribution of residuals for the training data-set is shown in Figure 4. There is still a significant variability of residuals, which it is desirable to reduce. For this a nonlinear model needs to be employed.
Gradient boosting
It is assumed that the model is additive:


where residuals contain variability that was not explained by a linear model. These residuals are modelled using a gradient boosting (GB) method as implemented by the LightGBM package. GB involves a number of hyperparameters such as depth of individual trees, learning rate, and regularization parameters. A grid search was employed with 5-fold cross-validation to fine-tune these parameters. The final model was trained on the full training data-set with the fine-tuned hyperparameters.
Model performance
Model performance on training data
Although it is not possible to judge model performance when the model is applied to training data, it provides the base for comparison when applied to the testing data. Furthermore, it can give an idea of how effective model training was.
The coefficient of determination R2, MAE, and RMSE for both the linear model and the combined model are shown in Table I.
Figure 4 compares the distributions of Si content, the linear model residuals, and the combined model residuals. It is evident that each model provides a considerable reduction in residuals variability. This is especially true for the addition of the GB model.
Model performance on testing data
Performance on the testing data is shown in Table II and Figure 5. The performance indicators of the linear model on the testing data are similar to those on the training data. In contrast, the combined model shows much less variability reduction compared to the training data. Nonetheless, there is still considerable reduction in variability by both linear and nonlinear models.
Validation on contiguous data
The result of the model applied to the contiguous data is shown in Figure 6. It is evident that although some variability in measured Si content is missed, model predictions provide an improved and reliable estimate compared to mean value (zero).
Importance of variables
For the purpose of Si content control, it is not enough to only predict it, but it is necessary to identify factors that affect it. While it is possible to point out several physical factors that control Si content, it is difficult to identify a particular factor that drives it up or down. Machine learning models provide a few techniques to
Table I
Model accuracy on training data
Metric Linear model Combined linear and GB model
R2 0.50 0.77
MAE 0.38 0.27
RMSE 0.70 0.47
Table II
Model accuracy on testing data
Metric Linear model Combined linear and GB model
R2 0.53 0.63
MAE 0.38 0.32
RMSE 0.64 0.57

Figure 5 Histograms of Si content, linear model residuals, and full model residuals for testing data

6 Comparison of the model predictions and true Si content on the contiguous validation data-set
identify the most important predictors of the model output. Linear models, including regularized models such as LASSO, offer a direct way for this by inspecting the model coefficients. GB models offer variable importance ranking as a part of the learning algorithm. However, for the current study this method is suboptimal since a GB model is used to improve the linear model results. A more direct approach for ranking variable importance is to use a permutation method, by which the observations of each variable are shuffled and the reduction in model accuracy is assessed.
Features selected by the LASSO linear regression model
Since the LASSO model was applied to the result of PCA transformation, they need to be considered together. PCA transformation can be represented as follows:


where X M×N is the data matrix with M observations of N variables, R N×N is the full (orthogonal) rotation matrix, and P M×N is the matrix of principal components. The LASSO model has the form

where Y is the response (Si content), Pj is the j-th column of P, βj are non-zero coefficients of the LASSO model, and the ellipsis is used to show that other components were omitted. Combining this equation with PCA transformation gives:

where Ri is the i-th column of matrix R. Since all the variables in matrix X have zero mean and variance unity (after standardization), their contribution can be assessed by the magnitude of the entries of the vector

The first four largest entries of vector C correspond to Si content in the last two taps and average Si content in the last two days. This shows the strong autoregressive nature of the model. Other strong predictors include carbon and titanium content in metal in the previous tap, CaO content in the slag, and slag basicity.
Variables importance of the full model
The top importance predictors that were identified by the permutation importance method include past Si content values, carbon content in the previous tap (the second most important), electrode resistance, and electrode slip.
Analysis of residuals
Normality test
The Shapiro-Wilk normality test indicates that the combined model residuals are not Gaussian (p-value is 1.25×10⁻²⁵). Therefore, it is likely that there are a small number of factors that can further reduce their variability and, thus, improve the model.
Mutual information
Mutual information analysis was performed on the testing data-set to determine if there are predictors in the current data-set that can have a functional relationship with residuals. Predictors with more than 50% of missing values in the testing data-set were excluded from this analysis.
Compared to a fully deterministic model (i.e., residuals vs residuals) taken as 100% MI, the largest MI between the residuals and predictors is 0.7%, corresponding to the active power standard deviation between the last and the current taps. For comparison, the top relative MI between the predictors and Si content is 7.5%. Low values of MI between the predictors for model residuals indicate that it is unlikely that the current model can be improved using the same predictors.
One curious outcome of the features importance analysis is the absence of any recipe-related variables. The most likely explanation for this is that the recipe is correctly designed for the process. Indeed, recipe adjustments are made to control, among other parameters, Si content in the metal. Therefore, for the learning procedure, changes in the recipe appear to have no effect on Si content. The best way to pick up the recipe effect would be to randomly change the recipe, or at least to forgo Si content control in the recipe calculation. This, however, is impractical.
The features from the model, specifically the carbon and titanium contents of the alloy in the previous tap, the CaO content and basicity of the slag, and electrode parameters reflect what fundamentally drives many reduction reactions in pyrometallurgical processes, i.e. the relative effects of chemistry and temperature.
Consider the main reaction for SiO2 reduction in the furnace, repeated here for convenience:


The equilibrium constant for the reaction is:

The effect of temperature on the equilibrium constant for the reaction is given in Figure 7a. Although a simplistic view of a complex process, the temperature at which SiO2 reduction with carbon occurs has been shown to be almost overriding in SAF smelting of chromite (Haldar, 2020; Hayes, 2004) and largely due to improper heat input due to poor electrode control (James, Witten, Hastie, and Tibshirani, 2017) , i.e. if the resistance of the burden is such that the electrode tips sit high up in the furnace, a greater amount of energy is spent on a small volume of material, readily increasing the Si content of the alloy. Once Si is produced in a SAF process, the alloy droplets trickle to the bottom of the furnace. Very little can be done to refine the metal further, unlike, for example in open-bath chromite smelting processes (Hyvärinen, and Oja, 2000), where the alloy can still be refined by addition of highly basic oxides such as CaO.
This said, there is still a sound basis for the addition of basic oxides (e.g. CaO) to compensate for high Si contents of the alloy – if a mini-melt of high basicity slag forms close to the reaction sites for SiO2-C reaction, the activity of SiO2 in the melt can be suppressed to some degree by having a more basic slag, as shown in Figure 7b, limiting the extent to which the SiO2-C reaction is driven.
Reducible oxides in the slag, e.g. TiOx and VOx, naturally compete with CrOx and SiO2 in the slag for carbon. It is therefore not surprising that some of the minor elements in the alloy such as Ti come out as predictors for Si. Interaction between the alloy components can be described thermodynamically; however, the complexity and nonequilibrium nature of the SAF smelting process make it more difficult to do so. It is for this reason that a machine learning approach becomes invaluable. The effect of temperature (driven by electrical energy input from the electrodes) and chemistry effects are neatly combined into a practical model that can be used on the plant.

Figure 7 (a) Effect of temperature on the equilibrium constant for the SiO2-C reaction and (b) effect of slag basicity on the activity of SiO2 in a MgO-Al2O3-CaO-SiO2 slag in SAF FeCr smelting at 1700°C. B3 = (%CaO+%MgO)/(%SiO2). Calculations done in FactSage 8.0, using the FTOxid database
This study aimed to develop a data-driven Si content model and identify important drivers of Si content in FeCr smelting. The model, based on time-embedding, PCA, LASSO regression, and gradient boosting regression tree methods showed good predictive capabilities. The Si, C, and Ti contents in the metal and CaO content in the slag from the previous taps are among the strongest predictors of the Si content at he next tap. The importance of these predictors can be explained by the ‘inertia’ of a SAF (previous Si content) and chemical properties of the ore, reductant, and flux mixture. The absence of recipe-related variables as important features is probably due to the recipe being correctly designed. Analysis of residuals shows that it is unlikely that the current model can be improved any further (given the same data-set). Overall, this model can give an early warning sign to the operator if the Si content is moving away from the target.
Acknowledgements
The financial assistance of the National Research Foundation (NRF) toward this research is hereby acknowledged. Opinions expressed and conclusions arrived at are those of the author and are not necessarily to be attributed to the NRF. This paper is published by permission of Mintek.
Conflict of interest
On behalf of all authors, the corresponding author states that there is no conflict of interest.
CRediT author statement
AVC: Methodology – Machine learning, Investigation, Formal analysis, Software, Writing, Visualisation, Project administration; ME: Methodology – Thermodynamics, Investigation, Writing, Visualisation; QGR: Supervision, Funding; SS: Conceptualisation, Supervision.
References
Boudraa, A-O. and Cexus, J-C. 2007. EMD-based signal filtering. IEEE Transactions on Instrumentation and Measurement, vol. 56. pp. 2196–2202. Chatfield, C. 1996. The Analysis of Time Series. An Introduction. 5th edn. Chapman & Hall/CRC.
Cherkaev, A.V., Rampyapedi, K., Reynolds, Q.G., and Steenkamp, J.D. 2022. Tapped alloy mass prediction using data-driven models with an application to silicomanganese production. Furnace Tapping 2022. Springer. pp. 131–144.
Erwee, M., Swanepoel, S., and Reynolds, Q. 2021. The importance of controlling the chemistry of pre-oxidized chromite pellets for submerged arc furnace FeCr smelting: a study on furnace Si control. Proceedings of the 16th International Ferro-Alloys Congress (INFACON XVI) ,Trondheim, Norway, 27-29 September 2021. http://dx.doi.org/10.2139/ssrn.3926683
Gasik, M.M. 2013. Introduction. Handbook of Ferroalloys. Elsevier. pp. 3–7. Geldenhuys, I.J. 2013. Aspects of DC chromite smelting at Mintek — An overview. Proceedings of the Thirteenth International Ferroalloys Congress, Almaty, Kazakhstan, 9-13 June 2013. https://www.pyrometallurgy.co.za/ InfaconXIII/0031-Geldenhuys.pdf
Haldar, S.K. 2020. Minerals and rocks. Introduction to Mineralogy and Petrology Elsevier. pp. 1–51.
Hayes, P.C. 2004. Aspects of SAF smelting of ferrochrome. INFACON X: ‘Transformation through Technology’. Proceedings of the Tenth International Ferroalloys Congress, Cape Town, South Africa, 1–4 February 2004. https:// www.pyrometallurgy.co.za/InfaconX/046.pdf
Hockaday, S.A.C. and Bisaka, K. 2010. Some aspects of the production of ferrochrome alloys in pilot DC arc furnaces at Mintek. INFACON XII. Proceedingas of the 12th International Ferroalloys Congress, Helsinki, Finland. Outotek Oyj. pp. 367–376.
Hyvärinen, A. and Oja, E. 2000. Independent component analysis: algorithms and applications. Neural Networks, vol. 13. pp. 411–430.
James, G., Witten, D., Hastie, T., and Tibshirani, R. 2017. An Introduction to Statistical Learning with Applications in R. Springer.
Jonsson, G.R. and Ingason, H.T. 1998. On the control of silicon content in ferrosilicon. INFACON VIII. Proceedings of the 8th International Ferroalloys Congress, Beijing, China, 7-10 June 1998. China Science & Technology Press. pp. 95–98.
Luo, S. and Chen, T. 2020. Two derivative algorithms of gradient boosting decision tree for silicon content in blast furnace system prediction. IEEE Access, vol. 8. pp. 196112–196122.
Makridakis, S., Spiliotis, E., Assimakopoulos, V., Chen, Z., Gaba, A., Tsetlin, I., and Winkler, R.L. 2022. The M5 uncertainty competition: results, findings and conclusions. International Journal of Forecasting, vol. 38, no. 4. pp. 13651385.
Marwan, N., Romano, M.C., Thiel, M., and Kurths, J. 2007. Recurrence plots for the analysis of complex systems. Physics Reports, vol. 438. pp. 237–329.
McCoy, J.T. and Auret, L. 2019. Machine learning applications in minerals processing: a review. Minerals Engineering, vol. 132. pp. 95–109.
Paninski, L. 2003. Estimation of entropy and mutual information. Neural Computation, vol. 15. pp. 1191–1253.
Ranganathan, S. and Godiwalla, K.M. 2011. Influence of process parameters on reduction contours during production of ferrochromium in submerged arc furnace. Canadian Metallurgical Quarterly, vol. 50. pp. 37–44.
Ranganathan, S., Mishra, S.N., Mishra, R., and Singh, B.K. 2005. Control of silicon in high carbon ferrochromium produced in submerged arc furnace through redistribution of quartzite in the charge bed. Ironmaking & Steelmaking, vol. 32. pp. 177–184.
Ringdalen, E. and Eilertsen, J. 2001. Excavation of a 54 MVA HC-ferrochromium furnace. INFACON IX. Proceedings of the Ninth International Ferroalloys Congress. Quebec City, Canada, 3-6 June 2001. The Ferroalloys Association, Washinhton, DC. pp. 166–173. https://www.pyrometallurgy.co.za/ InfaconIX/166-Ringdalen.pdf
Ringdalen, E., Rocha, M., and Figueiredo, P. 2015. Energy consumption during HCFeCr-production at Ferbasa. INFACON XIV. Proceedings of the Fourteenth International Ferroalloys Congress, Kiev, Ukraine, 31 May-4 June 2015. pp. 668–675. https://www.pyrometallurgy.co.za/InfaconXIV/668-Ringdalen.pdf
Urquhart, R. 1972. The production of high-carbon ferrochromium in a submerged-arc furnace. Minerals Science and Engineering, vol. 4. pp. 48–65.
Wedepohl, A. and Barcza, N.A. 1983. The 'dig-out' of a ferrochromium furnace. Special Publication no, 7. Geological Society of South Africa, Johannesburg.
Xiao, Y., Yang, Y., and Holappa, L. Tracking chromium behaviour in submerged arc furnace for ferrochrome production. Proeceedings of the Sohn International Symposium Volume 7- Industrial Practice. Kongoli, F. and Reddy, R.G. (eds). TMS, Warrendale, PA. pp. 417-433. u
Affiliation:
1Northam Platinum Holdings, South Africa.
Correspondence to:
J.P. Gouvea
Email: gunjaba@gmail.com
Dates:
Received: 25 Nov. 2019
Revised: 10 May 2022
Accepted: 17 Oct. 2023
Published: February 2024
How to cite:
J.P. Gouvea. 2024
Remnants and isolated blocks of ground in the Klerksdorp Goldfield. Journal of the Southern African Institute of Mining and Metallurgy, vol. 124, no. 2. pp. 75–84
DOI ID:
http://dx.doi.org/10.17159/24119717/1653/2024
ORCID:
J.P. Gouvea
http://orcid.org/0000-0003-2970-6691
by J.P. Gouvea1
Synopsis
Back-analysis of two mining-induced tremors in 2011 was used to determine a modelling criterion for the entire Klerksdorp Goldfield (i.e., Vaal Reefs region). At that time, most mining operations in the region were owned by AngloGold Ashanti (AGA) and shared many geotechnical similarities. By 2018 AGA had sold off all its Klerksdorp operations to different mining companies, which continued applying the 2011 modelling criterion. As mining activities became more remote, scattered, and isolated, the extraction of isolated blocks of ground and remnants became increasingly necessary. However, the inherited criterion allowed only minimal or no mining activities at these areas.
Keeping in mind that safety is the overriding consideration, an innovative numerical modelling approach, which includes the application of peak particle velocity designs, was developed to provide practitioners in the Klerksdorp Goldfield with a suitable criterion to justifiably and safely mine isolated blocks of ground and remnants. This would not always be possible if a conformist approach was used.
Keywords seismicity, potency, PPV, remnant, isolated block of ground, bracket pillar.
Introduction
The Witwatersrand Basin in South Africa comprises nine distinct goldfields, namely the Central Rand, West Rand, West Wits, South Rand, East Rand, Evander, Free State, Vredefort, and Klerksdorp goldfields. Mining activities were first established in the Klerksdorp Goldfield in the late 1800s, and by the early 1930s, mainstream mining companies started conducting large-scale operations in the area.
AngloGold Ashanti (AGA) owned most operational mines in the Klerksdorp Goldfield in 2011. The area is notorious for hard-rock narrow tabular mining, and most operations applied a scattered mining method at depths ranging between 800 m and 3000 m below surface. At that time, back-analysis of two mining-induced rockbursts was used to define a numerical modelling criterion for the entire Klerksdorp Goldfield (Hofmann and Scheepers, 2011). This entailed using modelled seismic potency as a quantitative criterion to determine the seismic hazard assiciated with geological structures.
In 2018, AGA sold all its underground mining operations in the Klerksdorp Goldfield region to Harmony Gold and Village Main Reef (refer to district 3 in Figure 1). As the glory days of the Klerksdorp Goldfield mining sector faded, companies started mining in more remote, scattered, and isolated areas than before. The numerical modelling criterion derived in 2011 became impossible to apply in practice as the modelled seismic potency for geological structures surrounding these areas, typically referred to as isolated blocks of ground and remnants, was rarely within ‘acceptable’ limits.
Remnants and isolated blocks of ground (IBGs) are terms commonly applied to remaining pieces of ground (typically less than 1000 m2 in size) entirely or partly surrounded by extensively mined-out areas. In practice, the term remnant is reserved for IBGs that have only one egress or ingress to a workplace and are characterized by difficult mining conditions (e.g., seismicity, poor ground conditions).
Through a case study approach, this paper details an innovative numerical modelling approach, using elastic boundary element code, which includes the application of peak particle velocity designs, that was developed to enable companies in the Klerksdorp Goldfield to justifiably and safely mine IBGs and remnants.
The mine where the initial study was conducted (Hofmann and Scheepers, 2011) is a hard-rock, narrow tabular operation situated in the Klerksdorp Goldfield. The Klerksdorp gold mining district is situated approximately 160 km southwest of Johannesburg, covering a total area of 200 km2 (Figure 2). Large-


scale mining activities in the region started in the early 1930s, and by 1970 the region was experiencing substantial mine-related seismicity (Gay and van der Heever, 1982), especially along geological structures, which necessitated further research.
The case study mine uses a twin shaft system to access the orebody and operates over eight main production levels. A scattered mining method is applied, similar to neighbouring mines. Stope and panel configurations may be breast, up-dip, down-dip, or on an apparent dip, depending on mining conditions and the presence of nearby geological structures. Mining takes place from predeveloped, dip-orientated raise lines, approximately 150 m to 180 m apart on strike, depending on the position of, and displacement on, nearby geological features.
It is important to note that scattered mining requires regular final extraction when mining approaches holing. This is inherent
to scattered mining and does not necessarily constitute remnant mining conditions.
The Vaal Reef, the primary economic horizon, occurs in a well-bedded argillaceous environment and is stratigraphically located near the middle of the Central Rand Group. The orebody is structurally complex and is predominantly transected by normal, graben, and horst structures (including bedding-plane faults). These structures have displaced the orebody to mineable depths of between 1000 m and 2300 m below surface. The reef channel varies between 30 cm and 200 cm in thickness and dips 10º to 35º in a southeasterly direction. The Main Bird series MB4 forms the hangingwall of the reef package, with the MB5 forming the immediate footwall (see the stratigraphic columns in Figures 3 and 4). The uniaxial compressive strength of these rock types on average ranges between 170 and 220 MPa.

The historical modelling criterion was determined by backanalysing two seismic events of local magnitude 3.0 and 4.0 that occurred at the mine on 15 October 2009 and 29 November 2009, respectively (Figure 5). These events resulted in significant damage to underground workings.
Boundary element numerical modelling software was used to simulate shear slip on the geological structure where the seismic events occurred. The coseismic slip was simulated using nonzero cohesion and friction angle (as part of the Mohr-Coulomb failure criterion), (Hofmann and Scheepers, 2011). After successful calibration and simulation of shear slip on the geological structure, the need for a forward modelling methodology for the mine was identified and assessed (after Hofmann, 2011).
The assessment was not an attempt to predict seismic events under planned mining, but rather to quantify the conditions under which seismicity can occur. For this purpose, seismic potency was used to quantify coseismic deformation, estimated from the lowfrequency plateau in the displacement spectrum. Seismic potency (P) is given by:
where A is the source area and D is the weighted average displacement on a particular geological feature.
Seismic potency was calculated at two different positions along the geological structure (areas A and B on Figure 5) for mining executed between January 2009 and October 2009. From


the historical modelling methodology, input parameters, and spatial analysis polygon, it was concluded that a total modelled seismic potency exceeding 775 m3 indicated a potentially unstable geological structure response (Hofmann, 2011).
One can appreciate that the modelling criteria that originated from the initial work by Hofmann and Scheepers (2011) were never divulged in a public forum due to the lack of case studies. Nonetheless, other practitioners in the Klerksdorp Goldfield applied the P = 775 m3 criterion in the absence of any other quantitative or qualitative criteria.
Operations in the Klerksdorp Goldfield resorted to abandoning blocks of ground or implementing substantial bracket pillars where the seismic potency on geological structures exceeded the P = 775 m3 criterion. The effectiveness of these stability pillars in risk mitigation was rarely considered, and as a result, the extraction of many IBGs and remnants was deemed not feasible.
Proposed methodology for extracting remnants and IBGs
Since risk is an integral part of mining, ‘acceptable risk’ becomes a necessary and significant consideration when assessing the mineability of a block of ground. A practical approach is to implement measures that result in acceptable levels of reliability and safety. One of the measures is thorough design, to ensure that all likely hazards have been satisfactorily addressed (after Stacey, 2009).
Figure 6 is a simplified process outline of the different geotechnical considerations that make up a remnant or IBG assessment. Decision gates determine if a block of ground should be considered further for possible extraction.
Considering all the functional requirements and constraints, the objective of the approach or methodology is to determine if a pillar or remnant can be extracted.
Plan assessment
Unfortunately, the reason for remnants and pillars being left intact is not always known, mostly due to the length of time elapsed since these areas were last actively mined. In the absence of accurate and definitive information, numerous inferences can be made from assessing historical mine plans and consulting persons who were working in the area at the time when the pillar or remnant was last mined (alternatively, persons who last visited the area). Factors can include a financial decision (grade, gold price, production costs) or rock mass conditions (large falls of ground, compromised access ways, seismicity). The assessment can provide valuable insights into anticipated rock mass behaviour that directly impacts on the potential mining of a remnant or isolated pillar.
Over and above contemplating the likely reasons that led to the creation of a particular remnant or IBG, numerous other geotechnical factors need to be considered during the plan assessment phase. Singh et al. (2006), as well as Rangasamy and Jager (2002), summarized several geotechnical factors to consider when assessing the potential extraction of a remnant or IBG (ground control district, structural and stratigraphical interpretation, access way stability, mining method, and layout, etc.). These geotechnical aspects are relatively well understood in the mining industry; however, they are more critical when dealing with remnants and isolated pillars, which are geotechnically more hazardous and proverbially unforgiving.
After the mine plans have been holistically reviewed; the grade, size of the block, and ease of access will ultimately determine if the block is worth pursuing further (decision gate 1, Figure 6).
It is important to develop conceptual layouts and designs for remnants or isolated pillars prior to the underground visit. Technical and practical considerations during this phase will, to a large extent, influence, and guide future assessments. In this regard, the Witwatersrand Rock Burst Committee (Durrheim and Riemer, 2012) made numerous practical suggestions regarding remnant and pillar mining layouts (Jeppe, 1946):
➤ Pillars or remnants should not be left where this is avoidable
➤ Efforts should be made to avoid the formation of IBGs, and to that end, panels should lead against mined-out areas or boundaries
➤ Where multi-reef mining takes place, one reef should be worked out as completely as possible in advance of the other
➤ Main haulages should be situated a considerable distance into the footwall of the reef package
➤ Final remnants should be positioned away from potentially seismically active geological features
➤ Mining should proceed away from the mined-out area towards solid ground wherever possible.
In terms of remnants, it was suggested that:
➤ The number of persons at the working face should be kept to a minimum
➤ The panel face should advance rapidly and continuously
➤ The direction of face advance should be carefully selected to ensure safety
➤ Sufficient yielding support should be kept close to the advancing face.

These guidelines are still valid and used in the industry today.
Seismic assessment
In terms of seismic energy release, the primary risks associated with the Vaal Reef in the Klerksdorp Goldfield are seismic emissions associated with geological structures in the form of ‘slip type’ events, with faceburst type events rarely being observed. True facebursts are rare and do not demonstrate a trend; however, this should be confirmed by conducting a seismic analysis of the area in question.
Seismic source parameters in the space, time, and volume mined domain need to be assessed (Figure 7). This would assist in quantifying seismic sources and provide useful insights into seismic source mechanisms. These interpretations may impact the overall extraction of a pillar or remnant and its extraction sequence on a local and regional scale.
Seismic data, in conjunction with site-specific experience, influences if the block of ground is worth pursuing further (decision gate 2, Figure 6).
Modelling-based hazard assessment
Design criteria typically used to assess mining of pillars and remnants do not necessarily apply to the Klerksdorp Goldfield. Typical methods, including average pillar stress (APS) and energy release rate (ERR), have limited use in the Klerksdorp Goldfield, as they primarily focus on burst-type events.
Jooste and Malan (2020) remarked ‘‘As many of the older mines exploit remnants, the question should be asked’’ to what extent these criteria are valid in remnant areas, and if they are not, what alternative method should be used to estimate the stress distribution and associated hazard.
The modelling methodology considered in this paper assesses seismic potency induced by the extraction of remnants or IBGs. It attempts to position and simulate the largest anticipated seismic event associated with the extraction of a particular pillar or remnant. Seismic hazard is inferred from the damage potential of the associated event, which is directly related to the location and distance of the seismic source with respect to a workplace.
Figures 8 and 9 are typical examples of model geometries in a boundary element numerical model.
Seismic potency and excess shear stress (after Ryder, 1987) are modelled for different geological structures near remnants and IBGs. Similar to the historical modelling approach, structures with a total modelled seismic potency below 775 m3 are deemed mineable. However, contrary to the historical modelling methodology (Hofmann and Scheepers, 2011), further analysis is conducted where the total modelled seismic potency on a geological structure exceeds 775 m3
In principle, the severity of a potential rockburst theoretically decreases the further away a workplace is from the seismic source. To better quantify the effects of distancing workplaces from sources of potentially damaging seismic events, the process starts with assessing the most probable location of an event. This is done by assessing seismic data and modelled potency on geological structures (Figure 10).
As a continuation of the process outlined above, mining step results are subtracted from each other to obtain differential results. Considering that blocks of ground were separately staged during the model construction, this assists in quantifying the seismic impact an individual pillar or remnant will have on a particular geological structure. The magnitude of selection is not considered absolute; however, a conservative approach is advocated where individual remnants and IBGs are extracted in a single mining step.
Equations provided by Jager (1988), Jager and Ryder (1999), as well as the Hanks Kanamori moment magnitude formula (Grandin et al., 2011) make it possible to convert modelled values (shear stress, displacement, area) to anticipated seismic moment and magnitude. Once the most likely location of failure (i.e., lobes of ride on the modelled geological structure) and magnitude have been determined, peak particle velocity (PPV) equations are used to determine anticipated ground motion at surrounding workplaces. The following equations were considered:
➤ McGarr, Green, and Spottiswoode, 1981
➤ Spottiswoode, 1984
➤ Potvin and Wesseloo, 2013
➤ Kaiser et al., 2010
➤ Kaiser, Tannand, and McCreath, 1996
➤ Butler and van Aswegen, 1993
➤ Mendecki, 2019.


Figures 11 and 12 depict anticipated ground motion, for a range of seismic event magnitudes, at locations that are 10 m and 100 m away from the seismic source, respectively.
The energy absorption criteria for ground support in narrow tabular mines are calculated based on an initial hangingwall velocity
of 3 m/s arrested within 0.2 m (Daehnke, van Zyl, and Roberts, 2001). At first, it can be tempting to consider 3 m/s (or 300 cm/s) as the design cut-off. However, studies have shown that damage can be experienced at lower velocities for different operations (Table I: Potvin and Wesseloo, 2013; Kaiser et al., 2010).


Table I
Anticipated seismic damage for different PPV ranges
PPV range
Anticipated damage
<50cm/s No damage
50cm/s–100cm/s Minor damage (shakedown)
100cm/s–300cm/s Falls of ground
>300cm/s Severe damage
As the proposed ranges for anticipated seismic damage require further research, conservative PPV ranges should be considered when designing bracket pillars. As more case studies are back-analysed and become available, higher PPV ranges can be considered.
Rockburst mitigation strategies deployed in the Klerksdorp Goldfield can be broadly classified into two categories. The first
set of controls is aimed at reducing the likelihood of experiencing potentially damaging seismic events by implementing safety and bracket pillars. Bracket pillars reduce the seismic hazard of a geological structure by providing sufficient clamping forces (normal stresses acting on the plane). In addition, bracket pillars effectively increase the distance between a workplace and the seismic source. A larger distance from the seismic source can reduce the maximum ground velocities that stope support is exposed to and makes it possible for support to protect workers more effectively. Unfortunately, very little engineering effort goes into defining this suitable distance or bracket pillar size. The size of bracket pillars is typically based on engineering judgement and experience. Safety pillars reduce the seismic hazard of a geological structure by effectively limiting mining spans and providing regional support, subsequently reducing closure. Past research has indicated that high levels of closure are associated with increased seismicity along surrounding geological structures.
After reviewing the modelling results, a decision is made whether the block of ground is worth pursuing further (decision gate 3, Figure 6).
Site investigation
Remnants and pillars are typically highly stressed, densely fractured, subject to high closure rates, and seismically active. Due to these prevailing conditions, the probability of rock-related incidents and accidents is higher than in ‘normal’ mining areas (higher risk). This makes the extraction of remnants and pillars unique, requiring improved designs, planning, and execution of extraction to reduce the risk.
Remnants and pillars are generally not situated near active mining areas. These old or sealed-off areas are likely to contain high-temperature air and noxious gases that could have potentially fatal consequences if due precautions are not taken prior to and during inspection.
When any abandoned or unventilated excavations or areas are to be re-opened (refer to Figure 13), an official request must be submitted, and permission granted from a responsible and appointed person (Section 3.1 of the Mine Health and Safety Act) before any seal is broken. Where possible, through-ventilation must be established a day prior to entry by opening seals on the intake and return side of the abandoned area. The return air from the abandoned area is then checked for gases and high air temperatures prior to entry.
There shall be a minimum of three persons in every investigation. A typical investigation team should consist of a blasting certificate holder (required), Ventilation Officer (required), Mine Overseer (required), Geologist (optional), Rock Engineer (optional), and assistants (optional).
No investigation into previously sealed off areas may be attempted unless the following items and equipment are available:
➤ GDIs (gas detection instruments)
➤ Whirling hygrometer
➤ Bottled aluminium dust (better known as ‘puff-puff’)
➤ Tins of spray paint
➤ Sufficient drinking water for each person
➤ Two identical plans, one for surface and one for underground
➤ Velocity meter
➤ Measuring tape
➤ Drager and tubes
➤ Self-Contained Self Rescue (SCSR) pack for each person
➤ First aid equipment
➤ PPE (personal protective equipment)
➤ Vent seal (also referred to as Versi-Foam).
Due consideration should be given to the health and safety of the investigating team members. Underground investigations of remnants or isolated pillars typically involve the removal of walls, travelling far distances on foot, carrying heavy equipment

and negotiating steep inclines and restricted areas. This is further exacerbated due to the majority of activities taking place in humid and poorly ventilated conditions.
Under no circumstances may any member take part in a visit if he or she:
➤ Is feeling sick or ill
➤ Is under the influence of alcohol or using strong medication (preceding 48 hours)
➤ Did not eat breakfast
➤ Was off sick from work the day before
➤ Has an expired certificate of fitness;
➤ Is classified heat-intolerant by a medical practitioner
➤ Was not underground for more than five consecutive days prior to the planned investigation.
Actual workplace conditions are unknown to investigating team members beforehand. When level-to-level investigations are conducted, the possibility exists that one of the accessways may be compromised (refer to Figure 14) and unplanned deviations from the proposed route are required (refer to Figure 15). From experience, this was the case on multiple investigations, and air flow was found to be an unreliable indication of whether accessways are still open.
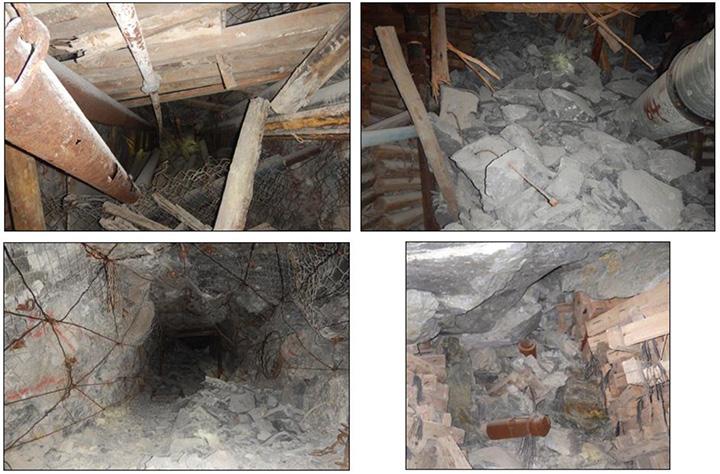
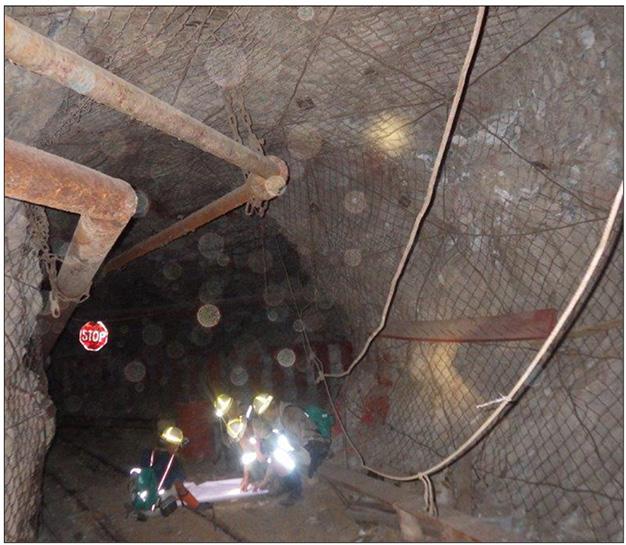
Rehabilitation and ‘upgrading’ of support at historically minedout workplaces is a contentious topic for different operations. Not only did the extent of serviceable infrastructure increase, but these excavations were supported according to support standards in force at that time (refer to Figure 16). Mines continuously attempt to improve health and safety, and as a result, several support standards have been amended over the years. More often than not, these amendments were made to further improve health and safety at the mine, and not because previous standards were regarded as unsafe or insufficient. The mine should review these historically applied standards and their effectiveness before deciding to rehabilitate or ‘upgrade’ installed support to modern-day standards. The alternative can be costly and negatively affect the mine‘s ability to extract remnant and pillar areas.
Once a site investigation has been completed, it is crucial that these areas are re-sealed (refer to Figure 17) to prevent access by unauthorized personnel and to maintain the integrity of the ventilation flow to the rest of the mine workings.
Considering the conditions of the support and excavation (overall stability) at the remnant or pillar mining area, a decision is made as to whether the block of ground is worth pursuing further (decision gate 4, Figure 6).
A total of 113 remnants and pillar mining areas were assessed over 2 years at the case study site. Applying the historical modelling methodology, 80 of the 113 remnants or pillars were deemed mineable (71%). Applying the new methodology, 107 of the 113 remnants or pillars were deemed mineable (95%). This improvement was significant considering the mine‘s operational strategy of balancing remnant and pillar mining with mining at newly developed raise lines.
Since the implementation of the new methodology at the study site, production personnel have prioritized and safely extracted numerous remnants and IBGs close to serviceable infrastructure. Notwithstanding the favourable results in the short term, the mining sequence being executed may inadvertently have negative implications in future, especially as regards remnants and isolated blocks at more remote areas of the mine where retreat mining sequences are critical. Well planned mining and support strategies are fundamental to the successful extraction of remnants and IBGs.
Discussion
In a recent annual report submitted by the Mine Health and Safety Inspectorate (MHSI), it was recognized that mining operations are running out of virgin ground as they are approaching the end of their life. As a result, mining companies rely on mining IBGs and remnants that are prone to seismicity and are likely to pose a higher probability for falls of ground.
The MHSI went on to state that preliminary investigations into mine disasters (a term typically reserved for a mine accident that results in the death of four or more employees) in the Klerksdorp Goldfield suggested that a lack of safe mineable ground and companies resorting to pillar mining without comprehensive risk management plans contributed to the disasters.
As a strategy to improve the status quo, the MHSI committed to more frequent and purposeful inspections at operations mining pillars and remnants. Furthermore, they have requested mines to submit detailed and comprehensive risk management plans for pillar areas and remnants before any mining of these can be allowed. These documents should be submitted to the MHSI at least


6 months prior to mining the area in question to allow for proper review and further work, should it be required. This is a wellconsidered initiative.
In a changing mining industry adopting emerging technologies, past practices may become obsolete, and the lack of rigorous reviews of these designs may result in systems that are neither optimized, nor effective (Gouvea and Stacey, 2019). This is the case considering the modelling criteria used in the Klerksdorp Goldfield.
Due to the higher risk inherent in mining remnants and pillars, it is in the best interest of all stakeholders (mine management, mine employees, goverment regulators, and associated unions structures) to ensure that these areas are properly investigated and the risks assessed prior to attempting extraction. The health and safety of workers remain integral to the long-term sustainability of the mining sector.
From a general point of view, the approach proposed in this paper is sound but it only covers fault-slip seismic events on known geological structures. Fault-slip is generally the most hazardous and common event, especially in the case study region (Klerksdorp Goldfield).
Numerical modelling approaches utilizing APS and ERR to assess remnants and pillar mining areas are obsolete when considering fault-slip on geological features. This notion was seconded by other industry geotechnical engineers that are involved with the assessment of remnants and pillar mining (after le Roux and Stacey, 2008): ‘‘The results of the study suggest that the use of average pillar stress, energy release rate and hydraulic radius is ineffective for the evaluation of the potential dynamic failure of remnants’’.
The approach in this paper can be deemed conservative in the long term. The shorter the ‘prediction’ period and the smaller the remnant or pillar mining area, the more uncertainty exists; hence back-analyses and more case studies are required for further calibration.
The results from the case study mine indicate that where the innovative approach for assessing the mineability of remnants or pillars looks promising.
References
Butler, A.G. and van Aswegen, G. 1993. Ground velocity relationships based on a large sample of underground measurements in two South African mining regions. Proceedings of the 3rd International Symposium on Rockburst and Seismicity in Mines, Kingston, Ontario, Canada. CRC Press. pp. 41–49.
Daehnke, A., van Zyl, M., and Roberts, M.K.C. 2001. Review and application of stope support design criteria. Journal of the South African Institute of Mining and Metallurgy, vol. 101. pp. 135–164.
Durrheim, R.J. and Riemer, K.L. 2012. History of endeavours to mitigate the rock burst risk in South African mines. Proceedings of the 9th International Mining History Congress, Johannesburg, South Africa, 17-20 April 2012. Society for Mining, Metallurgy, and Exploration, Englewood, CO. pp. 156–171. http://hdl. handle.net/10204/5990
Gay, N.C. and van der Heever, P.J. 1982. In situ stresses in the Klerksdorp gold mining district, South Africa - A correlation between geological structure and seismicity. Proceedings of the 23rd U.S Symposium on Rock Mechanics (USRMS), Berkeley, California. American Rock Mechanics Association, Alexandria, VA. Paper no. ARMA-82-176
Gouvea, J.P. and Stacey, T.R. 2019. An approach to determine the effectiveness of tendons in a support system. Proceedings of the 7th African Young Geotechnical Engineers Conference. South African Institution of Civil Engineering Geotechnical Division and the International Society of Soil Mechanics and Geotechnical Engineering.
Grandin, R., Jacques, E., Nercessian, A., Ayele, A., Doubre, C., and Socquet, A. 2011. Seismicity during lateral dike propagation: Insights from new data in the recent Manda Hararo- Dabahu rifting episode (Afar, Ethiopia). Geochemistry, Geophysics, Geosystems, vol. 12, no. 4. doi: 10.1029/2010GC003434
Hofmann, G.F. 2011. Numerical modelling back-analysis of two large seismic events associated with Zuipings-type faults. AngloGold Ashanti.
Hofmann, G.F. and Scheepers, L.J. 2011. Simulating fault slip areas of mining induced seismic tremors using static boundary element numerical modelling. Mining Technology, vol. 120. pp 53–64.
Minerals Council. 2023. https://www.mineralscouncil.org.za/sa-mining/gold [qccessed: 12 March 2023].
Jager, J.A. 1988. Excess shear stress in the assessment of geological hazardous situations. Journal of the South African Institute of Mining and Metallurgy, vol. 88. pp. 27–39.
Jager, A.J. and Ryder, J.A. 1999. A Handbook on Rock Engineering Practice for Tabular Hard Rock Mines. Creda Communications, Johannesburg, South Africa.
Jeppe, C.B. 1946. Gold Mining on the Witwatersrand. Transvaal Chamber of Mines, Johannesburg. pp. 805-806.
Jooste, Y. and Malan, D.F. 2020. The need for improved layout design criteria for deep tabular stopes. Journal of the Southern African Institute of Mining and Metallurgy, vol. 120. pp. 23–32.
Kaiser, P.K., Tannant, D.D., and McCreath, D.R. 1996. Canadian Rock Burst Support Handbook. Geomechanics Research Centre, Laurentian University, Sudbury, Ontario.
Kaiser, P.K., Kim, B., Bewick, R.P., and Valley, B. 2010. Rock mass strength at depth and implications for pillar design. Proceedings of the Fifth International Seminar on Deep and High Stress Mining. Australian Centre for Geomechanics, Perth. pp 463–476.
Le Roux, P.J. and Stacey, T.R. 2008. Establishing a methodology for the assessment of remnant stability using recorded seismic events on Harmony mines. SHIRMS 2008: Proceedings of the First Southern Hemisphere International Rock Mechanics Symposium, Potvin, Y., Carter, J., Dyskin, A., and Jeffrey, R. (eds), Australian Centre for Geomechanics, Perth. pp. 679–691, https://doi.org/10.36487/ ACG_repo/808_95
McGarr, A., Green, R.W.E., and Spottiswoode, S.M. 1981. Strong ground motion of mine tremors: Some implications for near-source ground motion parameters. Bulletin of the Seismological Society of America, vol. 71, no. 1. pp. 295–319.
Mendecki, A.J. 2019. Frequency range, log E, log P and magnitude. Proceedings of the 8th Rockburst and Seismicity in Mines Symposium, Russia. https://www. imseismology.org/doc/publications/Mendecki-2013-Frequency-Range-logElogP-and-Magnitude.pdf
Potvin, Y., Wesseloo, J., and Heal, D. 2013. An interpretation of ground support capacity submitted to dynamic loading. Proceedings of the Fifth International Seminar on Deep and High Stress Mining. Australian Centre for Geomechanics, Perth, Australia. pp. 251–272.
Rangasamy, T. and Jager, A.J. 2002. A selective review of remnant definitions and creation in the South African gold mining industry. Proceedings of the SANIRE Symposium, Re-Defining the Boundaries. South African National Institute of Rock Engineering.
Ryder, J.A. 1987. Excess shear stress (ESS): An engineering criterion for assessing unstable slip and associated rock burst hazards. Proceedings of the 6th ISRM Congress, Montreal, Canada. International Society for Rock Mechanics and Rock Engineering. Paper no. ISRM-6CONGRESS-1987-224.
Singh, N., Kataka, M., Milev, A., and Sellers, E. 2006. Remnant mining in South African gold mines. Proceedings of the 41st U.S. Symposium on Rock Mechanics, Golden, CO. American Rock Mechanics Association, Alexandria, VA. Paper no. ARMA-06-1038.
Spottiswoode, S.M. 1984. Source mechanisms of mine tremors at Blyvooruitzicht Gold Mine. Rockbursts and Seismicity in Mines: Proceedings of the First International Symposium on Rockbursts and Seismicity in Mines, South African Institute of Mining and Metallurgy, Johannesburg, pp. 29–37.
Wiles, T. 2020. Map3D user’s manual – Version 67, www.map3d.com/ftp/Map3D_ Help.pdf. u
Journal of the Southern African Institute of Mining and Metallurgy
11-14 March 2024 — Southern African Pyrometallurgy
2024 International Conference
Sustainable Pyrometallurgy - Surviving Today and Thriving Tomorrow
Misty Hills Conference Centre, Johannesburg, South Africa
Contact: Camielah Jardine
Tel: 011 538-0237, E-mail: camielah@saimm.co.za
Website: http://www.saimm.co.za
12-13 March 2024 — GMG Kiruna Forum | Tomorrow’s Mining: Innovating to Improve the Way We Mine
Contact: Camielah Jardine
E-mail: camielah@saimm.co.za
Website: https://gmggroup.org/gmg-kiruna-forumtomorrows-mining-innovating-to-improve-the-way-wemine/
19-25 April 2024 — World Tunnel Congress 2024 Shenzhen, China
Website: https://www.wtc2024.cn/
24-25 April 2024 — Drilling and Blasting Online Short Course 2024
Contact: Camielah Jardine
Tel: 011 538-0237, E-mail: camielah@saimm.co.za
Website: http://www.saimm.co.za
20-23 May 2024 — The 11TH World Conference of Sampling and Blending 2024 Hybrid Conference
Misty Hills Conference Centre, Johannesburg, South Africa
Contact: Camielah Jardine
Tel: 011 538-0237, E-mail: camielah@saimm.co.za
Website: http://www.saimm.co.za
27-31 May 2024 — Nickel-Cobalt-Copper LithiumBattery Technology-REE 2024 Conference and Exhibition Perth, Australia
Website: https://www.altamet.com.au/conferences/alta2024/
11-13 June 2024 — 15TH International Conference on Industrial Applications of Computational Fluid Dynamics
Trondhedim, Norway
E-mail: Jan.E.Olsen@sintef.no
Website: https://www.sintef.no/projectweb/cfd2024/
18-20 June 2024 — Southern African Rare Earths 2ND International Conference 2024 Swakopmund Hotel and Entertainment Centre, Swakopmund, Namibia
Contact: Camielah Jardine
Tel: 011 538-0237, E-mail: camielah@saimm.co.za
Website: http://www.saimm.co.za
3-5 July 2024 — 5TH School on Manganese Ferroalloy Production
Decarbonization of the Manganese Ferroalloy Industry
Boardwalk ICC, Gqeberha, Eastern Cape, South Africa
Contact: Gugu Charlie
Tel: 011 538-0238, E-mail: gugu@saimm.co.za
Website: http://www.saimm.co.za
5-8 August 2024 — 2nd Battery Materials Conference 2024 The Arena, Emnotweni Casino, Mbombela, Mpumalanga
Contact: Camielah Jardine
Tel: 011 538-0237, E-mail: camielah@saimm.co.za
Website: http://www.saimm.co.za
1-3 September 2024 — Hydrometallurgy Conference 2024
Hydrometallurgy for the Future
Hazendal Wine Estate, Stellenbosch, Western Cape, South Africa
Contact: Camielah Jardine
Tel: 011 538-0237, E-mail: camielah@saimm.co.za
Website: http://www.saimm.co.za
5-6 September 2024 — Mine Planning and Design School 2024
Electra Mining Nasrec, Johannesburg, South Africa
Contact: Camielah Jardine
Tel: 011 538-0237, E-mail: camielah@saimm.co.za
Website: http://www.saimm.co.za
18-21 September 2024 — Infacon XVII 2024 17TH International Ferro-Alloys Congress Beijing, China
Website: https://www.infacon17. net/?sid=2178&mid=577&v=108
9-10 October 2024 — Mine Closure Conference 2024 Maslow Hotel, Sandton, South Africa
Contact: Camielah Jardine
Tel: 011 538-0237, E-mail: camielah@saimm.co.za
Website: http://www.saimm.co.za
16-17 October 2024 — ESGS Conference 2024
ESG in the minerals industry challenges and opportunies Johannesburg, South Africa
Contact: Camielah Jardine
Tel: 011 538-0237, E-mail: camielah@saimm.co.za
Website: http://www.saimm.co.za
28-29 October 2024 — SANCOT Symposium 2024
Lesotho Highlands, Lesotho
Contact: Gugu Charlie
Tel: 011 538-0238, E-mail: gugu@saimm.co.za
Website: http://www.saimm.co.za
11-12 November 2024 — Mintek@90 Conference 2024 Sandton Convention Centre, South Africa
Contact: Camielah Jardine
Tel: 011 538-0237, E-mail: camielah@saimm.co.za
Website: http://www.saimm.co.za
The following organizations have been admitted to the Institute as Company Affiliates
3M South Africa (Pty) Limited
A and B Global Mining (Pty) Ltd
acQuire Technology Solutions
AECOM SA (Pty) Ltd
AEL Mining Services Limited
African Pegmatite (Pty) Ltd
Air Liquide (Pty) Ltd
Alexander Proudfoot Africa (Pty) Ltd
Allied Furnace Consultants
AMEC Foster Wheeler
AMIRA International Africa (Pty) Ltd
ANDRITZ Delkor(pty) Ltd
Anglo Operations Proprietary Limited
Anglogold Ashanti Ltd
Anton Paar Southern Africa (Pty) Ltd
Arcus Gibb (Pty) Ltd
ASPASA
Aurecon South Africa (Pty) Ltd
Aveng Engineering
Aveng Mining Shafts and Underground
Axiom Chemlab Supplies (Pty) Ltd
Axis House Pty Ltd
Bafokeng Rasimone Platinum Mine
Barloworld Equipment -Mining
BASF Holdings SA (Pty) Ltd
BCL Limited
Becker Mining (Pty) Ltd
BedRock Mining Support Pty Ltd
BHP Billiton Energy Coal SA Ltd
Blue Cube Systems (Pty) Ltd
Bluhm Burton Engineering Pty Ltd
Bond Equipment (Pty) Ltd
Bouygues Travaux Publics
Caledonia Mining South Africa Plc
Castle Lead Works
CDM Group
CGG Services SA
Coalmin Process Technologies CC
Concor Opencast Mining
Concor Technicrete
Council for Geoscience Library
CRONIMET Mining Processing
SA Pty Ltd
CSIR Natural Resources and the Environment (NRE)
Data Mine SA
DDP Specialty Products South Africa (Pty) Ltd
Digby Wells and Associates
DRA Mineral Projects (Pty) Ltd
DTP Mining - Bouygues Construction
Duraset
EHL Consulting Engineers (Pty) Ltd
Elbroc Mining Products (Pty) Ltd
eThekwini Municipality
Ex Mente Technologies (Pty) Ltd
Expectra 2004 (Pty) Ltd
Exxaro Coal (Pty) Ltd
Exxaro Resources Limited
Filtaquip (Pty) Ltd
FLSmidth Minerals (Pty) Ltd
Fluor Daniel SA ( Pty) Ltd
Franki Africa (Pty) Ltd-JHB
Fraser Alexander (Pty) Ltd
G H H Mining Machines (Pty) Ltd
Geobrugg Southern Africa (Pty) Ltd
Glencore
Gravitas Minerals (Pty) Ltd
Hall Core Drilling (Pty) Ltd
Hatch (Pty) Ltd
Herrenknecht AG
HPE Hydro Power Equipment (Pty) Ltd
Huawei Technologies Africa (Pty) Ltd
Immersive Technologies
IMS Engineering (Pty) Ltd
Ingwenya Mineral Processing (Pty) Ltd
Ivanhoe Mines SA
Kudumane Manganese Resources
Leica Geosystems (Pty) Ltd
Loesche South Africa (Pty) Ltd
Longyear South Africa (Pty) Ltd
Lull Storm Trading (Pty) Ltd
Maccaferri SA (Pty) Ltd
Magnetech (Pty) Ltd
Magotteaux (Pty) Ltd
Malvern Panalytical (Pty) Ltd
Maptek (Pty) Ltd
Maxam Dantex (Pty) Ltd
MCC Contracts (Pty) Ltd
MD Mineral Technologies SA (Pty) Ltd
MDM Technical Africa (Pty) Ltd
Metalock Engineering RSA (Pty)Ltd
Metorex Limited
Metso Minerals (South Africa) Pty Ltd
Micromine Africa (Pty) Ltd
MineARC South Africa (Pty) Ltd
Minerals Council of South Africa
Minerals Operations Executive (Pty) Ltd
MineRP Holding (Pty) Ltd
Mining Projections Concepts
Mintek
MIP Process Technologies (Pty) Limited
MLB Investment CC
Modular Mining Systems Africa (Pty) Ltd
MSA Group (Pty) Ltd
Multotec (Pty) Ltd
Murray and Roberts Cementation
Nalco Africa (Pty) Ltd
Namakwa Sands(Pty) Ltd
Ncamiso Trading (Pty) Ltd
Northam Platinum Ltd - Zondereinde
Opermin Operational Excellence
OPTRON (Pty) Ltd
Paterson & Cooke Consulting
Engineers (Pty) Ltd
Perkinelmer
Polysius A Division of Thyssenkrupp
Industrial Sol
Precious Metals Refiners
Rams Mining Technologies
Rand Refinery Limited
Redpath Mining (South Africa) (Pty) Ltd
Rocbolt Technologies
Rosond (Pty) Ltd
Royal Bafokeng Platinum
Roytec Global (Pty) Ltd
RungePincockMinarco Limited
Rustenburg Platinum Mines Limited
Salene Mining (Pty) Ltd
Sandvik Mining and Construction
Delmas (Pty) Ltd
Sandvik Mining and Construction
RSA(Pty) Ltd
SANIRE
Schauenburg (Pty) Ltd
Sebilo Resources (Pty) Ltd
SENET (Pty) Ltd
Senmin International (Pty) Ltd
SISA Inspection (Pty) Ltd
Smec South Africa
Sound Mining Solution (Pty) Ltd
SRK Consulting SA (Pty) Ltd
Time Mining and Processing (Pty) Ltd
Timrite Pty Ltd
Tomra (Pty) Ltd
Trace Element Analysis Laboratory
Traka Africa (Pty) Ltd
Trans-Caledon Tunnel Authority
Administarator
Ukwazi Mining Solutions (Pty) Ltd
Umgeni Water
Webber Wentzel
Weir Minerals Africa
Welding Alloys South Africa
Worley


Mining operators are seeing an increased demand for minerals and ores. Operators must now consider the costs of pump maintenance and replacement as well as the cost-benefit of utilizing fewer larger pumps versus several smaller pumps to perform the same work.
Mining operators are seeing an increased demand for minerals and ores. Operators must now consider the costs of pump maintenance and replacement as well as the cost -benefit of utilizing fewer larger pumps versus several smaller pumps to perform the same work.
The KSB GIW® MDX pump line delivers proven results in the harshest hard rock mining applications.
The KSB GIW® MDX pump line delivers proven results in the harshest hard rock mining applications.

W: www.ksb.com/en-za
T: +27-11-876-5600
W: www.ksb.com/en-za T: +27-11-876-5600


Weir Minerals is a leading designer and manufacturer of mine dewatering solutions, slurry pumps, hydrocyclones, valves, screens, centrifuges, crushers, feeders, washers, conveyers, rubber lining, hoses and wearresistant linings for the global mining and minerals processing, sand and aggregate, and power and general industrial sectors. For more information contact us on +27 11 9292600