


OFFICE BEARERS AND COUNCIL FOR THE 2023/2024 SESSION
Honorary President
Nolitha Fakude
President, Minerals Council South Africa
Honorary Vice Presidents
Gwede Mantashe
Minister of Mineral Resources and Energy, South Africa
Ebrahim Patel
Minister of Trade, Industry and Competition, South Africa
Blade Nzimande
Minister of Higher Education, Science and Technology, South Africa
President
W.C. Joughin
President Elect
E. Matinde
Senior Vice President
G.R. Lane
Junior Vice President
T.M. Mmola
Incoming Junior Vice President
M.H. Solomon
Immediate Past President
Z. Botha
Honorary Treasurer
E. Matinde
Ordinary Members on Council
W. Broodryk M.C. Munroe
Z. Fakhraei S. Naik
R.M.S. Falcon (by invitation) G. Njowa
B. Genc
S.J. Ntsoelengoe
K.M. Letsoalo S.M. Rupprecht
S.B. Madolo
A.T. van Zyl
F.T. Manyanga E.J. Walls
K. Mosebi
Co-opted Council Members
M.A. Mello
Past Presidents Serving on Council
N.A. Barcza C. Musingwini
R.D. Beck S. Ndlovu
J.R. Dixon J.L. Porter
V.G. Duke M.H. Rogers
I.J. Geldenhuys D.A.J. Ross-Watt
R.T. Jones G.L. Smith
A.S. Macfarlane W.H. van Niekerk
G.R. Lane – TP Mining Chairperson
Z. Botha – TP Metallurgy Chairperson
K.W. Banda – YPC Chairperson
S. Nyoni – YPC Vice Chairperson
Branch Chairpersons
Botswana Vacant
DRC Not active
Johannesburg N. Rampersad
Limpopo S. Zulu
Namibia Vacant
Northern Cape I. Tlhapi
North West I. Tshabalala
Pretoria Vacant
Western Cape A.B. Nesbitt
Zambia J.P.C. Mutambo (Interim Chairperson)
Zimbabwe Vacant
Zululand C.W. Mienie
*Deceased
* W. Bettel (1894–1895)
* A.F. Crosse (1895–1896)
* W.R. Feldtmann (1896–1897)
* C. Butters (1897–1898)
* J. Loevy (1898–1899)
* J.R. Williams (1899–1903)
* S.H. Pearce (1903–1904)
* W.A. Caldecott (1904–1905)
* W. Cullen (1905–1906)
* E.H. Johnson (1906–1907)
* J. Yates (1907–1908)
* R.G. Bevington (1908–1909)
* A. McA. Johnston (1909–1910)
* J. Moir (1910–1911)
* C.B. Saner (1911–1912)
* W.R. Dowling (1912–1913)
* A. Richardson (1913–1914)
* G.H. Stanley (1914–1915)
* J.E. Thomas (1915–1916)
* J.A. Wilkinson (1916–1917)
* G. Hildick-Smith (1917–1918)
* H.S. Meyer (1918–1919)
* J. Gray (1919–1920)
* J. Chilton (1920–1921)
* F. Wartenweiler (1921–1922)
* G.A. Watermeyer (1922–1923)
* F.W. Watson (1923–1924)
* C.J. Gray (1924–1925)
* H.A. White (1925–1926)
* H.R. Adam (1926–1927)
* Sir Robert Kotze (1927–1928)
* J.A. Woodburn (1928–1929)
* H. Pirow (1929–1930)
* J. Henderson (1930–1931)
* A. King (1931–1932)
* V. Nimmo-Dewar (1932–1933)
* P.N. Lategan (1933–1934)
* E.C. Ranson (1934–1935)
* R.A. Flugge-De-Smidt (1935–1936)
* T.K. Prentice (1936–1937)
* R.S.G. Stokes (1937–1938)
* P.E. Hall (1938–1939)
* E.H.A. Joseph (1939–1940)
* J.H. Dobson (1940–1941)
* Theo Meyer (1941–1942)
* John V. Muller (1942–1943)
* C. Biccard Jeppe (1943–1944)
* P.J. Louis Bok (1944–1945)
* J.T. McIntyre (1945–1946)
* M. Falcon (1946–1947)
* A. Clemens (1947–1948)
* F.G. Hill (1948–1949)
* O.A.E. Jackson (1949–1950)
* W.E. Gooday (1950–1951)
* C.J. Irving (1951–1952)
* D.D. Stitt (1952–1953)
* M.C.G. Meyer (1953–1954)
* L.A. Bushell (1954–1955)
* H. Britten (1955–1956)
* Wm. Bleloch (1956–1957)
* H. Simon (1957–1958)
* M. Barcza (1958–1959)
* R.J. Adamson (1959–1960)
* W.S. Findlay (1960–1961)
* D.G. Maxwell (1961–1962)
* J. de V. Lambrechts (1962–1963)
* J.F. Reid (1963–1964)
* D.M. Jamieson (1964–1965)
* H.E. Cross (1965–1966)
* D. Gordon Jones (1966–1967)
* P. Lambooy (1967–1968)
* R.C.J. Goode (1968–1969)
* J.K.E. Douglas (1969–1970)
* V.C. Robinson (1970–1971)
* D.D. Howat (1971–1972)
* J.P. Hugo (1972–1973)
* P.W.J. van Rensburg (1973–1974)
* R.P. Plewman (1974–1975)
* R.E. Robinson (1975–1976)
* M.D.G. Salamon (1976–1977)
* P.A. Von Wielligh (1977–1978)
* M.G. Atmore (1978–1979)
* D.A. Viljoen (1979–1980)
* P.R. Jochens (1980–1981)
* G.Y. Nisbet (1981–1982)
A.N. Brown (1982–1983)
* R.P. King (1983–1984)
J.D. Austin (1984–1985)
* H.E. James (1985–1986)
H. Wagner (1986–1987)
* B.C. Alberts (1987–1988)
* C.E. Fivaz (1988–1989)
* O.K.H. Steffen (1989–1990)
* H.G. Mosenthal (1990–1991)
R.D. Beck (1991–1992)
* J.P. Hoffman (1992–1993)
* H. Scott-Russell (1993–1994)
J.A. Cruise (1994–1995)
D.A.J. Ross-Watt (1995–1996)
N.A. Barcza (1996–1997)
* R.P. Mohring (1997–1998)
J.R. Dixon (1998–1999)
M.H. Rogers (1999–2000)
L.A. Cramer (2000–2001)
* A.A.B. Douglas (2001–2002)
S.J. Ramokgopa (2002-2003)
T.R. Stacey (2003–2004)
F.M.G. Egerton (2004–2005)
W.H. van Niekerk (2005–2006)
R.P.H. Willis (2006–2007)
R.G.B. Pickering (2007–2008)
A.M. Garbers-Craig (2008–2009)
J.C. Ngoma (2009–2010)
G.V.R. Landman (2010–2011)
J.N. van der Merwe (2011–2012)
G.L. Smith (2012–2013)
M. Dworzanowski (2013–2014)
J.L. Porter (2014–2015)
R.T. Jones (2015–2016)
C. Musingwini (2016–2017)
S. Ndlovu (2017–2018)
A.S. Macfarlane (2018–2019)
M.I. Mthenjane (2019–2020)
V.G. Duke (2020–2021)
I.J. Geldenhuys (2021–2022)
Z. Botha (2022-2023)
Editorial Board
S.O. Bada
R.D. Beck
P.den Hoed
I.M. Dikgwatlhe
M.Erwee
B.Genc
R Hassanalizadeh
R.T. Jones
W.C. Joughin
A.J. Kinghorn
D.E.P. Klenam
J.Lake
H.M. Lodewijks
D.F. Malan
C.Musingwini
S.Ndlovu
P.N. Neingo
S.S. Nyoni
M.Phasha
P.Pistorius
P.Radcliffe
N.Rampersad
Q.G. Reynolds
I.Robinson
S.M. Rupprecht
K.C. Sole
T.R. Stacey
D.Vogt
F.Uahengo
International Advisory Board members
R.Dimitrakopolous R.Mitra
A.J.S. Spearing
E.Topal
D.Tudor
Editor /Chairperson of the Editorial Board
R.M.S. Falcon
Typeset and Published by
The Southern African Institute of Mining and Metallurgy PostNet Suite #212 Private Bag X31 Saxonwold, 2132
E-mail: journal@saimm.co.za
Printed by Camera Press, Johannesburg
Advertising Representative
Barbara Spence
Avenue Advertising


JournalComment:Unrecognized-potentialwealthwhereleastexpected byH.Lodewijks iv
President’sCorner:TheSAIMMTailingsWorkingGroupleadstheway byW.C.Joughin vi-vi
THE INSTITUTE, AS A BODY, IS NOT RESPONSIBLE FOR THE STATEMENTS AND OPINIONS ADVANCED IN ANY OF ITS PUBLICATIONS.
Copyright© 2024 by The Southern African Institute of Mining and Metallurgy. All rights reserved. Multiple copying of the contents of this publication or parts thereof without permission is in breach of copyright, but permission is hereby given for the copying of titles and abstracts of papers and names of authors. Permission to copy illustrations and short extracts from the text of individual contributions is usually given upon written application to the Institute, provided that the source (and where appropriate, the copyright) is acknowledged. Apart from any fair dealing for the purposes of review or criticism under The Copyright Act no. 98, 1978, Section 12, of the Republic of South Africa, a single copy of an article may be supplied by a library for the purposes of research or private study. No part of this publication may be reproduced, stored in a retrieval system, or transmitted in any form or by any means without the prior permission of the publishers. Multiple copying of the contents of the publication without permission is always illegal. U.S. Copyright Law applicable to users In the U.S.A. The appearance of the statement of copyright at the bottom of the first page of an article appearing in this journal indicates that the copyright holder consents to the making of copies of the article for personal or internal use. This consent is given on condition that the copier pays the stated fee for each copy of a paper beyond that permitted by Section 107 or 108 of the U.S. Copyright Law. The fee is to be paid through the Copyright Clearance Center, Inc., Operations Center, P.O. Box 765, Schenectady, New York 12301, U.S.A. This consent does not extend to other kinds of copying, such as copying for general distribution, for advertising or promotional purposes, for creating new collective works, or for resale.
Honorary Legal Advisers
M H Attorneys
Auditors
Genesis Chartered Accountants
Secretaries
The Southern African Institute of Mining and Metallurgy 7th Floor, Rosebank Towers, 19 Biermann Avenue, Rosebank, 2196
PostNet Suite #212, Private Bag X31, Saxonwold, 2132 E-mail: journal@saimm.co.za
Telephone (011) 463-7940 . E-mail: barbara@avenue.co.za
ISSN 2225-6253 (print) . ISSN 2411-9717 (online)


DEMATEL and ISM analysis of factors influencing coal spontaneous combustion in longwall gobs by L. Zhou, J. Wang, G. Dai, M. Tang, and J. Qiu
Fifteen factors influencing coal spontaneous combustion in longwall gobs were identified and logical relationships between these factors were evaluated and quantified by (DEMATEL) and (ISM) methods. A four-level hierarchical structure model was established. The research shows that combining DEMATEL and ISM can reveal the key factors that influence coal spontaneous combustion in longwall gobs which could provide the basis for preventing and controlling coal spontaneous combustion in longwall gobs in future.
Hydrogeology and groundwater control at Chambishi mine, Zambia by Y. Fan, D.H. Zhang, and J.Y. Xu
Hydrological investigations were carried out to identify methods to reduce the discharge costs without greatly affecting the mining process at Chambishi mine. Backfilling was gradually adopted at the mine to appropriately safeguard the integrity of the aquifuge above the orebody. Use of the overlapping relationship between the aquifer and aquifuge has greatly reduced drainage costs, and also improved protection of the groundwater environment.
An investigation into mining coal losses at Klipspruit Colliery by M.J. Ntsekhe and W.W. de Graaf
The objectives of the study were to identify potential sources of coal losses, determine the factors affecting coal losses, and to identify the most cost-effective methods to reduce losses. The losses were mostly attributed to the drilling and blasting practises. Recommendations include re-visiting the current pre-split design and the tolerances adopted for the interburden and coal seam drilling and blasting, together with a continuous improvement plan for drilling and blasting.
The influence of solution treatment on the phase evolution and tensile properties of binary Ti-Mo alloys by N.A. Moshokoa, M.L. Raganya, R. Machaka, M.E. Makhatha, and B.A. Obadele
The influence of solution treatment on the phase evolution and tensile properties of Ti-Mo alloy was investigated to assess their potential use in biomedical applications. The elastic modulus and UTS of all the alloys investigated were significantly decreased after solution treatment, except for Ti-15.05Mo. whereas the elongation significantly increased. The fracture surfaces of all the solution-treated alloys indicated more ductile behaviour than brittle.
The effect of vanadium on the magnetic and mechanical properties of B2 FeCo alloy: a DFT approach by T.M. Ledwaba, R.G. Diale, P.E. Ngoepe, and H.R. Chauke
A density functional theory supercell approach was used to generate B2 Fe50Co50-xVx (0 ≤ x ≤ 50) structures and their properties were evaluated to determine their ductility at room temperature. It was found that all structures were thermodynamically stable due to negative heats of formation. Alloying with V effectively improved the ductility, and resulted in reduced magnetic strength due to a decrease in magnetic moments. These findings reveal that B2 FeCo-V alloys can be used as components and actuators for the automotive industry.
Full-waveform automatic location of small seismic events in an underground mine using synthetic strain Green’s tensors by S. Brijraj, S. Moolla, and R. Lynch
A reliable method to locate microseismic events is an important objective for routine mine seismic monitoring. We developed an algorithm that can automatically and reliably locate an event from a single uniaxial trace. The method is demonstrated using synthetic data calculated with a realistic underground 3D velocity model.
Framework for ergonomic design of control centres in underground coal mines—A Serbian experience by M. Grozdanovic, D. Marjanovic, and M. Ilic.
This study addresses the problem of functional compatibility between process control equipment in control centres at underground mines and operator capabilities. The layout of the existing control panel is compared with a recommended design. The basic principles of ergonomic design and arrangement of the controls and indicators, as well as ease of use and type of operations carried out are discussed.
Quantifying uncertainty in rock mass properties: Implications for GSI, RMi, and RMR assessments by N. Abbas, K.G. Li, M.Z. Emad, and A. Khan .......................................................................
Probability-based empirical methods were employed as an alternative approach to predicting uncertainties associated with rock mass properties. The results highlight the need for a comprehensive approach to rock mass characterization, considering multiple factors beyond joint volume, and emphasize the importance of empirical modeling and detailed site investigations for accurate assessment of rock mass quality and stability in the Himalaya.
Beyond the empirical pillar design method: The strain criterion and the pillar load inversion concepts by K.B. Le Bron, L.J. Gardner, and J. van Zyl
A method to calculate pillar stability based on the strain criterion and pillar load inversion concept is presented. This approach is not intended to replace the empirical method; instead, it is suggested that it be used as the initial step in the pillar design process, followed by iterative numerical modelling to study pillar behaviour, define pillar stability, and optimize the pillar design by considering site-specific and representative rock mass properties and criteria.
231
239
245
253
263
269


here has been a lot of talk lately about the just energy transition and critical minerals. Southern Africa is richly endowed with critical minerals and as such should play an important role in the journey towards renewable energy. And then there is coal. Inevitably, decarbonization will entail the phasing out of coal as an energy source. However, a just energy transition requires more than simply shutting down coal mines and power plants. Coal mining communities often rely heavily on the industry for their jobs and livelihoods. As coal use declines, these communities will require robust social safety nets and reskilling programmes to ensure a smooth transition into new sectors of the growing clean energy economy. Areas for consideration might include alternative applications for, and products from, coal such as carbon fibre, which has applications in motor vehicles, wind turbines and energy equipment, sports items, electronic, military, defence, and medical products. Another example is coal use in building materials, some made with carbon fibres and others with carbon char. include coal plastics, coal foam, and graphene-based building materials. Graphene is an important single-layered carbon product which is light and extremely strong. It is currently emerging as a vital product with many applications including manufacturing, vehicles, aircraft, space travel, and electronics. Other alternative products from coal are activated carbon and carbon black. Coal and coal discard may turn out to be viable sources of rare earth elements, which are also of critical importance to the decarbonization journey. As this journey progresses and as is seen elsewhere in the world, the future of coal may lie in its perceived role as one of the most important elemental, mineral, and ore commodities that a country can possess. For any of the above to materialize will require extensive research and development. And even then, only a few of these visions may come to fruition. However, to do nothing is not an option. I wish you a pleasant reading experience.
H. Lodewijks Coaltech Research Association


thought that that I would use this month’s President’s Corner to tell you about the Tailings Working Group (https://www.saimm.co.za/about-saimm/saimmcommittees/tailings-working-group), which was established in March 2020 to address critical issues in tailings storage facilities (TSF) management and design. This initiative, in collaboration with the South African Institute of Civil Engineers (SAICE), aims to meet the specific requirements of the Southern African mining industry. The Working Group comprises experts from academia, industry, consulting, and regulatory bodies.
An increased international focus on the responsible management of TSF was triggered by the catastrophic dam failure at Vale’s Corrego de Feijao mine in 2019 in Brumadinho, Brazil, which resulted in the loss of almost 300 lives, in addition to major environmental and social consequences. This incident followed several other highly publicised tailings dam failures, which also had major environmental and social impacts.
As a result, the International Council on Minerals and Metals (ICMM) commissioned a study to develop the Global Industry Standard on Tailings Management (GISTM) (https://globaltailingsreview.org/ global-industry-standard).
The standard is directed at operators, who are required to take responsibility and prioritise the safety of tailings facilities, through all phases of a facility’s lifecycle, including closure and post-closure. There are six topics that must be addressed (Figure 1). The GISTM aims for zero harm to people and the environment. It also mandates the disclosure of relevant information for public accountability.

Figure 1-Global Industry Standard on Tailings Management (https://globaltailingsreview.org/global-industry-standard)
SAIMM is coordinating funding for joint work with SAICE to revise SANS 10286, the Mine Residue Code of Practice. The previous version, born out of the Merriespruit tailings dam failure in 1994, was well aligned to international standards, and has served South Africa and multiple jurisdictions in Africa well. Many South African mining companies are now required to comply with the GISTM, even if they are not ICCM members, because many investors and insurance companies require compliance. The updated SANS 10286 will align with the GISTM and will incorporate specific South African requirements and practices.
Most South African tailings storage facilities are constructed using the upstream method, which is not suitable for significant water storage and is more vulnerable to seismic loading. This method of construction is not allowed in certain countries. The risks are mitigated by managing the rate of rise, good drainage characteristics of materials, good drainage design, storm water design, geotechnical investigations, slope design, and structured monitoring. When hazardous conditions are encountered, additional data are collected to remove uncertainty or dewatering and buttressing are implemented to improve stability.
The Working Group is linked to Global Action on Tailings (GAT), an initiative led by the Global Mineral Professionals Alliance (GMPA). GAT aims to build awareness and knowledge in good tailings practices and identify ways to eventually reduce or eliminate TSF. A key goal is to support professionals in gaining greater trust from society regarding the industry’s ability to manage tailings risks.
The SAIMM Tailings Working Group has a comprehensive mandate that includes:
→ Reporting on TSF activities in Southern Africa to the GMPA;
→ Coordinating regional activities and maintaining a watching brief;
→ Providing inputs and comments on global and local activities and documents;
→ Liaising with academic institutions to develop competency and qualifications;
→ Organizing conferences and schools through SAIMM to disseminate new knowledge and standards;
→ Offering local technical input to global committees to represent Southern African interests;
→ Reporting to other regional working groups on GMPA initiatives;
→ Developing a high-level, principle-based global framework for local codes, standards, and guidelines.
SAIMM has hosted three successful conferences on Tailings. The inaugural conference raised the profile of tailings management and fostered collaboration among various stakeholders in the tailings industry. The second conference focused on embracing the GISTM, highlighting the progress made in understanding its requirements and implications. The third conference was held in October 2023, which I had the pleasure of attending. It centred on the future of tailings management for the next generation. It explored new standards, expectations, and possibilities, while addressing the residual risks associated with tailings. Key discussions included strategies for reducing, reclaiming, or reusing tailings, as well as improving existing technologies and adopting new ones. The conference also emphasized the importance of addressing impacts that were once considered acceptable but are no longer tolerated, and how best to mitigate these issues moving forward. Through these conferences, SAIMM continues to lead the way in promoting safe, sustainable, and innovative tailings management practices.
The SAIMM Tailings Working Group remains dedicated to advancing the field, ensuring that Southern Africa remains at the forefront of responsible and efficient mining operations. We are always looking for volunteers to participate and contribute.
W.C. Joughin President, SAIMM

Affiliation:
1School of Mining and Safety Engineering, Anhui University of Science and Technology, Huainan Anhui 232001, China
Correspondence to: L. Zhou
Email: 28928188@qq.com
Dates:
Received: 30 Jul. 2019
Revised: 12 Sept. 2019
Accepted: 10 Feb. 2024
Published: May 2024
How to cite:
Zhou, L., Wang, J., Dai, G., Tang, M., and Qiu, J. 2024. DEMAYEL and ISM analysis of factors influencing coal spontaneous combustion in longwall gobs. Journal of the Southern African Institute of Mining and Metallurgy, vol. 124, no. 5. pp. 231–238
DOI ID:
http://dx.doi.org/10.17159/24119717/856/2024
by L. Zhou1, J. Wang1, G. Dai1, M. Tang1, and J. Qiu1
Abstract
Coal spontaneous combustion in longwall gobs is a major concern in coal mines. In comparison to other hazards, this phenomenon is difficult to detect. Fifteen factors influencing coal spontaneous combustion in longwall gobs were identified from the literature. The logical relationships between these factors were evaluated and quantified by decision-making trial and evaluation laboratory (DEMATEL) and interpretive structural modelling (ISM) methods. A four-level hierarchical structure model was established. The research shows that combining DEMATEL and ISM can reveal the key factors that influence coal spontaneous combustion in longwall gobs and establish the interactions and relationships among these factors. The results can provide the basis for preventing and controlling coal spontaneous combustion in longwall gobs.
Keywords spontaneous combustion, longwall gob, factor analysis, DEMATEL, ISM
Introduction
Coal spontaneous combustion is a serious threat to safety and production in coal mines. Statistical studies have shown that more than 90% of coal fires in China are caused by spontaneous combustion in longwall gobs and closed areas (Chi, 2008). Coal spontaneous combustion typically occurs in longwall gobs, where residual coal is affected by fresh air flow from a working face. The temperature of the coal can constantly increase, leading to spontaneous combustion under certain conditions of oxidation and heat accumulation (Pan et al., 2013; Wang et al., 2019; Huang et al., 2018; Deng, Ma, and Zhang, 2013). Coal combustion will produce a large amount of toxic gases, and cause gas explosions under certain conditions, thereby threatening the safety of miners and causing serious economic losses and environmental damage (Qi et al., 2015; Kim and Sohn, 2012; Dudzińska and Cygankiewicz, 2015; Onifade, Genc, and Wagner, 2019).
Coal spontaneous combustion in longwall gobs is a complex process that is related to many factors (Krishnaswamy, Agarwal, and Gunn, 1996). An in-depth discussion of these factors can inform risk management and provide a basis for developing an effective safety evaluation system (Zio, 2016; Dekker, Cilliers, and Hofmeyr, 2011; Desveaux et al., 2019; Onifade and Genc, 2018). Many related studies have addressed the risk analysis of coal spontaneous combustion, and several methods for analysing and evaluating the spontaneous combustion of residual coal in longwall gobs have been proposed, including grey correlation analysis, analytic hierarchy process, rough set theory, and matter element extension theory (Genc and Cook, 2015; Wang et al., 2014). However, the factors that affect coal spontaneous combustion in longwall gobs will influence each other, given the complexity of the process This consideration has been neglected in previous studies.
Decision-making trial and evaluation laboratory (DEMATEL) considers the direct and indirect impact relationships between factors to determine key cuases in accidents. DEMATEL is an effective method for analysing complex systems and has been applied in various fields (Tan et al., 2016; Govindan and Chaudhuri, 2016; Park , Kim and Lim, et 2016; Gazibey, and Demirel, 2015). Interpretive structural modelling (ISM) was developed by the Bottelle Institute to analyse complex social system problems. ISM constructs the structure of the system by calculating the reachability matrix among the elements, thereby analysing the direct and indirect relationships among the various factors. ISM has found extensive applications, such as in traffic accidents, address disasters, teaching problems, and enterprises, in recent years (Wang et al., 2018; Huang et al., 2019; Zhou and Lim, 2019; Ma-Jia, and Ding, 2019).
DEMATEL can only discover logical, and not hierarchical, relations among factors. ISM can identify the logical structure of the mutual influences of factors and arrange them in a hierarchy. By combining DEMATEL and ISM, the mutual influence between factors can be analysed and the logical structure
between factors established (Chauhan Singh, and Jharkharia, 2018; Zhang and Luo, 2017; Shen et al., 2015). In this study, DEMATEL and ISM are combined to analyse the factors that influence coal spontaneous combustion in longwall gobs and establish a multilevel hierarchical structural model. Then, hierarchical relationships of the influencing factors are determined, and the importance of these factors in coal spontaneous combustion identified.
Literature review
Spontaneous combustion in longwall gobs is a control problem rather than a choice or decision problem, because the influencing factors constitute a network with complex relationships and interactions (Zwetsloot et al., 2017 Arstad and Aven, 2017). In order for spontaneous combustion to occur, the following conditions are required:
➤ The coal must be in a broken state
➤ There must be a continuous supply of oxygen
➤ The environment must be conducive to accumulation of the heat generated by oxidation
➤ The three abovementioned conditions must coexist for long enough for the coal to undergo self-ignition.
In addition, appropriate safety technology can mitigate the risk of coal spontaneous combustion (Onifade and Genc, 2020).
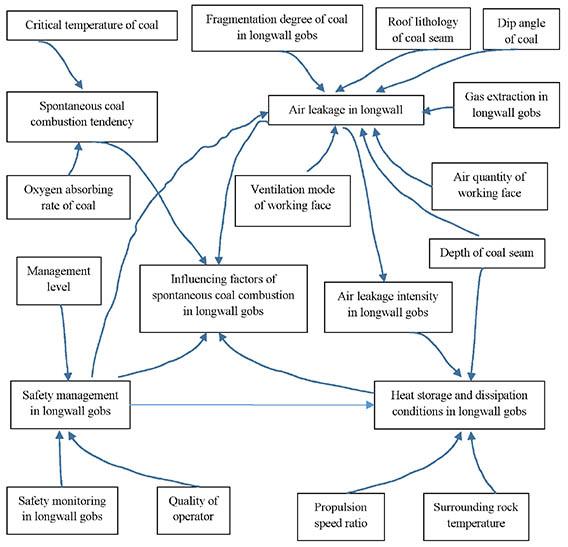
In this study, the factors influencing coal spontaneous combustion in longwall gobs include the following four aspects: coal spontaneous combustion propensity, air leakage in longwall gobs, heat storage and dissipation in longwall gobs, and safety management.
Coal spontaneous combustion propensity
The natural tendency of coal to undergo spontaneous combustion is the inherent factor and is directly related to the danger of spontaneous combustion (Genc and Cook, 2015). The oxygen absorption rate and critical temperature of coal are the external characteristics of spontaneous combustion propensity (Zhai Wang, and Joang, 2019; Shi et al., 2018; Qu, Song, and Tan, 2018; Choudhury, Sarkar, and Ram, 2916; Mohalik, Lester, and Lowndes, 2018).
Air leakage in longwall gobs
The air leakage in longwall gobs, which provides the necessary
Spontaneous coal combustion tendency
Air leakage in longwall gobs
Influencing factors of spontaneous coal combustion in longwall gobs
Heat storage and dissipation conditions in longwall gobs
Safety management in longwall gobs
oxygen supply, depends on the ventilation mode at the working face, as well as the porosity of the gob (degree of fragmentation of the coal (Wang et al., 2018; Chen et al., 2019).
Gas drainage measures in longwall gobs change air leakage patterns, thus complicating the gas flow and increasing the risk of, coal spontaneous combustion. An increase in the coal seam dip angle also has this effect, because it is more difficult to close off the cavity, thereby allowing a large air leakage (Tang et al., 2016).
The roof lithology also affects air leakage in longwall gobs. The porosity of the goaf depends on the roof lithology (Wang et al., 2018).
In the case of a shallow coal seam, communication with the surface via fissures may increase air leakage by admitting atmospheric air (Zhai, Wang, and Kiang, 2019).
In summary, the following factors affect air leakage in longwall gobs (Kong et al., 2017; Su et al., 2022):
➤ Ventilation mode at the working face
➤ Air flow rate at the working face
➤ Gas extraction from the gob
➤ Fragmentation of coal in the gob
➤ Dip angle of coal seam
➤ Roof lithology
➤ Depth of coal seam.
Heat
The ratio of the width of the potential self-ignition area to the advancement speed of the working face determines the length of time that the residual coal is exposed to oxidation conditions. A high ratio indicates a considerable risk of spontaneous combustion. The width of the self-ignition area is related to the air leakage intensity. The surrounding rock temperature affects the timing of coal spontaneous combustion, with a higher temperature indicating a shorter time to self-ignition (Zhang et al., 2019).
Three factors affect the heat storage and dissipation conditions in longwall gobs:
1. The ratio of the width of the self-ignition area to the advancement speed of the working face, which can be called the propulsion speed ratio
2. Surrounding rock temperature
3. Air leakage intensity in the gob.
Oxygen absorbing rate of coal x1
Critical temperature coal x2
Ventilation mode of the working face
Air quantity of the working face
Gas extraction in longwall gobs x5
Fragmentation degree of coal in longwall gobs x6
Dip angle of coal seam x7
Roof lithology of coal seam x8
Depth of coal seam x9
Propulsion speed ratio x10
Surrounding rock temperature x11
Air leakage intensity in longwall gobs x12
Safety monitoring in longwall gobs x13
Quality of operator x14
Management level x15
Safety management in longwall gobs
For longwall gobs where people cannot enter, monitoring and predicting the conditions likely to lead to coal spontaneous combustion is crucial. These processes are an effective means of controlling coal spontaneous combustion. In addition, the quality of personnel and the management level must be considered when implementing measures to prevent coal spontaneous combustion in longwall gobs (Guo et al., 2019; Cai, Yang, and Hu, 2019.
As illustrated in Figure 1, 15 factors that influence the coal spontaneous combustion in longwall gobs are identified from four aspects.
Critical temperature of coal
The self-ignition hazard in longwall gobs is influenced by many interacting factors simultaneously. These factors can be initially analysed as depicted in Figure 2.
Methodology
The factors influencing coal spontaneous combustion in longwall gobs constitute an interactive network that cannot be accurately analysed using traditional methods. This study uses integrated DEMATEL and ISM. This allows the relative importance of, and interactions between, the various factors to be clearly stated so as to provide specific methods and measures for preventing spontaneous combustion. The basic procedure is outlined in Figure 3.
Spontaneous coal combustion tendency
Oxygen absorbing rate of coal
Management level
Safety management in longwall gobs
Fragmentation degree of coal in longwall gobs
Roof lithology of coal seam
Air leakage in longwall
Ventilation mode of working face
Influencing factors of spontaneous coal combustion in longwall gobs
Dip angle of coal
Gas extraction in longwall gobs
Air quantity of working face
Depth of coal seam
Air leakage intensity in longwall gobs
Heat storage and dissipation conditions in longwall gobs
Safety monitoring in longwall gobs
Quality of operator
Propulsion speed ratio
Investigating and literature analysis
Determination of influencing factors
Direct infuence matrix Comprehensive influence matrix DEMATEL calculation Unit matrix
Overall influence matrix
Reachability matrix
Surrounding rock temperature
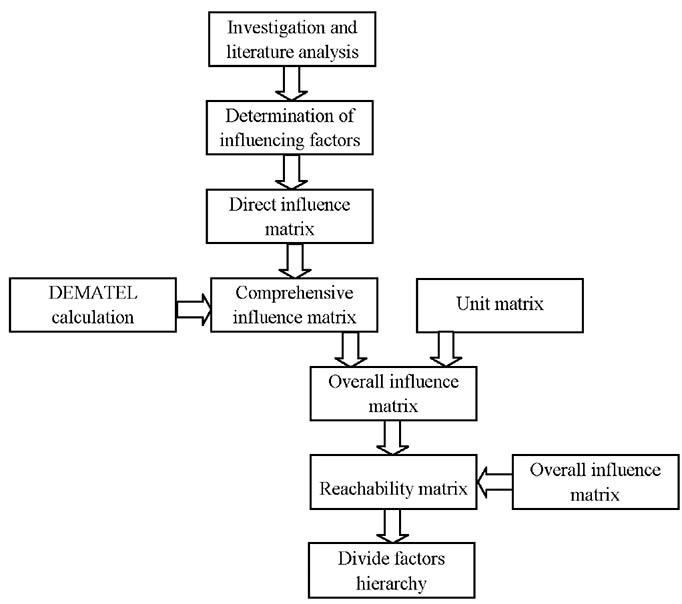
flow of the integrated DEMATEL and ISM methodology
Overall influence matrix
Divide factors hierarchy
Results and discussion
DEMATEL analysis
In Figure 1, 15 factors that affect coal spontaneous combustion in longwall gobs are determined. Then, expert consultation is used to clarify the relationships among the 15 factors. Four experts from universities and local coal mining enterprises, who have extensive experience in coal spontaneous combustion, were invited to evaluate the relationships between influencing factors. The influence of each factor on the others is ranked into five grades, with each of the factors assigned a specific value, as outlined in Table I.
Table I
Rankings influencing factors.
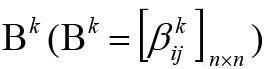
Expert k (k = 1,2,…,m) obtained the direct influence matrix , where denotes the influence of factor xi on factor xj, m denotes the number of experts (m = 4), and n denotes the number of factors (n = 15). Subsequently, the direct influence matrix B( ) is obtained as follows:

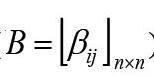
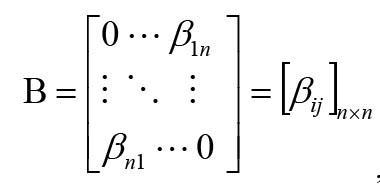
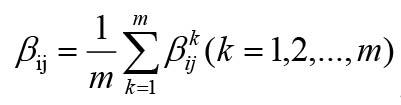
Table II lists the obtained direct influence matrix. The direct influence matrix reflects only the direct relationships among the factors. However, these relationships are complicated. The direct and indirect relationships among these factors must be
Table II
Direct influence matrix
Table III
Comprehensive influence matrix
considered. A comprehensive impact matrix can reflect the direct and indirect relationships of the factors (Zio, 2016). This matrix can be calculated using Equations. ([2] and [3].
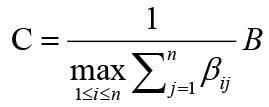
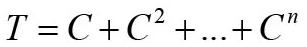
where C is the normalized direct impact matrix, and is the comprehensive influence matrix, n = 15.
Table III presents the obtained comprehensive influence matrix, with the influencing degree, influenced degree, centrality, and causality of each factor. For factor i , the influencing degree is denoted as fi , the influenced degree as ei , the centrality as mi, and the causality as ni. These are calculated as follows:
Table IV
Calculation results through the DEMATEL method
The results are presented in Table IV.
The comprehensive influence matrix excludes the effects of an individual factor on itself. Therefore, a unit matrix E must be added to obtain the overall influence matrix H as expressed in Equation [6].
Table V summarizes the obtained overall influence matrix. On the basis of Equation [6], the reachability matrix is constructed by Equation [7].
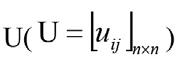
where λ is the threshold set in accordance with the actual situation. On the basis of many test results, expert advice, and practical requirements, λ is set to 0.15 in the present study, and then U is constructed as listed in Table VI.
x5
V
Table VI
Reachability matrix
Surrounding rock temperature
Propulsion speed ratio
Safety monitoring in longwall gobs
Critical temperature of coal
Oxygen absorbing rate of coal
Gas extraction in longwall gobs
Dip angle of coal seam
Air quantity of working face
Air leakage intensity in longwall gobs
Fragmentation degree of coal in longwall gobs
Ventilation mode of working face Management level
Depth of coal seam
Quality of operotor
Roof lithologic of coal seam
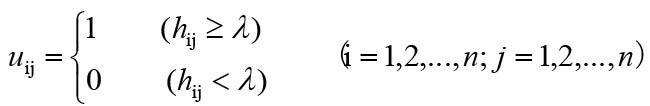
Subsequently, the reachable set Ri and antecedent set Si of factor i are determined in accordance with Equation [8], and the top-level factors for the reachability matrix are obtained using Equation [9].
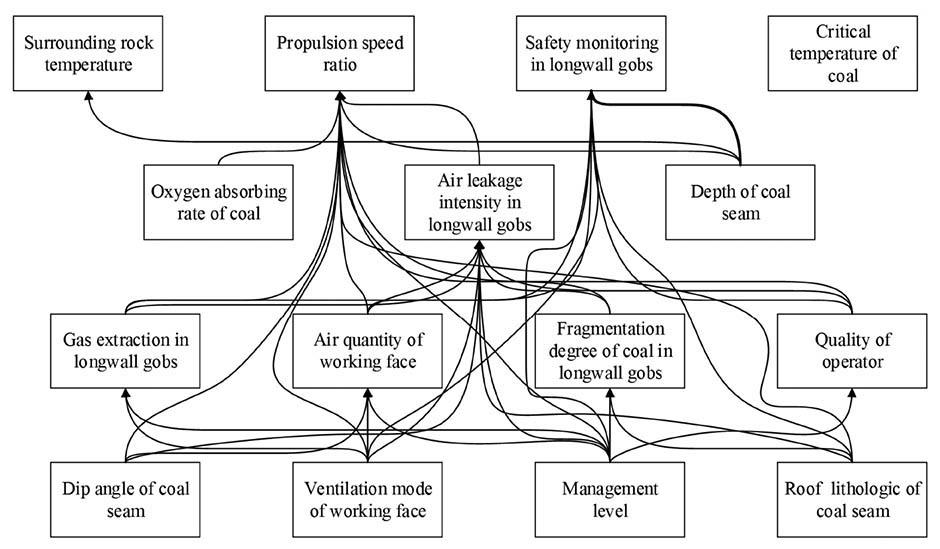
Results
The top factor is removed from the reachability matrix. Then, we continue to find the top-level factors of the residual matrix and remove them from the matrix until all the factors are screened. The order in which the factors are removed constitutes the hierarchy. The collections of the top-, second-, third-, and lowermost-layer factors correspond to {X2, X10, X11, X13}, {X1, X9, X12}, {X4, X5 , X6, X14}, and {X3, X7, X8, X15}. The hierarchy of the factors is displayed in Figure 4.
Discussion
The four direct causes of the spontaneous combustion of coal in longwall gobs are the temperature of the surrounding rock, the advancement speed of the working face, safety monitoring of the gob, and the critical temperature of the coal.
The intrinsic propensity of a coal to undergo spontaneous combustion can be assessed using methods such as the Wits-Ehac index and CJI index (Onifade and Genc, 2020; Gao et al., 2021). In this study, the critical temperature and oxygen absorption rate of the coal were used to determine the spontaneous combustion propensity (Wang et al., 2014). These factors have minimal impact on external factors, which are both the direct and fundamental causes of coal spontaneous combustion.
The dip angle of the coal seam, ventilation mode at the working face, management of the longwall gas extraction area, and lithology of the coal seam roof are closely related to other factors, indicating
that these four factors have a complex relationship with other factors and are brittle factors of coal spontaneous combustion.
Coal spontaneous combustion in longwall gobs is governed by a complex network of nonlinear correlations among the factors causing spontaneous combustion.
Conclusions
In this study, the mechanisms of coal spontaneous combustion in longwall gobs were analysed, and 15 factors influencong the phenomenon were identified on the basis of relevant literature. The relationships among these factors were analysed in detail through the DEMATEL–ISM method. This method integrated the DEMATEL and ISM to elucidate the logical relationships among the factors and determine their relative importance. The direct and primary causes and the key factors that lead to spontaneous combustion were identified through this method. The results clearly indicate the relationships among the factors that cause coal spontaneous combustion in longwall gobs. The results can also constitute a basis for preventing accidents caused by spontaneous combustion.
Author contributions
Conceptualization, Liang Zhou; Data curation, Liang Zhou; formal analysis, Liang Zhou, Jian Wang, Mingyun Tang, and Jinwei Qiu; funding acquisition, Guanglong Dai; methodology, Jian Wang; resources, Liang Zhou, Jinwei Qiu; Writing – original draft, Liang Zhou.
Funding
This research was funded by the National Natural Science Foundation of China (Grants no. 51574009, 51874007, 51774014), Anhui University Natural Science Research Project (KJ2019A0133).
Conflicts of interest
The authors declare no conflict of interest.
References
Arstad, I. and Aven, T. 2017. Managing major accident risk: concerns about complacency and complexity in practice. Safety Science, vol. 91, pp. 114–121.
Cai, J.W., Yang, S.Q., and Hu, X.C. 2019. Forecast of coal spontaneous combustion based on the variations of functional groups and microcrystalline structure during low-temperature oxidation. Fuel, vol. 253, pp. 339–348.
Chauhan, A., Singh, A., and Jharkharia, S. 2018. An interpretive structural modeling (ISM) and decision-making trail and evaluation laboratory (DEMATEL) method approach for the analysis of barriers of waste recycling in India. Journal of the Air & Waste Management Association, vol. 68, no. 2, pp. 100–110.
Chen, X.J., Li, L.Y., Guo Z.B., and Chang, T. 2019. Evolution characteristics of spontaneous combustion in three zones of the goaf when using the cutting roof and release pressure technique. Energy Science & Engineering, vol. 7, no. 3, pp. 710–720.
Chi, E.B. 2008. Security of the coal mine safety production in China: mine fire prevention and control. China High-Tech Enterprise, vol. 18, p. 99.
Choudhury, D., Sarkar, A., and Ram, LC. 2016. An autopsy of spontaneous combustion of lignite. International Journal of Coal Preparation and Utilization, vol. 36, no. 2, pp. 109–123.
Dekker, S., Cilliers, P., and Hofmeyr, J.H. 2011. The complexity of failure: implications of complexity theory for safety investigations. Safety Science, vol. 49, no. 6, pp. 939–945.
Deng, J., Ma, X.F., Zhang, Y.T., and Xiao, Y. 2013. Quantitative determination for the “three zones” of coal spontaneous combustion in gobs based on probability function. Disaster Advances, vol. 6, pp. 210–218.
Desveaux, L., Halko, R., Marani, H., Feldman, S., and Ivers, N.M. 2019. Importance of team functioning as a target of quality improvement initiatives in nursing homes: a qualitative process evaluation. Journal of Continuing Education in the Health Professions, vol. 39, no. 1, pp. 21–28.
Dudzińska, A. and Cygankiewicz, J. 2015. Analysis of adsorption tests of gases emitted in the coal self-heating process. Fuel Processing Technology, vol. 137, pp. 109–116.
Gao, D., Guo, L.W., Wang, F.S., and Zhang, Z. 2021. Study on the spontaneous combustion tendency of coal based on grey relational and multiple regression analysis. ACS Omega, vol. 6, no. 10, pp. 6736–6746.
Gazibey, Y., Kantemir, O., and Demirel, A. 2015. Interaction among the criteria affecting main battle tank selection: An Analysis with DEMATEL method. Defence Science Journal, vol. 65, no. 5, pp. 345–355.
Genc, B. and Cook, A. 2015. Spontaneous combustion risk in South African coalfields. Journal of the Southern African Institute of Mining and Metallurgy, vol. 15, no. 7, pp. 563–568.
Govindan, K. and Chaudhuri, A. 2016. Interrelationships of risks faced by third party logistics service providers: A DEMATEL based approach. Transportation Research Part E. Logistics and Transportation Review, vol. 90, pp. 177–195.
Guo, J., Wen, H., Zheng, X.Z., and Liu, Y. 2019. A method for evaluating the spontaneous combustion of coal by monitoring various gases. Process Safety and Environmental Protection, vol. 126(B), pp. 223–231.
Huang, L.D., Cai, G.R, Yuan, H.Y., and Chen, J. 2019. A hybrid approach for identifying the structure of a Bayesian network model. Expert Systems with Applications, vol. 131, pp. 308–320.
Huang, Z., Ma, Z.Z., Song, S.Y., Yang, R., Gao, Y., and Zhang, Y. 2018. Study on the influence of periodic weighting on the spontaneous combustion "three-zone" in a gob. Journal of Loss Prevention in the Process Industries, vol. 55, pp. 480–491.
Kim, C.J. and Sohn, C.H. 2012. A novel method to suppress spontaneous ignition of coal stockpiles in a coal storage yard. Fuel Processing Technology, vol. 100, pp. 73–83.
Kong, B., Li, Z.H., Yang, Y.L., Liu, Z., and Yan, D. 2017. A review on the mechanism, risk evaluation, and prevention of coal spontaneous combustion in China. Environmental Science and Pollution Research, vol. 24, no. 30, pp. 23453–23470.
Krishnaswamy, S., Agarwal, P.K., and Gunn, R.D. 1996. Lowtemperature oxidation of coal. 3. Modelling spontaneous combustion in coal stockpiles. Fuel, vol. 75, pp. 353–362.
Ma, G.F., Jia, J.Y., and Ding J.Y. 2019. Interpretive structural model based factor analysis of BIM adoption in Chinese construction organizations. Sustainability, vol. 11. ID:1982. https://doi.org/10.3390/su11071982
Mohalik, N.K., Lester, E., and Lowndes, I.S. 2018. Development a modified crossing point temperature (CPTHR) method to assess spontaneous combustion propensity of coal and its chemo-metric analysis. Journal of Loss Prevention in the Process Industries, vol. 56, pp. 359–369.
Onifade, M., Genc, B., and Wagner, N. 2019. Influence of organic and inorganic properties of coal-shale on spontaneous combustion liability. International Journal of Mining Science and Technology, vol. 29, no. 6, pp. 851–857.
Onifade, M. and Genc, B. 2020. A review of research on spontaneous combustion of coal. International Journal of Mining Science and Technology, vol. 30, no. 3, pp. 303–311.
Onifade, M. and Genc, B. 2018. A review of spontaneous combustion studies - South African context. International Journal of Mining Reclamation and Environment, vol. 33, no. 8, pp. 527–547.
Pan, R., Cheng, Y., Yu, M., Lu, C., and Yang, K. 2013. New technological partition for “three zones” spontaneous coal combustion in goaf. International Journal of Mining Science and Technology, vol. 23, pp. 489–493.
Park, S.H., Kim, I., and Lim. S.B. 2016. Exploring the usage of the DEMATEL method to analyze the causal relations between the factors facilitating organizational learning and knowledge creation in the Ministry of Education. International Journal of Contents, vol. 12, no. 4, pp. 31–44.
Qi, G.S.,Wang, D.M., Zheng, K.M., Xu, J., Qi, X., and Zhong, X. 2015. Kinetics characteristics of coal low-temperature oxidation in oxygen-depleted air. Journal of Loss Prevention in the Process Industries, vol. 35, pp. 224–231.
Qu, L.N., Song, D.Z., and Tan, B. 2018. Research on the critical temperature and stage characteristics for the spontaneous combustion of different metamorphic degrees of coal. International Journal of Coal Preparation and Utilization, vol. 38, no. 5, pp. 221–236
Shen, X., Xia, Y., Yang, X.Y., and Zhang L. 2015. DEMATEL and ISM- based study on factors influencing miners’ violation behaviour. China Safety Science, vol. 25, no. 9, pp. 145–151.
Shi, Q.L., Qin, B.T., Liang H.J., Gao, Y., and Bi, Q. 2018. Effects of igneous intrusions on the structure and spontaneous combustion propensity of coal: A case study of bituminous coal in Daxing Mine, China. Fuel, vol. 216, pp.181–189.
Su, G.R., Jia, B.S., Wang, P., Zhang, R., amd Shen, Z. 2022. Risk identification of coal spontaneous combustion based on COWA modified G1 combination weighting cloud model. Scientific Reports, vol. 12. ID: 2992. doi: 10.1038/s41598-022-06972-4
Tan, Q.L., Gao, R., Wei, Y.M., and Zhang, C. 2016. Analysis of biomass power generation based on the DEMATEL method. Journal of Biobased Materials and Bioenergy, vol. 10, no. 4, pp. 290–295.
Tang, M.Y., Jiang, B.Y., Zhang, R.Q., Yin, Z., and Dai, G. 2016. Numerical analysis on the influence of gas extraction on air leakage in the gob. Journal of Natural Gas Science and Engineering, vol. 33, pp. 278–286.
Wang, D.M. Qi, G.S. Qi, X.Y., and Xin H.H.2014. Quick test method for the experimental period minimum of coal to spontaneous combustion. Journal of China Coal Society, vol. 39, no. 11, pp. 2239-2243.
Wang, G., Xu, H., Wu, M.M., Wang, Y., Wang, R., and Zhang. X, 2018. Porosity model and air leakage flow field simulation of goaf based on DEM-CFD. Arabian Journal of Geosciences, vol. 11, no. 7, ID: 148.
Wang, K, Tang, H.B., Wang, F.Q., Miao, Y., and Liu, D. 2019. Research on complex air leakage method to prevent coal spontaneous combustion in longwall goaf. PLOS One, vol. 14, no. 3, ID: e0213101.
Wang, L.L, Cao Q.G., and Zhou L.J. 2018. Research on the influencing factors in coal mine production safety based on the combination of DEMATEL and ISM. Safety Science, vol. 103, pp. 51–61.
Wang, M.Z, Liu, Z.G, Zhang, X.J., Xia, T., and Lv, K. 2014. Risk evaluation of spontaneous combustion of residual coal in goaf based on AHP and extended set pair theory. Jourmal of Safety Science and Technology, vol. 8, pp. 182–188.
Zhai, X.W., Wang, B., and Jiang S.R. 2019. Oxygen distribution and air leakage law in gob of working face of U+ L ventilation system. Mathematical Problems in Engineering. ID:8356701.
Zhai. X., Wang, B., Wang, K., and Dariusz, O. 2019. Study on the influence of water immersion on the characteristic parameters of spontaneous combustion oxidation of low-rank bituminous coal. Combustion Science and Technology, vol. 191, no. 7, pp. 1101–1122.
Zhang, J., Zhang, H., Ren, T., Wei, K., and Liang, Y. 2019. Proactive inertisation in longwall goaf for coal spontaneous combustion control-A CFD approach. Safety Science, vol. 113, pp. 445–460.
Zhang, P. and Luo, F. 2017. Influencing factors of runway incursion risk and their interaction mechanism based on DEMATEL-ISM. Tehnicki Vjesnik-Technical Gazette, vol. 24, no. 6, pp. 1853–1861.
Zhou, F. Lim, M.K., He, Y., and Lin, Y. 2019. End-of-life vehicle (ELV) recycling management: Improving performance using an ISM approach. Journal of Cleaner Production, vol. 228, pp. 231–243.
Zio E. 2016. Challenges in the vulnerability and risk analysis of critical infrastructures. Reliability Engineering & System Safety, vol. 152, pp. 137–150.
Zwetsloot, G.I.J.M., Kines, P., Ruotsala, R., Drupsteen, K., Merivirta, M-L., and Bezemer, R. 2017. The importance of commitment, communication, culture and learning for the implementation of the Zero Accident Vision in 27 companies in Europe. Safety Science, vol. 96, pp. 22–32. u
Affiliation:
1China ENFI Engineering Corporation, China
2NFC Africa Mining Plc., Zambia
Correspondence to: Y. Fan
Email: fany@enfi.com.cn
Dates:
Received: 15 Sept. 2019
Revised: 12 Feb. 2021
Accepted: 12 Feb. 2024
Published: May 2024
How to cite: Fan, Y., Zhang, D.H., and Xu, J.Y. 2024. Hydrogeology and groundwater control at Chambishi mine, Zambia. Journal of the Southern African Institute of Mining and Metallurgy, vol. 124, no. 5. pp. 239–244
DOI ID:
http://dx.doi.org/10.17159/24119717/292/2024
by Y. Fan1, D.H. Zhang2, and J.Y. Xu1
Abstract
The hydrogeological conditions in the Chambishi mine area in Zambia. were investigated. Chambishi is a very wet mine and groundwater discharge costs are high. The research goal was to identify methods to reduce the discharge costs without greatly affecting the mining process.
Hydrogeological data was obtained from measurements in drill-holes and from drill cores. The differences in structural deformation in different areas determine whether a layer of rock is an aquifer. In the mine region, the Lower Roan Group ore shale and quartz-sandstone unconformably lie on the basal schist and granite aquifuge. The Upper Roan Group dolomite is continuously distributed over a large area around the orebody. This dolomite is the main target of groundwater control efforts, and its water yield is also influenced by the deformation intensity.
Based on the observations, backfilling was gradually adopted to appropriately safeguard the integrity of the aquifuge above the orebody. The overlapping relationship between the aquifer and aquifuge has been utilized to increase mine drainage efficiency. This measure has not only greatly reduced the costs of mine drainage, but also improced protection of the groundwater environment. The old drill-holes that were not sealed after exploration drilling were grouted.
Further, possible water-conducting fracture zones were investigated. Cover drilling towards the suspected zone was conducted to prevent the high-pressure groundwater from shallower aquifers from entering stopes in deep areas of the mine.
Keywords
hydrogeology, aquifer, aquifuge, structural deformation, backfill
Introduction
We report the results of a hydrogeological investigation at the Chambishi copper mine in the Zambian Copperbelt. The aim of the investigation was to ascertain the deep level hydrogeological conditions and to ensure safe mining. The Chambishi copper mine is located along the northern–northeastern margin of the Chambishi structural basin. The mining concession covers the region extending from the Main West deposit in the west to the South East orebody in the east, A distance od about 5 km.
The Chambishi structural basin includes a large area of soluble rock aquifer. Thus, the mine area is rich in groundwater, and because of the high inflow of water, the discharge costs are high. The objective of this research was to identify technical measures to reduce drainage costs without affecting mining activities. We first present a brief description of the study area and the research topic. This is followed by detailed descriptions of the two deposits with regard to the aquifers and aquifuges, and a description of the water control measures. Finally, the main findings of this research. are summarized.
Background
The topographic relief in the mine area is gentle; the general terrain slope is 2–4%, and the local elevation difference does not exceed 50 m. This gentle relief and undulating landform are favourable for rainwater infiltration. The vegetation is well developed and comprises mainly shrubs and a dense grass cover. Hydrophilous plants flourish in the low-lying areas and on the sides of rivers and streams. The dense vegetation cover is also favourable for increasing the precipitation recharge to groundwater. The annual average rainfall is 1 181 mm, and the annual maximum and minimum are 1 659 mm and 630 mm, respectively. The maximum monthly rainfall is 489 mm, typically 20 mm to 40 mm at a time, and long duration large rainstorm are rare. This pattern of rainfall also favours the infiltration of rainwater.
The gentle topographic relief, dense vegetation cover, plentiful precipitation, and moderate rainfall intensity are all favourable for recharge to the groundwater. These conditions are important factors contributing to the groundwater in the mine area.
Main West deposit: Aquifer and aquifuge
The basal schist, quartzite, and granite intrusive form an extensive and continuous aquifuge surrounding the Chambishi basin. These lithologies contain limited fissure water only near some structural belts or in some parts locally affected by the paleo-weathering zone. Most of the mining development is located in these lithologies.
The ore-bearing Lower Roan Group is composed of conglomerate, sand-slate, and shale/schist, with interlaid sandstone and quartzite above the ore horizon, and some carbonate interlayer. This Group is usually an aquifer with low or moderate water content. However, its water content may increase with increasing increaseincreasinge in the foldfolding deformation. The interlayer slippage and folds within the ore shale are common structural phenomena, and they often form the transition zones and slips between different structural units. The total groundwater inflow from this layer may not be large. However, since most mining development is in this Group, it is classified as a major aquifer. Here, one factor to be emphasized is that an approximately 20 m thick Upper Quartzite layer is located immediately above the Lower Roan Group. This layer is hard and competent, and serves as a good aquifuge when it is not breached by fractures.
The Upper Roan Group is dominated by dolomite in the lower part and interbedded dolomite and shale in the upper part, with a total thickness of up to 700 m. The middle and lower parts of this sequence generally contain gypsum. Because of the solubility of gypsum, the porosity of the aquifer can reach 10% or more. The section of the Group where gypsum has dissolved forms the major aquifer in the mine, and dolomitic sands are often present in this section. Concordantly intruded gabbro sills of thickness from tens of metres to 200 m are distributed intermittently in the middle part of the Group. The sill may act as aquifuges, but because they are limited in area, they can only be considered as a local aquifuge.
The lithology of the Mwashia Group comprises carbonaceous shale and dolomite. The dolomite also constitutes an aquifer, which has a low to moderate water content. In some sections, caves are developed locally and these form strong aquifers.
The Kundelungu/Nguba Group comprises shale, limestone, and tillite conglomerate at the bottom. It is mainly distributed in the middle of the basin, covering other strata. Where the Group is thin, it forms a weathering fissure aquifer. Where the shale and moraine conglomerate are thicker, a relative aquifuge is formed.
The residuum and weathering zone aquifers have a general thickness of 20–60 m, but may be more than 100 m thick in places. Most of the aquifers have a weak water yield.
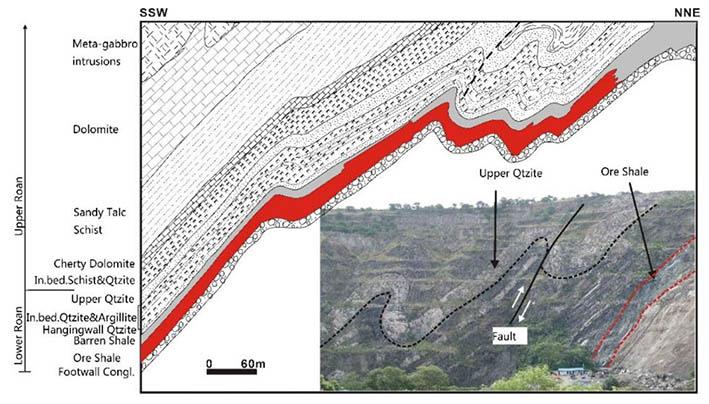
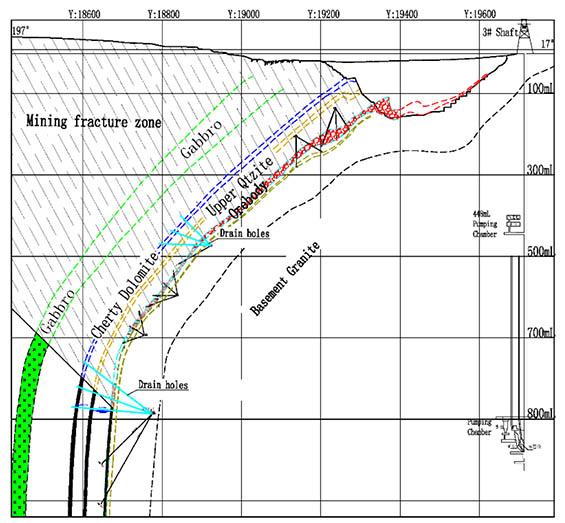
The upper stratum above the ore shale in the Main orebody has undergone strong deformation, thereby increasing its permeability. Therefore, when mining in the Main orebody a large volume of water inflow is encountered. Most of the hangingwall of the Main orebody experiences has poor geotechnical characteristice, and stope hangingwall stability is not good. The folds above the ore shale in the shallow stratum are shown in Figure 1, and the representative profile of the Main orebody is shown in Figure 2.
The open pit was begun in 1965, and the underground mine became operational in 1974. ZCCM adopted sublevel caving as the underground mining method. In such situations, large-scale drainage must be established in advance. The drainage works were generally located 100 m lower than the mining level, and their construction commenced about one year before mining. The large volume of water inflow and poor stability of the orebody and wall rock resulted in very high mining costs. In 1987, the mine was shut down for maintenance. Later, in 1998, NFCA took over the mine. Subsequently, the hydrogeology, water control, and mining methods were thoroughly examined. Detailed studies revealed that the complex folding in the ore horizon and overlying strata in the shallow part of the mine changes to a relatively simple monocline in the deeper part. Very steep structures still exert great influence on the stratum conductivity. The high permeability and relatively high water temperature (40°C) may be associated with the reactivation of the Lufilian Arc or a more recent tectonic event (rifting). Above the ore horizon, the cherty dolomite in the Upper Roan Group, which is located about 70 m above the orebody, is the strongest aquifer. Furthermore, the upper quartzite, located 40 m above the ore horizon, constitutes a good aquifuge. From the time that mining operations were restarted, sublevel caving has bee used in some mining sections, with backfilling adopted in other parts.
Backfilling does not cause large-scale damage to of the hangingwall rock. It improves ore recovery and significantly reduces ore dilution. The Upper Quartzite can act as an aquifuge to prevent the large volume of groundwater from the cherty dolomite entering the stopes. The mine drainage works only aim to drain the ore horizon and the associated strata below the Upper Quartzite. Most of the drainage boreholes can be terminated at the Upper Quartzite and need not penetrate the cherty dolomite strong aquifer, as was done during mining by ZCCM. Thus, the drainage intensity requirements were reduced, and accordingly, the costs of mine drainage works, as well as the water discharge volume, decreased.
The above measures helped restore production from the Main orebody in a relatively short time. Production continues at present. The depth of mining has reached the 732–865 m level from the 400–500 m level at the time production was restarted. The water inflow increased from 36 000 m3/d to 47 000 m3/d. Water from the sublevel caves, which constitute less than half of the total orebody length, accounts for two-thirds of the total water inflow, whereas the backfilling mining area accounts for only one-third.
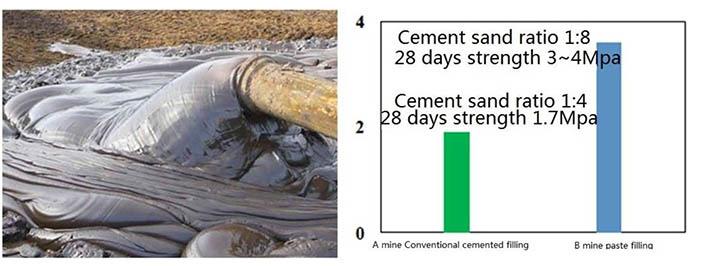
The West orebody is adjacent to the Main orebody and has similar hydrogeological characteristics. Based on the experience gained from mining the Main orebody, backfilling mining was adopted in all sections in the West orebody. In addition, a more advanced technique – paste filling – was introduced to further improve the backfilling quality and to provide better protection for the hangingwall. Paste filling has the advantages in that it undergoes no separation, segregation, or dehydration, and is a more compact filling. The characteristics of the paste filing material and a comparison of filling strengths are shown in Figure 3.
The mining and drainage depth at the West orebody has reached the 500 m level. Although the mining area is almost as long as the Main orebody, the total water inflow is less than 10 000 m3/d. The combination of selective drainage with backfill mining leads to satisfactory results. Through the use of advanced mining technology and a fine drainage works layout, the mine drainage cost has been greatly reduced, and the surrounding groundwater environment is well protected.
At present, the mining depth at the Main orebody is close to 900 m, and most of the proven resources have been depleted. Because of the large water inflow, mining of the remaining resources has become more difficult and higher costs are incurred. The adjacent West orebody has a relatively shallow mining depth and contributes the majority of production. While most of the water comes from the Main orebody, water inflow is considerable, and the drainage head is high. The drainage costs impose a heavy burden on production at the Main West orebody.
Southeast orebody
The Southeast orebody is located 5 km southeast of the Main West orebody. Here, the orebody is located at a great depth, and the surface hydrogeologial conditions are complex. Therefore, the mine was not developed until recently. The designed mining scale is 3.3 Mt/a. Mine construction commenced in 2013, and trial mining was conducted at the end of 2018. The distribution of the orebody and the surface water systems are shown in Figure 4.
The Mwambashi River flows from west to east through he Chambashi Basin and then joins the Kafue River. The drainage area of the river is 760 km2, and average flow rate is 3.4–9.6 m3/s with a maximum flow rate of 36.7 m3/s.
Owing to the impact of the paleo-sedimentary environment, the Southeast orebody has an extensive distribution and a complex shape. The orebody is 7 km long and 500–800 m wide. There are two other small orebodies on its north side. The northern part of
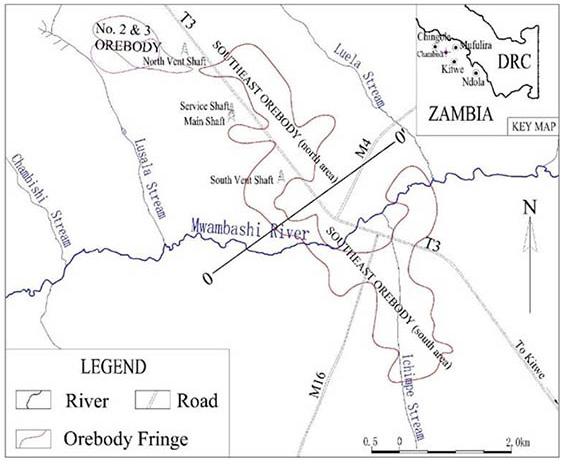
the orebody is located in a relatively high terrain between rivers; surface water is not developed and rainwater drainage is good. The orebody is at a depth of 700–1 000 m in the northern part. Hence, the northern part (north of the zero exploration line – see Figure 4) has been chosen as the first-stage mining area, so as to minimize the impact of the rivers on mining. The southern part of the orebody is shallower, and the ore horizon is closer to the aquifer. The bioherm dolomite (Greyling et al., 2005) adjacent to the orebody may also behave as the main aquifer. The Mwambashi River and Ichimpe stream flow above this ore section. The river seepage may be responsible for recharging water to the ore horizon. This part of the orebody is reserved for later mining.
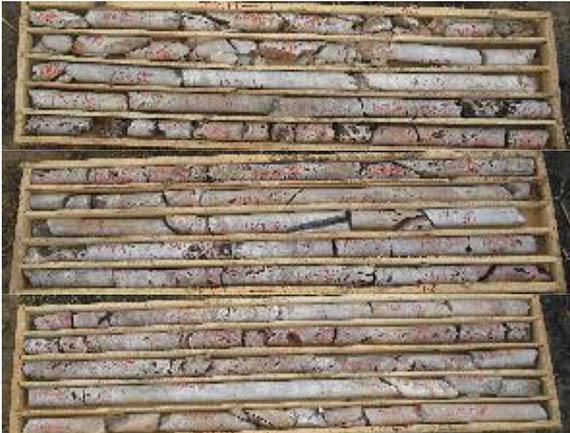
In the first-stage mining area, the strata can be clearly divided into the aquifer in the shallower part and the aquifuge in the deeper part. Both have similar thicknesses. The shallower aquifer includes the Mwashia dolomite and the upper part of the Upper Roan dolomite. The aquifuge includes the lower part of the Upper Roan, the Lower Roan, and basement. The gypsum-bearing arenite and the cherty dolomite, which is a strong aquifer in the Main-West orebody, form a part of the aquifuge in the Southeast orebody. The karst section of the upper portion of the Upper Roan dolomite is the strong section of the aquifer. Photographs of a core from the strong section of the aquifer are shown in Figure 5.
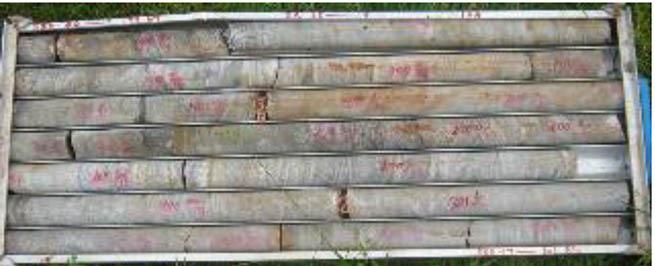
The brecciated dolomite of the Upper Roan and the entire Lower Roan are hard andcompetent; they form the aquifuge. Typical core is shown in Figure 6.
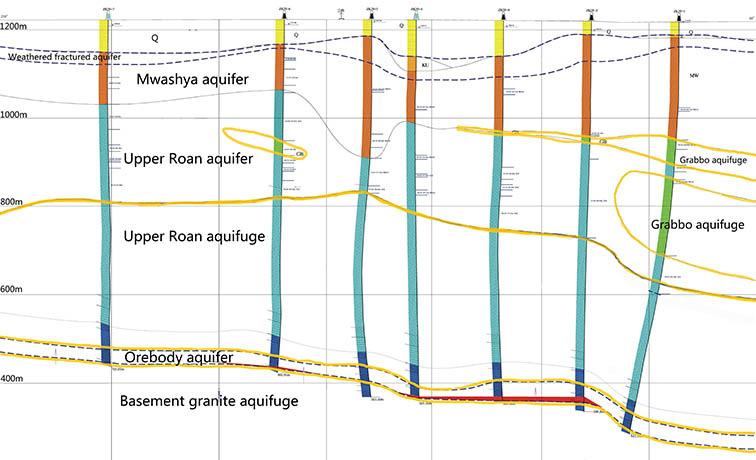
The basement Lufubu schist, quartzite, and gneissic granite form the footwall of the aquifuge, and also form the regional impervious boundary, outcropping at the northeast and east of the basin. The typical profile of the stratum attitude in the first-stage mining area and the aquifer-aquifuge distribution are shown in Figure 7.
NFCA conducted detailed exploration from 2008 to 2013. During this period, 83 boreholes totalling 68 844 m were drilled in the Southeast orebody. Of these, 15 were hydrological investigation holes. Hydrogeological logging was conducted for all 83 holes. Among these, 19 holes were used for monitoring the groundwater
regime, and 55 pumping tests and 25 hydro-chemical analyses have been done. Ground temperaturea were measured in 17 holes. Five holes were used for the geotechnical investigation prior to shaft sinking.
The results of the pumping tests for each aquifer (belt) are listed in Table I.
The results show that compared with the strata permeability reflected by the water yield of the Main West orebody, the conductivity coefficient for the Southeast orebody aquifer is clearly low.
Structural hydrogeological analysis was performed for the Southeast orebody. The ore horizon in the first-stage mining area is relatively undeformed. Ore-bearing strata are continuous with good integrity. This region is, on the whole, an ‘integral massive block’, lacking a strong conducting zone caused by tectonic factors. The forming of this ‘integral massive block’ is related to the different type of basement rock here compared with that in the other areas. The basements at the Main orebody and the southern part of the Southeast orebody are mainly granite. In contrast, in the first-stage mining area, the basement is schist and quartzite of the Muva and Lufubu Supergoups. Compared to the schist, the granite is more resistant to deformation. Therefore, the surrounding cover layer has experienced different intensities of folding deformation.
The ore shale and most of the overlying strata in the north part of the Southeast orebody have a gentle attitude, with dip angles 0–15°. In this regard, this orebody differs clearly from the Main orebody, which dips steeply from the basement to the basin centre. The intensive folding of the Main orebody results in a highly conductive aquifer that extends more than 1 000 m below the surface. The gabbro intrusion exerts great influence on stratum conductivity in the Southeast orebody. The outer contact zone of the intrusion forms a strong aquifer. Where the gabbro intrusion is thin, it forms a part of the aquifer. The influence of the intrusion is observed only in the shallower portion of the covering stratum; the deeper part of the area has experienced only weak tectonic influence.
Table I
Results of the pumping tests
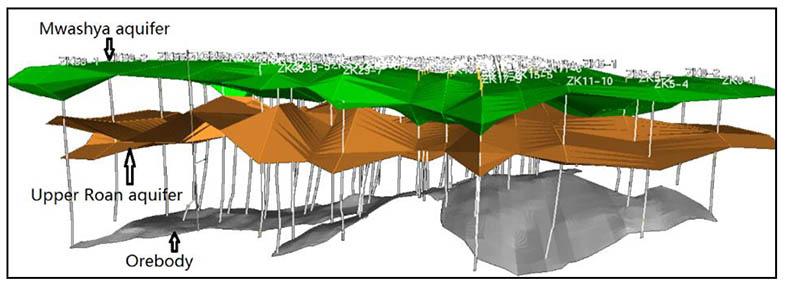
The positions and thicknesses of the aquifers were determined from hydrogeological core logging and observations of all drillholes. The thickness of the Mwashia limestone and dolomite aquifer is 50–100 m, while that of the Upper Roan aquifer (comprising dolomite and interbedded dolomitic mudstone) is 100–250 m. Between the aquifers is a relative aquifuge; a large part of which comprises a gabbro intrusion. A three-dimensional model of the spatial relationship of the aquifers with the orebody is shown in Figure 8.
The orebody, hangingwall, and footwall are all composed of hard rocks, with compressive strength Rc = 73.8–131.8 MPa and RQD = 95%. Good engineering geological features are favourable for maintaining the integrity of the stope hangingwall, thus preventing large inflows of groundwater from the upper aquifer from entering the mine.
At present, the development works and underground infill drilling have covered most of the first-stage mining area. Considering factors such as the overlapping of the aquifer and aquifuge, backfilling mining method, and actual water inflow in the existing developed works, the normal inflow of the first-stage mining area is predicted to be 10 000 m3/d. However, considering the fact that the fissure zone and mining activities may cause leakage recharge of the shallow aquifer, the estimated maximum water inflow is 30 000 m3/d.
The hydro-environment was studied thoroughly during exploration and construction of the mine, and a large number of hydrological
observations were made. Observations during the exploration period show that the trend of the groundwater level is basically the same as that of the terrain in the Southeast orebody. This indicates that the large volume of drainage at the Main West orebody has no significant impact on the Southeast orebody, and the impact of mine drainage is limited. Observations during construction (from October 2012 to the end of 2016) showwd that in some holes, the water level gradually fell, but only by a few metres. The water flow in the developed mine originates mainly from the deeply buried water-conducting structure. The change in the water level is quite small, and this indicates that the hydraulic connection between the orebody and shallow aquifer is not distinct and that deep water inflow has limited impact on the surface.
Ground temperatures measured in drill-holes reached up to 38°C in the deep part of the mine, adversely affecting the mining work. In some holes at depths less than 400 m, the ground temperature is clearly lower than at other holes at similar elevation. This indicates that the groundwater infiltrates from the shallow to the deeper section. At depths greater than 400 m, the measurements tend to be consistent, indicating that the groundwater flow is very weak at the deep level.
The temperature of the water flowing from some infill drillholes is 35°C or higher, with total dissolved solids of 2 007–2 426 mg/l. The pumping tests show that water from the deep segments have TDS 1.02–1.34 g/l. The groundwater conductivity in the shallow aquifer is generally EC 500–1 200 μs, TDS 0.45–0.87 g/l, and that of Mwambashi River water is EC 400–800 μs, with total dissolved solids 0.51 g/l. These results show that the water flow from
the mining levels is only associated with the deep water-conducting structures and is not directly connected to the shallow aquifer.
Water control measures
Water control during shaft sinking
Four shafts were developed in the mine. The general water inflow rate for the shaft in the weathering zone aquifer is less than 10 m3/h. The largest water inflow is located at a depth of 36.9 m in the northern ventilation shaft, with a flow rate of 39.2 m3/h.
The dolomite aquifer located at a depth less than 200 m is the main source of water inflow. The water control method adopted here is advance water detection drilling with cement grouting at the shaft sinking face. The maximum flow rate encountered by detection holes reaches 200–300 m3/h, with an average of 50 m3/h. The water-detection holes in some shaft segments emit dolomitic sand and encounter interbedded soft and hard rock, as well as rocks rich in gypsum and talc. In the main shaft, it took half a year to control water by grouting at the sinking face, and 1500 t of cement was consumed before the shaft passed through the aquifer. Retrospectively, we think that pre-grouting at the surface before shaft sinking may be a better choice for these hydrogeologic conditions.
In the downward excavation process at the 560–680 m level ramp at the southern ventilation shaft, water enters from the blastholes at the working face. Here, 20 t of cement was consumed for grouting. It was difficult to inject the grout fluid into the strata. After the ramp made a detour at some 10 m, the excavation was continued without encountering any more water.
During the mining process, it is important to prevent large areas of damage to stope hangingwalls and to ensure close contact between the backfill and hangingwall. Paste backfilling should be utilized in the stopes of the thicker orebody. Hangingwall support is an important measure to reduce the water inflow and to delay the increase in water inflow.
Fault zones are the main factor leading to the deterioration of stope stability. In areas where fault zones are present, the stope dimensions should be adjusted according to changes in geotechnical conditions so as to improve the stability of the hangingwall.
According to current understanding, the first-stage mining area is an integral massive block bounded by folds or fractures. Despite the flat-lying strata, slight tectonic deformation, and weak water content, analysis of the regional tectonic environment shows that folds or fracture structures may be present on the southeast and northeast sides of this area. These may be the boundary fractures (or folds) for the integral massive block. These two areas should be the focus of advance water detection work in the later mining stages
For the advance water detection drilling of such faults and fissure zones, the directional relationship between the drill-hole and
the fissure zone should be taken into consideration. Better results can be achieved if the detection hole intersects the fissure zone at a high angle.
During the ZCCM exploration period, drill-holes were generally not sealed after completion. For a mine such as the Southeast orebody that does not contain much drainage ground water, such old drill-holes may constitute connection to the shallow aquifer. Therefore, the old drill-holes were opened up and re-sealed. Because of the restrictions on land use rights, some of the old drill-holes could not be sealed. When feasible, these holes should be sealed as early as possible.
➤ Low topographic relief, dense vegetation cover, plentiful precipitation, and moderate rainfall intensity are all favourable for recharge to the groundwater. These conditions are responsible for the abundant groundwater in the mine area.
➤ The major lithologies in the ore shale are dolomite or dolomitic siltstone. Under the effects of long-term weathering and leaching, an extensive and continuous aquifer with a high porosity has formed, with a large static water storage capacity. This makes the development and early drainage of a new mine very difficult.
➤ Intensive strata deformation promotes the dissolution of carbonate rocks, thus forming a strong aquifer. Clastic rocks with a low water content such as shale, calcareous sandstone, siltstone, and feldspathic quartzite also form aquifers when deformed. Folding intensity has a great effect on the regional planar water conductivity of an aquifer. Faulting plays a role in connecting the strata, forming a strong conductivity zone.
➤ The areal distribution of the aquifer is a determining factor for the total water inflow of a mine. There is a greater chance for a larger aquifer to be intersected by river systems, which provide a perennial recharge source.
➤ With increasing mining depth, the groundwater has a more obvious impact on mine development and mining costs. The groundwater distribution should be investigated in detail during the exploration and design phases. Drainage design should take into account the spatial relationship between the aquifers and aquifuge in order to arrive at a reasonable drainage design, minimizing the drainage costs.
The authors wish to thank NFC Africa Mining plc. for the research sponsorship and permission to publish this paper. We are also grateful to Enago Group (www.enago.cn) for their invaluable assistance with editing.
Annels, A.E. and Simmonds, J.R. 1984. Cobalt in the Zambian Copperbelt. Precambrian Research, vol. 25, no. 1-3, pp. 75–98. Binda, P.L. 1994. Stratigraphy of Zambian Copperbelt orebodies. Journal of African Earth Sciences, vol.19, no. 4, pp. 251–264. Bull, S., Selley, D., Broughton, D., Hitzman, M., Cailteux, J., Large, R., and McGoldrick, P. 2011. Sequence and carbon isotopic stratigraphy of the Neoproterozoic Roan Group strata of the Zambian copperbelt. Precambrian Research, vol. 190, pp. 70–89. Greyling, L.N., Robb, L.J., Master, S., Boiron, M.C., and Yao, Y. 2005. The nature of early basinal fluids in the Zambian Copperbelt: A case study from the Chambishi deposit. Journal of African Earth Sciences, vol. 42, pp. 159–172. u
Affiliation:
1Department of Mining Engineering, University of Pretoria, South Africa
Correspondence to:
W.W. de Graaf
Email: wiblast@gmail.com
Dates:
Received: 27 Jan. 2021
Revised: 14 Sept. 2022
Accepted: 10 Mar. 2024
Published: May 2024
How to cite:
Ntsekhe, M.J., and de Graaf, W.W. 2024. An investigation into mining coal losses at Klipspruit Colliery. Journal of the Southern African Institute of Mining and Metallurgy, vol. 124, no. 5. pp. 245–252
DOI ID:
http://dx.doi.org/10.17159/24119717/1101/2024
ORCID:
W.W. de Graaf
http://orcid.org/0000-0003-0169-4721
by M.J. Ntsekhe and W.W. de Graaf
Abstract
Klipspruit Colliery is experiencing coal losses, which leads to a negative impact on coal production and subsequently loss in revenue. This study aimed to identify the possible causes of coal losses in the No. 4 upper and lower seams. The objectives were to identify potential sources of coal losses through a literature survey, to identify areas where the coal losses occurred, to determine factors affecting coal losses, and to identify the most cost-effective methods to reduce coal losses.
Highwall losses, top-of-coal losses, and coal edge losses were identified as the major areas of coal loss at Klipspruit. These losses were mostly attributed to the drilling and blasting practises of the pre-split, interburden waste, and the coal seams.
Recommendations include re-visiting the current pre-split design and the tolerances adopted for the interburden and coal seam drilling and blasting design. It is furthermore recommended that Klipspruit implement a continuous improvement plan for the drilling and blasting and refresher training for the blasting crew and operators.
Keywords opencast mining, drilling, blasting, pre-splitting, coal losses
Introduction
South Africa produces approximately 3.3% of the world’s coal supply, producing 251 Mt during 2018. The country’s coal reserves are estimated at 53 Gt (Eskom, 2019) while coal sales for 2018 were R139.4 billion (Mining for Schools, 2018). The Witbank and Highveld coalfields are the major sources of coal, contributing 75% of the country’s coal production. South Africa produces mainly thermal coal, which generates some 90% of the country’s electricity. The coal mining industry is the third largest employer in South Africa’s mining sector. In 2018, some 86 000 people were employed, which represented about 19% of the total workforce in the mining industry (Minerals Council South Africa, 2019; Mining for Schools, 2018).
It is estimated that the global coal industry loses about US$480 million (R5.5 billion) annually in revenue during the mining process (Baruya, 2012). Losses occur in various areas of the supply chain. including mining, during storage and transport, coal separation, and beneficiation. This study focuses primarily on coal losses during mining.
According to Goswami, Brent, and Hain (2008), the Australian coal mines experience 5% to 25% in-situ coal losses, which are usually blast-induced. It is estimated that a 1% improvement in coal recovery would lead to revenue increases of between A$1 million and 3 million per annum.
Coal loss mechanisms
Coal losses experienced during mining can be classified in several categories, discussed below.
Geological and geotechnical losses
These are naturally occurring losses that cannot be prevented and occur due to geological structures such as dykes and faults that were not identified during the exploration stage (Malambule and Zvarivadza, 2017; Ngwenyama, 2017).
Highwall losses
Highwall coal losses are caused by underbreak of the highwall. Potentially, these can be recovered during mining of the following strip, although this is not common practice.
Low wall losses
During blasting of the overlying rock, the rock ‘swells’, increasing the volume in the spoil. Due to the limited space to pack the material it is common for low wall slope failures, or sloughing, to occur, covering some of the coal. These losses may increase with an increase in the overlying rock mass. The recovery of low wall coal losses is generally unadvisable for reasons of safety (Ngwenyama, de Graaf, and Preis, 2017).
Top-of-seam losses / scalping
Scalping occurs during exposure of the coal seam, when the dragline, shovels, or dozers remove some of the coal. The coal seam may be damaged during blasting of the overlying waste rock. (Goswami and Brent, 2016). The excessive energy fractures the top of coal, which may lead to scalping. Further losses may occur due to poor operator skills, and these losses may increase during the night shift as it becomes difficult for the operator to distinguish between the waste material and the coal. The rate at which the coal is lost is also dependent on the friability of the coal (Ngwenyama, de Graaf, and Preis, 2017).
Floor losses
These are losses due to coal being left on the pit floor during loading or excavation, and are relatively low. They are highly dependent on the skills of the operator i.e. the ability of the operator to remove all the coal. An accumulation of water on the floor or loading during periods of [oor visibility may increase floor losses (Ngwenyama, de Graaf, and Preis, 2017).
Spontaneous combustion
Spontaneous combustion occurs when in-situ coal is exposed to oxygen and heats up until it ignites (Phillips, Uludag, and Chabedi, 2011). This decreases both the quantity and quality of the coal. Spontaneous combustion can also occur on stockpiles. increasing coal losses (Phillips et al., 2003)
Project background
Klipspruit Colliery is situated in Mpumalanga Province, close to Ogies. A dragline is used in the main pit to expose the coal seams, and a truck and shovel operation exposes the coal seams in the mini-pit. During June 2017, the mine’s coal reserves were estimated at 22 Mt. The majority of the coal produced is thermal coal, which is exported. The stratigraphy consists of six coal seams in the mining area, namely: 5 seam (S5), 4 upper seam (S4U), 4 lower seam (S4L), 3 seam (S3), 2 seam (S2), and 1 seam (S1). The S3 is considered uneconomical due to its low thickness and therefore is not mined.
The mine has been experiencing coal losses for several years. Although the sources of such coal losses are known, the need to identify and address the root causes needs to be addressed.
In addition to a literature review, site visits for data collection and interviews were conducted to determine areas in which major coal losses had ocurred.
Current coal loss evaluation methods at Klipspruit Colliery
The resource and reserve models are used to calculate the volumes of coal available for extraction. Wire-line logging is used to determine available coal for mining and the results are compared to the actual coal mined. A difference between the theoretical calculations and the actual mined coal indicates possible coal losses.
Coal losses at Klipspruit Colliery
The study was conducted between ramp 3 and ramp 4 in the main
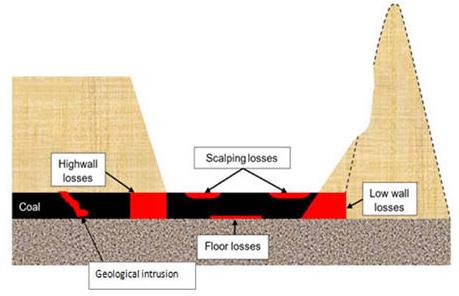
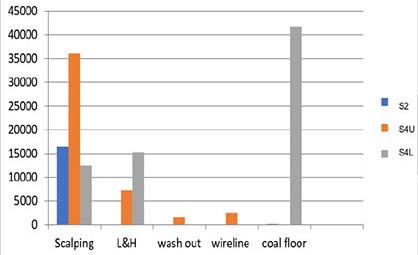
pit. In this area the S5 and S1 seams were not mined. The coal losses recorded include top-of-coal losses, coal in floor losses, low wall or highwall losses, and geological losses as shown in Figure 1.
The S4L seam was the largest contributor to the coal losses that occurred during 2018, as shown in Figure 2.
Current controls for coal losses
Control of coal losses is divided into three operational sections, namely exposure, drill and blast, and extraction. Each of these sections implements its own control measures as stipulated by the mine’s standard operating procedure (SOP).
Problem statement
Klipspruit Colliery is currently experiencing coal losses. which have a negative impact on the profits generated by the mine. This study aims to identify the possible causes of coal losses and suggest practical ways to reduce these.
Methodology
In order to acquire sufficient data, the following steps were taken.
➤ An extensive literature review was conducted to understand possible coal losses and how they can occur, and to examine the different sources of coal losses at various collieries and how the mines deal with the problem.
➤ Site visits to Klipspruit Colliery were undertaken for data collection to determine areas which have experienced major coal losses.
➤ Mining personnel were interviewed to gain a better understanding of the coal losses at Klipspruit Colliery.
Results and analysis
The major coal losses experienced at Klipspruit Colliery are grouped into three main types:
➤ Highwall
➤ Top-of-coal
➤ Coal edge.
To address the abovementioned coal losses the following blasting method designs will be discussed in more detail.
Pre-split design
Highwall losses are due to sub-standard blasting results, typically perimeter control. When the block being blasted is not broken to the planned perimeter, the ‘frozen’ material on the highwall, if not removed by the dragline, will result in coal being lost. Perimeter control can be an effective way to eliminate the coal losses.
Current pre-split design
The overburden on S4U is pre-split blasted before the main production holes are drilled, charged, and blasted.. The current pre-split parameters are listed in Table I. The current design was assessed based on industry standards. A typical block at the Klipspruit Colliery is 100 m long and 50 m wide. Pre-split holes are drilled through the coal seam.
Table I
Current pre-split parameters
Spacing 3 m Hole diameter
Mass of explosives 2.0 kg/m
Average depth 25 m
Pre-split bag diameter
250 mm
Explosive HEF 100 (booster- sensitive bulk emulsion)
Booster
Initiation system
Table II
400 g
Detonating cord
Splitting factors for different rock types (University of Pretoria, 2018)
Rock properties
Brittle, low density
Hard, high density
Competent sedimentary
Splitting factor (kg/m2)
0.2–0.4
0.3–0.6
0.4–0.7
The current pre-split design was assessed based on the following criteria (de Graaf, 2018):
MH = S × P where
MH = Mass per metre in the hole (kg/m)
S = Spacing (m) (15– 20 hole diameters)
P = Splitting factor (kg/m2)
The splitting factor depends on the rock mass properties and is indicated in Table II
Evaluation of pre-split design using current diameter holes
Using the factors in Table II, for a hole diameter of 256 mm, the spacing is expected to be between 3.84 m and 5.15 m. The current mine design has a spacing of 3 m, which falls outside the recommended range.
The overburden on the mine is a competent sedimentary rock;. According to Table II, the splitting factor ranges between 0.4 and 0.7 kg/m2. For this study and at Klipspruit Colliery, a splitting factor of 0.5 kg/m2 is used. Taking into consideration the minimum and maximum values for spacing, the acceptable range for mass of explosive per metre is calculated as follows:
MHmin = 3.84 × 0.5 = 1.92 kg/m
MHmax = 5.15 × 0.5 = 2.58 kg/m
The current mass of explosive per metre, 2 kg/m, is well within the acceptable range. However, the spacing falls outside the guidelines, which could result in uneven splitting of the highwall and potentially lead to both under- and over-break of the highwall. While there is no universally accepted hole diameter for pre-split blasting, industry practices suggest that smaller diameter holes in conjunction with smaller spacing may yield improved results.
Half cast factor (HCF) is a practical in-field method used to assess the success of the exposed pre-split. A well-blasted pre-split will show half barrels in the highwall. The HCF is represented as the sum of the total length of visible half barrels to the total length of holes drilled. HCF calculation is based on Figure 3, which shows a 25 m highwall with visible barrels. Nine barrels of 25 m are expected. The HCF was calculated as 23%, which is relatively low.
In addition to the current drill bit diameter (256 mm), there are two smaller diameters available; namely 141 mm and 200 mm. Two pre-split scenarios were designed using these two bits, as shown in Table III. Scenario 1 is the pre-split design using a 141mm bit, and scenario 2 is the design using a 200 mm bit. Parameters for both scenarios are shown in Table IV.
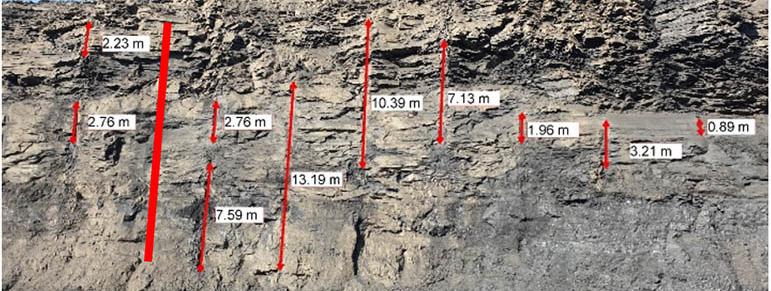
Table III
Pre-split design for 141 mm and 200 mm hole diameters Parameter
Table IV
Number of holes drilled for 141 mm and 200 mm hole diameters
Hole Diameter Holes drilled for one block Difference from current (%)
A pre-split with 141 mm hole diameter is expected to yield cleaner splitting; however, it will result in more holes drilled due to smaller spacing. For a block that is 100 m long, 34 holes need to be drilled for the current pre-split design. The number of holes that need to be drilled for hole diameters of 141 mm and 200 mm are shown in Table IV.
According to Table IV, scenario 1 may increase the number of holes required for a pre-split by up to 18%. Scenario 2, on the other hand, may reduce the total number of holes by up to 15%. Both scenarios are expected to reduce highwall coal losses. Scenario 2 is the most feasible of the two as it presents an opportunity to reduce the number of holes drilled, thus, reducing both drilling and blasting costs of the S4U overburden.
Overburden and parting drilling and blasting
Drilling plays a pivotal role in the success of the blasting outcome, and subsequently has an impact on the top-of-coal and edge losses when the burden is blasted. This is especially true at Klipspruit because the burden (overburden and parting) is drilled to top of coal. In this section, we consider different methods to determine the most suitable ways to minimize coal losses from the drill and blast for exposure perspective.
Current blast parameters
Top-of-coal damage and losses are normally attributed to overcharging of the overburden. The overburden is drilled and blasted to expose the S4U. When S4U extraction is compete, the parting is drilled and blasted and the S4L extracted. The overburden consists mainly of gritty sandstone with subordinate shale and has an average thickness of 25 m. The parting, on the other hand, is composed mainly of sandstone and has an average thickness of 1.8 m. The blasting parameters used for both overburden and parting are listed in Table V.
The overburden blast layout provides satisfactory results in terms of fragmentation.
Evaluation of current parting drill and blast pattern
According to Table V, a planned powder factor of 0.45 kg/m3 is well within the industry accepted range of 0.35–0.65 kg/m3 for sandstone. From a design perspective, the blast design is expected
Table V
Current drill and blast parameters for parting and overburden Parting Overburden
(B × S)
to yield satisfactory results. However, when the powder factor was calculated using the blasting parameters in Table V, a higher powder factor was obtained – 0.8 kg/m3 compared to the planned powder factor of 0.45 kg/m3. The calculated powder factor falls out of the recommended range of 0.35–0.65 kg/m3. The current drill and blast parameters do not meet the required powder factor. A high powder factor implies that a blast-hole may be under-burdened, thus resulting in some energy directed into the coal seam.
The burden and spacing were also calculated using the planned powder factor of 0.45 kg/m3 and current hole diameter of 141 mm. The burden and spacing were calculated as 5.5 m. However, the burden is now significantly more than the parting width. This will result in poor fragmentation and increased top-of-coal losses. To maintain the powder factor the burden and spacing, as well as the blast-hole diameter, should be reduced.
Apart from matching the powder factor to the type of rock being blasted, the hole diameter and the bench height ratios needed to be addressed. The height (H) and hole diameter (D) are related according to the following equation (AEL Mining Services, 2014):
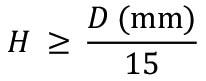
By rearranging the above equation, the maximum hole diameter that is most suited for a 1.8 m parting was determined as D ≤ 27 mm
The mine is currently using a hole diameter of 141 mm, which is approximately five times greater than the recommended diameter. The mass of explosives per metre changes from 17.7 kg/m to 0.7 kg/m. To maintain the current powder factor, the burden and spacing were calculated as 1 m × 1 m. The tight spacing and burden have serious implications in terms of practicality, time, and costs. This pattern could result in lower coal losses; however, unintended consequences need to be investigated.
Due to equipment constraints, the smallest drill bit the mine has is a 102 mm diameter. The powder factor is maintained at 0.45 kg/ m3, and the spacing-to-burden ratio is changed to 1.15 for better distribution of explosive energy. Table VI shows the blast design to be used in the interim.
As mentioned previously, both parting and overburden are drilled to top of coal. This may lead to pulverization of top of coal during blasting. The direct contact between the explosive column and top
Table VI
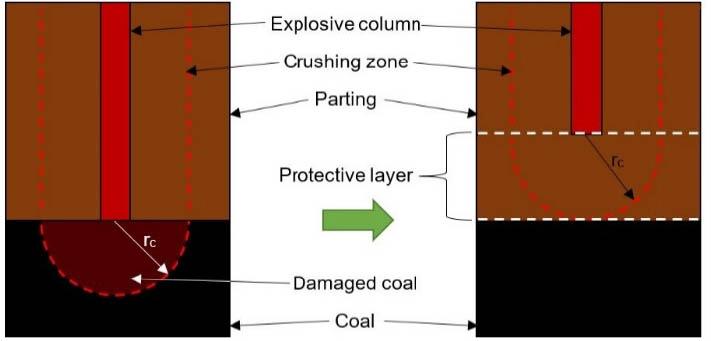
of coal implies that a fraction of the explosive energy goes into the coal seam. The energy in the crushing zone breaks coal into fine particles which are not recoverable (Esen, Onederra, and Bilgin, 2003).
According to Esen, Onederra, and Bilgin (2003) there is a relationship between the blast-hole radius (ro) and the radius of the crushed zone (rc). There are many models that attempt to quantify the crushing zone of an explosive column, and they all suggest that the ratio, rc/ro, does not exceed 3 to 5 blast-hole radii (Esen, Onederra, and Bilgin, 2003). Assuming that the rc/ro ratio holds true not only laterally, but also vertically at the toe of the blast-hole; potential coal losses can be calculated.
To determine the potential top-of-coal losses that occur due to drilling to top of coal, assuming that there is no over-drilling, an approach by Esen, Onederra, and Bilgin {2003) was used. The extent of the damage into the coal seam is shown in Table VII.
Due to drilling to top of coal, damage to top of coal may extend an average of 512 mm and 282 mm into the S4U and S4L, respectively. Thus as much as 18% of both the S4U and S4L seam thicknesses may be lost. It is worth noting that the true extent of the damage is dependent on more than the hole radius.
VII
Since the extent of possible coal loss has been determined, controls which include leaving a protective layer on top of the coal, as seen in Figure 4 should be put in place to minimize coal losses due to drilling to top of coal.
Coal losses due to drilling tolerances
Inasmuch as strict adherence to the plan is encouraged, getting the correct depth to the last millimetre can prove time-consuming and almost impossible in practise. Hence the mine developed a standard to allow for some variation. Currently, drilling is done to a tolerance of ±1 m, meaning a blast-hole that is either 1 m shorter or longer than the planned depth is considered acceptable. Blast-holes that are more than 1 m off the planned depth are re-drilled. It was found that on average 50% of the holes are not drilled to their planned depth but are still within the 1 m tolerance. Of that 50%, some 62% of the holes are drilled longer than the planned depth. Evaluating the drill-hole data, over-drilling of blast-holes is on average 57 cm.
Parting
S4L coal is extracted after removing the parting layer overlying the S4L. The S4L has a maximum thickness of 5.17 m, with an average thickness of 1.57 m. Using the drill pattern in Table V, the number of holes drilled for one block was calculated at 313 holes. equating to 0.03 holes per BCM. The number of holes that are drilled beyond the planned depth but are still within the 1 m tolerance was calculated as 0.01 holes per BCM.
A small deviation from the planned depth can have an effect on the quantity of coal mined. Over-drilling by 0.57 m on the 4 × 4 m pattern, taking into account the number of holes that are overdrilled, results in an estimated coal loss of 1327 t, approximately 11.3% coal loss per block.
Overburden
S4U coal is extracted after the overburden has been removed. The S4U has a maximum thickness of 5.53 m, with an average thickness of 2.82 m. The overburden drill pattern and the block size shown in Table VI indicates 89 holes drilled per block.
The number of holes that are drilled beyond the planned depth but within the 1 m tolerance is 28. Using the 7 × 8 m pattern and the number of holes that are over-drilled,; the estimated coal lost is 1340 t.
The expected S4U coal tonnage is 21 150 t per block. However, as much as 5.9% of that tonnage is lost due to non-adherance to drilling tolerances.
From the above calculations, drilling tolerances have a considerable influence on the coal losses at Klipspruit Colliery. The tolerance should be reduced to minimize drilling into coal during parting blasting. A methodical approach was followed where the tolerance was reduced in steps of 25%, as shown in Table VIII. The analysis suggests that the holes are over-drilled by 57% (0.57/1) of the tolerance.
Table VIII
Effect of reduction of drilling tolerance
Discussion
Highwall coal losses
The highwall coal losses are a result of underperforming perimeter control. The overburden pre-split is currently drilled with a 256 mm hole diameter. Due to unsatisfactory results and a low HCF. two hole diameters were compared to the current pre-split design.
Improved perimeter control
The reduced spacing and smaller diameter drill-hole has been shown to yield better results than the current design. This is due to improved control of the explosive energy during pre-split blasting. Thus, 141 mm is the preferred hole diameter for pre-split drilling.
Practicality
The pre-split design should be as practical as possible. This includes the time and effort taken to prepare, drill, charge, and blast. Practicality is assessed in terms of the area covered by each hole drilled. The greater this area, the easier and quicker it is to blast the overburden pre-split. (Table IX).
According to Table IX, scenario 1 is more practical as regards the amount of drilling required. For every hole drilled, scenario 1 covers 17% more area than the current design due to the greater spacing between the pre-split holes. Scenario 2, on the other hand, covers 17% less than the current design due the smaller spacing.
Costs
The aim is to reduce coal losses while reducing the operating costs. The pre-split parameters across the pre-split designs are similar. The mass of emulsion per hole varies for each design; however, the overall mass per unit area does not change, due the chosen splitting factor of 0.5 kg/m2.
Using the areas covered per hole and the unit costs respectively; the costs for the current design, scenario 1, and scenario 2 were calculated. Table X shows the cost comparison of the three designs. From the cost perspective, scenario 1 is the most suitable design to mitigate overburden highwall losses, as it is the most financially feasible of the three designs.
Top-of-coal losses
Two possible solutions were identified to address top-of-coal losses: changing the current blasting pattern and avoiding drilling to top
IX
Area covered per hole Current
Table X
XI
Parting blasting design
of coal. The overburden blasting pattern is performing as expected. Due to the parting thickness of 1.8 m, only a few drill and blast options are available for the parting.
Changing the current blasting pattern
From the results, it is evident that a suboptimal hole diameter is a possible cause for high top-of-coal losses, particularly when drilling and blasting the parting. It is expected that a hole diameter of 27 mm will result in less coal losses due to better distribution of explosive energy across the block. The current design has a lower distribution of holes compared to the recommended design, as shown in Table XI.
The hole distribution shown in Table XI implies that for every 100 BCM's, there are approximately three holes drilled for the current parting design compared to 60 holes for the recommended hole diameter of 27 mm.
The new pattern has the potential to decrease the number of holes drilled per block while reducing the damage to top of coal, thus reducing the overall costs for drilling and blasting. The two patterns are similar, the only difference is the number of holes that need to be drilled per block.
The costs of drilling and emulsion using the current pattern are R129 per metre and R6.30 per kilogram respectively. The current and two other drill and blast designs were compared. It was determined that the drilling costs for a 27 mm blast-hole are 16 times more than the current drilling costs. Such costs are not justifiable as the costs outweigh the possible revenue generated from recovering the coal that would have been damaged. The drilling costs for the 102 mm hole diameter are 15% higher than for a 141 mm hole – R9.21 per cubic metre compared with R8.00 per cubic metre. However, the higher drilling costs are offset by lower emulsion costs per BCM. More work is required to determine the ideal hole diameter for parting blasting. In the interim, the mine should make use of the 102 mm hole diameter to minimize the topof-coal losses. In addition to reducing coal losses, changing the blast pattern has the following advantages:
➤ Less explosive energy penetrating top of coal
➤ Easy to implement (no additional training required)
➤ No additional resources required to be assigned
➤ Improved floor control.
Drilling tolerances
Coal losses related to drilling tolerance constitute approximately 11% of the total losses. Three possible tolerances were considered: 75 cm, 50 cm, and 25 cm. Reducing the tolerance to 50 cm could potentially reduce the losses due to drilling to top of coal by 50%. This will also promote accurate drilling by the operator.
Conclusions
Coal losses are a complex problem by nature. The major areas
Table XII
Coal loss types and causes at Klipspruit Colliery
Category Potential causes
Highwall losses Poor perimeter control during blasting Suboptimal pre-split design.
Top-of-coal losses Drilling to top of coal Error between planned and actual powder factors
Drilling tolerances
Coal edge losses Movement of coal seam during throw blasting
of coal loss at Klipspruit Colliery and their causes have been identified and possible solutions proposed.
Coal losses at Klipspruit can be grouped into highwall, top-ofcoal, and edge losses. For each of these the root causes are listed in Table XII.
All these losses are largely related to blasting practices and loading of overburden above the S4U and S4L. Some of the contributing factors include drilling accuracy, prime mover operator skills, rock properties.- and the underlying geology.
Recommendations
Klipspruit Colliery should institute a continuous improvement plan for their drilling and blasting practises by analysing blasts to identify improvement opportunities. Furthermore, the blasting crew and operators should attend refresher courses to ensure that they comply with the SOPs at all times. This will also improve employees‘ understanding of the need to comply with SOPs (such as drilling to the correct depth) and the adverse impact of non-compliance on coal recovery.
Recommendations to reduce/minimize the different types of coal losses at Klipspruit Colliery are as follows:
Highwall losses
➤ Changes to the current pre-split design should be made to ensure that the planned highwall perimeter is always achieved during blasting.
➤ A smaller hole diameter for the pre-split design should be considered for the overburden.
Top-of-coal losses
➤ The mine should avoid drilling into the coal seam by implementing strict field controls. When holes are overdrilled, corrective measures should be implemented such as backfilling. However, if the blast-hole is drilled to the coal seam coal losses are inevitable due to blast damage. A 30 cm protective layer should be left above the seam to reduce blast damage to the top of the coal seam.
➤ Drilling tolerances should be reduced from 1 m to 0.5 m to encourage more accurate drilling, which will reduce coal damage and losses.
➤ The recommended change in the blast design to address topof-coal losses is expected to also limit seam movement, thus reducing coal edge losses.
The results of the study could be verified using a larger area of the mine. This could be followed by an investigation into coal losses on the other seams (S1, S2, and S5).
The drilling and blasting tolerances currently used at Klipspruit Colliery should be further investigated. Losses experienced in other areas of the coal supply chain at the mine, such as during beneficiation, should also be investigated.
AEL Mining Services. 2014. Surface Blasting Handbook. Modderfontein, South Africa.
De Graaf, W. 2018. PRX 321: Explosives. [lecture notes] Department of Mining Engineering, University of Pretoria.
Esen, S., Onederra, I., and Bilgin, H. 2003. Modelling the size of the crushed zone around a blasthole. International Journal of Rock Mechanics & Mining Sciences, vol. 40, pp. 485–495.
Goswami, T., Brent, G.F., and Hain, L. 2008. Reducing coal damage and loss with a new blasting technology. Proceedings of the 34th International Conference on Explosives and Blasting Technique International Society of Explosives Engineers, Cleveland, OH. https://www.oricaminingservices.com/uploads/Coal-RecoverySolutions/Technical-Papers/200245_Reference_ISEE_ Reducing%20coal%20damage%20and%20loss%20with%20 new%20blasting%20technology_Australia_English.pdf
Goswami, T. and Brent, G. 2016. Blasting approaches to increase mine productivity and reduce greenhouse gas emission in surface coal mining. Proceedings of the 11th International Symposium on Rock Fragmentation by Blasting. Australasian Institute of Mining and Metallurgy, Melbourne. 14 pp. https://static1.squarespace.com/static/580dc4ec37c581b0761d0261/ t/581585e1893fc013e675ae30/1477805551374Blasting+approac hes+to+increase+mine+productivity+and+reduce+greenhouse +gas+emissions+in+surface+coal+mining.pdf
[accessed 6 July 2019].
Goswami, T. and Brent, G. 2006. Stratablast, A new mining method. Proceedings of the Annual Conference on Explosives and Blasting Technique. International Society of Explosives Engineers, Cleveland, OH. https://www.oricaminingservices.com/uploads/Coal-RecoverySolutions/Technical-Papers/200262_OR1236_StrataBlast_A_ NewMiningMethod.pdf
Malambule, T. and Zvarivadza, T. 2017. Effects of geology on production rate: Open pit coal. Minerals Council South Africa. Coal. https://www.mineralscouncil.org.za/sa-mining/coal [accessed 20 July 2019]
Mining for Schools. 2018. https://https://www.miningforschools.co.za/ Ngwenyama , P.I., de Graaf, W.W., and Preis, E.P. 2017. Factors and challenges affecting coal recovery by opencast pillar mining in the Witbank coalfield. Journal of the Southern African Mining and Metallurgy, vol. 117, pp. 215–221.
Phillips, H., Uludag, S., and Chabedi, K. 2011. Prevention and control of spontaneous combustion. Best practice guidelines for surface coal mines in South Africa. Coaltech, Johannesburg. 129 pp. https://miningandblasting.files.wordpress.com/2009/09/ spontaneous_combustion_guidelines.pdf
[accessed 3 July 2019] u


Mining operators are seeing an increased demand for minerals and ores. Operators must now consider the costs of pump maintenance and replacement as well as the cost-benefit of utilizing fewer larger pumps versus several smaller pumps to perform the same work.
Mining operators are seeing an increased demand for minerals and ores. Operators must now consider the costs of pump maintenance and replacement as well as the cost -benefit of utilizing fewer larger pumps versus several smaller pumps to perform the same work.
The KSB GIW® MDX pump line delivers proven results in the harshest hard rock mining applications.

The KSB GIW® MDX pump line delivers proven results in the harshest hard rock mining applications. W: www.ksb.com/en-za T: +27-11-876-5600
W: www.ksb.com/en-za T: +27-11-876-5600

Affiliation:
1Advance Materials and Engineering, Manufacturing Cluster, Council for Scientific and Industrial Research, Brummeria, Pretoria,South Africa
2Department of Metallurgy, School of Mining, Metallurgy and Chemical Engineering, University of Johannesburg, Doornfontein Campus, Johannesburg, South Africa
3Department of Chemical, Materials and Metallurgical Engineering, Botswana International University of Science and Technology, Botswana
Correspondence to: B.A. Obadele
Email: obadele4@gmail.com
Dates:
Received: 1 Sept. 2020
Revised: 8 Mar. 2021
Accepted: Feb. 2024
Published: May 2024
How to cite:
Moshokoa, N.A., Raganya, M.L., Machaka, R., Makhatha, M.E., and Obadele, B.A. 2024. The influence 0f solution treatment on the phase evolution and tensile properties of binary Ti-Mo alloys. Journal of the Southern African Institute of Mining and Metallurgy, vol. 124, no. 5. pp. 253–262
DOI ID:
http://dx.doi.org/10.17159/24119717/1354/2024
ORCID:
B.A. Obadele
http://orcid.org/0000-0003-4529-4762
N.A. Moshokoa
http://orcid.org/0000-0001-5750-1314
M.L. Raganya
http://orcid.org/000-0002-3259-8647
R. Machaka
http://orcid.org/0000-0002-3174-8703
M.E. Makhatha
http://orcid.org/0000-0003-2157-9712
by N.A. Moshokoa1,2, M.L. Raganya1,2, R. Machaka1,2, M.E. Makhatha2, and B.A. Obadele3
Abstract
The influence of solution treatment on the phase evolution and tensile properties of Ti-Mo alloys was investigated to assess their potential use in biomedical applications. Phase formation and microstructural evolution were studied using X-ray diffraction (XRD), optical microscopy (OM), scanning electron microscopy (SEM), and electron backscatter diffraction (EBSD). The mechanical properties were characterized by means of tensile tests and bending strength. XRD analysis showed that solution treatment increased the volume fraction of β phase and supressed the α" phase. The microstructures of the as-cast alloys consisted of β equiaxed grains with sub-grain structures of different sizes, while the solution treated alloys comprised β equiaxed grains only except for Ti10.02Mo, which comprised needle-like α" structures. EBSD showed an increase in the volume fraction of the ω and α" phases in all the alloys after solution treatment. The elastic modulus and UTS of all the alloy significantly decreased after solution treatment, except for Ti-15.05Mo, whereas the elongation significantly increased. The fracture surfaces of all the alloys after solution treatment indicated more ductile behaviour than brittle.
Keywords
Ti-Mo alloys, solution treatment, mechanical properties, microstructure
Introduction
Biomedical implants made of natural or artificial materials have been developed over the years to replace lost or diseased biological structures and improve quality of life (Long and Rack, 1998; Geetha et al., 2009; Gepreel and Niinomi, 2012). Navarro, Michiardi, and Castan (2008) reported that the use of implants has become more widespread, especially in aged people suffering from conditions such as arthritis and joint pains. According to Long and Rack (1998), orthopaedic hip and knee joint replacements have a high prevelance due to factors such as osteoarthritis (inflammation in the bone joints), osteoporosis (weakening of the bones), and trauma, which can lead to pain, loss of function, or loss of natural healing ability. However, the effectiveness of implants can be compromised by factors such as debris generation, metal ion release and foreign body response, and mismatch of modulus between the bones and the implant or low strength under load (Gepreel and Niinomi, 2013).
The design and development of orthopaedic materials must take into account certain requirements to avoid revision surgery. An elastic modulus close to that of the bone to avoid the stress shielding effect is vital. The stress shielding effect (Engh and Bobyn, 1988) is insufficient load transfer from the artificial implant to the adjacent remodelling bone, which leads to bone resorption and eventually loosening of the prosthetic. Due to this considerations, metals and alloys have been extensively used as load-bearing implants. For example, Ti6Al4V is commonly used for prostheses such as knee joint and hip replacements because of its outstanding properties such as high specific strength, excellent corrosion resistance, low elastic modulus, and superior biocompatibility compared to stainless steel and Co-Cr materials (Sidambe, 2014). However, the advantages of this alloy are not sufficient to avoid implant failure, because Ti6Al4V suffers from two major drawbacks. The release of Al and V ions is reported to cause adverse health issues. (Okazaki, 1996; Keda et al., 2002). Also, Ti6Al4V has a modulus of 110 GPa, higher than that of human bone at 10-40 GPa (Niinomi, 2008).
Therefore, the development and design of β-type Ti alloys containing non-toxic and non-allergenic elements such as Mo, Nb, Ta, Zr, and Sn has attracted considerable attention because of their properties such as low elastic modulus and excellent biocompatibility. In this study, commercially pure Ti was microalloyed with molybdenum (Mo) due to its strong β-stabilizing properties and low cost compared with other β-stabilizing elements (Polmear, 2006; Lu et al., 2013). Currently, the binary alloys Ti-10Mo, Ti-15Mo, and
Ti-7.5Mo have been developed for use in biomedical applications in the as-cast condition. Most previous studies on Ti-Mo alloys have concentrated on phase transformations, microstructure, and mechanical properties in the as-cast condition and there are few studies on these properies in solution-treated alloys. Therefore, the aim of this study was to investigate the influence of solution treatment of the microstructure and tensile properties of Ti10.02Mo, Ti-10.83Mo, Ti-12.89Mo, and Ti-15.05Mo.
Experimental
Alloy design and preparation
The cluster-plus-glue-atom-model was used to design the compositions of the Ti-Mo binary alloys. The β-stabilizing prediction tools found in the literature, such as molybdenum equivalence (Moeq), valence electron to atom (e/a) ratio, and the d-electron stability map were used to forecast the stability of the β phase. Moeq is defined as the total number of beta-stabilizing elements, alpha-stabilizing elements, and neutral elements required to retain 100% of the β phase after quenching from above the β transus temperature to room temperature (Welsch, Boyse, and Collings, 1993). Bania (1994) reported that a Moeq value of 10.0 wt% in Ti-Mo alloys is required to stabilize the β phase during quenching. The e/a ratio is the average number of valence electron in each atom of Ti-Mo binary alloys and is used to predict the formation of athermal omega (ω) phase in Ti alloys. According to Ikehata et al. (2004) the formation of athermal omega phase is at its maximum at an e/a ratio of 4.13 and minimum at 4.30; above this minimum the β phase becomes dominant. The calculated values of Moeq and e/a showed that all the designed alloys will stabilize the β phase upon quenching without precipitation of the ω phase.
The phase stability map was used to predict the stability of the β phase in Ti-Mo alloys upon quenching from the beta transus. According to the phase stability map, Ti-10.02Mo is located between the martensitic and the ϖ phase boundary lines, indicating that it will form β+α"+ω upon quenching above the beta transus. Ti10.83Mo is between the slip line and the ω boundary line, meaning that after quenching the alloy will include β+ω. The Ti-12.89Mo alloy is situated in the β field, suggesting that the alloy will contain β phase only. The Ti-15.05Mo alloy is positioned in the β field, implying that it will comprise only β phase upon quenching from above the beta transus region. The calculated Mo equivalences, e/a ratios, bond order (Bo) and mean d-orbital energy level (Md) values are presented in Table I, while their positions are indicated on the Bo and Md stability map in Figure 1.
Elemental powders of CP-Ti and molybdenum were fabricated to produce ingots of 100 g each. A cold-press machine was employed to produce green compacts, which were melted in a water-cooled copper crucible with a tungsten electrode using a commercial arc
Table I
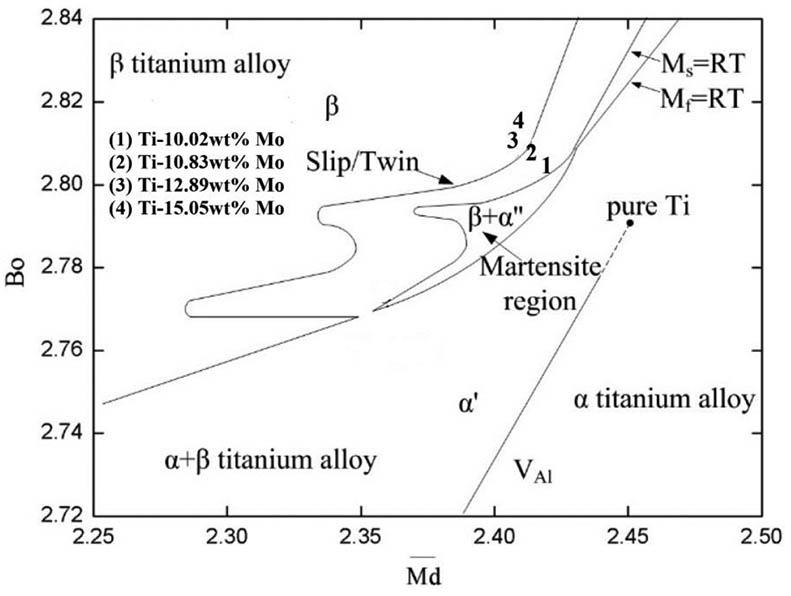
1—The Bo and Md stability phase map showing the positions of the designed alloys (Kuroda et al., 1998)
melting vacuum-pressure casting system. Prior to melting, the melting chambers were evacuated and purged with argon. The ingots were re-melted three times to ensure chemical homogeneity. The as-cast ingots were solution treated at a temperature of 1100ºC for an hour and then quenched in icy water.
Phase and microstructural analysis
The samples were prepared for microstructural analysis following standard metallographic techniques used for Ti and its alloys. The samples were etched with Kroll’s reagent (92 ml distilled water, 8 ml HNO3, and 2 ml HF) for 60 secongs. The microstructure was examined using an optical microscope (Leica CTR4000) and scanning electron microscope (Joel: JSM-6510). Phase analysis was done using a Philips PANalytical powder diffractometer configured with an X’Celerator detector. The patterns were run with Co-Kα radiation with a secondary monochromatic wavelength of λ = 1.89 Å. Phase identification was done using X’Pert HighScore software as well as available literature for comparison. Samples for EBSD analysis were electropolished using a Struers polishing machine. Electron backscatter diffraction (EBSD) scans were performed using a Zeiss Crossbeam 540 instrument operating at 25 kV and 10 nA to image the samples. The EBSD analyses were performed using an Oxford NordLys Max3 detector and Oxford Aztec analysis software.
Mechanical properties
Tensile test specimens with gauge dimensions of 3 × 4 × 10 mm were sectioned from the ingots using electrical discharge machining (EDM). Tensile tests were performed using the InstronTM 1342 apparatus at room temperature. The strain was measured using an extensometer. Three samples from each alloy were tested for mechanical properties (UTS, E, %e) and the average of the three was calculated.
Nominal compositions and calculated values of Moeq, e/a ratio, and Bo and Md
Cluster
X-ray diffraction was conducted to identify the constituent phases of the Ti-Mo alloys in the as-cast (Moshokoa, 2021) and solution treated conditions. The XRD patterns are presented in Figure 2. The diffreactogram of Ti-10.02Mo (Figure 2a) indicates high volume fractions of orthorhombic martensite (α" peaks) and low volume fractions of the bcc phase (β peaks) in the as-cast condition and after solution treatment. The highest peak (i.e., α") was found to be 2θ = 49º. The Ti-10.83Mo alloy (Figure 2b) shows higher intensity peaks of the α" phase and few peaks of bcc β phase in the as-cast condition. After solution treatment, there was transformation of α" into β phase at 2θ = 68º and 85º. The higher volume fraction peaks
of α" phase may be due to the martensitic start (Ms) temperature, which is above room temperature during casting and quenching and the Mo composition being too low to supress the Ms temperature. The Ti-12.89Mo alloy (Figure 2c) shows a lower volume fraction of the orthorhombic martensitic α" phase than Ti-10.02Mo and Ti-10.83Mo in the as-cast condition. The β phase peaks are more prominent after solution treatment, with a single peak of α" present at 2θ = 75º. The highest peak is that of bcc β phase at 2θ = 46º. The paucity of α" peaks in the as-cast condition and the single peak after solution treatment may be attributed to the decrease in the Ms temperature to close to room temperature. Figure 2d illustrates equal volume fractions of orthorhombic martensitic α" phase and bcc β phase in the as-cast condition. After solution treatment, the XRD pattern shows bcc β phase peaks only, with the highest peak
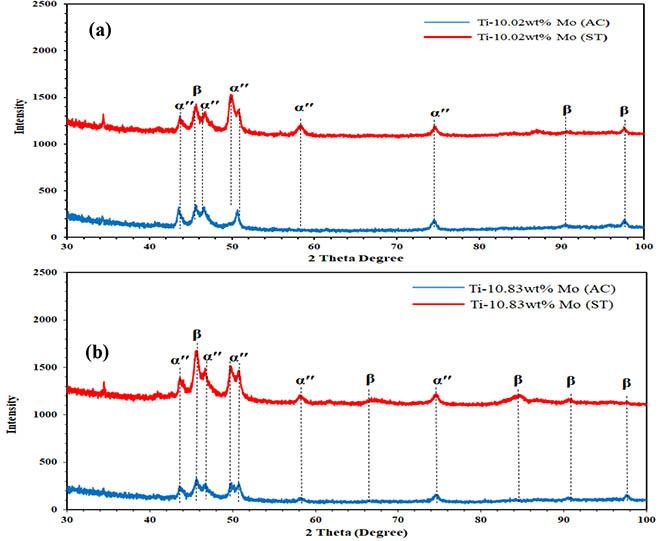
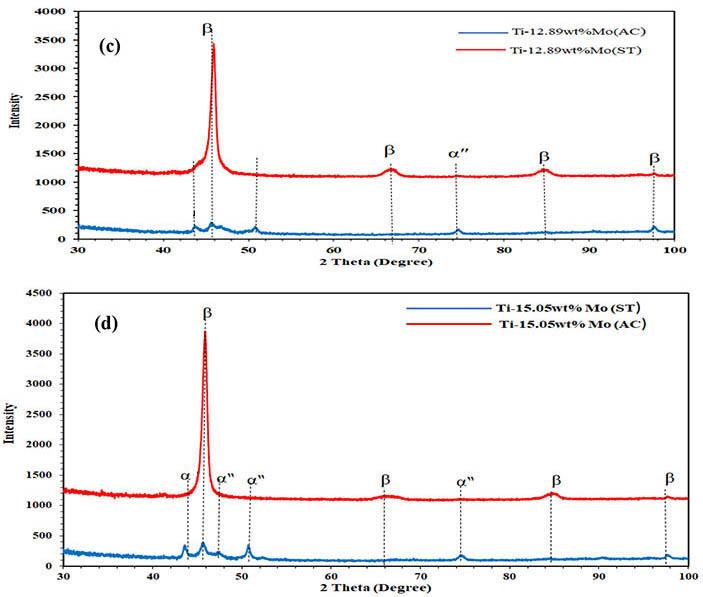
at around 2θ = 46º. The significant decrease in the orthorhombic martensitic peaks in the as-cast condition is attributed to the significant decrease in the Ms temperature, and the presence of the β phase peaks only after solution treatment is due to the Ms temperature being at room temperature during quenching and the molybdenum content being high enough to supress the α" phase. The ω phase was below the detection limit in all of the samples.
The XRD results for Ti-10.02Mo in the as-cast condition are consistent with the results reported by Oliveira and Guastaldi (2008) but different from those reported by Bania (1994), who stated that the β phase is retained at a Mo content of 10 wt%. The XRD results for Ti-15.05Mo alloy are also inconsistent with the results reported by Martins et al. (2011).
None of the as-cast Ti-Mo alloys are in agreement with the experimental results reported by Chen et al. (2006), Ho, Ju, and Lin (1999), and Davis, Flower, and West (1979). The XRD spectrum for as-cast Ti-12.89Mo is quite different from results reported by Oliveira and Guastaldi (2009) and Ho, Ju, and Lin (1999) where an α" peak is found at 2θ = 76º. The XRD results of the solution-treated Ti-10.02Mo and Ti-15.05Mo alloys are in agreement with the results reported by Cardoso et al. (2014) and Wang et al. (2016).
Zhao et al. (2012) also reported the presence of β phase in Ti15Mo. The phase constituents of all the designed alloys in the as-cast condition differ from the theoretical results in Table I and Figure 1. The results of the solution-treated Ti-10.02Mo, Ti-10.83Mo, and Ti-12.89Mo also differ from the theoretical results. However, solution-treated Ti-15.05Mo agrees with all the theoretical results. The Mo equivalence and the e/a ratio predict that the β phase will be retained after quenching above the β transus temperature without the precipitation of the secondary phases. The average Bo and Md stability map predicts that Ti-10.02Mo and Ti-10.83Mo will exhibit β, α", and ω phases upon quenching from above the β transus temperature, whereas Ti-12.89Mo and Ti-15.05Mo are predicted to form only the β phase.
Figure 3 depicts the optical micrographs of the alloys in the as-cast and solution-treated conditions. Ti-10.02Mo consists of equiaxed β grains and sub-grain boundaries in both the as-cast and solutiontreated conditions (Figure 3a and 3b). The Ti-10.83Mo alloy contains β equiaxed grains with fewer sub-grain boundaries than Ti-10.02Mo in the as-cast condition. After solution treatment, the alloy consists of β equiaxed grains only. As-cast Ti-12.89Mo has a similar structure to Ti-10.83Mo, although with a lower volume fraction of sub-grain boundaries. The solution-treated microstructure is similar to Ti-10.83Mo. The Ti-15.05Mo alloy in the as-cast condition is comparable to Ti-10.83Mo and Ti-12.89Mo alloys, with a significant decrease in the sub-grain boundaries. The solution-treated micrographs show only β equiaxed grains.
The significance reduction in the sub-grain boundaries with increasing Mo content in the as-cast alloys may be due to a decreasing s Ms temperature. The presence of a martensitic phase is also reported in other studies as evidence for martensitic transformation from β to α" phase (Mantani, 2006; Ho, 2008). The exceptional suppression of α" in Ti-10.83Mo, Ti-12.89Mo, and Ti15.05Mo after solution treatment shows that the Ms temperature is below room temperature during quenching.
The microstructures obtained for all the alloys are quite different from those reported by Chen et al. (2006) and Ho, Ju, and Lin (1999). However, as-cast Ti-10.02Mo alloy is in agreement with the findings of Chen et al. (2006), Moshokoa et al. (2019), and Raganya
et al. (2021). The presence of a martensitic phase is also reported in other studies as evidence for a martensitic transformation from a β to an α"phase (Mantani, 2006). The Ti-10.02Mo (ST) alloys are in agreement with Wang et al. (2016) but differ from the findings of Cardoso et al. (2014). However, the Ti-15.05Mo (ST) alloy is consistent with experimental results reported by Zhao et al. (2012), Cardoso et al. (2014), and Wang et al. (2016). Due to the paucity of work reported on solution-treated Ti-10.83Mo and Ti-12.89Mo, it is challenging to compare the experimental results with those reported in the literature.
The optical micrographs of all the designed alloys in as-cast conditions are in contrast with the theoretical results predicted by the Mo equivalence, e/a ratio, and the d-electron methods. The Ti-10.02Mo and Ti-10.83Mo alloys after solution treatment are not consistent with the theoretical results, especially the average Bo and Md stability map, whereas micrographs of the solution-treated Ti-12.89Mo and Ti-15.05Mo alloys are in agreement with the theoretical results predicted by the β stabilizing method.
The EBSD technique was utilized to further characterize the phase constituents and microstructures of the alloys. The EBSD inverse
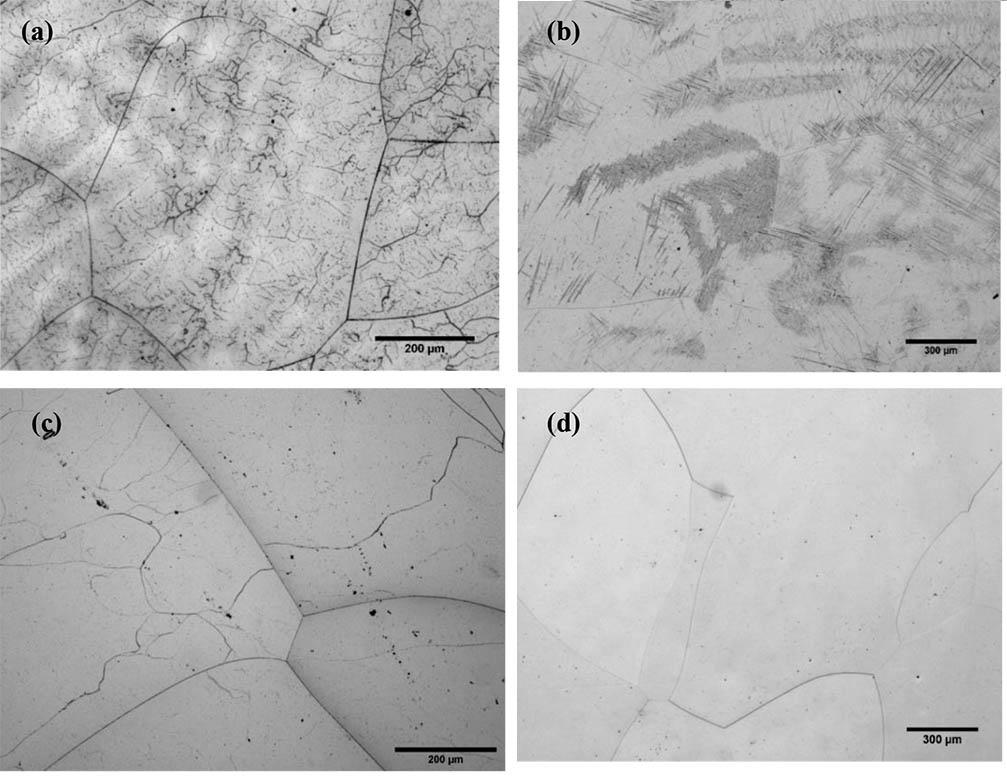
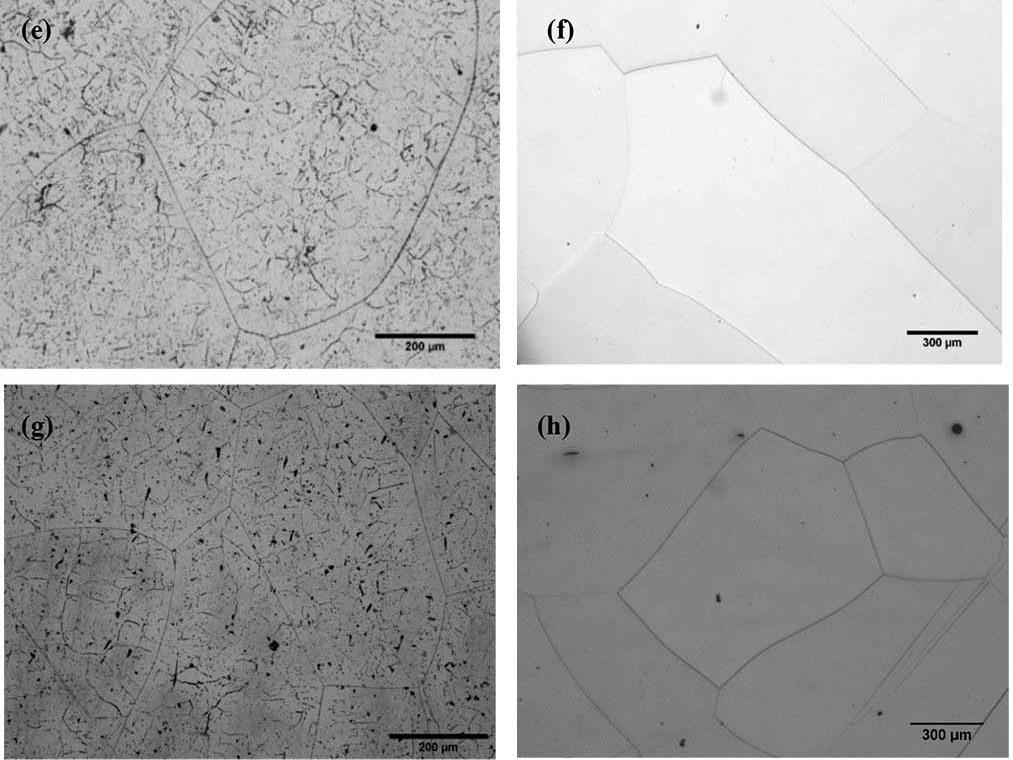
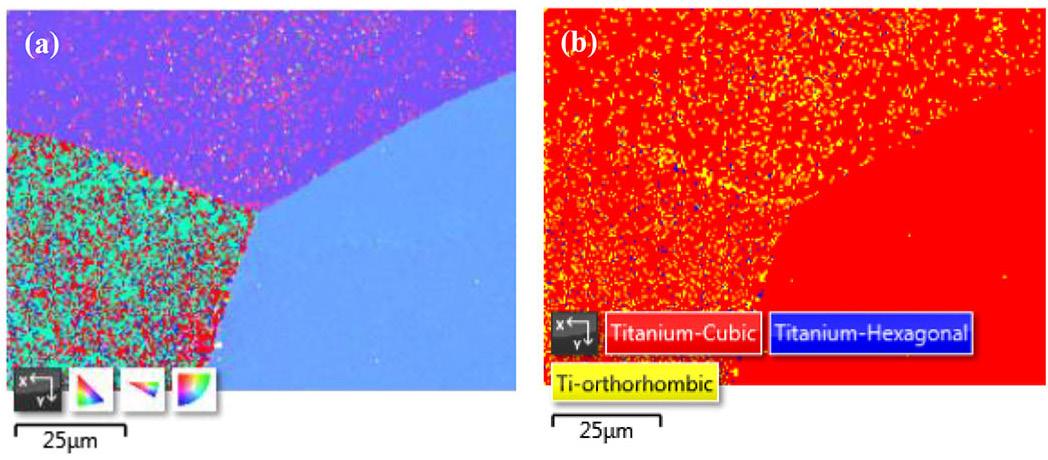
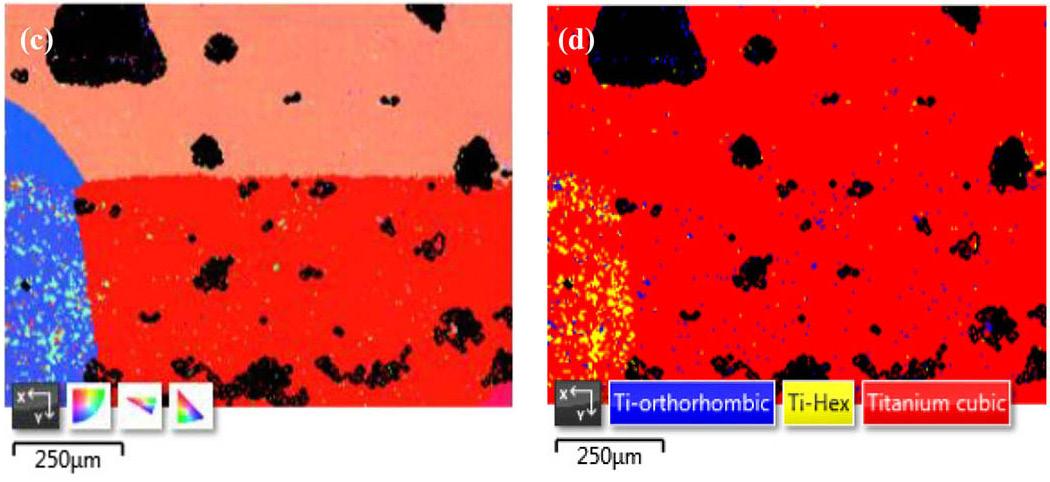
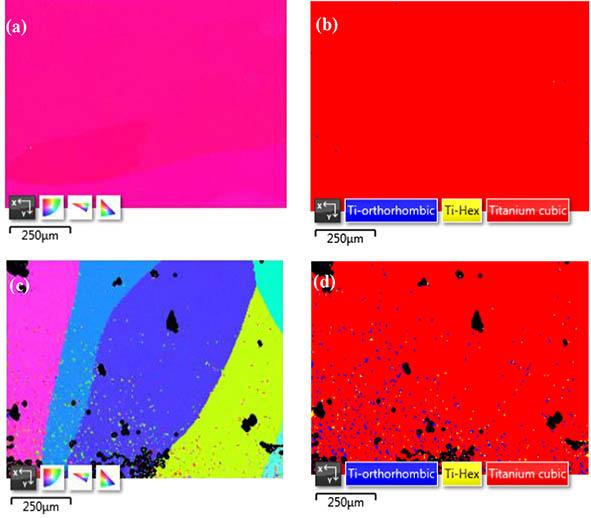
pole figures (IPFs) and phase maps of the as-cast and solutiontreated alloys are presented in Figures 4−7. The IPF maps at different orientations show the grain boundaries and small grains of different colours within the large grains. The particles in as-cast Ti10.02Mo and Ti-15.05Mo are identified as bcc β phase as the matrix in a red colour, orthorhombic martensitic α" represented in a yellow colour, and the ω phase illustrated in a blue colour, while the Ti-
10.83Mo and Ti-12.89Mo alloys were identified as bcc β phase as the matrix (red), orthorhombic martensitic α" (blue), and the ω phase (yellow). The particles after solution treatment for all the alloys were distinguished as β phase as the matrix (red), orthorhombic martensitic α" (blue), and the ω phase (yellow) colour.
The Ti-10.02Mo alloy in the as-cast condition (Figure 4b) exhibited a high volume fraction of the ω phase and orthorhombic
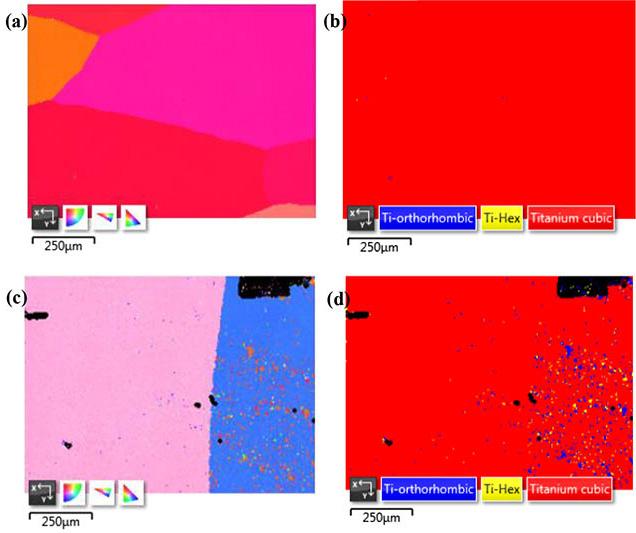
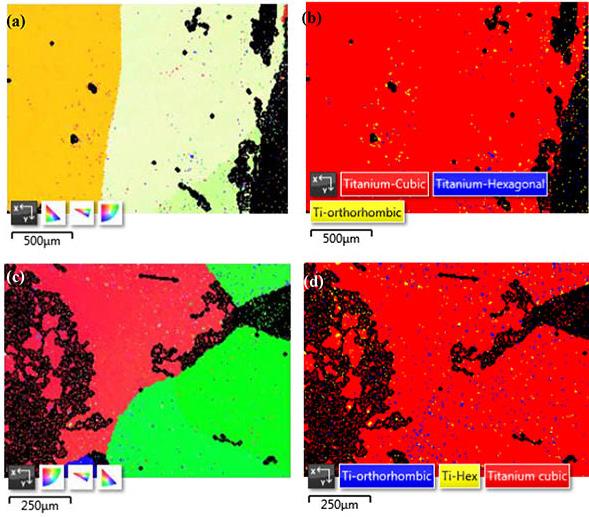
martensitic precipitate. After solution treatment the fraction of orthorhombic martensitic precipitates decreased while the ω precipitates increased, as shown in Figure 4d. Ti-10.83Mo and Ti12.89Mo in the as-cast condition (Figures 5b and 6b) show minor ω and α" precipitates distributed unevenly through the grains. The amount of the precipitates was too low to distinguish them clearly, and this may be caused by segregation during cooling. After solution treatment, the alloy shows a high volume fraction of α" precipitates and a low volume fraction of ω precipitates (Figures 5d and 6d respectively). The volume fractions of both the ω and
martensitic phase in Ti-10.02Mo and Ti-12.89Mo alloys increased significantly in the as-cast condition and after solution treatment. The as-cast Ti-15.05Mo alloy (Figure 7b) shows lower contents of α" and ω precipitates compared to Ti-10.02Mo alloy. After solution treatment the volume fractions of the ω and α" precipitates increased significantly compared to the other alloys (Figure 7d. The orthorhombic martensitic phase and the ω phase were heterogeneously distributed along the β equiaxed grains in all the alloys. It was difficult to distinguish the secondary phases in some of the grains, and this may be attributed to segregation.
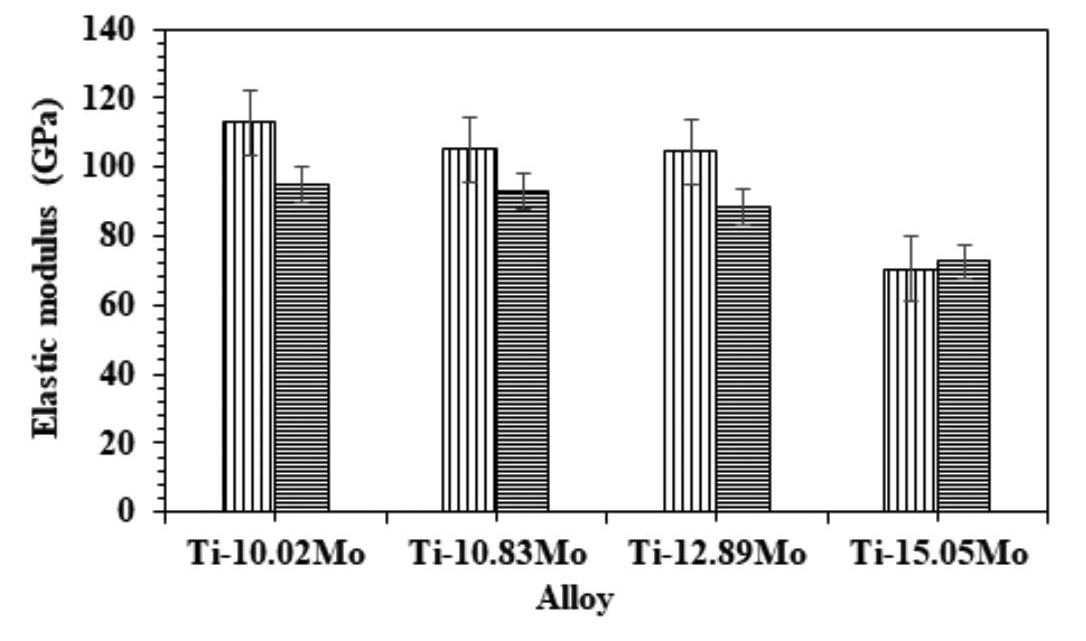
The occurrence of the ω phase in EBSD maps is not widely reported in the literature, especially in as-cast and solution-treated binary Ti-Mo alloys, therefore it was challenging to compare these experimental results with those of previous work. Further research is required to quantify the use of this technique in characterizing the ω phase.
Tensile properties
Elastic modulus
The elastic moduli of the alloys are illustrated in Figure 8. The Ti10.02Mo alloy in the as-cast condition exhibited the highest elastic modulus, and after solution treatment the elastic modulus decreased significantly. The high elastic modulus in the as-cast alloy may be attributed to the presence of ω precipitates as observed in the EBSD map (Figure 4b). The elastic moduli of as-cast Ti-10.83Mo and Ti-12.89Mo were found to be higher than the values after solution treatment. This may be due to the higher volume fraction of the ω phase, although ω was not detected, due to segregation during cooling. The decrease in the elastic modulus as the Mo content increased is due to the stability of the β phase and the suppression of the orthorhombic martensitic α"phase, which is evident in the XRD spectra and optical micrographs. The elastic modulus of Ti15.05Mo increases after solution treatment. This may be attributed to the substantial increase in the volume fraction of ω precipitates, as seen in the EBSD phase map in Figure 7d. Lee and Ju (2002) reported that the phases influence the elastic modulus in the order Eω > Eα' > Eα" > Eβ. It is noted that the ω phase has a higher elastic modulus than the β and martensitic α"phases. Likewise, it is well
known that the ω phase has a significant effect on the mechanical properties of Ti alloys, and it is likely to increase the elastic modulus (Akahori, Niinomi, and Fukui, 2005). Graft, Levinson, and Rostoker (1957) also indicated that the ω phase had an unusually high elastic modulus. Hao et al. (2006) also reported that the ω phase is deleterious to the mechanical properties as it increases the elastic modulus.
The elastic moduli of the as-cast Ti-Mo alloys are lower than for commercially available Ti6Al4V as reported by Niinomi (2008). It was difficult to compare the findings of the present study with the values for Ti-Mo alloys reported by Ho, Ju, and Lin (1999) in as-cast conditions and Ti-Sn alloys because they reported on the bending modulus only, whereas the elastic modulus results in this work were obtained from tensile tests. The elastic moduli of the alloys after solution treatment were lower than commercially available Ti6Al4V alloy as reported by Niinomi (1986). The elastic moduli of the Ti10.02Mo and Ti-15.05Mo alloys are lower than those reported by Zhou and Luo (2011a), Cardoso et al. (2014), and Wang et al. (2016) in the solution-treated condition.
The ultimate tensile strength and elongation data are presented in Table II. As-cast Ti-10.02Mo exhibited a higher UTS after solution treatment. This may be due to the decrease in the ω phase, s shown in Figure 4. The elongation increased significantly after solution treatment, indicating that the as-cast alloy was too brittle. The results reported by Wang et al. (2016) for Ti-10.02Mo alloy after solution treatment show an enhanced UTS (756.17 MPa) and percentage elongation (24.04%) compared to the studied alloy. The UTS of Ti-10.83Mo decreased after solution treatment but the elongation increased significantly. The UTS of solution-treated Ti12.89Mo was lower than in the as-cast alloy. The elongation of the Ti-12.89Mo alloy in the as-cast condition was significantly lower, indicating that the alloy was too brittle, whereas the Ti-12.89Mo alloy after solution treatment displayed a significantly higher elongation, which indicates that the alloy was more ductile. The UTS and elongation of Ti-15.05Mo alloy in the as-cast condition werelower, and increased significantly after solution treatment. The increase in the UTS may be attributed to the increase in the ω precipitates, as seen in the EBSD phase map in Figure 7d. The elongation indicates improved ductility after solution treatment. The UTS and elongation of the Ti-10.02Mo and Ti-15.05Mo alloys after solution treatment were found to be lower than the values reported by Wang et al. (2016), but higher than reported by Zhou and Luo (2011b). The elongation reported by Zhou and Luo was higher
Tensile properties of as-cast (AC) and solution treated (ST) alloys
Ti-10Mo (Wang et al., 2016) - 756.17 -
Ti-15Mo (Wang et al., 2016)
Ti-15Mo (Zhou et al., 2012)
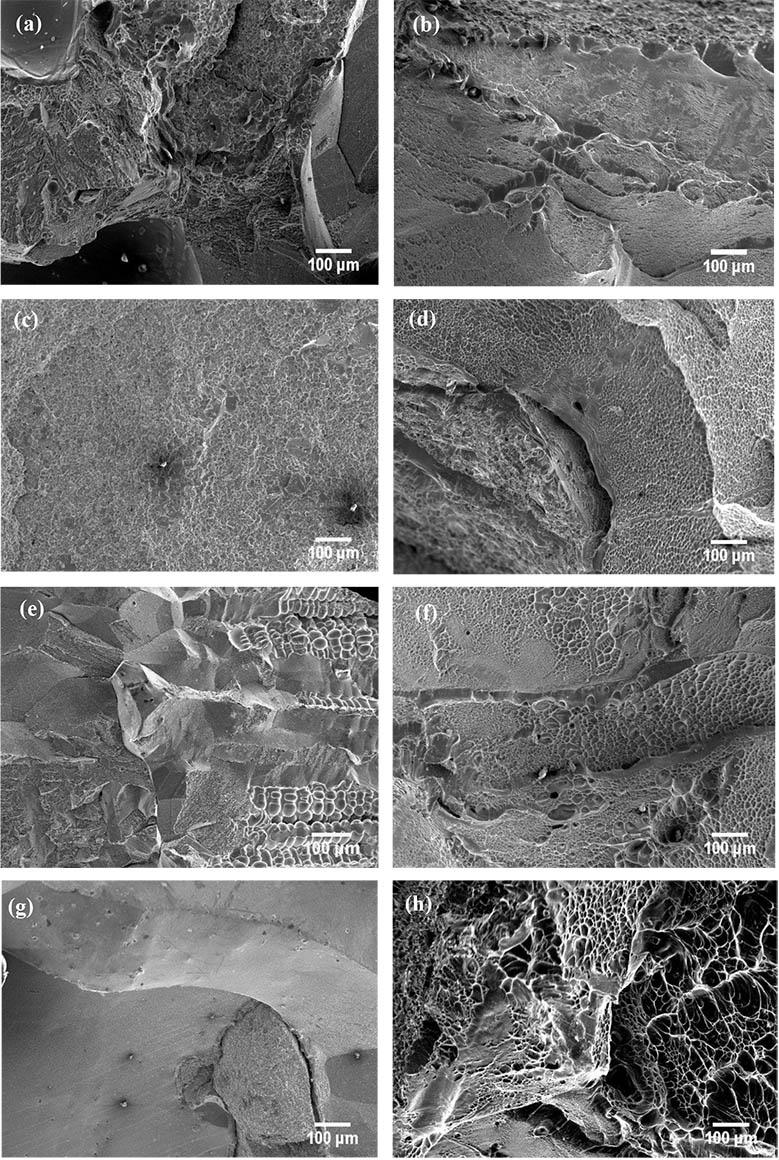
than that of the designed alloy, though. In general, Ti-10.83Mo showed moderate strength and high elongation, which is desirable for biomedical applications. However, the elastic modulus was still higher than that of human bone.
Figure 9 displays SEM micrographs of the fracture surfaces of the alloys after tensile testing. Ti-10.02Mo alloy in the as-cast condition exhibits both dimples and cleavage facets, indicating that the alloy undergoes both brittle and ductile fracture. However, the pronounced cleavage facets show that brittle fracture is the dominant mode of failure. Solution-treated Ti-10.02Mo alloy shows numerous smooth cleavage facets on the fractured surface, which is an indication of a typical brittle fracture. Ti-10.83Mo alloy in the as-cast condition shows small dimples without cleavage facets, implying ductile fracture. After solution treatment, the fracture surface exhibits small dimples with subordinate cleavage facets, indicating high ductility and ductile fracture. Likewise, as-cast Ti-
12.89Mo shows more cleavage features with lesser dimpling. After solution treatment, the fracture surface consists of medium dimples with cleavage facets, indicating both ductile and brittle fracture, together with dendrites that may have formed due to casting porosity. Ti-15.05Mo alloy shows dominant cleavage features with a small amount of dimple features. After solution treatment, the fracture surface is characterized by large dimples and fewer cleavage facets, indicating a dustile fracture even though the ductility of the alloy has decreased. The fracture surfaces of the Ti-10.02Mo and Ti-15.05Mo alloys differ from those obtained by Wang et al., (2016), who reported that the alloys were characterized by ductile fracture only.
The characteristics of the as-cast alloys obtained by XRD, optical microscopy, and EBSD were found to be inconsistent with the results predicted using β stabilizing predictions. The optical
microscopy results for solution-treated Ti-10.83Mo, Ti-12.89Mo, and Ti-15.05Mo were in agreement with the theoretical results, but the Ti-10.02Mo results were inconsistent. The XRD results for the solution-treated alloys were not in agreement with the theoretical results, except for Ti-15.05Mo. The XRD patterns of all the alloys in the as-cast condition indicated the presence of both orthorhombic martensitic and bcc β phase, with increasing transformation of α" to β after solution treatment. Ti-15.05Mo alloy was able to retain the β phase. The ω phase was not detected by XRD in any of the alloys, either as-cast or solution-treated, due to the detection limit.
The optical micrographs of all the designed alloys in the ascast condition showed β equiaxed grains sub-grains of different sizes. The solution-treated Ti-10.83, Ti-12.89Mo, and Ti-15.05Mo alloys comprised only β equiaxed grains, whereas the Ti-10.02Mo alloy showed needle like structures in addition to the β equiaxed grains. The EBSD phase maps of all the designed alloys showed an increase in the ω and orthorhombic precipitates after solution treatment. The elastic moduli and UTS of all the designed alloys decreased significantly, except for Ti-15.05Mo, for which both the elastic modulus and UTS increased slightly after solution treatment. The ductility of all the designed alloys improved significantly after solution treatment, and this was also evident in the SEM micrographs of the fracture surfaces. These alloys show promise in advancing dental implant materials. However, further testing on their biocompatibility, mechanical properties, and bio/ tribocorrosion resistance is required to verify their suitability for implant applications.
We acknowledge NRF Thuthuka (Grant No: 115859) for funding this project, the CSIR for laboratory facilities, the casting team at Mintek, and the University of Pretoria laboratory and CSIR teams for assisting with the work. We also thank our supervisors, Dr Babatunde Abiodun Obadele, Ms Lerato Raganya, Professor Ronald Machaka, and Professor Elizabeth Makhatha for their supervision.
Author contribution
NAM: Conceptualization, characterization of the samples, manuscript writing, editing of the manuscript.
R: Conceptualization, characterization, and editing.
RM: Conceptualization and editing.
MEM: Conceptualization and editing.
BAO: Supervision, conceptualization, editing and final checks or editing.
References
Akahori, Y., Niinomi, M., Fukui, H., Ogawa, M., and Toda, H. 2005. Improvement in fatigue characteristics of newly developed beta type titanium alloy for biomedical applications by thermomechanical treatments’. Material Science and Engineering C, vol. 25, no. 3, pp. 248–254. doi: 10.1016/j.msec.2004.12.007
Bania, P.J. 1994. Beta titanium alloys and their role in the titanium industry. JOM, vol. 46, pp. 16–19.
Cardoso, F.F., Ferrandini, P.L., Lopes, E.S.N., Cremasco, A., and Caram, R. 2014. Ti–Mo alloys employed as biomaterials: Effects of composition and aging heat treatment on microstructure and mechanical behavior. Journal of the Mechanical Behavior of Biomedical Materials, vol. 32, pp. 31–38. doi: 10.1016/j. jmbbm.2013.11.021
Chen, Y-Y., Xu, L-J., Liu, Z-G., Kong, F-T., and Chen, Z. 2006. Microstructures and properties of titanium alloys Ti-Mo for dental use. Transactions of Nonferrous Metals Society of China, vol 16, pp. 824–828. doi: https://doi.org/10.1016/S10036326(06)60308-7
Davis, R., Flower, H.M., and West, D.R.F. 1979. Martensitic transformations in Ti-Mo alloys. Journal of Materials Science, vol. 14, no. 3, pp. 712–722. doi: 10.1007/BF00772735
Engh, C.A. and Bobyn, J.D. 1988. The influence of stem size and extent of porous coating on femoral bone resorption after primary cementless hip arthroplasty. Clinical Orthopaedics and Related Research, vol. 231, pp. 7–28.
Geetha, M., Singh, A.K., Asokamani, R., and Gogia, A.K. 2009, Ti based biomaterials, the ultimate choice for orthopaedic implants–a review. Progress in Materials Science, vol. 54, no. 3, pp. 397–425.
Gepreel, M.A-H. and Niinomi. M. 2013. Biocompatibility of Tialloys for long-term implantation, Journal of the Mechanical Behavior of Biomedical Materials, vol. 20, pp. 407–415. doi: 10.1016/j.jmbbm.2012.11.014
Graft. W.H., Levinson, D.W., and Rostoker, W. 1957. The influence of alloying on the elastic modulus of titanium alloys. Transactions of Nonferrous Metals Society of China.
Hao, Y.L., Li, S.J., Sun, S.Y., and Yang, R. 2006. Effect of Zr and Sn on Young’s modulus and superelasticity of Ti–Nb-based alloys. Material Science and Engineering A, vol. 441, no, 1–2, pp. 112–118. doi: 10.1016/j.msea.2006.09.051
Ho, W. 2008. Effect of omega phase on mechanical properties of Ti-Mo alloys for biomedical applications. Journal of Medical and Biological Engineering, vol. 28, no. 1, p. 47.
Ho, W.F., Ju, C.P., and Lin, J.HC. 1999 Structure and properties of cast binary Ti-Mo alloys. Biomaterials, vol. 20, no. 22, pp. 2115–2122.
Ikehata, H., Nagasako, N., Furuta, T., Fukumoto, A., Miwa, K., and Saito, T. 2004. First-principles calculations for development of low elastic modulus Ti alloys. Physical Review B, vol. 70, no. 17, p. 174113. https://journals.aps.org/prb/abstract/10.1103/ PhysRevB.70.174113
Keda, Y.M. , Krjukova, I,V., Ilovalskala, I.A., Morozova, M.A., Gofanova, O.V., Babarina, M.V., Marova, E.I., Pankov, Y.A., and Kandror, V.I. 2002, Antibodies to pituitary surface antigens during various pituitary disease states. Journal of Endocrinology, vol. 175, no. 2, pp. 417–423.
Kuroda, D., Niinomi, M., Morinaga, M., Kato, Y., and Yashiro, T. 1998. Design and mechanical properties of new β type titanium alloys for implant materials. Materials Science and Engineering A, vol, 243, no. 1-2, pp. 244–249.
Lee, C.M., Ju, C.P., and Chern Lin, J.H. 2002. Structureproperty relationship of cast Ti-Nb alloys. Journal of Oral Rehabilitation, vol. 29, no. 4, pp. 314–322. doi: 10.1046/j.13652842.2002.00825.x
Long, M. and Rack, H.J. 1998. Titanium alloys in total joint replacement — a materials science perspective. Biomaterials, vol. , no. 18, pp. 1621–1639.
Lu, J-W., Zhao, Y-Q., Ge, P., and Niu, H-Z. 2013. Microstructure and beta grain growth behavior of Ti–Mo alloys solution treated. Materials Characterization, vol. 84, no. 96, pp. 105–111. doi: 10.1016/j.matchar.2013.07.014
Mantani, Y. and Tajima, M. 2006. Phase transformation of quenched α" martensite by aging in Ti–Nb alloys. Materials Science and Engineering A, vol. 438–440, pp. 315–319. doi: 10.1016/j. msea.2006.02.180
Martins, J.R.S. Nogueira, R.A., de Araújo, R.O., Donato, T.A.G., Arana-Chavez, V.E., Claro, A.P.R.A., Moraes, J.C.S., Buzalaf, M.A.R., and Grandini, C.R. 2011. Preparation and characterization of Ti-15Mo alloy used as biomaterial. Materials Research, vol. 14, no. 1, pp. 107–112. doi: 10.1590/S151614392011005000013
Moshokoa, N., Raganya, L., Obadele, B., Olubambi, P., and Machaka, R. 2019. Effects of Mo content on the microstructural and mechanical properties of as-cast Ti-Mo alloys. IOP Conference Series: Materials Science and Engineering, vol. 655, no. 1, p. 012015.
Moshokoa, N.A., Raganya, M.L., Machaka, R., Makhatha, M.E., and Obadele, B.A. 2021. The effect of molybdenum content on the microstructural evolution and tensile properties of as-cast TiMo alloys. Materials Today Communications, vol. 27, p.102347.
Navarro, M., Michiardi, A., Castaño, O., and Planell, J,A, 2008. Biomaterials in orthopaedics. Journal of the Royal Society Interface, vol. 5, no. 27, pp. 1137–1158. doi: 10.1098/ rsif.2008.0151
Niinomi, M. 2008. Mechanical biocompatibilities of titanium alloys for biomedical applications. Journal of the Mechanical Behavior of Biomedical Materials, vol. 1, no. 1, pp. 30–42. doi: 10.1016/j. jmbbm.2007.07.001
Niinomi, M., Adachi,. M., and Kobayashi, T. 1986. Evaluation of toughness in 7075 alloy by R curve method. Journal of Japan Institute of Light Metals, vol. 36, no. 4, pp. 215–222. doi: 10.2464/jilm.36.215w
Okazaki, Y. 1996. Corrosion resistance and corrosion fatigue strength of new titanium alloys for medical implants without V and Al. Materials Science and Engineering A, vol. 213, no. 1–2, pp. 138–147.
Oliveira, N.T.C. and Guastaldi, A.C. 2008. Electrochemical behavior
of Ti-Mo alloys applied as biomaterial. Corrosion Science, vol. 50, no. 4, pp. 938–945. doi: 10.1016/j.corsci.2007.09.009
Oliveira, N.T.C. and Guastaldi, A.C. 2009. Electrochemical stability and corrosion resistance of Ti–Mo alloys for biomedical applications. Acta Biomaterialia, vol. 5, no. 1, pp. 399–405. doi: 10.1016/j.actbio.2008.07.010
Polmear, I.J. 2006. Light Alloys: From Traditional Alloys to Nanocrystals. 4th edn. Butterworth-Heinemann. 421 pp. Raganya, L., Moshokoa, N., Obadele, B.A., Olubambi, P.A., and Machaka, R. 2021. Investigation .of the tensile properties of heat treated Ti-Mo alloys. Materials Today: Proceedings, vol. 38, pp.1044–1048.
Sidambe, A.T. 2014. Biocompatibility of advanced manufactured titanium implants—A review. Materials, vol. 7, no. 12. doi: 10.3390/ma7128168
Wang, C.H., Yang, C.D., Liu, M., Li, X., Hu, P.F., Russell, A.M., and Cao, G.H. 2016. Martensitic microstructures and mechanical properties of as-quenched metastable β-type Ti–Mo alloys. Journal of Materials Science, vol. 51, pp. 6886–6896. doi: 10.1007/s10853-016-9976-6
Wang, X., Zhang, L., Guo, Z., JIang, Y., Tao, X., and Liu, L. 2016. Study of low-modulus biomedical β Ti-Nb-Zr alloys based on single-crystal elastic constants modeling. Journal of the Mechanical Behavior of Biomedical Materials, vol 62, pp. 310–318. doi: 10.1016/j.jmbbm.2016.04.040
Welsch, G., Boyse, R., and Collings, E.W. 1993. Materials Properties Handbook: Titanium Alloys. ASM International, Materials Park, OH.
Zhao, X., Niinomi, M., Nakai, M., and Hieda, J. 2012. Beta type Ti–Mo alloys with changeable Young’s modulus for spinal fixation applications. Acta Biomaterialia, vol. 8, no. 5, pp. 1990–1997. doi: 10.1016/j.actbio.2012.02.004
Zhou, Y. and Luo, D. 2011a. Corrosion behavior of Ti–Mo alloys cold rolled and heat treated, Journal of Alloys and Compounds, vol. 509, no. 21, pp. 6267–6272. doi: 10.1016/j. jallcom.2011.03.045
Zhou, Y. and Luo, D. 2011b. Microstructures and mechanical properties of Ti–Mo alloys cold-rolled and heat treated. Materials Characterization, vol. 62, no. 10, pp. 931–937. doi: 10.1016/j.matchar.2011.07.010 u
Affiliation:
1Materials Modelling Centre, University of Limpopo, South Africa
2Advanced Materials Division, Mintek, Randburg, South Africa
Correspondence to: H.R.Chauke
Email: hasani.chauke@ul.ac.za
Dates:
Received: 7 Sept. 2020
Revised: 5 Aug. 2022
Accepted: Feb. 2023
Published: May 2024
How to cite: Ledwaba, T.M., Diale, R.G., Ngoepe, P.E., and Chauke, H.R. 2024. The effect of vanadium on the magnetic and mechanical properties of B2 FeCo alloy: a DFT approach. Journal of the Southern African Institute of Mining and Metallurgy, vol. 124, no. 5. pp. 263–268
DOI ID:
http://dx.doi.org/10.17159/24119717/1368/2024
by T.M. Ledwaba1, R.G. Diale2, P.E. Ngoepe1, and H.R. Chauke1
Abstract
FeCo alloys play an important role in soft magnetic materials with a wide range of technological applications due to their high saturation magnetization and Curie temperature. However, these alloys have low ductility at room temperature. The ductility can be improved by the ternary addition of elements such as V. A density functional theory supercell approach was used to generate B2 Fe50Co50-xVx (0 ≤ x ≤ 50) structures and the properties were evaluated at different atomic percentage compositions to determine the ductility at room temperature. The structures were fully optimized to obtain better equilibrium ground-state properties such as lattice parameters and thermodynamic properties for both binary and ternary systems. The stability of Fe50Co50xVx was evaluated from the heats of formation, elastic properties, and phonon dispersion curves. Furthermore, magnetic strength was evaluated from magnetic moments. It was found that all structures are thermodynamically stable due to the negative heats of formation. The calculated Pugh’s ratio and Poisson’s ratio confirm that alloying with V effectively improved the ductility. It was also found that Fe50Co50-xVx showed a positive shear modulus for the entire concentration range investigated, in agreement with phonon dispersion curves. The ternary addition of V to the FeCo system resulted in reduced magnetic strength due to a decrease in magnetic moments. These findings reveal that B2 FeCo-V alloys can be used as components and actuators for the automotive industry.
Keywords
FeCo alloy, magnetic properties, phonons, ductility
Introduction
FeCo alloys are relatively soft materials that are used in various engineering applications owing to their superior properties, particularly their high saturation magnetization (Liu and Morisako, 2008). FeCo possesses improved properties such as high mechanical strength and soft magnetic character, with high permeability, a high Curie temperature, high tensile strength, and the highest saturation magnetization of all known magnetic alloys, which are required for advanced power applications (Sides, Kassouf, and Huang, 2019). However, B2 FeCo suffers from low ductility at room temperature, which makes this alloy difficult to process (Sourmail, 2005). Furthermore, the current FeCo alloys cannot withstand temperatures above the transformation temperature for lenghty periods. which limits their use in the aerospace industry (Horwath. Turgut, and Fingers, 2006). Due to their smooth magnetic characteristics at elevated temperatures, there is a long tradition of using FeCo alloys with ternary element additions as engineering materials.
Various attempts to improve the ductility of FeCo alloys through ternary additions have been reported, but most did not yield the required properties. However, Pd, V, Ti, Ta, and Cr have shown promise (Liu, 2011). Vanadium additions impart higher tensile strength and elongation at room temperature (Albaaji, 2017). By combining the soft magnetic properties of iron and hard magnetic properties of cobalt and vanadium, an optimal magnetic material could be developed. In a previous investigation (Ledwaba et al., 2021), density functional theory (DFT) was used together with cluster expansion to investigate the possible structures that can be formed in Fe-Co-V ternary alloys. It was found that VFeCo2 and VFe2Co (P4/mmm) are the most thermodynamically stable phases. The results also showed that vanadium prefers the Co site rather than the Fe site substitution, leading to improved ductility. In this investigation, the ternary alloying of FeCo with V was performed using the DFT approach to investigate the thermodynamic, mechanical, and magnetic stability. It was found that the addition of V to B2 FeCo resulted in improved thermodynamic and mechanical properties. Figure 1 shows the atomic arrangement of the investigated structures (B2 FeCo and FeCo-V).
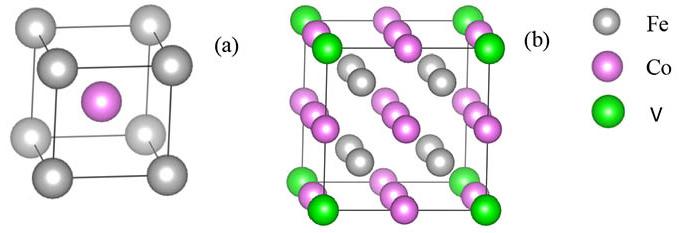
Methodology
The calculations were performed using the Vienna ab-initio simulation package (VASP) code based on DFT (Kresse and Hafner, 1993; Kresse and Furthmuller, 1996). The interaction between the core and the valence electrons was described using the projector augmented wave (PAW) method. The generalized gradient approximation (GGA) of the Perdew-Burke-Ernzerhof (PBE) exchange-correlation functional (Perdew, Burke, and Ernzerhof, 1996) was employed. An energy cut-off of 500 eV was used to converge the total energy of the structures. A k-spacing of 0.2 was used for FeCo and equivalent numbers of k-points were used for the supercell, following Monkhorst and Pack (1976). The calculations were carried out using a 2 × 2 × 2 supercell with 16 atoms. The substitutional search tool in VASP was used to substitute Co with V at different atomic percentage compositions. The elastic constants were calculated for a small strain of 0.005 for all structures. The phonon dispersion curves were calculated using PHONON code (Parlinski, Li, and Kawazoe, 1997) as implemented in Materials Design within the MedeA software platform.
Results and discussion
Structural and thermodynamic properties
Figure 2 depicts the equilibrium lattice constants for the binary Fe50Co50 and ternary Fe50Co50-xVx (0 ≤ x ≤50) alloys. It was found that the lattice constant of Fe50Co50 is 2.844 Å, which compares well with the experimental value of 2.843 Å (Materials Explorer, 2020), a difference of 0.035%. The lattice parameters were determined from fully relaxed structures; both the lattice geometry and ionic positions were fully optimized. It is clear that the equilibrium lattice parameter of Fe50Co50-xVx increases as the V content is increased. This is due to the large atomic radius of V (135 pm) compared to Co (125 pm). The thermodynamic stability of Fe50Co50-xVx is predicted from calculated heats of formation (∆Hf) using the following expression:
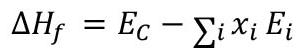
where EC is the calculated total energy of the compound and Ei is the calculated total energy of elements in the compound. For a structure to be thermodynamically stable, the heat of formation must have the lowest negative value (∆Hf < 0) – a positive value implies instability. Figure 3 presents the heats of formation for the B2 Fe50Co50-xVx systems for concentrations 0 ≤ x ≤ 50. The heat of formation for the binary B2 Fe50Co50 was found to be –0.057 eV per atom, which is in good agreement with an experimental value of –0.065 eV per atom obtained by Fu (2006), within 3%. As shown, the ∆Hf decreases as V content is increased, implying that the structure becomes thermodynamically stable with the addition of V.
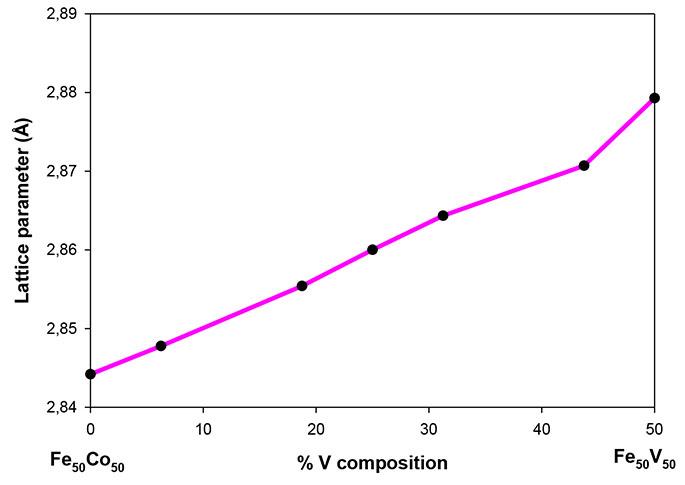
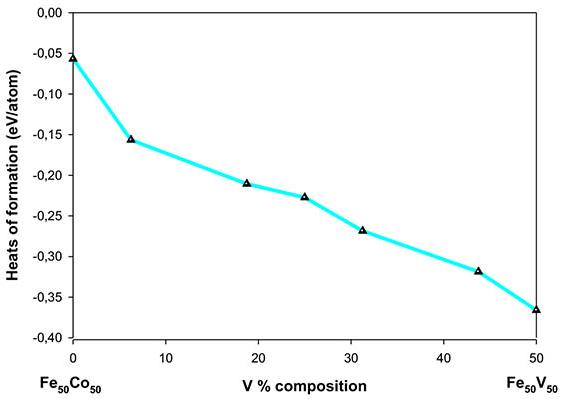
The elastic properties give important information about the mechanical stability of compounds. For the cubic symmetry B2 crystal structure of Fe50Co50-xVx, there are three independent elastic constants (C11, C12, and C44). The stability criterion for cubic crystals (Wang et al., 1993) is as follows:
where the shear modulus C' can be calculated as:
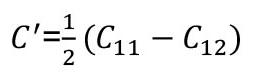
In Figure 4, the calculated elastic properties of the Fe50Co50xVx alloys where (0 ≤ x ≤50) are shown. The stability criterion for the elastic constants must be satisfied for the structure to be stable. A positive shear modulus, C´ shows that a crystal is mechanically stable; a negative C´ indicates instability. It is notable that the mechanical stability conditions are satisfied for the entire concentration range of Fe50Co50-xVx alloys where (0 ≤ x ≤ 50).
Figure 5a shows the variations in bulk, shear, and Young's moduli with atomic per cent V. The bulk modulus decreasees with increasing V concentration below 31 at.% and increases above this
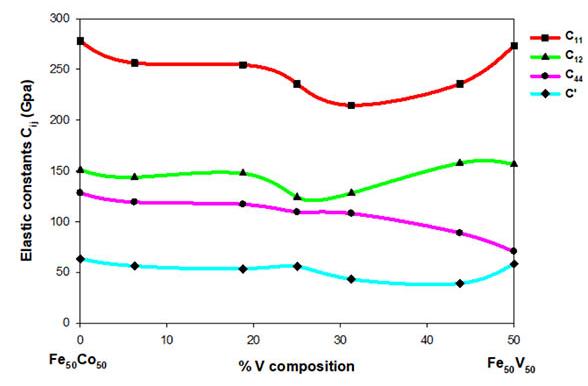
Figure 4—Elastic constants (GPa) versus atomic per cent V for Fe50Co50-xVx, where
value. This indicates that the compressibility of the Fe50Co50-xVx alloys is enhanced above 31 at.% V. Fe50Co43.75V6.25 appears to have the highest bulk modulus (184.96 GPa). The shear modulus and Young’s modulus decrease minimally with an increase in V concentration over the entire compositional range. Fe50V50 appears to be more compressible, as suggested by lowest shear modulus. Young modulus was calculated to check the rigidity of the material. The highest Young’s modulus is regarded as indicating high stiffness. It is noted that Fe50Co43.75V6.25 has the highest Young‘s modulus of all the compositions investigated.
To assess the ductility of the material with different atomic compositions of V, the Cauchy pressure, Poisson’s ratio, and B/G ratio (bulk modulus/shear modulus) were determined as shown in Figures 5b, 5c, and 5d, respectively. The Cauchy pressure of a cubic crystal is calculated as (C12-C44) for the (100) plane. A positive Cauchy pressure indicates an ionic character and ductile behaviour,
while a negative value indicates a weak covalent bond and brittle behaviour (Pettfor, 1992). As the concentration of V is increased, the Cauchy pressure values remain positive for the entire range (0 ≤ Xx ≤ 50), suggesting that the system is ductile at room temperature (see Figure 5b). Poisson’s ratio (σ) was also evaluated to confirm the ductility of the materials. Note that the structure is considered ductile when σ is greater than 0.26, otherwise brittle (Frantsevich and Voronov, 1983). As the content of V is increased, the σ values were found to be greater than 0.26 in the entire concentration range, indicaring a condition of ductility (Figure 5c).
Considering that the shear modulus characterizes the resistance to plastic deformation and the bulk modulus the resistance to fracture (Mayer et al., 2003) the Pugh ratio B/G was calculated and evaluated to determine the ductility and brittleness of the structures. The structures (see Figure 5d) were observed to be ductile since all the ratios were greater than the critical value of 1.75 (Pugh, 1954). Figure 6a shows the magnetic moments of the Fe50Co50-xVx alloys (0 ≤ x ≤ 50). The magnetic moment indicates the magnetic strength and orientation of a magnet. It is noted that the magnetic moment decreases at 6.25 at.% V. However, above 6.25 at.% V the reduction in magnetic moments is minimal. This suggests that the addition of V on Fe50Co50 slightly reduces the magnetic moment.
To investigate the vibrational stability of the B2 Fe50Co50-xVx alloys, we determined the phonon dispersion curves presented in Figure 7. The calculations were carried out using the PHONON code (Parlinski, Li, and Kawazoe, 1997). A structure is considered vibrationally stable if there are no soft modes along with negative directions in the Brillouin zone. The absence of soft modes in all directions indicates that the phonon dispersion curves of B2 Fe50Co50-lyxVx are vibrationally stable below 43.75 at.% V. This prediction is consistent with the elastic moduli (Figure 4). However,
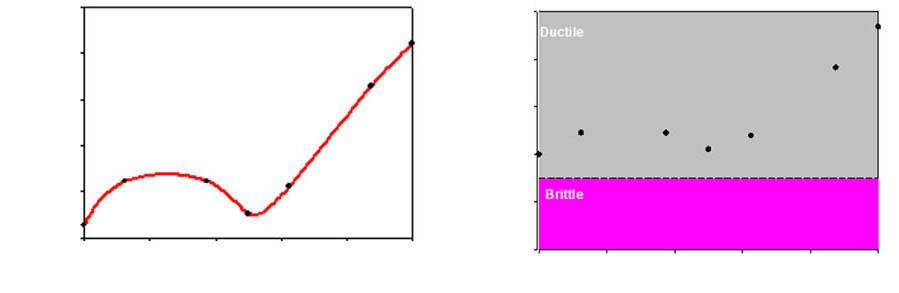
Fe50V50 displays negative vibrations along the M and X directions, which does not imply mechanical instability but rather shows the potential to undergo a phase transition from high to lower temperature phases, hence the presence of soft modes.
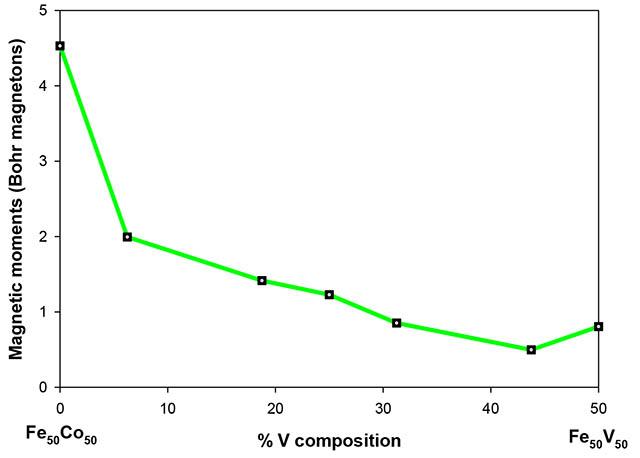
The ab-initio DFT approach was successfully used to study the effect of V content on the structural, magnetic, and mechanical properties of B2 FeCo alloy. The results showed that Fe50Co50-xVx is thermodynamically stable at high concentration of V with the lowest heats of formation. It was found that Fe50Co50-xVx alloys are mechanically stable for the entire concentration range studied. The bulk modulus (B), shear modulus (G), and Young’s modulus (E) showed a decreasing tendency with increasing V content. The ductility improved as shown by the increases in the Pugh ratio (B/G), Cauchy pressure (C12-C44), and Poisson’s ratio with an increase in V concentration. The magnetic moment was found to decrease with the addition of V, indicating a lower magnetic strength. The phonon dispersion curves showed mechanical stability over the entire concentration range studied, except for Fe50V50 The findings may provide guidance to the future development of ferromagnets made from new Fe50Co50-xVx alloys.
The computing resources provided by the Materials Modelling Centre (MMC) at the University of Limpopo and Center for High Performance Computing (CHPC) are deeply appreciated. We
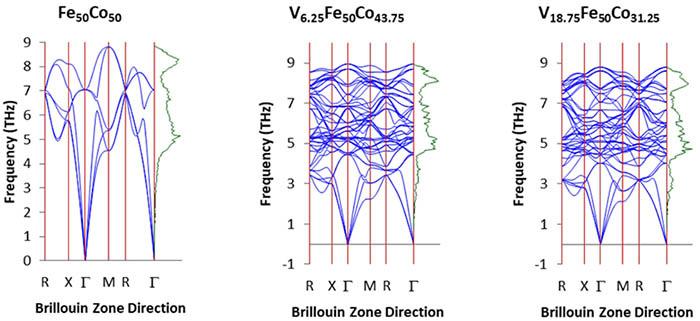
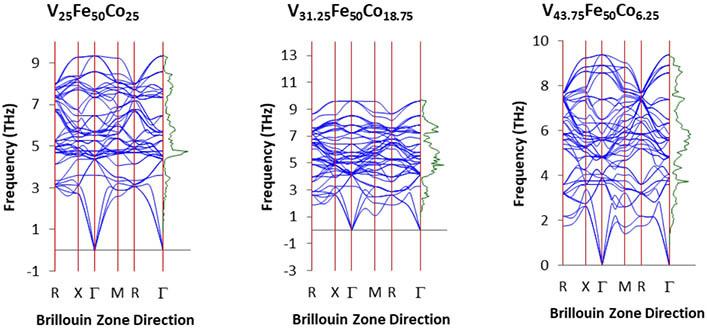
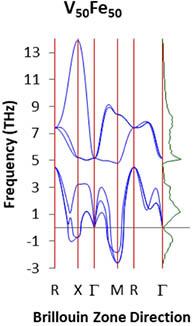
The effect of vanadium on the magnetic and mechanical properties of B2 FeCo alloy: a DFT approach
gratefully acknowledgs The support of the South African Research Chair Initiative of the Department of Science and Technology.
References
Albaaji, A.J. 2017. Enhancement in the elongation, yield strength and magnetic properties of intermetallic FeCo alloy using spark plasma sintering. Journal of Materials Science, vol. 52, pp. 13284–13295.
Frantsevich, I.N. and Voronov, S.A. 1983. Elastic Constants and Elastic Moduli of Metals and Insulators Handbook. Naukova Dumka, Kiev. Vol. 1, pp. 60-180.
Fu, C.L. and Maja, K. 2006, First-principles study of the structural, defect, and mechanical properties of B2 FeCo alloys. Physical Review B, vol. 74, 174108–8.
Horwath, J., Turgut, Z., and Fingers, R. 2006. High temperature properties and aging-stress related changes of FeCo materials. AFRL-PR-WP-TR-2006-2176, July 2006. Air Force Research Laboratory, Wright-Patterson Air Force Base, OH.
Kresse, G. and Furthmuller, J. 1996. Efficient iterative schemes for ab initio total-energy calculations using a plane-wave basis set. Physical Review B, vol. 54, pp. 11169–11186.
Kresse, G. and Hafner, J. 1993. Ab initio molecular dynamics for liquid metals. Physical Review B, vol. 47, pp. 558–561.
Ledwaba, T.M., Diale, R.G., Ngoepe, P.E., and Chauke, H.R. 2021. Structural and stability of B2 FeCo1-xVx and Fe1-xCoVx systems: Cluster expansion approach. South African Journal of Science and Technology, vol. 40, no. 1, pp. 98–101. https://doi.org/10.36303/SATNT.2021cosaami.19
Liu, X. 2011. The effect of underlayers on FeCo thin films. Journal of Physics: Conference Series, vol. 266. 012037.
Liu, X. and Morisako, A. 2008. Soft magnetic properties of FeCo films with high saturation magnetization. Journal Applied Physics, vol. 103. 07E726.
Materials Explorer. 2020. FeCo. https://next-gen.materialsproject. org/materials/mp-2090
Mayer, B., Anton, H., Bott, E., Methfessel, M., Sticht, J., and Schmidt, P.C. 2003. Ab-initio calculation of the elastic constants and thermal expansion coefficients of Laves phases. Intermetallics, vol. 11, pp. 23–32.
Monkhorst, H.J. and Pack, J.D. 1976. Special points for Brillouinzone integrations. Physical Review B, vol. 13, 5188.
Parlinski, K., Li, Q.Z., and Kawazoe, Y. 1997. First-principles determination of the soft mode in cubic ZrO2 Physical Review Letters, vol. 78, pp. 4063–4066.
Patil, S.K.R., Khare S.V., Tuttle, B.R., Bording, J.K., and Kodambaka, S. 2006. Mechanical stability of possible structures of PtN investigated using first-principles calculations. Physical. Review B, vol. 73, 104118.
Perdew, J.P., Burke, K., and Ernzerhof, M. 1996. Generalized gradient approximation made simple. Physical Review Letters, vol. 77, 3865.
Pettfor, D.G. 1992. Theoretical predictions of structure and related properties of intermetallics. Materials Science and Technology, vol. 8, pp. 345–349.
Pugh, S.F. 1954. Relations between the elastic moduli and the plastic properties of polycrystalline pure metals. Philosophical Magazine, vol. 45, pp. 823–843.
Sides, W., Kassouf, N. and Huang, Q.J. 2019. Electrodeposition of ferromagnetic FeCo and FeCoMn alloy from choline chloridebased deep eutectic solvent. Journal of the Electrochemical Society, vol. 4, pp. D77–D85.
Sourmail, E. 2005. Near equiatomic FeCo alloys: Constitution, mechanical and magnetic properties. Progress in Material Science, vol. 50, pp. 816–880.
Wang, J.H., Yip, S., Phillpot, S.R., and Wolf, D. 1993. Crystal instabilities at finite strain. Physical Review Letters, vol. 71, pp. 4182–4185. u


28-29 August 2024
54 on Bath, Rosebank, Johannesburg and Online via Zoom ECSA Validated CPD
MMS’ mission is to empower mining companies with the knowledge, strategies, and solutions needed to thrive in a rapidly evolving industry. We are committed to helping the industry overcome challenges, minimize risks, and achieve sustainable growth, through digital and data-driven solutions.
The primary goal of this course is to provide participants with a comprehensive understanding of metal accounting across the entire value chain and lifecycle of a mining project. This training aims to develop holistic insight into the critical role of the measurements, sampling and analyses required for metal accounting, emphasising their impact on operational efficiency, compliance, financial reporting, and sustainable business practices. This course strives to fulfill its objectives by examining the principles outlined in the AMIRA P754 code of practice for metal accounting, along with other pertinent industry standards and guidelines. It emphasizes the practical implementation of these standards and technologies while preparing for future advancements to improve current practices.
Designed for industry professionals at all levels, this two day course provides essential knowledge and skills necessary for understanding and managing metal accounting systems effectively, encompassing all stages from exploration through to closure of mining operations.
Key Highlights:
• Learn requirements for correct sampling, reliable mass measurement and analysis of metal content in streams and production lots development of new systems monitored by Metal Accounting and Plant Performance management systems,
• Report results transparently and accurately, positively impacting company reputation, market credibility and social licence.
• Understand the broader business impact of sound Metal Accounting, facilitating operational improvements and resource sustainability.
• Gain insights into plant design and measurement system requirements for optimal Metal Accounting performance.
• Identify limitations, uncertainties, and risks in Metal Accounting systems, and how system information can be used in value added decision making and growth of knowledge.
• Support improvement of established Metal Accounting systems and development of new Metal Accounting systems for new mines, mineral processing plants and downstream customer, mineral processing plants and downstream customers, with a solid understanding of Metal Accounting’s role in each stage of development of the metal value chain.
Learning Objectives
1. Fundamentals and Importance:
a. Gain a foundational understanding of measurement, sampling and analysis processes required for metal accounting and their relevance in mining operations from exploration to closure.
b. Recognize the diverse audience of stakeholders including site management, regulatory bodies, and technology providers, and understand their specific needs and expectations.
2. Industry Standards and Best Practices:
a. Familiarisation with the AMIRA P754 Code principles, requirements and methods used to assess Metal Accounting practices as well as methods of evaluating measurement system used in mineral and metal processing plants.
b. Explore the principles, requirements, and methods used to evaluate and enhance metal accounting and associated measurement systems.
3. Technical Mastery in Sampling and Metal Accounting:
a. Identify current Metal Accounting practices, with an emphasis on correct Sampling and reliable Analytical methods, Laboratory quality assurance and quality control, Mass measurement, Bias and Error management, Data management, Reconciliation, and Reporting.
b. Learn about Metal Accounting specifics, including measurement, data management, and reconciliationto ensure accurate estimation of metal contents in the materials that are processed within and along the different stages of the mining value chain. Camielah Jardine: Head of
FOR FURTHER INFORMATION CONTACT:
Affiliation:
1University of KwaZulu Natal, Durban
2Institute of Mine Seismology, Stellenbosch
3Durban University of Technology, Durban
4Viotel Australia Pty Ltd, Australia
Correspondence to: S. Brijraj
Email: sahilbrijraj@gmail.com
Dates:
Received: 28 Oct. 2020
Revised: 28 Feb. 2022
Accepted: 10 Feb. 2024
Published: May 2024
How to cite:
Brijraj, S., Moolla, S., and Lynch, R. 2024. Full-waveform automatic location of small seismic events in an underground mine using synthetic strain Green’s tensors. Journal of the Southern African Institute of Mining and Metallurgy, vol. 124, no. 5. pp. 269–278
DOI ID:
http://dx.doi.org/10.17159/24119717/1416/2024
ORCID:
S. Brijraj
http://orcid.org/0000-0002-0106-5709
S. Moolla
http://orcid.org/0009-0008-8045-4825
R. Lynch
http://orcid.org/0000-0002-7529-0669
by S. Brijraj1,2, S. Moolla3, and R. Lynch4
Abstract
A reliable method to locate microseismic evets is an important objective for routine mine seismic monitoring. We developed an algorithm that can automatically and reliably locate an event from a single uniaxial trace. Signals created by microseismic events are recorded as seismograms that consist of direct P- and S-waves as well as the waves reflected off the underground excavations. We take advantage of the extra complexity these reflections introduce as they make the signal more unique. In our investigation we cross-correlated unaltered synthetic seismograms against trial waveforms created from a linear combination of appropriate waveforms from a library of numerically calculated strain Green’s tensors. We use a single uniaxial synthetic seismogram to invert for the source location, six moment tensor components, and frequency. The resulting cost functions are constructed as maximal correlations at each node in the mine grid through the true source x-planes. This function is maximized by differential evolution to simultaneously yield the source parameters. Sensitivity tests such as shifting the mine plans and altering the background velocities of the media are investigated to test the robustness of the method. We contaminate the data with 40% white noise to test the resolution against simulated real recorded seismograms. The method is demonstrated using synthetic data calculated with a realistic underground 3D velocity model.
Keywords mine seismicity, microseismic event, location, strain Green’s tensor
Introduction
Microseismic monitoring is a standard technique routinely applied in more than 300 underground mines around the world (Mendecki and Young, 1993; Mendecki, 1997). Reliable location of microseismic events is vital in managing seismic hazard, and in understanding the rock mass response to mining. As more than 1 000 000 seismograms are recorded in underground mines each day, processing and locating techniques should be practical, quick, and – ideally – automatic.
Typically, arrays of seismic sensors are installed into short boreholes drilled from the underground tunnels. These sensors record both the direct body waves and the complex coda arising from multiple reflections and interactions with the tunnels and mining excavations. Routinely, the direct P- and S-wave arrivals are picked for a set of associated seismograms, and the seismic source is located using a variation of Geiger’s method (Geiger, 1912). While 3D ray-tracing is sometimes used (Sewjee, Lynch, and du Toit, 2008), a homogeneous apparent velocity model is usually sufficiently accurate, and easier to maintain than a 3D velocity model of the changing mine. The nature of the velocity model is of paramount importance as its similarity to reality will determine how closely the synthetic and recorded waveforms match. If the wave velocities do not vary by more than a few per cent along the propagation path then the fixed velocity model holds well (Sewjee, Lynch, and du Toit, 2008). However, if there are localized regions of significant variation in wave velocities then the arrival times recorded may misrepresent the distance from the sensor to the hypocentre, which would reduce the reliability of the estimated hypocentre location. Voids within a mine represent areas with a high contrast in wave velocities to the surrounding rock. Lynch and Lotter (2007) estimated the variance of seismic wave velocities in cave mining at over 80%, while in open pit mines the variance between solid rock and air is over 90%.
There are three broad categories of event location calculation, distinguished by the nature of the velocity model being used. The first category assumes fixed-velocity models (Asch et al., 1996), based on the classic (Geiger, 1912) method. The second category comprises techniques that attempt to update the velocity model with information provided by recorded seismic events whose locations are yet to be calculated, while
simultaneously computing their hypocentres. (Thurber, 1986; Iyer and Hirahara, 1993). The third category is based on the location of seismic event hypocentres relative to each other, known as double differences in global seismology. (Waldhauser and Ellsworth, 2000; Waldhauser and Schaff, 2008). These methods employ the concept of using an already located earthquake, termed the master, as well as the associated slaves, which are earthquakes yet to be located relative to it.
Standard seismic location methods require identification of the P- and S-waves in recorded signals. This phase identification and the measurements of their arrival times are used to determine the event location. Phase picking is very difficult for signals with a relatively low signal-to-noise ratio. Techniques based on Kirchhoff migration utilize the entire waveform instead of phase identification. Signals from all sensors are superimposed and then maximized to identify the source location. Waveforms with a low signal-to-noise ratio as well as velocity models simulating very heterogeneous regions can make the results ambiguous (Gharti et al., 2010). Gajewski and Tessmer (2005) employed the backward extrapolation migration method to determine source location by considering the recorded waveforms as the boundary values for the reverse modelling. In other words. by reversing the waveforms in time and propagating them backwards through the model, the sensors can now be thought of as sources. The focus point then represents the event hypocentre. The origin time of the event is given by the time at which maximum focusing is observed. The spatial extent of the focus indicates the resolution power of the recorded waveform. Waveforms with a signal-to-noise ratio smaller than unity are difficult to manually process, as event arrivals are almost impossible to identify accurately. Gajewski and Tessmer showed that even such complex signals can be used to focus the event hypocentre very well.
Some methods require the use of envelopes and absolutes of the traces’ amplitudes. These methods utilize the concept of delay and summing of the traces to enhance the signal-to-noise ratio (Ringdal and Kværna, 1989; Arnold, 1977; Gharti et al., 2010). This can be done by focusing on first arrivals, P-waves, or the most energetic parts of the signal, the S-waves. Siwei and Fomel (2013) used first arrivals to address the problem of working with a sparse source sampling by considering the derivative of travel time with respect to the source location. Kao and Shan (2004) proposed the source-scanning algorithm (SSA) to map the distribution of seismic sources in space and time. This method is limited, as instead of summing over the entire waveform it only sums absolute amplitudes at computed arrival times for predefined time windows around the most energetic portion of the trace. The problem with using envelopes of the waves is that information derived from the amplitude, phase, and position of the individual peaks is lost. This information is critical for learning about the moment tensor of the source. Thus in our study no envelopes are used. The full complex waveforms, comprising the direct body waves and the complex coda received later, are processed. The nature of all these peaks is intrinsically related to the mechanism of the event. We used a library of strain Green’s tensors (SGTs) to create trial waveforms by linearly combining appropriate tensors. The scalars that are used to multiply and then combine the tensors representing the source mechanism, or moment tensor components. The trial waveforms are then cross-correlated against a synthetic data waveform. We employed the differential evolution (DE) code to optimize the full 10D problem and solve for the location, mechanism, and frequency.
The theory behind this approach is quite simple. A library of SGTs is numerically calculated using a modified version of the finite difference code developed by Larsen and Schultz (1995b). The SGTs are derived from the Green’s functions. The Green’s functions are created using delta source-time functions, which are source impulses that contain all frequencies. The Green’s functions fully describe the medium between the source and receiver as the waves sample every possible ray path between the two locations. Thus, a waveform produced at a source and recorded at a sensor should be reproducible by linearly combining Green’s functions with the same trigger and recording locales. In our investigation, we focused on moment-tensor point sources. The moment tensor associated with an event, Mij, is a 3 × 3 matrix, with equal offdiagonal elements, leaving six independent components. Thus, at every node in the model representing a potential source location, six SGT time functions must be created per sensor component (x, y, z). Seismograms, or displacement fields, generated as a result of moment-tensor sources are given by the general relationship (Aki and Richards, 2002)
[1]
where the symbol (✴) denotes the convolution, un is the nth component of the displacement field (n = x, y, z ), G the Green’s function recorded at x for a unit force applied at ξ , and M the moment tensor. The moment tensor can be broken down into the multiplication of a scalar 3 × 3 matrix with a common source-time function, s(t), thus Mij (t) = Mij × s(t). Summation convention applies to repeated indices. The index j after the comma (,) represents the partial derivative with respect to the source coordinates (ξ j). Our approach uses the SGT, as demonstrated by Gharti et al. (2011). The spatial reciprocity of the Green’s function means Equation [1] can be reformulated as
[2]
where Eij,n is the SGT, which represents the strain components computed for a unit force applied in the nth direction. Due to the symmetry, the SGT has 18 independent components. It is related to the Green’s functions by [3]
The conversion of the Green’s tensor to the SGT is far more appealing, as only three simulations are required for each individual source-sensor configuration, and not six, thereby reducing computational time as well as storage space for the library. Kawakatsu and Montagner (2008) showed that doing the timereversal operation by reversing the received traces, un (x, t), in time and convolving them with elements of the SGT library gave a good approximation of the source location by
[4]
where un (x, t0 − t) is the time-reversed version of the data un (x, t). However, it is easier to use the traces as they are. The easier approach would be to simply cross-correlate the original received trace un (x, t) with either the Green’s tensor or SGT libraries (Gharti et al., 2011) as
[5]
where the symbol (Χ) denotes the cross-correlation. Gharti et al. (2011) explain that this formulation of Mij is not the actual moment tensor, but rather this quantity focuses at the correct source location and should give a qualitative estimation of the moment tensor. Using cross-correlation is preferred as it is computationally less expensive than convolution. In our study we take advantage of the reciprocity property of the SGTs and consider each location in the mine as a sensor, and each sensor as a source to reduce computational costs. The objective function at each location in the mine, ξ , and origin time t0 is given as
[6]
For objective functions with multiple significant peaks we square the objective function values, which enhances any significantly high values as well as supressing lower insignificant peaks that may seem interesting but are actually regions of false positives. The region in our resulting cost function that reaches a maximum identifies the location of the source. The simulations are all triggered at time sample zero, thus origin time in this synthetic study was sample zero. This removed one degree of freedom from the problem. For purely synthetic, noiseless simulations a maximum correlation of unity is expected at the correct location. Where Gharti et al. (2011) could find a qualitative description of the source’s moment tensor at the correct location, we inverted for the location, mechanism, and frequency simultaneously, thus fully describing the event all at once. We also used only a single uniaxial seismogram, whereas Gharti et al. (2011) used 18 triaxial traces. If this is successful it would be a great advantage in microseimic analysis.
In this investigation we focused on running numerical synthetic simulations. The Pyhasalmi mine, located in central Finland (Figure 1), exploits a volcanogenic massive sulphide (VMS) deposit (Gharti et al., 2011). SGTs describe all possible paths between the sensor sites and every node in the model. The tensor elements also contain all possible frequencies as they are created using a unitary
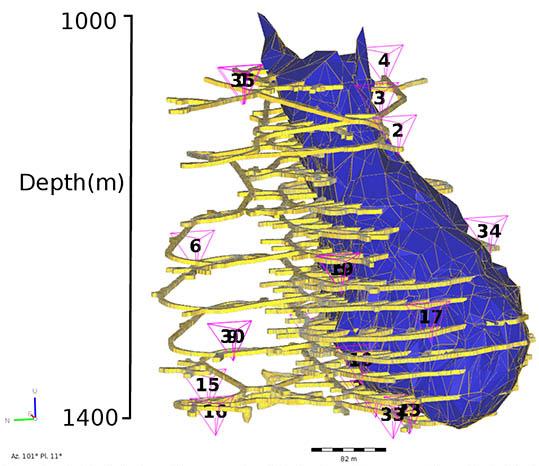
delta force source. Thus, in theory, any specific frequency wave for a specific path from a node in the model to a sensor should be retrieveable by linearly combining the appropriate tensor elements multiplied by unique independent scalars. All the simulations were carried out using a version of the 3D viscoelastic finite-difference code by Larsen and Schultz (1995a) modified by Dr H.N. Gharthi, which from here on will be referred to as E3d.
The SGT library is computed by solving the forward wave equation using a simple delta point source. The drawback to this method is that it requires physical storage space for the tensor element files, which contain a large amount of data. However, once the library is prepared any number of tests can be conducted on any number of specified regions of interest within the model. The library was constructed by taking advantage of the inherent reciprocity property of SGTs, which meant, computationally, we could consider the sensors as sources and each node in our mine plan as a sensor, thereby reducing the number of simulations required, as done by Gajewski and Tessmer (2005). However, unlike them we do not reverse our signals in time. Thus instead of using 250-squared scripts with one sensor per script for each of the three unitary forces (Fx, Fy, Fz), it was more convenient to run scripts with one source and 250-squared sensors for each unitary force. Using this approach, each simulation took roughly just under 3 hours to complete a library on a single x-plane and roughly 2 Gb of RAM. The cost function is calculated at each grid point in the model using Equation [6]. Per location per sensor per component the six SGTs are linearly combined, then convolved with a source-time function of a specific frequency and shape to create a trial waveform, which is in turn correlated against the corresponding nth-component seismogram, n = .x, .y, .z.
For this paper a 250 Hz Ricker wavelet source-time function was used. The six scalars and frequency are optimized using DE to give the maximum value for the objective function at each node. If more than one sensor is considered then the total cost function at that location is the sum of each correlation between corresponding sensor-source traces. If the model and the mathematical operations are perfect. each sensor correlation should give the theoretically maximum value of unity at, and only at, the correct source location. If multiple sensors are considered then we just superimpose their correlations at each location and expect their contributions, given by (correlation per sensor)/(number of sensors), to yield a value of unity. We attempt to extend the work of Gharti et al. (2011) by reducing the number of traces used to just a single uniaxial trace.
We use a complex void-filled model. Voids are regions like tunnels, excavations, caves –essentially they are blocks of air within the model. Within these areas the P- and S-wave velocities drop to 0.3 km/s and zero, respectively. The Q-factor (attenuation) drops from 300 to 0.01. These effects will affect the arrival times of the P- and S-waves, as voids introduce reflections into the problem. The waves will reflect off the air/rock boundary and travel on a new ray path through the medium. This will result in different arrival times being recorded at the sensors and hence build the seismograms into a more complex waveform. These reflections do make the problem more complex, but also add an element of uniqueness. This is because waves that travel from one location will travel a very different path to a ray originating at a node right next to it, as it will strike different sections of voids at different angles, thus reflecting off in different paths. It is therefore expected that the cost function produced for inhomogeneous models will have a far
more unique maximum than the homogeneous case. We attempt to take full advantage of the highly complex coda as well as the direct body waves and use a single uniaxial seismogram to perform our inversion. Sensitivity tests are important to verify the robustness of any method. A major factor that affects the phase arrivals of events is the distribution of voids within the mine, such as tunnels, stopes, and shafts. Such areas cause reflections of seismic signals, which increase the complexity of the final received traces. The voids used here simulate the actual Pyhäsalmi mine plans. Another significant factor to consider is regions of variation in the velocity model. Such regions cause the phases to be received either later or earlier, depending on whether the r wave path is characterized by lower or higher velocities, respectively, than the expected background velocity of the host material, which is roughly 6 km/s for P-waves and 3.73 km/s for S-waves. The SGT library was constructed using a homogeneous velocity model with these velocities.
Figure 2 represents the resulting cost functions when the model has been altered to reflect realistically non-ideal situations. For our runs we simulate a source at node (x 180, y 105, z 105) in a 351-cubed node model. Since the model includes absorbing boundaries that are 50 nodes thick around our mine model, the physically feasible model is 250-cubed nodes. The model has a node spacing of 2 m. The x-, y-, and z-axes represent the extent in the north-south, east-west, and depth directions respectively. For the sensitivity tests we use a single uniaxial sensor located at node (x 169, y 117, z 55). The sensor is projected onto the true source x-plane, denoted by ’S ’ at node (x 180, y 117, z 55) in Figure 2. Figure 2 shows the result of using the SGT library created using a single uniaxial sensor with a uniform background velocity model and a 250 Hz Ricker source, located at node (x 180, y 105, z 105), denoted by ‘L’, with a moment tensor [mxx = 1.0, mxy = 0.5, mxz = 0.2, myy = −1.0, myz = 0.1, mzz = 0.1]. The calculated maximal source location is indicated by ‘L’. The cost functions display the variation of maximal correlations per node through the x-plane of the true source (x-node = 180). Figure 2a shows the resulting cost function for a 250 Hz source correlated against the SGT library using a smoothly varying velocity model with randomly scattered regions of ±10% of the standard P-wave velocity of 6 km/s, as well as the tunnels and mine plans. Figure 2b displays the cost function for a source velocity model varying by ±20% of the maximum P-wave velocity in random scattered regions. These tests give an indication of the method‘s ability to incorporate changes in the background media that are not known and their effect on a definitive accurate location resolution. In both figures the correct location is retrieved, as well as an accurate approximation of the source mechanism. Such tests are very important because in a real working mine there are regions characterized by higher or lower velocities than the standard assumed velocity for that particular mine. Any method that involves analysing waveforms produced in such media must either incorporate a model specified enough to portray the regions accurately, or more conveniently, be immune to such changes and thus, simply, assume a constant velocity background. Our tests show that we can assume a fixed velocity model.
Figure 2c shows the cost function for shifting the mine plans by 2 m in all three axial directions, resulting in a total shift of 3.5 m. Tests showed that an equally far shift in any direction yielded functionally identical results. This test is meant to represent errors in the surveying of the mine plans before they are digitized and used to create synthetic models. Since the problem of microseismic location is inherently due to the geometry of the ray paths and reflections off voids, an unknown shift in the mine plans could be
detrimental to accurate results. However, unknown shifts of the plans of the order of a few metres did not affect the resolution of the resulting location. A powerful and promising outcome of these tests is that using a single uniaxial sensor produced almost perfect correlations (> 0.99) at the correct location.
Figure 3 shows the result of using a different sensor than in the tests displayed in Figure 2. Figure 3a shows the cost function through the x-plane of the true source location (x 180, y 105, z 105). The sensor is located at node (x 185, y 156, z 130), which is projected onto the true source x-plane at node (x 180, y 156, z 130). The sensor is centrally placed in the region of the cost function. There is a clear single, isolated narrow maximum peak at the correct location of (y 105, z 105) on this plane. The value rises to a correlation value of 0.99 at the correct location. This shows that a single uniaxial trace can be used to compare against an SGT library. Our results compare well to previous similar studies (Gharti et al., 2010, 2011). As can be seen from Figures 2 and 3a, the expected ring structure from using a single sensor is present. Figure 3a shows the circular distribution of elevated correlations around the sensor location; however, the maximum value along the perimeter is located only at the true source location. Figure 3b shows the comparison of the single uniaxial data trace (green) and the sum of the convolved SGTs (black) at the maximal location picked out by DE. DE gave final values of (y = 105, depth (D) = 105, f = 246 Hz, mxx = 0.978, mxy = 0.538, mxz = 0.174, myy = −1.00, myz = 0.089, mzz = 0.106), which are very close to the true source parameters. To synthetically simulate a real seismogram, which is contaminated by noise composed of many frequencies, we added 40% white noise to the original 250 Hz data trace (see Figure 4). This was then used as our data, and as can be seen in Figure 4a the results are still very promising. In this case there is still a definitive peak in the cost function centred over the correct source location (y = 105, z = 105). Figure 4b shows the comparison of the contaminated data trace against the sum of the noiseless synthetic SGT waveforms. The high noise contamination is clearly dominant and reduces the correlation to 0.603;, however, it can clearly be seen the waveforms still follow the same low frequency vibration. DE gave final maximal values of [y = 105, D = 105, f = 244 Hz, mxx = 1.0, mxy = 0.43, mxz = 0.15, myy = −0.79, myz = 0.06, mzz = 0.143]. Again here, it can be seen that even with a very noisy signal the maximal parameters calculated come out very close to the true soure parameters, including the polarity of the moment tensor components and not just their magnitudes. To remove the some of the interference effect of the noise the signal was band-pass filtered between 20 and 480 Hz, as shown in Figure 4c. Final maximal parameters are [y = 105, D = 105, f = 252 Hz, mxx = 0.86, mxy = 0.42, mxz = 0.40, myy = −1.00, myz = 0.18, mzz = −0.10). The correlation in this case increases to just over 0.98. This test has very important implications as it shows that we can still take a noisy signal, bandpass filter it around its central frequency, which is a parameter that is routinely retrieved, and then still use it in our method to give excellent results. The convenient aspect of this investigation is that once the SGT library has been constructed, we are able to simulate a source of any frequency, as well as, any combination of moment tensor components.
The ultimate aim of this investigation is to retrieve the location of real recorded microseismic events in a working mine. Currently, IMS Trace software is used routinely as a tool to resolve an event’s
location. Trace utilizes ray-tracing, and seismograms from at least three sensors are required to resolve the location of the event. Although this method works, quite often three waves are not recorded for an event. This means that all events that do not meet this threshold are ignored, which is a large waste of data. Thus, a method that can utilize only one or two sesimograms will be highly beneficial. Using a library of SGTs can solve this problem. Another factor to keep in mind is that most mines do not use many triaxial sensors, as uniaxial sensors are more cost-effective.
Thus, for a given event the data recorded may only be a single z-seismogram, as most uniaxial sensors are aligned along the z (depth) direction.
To test the method for real data an event recorded on 16 July 2015 in the Pyhäsalmi mine was utilized. The event was recorded on five sensors. We considered analysing a single sensor’s trace. From Figure 6b it was found that sensor 16 had the highest correlation. The maximal frequency range was observed to be between 350 and 500 Hz . This seismogram, which was a single z-component
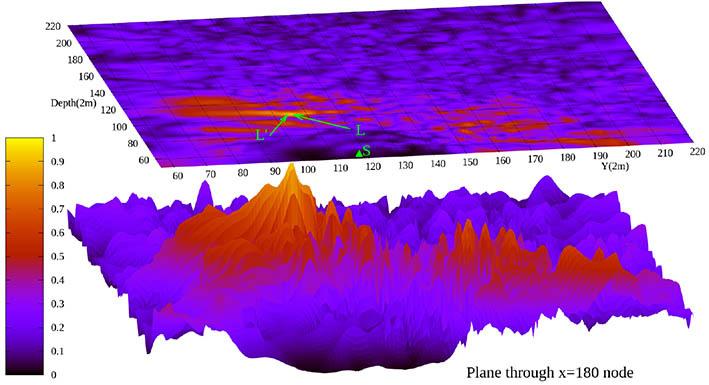
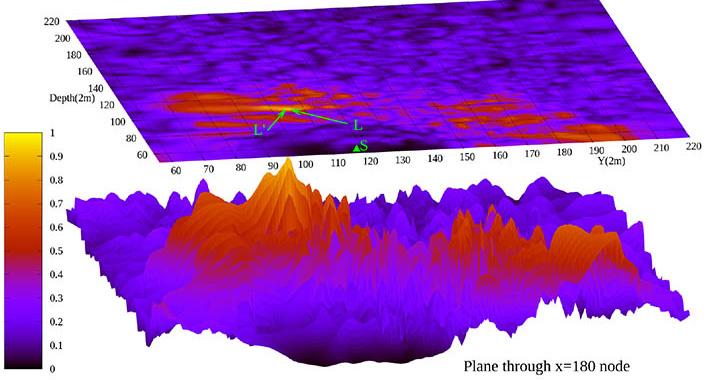
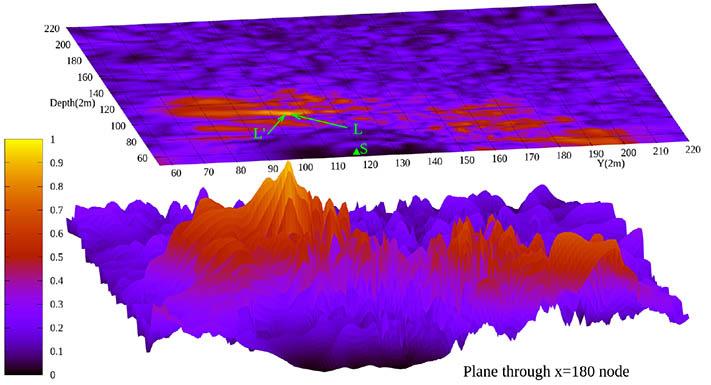
Figure 2— Sensitivity
functions for fixed-velocity strain Green’s tensors library correlated against single uniaxial 250Hz noiseless data trace using a model with a) scattered regions of ±10% of the background velocity, V pmax , b) regions in a) increased to ±20% and c) mine-plans shifted by 2m in all three axial directions. True source, L, sensor, S, and calculated maximal location at L’. Maximal location matches true location exactly with correlations of 0.943, 0.93 and 0.937 respectively. General ring structure of elevated values is observed, and as expected near perfect zero values observed near the sensor
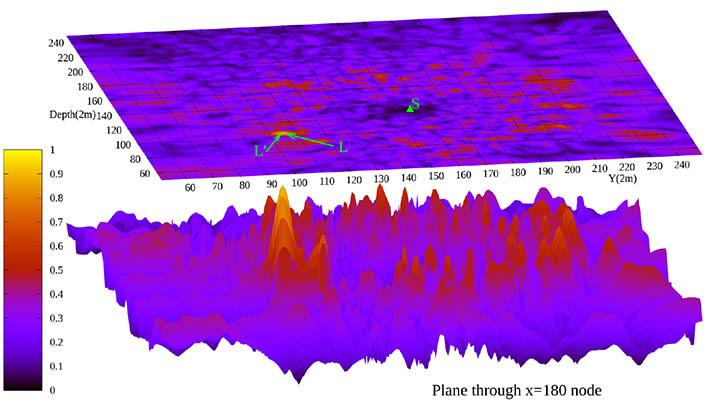
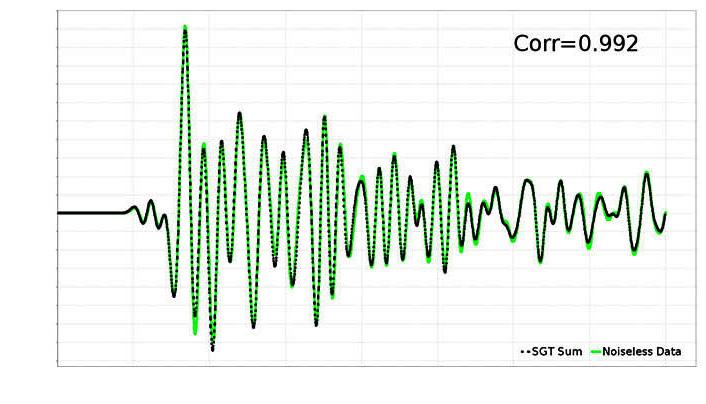
Corr=0.992
Figure 3— a)Objective function computed for noiseless 250Hz Ricker source. True source, L, sensor, S, and calculated maximal location at L’. Maximal location bright spot at node(y=105, Depth=105) matches real source at node(y=105, Depth=105) on this x-plane. Circular distribution of elevated values around sensor with radius of roughly 60m. The complex reflections in the signal help break up the ring and isolate a single pronounced peak at the correct location as a global maximum. As expected there are near-zero values near the sensor. b) Synthetic summed strain Green’s tensors waveform(black) vs synthetic 250Hz data trace(green), with correlation of just over 0.991
seismogram, was correlated against a library of SGTs created using the contemporary mine model. The first aspect of this method would require some knowledge of the frequency as well as the temporal profile of the event trigger.
Tests pointed to using the Beresnev profile (Beresnev, 2001) for the source-time function in preference to the standard Ricker wavelet employed by E3d (Larsen and Schultz, 1995a) as best to match real recorded data. Using a Beresnev source-time function at a frequency of 375 Hz gave the best matching waveforms. This source-time function was used to convolve the SGT library and carry out the correlations. The preliminary results are displayed in the the cost functions seen in Figure 5. The location predicted by Trace was (x = 187, y = 123, z = 88). However, our method found the location at (187,132, 93). This is roughly a 20 m shift, considering a node spacing of 2 m. This could be explained by the fact that Trace assumes straight ray paths, essentially triangulation, which does not take into account the effect of the voids on arrival times. Our method inherently uses the effect of reflections off the voids, which gives a more accurate reading.
As can be seen in Figure 5a there is a single definitive peak. The rest of the surface is not an ideal flat plane of zero values, due to the complex nature of a real seismogram. The cost function values were
squared to enhance the signa- to-noise ratio. Figure 5b shows that the resultant peak location is roughly 20 m away from the location predicted by Trace. However, this location was determined using just a single seismogram. The peak value may not be perfect, but shows promise, especially if it shows that a single seismogram can be used to find the location of the event with reasonable accuracy. The cost functions in Figure 5 show there is a large region of elevated correlations centred on node (y = 200, D = 200). Such a region can be explained as due to numerical artefacts resulting from performing the cross-correlations across the entire waveforms. Using Pythagoras it can be calculated that the maximal peak located at (y = 123 , D = 99) in Figure 5 is roughly 78 m away from the sensor.
Figure 6a shows the comparison of the data trace in red as well as the linear combination of library tensors in blue. We used the seismogram to calculate the path distance from source to sensor. Equation [7] shows the derivation of finding the distance, d, in terms of the P-wave arrival time (tp) and velocity (vp) and the S-wave arrival time (ts) and velocity (vs) and an initial time (t0). Picking the P- and S-wave arrival points at 330 and 430, respectively, and the standard velocities of 6 km/s for P-waves and 3.73 km/s for S-waves, the calculated distance, using Equation [7], was found to be 80 m.
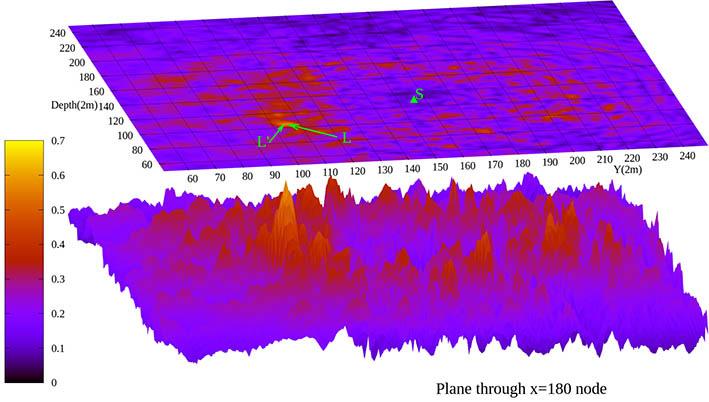
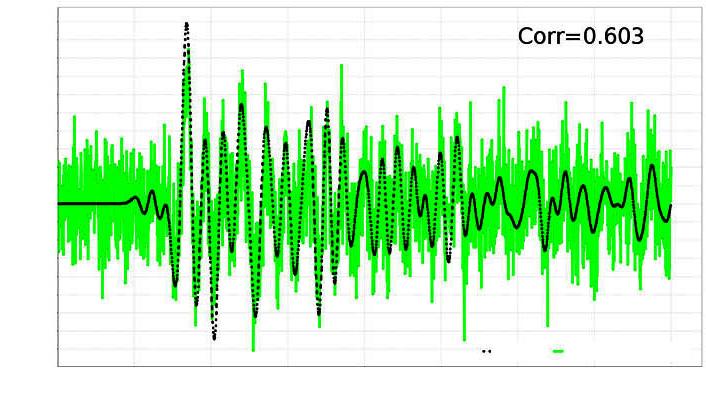
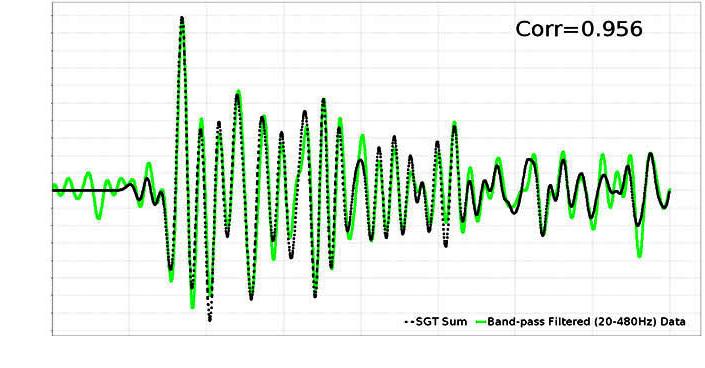
Figure 4—Results of correlating a 250Hz data trace contaminated with 40% white noise against a library of noiseless strain Green’s tensors. a)Objective function represents x-plane through true source location (x=180) with true source, L, sensor, S, and calculated maximal location at L’. Maximal location bright spot at node (y=105, Depth=105) matches real source at node (y=105, Depth=105). Maximum correlation reaches just over 0.6 due to the high degree of noise present in the data trace. b) Summed synthetic strain Green’s tensors waveform (black) vs 250Hz data trace contaminated with 40% white noise (green), showing correlation of just over 0.6. Observe most energetic sections of waves match between samples 400 to 2000. Calculated source parameters are very similar to the true source parameters. c) White noise data trace from b) band-pass filtered (20-480HZ) (green) and correlated against noiseless SGT library (black). Calculated parameters for band-pass filtered trace gives a correlation of 0.956. Noise tests show that synthetic complex waveforms that simulate real seismograms can also be used to produce definitive results
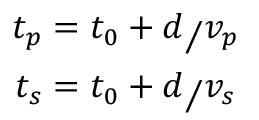
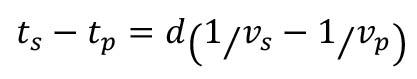
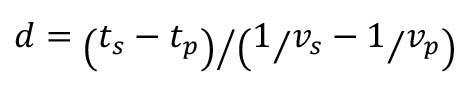
This value compares very well to the distance calculated from the cost functions.
More importantly this establishes a region of interest outlined by a border of radius 80 m. Using this value, it can be seen that the region of elevated correlations in the cost functions falls outside this radius, and is therefore not physically significant. We use the DE optimization technique to reduce the processing time.
DE works by initially comparing two waveforms created using diffferent sets of values. In our work we have ten independent parameters. The three location values, the frequency, and the six
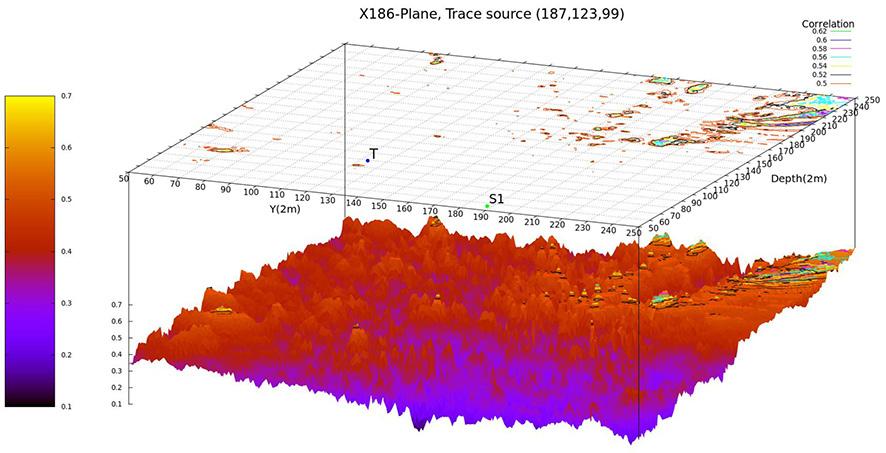

moment tensor components suffice to fully describe an event. DE creates a candidate solution using trial values for each parameter. Each parameter can be stipulated to exist within a certain range of values; this helps to optimize the processing time for the run, but also allows the algorithm to scan through a source space of potential values. DE compares a new candidate solution to the previous solution. If the new solution is an improvement in terms of being optimally maximal, then the ten values of the parameters for that solution are kept, and the other solution‘s parameters are disregarded. DE will take values of parameters that yield a better solution from both and combine, or mutate, them into a new solution that uses information from the previous generation.
An example of the results of DE is shown in Figure 7. The blue trace is the summed convolved SGT waveform, and the red is the event trace. Each run produced a maximal correlation of approximately 0.65. This is a significantly high value, considering the complex nature of the two waveforms. The maximal frequency of the event ranged from 355 to 480 Hz, which we averaged through oter numerous runs to 400 Hz. The maximal location in three dimensions was within a very tight locale, centred on node (x = 185, y = 123, D = 92).
Clearly the DE run circled around a maximal global location. There is only a few metres difference between the DE maximal location and that achieved by the brute force method that created the cost functions in Figure 6. This reinforces the affirmation that
our technique, in conjunction with DE, can be used as a very effective and accurate method to determine the source parameters of a microseismic event.
Conclusion
We have shown that cross-correlation of unaltered, full, complex seismograms with the strain Green’s tensor library constitutes a powerful tool, as with just a single uniaxial sensor the correct location of a microseismic event is retrieved with functionally perfect correlations. The method we propose is robust as it has been shown numerically that variations in the model that are realistically non-ideal, such as unknown regions of background velocities by up to ±20% and shifts in the mine plans in relation to the sensor sites by a few metres do not drastically affect the resolution of the source location or mechanism. We have also shown that a data trace contaminated by noise can still be used to identify the source parameters. Although a highly complex waveform usually makes processing difficult, for this method it is useful as it adds to the uniqueness of the true source location. Differential evolution is a promising tool in solving the problem, as the moment tensor components of the source, the source location, and frequency can be approximated relatively well in a timeous manner. If the location of an event can be retrieved using just a single trace. This will prove to be a very powerful advancement in microseismic location estimation.
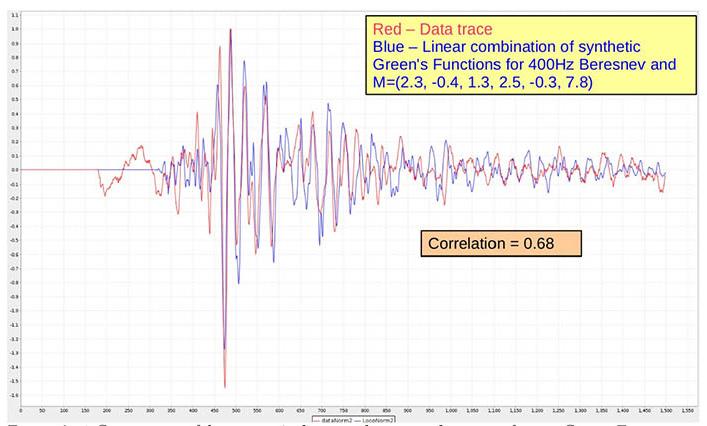
Figure 6— a) Comparison of data trace (red) versus linear combination of strain Greens Tensors (blue). b) Maximal correlation variation with frequency per sensor for single event, showing maximal correlations around 390 - 450 $Hz$. 'UG' means signls had leading noise before P-wave arrival zeroed out
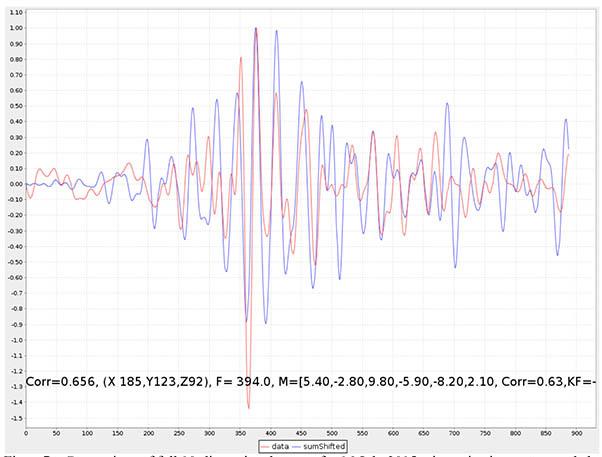
Figure 7—Comparison of full 10-dimensional traces for 16 July 2015 microseismic event recorded by sensor
References
Aki, K. and Richards, P.G. 2002. Quantitative Seismology. 2nd edn. University Science Books, Herndon, VA
Arnold, M.E. 1977. Beam forming with vibrator arrays. Geophysics, vol. 42. pp. 1321–1338.
Asch, G., Wylegalla, M., Hellweg, M., Seigi, D., and Rademaher, H. 1996. Observations of rapid-fire event tremor at Lascar volcano, Chile. Annals of Geophysics, vol. 39, pp. 273–282.
Gajewski, D. and Tessmer, E. 2005. Reverse modelling for seismic event characterization. Geophysical Journal International, vol. 163, pp. 276–284.
Geiger, L. 1912. Probability method for the determination of earthquake epicenters from the arrival time only. Bulletin of St. Louis University.
Gharti, H.N., Oye, V., Roth, M., and Kuhn, D. 2010, Automated microearthquake location using envelope stacking and robust global optimization. Geophysics, vol. 75, no. 4, pp. MA27–MA46.
Gharti, H.N., Oye, V., Kuhn, D., and Zhao, P. 2011, Simultaneous microearthquake location and moment-tensor estimation using time-reversal imaging. T SEG Technical Program Expanded Abstracts, vol. 30, no. 1, pp. 1632–1637. doi:10.1190/1.3627516
Iyer, H,M. and Hirahara, K. 1993. Seismic Tomography: Theory and Practice. Chapman and Hall.
Kao, H. and Shan, S.J. 2004. The source-scanning algorithm: Mapping the distribution of seismic sources in time and space. Geophysical Journal International, vol. 157, pp. 589–594.
Kawakatsu, H. and Montagner, J-P. 2008. Time-reversal seismicsource imaging and moment-tensor inversion. Geophysical Journal International, vol. 175, pp. 686–688.
Larsen, S. and Schultz, C.A. 1995a. ELAS3D: 2D/3D elastic finite difference wave propagation code. Technical Report no. UCRLMA-121792. U.S. Department of Energy, Office of Scientific and Technical Information.
Larsen, S and Schultz, C.A. 1995b. ELAS3D: 2D/3D elastic finite difference wave propagation code. Technical Report no. UCRLMA-121792. U.S. Department of Energy, Office of Scientific and Technical Information.
Lynch, R.A. and Lotter, E. 2007. Estimation of cave geometry using a constrained velocity model inversion with passive seismic data. Journal of the Southern African Institute of Mining and Metallurgy, vol. 107, no. 12, pp. 791–796. http://saimm.s1029.sureserver.com/Journal/v107n12p791.pdf
Mendecki, A.J. 1997. Seismic Monitoring in Mines. Chapman and Hall.
Mendecki, A.J. and Young, R.P. 1993. Real time quantitative seismology in mines. Proceedings of the 3rd International Symposium on Rockbursts and Seismicity in Mines, Kingston, ON. Routledge. pp. 287–295.
Ringdal, F. and Kværna, T. 1989. A multi-channel processing approach to real time network detection, phase association, and threshold monitoring. Bulletin of the Seismological Society of America, vol. 79, no. 1, pp. 927–1940.
Sewjee, R., Lynch, R.A., and du Toit, C. 2008. Locating seismic events in mines containing strongly heterogeneous media. Proceedings of the Fifth International Conference and Exhibition on Mass Mining, Luleå, Sweden. Schunnesson, H. and Nordlund, E. (eds). Luleå University of Technology.
Siwei, L. and Fomel, S. 2013. Kirchhoff migration using eikonalbased computation of traveltime source-derivatives. Geophysics, vol. 78, no. 4, pp. S211–S219.
Thurber, C.H. 1986. Analysis methods for kinematic data from local earthquakes. Reviews of Geophysics, vol. 24, pp. 793–805.
Waldhauser, F. and Ellsworth, W.L. 2000. A double-difference earthquake location algorithm: Method and application to the Northern Hayward fault, California. Bulletin of the Seismological Society of America, vol. 90, pp. 1353–1368.
Waldhauser, F. and Schaff, D.P. 2008. Large-scale relocation of two decades of Northern California seismicity using crosscorrelation and double-difference methods. Journal of Geophysical Research, vol 113, B08311. u
Affiliation:
1Engineering Academy of Serbia, Serbia
2Ei R&D Institute Nis, Serbia
3Faculty of Electronics University of Nis,Serbia
Correspondence to: M. Ilich
Email: miloss.ilich@gmail.com
Dates:
Received: 9 Oct. 2022
Revised: 4 Oct. 2023
Accepted: 29 Feb. 2024
Published: May 2024
How to cite:
Grozdanovic, M., Masrjanovic, D., and Ilic, M. 2024. Framework for ergonomic design of control centres in underground coal mines—A Serbian experience. Journal of the Southern African Institute of Mining and Metallurgy, vol. 124, no. 5. pp. 279–284
DOI ID:
http://dx.doi.org/10.17159/24119717/2363/2024
by M. Grozdanovic1, D. Marjanovic2, and M. Ilic3
Abstract
We present a framework for solving the problem of functional compatibility between process control equipment in control centres at underground mines and operator capabilities. The equipment incorporates displays of current ventilation, gas, and fire hazard data, status of alarm and early warning systems, a voice communication subsystem, and facilities for recording and printing of data and reports. The layout of the existing control panel is compared with a recommended design. The basic principles of ergonomic design and arrangement of the controls and indicators, as well as ease of use, type of operations carried out with these controls, and operators’ viewing angles are discussed. The objective is to improve the usability of control panels, display boards, and graphic screens so as to enhance the functioning of control centres and optimize control of technological processes in coal mines.
Keywords
ergonomic design, control centre, control panel, coal mining
Introduction
Underground coal mining is conducted in harsh conditions with ever-present risks of fire and explosion, toxic gases, mine collapses, flooding, and similar hazards. However, coal production from underground mines is increasing with the expansion of existing operations and opening of new ones. This has led to research into ways of detecting and quantifying hazardous conditions, as well as registering, communicating, processing, displaying, and storing the related information, automation of the mining process, and communication between employees on the surface and underground.
Previous studies in this area have included injuries in the underground coal-mining environment (Stojadinović et al., 2011), causes of accidents involving mining equipment (Dhillon, 2010; de Rosa and Litton, 2010; Kirsch, Shi, and Sprott, 2012), the underground environment and ventilation (Li and Long, 2011; Witrant et al., 2010; Yang et al., 2010), the development of methods for detecting and measuring underground environmental parameters (Grozdanovic and Bijelić, 2018; Stojiljkovic, Grozdanovic, and Marjanovic, 2014), mining equipment safety (Zeng and Wang, 2010), electrical-related mining mishaps and lessons learned (Abdalla, Kizil, and Canbulat, 2013), human factors in the design of safer mining equipment (Grozdanovic and Janackovic, 2016; Horberry et al., 2013; Horberry, Burgess-Limerick, and Steiner, 2016; Lynas and Horberry, 2011), human reliability analysis (Kovacevic et al., 2016; Tu, 2016), research and development of remote control systems (Grozdanovic, Savic, and Marjanovic, 2015; Grozdanovic, Marjanovic, and Janackovic, 2016; Grozdanovic and Bijelić, 2018; Marjanovic et al., 2016; Wang, Wang, and Pei, 2013), and communication systems (Ranjan, Sahu, and Misra, 2014).
The first generation of process control devices in Serbia, comprising a remote control system for ventilation, gas and fire parameters (OLDHAM), and alarm and voice communication systems, was commissioned in 1983 at Aleksinac coal mine. A second-generation system (DKP-1), produced by EI Institute, was commissioned in Senje coal mine in 1984. This was followed in 1988 by a new, intrinsically safe digital multiplex system (EI SM-64) at Senje coal mine in 1988. The same type of system was installed in the Soko and Ibar mines of the Rembas complex.
There were no clearly defined criteria for ergonomic considerations when these control centres were designed, so little attention was given to functional and ergonomic demands. More research on compatilility between operators and process control elements in these centres is therefore required. A completely new approach to human operator’s activity requires comprehensive study, since even a small error can lead to an accident, breakdown, or even destruction of the entire control system with catastrophic consequences.
An optimized operator-equipment interface is essential in a control centre. Operators are required to maintain high levels of concentration and attention, and also to have immediate control of information displays showing many different types of data, since they are required to continuously comprehend the state of the system.
Investigations of control rooms in coal mines in Serbia have identified several key factors pertaining to their ergonomic design (Grozdanovic, Savic, and Marjanovic, 2015), leading to the formulation of a new integral control model that can be applied in the mining, railway, and electrical power industries in Serbia (Grozdanovic and Janackovic, 2016) and which influenced the development of an informational system for monitoring the impact of underground coal mining on the environment (Stojiljkovic, Grozdanovic, and Marjanovic, 2014).
The functional compliance and efficiency of process control in Serbian coal mines has received increased attention since it was realized that this is not just a matter of human competence and efficiency, but rather a complex human-control interface problemc with far-reaching consequences that requires a comprehensive diagnostic and prognostic evaluation of actual and expected situations in control centres. A systematic approach based on multidisciplinary principles is therefore necessary.
Methodology
Control centres
The process control system in the Rembas mine complex covers four pits – Senje, Strmosten, Jelovac, and Pasuljanske livade, with the main control centre (CC) located in Resavica. There are two transit CCs, one in Vodna for the Strmosten and Jelovac pits and one in Senje. Pasuljanske livade is directly connected to the main CC. This layout is based on the fact that all pits are connected with Resavica by undercuts and are located such that is possible to monitor all data from one main CC. Thus only the main CC needs to be continuously manned, which significantly reduces the number of employee working on ths system. Each transit CC is equipped with a central unit connected with the pit’s substations, from which it gathers the current readings. The central unit displays current and alarm data, supports an alarm data printer and communication with the control panel and alarm-voice communication system and main CC and other necessary equipment. Transit CCs are without operators, but they provide a complete overview of conditions in the pit and when an incident occurs, operators can access these centres and take the necessary actions.
Equipment in CC Rembas (Figure 1) provides a continuous display of current readings for all ventilation, gas, and fire parameter and the states of the alarm-voice communication subsystem (AVS), early warnings and alarms for all parameters and AVS elements, records all current and alarm data, printouts of alarm data and reports on processed data (diagrams, tables, alarm figures).
Equipment consists of:
➤ A control panel with main and backup computers R1 and R2, AVS keyboard for each pit, equipment for recording AVS conversations during alarms, two 19-inch colour monitors, a touch-screen monitor (system monitor), alarm printer for the whole system, report printer, keyboards for R1 and R2, alarm printer for Pasuljanske livade.
➤ Display board for each pit.
➤ Process computer IRI-2, multichannel intrinsically safe interface Ei SNM-64 used for conducting all intrinsically safe
digital and voice communication between the main dispatcher centre and transit centres; other necessary equipment. The overall structure classifies this system as a multihierarchical distributed computer integrated system (DCIS).
Computer R1 works in real-time mode. Process computer IRI-2 supports all communications within the system, and functioning of the touch-screen monitor and printer for automatic printing of all alarm data. In normal conditions the R2 computer performs offline data processing, which includes the following functions:
➤ Receiving and archiving data from R1, and analysis of received data
➤ Creating shift reports in the form of diagrams and tables, displaying and printing reports
➤ Making modifications to the mine’s linear schemes and sending these to R1 so that they can be used in the real-time mode
➤ Making modifications to location plans of measurement sensors and speakers installed in the pits, and sending the current location plan to R1
➤ Monthly data archiving, drafting of paperwork, working in real-time mode in case of an R1 computer failure.
The AVS subsystem provides:
➤ Communication to or alarming of any number of underground or surface communication units connected to the subsystem
➤ Simultaneous alarming of one or more communication units and operators‘ communication with one or more communication units
➤ Voice communications from the pit during an evacuation alarm
➤ Automatic broadcast of standard messages for two hazard levels and variable messages, depending on conditions in the pit
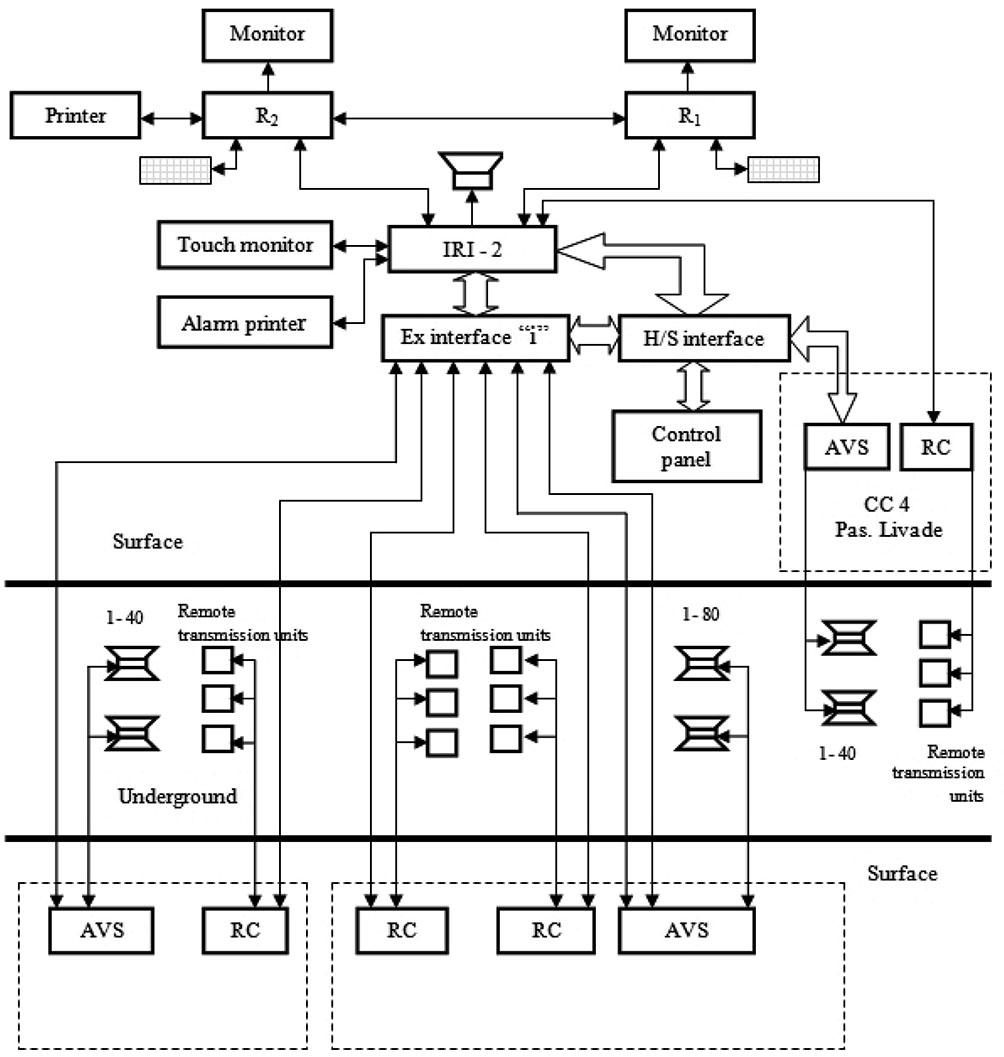
➤ Communication with employees in the pit within 50 m of a communication unit
➤ Automatic recording of alarm situation conversations
➤ Control panel remote controlling
➤ Connection to computer systems
➤ Charging of local energy sources in communication units from central location.
Ergonomic recommendations for control panels
An ergonomic analysis of a control panel begins with a comparison of the parameters of the existing panel with recommendations.
The basic principles of ergonomic design of control panels and of arranging the controls and indicators, as well as the terms of use and type of operation with these controls (Figure 2), are as follows.
➤ Controls and indicators should be arranged taking into account: priority of use and grouped into logical sections, with appropriate interconnections and relationships between indicators and controls.
➤ Grouping of indicators and controls should be done by three principles: functionality (grouping based on function, sequence of use (grouping according to sequence of work tasks that are performed), and importance (the most important indicators and controls are placed in the optimal zone, alarm indicators are easily accessible but not within the optimal zone, and periodically used elements are placed in non-optimal zones).
➤ The accuracy and speed with which operators can identifying indicators and controls should be established, as well as the simplicity of manipulating these controls. Reading errors and their influence on task execution should be identified.
➤ Indicators must be clearly visible from the operator’s position. The most important indicators must be easily recognizable, and there must be a functional interaction between the indicators and controls that they are connected with. To
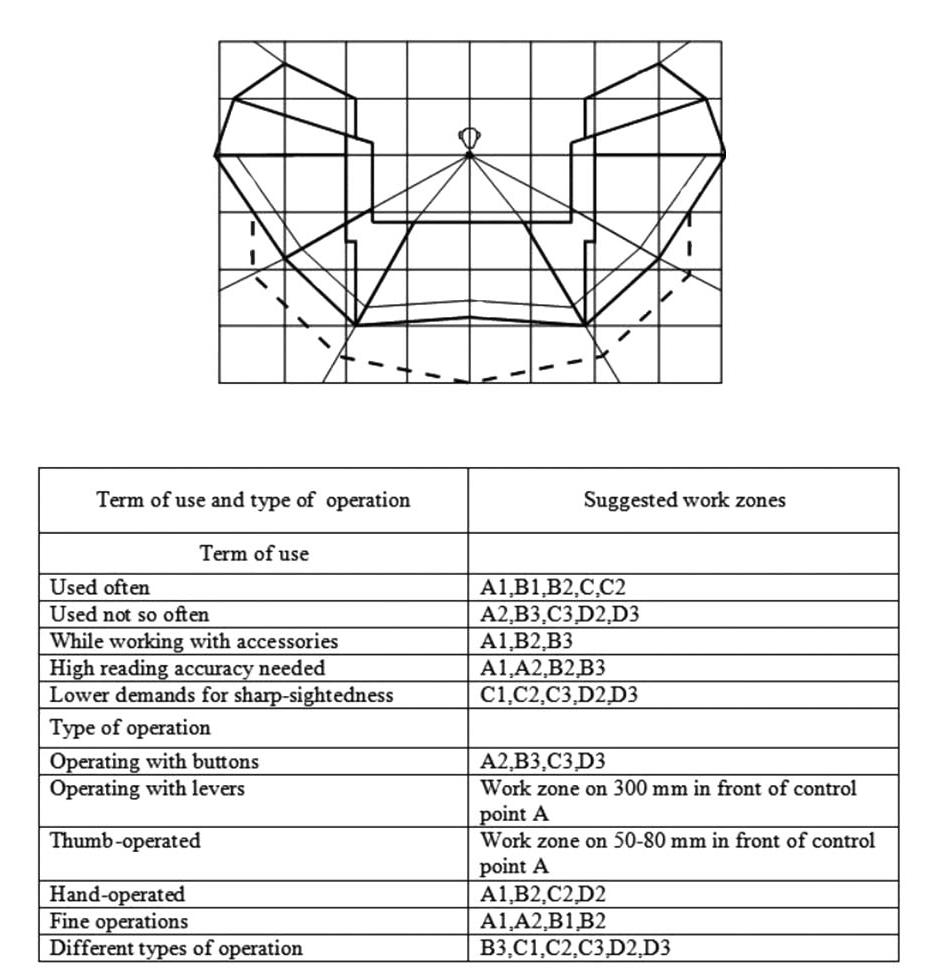
facilitate recognition, groups of six or more indicators should be arranged in rows or columns. Groups of 25-30 indicators should be arranged in two or three visually distinctive sections.
➤ Symbols for labelling indicators or controls should be simple, distinctive, and indicate the function of the indicator or control. A unified design scheme should be used.
➤ Control panels should be non-reflective and not include features that do not contribute to work functionality, The most appropriate colours are light grey, blue-grey, yellow, or dark grey. The dimensions for work in a seated position must not be less than 600 mm in height, 400 mm in depth (at knee level, 600 mm in depth (at floor level), and 500 mm wide.
When it’s necessary to have a clear view above the control panel the height of the panel for work in a seated position should not be greater than 1100 mm from the floor, and all controls should be at 600-1000 mm from the floor.
➤ Since many types of control panel are used in CCs, we will review some principles for arranging indicator and controls as well as their applications (Figure 2) so that we can use the previously discussed design principles to do an ergonomic assessment of an existing control panel.
The equipment in the CC of Rembas mine complex is designed to give a clear, continuous display of all ventilation, gas, and fire parameter readings and states of the alarm-voice communication subsystem (AVS), to record all current and alarm data, to print alarm data at any moment, and print reports about processed data (diagrams, tables, alarm figures etc.).
In order to perform an ergonomic analysis of the control panel it is necessary to compare the existing panel with the recommended design criteria.
The current control panel (Figure 3) is a trapezoid shape to facilitate acces to the process control elements that are placed on the sides of the panel.
Most of the area of the operator’s panel is occupied by the AVS keyboards (Figure 4). There are four keyboards in total, one for each pit, each measuring 400 × 270 mm.
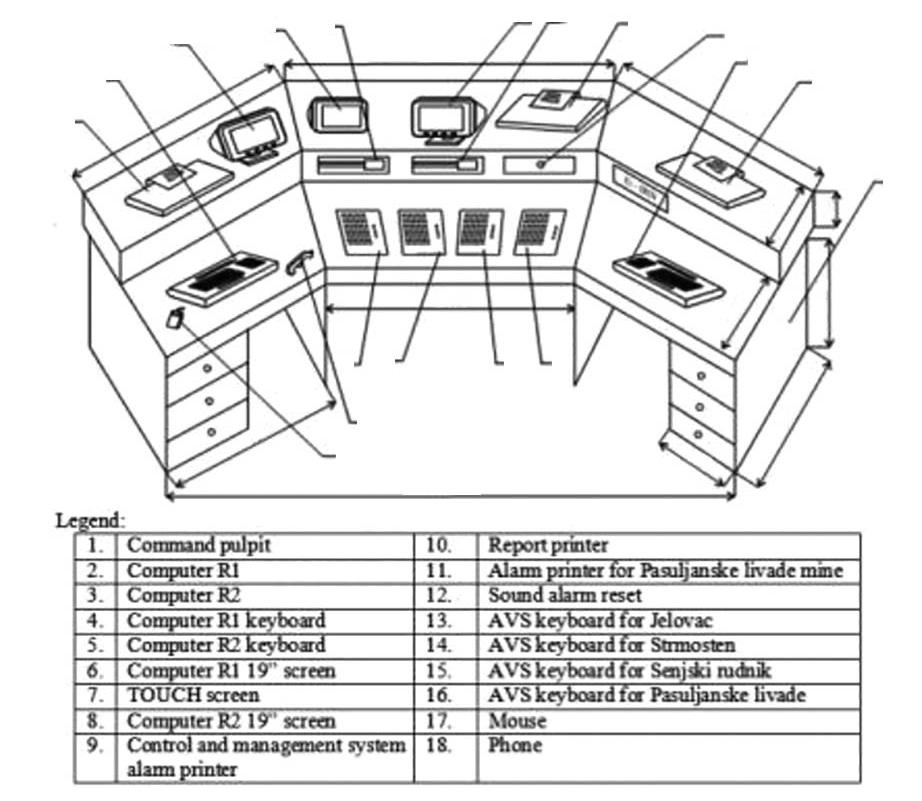
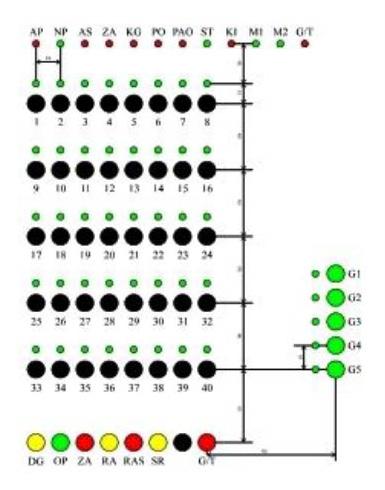
1
9
17
25
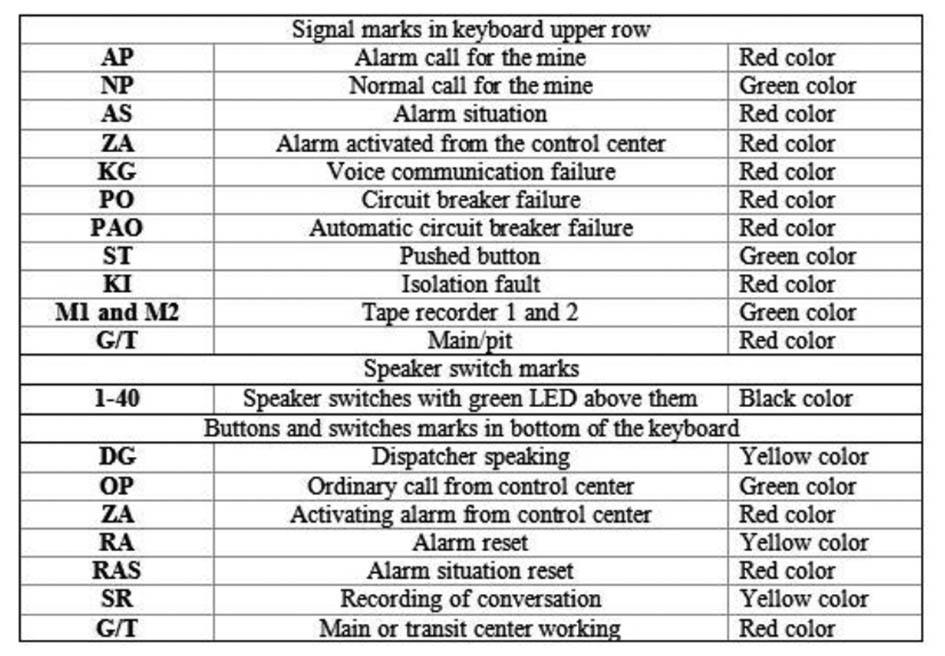
Switches, buttons, and signal indicators on the keyboard are divided into four functional groups. Indicators are located on the upper section of the keyboard; switches that activate the in-pit speakers are located in the middle (largest) section, and buttons for executing certain system functions in the lower section; switches for simultaneous transfer of information from the CC to the designated speakers in the pit are located in the right-hand lower middle section of the keyboard.
Analysis of the operator’s interaction with the keyboard revealed the following.
➤ The layout of signalization, switches, and buttons corresponds to the ergonomic recommendations. These are arranged in four logical groups, there are clear connections between signalization and controls, and the priority of use principle is followed. Labelling is clear. The keyboard is easy to use, and errors while using it are rare. In normal situations keyboard errors do not have a significant influence on the system’s functionality. In an alarm situation errors are nore serious and can have an impact on functionality of the control panel as a whole (for example, if the RAS button is pressed in error this will turn off the tape recorder, which is not permitted in an alarm situation). The indicator layout does not correspond to ergonomic recommendations – the 12 indicators should be grouped into two rows.
➤ The spacing between adjacent switches or buttons is 18 mm, whereas the ergonomic recommendation is 22 mm.
➤ The black colour of the speaker switches does not comply with ergonomic recommendations; they should be white or blue. Colours of the rest of the switches and buttons and all the indicators are according to recommendations.
Ergonomic analysis of the control panel was conducted by measuring, analysing the layout of signal-control elements on the centre and side sections, checking the colour type and comparing the results with the ergonomic recommendations.
The panel’s dimensions are: height of horizontal part 750 mm; depth at knee level 600 mm; depth at floor level 900 mm; frontal part width 1600 mm. These dimensions correspond to the ergonomic recommendations. However, the shape of the panel is not compliant since most of the right-hand side is out of reach when the operator is seated.
The layout of elements in the centre and side sections was analysed by comparing the data gathered (Figure 5) with the recommendations for terms of use, type of operation, and work zones (Figure 3).
By applying the terms-of-use principle to the keyboards three groups of switches and buttons can be identified: frequently used (buttons DG and OP and switches 1-40); used in alarm situations (buttons ZA, RA, RAS and switches 1-40); rarely used switches (G/T, SR, and G1- G5).
Compliance of these terms of use with recommended work zones depends on compliance of keyboard T1-T4 positions on the panel’s front section with recommended work zones. Keyboards T2 and T3 are positioned in appropriate work zone A. Parts of T1 and T4 keyboards located in zone B are outside the recommended range of 0-600 mm. Keyboard T1 should be moved 150 mm to the right and T4 100 mm to the left.
The R1 computer keyboard in zone C is outside of the recommended range of 0-800 mm and is thus not compliant with ergonomic recommendations. The keyboard of the R2 computer on the left side of the panel, which functions automatically as a backup in the case of R1 failure, is not positioned according to ergonomic requirements.
As regards ‘type of operation’ criteria, all switches and buttons are push-type.
The white colour of the panel corresponds with ergonomic recommendations.
The above analysis clearly shows that ergonomic recommendations were not taken into account when designing this control panel.
In the CC of Rembas mine complex, data is displayed on three graphic screens: the 19-inch colour monitor of computer R1, with 1230 × 860 resolution, which shows information in real time; a touch-screen monitor, displaying information based on functional demands; and the 19-inch colour monitor of computer R2, with 1230 × 860 resolution, which shows diagrams and tables that are generated offline by computer R2.
All three monitors are located on the panel’s rear section, which is 400 mm wide and extends 150 mm above the front section of the panel (see Figure 3). From an ergonomic point of view, the R1 colour monitor and the touch-screen monitor are especially interesting since they display both current and alarm data in real time. Measurements in the CC reveaked that:
➤ The distance (L) between the R1 monitor and dispatcher’s eyes is 1050 mm
➤ Size of the symbols for labelling process control devices (S) is 5 × 5 mm
➤ The symbols for marking the mine galleries, current measurents, and alarm data and device numbers measure 5 × 3 mm
➤ Angles of vision are determined from Figure 5 and the following formula:
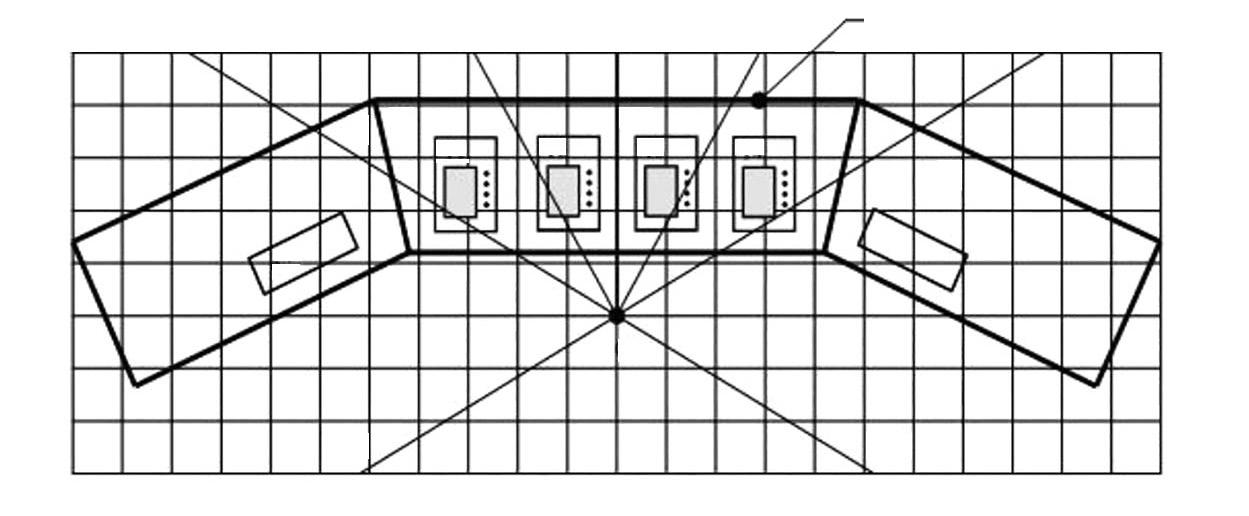
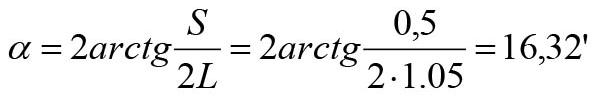
For our conditions where precise readings are required, angle α should be 35-40’. It is obvious that ergonomic recommendations were not considered when this information display was installed.
The distance (L) at which the colour monitor should be situated so that the operator can quickly and accurately read the necessary symbols or alphanumeric values is calculated by the following formula:
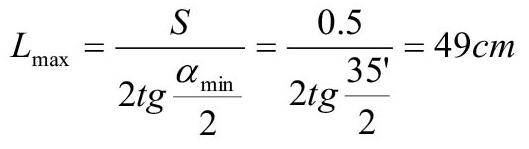
The correct distance can be realized by placing the colour monitors right on the edge of the panel’s raised front section
The same conditions apply to the touch-screen monitor since sign height (S) and distance (L) are the same. The construction of this monitor does not allow it to be moved in order to provide a 35’ angle. This can only be achieved by modifying the panel. We will calculate the distance L that will allow the operator to obtain the precise reading, but not quickly. Angle α for this situation, according to the recommendations, is 18’ to 20’. For distance L we obtain:
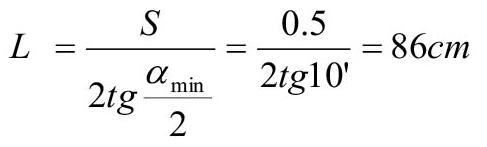
In the present situation there is room to move this display forward by 19 cm.
The colour scheme used on the real-time information display is compared with the recommended colours in Table I.
Table I
Background Dark blue Dark Y
Mine tunnels Red, blue1 - -
Normal conditions Light blue Green N
Early warning Dark blue2 Yellow N
Alarm Red2 Red Y
Total colours 5 3-7 Y
1In underground coal mines worldwide red is used to denote an inlet air flow and blue an outlet
2With blinking symbol on control device
Parameters for sensitivity and screen contrast and illumination of the workplace are not given here. It is therefore not possible to reach a final verdict on the quality of the information display. However, it’s obvious that the colours were not chose based on ergonomic recommendation.
In underground mines the location of work sites is constantly changing, and thus control instruments also have to be moved. These changes must be updated in the remote control system in order to obtain the correct data. However, updating these changes on the display board is often forgotten. This troubles the operators, as was pointed out in interviews conducted with them. These boards enable the CC operators to view the layout of control instrumentation inside the mine, the dimensions of the workings, diagrams of parameter changes, and to obtain a realistic picture of the environmental conditions in the entire pit. Based on this analysis, important data is gathered, such as the locations where methane may accumulate or spontaneous combustion occur, and the condition of the ventilation system. For example, when an accident occurred in Soko mine in 1998, by using the display board, together with data about the location of the explosion and the timing and location of damage to the ventilation doors, it was calculated that the speed of the blast after the methane explosion was around 300 km/h. Boards are placed behind and above the monitors on the CC wall or on separate stands at a distance appropriate for the operator. These boards are of great value and should be updated regularly to reflect changes inside the pit and should be improved. This mainly applies to improving the way of updating these boards based on the progress of mining operations and appropriate changes in process control devices layout.
Existing design solutions for control centres show some significant deficiencies related to: functional suitability and operator efficiency, particularly as regards the ergonomic aspects of process control equipment usage. Since there are no criteria for size and layout of equipment, and given the large number of instruments and communication devices, there are no clear guidelines for deciding which solutions to choose in order to enhance operators’ functionality and efficiency.
These deficiencies are present because no research was conducted before these control centres were installed. Their combined impact poses a hypothetical ‘model-problem’. Attempts to solve this problem by presenting proposals regarding optimal functional suitability and efficiency, as well as information compliance, for control centre operators will significantly improve the functioning of the entire control system.
Acknowledgments
This paper has been financed by the Ministry of Science and Technology Development of the Republic of Serbia, under Project no. 43014.
References
Abdalla, S., Kizil, M.S., and Canbulat, I. 2013. Development of a method for layout selection using analytical hierarchy process. Proceedings of the 2013 Coal Operators' Conference, University of Wollongong, 18-20 February. https:/ ro.uoweduaucgiviewcontentcgi?article=2096&context=coal
De Rosa, M. and Litton, C. 2010. Rapid detection and suppression of mining equipment cab fires. Fire Technology, vol. 46, pp. 425–435.
Dhillon, B. 2010. Mine Safety. Springer, London.
Grozdanovic, M. and Bijelic, B. 2020. Ergonomic design of display systems in control rooms of complex systems in Serbia. Process Safety Progress, vol. 40, no. 2. https://doi.org/10.1002/prs.12205
Grozdanovic, M. and Bijelić, B. 2018. Impact of human, workplace and indoor environmental risk factors on operator’s reliability in control rooms. Human and Ecological Risk Assessment, vol. 26, pp. 177–189.
Grozdanovic, M. and Janackovic, G. 2016. The development of a new integral control model based on the analysis of three complex systems in Serbia. Cognition, Technology & Work, vol. 18, September, pp. 761–776.
Grozdanovic, M., Marjanovic, D., and Janackovic, G. 2016. Control and management of coal mine with control information system. Arabian Journal of of Information Technology, vol. 13, pp. 387–395.
Grozdanovic, M., Savic, S., and Marjanovic, D. 2015. Assessment of the key factors for ergonomic design of management information systems in coal mines. International Journal of Mining, Reclamation and Environment, vol. 29, pp. 96–111.
Horberry, T., Burgess-Limerick, R., and Steiner, L. 2016. Human Factors for the Design, Operation, and Maintenance of Mining Equipment. CRC Press, Boca Raton, FL.
Horberry, T., Xiao, T., Fuller, R., and Cliff, D. 2013. The role of human factors and ergonomics in mining emergency management: three case studies. International Journal of Human Factors and Ergonomics, vol. 2, no. 2–3, pp. 116–130.
Kirsch, P., Shi, M., and Sprott, D. 2012. Riskgate: Industry sharing risk controls across Australian coal operations. Australian Journal of Multi-Disciplinary Engineering, vol. 11, pp. 47–58.
Kovacevic, S., Papic, L., Janackovic, G., and Savic, S. 2016. The analysis of human error as causes in the maintenance of machines: a case study in mining companies. South African Journal of Industrial Engineering, vol. 27, no. 4, pp. 193–202. https://doi.org/10.7166/27-4-1493
Li, J. and Long, J. 2011. Coal mining environment security assessment based on AHP –Taking Luolong coal mine in Guizhou province for example. Proceedings of the 2011 International Conference on Remote Sensing, Environment and Transportation Engineering, Ninjang, China. IEEE, New York. pp. 8112–8114. doi: 10.1109/RSETE.2011.5964038
Lynas, D. and Horberry, T. 2011. Human factor issues with automated mining equipment. The Ergonomics Open Journal, vol. 4, August, pp. 74–80.
Marjanovic, D., Grozdanovic, M., Janackovic, G., and Marjanovic, J. 2016. Development and application of measurement and control systems in coal mines. Measurement and Control, vol. 49, February. pp. 18–22.
Ranjan, A., Sahu, H., and Misra, P. 2014. Wave propagation model for wireless communication in underground mines. Proceedings of the 2015 IEEE Bombay Section Symposium (IBSS), Mumbai, India IEEE, New York. pp. 1-5. doi: 10.1109/IBSS.2015.7456655
Stojadinović, S., Svrkota, I., Petrović, D., Denić, M., Pantović, R., and Milić, V. 2011. Mining injuries in Serbian underground coal mines – A 10-year study. Injury, vol. 43, pp. 2001–2005.
Stojiljkovic, E., Grozdanovic, M., and Marjanovic, D. 2014. Impact of the undergroud coal mining on the environment., Acta Montanistica Slovaca, vol. 19, no. 1, pp. 6–14. https://actamont.tuke.sk/pdf/2014/n1/2stojiljlikovic.pdf
Tu, J. 2016. Human reliability analysis of roof bolting operation in underground coal mines. Quality and Reliability Engineering International, vol. 32, no. 7, pp. 2253–2261. https://doi.org/10.1007/978-3-642-31698-2_26
Wang, L., Wang, Y., and Pei, J. 2013. Coal mine ventilator remote monitoring system based on the fuzzy control. Proceedings of the 2012 International Conference on Communication, Electronics and Automation Engineering. Springer, Berlin, Heidelberg. pp. 181–186.
Witrant, E., D'innocenzo, A., Sandou, G., Santucci, F., Di Benedetto, M., Isaksson, A., Johansson, K., Niculescu, S.-I., Olaru, S., Serra, E., Tennina, S., and Tiberi, U. 2010. Wireless ventilation control for large-scale systems: The mining industrial case. International Journal of Robust and Nonlinear Control, vol. 20, pp. 226–251.
Yang, S., Pang, W., Wen, H., Yu, B., Ma, Z., and Huang, R. 2010. Theoretical analysis and applications of Y-inversion ventilation system in a mine fire zone. Mining Science and Technology (China), vol. 20, September, pp. 672–676.
Zeng, Q. and Wang, X. 2010. Safety evaluation of coal mines based on analytic hierarchy process. Proceedings of the 2010 International Conference on Management and Service Science, Wuhan, China. IEEE, New York. pp. 1–4. doi: 10.1109/ ICMSS.2010.5578200 u
Affiliation:
1Faculty of Land Resource Engineering, Kunming University of Science and Technology, Kunming, Yunnan, 650093, China
2Department of Mining Engineering, Karakoram International University (KIU), Gilgit, Pakistan
3Department of Mining Engineering University of Engineering and Technology, Lahore Pakistan
Correspondence to: N. Abbas
K.G. Li
Email: naeem.abbas@kiu.edu.pk likegang_78@163.com
Dates:
Received: 30 Jan. 2023
Revised: 21 Apr. 2023
Accepted: 1 Sept. 2023
Published: May 2024
How to cite:
Abbas, N., Li, K.G., Emad, M.Z., and Khan, A. 2024. Quantifying uncertainty in rock mass properties: Implications for GSI, RMi, and RMR assessments. Journal of the Southern African Institute of Mining and Metallurgy, vol. 124, no. 5. pp. 285–292
DOI ID:
http://dx.doi.org/10.17159/24119717/2599/2024
ORCID:
N. Abbas
http://orcid.org/0000-0002-4495-8144
by N. Abbas1,2, K.G. Li1, M.Z. Emad3, and A. Khan1
Abstract
Probability-based empirical methods were employed as an alternative approach to predicting uncertainties associated with rock mass properties. The focus was on developing probabilistic spreadsheets to forecast rock mass classification indexes. Histograms were constructed to describe the best distribution in predicting rock mass properties. The developed models also offer utility in predicting the impact of discontinuities within the rock mass on rock strength and rock mass classification systems. Statistical analyses identified volumetric joint count, joint spacing, joint frequency, and rock strength as the most influential parameters. Moreover, the statistical analysis revealed varying degrees of correlation among different rock mass properties. While some properties demonstrated significant correlations suitable for modelling, others did not align well with any correlation model. The results highlight the need for a comprehensive approach to rock mass characterization, considering multiple factors beyond volumetric joint count. Geological complexities, including tectonic activity and weathering processes, may obscure direct correlations. These results emphasize the importance of empirical modelling and detailed site investigations for accurate assessment of rock mass quality and stability in the Himalaya.
Keywords rock mass classification, probability, spreadsheet, correlation
Introduction
A rock mass comprises two distinct aspects: intact rock and discontinuities, each exerting significant influence on the overall strength and deformability of the rock mass. Furthermore, the extent of weathering is widely acknowledged to have a substantial impact on the in-situ engineering characteristics of rocks (Park and West, 2001). Therefore, accurate assessments of strength and deformability are crucial for rock mass characterization. Although the structural characteristics and degree of weathering of the rock mass have the greatest influence on near-surface mine workings, the characteristics of rock formations encountered in mining vary widely, both geographically and randomly, and they are rarely predictable with certainty (Abbas et al., 2023; Qin et al., 2024).
Preliminary design research must adequately explain the random characteristics of natural materials like soil and rock. since they are inherently diverse and unpredictable (Abbas et al., 2024; Sari, Karpuz, and Aydaya, 2010). Currently, a stochastic system is preferred to deterministic variation in rock mass properties (Sari, Karpuz, and Aydaya, 2010). In a stochastic estimation, it is possible to take into account all available information regarding a certain random quality. Probability distributions, which provide both the possible range of values for the variable and the relative frequency of each value within that range, make this simple to accomplish (Evans et al., 2011). In earlier studies, statistical and probabilistic techniques were applied to calculate the minimum number of specimens needed for rock mechanics laboratory testing or to estimate the strength and deformability of rocks from laboratory experiments (Gill, Corthésy, and Leite, 2005; Sari and Karpuz, 2006).
The variability of the mechanical characteristics of a rock mass is challenging to experimentally assess (Abbas et al., 2023). When there is a lack of site data, rock engineers commonly use empirical methods to determine rock mass attributes (Barton et al., 1974; Hoek and Bray, 1981).
The Himalayan rocks present a unique complexity stemming from a history of intense tectonic activity, yet there is a notable lack of studies concerning rock mass classification in this region (Abbas et al, 2022). Existing classifications are utilized for assessing slope and tunnel stability; however, a significant source of uncertainty lies in the analysis of discontinuities within jointed rock masses. Despite the critical importance of understanding this uncertainty for ensuring infrastructure safety and stability in the Himalayas, research in this area has garnered limited attention. Consequently, there is a pressing need for deeper study of
uncertainty associated with jointed rock masses in the Himalayas to enhance comprehension and management of geological hazards in this region.
In this study we investigate uncertainty in the computation of key rock engineering indices such as the Geological Strength Index (GSI), Rock Mass Index (RMI), and Rock Mass Rating (RMR). To achieve this objective, data has been gathered from ongoing tunnelling projects traversing the Himalayas in northern Pakistan. Leveraging existing statistical models, this research aims to identify the most influential parameters affecting GSI, RMI, and RMR. We present empirical correlations of rock mass parameters specifically for the challenging geological conditions of the Himalayan region. These correlations are designed to enhance the understanding of rock mass behaviour and stability assessment in this unique and complex terrain.
Statistical analysis of rock mass: Past studies
In the literature, there are a limited number of studies that consider uncertainty in RMR, RMI, and GSI. Monto Carlo (MC) simulation has been used to incorporate uncertainty in GSI from Kizikaya and New Zealand greywacke (Sari, 2015), leading to the conclusion that the MC method is a viable tool for assessing the variability of rock mass properties. A probabilistic method to characterize the mechanical behaviour of rock mass has been presented by Kim and Gao (1995). Doyuran, Ayday, and Karahanoglu (1993) looked into the most suitable frequency distributions for aperture, persistence, and spacing of discontinuities in andesite, marble, and peridotite. Recent studies have investigated correlations of rock mass classification systems specifically for underground excavations in the Himalayas (Abbas et al., 2023). Statistical analysis revealed that within a single rock mass, the degree of weathering and the orientation of discontinuities significantly influence the frequency distributions of discontinuity parameters.
Research methodology
The GSI (Hoek, Kaiser, and Bawden, 2000) and RMR (Bieniawski, 1973) are frequently used in surface and subsurface geotechnical investigations. Through their extensive usage and validation across diverse geological settings, the GSI and RMR frameworks have earned recognition as indispensable resources in the field of rock mechanics and engineering geology.
The first parameter of the RMR, the joint compressive strength (JCS) (ISRM, 1978), is given by
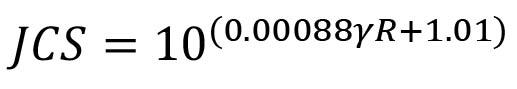
where γ is the unit mass of rock material (expressed in kN/m3) and R is the representative rebound, i.e. the mean of the five higher measured values on a set of ten measurements for each tested discontinuity.
The second parameter used to determine RMR has been indirectly derived by Palmstrom (1982), who suggested that when cores are not available, the RQD may be estimated from the number of joints per unit volume, by summing the number of discontinuities per metre for each joint. The conversion formula for clay-free rock masses is
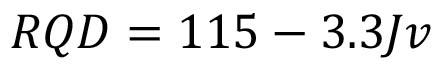
where Jv is the volumetric joint count, which represents the total number of joints within a unit volume of rock mass and can be derived from the average spacing of each discontinuity.
When RQD = 0 for Jv > 35, and RQD = 100 for Jv < 4.5,
Here s1, s2, and s3 are the joint set spacings. Random joints can be included by assuming a random spacing (sr) for each of these. Experience indicates that this can be set to sr = 5 m, thus, the volumetric joint count can be generally expressed as
The condition of discontinuities includes the following properties:
[4]
Persistence describes the discontinuity length Aperture has been measured using ISRM classes (ISRM, 1978). The roughness of surfaces, The Joint Roughness Coefficient (JRC) is probably the most commonly used measure of the roughness of rock joint surfaces. The JRC is evaluated by visual comparison of measured profiles against a set of standard JRC profiles produced by Barton and Choubey (1977).
The fifth parameter of the RMR classification takes into account the occurrence of water along discontinuities.
The frequency distribution of data is shown in Figure 1.
The GSI has been empirically correlated with RMR and jointing parameter (JP). The jointing parameter, which expresses the reduction of intact strength of a rock mass, is calculated as
[5]
Here JP is joint parameter, Vb is block volume, and JC is the joint condition factor, including roughness and size of the joints, while the exponent D is 0.37 ×JC −0.2. It varies from 0.2 to 0.6. In common conditions JC = 1.75.
The GSI chart proposed by Hoek considered only two parameters: block volume and weathering conditions. However, Hoek, Marinos, and Benissi (1998) suggested the following relationship between GSI and RMR.
[6]
Cai and Kaiser (2006) incorporated the jointing condition factor (JC) and the block volume (Vb) and suggested the following relationship.
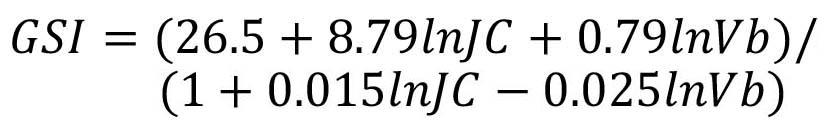
Russo (2009) considered the jointing parameter and suggested the following equation for GSI:
[7]
Another important rock mass classification unit is RMI. Palmstrom (1996) proposed the following equation for RMI by incorporating the uniaxial compressive strength (σc) and the jointing parameter:
[2]
[8]
[9]
Kumar, Samadhiya, and Anbalagan (2004) developed an empirical relationship between of RMI and Q for rocks mass along the Himalayas.

The RMR is another rock mass index frequently used in geotechnical projects. Bieniawski (1984) developed the following equation to derive RMR from Q:
[10]
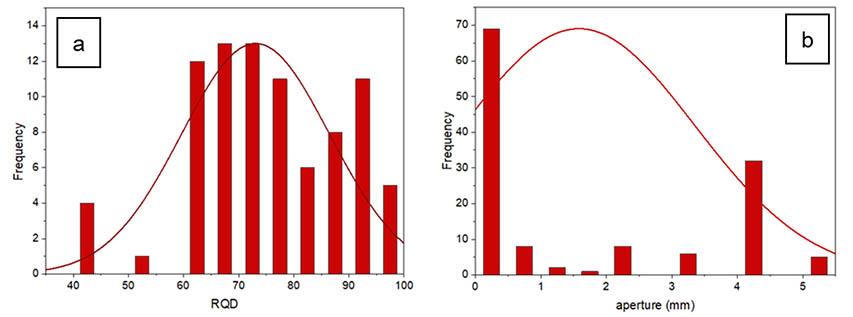
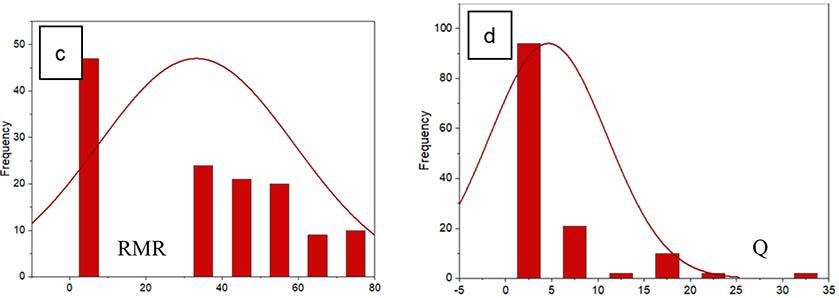
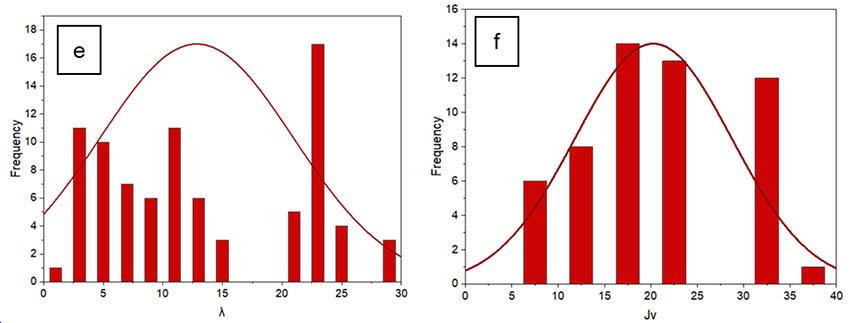
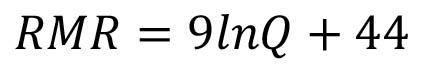
Rutledge and Perston (1978) suggested the following relationship:
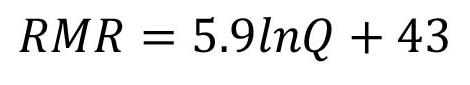
Results and discussion
The descriptive statistics of the rock mass classifications are given in Table I. The RQD is in the range of 40 to 95. The RMR value is 38 to 77. The mean values of RQD and RMR are 73 and 50 respectively. The probabilistic wanalysis of the RQD, RMI, and RMR is as follows. The probabilistic models of Equations [6–8] are shown in Figure 2. The distribution that best describes the data is Equation [6], since the GSI calculated from RMR using Equation [6] is more consistent and the data is less scattered compared to the other two equations. One of the drawbacks of Equation [8] is that the GSI calculated is close to or greater than 100, which is meaningless. The mean value of GSI is the same for all three equations; however, the GSI values calculated for the same rock mass are different.
The RMI calculated from Equations [9] and [10] is shown in Figure 3. Equation [10] (suggested by Kumar, Samadhiya, and Anbalagan) is more consistent and the data is less scattered
Table I
Descriptive
compared to Equation [9]. Kumar, Samadhiya, and Anbalagan (2004) developed their correlation for the Himalayas. This is why the correlation is the most suitable for RMI, as the data used in this study was from a tunnelling project in that region. This shows that the empirical correlations are dependent on rock type and regional geology.
Similarly, the RMR calculated from Equations [11] and [12] are dissimilar for the same rock mass (Figure 4). Equation [11] is more consistent than Equation [12]. Hence it can be said that the
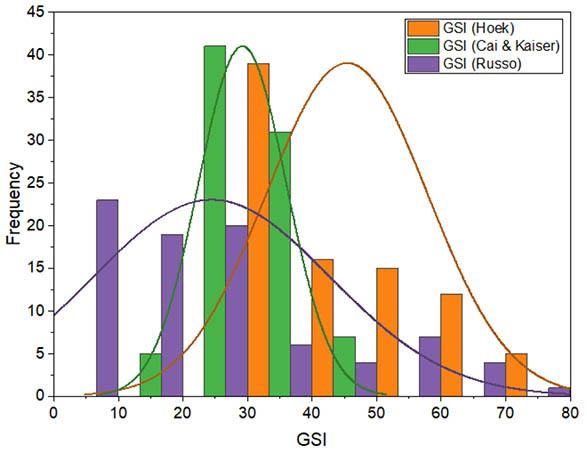
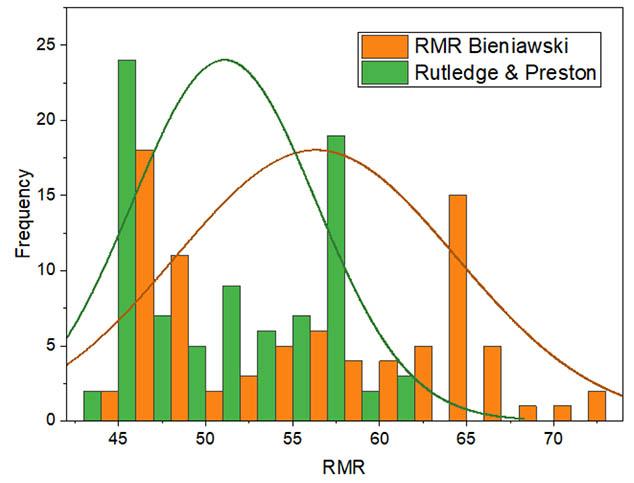
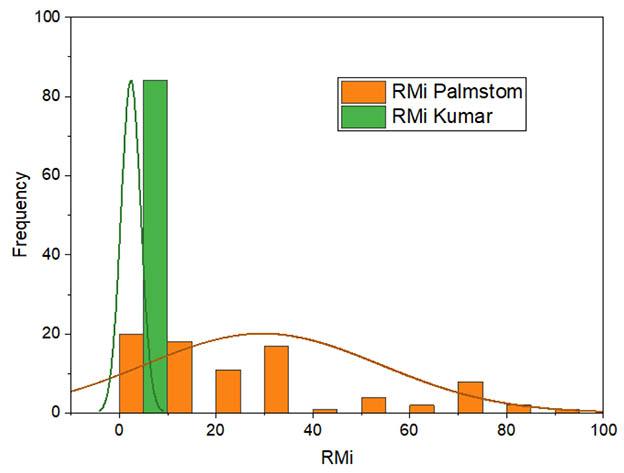
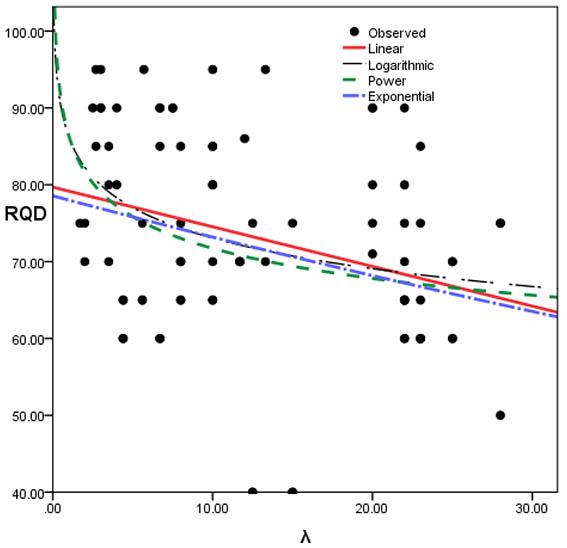
rock strength and other parameters are rock-dependent and a single correlation between rock mass properties may not be representative for all rock types. It is recommended that more realistic correlations be used for different rock types based on regional geology.
A specific correlation of RQD from joint frequency for the Himalayas is presented in Equation [13]. Four statistical models (Figure 5) –linear, power, exponential, and logarithmic – were applied to the data. It was observed that the best fit model is exponential [Equation 13]. Here the data is less scattered with a strong correlation coefficient of 0.8 (Table III). Figure. 6 shows the correlation between volumetric joint count and RQD. No significant correlation was observed in any type of statistical model. None of the models are statistically significant as the correlation coefficients are less than 0.5 (Table IV).
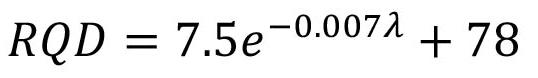
where λ is the average number of discontinuities per metre, λ = 1/ (mean joint spacing). The distribution of spacing must be negatively exponential if the theoretical RQD is to be applied to a particular rock.
The correlation of different rock mass properties for a single rock type is shown in Table II. The RQD has a good correlation with Vb, joint spacing (Js), and joint aperture (a), with correlation coefficients greater than 0.5. RQD is not significantly correlated with RMR. This suggests that RQD, reflecting the degree of rock mass integrity and fracturing, exhibits meaningful relationships with these specific geometric and structural characteristics of the rock mass. However, it is important to note that RQD does not exhibit a significant correlation with RMR. This discrepancy could stem from the broader scope of RMR, which incorporates additional factors beyond RQD, such as joint orientation, joint roughness, and groundwater conditions. Consequently, while RQD provides valuable informations into certain aspects of rock mass behaviour, its limited correlation with RMR highlights the need for a comprehensive approach to rock mass characterization, considering a range of parameters to accurately assess rock mass stability and engineering properties.
The application of statistical models to analyse RQD derived from joint frequency data for the Himalayas is crucial for understanding the rock mass characteristics in this complex geological setting. The observation (Table III) that the exponential model provides the best fit suggests that the relationship between RQD and joint frequency in the Himalayas is nonlinear and exhibits exponential growth or decay. This result could be attributed to various geological factors influencing joint frequency and RQD (Deere, 1989). For instance, in regions with intense tectonic activity like the Himalayas, the distribution and density of fractures may follow complex patterns influenced by faulting, folding, and other structural features. Additionally, geological processes such as weathering and erosion may further alter the distribution of fractures, leading to nonlinear relationships between joint frequency and RQD (Abbas et al., 2022).
Moreover, the exponential model may better explain the diminishing returns or saturation effects observed in RQD as joint frequency increases. This phenomenon could reflect the decreasing proportion of intact rock at higher joint frequencies, where the fractures become increasingly interconnected, reducing the overall RQD value.
The lack of significant correlation between volumetric joint count and RQD, as depicted in Figure 6 and confirmed by the statistical analysis presented in Table IV, highlights an important aspect of rock mass characterization in the Himalayas. Despite efforts to explore potential relationships using various statistical models, including linear, power, exponential, and logarithmic models, none yielded statistically significant results, with all
Table II
Correlation among rock mass properties
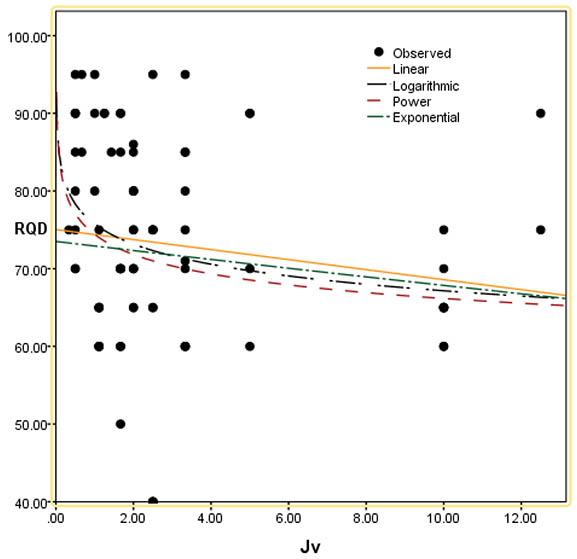
Figure 6—Correlation of RQD with volumetric joint count
correlation coefficients below 0.5. The results suggests that in the context of the Himalayas, volumetric joint count alone may not be a reliable predictor of RQD, indicating the presence of additional factors influencing rock mass integrity and fracturing other than sheer volume of joints. Several factors could contribute to this lack
** Correlation is significant at the 0.01 level (2-tailed).
* Correlation is significant at the 0.05 level (2-tailed).
Table III
Model summary and parameter estimates
Table IV
Model summary and parameter estimates
of correlation. The complex geological history and tectonic activity in the Himalayan region may lead to complex fracture patterns and distributions that are not solely determined by volumetric joint count (Shah et al., 2023). Other factors such as joint orientation, spacing, and roughness, as well as the degree of weathering and rock type, may play significant roles in determining RQD. Furthermore, the influence of volumetric joint count o RQD may be offset by other factors that exert greater control over rock mass quality. For example, in heavily fractured rock masses with high volumetric joint count, the overall rock mass integrity and RQD may still be relatively high if the fractures are predominantly closed or filled, mitigating their impact on rock mass behaviour.
A probability-based analysis was performed to incorporate uncertainty in rock mass properties. The rock mass classification indexes GSI, RMR, and RMI were investigated using their proposed empirical equations. For GSI three equations were examined: a general equation proposed by Hoek, Marinos, and Benissi (1998) (Equation [6]), and relationships proposed by Cai and Kaiser (2006) and Russo (2009) (Equations [7] and [8]). The three suggested equations yield completely different values of GSI. In practical applications, the Hoek, Marinos, and Benissi equation is recommended for estimation of GSI along the Himalayas, as the data is less scattered compared to the other two equations. In the case of RMI two equations (Equations [9] and [10]) were examined. Equation [10] (Kumar, Samadhiya, and Anbalagan, 2004) is more consistent and the data is less scattered compared to Equation [9], as the equation was developed using similar data along the Himalayas. Likewise, the RMR values calculated from Equations [11] and [12] are dissimilar for the same rock mass. Equation [11] is more consistent than Equation [12]. Hence it can be concluded that the rock strength and other parameters are rockdependent and a single correlation between rock mass properties may not be representative for all rock types.
The results from the correlation analysis between volumetric joint count and RQD in the Himalayan region highlight the complexity of rock mass characterization in this geologically diverse and tectonically active area. Despite efforts to establish a relationship between volumetric joint count and RQD using various statistical models, none yielded statistically significant results, indicating a lack of strong correlation between these parameters. Geological complexities, such as varying fracture patterns influenced by tectonic activity and weathering processes, may obscure the direct relationship between volumetric joint count and RQD. Other factors such as joint orientation, spacing, roughness, and the degree of weathering may also have significantl influence on rock mass quality and behaviour, further complicating the correlation analysis.
The absence of a significant correlation between volumetric joint count and RQD emphasizes the importance of comprehensive site investigations and empirical modelling approaches in the Himalayan region.
Conflicts of Interest:
The authors declare no conflict of interest
References
Abba, N., Shah, K.S., Qureshi, J.A., Khan, H., Hussain, J., and Ali, A. 2023. Predictive models for uniaxial compressive strength of dry and saturated marble: An empirical approach. Journal of Himalayan Earth Science, vol. 56, no. 2, p. 60.
Abbas, N., Khan, I., Afayou, A., Khan, A., and Alam, N. 2024. Enhanced geotechnical methods for evaluating slope stability in unconsolidated strata: A comprehensive analysis. Journal of Mining and Environment doi:10.22044/jme.2024.14023.2615
Abbas, N., Li, K.-G., Emad, M. Z., Qin, Q., Li, M., Shah, K.S., and Qiu, S. 2023. Empirical evaluation of RMR, GSI, and Q for underground excavations. Iranian Journal of Science and Technology, Transactions of Civil Engineering. doi:10.1007/s40996-023-01275-8
Abbas, N., Li, K., Khan, A., and Qureshi, J.A. 2022. The influence of thermal breakage on physio-mechanical behavior of Ghulmet marble north Pakistan. International Journal of Mining and Geo-Engineering, vol. 56, no. 2, pp. 199–203. doi:10.22059/ ijmge.2021.318906.594891
Abbas, N., Li, K. G., Abbas, N., and Ali, R. 2022. Correlation of Schmidt hammer rebound number and point load index with compressive strength of sedimentary, igneous and metamorphic rocks. Journal of Mining Science, vol. 58, no. 6, pp. 903–910. doi:10.1134/S1062739122060047
Barton, N. and Choubey, V. 1977. The shear strength of rock joints in theory and practice. Rock Mechanics, vol. 10, no. 1, pp. 1–54.
Barton, N., Lien, R., and Lunde, J. 1974. Engineering classification of rock masses for the design of tunnel support. Rock Mechanics, vol. 6, no. 4, pp. 189–236.
Bieniawski, Z. 1973. Engineering classification of jointed rock masses. Civil Engineering/Siviele Ingenieurswese, vol 12, pp. 335–343. https://journals.co.za/doi/pdf/10.10520/ AJA10212019_17397
Bieniawski, Z.T. 1984. Rock Mechanics Design in Mining and Tunneling. Balkema, Rotterdam.
Cai, M. and Kaiser, P. 2006. Visualization of rock mass classification systems. Geotechnical & Geological Engineering, vol. 24, no. 4, pp. 1089–1102.
Deere, D. U. and Deere, D.W. 1989. Rock quality designation (RQD) after twenty years. US Army Engineer Waterways Experiment Station, Vickburg, MS.
Doyuran, V., Ayday, C., and Karahanoglu, N. 1993. Statistical analyses of discontinuity parameters of Gölbaši (Ankara) andesites, Süpren (Eskišehir) marble, and Porsuk Dam (Eskišehir) peridotite in Turkey. Bulletin of the International Association of Engineering/Geology-Bulletin de l'Association Internationale de Géologie de l'Ingénieur, vol. 48, no. 1, pp. 15–31.
Evans, M., Hastings, N., Peacock, B., and Forbes, C. 2011. Statistical Distributions. Wiley.
Gill, D.E., Corthésy, R., and Leite, M.H. 2005. Determining the minimal number of specimens for laboratory testing of rock properties. Engineering Geology, vol. 78, no. 1–2, pp. 29–51.
Hoek, E., and Bray, J.D. 1981. Rock Slope Engineering. CRC Press.
Hoek, E., Kaiser, P.K., and Bawden, W.F. 2000. Support of Underground Excavations in Hard Rock. CRC Press.
Hoek, E., Marinos, P., and Benissi, M. 1998. Applicability of the Geological Strength Index (GSI) classification for very weak and sheared rock masses. The case of the Athens Schist Formation. Bulletin of Engineering Geology and the Environment, vol. 57, no. 2. pp. 151–160.
ISRM (International Society for Rock Mechanics). 1978. Suggested methods for the quantitative description of discontinuities
in rock masses. International Journal of Rock Mechanics and Mining Sciences & Geomechanics Abstracts, vol, 15, pp. 319–368
Kim, K. and Gao, H. 1995. Probabilistic approaches to estimating variation in the mechanical properties of rock masses. International Journal of Rock Mechanics and Mining Sciences & Geomechanics Abstracts, vol. 32, no. 3, pp. 111–120.
Kumar, N., Samadhiya, N.K., and Anbalagan, R. 2004. Application of rock mass classification systems for tunneling in Himalaya, India. International Journal of Rock Mechanics and Mining Sciences, vol. 41, pp. 852–857.
Palmström, A. 1982. The volumetric joint count — a useful and simple measure of the degree of rock mass jointing. Proceedings of 4th International Congress IAEG, New Delhi, 10–15 December 1982. Balkema, Rotterdam. pp. 221-228.
Palmström, A. 1996. Characterizing rock masses by the RMi for use in practical rock engineering: Part 1: The development of the Rock Mass index (RMi). Tunnelling and Underground Space Technology, vol 11, no. 2, pp. 175–188.
Park, H. and West, T. 2001. Development of a probabilistic approach for rock wedge failure. Engineering Geology, vol. 59, no. 3-4, pp. 233–251.
Qin, Q., Li, K., Li, M., Abbas, N., Yue, R., and Qiu, S. 2024. An anisotropic failure criterion for jointed rocks under triaxial stress conditions. Rock Mechanics and Rock Engineering, vol. 57, no. 5, pp. 1–18. doi:10.1007/s00603-023-03684-7
Russo, G. 2009. A new rational method for calculating the GSI. Tunnelling and Underground Space Technology, vol. 24, no. 1, pp. 103–111.
Rutledge, J. and Preston, R. 1978. Experience with engineering classifications of rock. Proceedings of the International Tunnel Symposium, Tokyo, Japan, 29 May–2 June 1978. Pergamon, Oxford. pp. A3.1–A3.7.
Sari, M. 2015. Incorporating variability and/or uncertainty of rock mass properties into GSI and RMi systems using Monte Carlo method. Engineering Geology for Society and Territory. Proceedings of the IAEG XII Congress, Torino, Italy. vol. 6. Springer. pp. 843–849.
Sari, M. and Karpuz, C. 2006. Rock variability and establishing confining pressure levels for triaxial tests on rocks. International Journal of Rock Mechanics and Mining Sciences, vol. 43, no. 2, pp. 328–335.
Sari, M., Karpuz, C., and Ayday, C. 2010. Estimating rock mass properties using Monte Carlo simulation: Ankara andesites. Computers & Geosciences, vol. 36, no. 7, pp. 959–969.
Shah, K.S., Abbas, N., Kegang, L., Mohd Hashim, M.H.B., Rehman, H.U., and Jadoon, K.G. 2023. Analysis of granite failure modes and energy conversion under uniaxial compression at various temperatures. Journal of Mining and Environment, vol. 14, no. 2, pp. 493–506. u

Water scarcity is a growing crisis that cannot be ignored. Large and growing populations in southern Africa place increasing demands on water resources. Climate change is gathering pace, intensifying the severity of droughts and floods across the region. Deteriorating public infrastructure results in inadequate water supply, even when rainfall is abundant.
South Africa’s National Water and Sanitation Master Plan (2018) notes that in 2017 over three million South Africans lacked access to a basic water supply service. More than 50% of South Africa’s wetlands were already lost, and of those that remained, a third were in poor condition. The plan projected a 17% water deficit by 2030 if no additional action was taken. South Africa’s water security has deteriorated substantially in the six years since the master plan was published.
Implats and other responsible mining companies make an extraordinary contribution to socio-economic development in rural areas, including development related to ensuring efficient water reuse and adequate water supply.
Our operations address supply constraints in vulnerable host communities through major infrastructure projects and focus on alleviating water shortages. We work with municipalities and schools to improve water conservation and climate change awareness. We assist with strategic regional planning and local service provision, and work with local stakeholders to address immediate needs and ensure that bulk infrastructure is maintained and long-term planning is in place. At the same time, we work tirelessly to improve our internal water use – our goal is to achieve 70% water recycling and re-use by 2030 and have improved our performance to 52% in FY2023, earning an “A-” rating from the CDP Water Disclosure Project.
Implats aligns its water practices with global reporting requirements and frameworks, such as the United Nations Sustainable Development Goals, Task Force on Climate-Related Financial Disclosures, CDP disclosures and global ISO standards. These frameworks require rigorous monitoring and analysis.
We use this data to better understand our impact, the impact of resource scarcity and climate change, our vulnerabilities and risks, enabling us to implement pragmatic, results-driven models within appropriate timeframes — all within rigorous governance and reporting frameworks. This is a powerful foundation for positive social impact.
Companies must properly understand their environmental and social impact, commit to sustainable operational and business practices, and develop innovative water models and initiatives. But the scale of water scarcity is too great for it to be solved by business alone.
The private sector and parastatals, working together, can offer resources –principally expertise and funding – that governments are otherwise unable to obtain, and governments can help apply these resources at scale. These strategic partnerships address infrastructure problems that have financial, health, social or environmental consequences – and do so to the benefit of all stakeholders. Alongside other commercial water users, Implats is part of two water-specific public-private partnerships (PPPs) –
the Olifants Management Model and the Rustenburg Water Services Trust – which showcase the potential these models hold to support the development of effective, long-term water infrastructure.
Rustenburg Municipality, a water-stressed area, faced increased water demand from domestic and industrial sources and deteriorating wastewater treatment capacity. Public finances could not meet investment needs, which led to an engagement with local mining companies, including Implats. The municipality and mining companies established the Rustenburg Water Services Trust to finance and operate new water infrastructure.
The trust used a blended finance approach — it secured ring-fenced revenues from municipal bulk-water sales and an off-take agreement with local mines. This revenue security enabled access to commercial finance on favourable terms. The public sector played a key role in structuring a transaction that addressed critical water resource needs for the municipal area.This partnership realised several benefits: it secured supplies for mining, increased freshwater availability for the municipality, and improved downstream water quality through better wastewater treatment.
The partnership inspired a World Bank case study, which concluded: “The Rustenburg case proves that relatively small and financially weak municipalities can raise significant funding through well-structured projects with strong revenue streams from private sources,” and that “… there is high potential for replication in areas where industry has a stake in improving outcomes.”
Efforts to address the water needs of the middle Olifants River catchment area in the Limpopo Province were inadequate since they were conceptualised in the late 1990s, resulting in chronic water scarcity in the region and an associated increase in social unrest. Water infrastructure was vandalised and mining operations disrupted.
To address these challenges, government and a consortium of commercial water users, including Implats’ Marula operation, entered a joint-venture arrangement to construct and manage bulk-water infrastructure.
This arrangement, the Olifants Management Model (OMM), was launched in 2022 and will accelerate the delivery of raw and potable water services in the region, creating employment opportunities and ensuring security of water supply for Marula and its host communities.
The challenges underlying water scarcity in southern Africa – constrained public purses, struggling infrastructure, climate-change risk, and increasing demand – are familiar. Collaborative efforts and sustained commitment can ensure access to this basic human right and secure a better future for generations to come.
Where projects demonstrate success, they should be championed and scaled.
Affiliation:
1MLB Consulting, Ballito, South Africa
2Impala Platinum Ltd, Rustenburg, South Africa
3Glencore Alloys, Rustenburg, South Africa
Correspondence to:
K.B. Le Bron
Email: kevin@mlbconsulting.co.za
Dates:
Received: 5 Sept. 2023
Revised: 24 Nov. 2023
Accepted: 13 Feb. 2024
Published: May 2024
How to cite:
Le Bron, K.B., Gardner, L.J., and van Zyl, J. 2024. Beyond the empirical pillar design method: The strain criterion and the pillar load inversion concepts. Journal of the Southern African Institute of Mining and Metallurgy, vol. 124, no. 5. pp. 293–302
DOI ID:
http://dx.doi.org/10.17159/24119717/3125/2024
by K.B. Le Bron1, L.J. Gardner2, and J. van Zyl3
Abstract
Pillar design is a crucial aspect of underground mining engineering, as it directly impacts the safety, stability, and overall effectiveness of mining operations. In this paper we present a method to calculate pillar stability based on the strain criterion and pillar load inversion concept, which complements the empirical pillar strength formulae. Those formulae do not account for certain parameters that can affect the stability of the pillars, e.g. weak layers, changes in stress orientations due to mining, orebody dip, mining layout complexity, and the influence of regional stabilizing pillars. The approach presented here is not intended to replace the empirical method; rather, we suggest using it as the initial step in the pillar design process. This should be followed by iterative numerical modelling to study pillar behaviour, define pillar stability, and optimize the pillar design by considering site-specific and representative rock mass properties and criteria.
Keywords
pillar design, strain criterion, tabular orebody, bord and pillar
Introduction
Pillars are unmined portions of ore that are left in place to support the roof and overburden. These pillars help to minimize the risk of roof collapses, which could injure people working in underground excavations. Correctly designed pillars provide support to prevent subsidence (applicable to shallow mining conditions) and maintain the integrity of the surrounding rock mass.
The stability of the walls of an excavation relies on the pillar layout. The size and location of pillars can impact the efficiency of resource extraction. If pillars are too large, significant amounts of valuable resources will be left unmined. On the other hand, if they are too small, they could fail and compromise stability.
The extraction method used in underground mining, e.g. the bord-and-pillar approach, determines the layout and design of the pillars. Each mining method involves specific pillar design considerations. Pillar design is therefore a crucial aspect of underground mining engineering. In this paper we present a pillar design method that goes beyond the empirical approach by incorporating a strain criterion concept and a pillar load inversion concept.
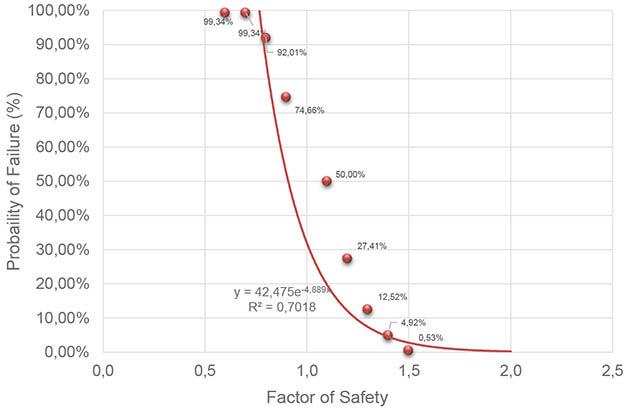
Figure 1—The relationship between predicted probability of failure and the factor of safety of coal pillars (after Salamon and Munro, 1967)
Salamon and Munro (1967) followed an empirical approach, which involved studying data from a total of 125 pillars in South African coalfields, 27 of these being collapsed pillars. Based on a statistical appraisal of the data, they presented a relationship between the probability of failure (PoF) and factor of safety (FoS) for coal pillars. The graph presented in Figure 1 is based on this data, which also forms the basis for applying a factor of safety of 1.6 in coal pillar design.
Several empirically based pillar strength equations have since been developed for hard rock mines (Hedley and Grant, 1972; von Kimmelman, Hyde, and Madgwick, 1984; Lunder and Pakalnis, 1997). Hedley and Grant (1972) specifically applied the approach adopted by Salamon and Munro (1967) to develop a pillar strength formula hard rock mines, based on a study of 28 pillars (three of which were defined as failed) at the Elliot Lake uranium mines in Canada. This formula has typically been used for designing pillars for mines in the Bushveld Complex.
The empirical strength formulae have several limitations.
➤ They are mostly based on the study of a limited number of pillars, and the interpretation of ‘stable’ versus ‘failed’ pillars is not always clear,
➤ They are designed for a particular orebody, and are not necessarily applicable in other, potentially similar orebodies,
➤ They do not account for parameters that may impact the stability of the pillars, such as weak layers, changes in stress orientations as a result of mining, orebody dip, complexity of mining layout, and the effect of regional stabilizing pillars.
Kersten (2019) suggested that the application of the empirical Hedley-Grant formula in conjunction with tributary area theory requires revision. He investigated the possibility of creating an analytical solution to replace the empirical approach, using the load line of the pillar system in conjunction with FLAC2D modelling and the Hoek-Brown (1980) failure criterion, to calculate pillar deformation and failure strength. He concluded that this method may be used to predict the influence of rock mass characteristics, the likelihood of pillar failures at greater depths, and alternative pillar mining methods.
Malan (2010) concluded that neither empirical techniques nor numerical modelling currently provide a solid basis for conducting pillar design. He therefore recommended that both these techniques be utilized to obtain the best possible insight into the problem. Napier and Malan (2011) cite uncertainties in pillar strength and loading stiffness as reasons for moving beyond the sole use of empirical formulae for pillar design towards combining monitoring and numerical modelling to obtain the best insights into design problems (Spottiswoode and Drummond, 2014).
The approach suggested in this paper is a hybrid methodology for pillar design. It is not intended to replace the empirical method; rather, it incorporates both empirical methods and inelastic numerical modelling, applying the strain criterion concept and pillar load inversion concept. We thus recognize the value of empirical data, but propose that it should be utilized as the initial phase of pillar design.
Subsequently, numerical modelling is introduced to further assess and understand pillar behaviour, allowing for a more accurate definition of pillar stability. This is achieved by considering rock mass properties and stability criteria that are specific to the site in question and which accurately represent the rock mass and loading conditions. The components required in the pillar design process are presented in Figure 2.
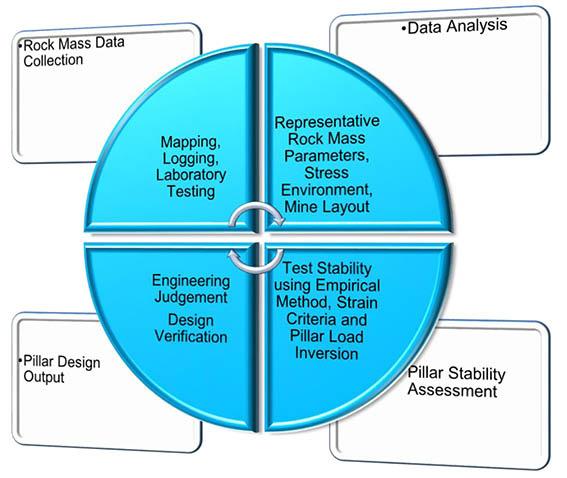
Confidence in the design improves with increasing understanding of the rock mass data. With access to accurate and comprehensive data relating to the rock mass, including geological characteristics, structural features, mechanical properties, and potential hazards, more informed decisions are possible during the design phase.
The available advanced geotechnical modelling techniques allow geotechnical engineers to simulate different scenarios, assess rock mass behaviour under a range of conditions, and identify potential challenges before any excavation is developed. Thus, with accurate rock mass data, the numerical models and empirical methods become more reliable and can provide insights into potential challenges that might arise during the mining operation.
As the empirical method is well-known and widely used, the novel pillar load inversion concept and strain criterion are presented together with case studies that best illustrate their application.
Under elastic conditions, the stresses along the edges and at the corners of pillars are considerably higher than at the core of the pillar. During mining, pillars may become overloaded, which may lead to load shedding at the pillar (or excavation) edges and particularly the pillar corners.
When load shedding occurs at the corners, the pillar load is transferred to the confined core. As the load on the pillar is further increased, the stress profile changes from being higher near the pillar edge to a peak at the pillar centre (Figure 3). This implies that load inversion has occurred in the pillar, meaning that the pillar behaviour has transitioned from elastic to inelastic.
If the pillar edges remain within the elastic zone, this situation will indicate stable pillar conditions. However, fracturing on the pillar edge does not necessarily mean pillar failure. Since there may be two intersections on the pillar stress curve for the same stress level (Figure 4), i.e. one in the elastic zone and the other post-failure, the strain would be the determining factor for failure. A graphical explanation of the concept is indicated in Figures 3 and 4.
Axial strain criterion based on uniaxial compressive strength (UCS) tests
The positive axial strain at failure can be used to predict potential failure in the rock mass where similar unconfined conditions may
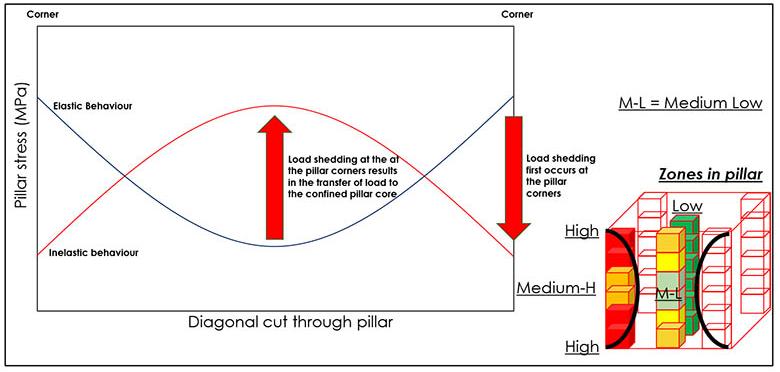
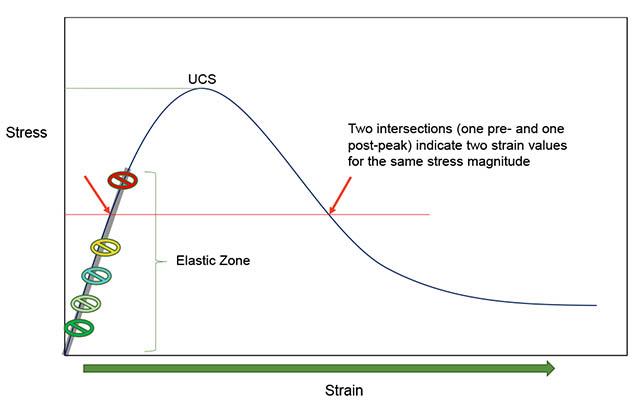
exist. The strain criterion has been applied successfully to predict potential pillar instabilities on mines located in the Bushveld Complex (described in numerous project reports submitted to various mines and which are not publicly available).
The edges of underground pillars may experience similar unconfined compression to samples tested in the laboratory. This means that the vertical axial strain may be applied as a stability condition in inelastic numerical modelling to determine the onset of pillar fracturing as a precursor to possible slabbing and spalling of the pillar sides (this is based on underground measurements from five pillar formation and pillar reduction projects).
A conservative approach to pillar design would assume a minimum value for axial strain, determined during UCS tests in a laboratory (it should be noted that higher width-to-height ratios may lead to pillar punching or strain bursting in some rock types, which is not discussed in this paper). Using the median or average UCS strain may be more appropriate, as it is more representative of an entire system of pillars. For the adoption of this approach, a large database of laboratory test data is preferable, as it improves confidence in the data and allows representative rock mass parameters and failure criteria to be compiled.
One of the Bushveld Complex mines has a substantial laboratory testing database which was used to illustrate the criteria. The graphs in Figures 5 and 6 show a probabilistic approach to the available laboratory-determined UCS strain data for Merensky Reef samples. These graphs are based on available laboratory-tested axial strain data for Merensky pyroxenite (MPX - Figure 5) and Merensky
pegmatoid (MPG - Figure 6) samples. The minimum values are predicted to be approximately 1.2 mm/m for both MPG and MPX. Provided the minimum value for strain at failure is not exceeded, the pillar is predicted to remain in the elastic zone. The average values are approximately 2.2 mm/m for MPX and 1.75 mm/m for MPG.
Axial strain criterion based on triaxial confinement
The relationship between confining stress and triaxial compressive strength is presented in Figures 7 and 8, for MPX and MPG, respectively. The graphs indicate that an increase in confinement will result in significantly greater rock strengths. For MPX, the average UCS (without confinement) is approximately 117 MPa, increasing to approximately 275 MPa for a pillar confinement of 20 MPa. For MPG, the average UCS is approximately 96 MPa, increasing to approximately 195 MPa for a pillar confinement of 20 MPa. It is noted that at a pillar confinement of 40 MPa, the compressive strength is predicted to be as high as 275 MPa.
The effects of confinement on the vertical axial strain are presented in Figures 9 and 10. The graphs show that confining stresses of 20 MPa or higher will result in a vertical axial strain at failure of approximately 6 mm/m. Increased confinement not only results in greater axial compressive strength, but also increased strain deformation before sample failure.
Figure 9, therefore, suggests that for a horizontal confining stress of at least 20 MPa, a strain criterion of approximately 6 mm/m (or millistrain) may be applied anywhere in the pillar where the
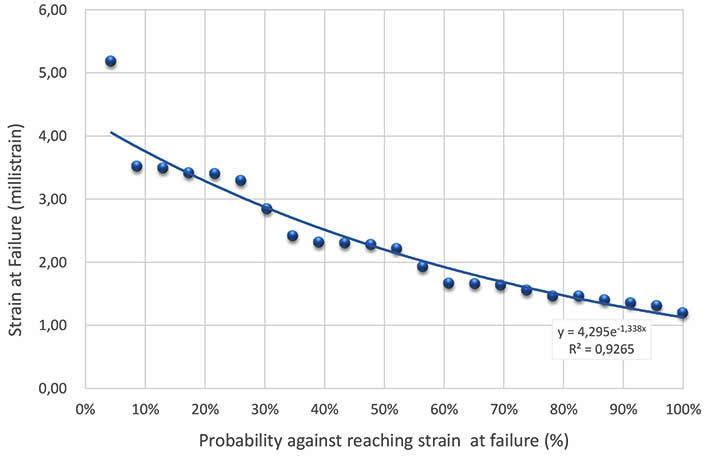
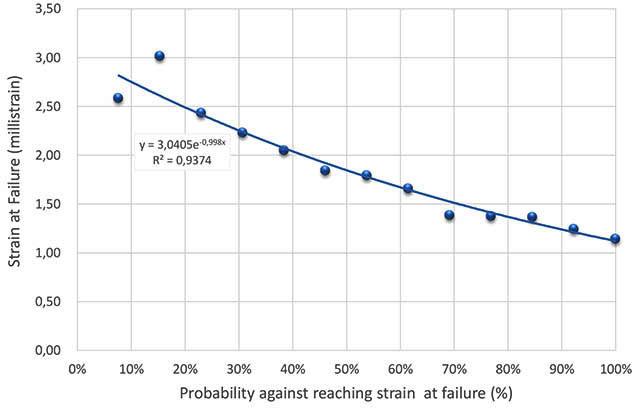
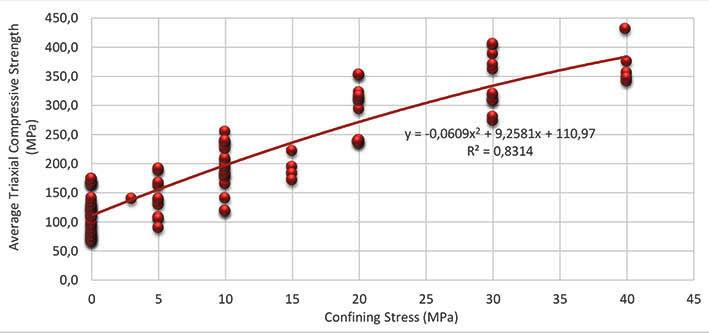
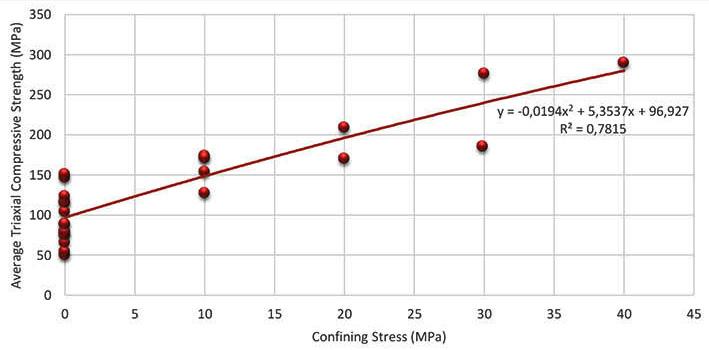
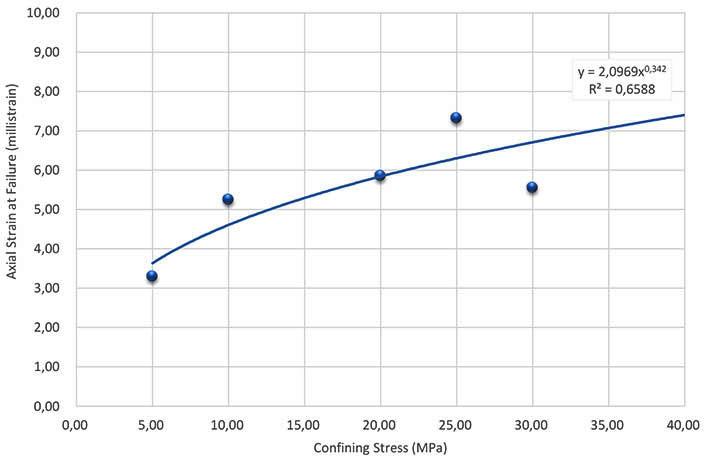
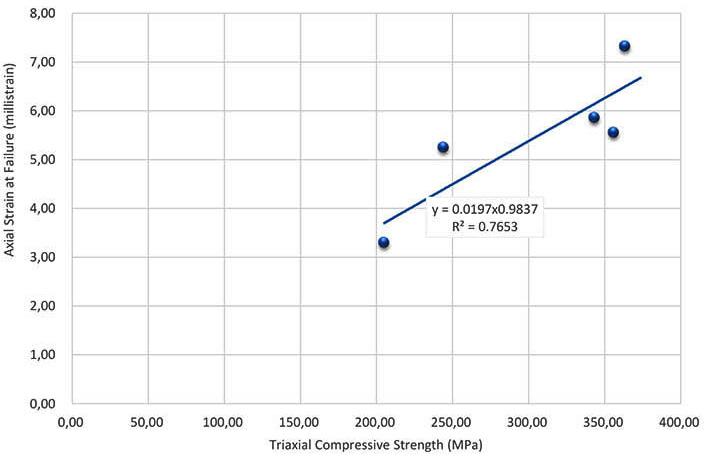
confinement is equivalent to that value, as an indication of the potential onset of fracturing. which may result in load shedding of that particular zone (under triaxial loading). At confining stress levels of approximately 95 MPa, the criterion would be 10 millistrain.
Case study 1: Application in a bord-and-pillar layout on the Merensky Reef at depths of 1270–1350 m below surface FLAC3D Itasca Consulting Croup, 2014) was used to evaluate the pillar stability for the bord-and-pillar layout with regional stabilizing pillars on the Merensky Reef at depths down to 1350 m below surface. The dimensions of the regional stabilizing pillars, namely 14 m × 14 m, were determined using the empirical strength formula. These pillars are non-continuous, due to ventilation requirements and restrictions posed by mechanical equipment and mine layout. In-stope pillars were simulated as 7 m × 7 m, 7.5 m × 7.5 m, and 8 m × 8 m, in each case with 7 m bords and a mining height of 1.85 m. A total of 11 bords were included between the regional stabilizing pillars. The Mohr-Coulomb constitutive model was assigned to all rock mass types simulated (over Hoek-Brown), with the material properties being derived from laboratory tests, core logging, and underground mapping data and observations. Detailed site-specific data was available to realistically represent the rock mass in the model, as shown in Figure 11. Saiang et al. (2014) state that Hoek-Brown model is not a classic constitutive model
like the Mohr-Coulomb and hence, cannot relate stress and strain the same way as the Mohr-Coulomb model. Saiang et al. (2014 further state that Hoek-Brown will have the tendency to produce questionable results when large plastic strains occur. For strain softening to be attempted applying this approach, one would need post-peak residual strength properties. The associated friction angle and cohesion at the residual strength, would have to be determined by running sensitivity analyses until representative residual strength parameters are obtained. This information is not available, which is why Mohr Coulomb Constitutive model was run. The pillar load inversion concept and strain criterion were applied to determine pillar stability in the models. The following data was used to define the onset of fracturing and pillar failure:
➤ Unconfined pillar sides/corners – vertical strain of 1.75 mm/m (MPG average)
➤ Confined pillar core – vertical strain of 6 mm/m
➤ Triaxial compressive stress – 195 MPa (minimum strain at 20 MPa confining stress).
The following points were noted from the study.
➤ The highest stress concentrations were not predicted to be at the core of the pillar at any of the depths modelled, but between the pillar core and the outer edges. This result suggests that most of the overburden load was not carried by the pillar core but by the entire pillar. For failure to occur,
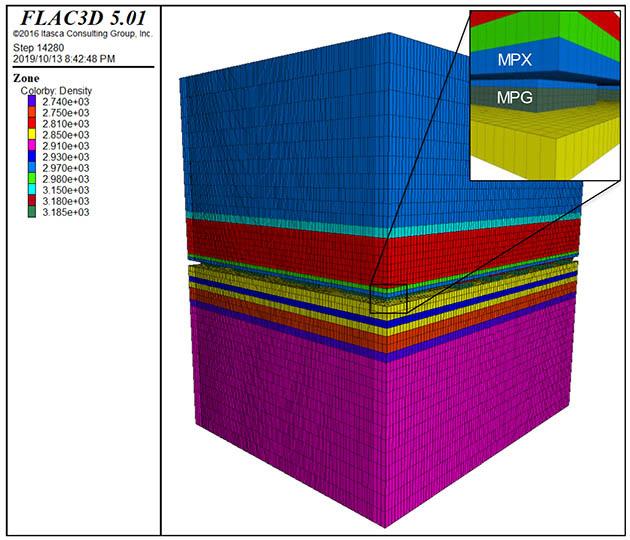
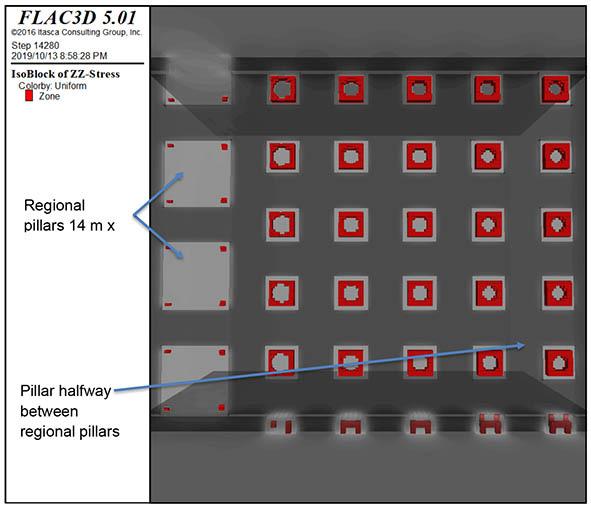
the pillar core must carry most of the load before the pillar reaches the peak stress of 195 MPa, under triaxial loading of at least 20 Mpa.
➤ As shown in Figure 12, no pillar load inversion was predicted for the specific scenarios modelled. However, should pillars start to slab and scale, further load shedding may occur, which would lead to stress being transferred to the core of the pillar. Fractured material around the pillars should preferably not be removed so as to ensure the long-term integrity of the pillar system.
➤ The 7 m × 7 m pillars with 7 m wide bords (and 11 bords between the 14 m × 14 m regional pillars) at 1270 m below surface were predicted to be stable.
➤ The layout using 7.5 m × 7.5 m pillars with 7 m wide bords (and 11 bords between the 14 m × 14 m regional pillars) was predicted to be stable down to 1310 m below the surface.
Table I
Minimum pillar widths for various depths below surface based on empirical and numerical modelling approaches
Depth (m)
Minimum pillar width (m) based on Hedley and Grant (1972), K-value 55 MPa
Modelled minimum pillar width for 7 m wide bords (m)
1270 14 × 14 (extraction ratio approx. 56%) 7 × 7 (extraction ratio approx. 65%)
1310 14 × 15 (extraction ratio approx. 55%) 7.5 × 7.5 (extraction ratio approx. 64%)
1350 14 × 15 (extraction ratio approx. 55%) 8 × 8 (extraction ratio approx. 64%)
➤ The layout using 8 m × 8 m pillars with 7 m wide bords (and 11 bords between the 14 m × 14 m regional pillars) was predicted to be stable down to 1350 m below the surface.
The modelling suggested that the minimum pillar widths could be significantly optimized based on the pillar load inversion and strain criterion concepts. A comparison of the empirical and modelling approaches is presented in Table I. Note the 9% difference in the extraction ratio between the two approaches (the loss associated with the regional pillars has been accounted for in the calculations). This pillar layout has been successfully implemented with zero pillar failures to date.
Case study 2: Pillar back-analysis: Simulation of pillar formation on the LG6 chromitite seam using monitoring data from an instrumented pillar
The pillars on another bord-and-pillar operation, in this case mining the Lower Group chromitite seam No. 6 (LG6), were initially designed in 1980 (van Zyl, 2023) using the Hedley and Grant empirical strength formula (1972). To gain a better understanding of LG6 pillar behaviour and develop representative rock mass parameters, an instrumentation programme was initiated in 2018 (van Zyl, 2023). Both the hangingwall and the footwall consist of pyroxenite, with a pyroxenite waste band separating the LG6 and LG6A chromitite seams.
A pillar back-analysis exercise was carried out using FLAC3D to simulate the stratigraphic sequence as described above, using the stress and deformation monitoring data obtained during the formation of an actual underground pillar, to calibrate the model. The mining steps and pillar formation were simulated, with model input parameters being adjusted until the measured strains and deformations aligned with the model results. For the backanalysis, the following parameters were varied: bulk modulus, shear modulus, cohesion, and friction angle. This calibration process ensured that the numerical models accurately reflected the actual behaviour of the rock mass.
An 8 m × 8 m pillar was monitored, located at a depth of 385 m below the surface, with 8 m wide bords and a mining height of approximately 3 m. The instrumentation included a CSIRO stress change monitoring cell placed at the centre of the pillar, as well as three displacement sensors positioned along the front (east) face of the pillar. These sensors recorded strain and displacement during various stages of pillar formation.
The strain and displacement data showed the structural integrity of the initial pillar and provided the opportunity for optimizing
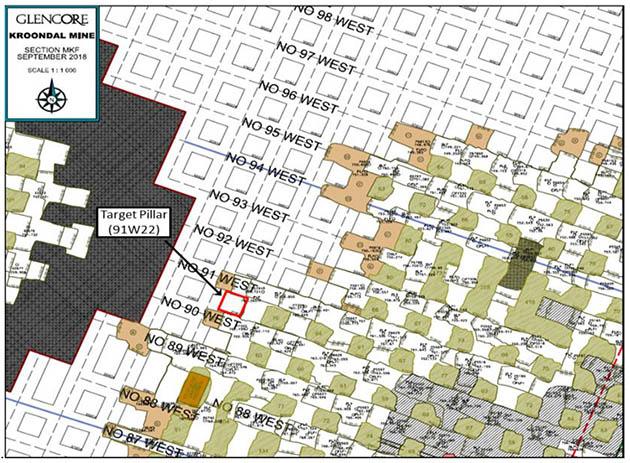
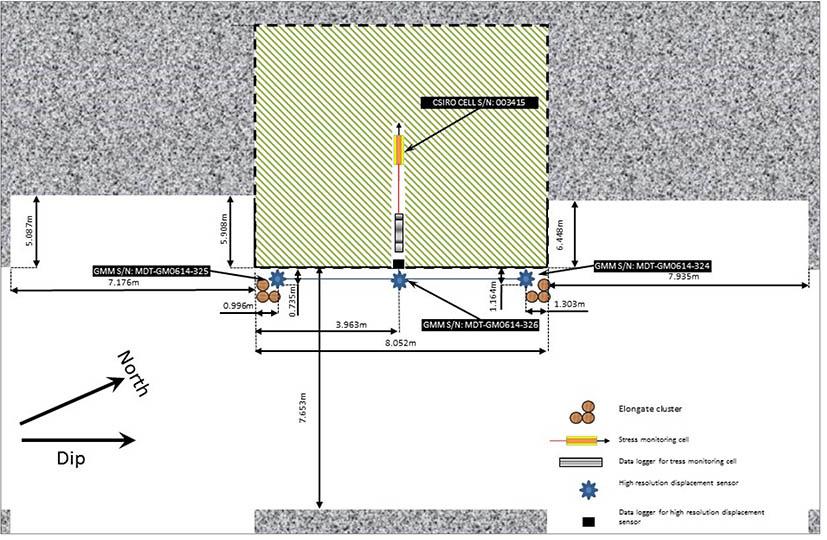
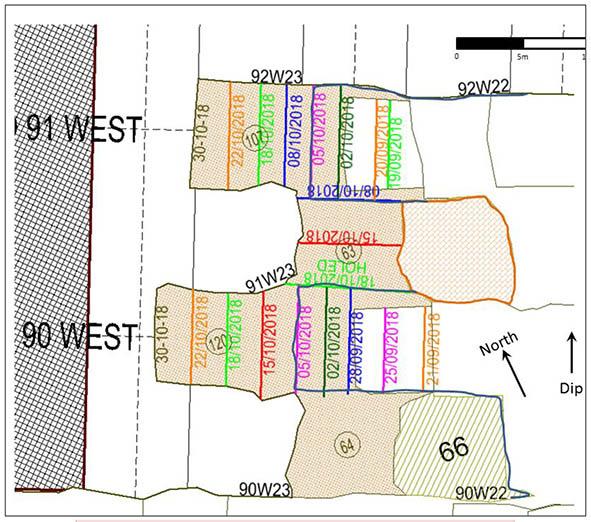
the pillar system design for efficiency and safety. A mine plan of the section containing the target pillar was prepared before the pillar cutting, as shown in Figure 13. The target pillar, 91W22, was situated between the 90 West and 91 West bords.
The layout of the instrumentation is shown in Figure 14. The pre-mining vertical stress level was determined using the analytical formula based on the overburden density, gravitational acceleration, and depth below surface.
Figure 15 shows the extraction sequence and dates of extraction of the panels surrounding the target pillar. The first blast after the instruments were installed was on 19 September 2018 and the pillar was fully formed by 18 October 2018, nine blasts later. Numerous numerical iterations were run with a variety of rock mass properties used as input parameters. The Mohr-Coulomb constitutive model was used in FLAC3D until the combination of input parameters resulted in similar strain changes to those recorded underground.
The modelling results, shown in Figures 16–19, indicated the following.
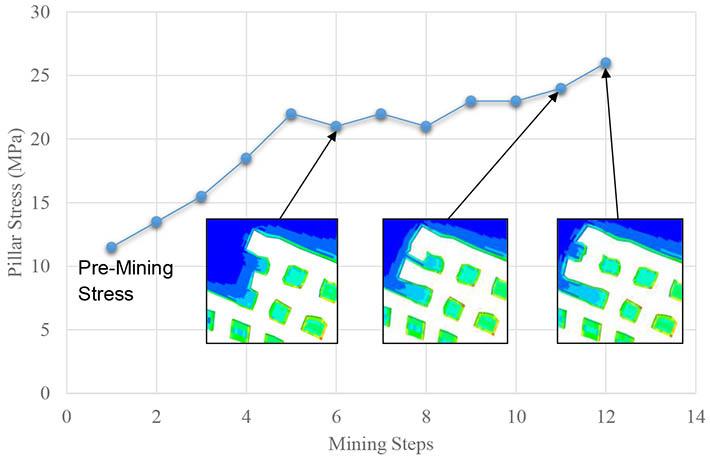
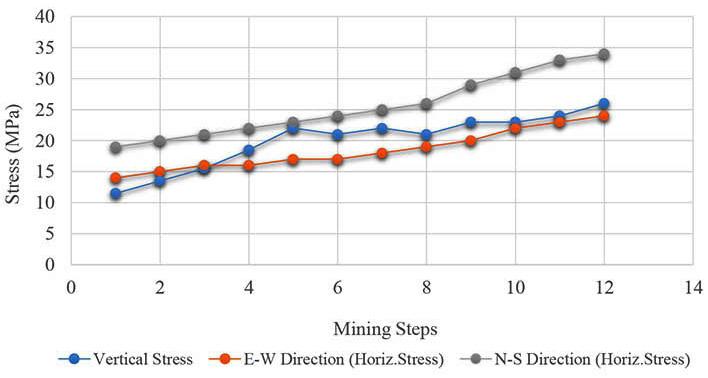
➤ The modelled vertical compressive stress in the instrumented target pillar increased from approximately 11 MPa (before mining) to 26 MPa (at the final mining step).
➤ The modelled stress changes are similar to those measured underground between 28 September 2018 (step 8) and 25 October 2018 (step 11) (Table II). Note that step 8 is when the four sides of the pillar had been established, although the pillar had not been completely formed (only three sides of the pillar had been established at step 7).
The modelling results can be summarized as follows.
➤ No pillar load inversion occurred in the target pillar.
➤ No loss of confinement occurred in the target pillar.
➤ No scaling of the target pillar was predicted.
➤ Based on the relatively small difference between the modelled and measured stress changes (between mining steps 8 and 12), the following can be inferred:
– The back-analysed rock mass parameters, shown in Table III, are considered representative of the rock mass properties at the target pillar. These parameters were were used in the model that correlated best with the underground measurements, and recommended for future pillar stability analyses.
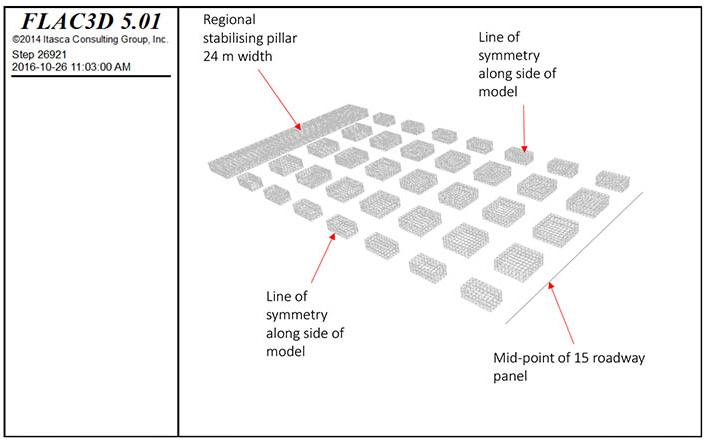
– The k-ratios of approximately 1.8 in the N-S direction and 1.2 in the E-W direction appear to be representative of the stress regime at the target pillar.
➤ The target pillar was therefore assessed to be stable.
Case study 3: Application in a bord-and-pillar layout on the LG6 chromitite seam at depths of 370–500 m below surface
The assessment criteria for this case study were developed based on an extensive database of laboratory testing, stress measurement data, and mapping and core logging data.
➤ A strain criterion (for uniaxial loading conditions) of 1.1 mm/m was assigned to indicate the onset of fracturing, based on laboratory tests.
➤ A strain criterion (for triaxial loading conditions) of 3 mm/m was assigned to indicate the onset of fracturing under a confinement of 10 MPa (no triaxial loading data was available for the LG6 at the time of the study).
➤ A stress drop in the pillar core indicates pillar failure – loss of confinement may lead to disintegration.
Models of the proposed layout were run with regional stabilizing pillars of 24 m width, spaced 232 m apart skin-to-skin, with every fifth roadway cutting through the regional stabilizing pillar, and without regional stabilizing pillars. The in-stope pillars were 8 m × 8 m with 8 m wide bords, resulting in a 75% extraction ratio. A schematic showing the modelled layout is presented in Figure 18.
In-stope pillar behaviour at a depth of 370 m
The models showed that the vertical compressive strain is predicted to exceed the uniaxial compressive strain criterion of 1.1 mm/m on the sides of the pillars. However, at a confining load equalling or exceeding 10 MPa, the minimum strain in the core of the pillars was not predicted to exceed the criterion of 3 mm/m, as shown in
Comparison of measured and modelled stress changes in pillar (mining steps 8–12)
Table III
Back-analysed rock mass properties
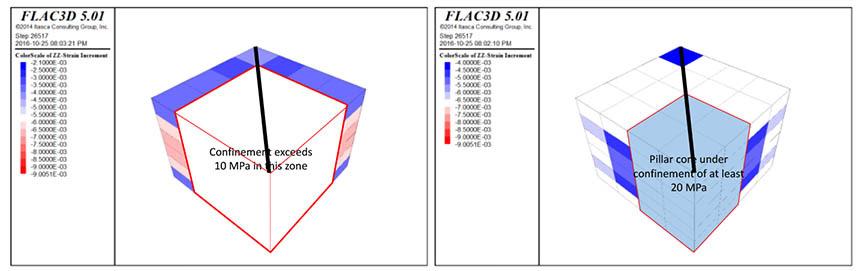
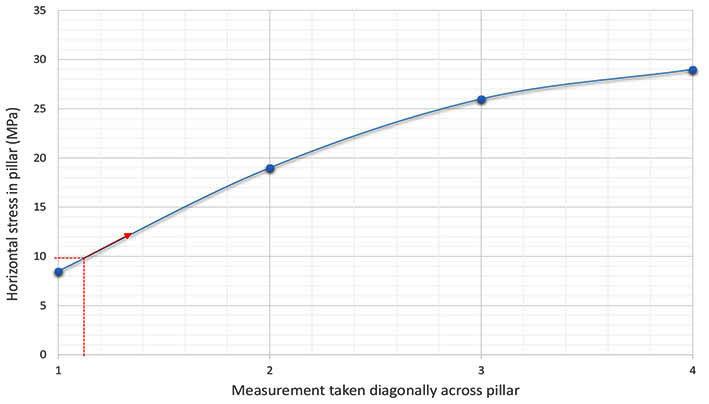
Figure 20 —Horizontal confining stress recorded in the FLAC3D model, diagonally across the pillar from the corner to the core. The criterion for indication of fracturing based on triaxial confinement of 10 MPa is 3 mm/m
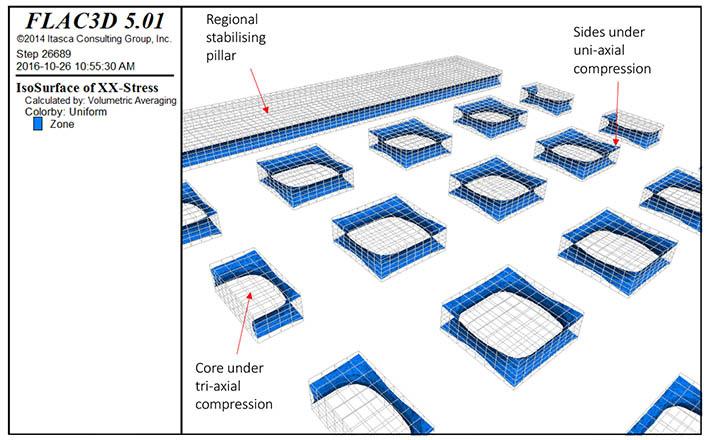
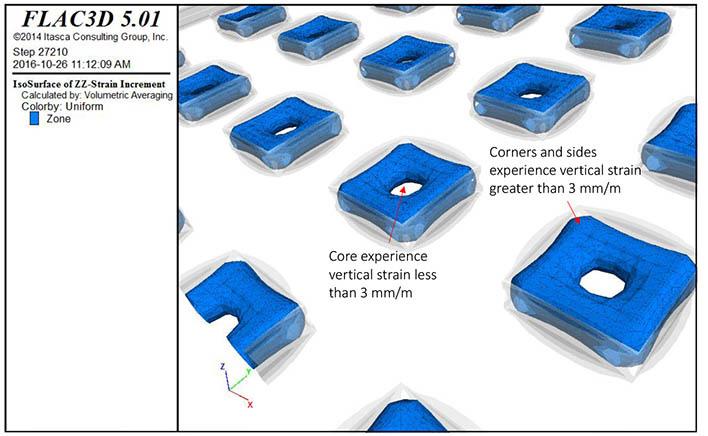
22—FLAC3D iso-surface with a vertical strain of 3 mm/m, at a depth of 370 m below surface with a regional stabilizing pillar. Note that the pillar core has not reached the 3 mm/m criterion
Figures 19–22. Thus 8 m × 8 m pillars with 8 m wide bords were predicted to remain stable at 370 m below the surface.
In-stope pillar behaviour for different mining heights at depths of 370 m and 500 m below surface
Based on available data, the thickness of the LG6 chromitite seam increases from 3 m at a depth of 370 m below surface to approximately 3.8 m at a depth of 500 m. The vertical virgin stresses were calculated at approximately 10.9 MPa at a depth of 370 m and 14.7 MPa at 500 m, representing an increase of 3.8 MPa or 34%.
A comparison of the modelling results of the pillar stresses at 370 m (3 m mining height) with those at 500 m (3.8 m mining height) shows that:
➤ Vertical stresses in the pillar cores increase from approximately 60 MPa (at a depth of 370 m below surface) to 140 MPa (at a depth of 500 m), which is more than 230%. The
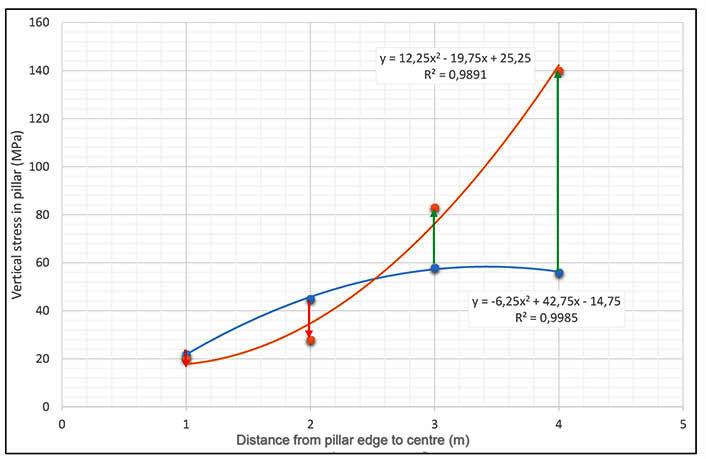
major reason appears to be the increase in pillar height, rather than the additional stress due to the depth increase.
➤ A slight stress drop is predicted to occur on the pillar sides, but not in the core, i.e. the sides of the pillars at 370 m experience slightly higher stress than the same sized pillars at a depth of 500 m. However, the vertical stress in the core of a pillar at 500 m below surface is significantly greater than that in the same pillar at a depth of 370 m.
➤ Partial pillar load inversion is predicted by the numerical model at a depth of 370 m below surface (Figure 23), which means that the pillar remains stable, albeit conditionally, i.e. possible future scaling of the sidewalls may push the pillar to full pillar load inversion. The pillars at 500 m depth are predicted to experience full pillar load inversion, meaning that the pillar has crushed – a precursor to potential failure.
The applicability of the hybrid methodology, which includes the empirical method, the consideration of pillar inversion, and the strain criteria based on uniaxial and triaxial loading conditions, to pillar stability assessments has been illustrated using three case studies.
The case studies include both shallow bord-and-pillar layouts and what would be considered ‘deep’ bord-and-pillar mining layouts. They clearly illustrate the impact of multiple parameters on pillar stability; including pillar height and rock mass strength (pillars on the Merensky Reef are similar in size to the pillars on the LG6, although the difference in mining depth is approximately 800 m), and the impact of regional pillars.
The use of this hybrid method of pillar stability assessment is recommended for pillar design, as the integration of different methods is often considered robust because it takes advantage of the strengths of each approach while mitigating their limitations. The more conservative empirical approach safeguards against possible unexpected factors (as a first step), while the numerical modelling approach enhances the understanding of pillar behaviour under simulated loading conditions. By proposing a process that starts with a conservative estimate of stability based on empirical methods, the method ensures a substantial safety margin.
Pillar back-analysis is required to enhance the reliability of pillar designs and forward predictions through the verification and adjustment of numerical models using real-world observations. This iterative process refines the comprehension of stress distribution,
rock behaviour, and pillar performance. By optimizing the layout and dimensions of pillars based on these insights, mining operations can minimize risks, maximize safety, and enhance ore recovery.
References
Brady, B.H.G. and Brown, E.T. 1985. Rock Mechanics for Underground Mining. George Allen and Unwin, London. 527 pp.
Hedley, D.G.F. and Grant, F. 1972. Stope and pillar design for the Elliot Lake uranium mines. CIM Bulletin. vol. 65, pp. 37–44.
Hoek, E. and Brown, E.T. 1980. Empirical strength criterion for rock masses. Journal of the Geotechnical Engineering Division, American Society of Civil Engineers, vol. 106, pp. 1013–1035.
Itasca Consulting Croup. 2014. FLAC3D Version 5.01 Manual. Minneapolis, MN.
Kersten, R.W.O. 2019. An alternative pillar design methodology. Journal of the Southern African Institute of Mining and Metallurgy, vol. 119, no. 5, pp. 471–478.
Le Bron K.B. and Piper. P.S. 2019. Back analysis modelling of pillar formation at Kroondal Chrome Mine. Technical Consulting Report.
Lunder, P.J. and Pakalnis, R. 1997. Determining the strength of hard rock mine pillars. CIM Bulletin, vol. 90, pp. 51–55.
Malan, D.F. 2010. Pillar design in hard rock mines – Can we do this with confidence? Proceedings of the Second Australasian Ground Control in Mining Conference, Sydney, NSW. Australasian Institute of Mining and Metallurgy, Melbourne.
Napier, J.A.L and Malan, D.F. 2011. The design of stable pillars in the Bushveld Complex mines: A problem solved? Journal of the Southern African Institute of Mining and Metallurgy, vol. 111, no. 12, pp. 821–836.
Saiang, D., Gwynn, X., and Marshall, N. 2014. Hoek-Brown vs. Mohr-Coulomb – Results from a three-dimensional open-pit/ underground interaction model. www.SRK.com
Salamon, M.D.G. and Munro, A.H. 1967. A study of the strength of coal pillars. Journal of the South African Institute of Mining and Metallurgy, vol. 68, no. 2, pp. 55–67.
Smith, C. and Piper, P.S. 2019. The stress–strain behaviour of a stope pillar during formation at Kroondal Mine. Technical Consulting Report.
Spottiswoode, S.M. and Drummond, M. 2014. Pillar behaviour and seismicity in platinum mines. Proceedings of the 6th Southern African Rock Engineering Symposium SARES 2014, Misty Hills, Cradle of Humankind, South Africa. South African National Institute of Rock Engineering, Johannesburg.
Von Kimmelman, M.R., Hyde, B., and Madgwick, R.J. 1984. The use of computer applications at BCL Limited in planning pillar extraction and the design of mining layouts. Design and Performance of Underground Excavations. Brown, E.T. and Hudson, J.A. (eds). British Geotechnical Society, London. pp. 53–63.
Van Zyl, J. 2023. Personal communication. Glencore Kroondal Chrome Mine.
Watson, B. P., Lamos, R.A. and Roberts, D.P. 2021. PlatMine pillar strength formula for the UG2 Reef. Journal of the Southern African Institute of Mining and Metallurgy, vol. 121, no. 8, pp. 437–448 u
11-13 June 2024 — 15TH International Conference on Industrial Applications of Computational Fluid Dynamics
Trondhedim, Norway
E-mail: Jan.E.Olsen@sintef.no
Website: https://www.sintef.no/projectweb/cfd2024/
13-14 June 2024 — SANIRE Symposium 2024
Technical Application in Rock Engineering
Silverstar Hotel Conference Centre, Muldersdrift
E-mail: Prudence@sanire.co.za
Website: https://www.sanire.co.za/
17-19 June 2024 — MOLTEN 2024
Brisbane, Australia
Website: https://www.ausimm.com/conferences-andevents/molten-conferences-2024/
18-20 June 2024 — Southern African Rare Earths 2ND International Conference 2024
Swakopmund Hotel and Entertainment Centre, Swakopmund, Namibia
Contact: Camielah Jardine
Tel: 011 538-0237, E-mail: camielah@saimm.co.za
Website: http://www.saimm.co.za
19-20 June 2024 — European Conference Hydrogen & P2X
Copenhagen, Denmark
Website: events@fortesmedia.com
4 July 2024 — 5TH School on Manganese Ferroalloy
Production Online School 2024
Decarbonization of the Manganese Ferroalloy Industry
Contact: Gugu Charlie
Tel: 011 538-0238, E-mail: gugu@saimm.co.za
Website: http://www.saimm.co.za
5-8 August 2024 — 2nd Battery Materials Conference 2024
The Arena, Emnotweni Casino, Mbombela, Mpumalanga
Contact: Camielah Jardine
Tel: 011 538-0237, E-mail: camielah@saimm.co.za
Website: http://www.saimm.co.za
1-3 September 2024 — Hydrometallurgy Conference 2024
Hydrometallurgy for the Future
Hazendal Wine Estate, Stellenbosch, Western Cape, South Africa
Contact: Camielah Jardine
Tel: 011 538-0237, E-mail: camielah@saimm.co.za
Website: http://www.saimm.co.za
4-6 September 2024 — 7th IFAC Workshop on Mining, Mineral and Metal Processing (IFAC MMM 2024)
Brisbane, Australia
Website: https://ifac.papercept.net/conferences/scripts/ start.pl
5-6 September 2024 — Mine Planning and Design Colloquium 2024
Electra Mining Nasrec, Johannesburg, South Africa
Contact: Camielah Jardine
Tel: 011 538-0237, E-mail: camielah@saimm.co.za
Website: http://www.saimm.co.za
16-17 September 2024 — The Control Conference Africa 2024
Balaclava, Mauritius, Website: https://cca2024.org/
18-21 September 2024 — Infacon XVII 2024
17TH International Ferro-Alloys Congress
Beijing, China
Website: https://www.infacon17 net/?sid=2178&mid=577&v=108
1-4 October 2024 — Southern African Geophysical Association
Windhoek
E-mail: chair@sagaconference.co.za
Website: https://sagaconference.co.za/
16-17 October 2024 — ESGS Conference 2024
ESG in the minerals industry challenges and opportunities
Focus Rooms, Modderfontein, Johannesburg, South Africa
Contact: Camielah Jardine
Tel: 011 538-0237, E-mail: camielah@saimm.co.za
Website: http://www.saimm.co.za
16-17 October 2024 — MESA Africa 2024 Summit
The Edge at Knightsbridge, Bryanston, Johannesburg, South Africa, Website: https://evt.to/asiuosimw
31 October - 1 November 2024 — SANCOT Symposium 2024
Cullinan Diamond Lodge, Cullinan, Pretoria Advances in Tunnelling-A Portal to the Future
Contact: Gugu Charlie
Tel: 011 538-0238, E-mail: gugu@saimm.co.za
Website: http://www.saimm.co.za
7-8 November 2024 — MineSafe Conference 2024 Emperors Palace Convention Centre, South Africa
Contact: Camielah Jardine
Tel: 011 538-0237, E-mail: camielah@saimm.co.za
Website: http://www.saimm.co.za
11-12 November 2024 — Mintek@90 Conference 2024
Sandton Convention Centre, South Africa
Contact: Camielah Jardine
Tel: 011 538-0237, E-mail: camielah@saimm.co.za
Website: http://www.saimm.co.za
The following organizations have been admitted to the Institute as Company Affiliates
3M South Africa (Pty) Limited
A and B Global Mining (Pty) Ltd
acQuire Technology Solutions
AECOM SA (Pty) Ltd
AEL Mining Services Limited
African Pegmatite (Pty) Ltd
Air Liquide (Pty) Ltd
Alexander Proudfoot Africa (Pty) Ltd
Allied Furnace Consultants
AMEC Foster Wheeler
AMIRA International Africa (Pty) Ltd
ANDRITZ Delkor(Pty) Ltd
Anglo Operations Proprietary Limited
Anglogold Ashanti Ltd
Anton Paar Southern Africa (Pty) Ltd
Arcus Gibb (Pty) Ltd
ASPASA
Aurecon South Africa (Pty) Ltd
Aveng Engineering
Aveng Mining Shafts and Underground
Axiom Chemlab Supplies (Pty) Ltd
Axis House Pty Ltd
Bafokeng Rasimone Platinum Mine
Barloworld Equipment -Mining
BASF Holdings SA (Pty) Ltd
BCL Limited
Becker Mining (Pty) Ltd
BedRock Mining Support Pty Ltd
BHP Billiton Energy Coal SA Ltd
Blue Cube Systems (Pty) Ltd
Bluhm Burton Engineering Pty Ltd
Bond Equipment (Pty) Ltd
Bouygues Travaux Publics
Caledonia Mining South Africa Plc
Castle Lead Works
CDM Group
CGG Services SA
Coalmin Process Technologies CC
Concor Opencast Mining
Concor Technicrete
Council for Geoscience Library
CRONIMET Mining Processing
SA Pty Ltd
CSIR Natural Resources and the Environment (NRE)
Data Mine SA
DDP Specialty Products South Africa (Pty) Ltd
Digby Wells and Associates
DRA Mineral Projects (Pty) Ltd
DTP Mining - Bouygues Construction
Duraset
EHL Consulting Engineers (Pty) Ltd
Elbroc Mining Products (Pty) Ltd
eThekwini Municipality
Ex Mente Technologies (Pty) Ltd
Expectra 2004 (Pty) Ltd
Exxaro Coal (Pty) Ltd
Exxaro Resources Limited
Filtaquip (Pty) Ltd
FLSmidth Minerals (Pty) Ltd
Fluor Daniel SA ( Pty) Ltd
Franki Africa (Pty) Ltd-JHB
Fraser Alexander (Pty) Ltd
G H H Mining Machines (Pty) Ltd
Geobrugg Southern Africa (Pty) Ltd
Glencore
Gravitas Minerals (Pty) Ltd
Hall Core Drilling (Pty) Ltd
Hatch (Pty) Ltd
Herrenknecht AG
HPE Hydro Power Equipment (Pty) Ltd
Huawei Technologies Africa (Pty) Ltd
Immersive Technologies
IMS Engineering (Pty) Ltd
Ingwenya Mineral Processing (Pty) Ltd
Ivanhoe Mines SA
Kudumane Manganese Resources
Leica Geosystems (Pty) Ltd
Loesche South Africa (Pty) Ltd
Longyear South Africa (Pty) Ltd
Lull Storm Trading (Pty) Ltd
Maccaferri SA (Pty) Ltd
Magnetech (Pty) Ltd
Magotteaux (Pty) Ltd
Malvern Panalytical (Pty) Ltd
Maptek (Pty) Ltd
Maxam Dantex (Pty) Ltd
MCC Contracts (Pty) Ltd
MD Mineral Technologies SA (Pty) Ltd
MDM Technical Africa (Pty) Ltd
Metalock Engineering RSA (Pty)Ltd
Metorex Limited
Metso Minerals (South Africa) Pty Ltd
Micromine Africa (Pty) Ltd
MineARC South Africa (Pty) Ltd
Minerals Council of South Africa
Minerals Operations Executive (Pty) Ltd
MineRP Holding (Pty) Ltd
Mining Projections Concepts
Mintek
MIP Process Technologies (Pty) Limited
MLB Investment CC
Modular Mining Systems Africa (Pty) Ltd
MSA Group (Pty) Ltd
Multotec (Pty) Ltd
Murray and Roberts Cementation
Nalco Africa (Pty) Ltd
Namakwa Sands(Pty) Ltd
Ncamiso Trading (Pty) Ltd
Northam Platinum Ltd - Zondereinde
Opermin Operational Excellence
OPTRON (Pty) Ltd
Paterson & Cooke Consulting
Engineers (Pty) Ltd
Perkinelmer
Polysius A Division Of Thyssenkrupp
Industrial Sol
Precious Metals Refiners
Rams Mining Technologies
Rand Refinery Limited
Redpath Mining (South Africa) (Pty) Ltd
Rocbolt Technologies
Rosond (Pty) Ltd
Royal Bafokeng Platinum
Roytec Global (Pty) Ltd
RungePincockMinarco Limited
Rustenburg Platinum Mines Limited
Salene Mining (Pty) Ltd
Sandvik Mining and Construction
Delmas (Pty) Ltd
Sandvik Mining and Construction
RSA(Pty) Ltd
SANIRE
Schauenburg (Pty) Ltd
Sebilo Resources (Pty) Ltd
SENET (Pty) Ltd
Senmin International (Pty) Ltd
SISA Inspection (Pty) Ltd
Smec South Africa
Sound Mining Solution (Pty) Ltd
SRK Consulting SA (Pty) Ltd
Time Mining and Processing (Pty) Ltd
Timrite Pty Ltd
Tomra (Pty) Ltd
Trace Element Analysis Laboratory
Traka Africa (Pty) Ltd
Trans-Caledon Tunnel Authority
Administarator
Ukwazi Mining Solutions (Pty) Ltd
Umgeni Water
Webber Wentzel
Weir Minerals Africa
Welding Alloys South Africa
Worley

Abstract Submission Deadline – 05 August 2024
The conference is centered on improving safety, health and environmental practices within the mining and metallurgical industry. It seeks to create a platform for knowledge-sharing and idea exchange among various stakeholders, including mining companies, Department of Mineral Resources and Energy (DMRE), Minerals Council South Africa, labour unions, and health and safety practitioners at all levels within the industry. The main objectives of the conference are as follows:
Promoting Learning: The conference aims to facilitate a space where attendees can learn from each other’s experiences and best practices. This will help enhance overall safety and environmental standards in the mining and metallurgical sector.
Addressing Safety, Health, and Environment: The conference will focus on discussions related to safety and health issues within the industry, including the well-being of employees, contractors, and local communities. It will also emphasize the importance of reducing the environmental impact of mining and metallurgical processes.
Enhancing Relationships with Local Communities: Recognizing the significance of local communities, the conference will address the issues surrounding their relationship with mining companies. This can include concerns about environmental effects, community engagement, and socioeconomic impacts.
Zero Harm Approach: The conference will highlight the importance of adopting a ‘zero harm’ approach to health and safety in the mining and metallurgical sector. This means striving for an injury-free and accidentfree workplace.
Value-Based Approach: A value-based approach to health and safety implies that these aspects are not just compliance-driven but are deeply ingrained in the organizational values and culture. This conference aims to encourage discussions and strategies to promote such a value-based approach.
Addressing Key Challenges: The conference will tackle major challenges in the mining industry, such as logistics, energy usage, and safety concerns related to employees, contractors, and communities. By bringing together diverse stakeholders and sharing their expertise and experiences, this conference hopes to foster a safer and more sustainable mining and metallurgical industry. It emphasizes the importance of collaboration and collective efforts to address the complex challenges faced by the sector.
Sponsorship opportunities are available. Companies wishing To partner on this event should contact the Conference Coordinator.
The conference should be of value to:
• Safety practitioners
• Mine management
• Mine health and safety officials
• Engineering managers
• Underground production supervisors
• Surface production supervisors
• Environmental scientists
• Minimizing of waste
• Operations manager
• Processing manager
• Contractors (mining)
• Including mining consultants, suppliers and manufacturers
• Education and training
• Energy solving projects
• Water solving projects
• Unions
• Academics and students
• DMRE Camielah Jardine, Head of Conferences and Events
Call for papers on the topics of safety, health and environment Prospective authors are invited to submit titles and abstracts of their presentations in English and not longer than 500 words. Abstracts should be submitted to: Camielah Jardine, Head of Conferencing, E-mail: camielah@saimm.co.za
Abstract submission – 5 August 2024
Acceptance of Abstracts – 19 August 2024
Extended Abstract submission - 23 September 2024
FOR FURTHER INFORMATION, CONTACT: E-mail: camielah@saimm.co.za Tel:+27 11 530 0237 Web: www.saimm.co.za
The Southern African Institute of Mining and Metallurgy in collaboration with the SAIMM Western Cape Branch is hosting the
1-3 SEPTEMBER 2024
HAZENDAL WINE ESTATE, STELLENBOSCH, WESTERN CAPE, SOUTH AFRICA
The world’s dependency on metals has become more evident with the growing demand for metals required to drive advancements in the technological and digital landscape and, the energy transition for a carbon neutral future. This growing demand however, implies that the metal extraction industry will need to play a significant role in providing the world with vast quantities of metals crucial in the building of the necessary infrastructure.
Furthermore, energy and water are two critical inputs in the hydrometallurgical process flowsheets and their increasing shortage suggests the need for the development of processes that take such challenges into consideration. A circular hydrometallurgy approach focusing on innovative research and developments around energy and resource efficient processes based on closing materials and resources loops can therefore, play an important role if the metal extraction sector is to meet the current and future global metal demands. In addition, advancements in the field of artificial intelligence can also allow for the use of innovative tools such as machine learning to better understand, predict and optimise hydrometallurgical processes in a smarter and sustainable manner.
The SAIMM Hydrometallurgy conference, 2024, will bring together internationally and locally recognized scientists and engineers from mining and metal producing companies, project design and implementation entities, equipment and reagent suppliers, research and academic institutions to discuss and share innovative technologies that can assist the global world in meeting the current and future metal demands.
ECSA Validated CPD Activity, Credits = 0.1 points per hour attended.
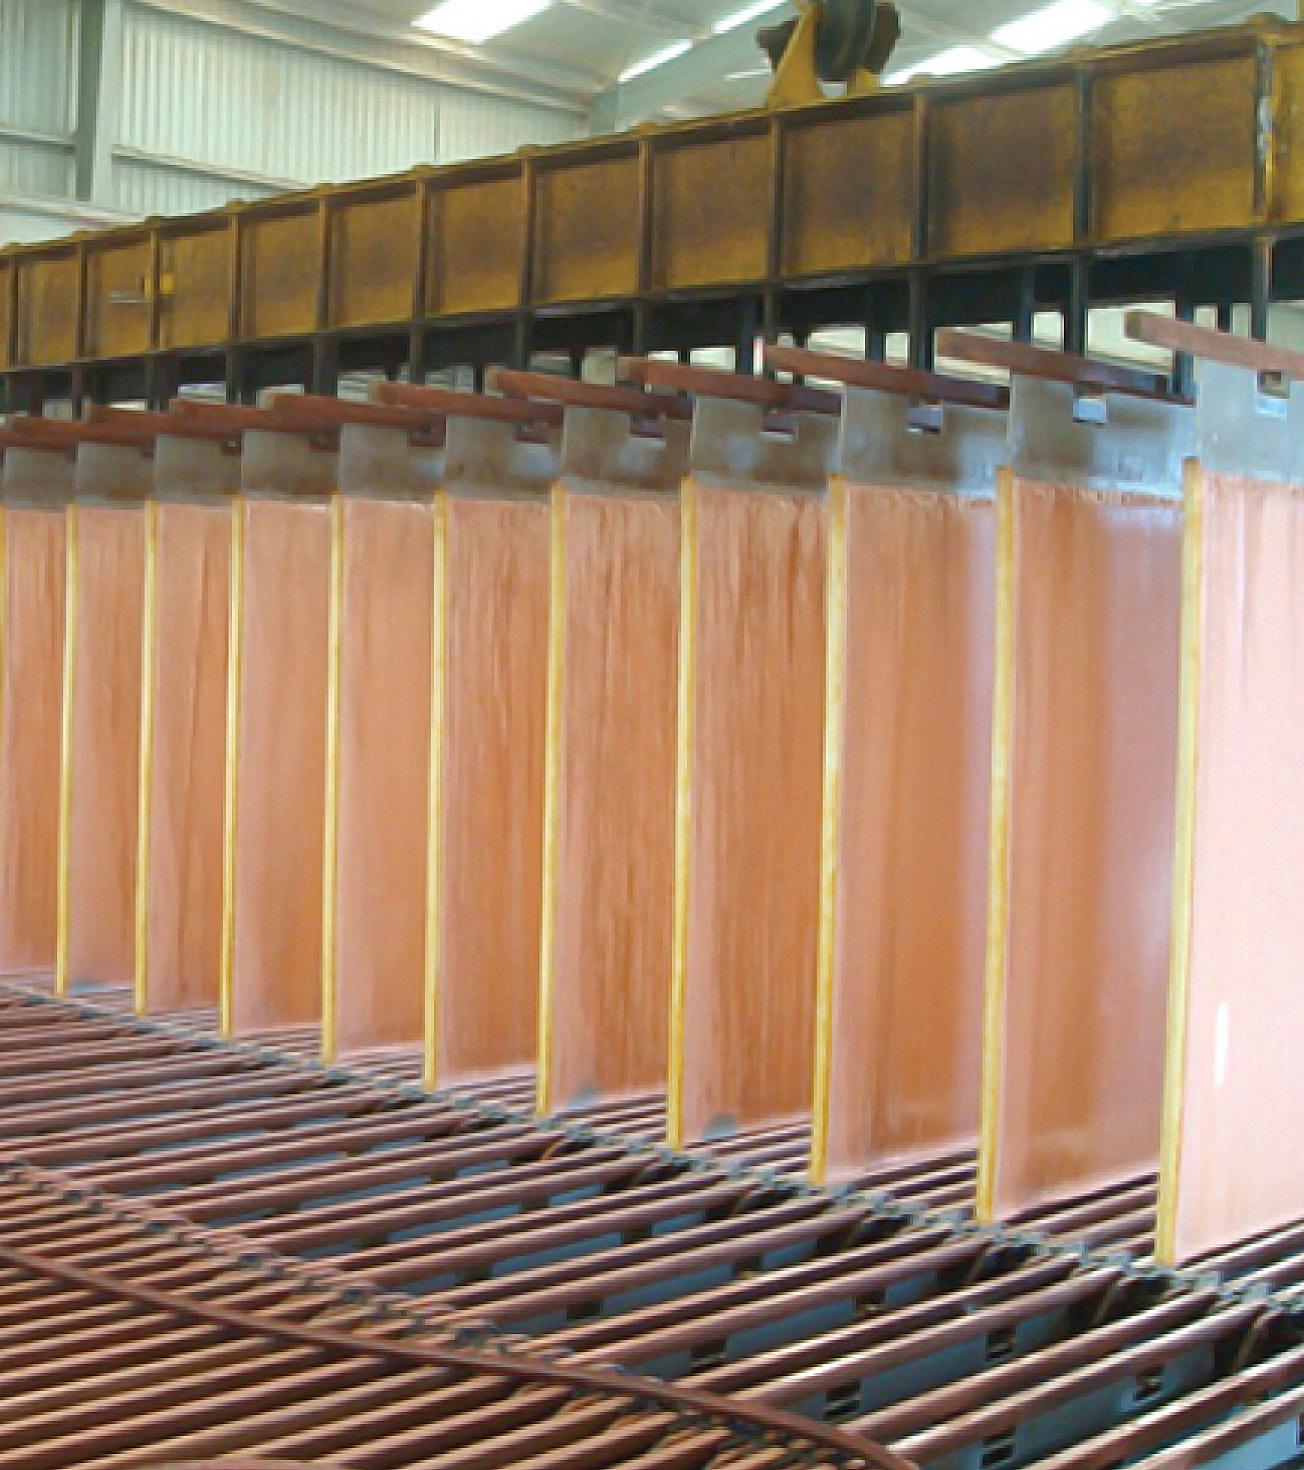
FOR FURTHER INFORMATION, CONTACT:
Camielah Jardine, Head of Conferences and Events
camielah@saimm.co.za