


Growthof the SAIMM membership is crucial to sustaining our organization. As part of developing future leaders of the Institute, we offer students the opportunity to become Student members at no cost. We are one of the few global learned societies who do this, and we do it as part of giving credibility to our motto Capaci Occasio, translated as ‘to the capable, the opportunity.’ We want to give our young people the opportunity of excelling in their chosen careers.
To become a Student member of the SAIMM, a candidate must fulfil the following criteria:
• Be in their third or further year of being educated or trained in a manner approved by SAIMM’s Council to occupy a technical position or associated with the minerals or metals industries;
• Satisfy the Council that he/she is eligible to become a Student member, i.e., by confirming their registration as a student with a head of department or lecturer at the educational institution listed on their application;
• Remain a Student member only while he/she is being educated in a manner approved by the Council;
• Confirm their membership at the beginning of each academic year by submitting proof of registration at their applicable tertiary institution: failure to submit proof of registration will result in termination of their membership;
• Not remain a Student member after the end of the Institute’s financial year in which he/she attains the age of 28 years. The Council may relax the provisions of this clause in such cases as it considers appropriate.
All of the above are easy to comply with, and we encourage students to use the opportunity to apply for membership.
We also encourage students to participate in the Annual Student Colloquium, which has been held annually for over 21 years. The Colloquium provides a networking opportunity for students from several universities, and the best final-year mining and metallurgical students have an opportunity to present their final-year projects to an audience of mining and metallurgical industry experts.
Although we have not held the Career and Leadership Conference since the COVID period, we are planning this again as part of the Young Professionals Council events later in 2024. This event comprises several presentations from industry professionals and leaders aimed at students entering the workplace, and rotates between the universities of Johannesburg, Pretoria, UNISA, and Wits.
SAIMM and the Johannesburg Branch also host the Annual Student Debate. The aim of this event is to provide a platform for students to hone their presentation and debating skills.
The Institute prides itself on proving these platforms for students to excel, while also giving them an opportunity to network, interact, and compete against their peers. This is a stepping stone to becoming a young professional, and ultimately a professional in the minerals industry. We are here to support students in their development and growth.
At the Annual General Meeting this year (2024), we will be awarding 50-year memberships to fourteen members of the Institute. All these members joined SAIMM when they were students and saw the value in being part of a network of professionals with whom they could engage and learn from. This is a goal to strive for.
OFFICE BEARERS AND COUNCIL FOR THE 2023/2024 SESSION
Honorary President
Nolitha Fakude
President, Minerals Council South Africa
Honorary Vice Presidents
Gwede Mantashe
Minister of Mineral Resources and Energy, South Africa
Ebrahim Patel
Minister of Trade, Industry and Competition, South Africa
Blade Nzimande
Minister of Higher Education, Science and Technology, South Africa
President
W.C. Joughin
President Elect
E. Matinde
Senior Vice President
G.R. Lane
Junior Vice President
T.M. Mmola
Incoming Junior Vice President
M.H. Solomon
Immediate Past President
Z. Botha
Honorary Treasurer
E. Matinde
Ordinary Members on Council
W. Broodryk M.C. Munroe
Z. Fakhraei S. Naik
R.M.S. Falcon (by invitation) G. Njowa
B. Genc
S.J. Ntsoelengoe
K.M. Letsoalo S.M. Rupprecht
S.B. Madolo
A.T. van Zyl
F.T. Manyanga E.J. Walls
K. Mosebi
Co-opted Council Members
M.A. Mello
Past Presidents Serving on Council
N.A. Barcza C. Musingwini
R.D. Beck S. Ndlovu
J.R. Dixon J.L. Porter
V.G. Duke M.H. Rogers
I.J. Geldenhuys D.A.J. Ross-Watt
R.T. Jones G.L. Smith
A.S. Macfarlane W.H. van Niekerk
G.R. Lane – TP Mining Chairperson
Z. Botha – TP Metallurgy Chairperson
K.W. Banda – YPC Chairperson
S. Nyoni – YPC Vice Chairperson
Branch Chairpersons
Botswana Vacant
DRC Not active
Johannesburg N. Rampersad
Limpopo S. Zulu
Namibia Vacant
Northern Cape I. Tlhapi
North West I. Tshabalala
Pretoria Vacant
Western Cape A.B. Nesbitt
Zambia J.P.C. Mutambo (Interim Chairperson)
Zimbabwe Vacant
Zululand C.W. Mienie
*Deceased
* W. Bettel (1894–1895)
* A.F. Crosse (1895–1896)
* W.R. Feldtmann (1896–1897)
* C. Butters (1897–1898)
* J. Loevy (1898–1899)
* J.R. Williams (1899–1903)
* S.H. Pearce (1903–1904)
* W.A. Caldecott (1904–1905)
* W. Cullen (1905–1906)
* E.H. Johnson (1906–1907)
* J. Yates (1907–1908)
* R.G. Bevington (1908–1909)
* A. McA. Johnston (1909–1910)
* J. Moir (1910–1911)
* C.B. Saner (1911–1912)
* W.R. Dowling (1912–1913)
* A. Richardson (1913–1914)
* G.H. Stanley (1914–1915)
* J.E. Thomas (1915–1916)
* J.A. Wilkinson (1916–1917)
* G. Hildick-Smith (1917–1918)
* H.S. Meyer (1918–1919)
* J. Gray (1919–1920)
* J. Chilton (1920–1921)
* F. Wartenweiler (1921–1922)
* G.A. Watermeyer (1922–1923)
* F.W. Watson (1923–1924)
* C.J. Gray (1924–1925)
* H.A. White (1925–1926)
* H.R. Adam (1926–1927)
* Sir Robert Kotze (1927–1928)
* J.A. Woodburn (1928–1929)
* H. Pirow (1929–1930)
* J. Henderson (1930–1931)
* A. King (1931–1932)
* V. Nimmo-Dewar (1932–1933)
* P.N. Lategan (1933–1934)
* E.C. Ranson (1934–1935)
* R.A. Flugge-De-Smidt (1935–1936)
* T.K. Prentice (1936–1937)
* R.S.G. Stokes (1937–1938)
* P.E. Hall (1938–1939)
* E.H.A. Joseph (1939–1940)
* J.H. Dobson (1940–1941)
* Theo Meyer (1941–1942)
* John V. Muller (1942–1943)
* C. Biccard Jeppe (1943–1944)
* P.J. Louis Bok (1944–1945)
* J.T. McIntyre (1945–1946)
* M. Falcon (1946–1947)
* A. Clemens (1947–1948)
* F.G. Hill (1948–1949)
* O.A.E. Jackson (1949–1950)
* W.E. Gooday (1950–1951)
* C.J. Irving (1951–1952)
* D.D. Stitt (1952–1953)
* M.C.G. Meyer (1953–1954)
* L.A. Bushell (1954–1955)
* H. Britten (1955–1956)
* Wm. Bleloch (1956–1957)
* H. Simon (1957–1958)
* M. Barcza (1958–1959)
* R.J. Adamson (1959–1960)
* W.S. Findlay (1960–1961)
* D.G. Maxwell (1961–1962)
* J. de V. Lambrechts (1962–1963)
* J.F. Reid (1963–1964)
* D.M. Jamieson (1964–1965)
* H.E. Cross (1965–1966)
* D. Gordon Jones (1966–1967)
* P. Lambooy (1967–1968)
* R.C.J. Goode (1968–1969)
* J.K.E. Douglas (1969–1970)
* V.C. Robinson (1970–1971)
* D.D. Howat (1971–1972)
* J.P. Hugo (1972–1973)
* P.W.J. van Rensburg (1973–1974)
* R.P. Plewman (1974–1975)
* R.E. Robinson (1975–1976)
* M.D.G. Salamon (1976–1977)
* P.A. Von Wielligh (1977–1978)
* M.G. Atmore (1978–1979)
* D.A. Viljoen (1979–1980)
* P.R. Jochens (1980–1981)
* G.Y. Nisbet (1981–1982)
A.N. Brown (1982–1983)
* R.P. King (1983–1984)
J.D. Austin (1984–1985)
* H.E. James (1985–1986)
H. Wagner (1986–1987)
* B.C. Alberts (1987–1988)
* C.E. Fivaz (1988–1989)
* O.K.H. Steffen (1989–1990)
* H.G. Mosenthal (1990–1991)
R.D. Beck (1991–1992)
* J.P. Hoffman (1992–1993)
* H. Scott-Russell (1993–1994)
J.A. Cruise (1994–1995)
D.A.J. Ross-Watt (1995–1996)
N.A. Barcza (1996–1997)
* R.P. Mohring (1997–1998)
J.R. Dixon (1998–1999)
M.H. Rogers (1999–2000)
L.A. Cramer (2000–2001)
* A.A.B. Douglas (2001–2002)
* S.J. Ramokgopa (2002-2003)
T.R. Stacey (2003–2004)
F.M.G. Egerton (2004–2005)
W.H. van Niekerk (2005–2006)
R.P.H. Willis (2006–2007)
R.G.B. Pickering (2007–2008)
A.M. Garbers-Craig (2008–2009)
J.C. Ngoma (2009–2010)
G.V.R. Landman (2010–2011)
J.N. van der Merwe (2011–2012)
G.L. Smith (2012–2013)
M. Dworzanowski (2013–2014)
J.L. Porter (2014–2015)
R.T. Jones (2015–2016)
C. Musingwini (2016–2017)
S. Ndlovu (2017–2018)
A.S. Macfarlane (2018–2019)
M.I. Mthenjane (2019–2020)
V.G. Duke (2020–2021)
I.J. Geldenhuys (2021–2022)
Z. Botha (2022-2023)
S.O. Bada
R.D. Beck
P. den Hoed
I.M. Dikgwatlhe
M. Erwee
B. Genc
R Hassanalizadeh
R.T. Jones
W.C. Joughin
A.J. Kinghorn
D.E.P. Klenam
J. Lake
H.M. Lodewijks
D.F. Malan
C. Musingwini
S. Ndlovu
P.N. Neingo
S.S. Nyoni
M. Phasha
P. Pistorius
P. Radcliffe
N. Rampersad
Q.G. Reynolds
I. Robinson
S.M. Rupprecht
K.C. Sole
T.R. Stacey
D. Vogt
F. Uahengo
International Advisory Board members
R. Dimitrakopolous
R. Mitra
A.J.S. Spearing
E. Topal
D. Tudor
Editor /Chairperson of the Editorial Board
R.M.S. Falcon
Typeset and Published by
The Southern African Institute of Mining and Metallurgy PostNet Suite #212 Private Bag X31 Saxonwold, 2132
E-mail: journal@saimm.co.za
Printed by Camera Press, Johannesburg
Advertising Representative
Barbara Spence
Avenue Advertising

Journal Comment: Wonders of New Age Technology by M.W. Erwee iv
President’s Corner: SAIMM and SANIRE by W.C. Joughin v-vi
SAMCODES News June 2024 338
Obituary: Sedupe Josiah Ramokgopa 348
THE INSTITUTE, AS A BODY, IS NOT RESPONSIBLE FOR THE STATEMENTS AND OPINIONS ADVANCED IN ANY OF ITS PUBLICATIONS.
Copyright© 2024 by The Southern African Institute of Mining and Metallurgy. All rights reserved. Multiple copying of the contents of this publication or parts thereof without permission is in breach of copyright, but permission is hereby given for the copying of titles and abstracts of papers and names of authors. Permission to copy illustrations and short extracts from the text of individual contributions is usually given upon written application to the Institute, provided that the source (and where appropriate, the copyright) is acknowledged. Apart from any fair dealing for the purposes of review or criticism under The Copyright Act no. 98, 1978, Section 12, of the Republic of South Africa, a single copy of an article may be supplied by a library for the purposes of research or private study. No part of this publication may be reproduced, stored in a retrieval system, or transmitted in any form or by any means without the prior permission of the publishers. Multiple copying of the contents of the publication without permission is always illegal. U.S. Copyright Law applicable to users In the U.S.A. The appearance of the statement of copyright at the bottom of the first page of an article appearing in this journal indicates that the copyright holder consents to the making of copies of the article for personal or internal use. This consent is given on condition that the copier pays the stated fee for each copy of a paper beyond that permitted by Section 107 or 108 of the U.S. Copyright Law. The fee is to be paid through the Copyright Clearance Center, Inc., Operations Center, P.O. Box 765, Schenectady, New York 12301, U.S.A. This consent does not extend to other kinds of copying, such as copying for general distribution, for advertising or promotional purposes, for creating new collective works, or for resale.
Honorary Legal Advisers
M H Attorneys
Auditors
Genesis Chartered Accountants
Secretaries
The Southern African Institute of Mining and Metallurgy 7th Floor, Rosebank Towers, 19 Biermann Avenue, Rosebank, 2196
PostNet Suite #212, Private Bag X31, Saxonwold, 2132 E-mail: journal@saimm.co.za
Telephone (011) 463-7940 . E-mail: barbara@avenue.co.za ISSN 2225-6253 (print) . ISSN 2411-9717 (online)


The status of extended reality technology in South Africa’s mining industry by S.M. Buthelezi, J. Maritz, and K. de Beer
In 2021, the Minerals Council of South Africa highlighted the potential of extended reality technologies to achieve zero-harm production and modernize the mining industry. Through use of an online survey, this study assessed the awareness, knowledge, and current use of extended reality in the South African mining industry. The paper defines the nature and capabilities of different extended reality technologies, and assesses levels of their understanding and application within the industry.
A conceptual framework for reframing artisanal and small-scale mining: understanding characterization of artisanal and small-scale mining in South Africa by M. Chuma, T.-L. Field, and N. Mutemeri
This study addresses the differences between legal and scholarly definitions of small-scale and artisanal mining in a wide range of geographic jurisdictions, and the impact of these on policy development and legislation. Negative environmental, economic, sociocultural, safety, and health consequences of informality and illegality of such mining are discussed in terms of the tragedy of the commons theory. It is argued that formalization of these industries is necessary for their sustainable continued existence.
A critical investigation into identifying key focus areas for the implementation of blockchain applications in the mining industry by K.G. Philo and R.C.W. Webber-Youngman
In this era of data-driven decision-making, safeguarding and ensuring the integrity of digital information exchange have become paramount. To address these challenges, blockchain technology was identified as a possible tool for enabling secure and trusted digital value exchange within the mining industry. This research study provides a fundamental understanding of blockchain technology’s capabilities and explores its potential applications within the mining industry. Areas are identified for further research and development of blockchain applications.
Compositing and regularization of drillhole data for geostatistical resource estimation by L.W. Palmer
In this paper, three compositing or regularisation of drillhole data methods are reviewed and the effects of inappropriate compositing methodologies presented. It is shown through a case study that compositing samples to different lengths leads to changes in the average and variance of the grades in the datasets of the drill cores, which impact the final estimated value. The importance of appropriately treating blank and zero data is also presented. Globally, these differences might be minimal, but locally could be substantial, affecting the reliability of the estimation and subsequent use of results in mine planning and reconciliation.
Kinetic study of reaction formation of phosphate products from thermal dissolution of wolframite using fusion technique by T.T. Chiweshe, L.S. Mokhahlane, and M. Welman-Purchase
This study examines an alternative technique of extracting tungsten from wolframite ore using a fusion method with ammonium phosphate salt. A two-step extraction process is examined. The novelty of this technique is the ability to completely decompose wolframite ore and to form an unstable tungsten oxide phosphate (WO2(PO3)2) compound. The instability of WO2(PO3)2 in water enables selective isolation of tungsten as insoluble precipitates of WO3 and WO.
The future of Ni−Cu smelting in Botswana: the choice between flash-smelting and top-submerged lance furnaces by A. Mabentsela and B. Ceki
This study examines the relative operating costs and technology benefits of using the existing flash-smelting furnace at BCL nickel–copper operation, Botswana, compared with a top-submerged lance furnace. The study is based on statistical analysis of published operating data for three copper flash smelters and two copper top-submerged lance furnaces, and extrapolation of these data to the nickel–copper conditions at BCL. No capital cost comparison is undertaken.
Forecasting open-pit slope runout distances by A. McQuillan and N. Bar
This paper updates previous empirical relationships presented by the authors for estimating the volume and runout distance of excavated slope failures in an open-pit mine operation using slope geometry as the primary predictor. Of the parameters analysed, slope height was found to be the simplest and best predictor of runout distance. This paper presents new charts for predicting failed material runout distance for rock slopes. Relationships are defined for structurally and rock mass-driven slope failure mechanisms at 75% and 95% prediction intervals.
303
311
331
339
349
355


If you’re bored, it’s probably your own fault. When I was a firstyear student in 2002, I was exceptionally shy and introverted, like many of my engineering student friends. I grew up with technology and was one of the first among my peers to sacrifice a bit of hard-earned internet-café job money (intended for a few on-campus treats at Steers) to buy a USB flash drive. I would crawl under computer laboratory desks to find the USB port to plug it in, much to the amusement of my peers who were still using floppy disks. Six months later, there were extension cables on the tables to plug in your ‘stick’. Google and Wikipedia were novelties, and search engines like Yahoo and Alta Vista were considered great for starting an internet search. The library computers and staff were invaluable for finding relevant information on all subjects.
I was not suffering, nor was I unhappy, because there were very few modern tools available for any kind of ‘instant solution’ to a problem. Learning was by discovery and, to a large degree, it gave me great satisfaction. It just took lots of time, and when I was frustrated, getting help was not as simple as ‘googling’ it. Nor was it easy for me to approach my lecturers (who were all great, by the way) because I was simply too shy. I’ve come out of my shell since.
As I read through the abstracts for this month’s edition of the journal, I was again amazed by how far we’ve come as a human race in leveraging technology to our advantage. This month’s edition features a particular paper based on a master’s degree project in mining engineering that piqued my interest. Within seconds, I could open the dissertation online and read all about it. As a Xennial, a cross between Generation X and Millennial, I deeply appreciate the ability to instantly access information. I am reminded of a quote from The History Boys, in which the eccentric Mr. Hector says, ‘The best moments in reading are when you come across something – a thought, a feeling, a way of looking at things – that you’d thought special, particular to you. And here it is, set down by someone else, a person you’ve never met, maybe even someone long dead. And it’s as if a hand has come out, and taken yours’.
Those moments come when I read papers and explore new things. This keeps me hopeful that we have a bright future, despite our challenges as an industry. We have gargantuan sets of data to explore, centuries of knowledge at our fingertips, and free tools to leverage all of this to our advantage.
You simply can’t be bored or out of ideas. If you are, it’s probably your own fault. When in doubt, Google it, watch a YouTube tutorial, or ask ChatGPT for some ideas. Also, invite a young person for coffee—they’ll help you more than you might expect!
M.W. Erwee Pyrometallurgist


n April 2024, SAIMM began providing secretarial services to the South African National Institute of Rock Engineering (SANIRE) https://www.sanire.co.za/, following approval by the council in February 2024. These services encompass membership management through the MYMEMBERSHIP platform, coordination of branch meetings and annual conferences, administrative support, and accounting services. Prudence Ntumelang has been re-employed by SAIMM as the SANIRE administrator. This arrangement aims to strengthen the collaboration between SAIMM and SANIRE.
SANIRE operates under a constitution that govern their operations, decision-making processes, and codes of ethics, like the SAIMM. It was established in 1969 as the South African National Group of Rock Mechanics (SANGORM) and became a national group within the newly formed International Society for Rock Mechanics (ISRM). In 1999, SANGORM was renamed SANIRE, reflecting its objective to evolve into a professional institute.
I am often asked about the difference between rock mechanics and rock engineering. Rock mechanics is a theoretical and applied science of the mechanical behaviour of rocks and rock masses. Rock Engineering is the creative application of rock mechanics, mathematical methods, and empirical evidence to the innovation, design, construction, and maintenance of surface and underground excavations. SANIRE primarily focuses on rock engineering in the mining industry, although it also includes members who work mainly in civil infrastructure. In contrast, the ISRM places a strong emphasis on civil infrastructure, while including mining and energy.
SANIRE is actively involved in the education and qualification of rock engineering practitioners in the South African mining industry. The Minerals Council Rock Mechanics Certificates, previously Chamber of Mines Rock Mechanics Certificates are managed by SANIRE on behalf of the Minerals Council of South Africa (MCSA). These are currently the only rock engineering qualifications currently recognized by the Mine Health and Safety Act of 1996 (MHSA). SANIRE is also actively participating in the MCSA Mine Occupational Health and Safety (MOSH) and Fall of Ground Action Plan (FOGAP) programmes, which I mentioned in my April President’s Corner https://www.saimm.co.za/journal-presidents-corner/1091-questfor-zero-harm-in-south-african-deep-gold-mines
The SAIMM and SANIRE have collaborated in the organization of many successful international rock engineering conferences for more than 30 years. Our secretariat carries out all the administrative requirements and co-ordinates the refereeing of papers, while SANIRE provides the technical expertise. Papers on the management of rockfalls and rockbursts have probably featured in the SAIMM journal from the very beginning. However, the term Rock Mechanics was first coined in the 1960s, when the discipline really started in earnest, and the term Rock Engineering was introduced later. Many groundbreaking papers on the subject have been published in our journal, several preceding the formation of the ISRM. More recently recognition has been given through the award of many SAIMM gold and silver medals to papers on rock engineering. Notable multiple medal recipients include Dick Stacey, Nielen van der Merwe, John Napier and Francois Malan. SAIMM books on rock mechanics and rock engineering include: Rock Mechanics in Mining Practice (Sandor Budavari), Handbook on Hard-Rock Strata Control (Sam Spearing), Rock Fracture and Rockbursts-an illustrative study (Dave Ortlepp), Rock Engineering for underground coal mining (Nielen van der Merwe and Bernard Madden), Theoretical Rock Mechanics for Professional Practice (Matthew Handley), Johannesburg and its Holey Mining Heritage (Dick Stacey and Greg Heath).
The recent book by Brian Protheroe entitled COMRO’s Legacy: Research and Development of Stoping Mining Machinery and Technologies. https://www.saimm.co.za/publications/saimm-book-sale
The collaboration is further evident because I and four past SAIMM Presidents https://www.saimm. co.za/about-saimm/saimm-past-presidents, (Horst Wagner, Oskar Steffen, Dick Stacey, Nielen van der Merwe) have also served as SANIRE/SANGORM Presidents and ISRM Vice Presidents for Africa. Nielen also served as the President of ISRM from 2003 to 2007, and chaired the 2003 ISRM International Congress in Johannesburg, which was organized by the SAIMM. Past Presidents Pinkie (FG) Hill and Miklos Salamon also made major contributions to the discipline. Several former Brigadier Stokes Memorial Award https://www.saimm.co.za/about-saimm/brigadier-stokes-memorial-award recipients have provided key contributions to rock engineering (Pinkie Hill, Miklos Salamon, Horst Wagner, Dennis Laubscher, and Dick Stacey).
SANIRE held its 2024 symposium https://www.sanire.co.za/ at Silverstar hotel in Muldersdrift from 2024-06-13 to 2024-06-14, which was arranged by our secretariat, and I was glad to attend. The symposium was opened by the current SANIRE President, Kevin Le Bron and the programme included several keynotes: Winning the war on falls of ground, Lerato Tsele, MCSA; Advancing rock engineering skills for a sustainable future in Mining; Thabo Mashongoane, Mining Qualifications Authority South Africa (MQA); Developments in pillar design, Bryan Watson, University of the Witwatersrand. SANIRE also announced the launch of their new education platform. There were several interesting presentations on many topics covering open pit and underground mining, developments in support practice, case studies and an interesting trial on hydraulic fracturing for preconditioning. I certainly enjoyed the conference and learned a great deal. As always, the geotechnical service and rock support suppliers came to the party, sponsoring and providing an illuminating exhibition.
During the symposium, the SANIRE Treasurer, Sifiso Mashile, informed members of the new agreement and highlighted the contribution by the SAIMM secretariat, since the secretarial service commenced. Unfortunately, recent administrative challenges had prevented the reliable collection of membership fees, creating significant cashflow challenges. This has now been resolved through Prudence’s timely intervention.
The process of organizing the next international conference on rock engineering in South Africa has commenced, so keep your eye out for announcements, starting with a call for papers. I believe that the new arrangement to provide secretarial services to SANIRE can only improve the collaboration going forward, and importantly, enabling SANIRE to maintains its identity as a leading national group of rock engineering.
W.C. Joughin President, SAIMM

Affiliation:
1Department of Mining Engineering, University of Pretoria, Pretoria, South Africa
Correspondence to:
S.M. Buthelezi
Email: u16107498@tuks.co.za
Dates:
Received: 28 Feb. 2022
Revised: 1 May 2022
Accepted: 13 Mar. 2024
Published: June 2024
How to cite:
Buthelezi, S.M., Maritz, J., and de Beer, K. 2024. The status of extended reality technology in South Africa’s mining industry. Journal of the Southern African Institute of Mining and Metallurgy, vol. 124, no. 6. pp. 303–310
DOI ID:
http://dx.doi.org/10.17159/24119717/2035/2024
ORCID:
J. Maritz
http://orcid.org/0000-0002-4176-8919
K. de Beer
http://orcid.org/0000-0003-0871-1782
by S.M. Buthelezi1*, J. Maritz1, and K. de Beer1
*Paper written on project work carried out in partial fulfilment of BEng(Hons) (Mining Engineering) degree
Abstract
The economic upheaval of COVID-19 forced companies to invest in emerging technologies to aid recovery. One such technology is extended reality, which is becoming a mature and innovative tool. Early adopters are seeing significant benefits in learning, training, immersive data visualization, and remote assistance. In South Africa, the mining industry is increasingly interested in using extended reality to optimize and innovate operations. The Minerals Council of South Africa's July 2021 report highlighted the potential of extended reality's to achieve zero-harm production and modernize the industry. However, the extent of extended reality adoption in mining remains unclear due to limited information on its usage. This study addressed this gap by distributing an online survey to assess awareness, knowledge, and current uses of extended reality in South Africa’s mining sector. The results indicated that virtual and augmented reality had the highest levels of awareness and usage, primarily for learning and training. Mixed reality, however, had the lowest awareness and knowledge levels. In terms of applications, visualization and remote assistance had the least use cases. These findings highlight that the South African mining industry is deficient in its understanding and use of extended reality technologies. Without better awareness and application, the South African industry risks missing out on the full benefits of extended reality. The study underlines the need for the South African mining industry to improve its outlook on extended reality technologies to fully leverage their potential applications and benefits.
Keywords
extended reality, mixed reality, training, visualization, collaboration, South Africa, mining
Introduction
Governments and businesses across the globe have been forced to accelerate adoption and implementation of new technologies to mitigate the economic upheaval of the COVID-19 pandemic (Hajj et al., 2020).
One technology set to innovate businesses across the globe is augmented reality (AR), which is part of a larger class of emerging technologies referred to as extended reality (XR) technologies. XR technologies either blend the virtual and real world, or vice versa (Marr, n.d.). XR technologies include virtual reality (VR) and mixed reality (MR). These reality-extension tools are transforming into mature technologies at the forefront of innovation. This is supported by Gartner’s most-recent technology report, which forecast that multi-experience or immersive platforms would be deployed in at least one-third of all businesses by 2021 (Dilmegani, 2022). Moreover, the technology scouting report of Minerals Council South Africa (MINCOSA) (2021), which explored technology-driven training solutions to support the South African mining industry to achieve zero-harm production and assist with modernization of the industry, placed XR technologies at the forefront of these efforts.
The appeal of XR technologies in this data-driven era is that businesses that embrace data are those that will succeed. XR technologies enable this by putting valuable information in a context that allows users to get better results. This represents a significant change in how businesses and individuals interact with data (Engholm, 2020): instead of struggling through spreadsheets to analyze and understand their data, businesses could get a more accurate understanding by using XR technologies, such as smart glasses, to assess the data through immersive data visualization, which will assist them in making better and more informed decisions (Engholm, 2020). XR technologies make this possible by giving users the opportunity to absorb and decipher vast amounts of information through immersive, three-dimensional (3D)
experiences, which enable on-the-spot solutions and continuous, dynamic training environments (Engholm, 2020). Moreover, XR tools have the ability to connect individuals, regardless of their physical location, for engineering tasks that require communication of spatial data, such as in-design and prototyping and for troubleshooting and repair, through immersive remote collaboration and remote assistance (Rabaudo et al., 2020).
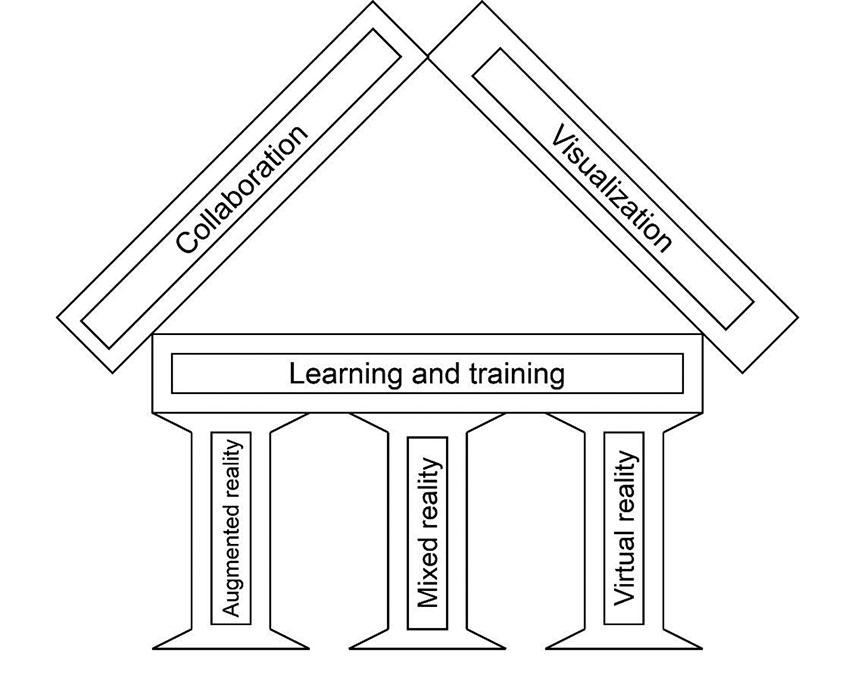
Industrial applications of XR technologies can be categorized as learning and training, immersive data visualization, and remote assistance or collaboration. Their added benefit is that all the subtypes (VR, AR, and MR) are capable of performing each of the aforementioned applications. Figure 1 provides a schematic summary of the XR technologies and their supported applications.
There are several users of XR technologies, particularly AR, in the manufacturing industry that are incorporating these into their processes to optimize their business and achieving significant gains. Table I summarizes how three early adopters are utilizing AR technologies, as well as the gains from adopting and implementing XR solutions within their processes. All XR technologies are capable of supporting all industrial applications, so it is possible to achieve similar gains utilizing either VR or MR, provided the specific XR technology is suitable for a particular field and its intended use.
Motivations for the manufacturing industry’s drive towards developing XR technology solutions are the persistent rises in costs of equipment, product assembly, and workforce training. This is further compounded by technological innovation, which is driving even higher demands for a more skilled labour force due to the growing complexity of manufacturing equipment. These conditions create new challenges for manufacturing companies to find ground-breaking solutions, such as those provided by XR technologies, which save time, lower costs, and guarantee that their more-generalist workforce has the know-how to efficiently do their jobs (Montgomerie, 2019).
Globally, the mining industry is experiencing similar issues as well as mining-specific issues, such as depleting reserves, increasing geological complexity, decreasing ore grades, and price volatility (Viktoriia et al., 2019). In response, mining companies across the globe are collaborating with experts and service providers of immersive technologies to develop XR solutions to optimize their operational processes and improve profit margins. Findings of a literature survey concerning the use of XR technologies in the global mining industry revealed that some of the initial research
goes back over 20 years. Much initial research focused on use of VR technology for learning and training (Bise, 1997; Denby et al., 1998; Schofield et al., 1995; Zhang et al., 1999). The mining industry in South Africa took notice of XR technologies during this period because there were similar publications concerning use of VR technologies for personnel training (Squelch, 2001).
Through advances in XR technologies in the past decade, the global mining industry has furthered integration of XR technologies within their organizational processes. This is seen in research regarding the adoption and implementation of technologies such as AR and MR, and concerning applications of XR technologies besides learning and training. For example, Belyi and Nikitenko (2018) did research in Russia concerning the application of HMT1, which is an AR device that allows employees to gain access to documents and communicate with other employees to assist with dispatch control in underground mining. In Chile, Gonzalez et al. (2016) published their findings on an immersive 3D geological and mining data visualization tool, known as Mixed Reality Exploration Environment (Miree). However, based on the available academic and informal publications, there appear to be no comparable
Initial users of extended reality technologies for industrial applications (adapted from Montgomerie, 2019)
Company Lockheed Martin
Industrial sector Aeronautical engineering
Unilever
Consumer products manufacturer
Prince Castle
Foodservice equipment manufacturer XR technology AR AR AR
Use category Visualization, training
Purpose Superimpose digital data and
Collaboration (remote assistance)
Connect employees on factory floor
Collaboration (remote assistance)
Connect general contractor with assembly instructions onto with experts for machine repairs
Prince Castle experts for troubleshooting components and repair
Results 35%–50% decrease in overall 50% decrease in overall machine 100% success rate in diagnosis on initial visit; technician time; 90%–99% downtime; 1700% return on initial 50% decrease in service trips; decrease in time to interpret investment. 50%–80% decrease in labour cost. drawings and instructions; 85% decrease in overall time for training.
efforts in South Africa’s mining industry with regards to the advancement of XR technologies. This lack of available literature served as motivation for this research project, which was to provide insight into the state of XR technologies in South Africa’s mining industry, with particular interest regarding the levels of awareness and knowledge, and existing applications of XR technologies in the industry. To comprehend the methodology and results of this paper, it is important to understand XR technology, with particular reference to the capabilities and properties of the different technologies: VR, AR, and MR.
What is extended reality technology?
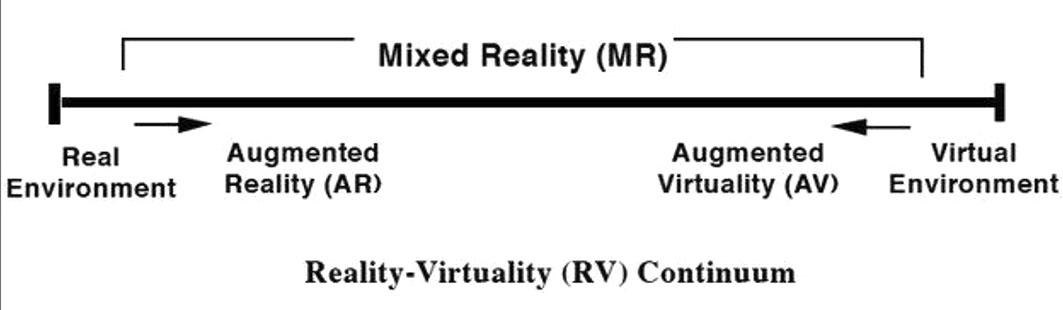
XR is a relatively new term that covers all immersive technologies that extend the reality of the real world (Lokesha et al., 2020). The concept originates from the reality–virtuality (RV) continuum proposed by Milgram and Kishino (1994), which explains the transition between the real world on one end of the continuum and completely digital or virtual environment (VE) on the other end. Figure 2 shows a graphical adaptation of this continuum.
From a technology perspective, XR is a more modern term used to describe the RV continuum. XR encompasses VR, AR, and MR, as well as other future realities that could be created as immersive technologies (XR4ALL, n.d.). XR covers the entire spectrum of real and virtual environments and the technologies associated with each environment.
Virtual reality
VR represents an artificial computer environment, which allows users to explore a realism that differs from the physical environment. It typically uses head-mounted displays (HMD), such as HTC Vive™, to create realistic sensations, such as sound and visuals, to create an artificial reality that is similar to the actual physical environment. Users who wear an HMD enter a simulated digital experience and are under the illusion of the VE. A VE is a digital world in which a user’s actions are tracked and their surroundings are rendered, or digitally composed, and presented to the senses in accordance with the movements made by the user (Lokesha et al., 2020).
Augmented reality
AR is a system that enhances the real world with virtual objects that seem to co-exist in the same space as the actual physical environment (Azuma et al., 2001). Moreover, according to Azuma (1997), an AR system is characterized by two or more properties that interact in real time, as well as alignment and blending of actual and digital objects in 3D. Although virtual elements are seamlessly projected, in contrast to VR, AR does not produce a new synthetic reality that replaces the actual physical environment; instead, it overlays supplementary virtual data onto the actual physical surroundings/objects (Carmigniani et al., 2011; Tang et al., 2003). Simply put, AR adds additional information to the user’s perspective, thereby enhancing their perception of their surroundings by providing contextual information by overlaying
digital objects in the actual physical environment. However, these objects do not interact with the physical environment: the interaction with the digital objects occurs on the devices themselves, with inputs from the user (Nee et al., 2012).
The MR environment combines real and virtual environments in such a way that a window is created between them. As a result, a physical object interacts with a virtual object to perform practical scenarios for the user. There are three key characteristics of any MR system: (i) combining of real-world and virtual objects; (ii) interacting in real time; and (iii) mapping between a virtual object and physical object to create interactions between them. MR systems are created to give their users the sense that the digital objects are in the same space as the physical objects. For coexistence to be possible, the digital objects have to be accurately placed in the actual physical environment and aligned with the physical objects in real time (Rokhsaritalemi et al., 2020). MR includes systems where either virtual elements or those in the physical reality are prevalent; within this range, AR contains more physical elements than virtual elements (Rokhsaritalemi et al., 2020).
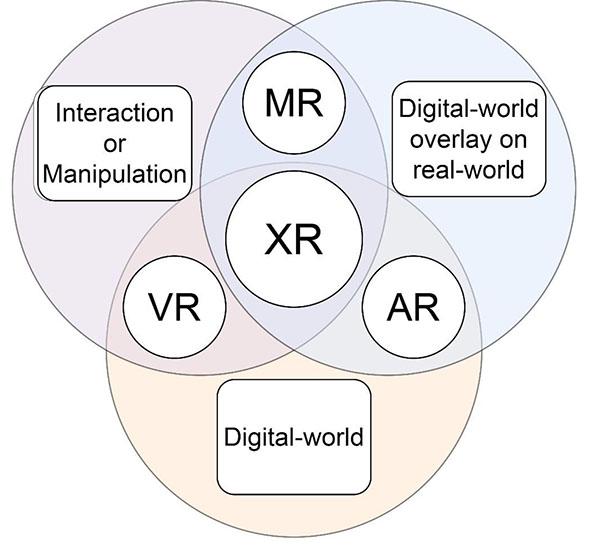
A more simplistic or intuitive interpretation of XR, the RV continuum, and the different XR technologies is provided by Figure 3. In summary, real-to-virtual environments may be understood as a spectrum, where AR or VR are specific regions within the general area of MR. AR combines the physical environment with the digital environment, while VR enables users to control and navigate their movements in a VE, which could simulate an actual physical environment (Zeng and Richardson, 2016). As such, AR and VR may be seen as technologies that produce varying levels of MR and allow users to experience a sense of immersion in a mock environment where physical and digital objects co-exist (Di Serio et al., 2013).
Two tools were applied to determine the status of XR technologies in the South African mining industry. The first was a literature survey regarding XR technologies; the second was the distribution of an online survey questionnaire concerning XR technologies to the South African mining industry, with assistance from the Association of Mine Managers of South Africa (AMMSA) through access to their extensive membership database.
The purpose of the literature survey was to get a clear comprehension of XR technologies with regards to their properties and capabilities. These findings were the precedent for determining the status of XR technologies in the South African mining industry with regards to assessing the levels of awareness, knowledge, and how XR technologies are used in mining. As such, the findings of the literature survey formed the basis of the development of the online survey questionnaire and aided in analysis of the respondents’ descriptions of XR, VR, AR, and MR.
The objective of the online survey questionnaire was to determine the status of XR technologies in the South African mining industry using the following questions:
➤ Do you know about XR/VR/AR/MR?
➤ What is your understanding of XR/VR/AR/MR?
➤ Does your company utilize any XR technologies?
➤ How are XR technologies being used at your company?
The responses to and analysis of these questions provided both quantitative and qualitative results for this study.
The invitation to participate in the study was sent via email to AMMSA’s entire membership database, but recipients were not obligated to participate, so responses to the online survey questionnaire represent a convenience sample: only those invitees who were interested in filling out the online survey questionnaire are included in the results. This means that the results may not be fully representative, but nevertheless provide insight to the research question. The responses to the online survey questionnaire formed the basis of discussion of the results of the study and provide insight to the status of XR technologies in the South African mining industry.
Status of extended reality technologies in South Africa’s mining industry
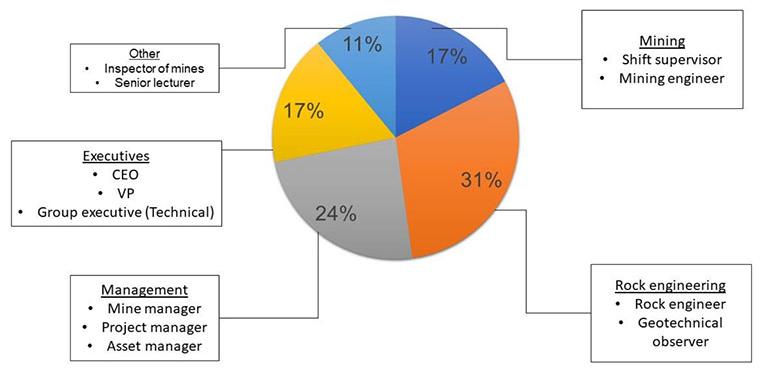
There were 50 respondents to the online survey questionnaire, all of whom were stakeholders in the mining industry: 87% of the sample group comprised individuals with more than eight years’ experience. These participants serve in different capacities in the industry, as illustrated in Figure 4.
Contextual analyses of the responses focused on identifying the following quantitative and qualitative aspects regarding XR technologies in the South African mining industry:
➤ Awareness of XR technologies (VR, AR, and MR);
➤ Knowledge of XR technologies (VR, AR, and MR);
➤ Application of XR technologies in their respective organizations.
Awareness of extended reality technologies
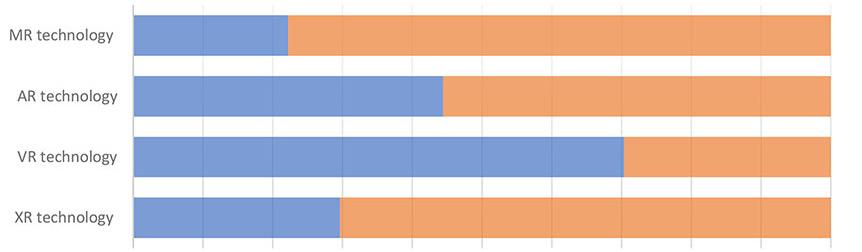
The responses revealed that awareness levels of XR, VR, AR, and MR were 30%, 70%, 44%, and 22%, respectively. Figure 5 summarizes these results. Levels of awareness surrounding XR and MR were lowest. Possible reasons are that these are relatively new terms and technologies compared with VR and AR, which are more mature technologies with several high-level industrial applications, some of which are used in the mining industry.
Knowledge of extended reality technologies
Additionally, from the responses shown in Figure 5, those who said that they were aware of VR, AR, or MR were asked to provide their own description of the respective XR technology or technologies. This was to gain insight into whether personnel in the mining industry had a functional understanding of the different XR technologies. Qualitative analysis – particularly grounded theory (Glaser et al., 1968) – was used to assess their description(s), i.e., their knowledge of XR technologies.
The criteria for assessing these respondent descriptions were the findings of the literature survey. The discretion and disposition of the researcher was core to assessing these descriptions and how closely they fitted the literature definitions of VR, AR, and MR, with particular focus on the keywords and concepts regarding the properties and capabilities of each of the technologies. A ranking system was then used to evaluate the responses as either showing advanced, proficient, approaching, or novice understanding of these concepts.
The descriptions categorized as advanced understanding possessed comprehensive discussions of the key properties and capabilities of the XR technology. The proficient and approaching understanding categories were for those responses that discussed either properties or capabilities of the XR technology, but not both. Responses in the novice category were those with incomplete statements and did not exhibit any distinguishable comprehension
of the properties and/or capabilities of the XR technology being described. Figure 6 provides a graphical summary of the ranking system and classification criteria.
Status of extended reality technologies in South Africa’s mining industry – virtual reality
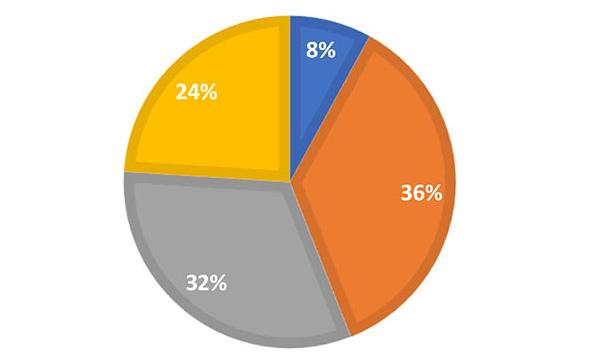
Figure 7 provides a statistical summary of classification of the respondents’ descriptions of VR. Approximately 35% of respondents were categorized as advanced, with comprehensive descriptions of VR that closely corresponded with the literature definition concerning how VR places a user inside a simulation or artificial environment where the space consists only of digital elements or objects. In contrast, 23% and 25% of the responses were considered proficient and approaching understanding, respectively. The main reasons for these classifications were that these responses discussed how VR places a user in a simulation or artificial environment, but did not mention that the environment within the simulation only consists of virtual or digital objects.
Status of extended reality technologies in South Africa’s mining industry – augmented reality
Figure 8 summarizes the corresponding results for descriptions of AR. Here, 24% of the responses were in the advanced category. These responses discussed how AR is the overlay of digital objects or elements over the real world to enhance the user’s view of the real world (i.e., provide additional context to real-world situations). The

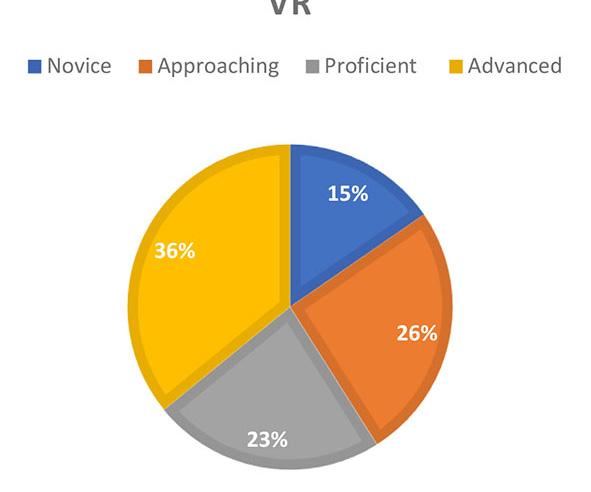
Figure 7—Summary of classification of virtual reality descriptions from responses to the online survey questionnaire
responses classified as proficient and approaching understanding (32% and 36%, respectively) mentioned how AR comprises overlay of digital objects over the physical environment, but did not discuss that the purpose of this overlay is to enhance the view of real world. Some responses discussed how AR enhances the real-world view, but did not mention that this is done through superimposing digital objects onto real objects or the real world.
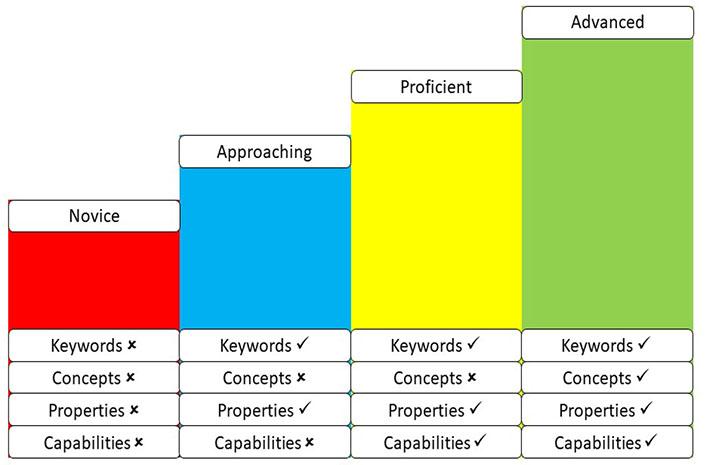
6—Criteria for response ranking system

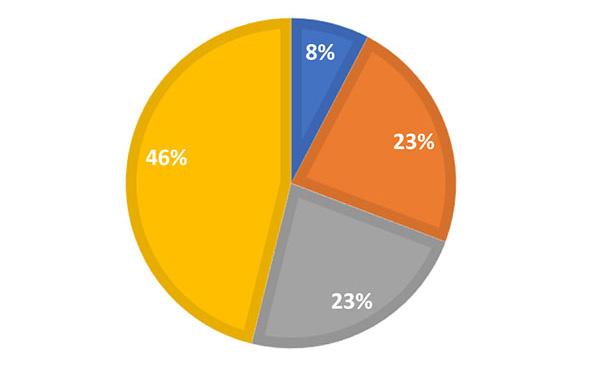
Status of extended reality technologies in South Africa’s mining industry – mixed reality
Figure 9 summarizes classification of the responses regarding the definition of MR. Here, 46% of responses were categorized as advanced. Approximately 23% and 23% of the responses were considered proficient and approaching proficiency, respectively, in that they were correct in indicating that MR involves merging of real and virtual environments, but there was no mention of how MR creates a space for interaction of real and virtual objects within this environment.
Status of extended reality technologies in South Africa’s mining industry – other findings
A more interesting analysis comprised assessing how appropriate the responses were for the particular XR technology being described. Some responses were ambiguous, in that the singular discussion described a range of immersive or XR technologies. The 50 participants of the online survey questionnaire produced 77 descriptions of VR, AR, and MR. Of these, 23 responses were considered unclear, and were more a descriptor of generic XR technology, rather than of a specific XR technology subtype. These 23 responses constituted 29% of the descriptions. This means there is a significant contingent in the South African mining industry who are aware of different XR technologies, but are unclear in their comprehension of the respective properties and capabilities.
The significance of these latter responses is that, as much as South Africa’s mining industry may want to adopt and implement XR technologies, it is more important that there is clarity regarding the desired product or outcome of the XR solution. The importance of this is that if the mining industry approaches service providers of such technologies with unclear directives of the required product – particularly with regards to the properties and capabilities, then there may be a lot of dissatisfaction with the delivered product when the XR solution does not perform its intended function. A knockon effect would be disenchantment surrounding XR technologies and less appreciation of their potential applications for the mining industry. Therefore, it is important that the South African mining industry improves its comprehension of the properties and capabilities of the different XR technologies, so as to have a clearer directive of what it wants to achieve with such solutions. This will ensure that the correct technology – VR, AR, or MR – is chosen for the specific application for which it will be deployed.

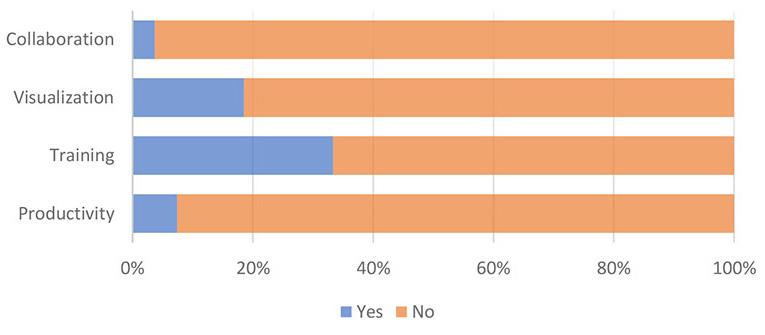
Existing applications of immersive technologies in South Africa’s mining industry
Figure 10 summarizes responses to the online survey questionnaire regarding existing applications of XR technologies in the South African mining industry. The results show that affirmative responses to the use of XR technologies for productivity, training, visualization, and collaboration were 7%, 33%, 19%, and 4%, respectively. Learning and training appear to be the largest use for XR technologies. This result corresponds with discussions from MINCOSA’s technology scouting report (Minerals Council South Africa, 2021).
Assessment of validity of the responses regarding the use of XR technologies for productivity, visualization, and collaboration proved difficult, in the absence of details of the specific hardware and software used by respondents at their respective mining operations/companies. In retrospect, this was a flaw in the compilation of the online survey questionnaire with regards to assessing existing applications of XR technologies in the South African mining industry.
An online survey questionnaire to assess the status and understanding of XR technologies in the South African mining industry was undertaken. Analyses of the 50 responses received revealed the following:
➤ VR and AR have the highest levels of awareness owing to maturity of these technologies and several high-level applications in the industry.
➤ XR and MR have the lowest levels of awareness because these are recent developments in the domain of immersive technologies.
➤ It is concerning that the levels of awareness of AR, MR, and XR are less than 50%, because this means that large portions of immersive technologies remain unexplored by the South African mining industry.
➤ The South African mining industry has inadequate understanding of the properties and capabilities of the different technologies, which represents a problem with regards to their adoption and implementation.
➤ The South African mining is primarily considering VR for learning and training. This corresponds with MINCOSA’s
technology scouting report, which provided an outlook on XR technologies for the industry. This narrow view shows that more must be done to expand the visibility of XR technologies in the mining industry.
➤ By improving levels of awareness of the different XR technologies and knowledge of their respective properties and capabilities, the South African mining industry could further its scope of applications beyond that of learning and training with VR.
➤ A more holistic approach will assist in utilizing XR technologies to realize zero-harm production and assist with modernization of the South African mining industry.
Recommendations
From the discussions and conclusions provided above, the recommendations from this research paper are as follows:
➤ More effort should be applied to informing the South African mining industry about XR technologies and their benefits to ensure that the industry has a more proficient comprehension of their properties and capabilities. This should lead to improvements in the development of XR solutions for the industry and ensure that the correct solutions are developed. In turn, this will improve the level of adoption and implementation of XR technologies by the South African mining industry.
➤ More investment into research and development of XR technology solutions beyond the scope of VR for learning and training purposes is required. This will assist the mining industry to provide real-time solutions to improve optimization strategies and profit margins.
Suggestions for further studies
Based on the discussions emanating from this study, recommendations for further work are as follows:
➤ Identification of suitable XR technology applications from other industries (besides VR for learning and training) that could be easy to pilot for a process in the mining cycle, and assess the impact thereof;
➤ Create a report that informs the mining industry about XR technologies to improve understanding and dispatch current misconceptions of immersive technologies, as apparent from the results of the online questionnaire.
Acknowledgements
SB extends heartfelt thanks to Exxaro for sponsoring the Exxaro Research Chair in Immersive Technologies, a collaboration with the University of Pretoria's Multimedia and Department of Mining Engineering. Their generous support has enabled this research into the state of extended reality technology in the South African mining industry. SB is deeply privileged to be chosen as the recipient of this sponsorship, and appreciates Exxaro's commitment to advancing innovation in the mining sector. Special thanks also go to the University of Pretoria for their collaboration and support throughout this endeavour.
References
Azuma, R., Baillot, Y., Behringer, R., Feiner, S., Julier, S., and MacIntyre, B. 2001. Recent advancements in augmented reality. IEE Computer Graphics and Applications, vol. 21, no. 6 pp. 34–77. doi: 10.1109/38.963459
Azuma, R.T. 1997. A survey of augmented reality. In Presence: Teleoperators and Virtual Environments, vol. 6, no. 4, pp. 355–385. https://www.inf.pucrs.br/pinho/TCG/Docs/ ASurveyOfAugmentedReality.pdf
Belyi, A.M. and Nikitenko, M.S. 2018. Technology of augmented reality applications in dispatching control of industry processes and mining. IOP Conference Series: Earth and Environmental Science, vol. 206, 012044. doi: 10.1088/1755-1315/206/1/012044
Bise, C. J. 1997. Virtual reality: emerging technology for training of miners. Mining Engineering, vol. 49, no. 1, pp. 37–41. https:// www.osti.gov/etdeweb/biblio/463804
Carmigniani, J., Furht, B., Anisetti, M., Ceravolo, P., Damiani, E., and Ivkovic, M. 2011. Augmented reality technologies, systems and applications. Multimedia Tools and Applications, vol. 51, pp. 341–377. doi: 10.1007/s11042-010-0660-6
Denby, B., Schofield, D., McClarnon, D.J., Williams, M., and Walsha, T. 1998. Hazard awareness training for mining situations using virtual reality. International Symposium on Computer Applications in the Minerals Industries. Institution of Mining and Metallurgy, London, pp. 695–705. https://www.osti.gov/ etdeweb/biblio/337713
Di Serio, A., Ibáñez, M., and Delgado-Kloos, C. 2013. Impact of an augmented reality system on students’ motivation for a visual art course. Computers & Education, vol. 68, pp. 586–596. doi: 10.1016/j.compedu.2012.03.002
Dilmegani, C. 2022. Multiexperience (MXDP) platforms in 2022. Technologies & Tools https://research.aimultiple.com/ multiexperience/ (accessed 7.25.22).
Engholm, F. 2020. 3 Reasons your business needs XR technologies now. https://medium.com/@folkeviralaccess/3-reasons-yourbusiness-needs-xr-technologies-now-a349bf2645cd (accessed 7.25.22).
Glaser, B.G., Strauss, A.L., and Strutzel, E. 1968. The discovery of grounded theory; Strategies for qualitative research. Nursing Research, vol. 17, 364 p. doi.org/10.1097/00006199-19680700000014
Gonzalez, C, Navarro, F., Rojas, C., Gonzalez, M., Pardo, S., Comte, D., Carrizo, D., Díaz, M., and Salvo, J. 2016. An immersive 3D geological and mining data visualization environment. MININ 2016 – 6th International Conference on Innovations in Mine, Santiago. https://www.researchgate.net/profile/FelipeNavarro-12/publication/314345630_An_immersive_3D_ geological_and_mining_data_visualization_environment/ links/58c08eff92851c2adfeb26e7/An-immersive-3D-geologicaland-mining-data-visualization-environment.pdf
Hajj, J., Atwi, I., and Raquib, R. 2020. Adopting emerging technologies in a post-COVID-19 world. Strategy & Middle East. https://www.strategyand.pwc.com/m1/en/articles/2020/ adopting-emerging-technologies-in-a-post-covid-world.html (accessed 7.25.22).
Lokesha, V., Banumathi, D., and Bhagya, R. 2020. Progressing with extended reality. Journal of Critical Reviews, vol. 7, no. 8, pp. 1405–1411. https://www.jcreview.com/issue. php?volume=Volume%207%20&issue=Issue-18&year=2020
Marr, B. (n.d.). What is extended reality technology? A simple explanation for anyone. https://www.forbes.com/sites/ bernardmarr/2019/08/12/what-is-extended-reality-technologya-simple-explanation-for-anyone/ (accessed 16.8.22).
Milgram, P. and Kishino, F. 1994. A taxonomy of mixed reality visual displays. https://search.ieice.org/bin/summary. php?id=e77-d_12_1321 (accessed 3.8.2).
Minerals Council South Africa. 2021. Mining Skills 4.0 Technology Scouting Report. Minerals Council of South Africa (MINCOSA).
Montgomerie, S. 2019. How augmented reality is modernizing manufacturing. https://www.scopear.com/how-augmentedreality-is-modernizing-manufacturing/ (accessed 25.7.22).
Nee, A.Y.C., Ong, S.K., Chryssolouris, G., and Mourtzis, D. 2012. Augmented reality applications in design and manufacturing. CIRP Annals, vol. 61, pp. 657–679. doi: 10.1016/j. cirp.2012.05.010
Rabaudo, S., Tinkham, D., and Rudert, F. 2020. VR for remote collaboration. https://www.worldviz.com/post/vr-for-remotecollaboration (accessed 1.8.22).
Rokhsaritalemi, S., Sadeghi-Niaraki, A., and Choi, S.-M. 2020. A review on mixed reality: current trends, challenges and prospects. Applied Sciences, vol. 10, 636 p. doi: 10.3390/ app10020636
Schofield, D., Denby, B., and McClarnon, D. 1995. Computer graphics and virtual reality in the mining industry. International Journal of Rock Mechanics and Mining Sciences & Geomechanics Abstracts, vol. 4, p. 167A.
Squelch, A.P. 2001. Virtual reality for mine safety training in South Africa. Journal of the South African Institute of Mining and Metallurgy, vol. 101, pp. 209–216. doi: 10.10520/ AJA0038223X_2672
Tang, A., Owen, C., Biocca, F., and Mou, W. 2003. Comparative effectiveness of augmented reality in object assembly. Proceedings of the Conference on Human Factors in Computing Systems - CHI ’03, ACM Press, Ft. Lauderdale, Florida, USA, p. 73. doi: 10.1145/642611.642626
Viktoriia, F., Dolina, O., and Shpilkina, T. 2019. Investment risk management at mining enterprises. E3S Web Conference, 105, 01054. doi: 10.1051/e3sconf/201910501054
XR4ALL. (n.d.). https://xr4all.eu (accessed 7.26.22).
Zeng, W. and Richardson, A. 2016. The role of translated information quality in a global e-retailing context. Australasian Conference on Information Systems 2015 doi.org/10.48550/ arXiv.1606.00891u
Affiliation:
1Faculty of Commerce, Law and Management, School of Law, University of the Witwatersrand, Johannesburg, South Africa
Correspondence to: M. Chuma
Email: maxwellchuma@gmail.com
Dates:
Received: 12 Jul. 2021
Revised: 12 Sept. 2022
Accepted: 12 Feb. 2024
Published: June 2024
How to cite:
Chuma, M., Field, T.-L., and Mutemeri, N. 2024. A conceptual framework for reframing artisanal and small-scale mining: understanding characterization of artisanal and small-scale mining in South Africa. Journal of the Southern African Institute of Mining and Metallurgy, vol. 124, no. 6. pp. 311–318
DOI ID:
http://dx.doi.org/10.17159/24119717/1614/2024
ORCID:
M. Chuma
http://orcid.org/0000-0001-9100-0839
T.-L. Field
http://orcid.org/0000-0003-2925-9449
N. Mutemeri
http://orcid.org/0000-0002-7030-2114
by M. Chuma1*, T.-L. Field1, and N. Mutemeri1
*Paper written on project work carried out in partial fulfilment of Doctor Philosophy (School of Law) degree
Abstract
The categorization of artisanal and small-scale mining has a significant impact on perception and understanding of the sector, particularly from a livelihood perspective. Several developing countries classify different types of artisanal and small-scale mining based on legal status. Given the nature such activities, the tragedy of the commons theory has been applied to understand the inevitable environmental, economic, sociocultural, safety, and health negative externalities – which are products of informality and illegality. Consequently, formalization is a panacea to sustainability. This article aims to offer a conceptual organization and foundational knowledge for characterization of artisanal and small-scale mining. It seeks to identify existing literature on the subject to avoid replication and acknowledge other scholars. Moreover, the article aims to place the study within the context of existing literature, establishing relationships with other studies and why the research is necessary. This paper pinpoints gaps left from other studies in so far as the characterization of artisanal and small-scale mining is concerned. Thus, reviewing literature abetted in finding similarities and differences on how artisanal and small-scale mining is defined from a scholarly and legal basis. The paper ascertains major claims made by earlier research on this topic, such as environmental impacts, the lack of adequate regulatory framework, and presents querying and probing questions lacking from other studies.
Keywords
scholarly definition, legal definition, legal status, negative narratives, tragedy of the commons
Introduction
Artisanal and small-scale mining (ASM) is defined as subsistence-type mining conducted by individuals or groups of people, often characterized by informality and illegality.
ASM has experienced growth in past years due to the escalating value of mineral prices and rising challenges resulting from loss of income (IGF, 2017). It is estimated that over 40 million people, particularly in developing countries, are directly involved in ASM (World Bank, 2019). This paper presents dominant characterizations of ASM, drawing on scholarly, advocacy, and legal sources. Characterization also includes a focus on negative environmental and socioeconomic externalities of ASM, drawing on theory of the tragedy of the commons. As the discussion shows, the meaning given to ASM is multi-dimensional and country-specific. Nevertheless, it is important to derive a core understanding of ASM to reflect the South African context and provide a common understanding of terms to inform ASM interventions towards the management of challenges and opportunities presented by the sector.
Quite different definitions of ASM exist in scholarly and advocacy literature. The Mining and Sustainable Development report entitled Breaking New Ground (2002, p. 348) characterizes ASM as operations that ‘exploit marginal or small deposits, lack capital, are labour intensive, have poor access to markets and support services, low standards of health and safety and a significant impact on the environment’. Hentschel et al. (2002 p. 18) add that ASM is ‘mining by individuals, groups, families or cooperatives with minimal or no mechanization, often in the informal (illegal) sector of the market’. Hinton and Hollestelle (2012, p. 5) highlight the survivalist and subsistence character of ASM as an undertaking ordinarily conducted on a subsistence basis by individuals or small groups with simple tools. Goreux (2001, p. 10) contends that ASM is mainly ‘a poverty driven activity, typically practiced in the poorest and most remote areas of
a country by a largely itinerant, poorly educated populace with little other employment alternatives’. Dreschler’s (2001) definition captures most themes of the apparent dominant scholarly discourse on ASM (informality, poverty, subsistence, labour intensity, low levels of capital investment, and detrimental social, health, and environmental impacts). Ledwaba and Nhlengetwa (2016, p. 27) maintain that:
‘ASM mining operations are unregulated; they range from activities conducted by individuals to junior operations; the majority of activities are poverty-driven, with a few business orientated; they can be permanent or seasonal in nature; they are technologically backwards using very little, if any,
Table I
Definitions of artisanal and small-scale mining by country
Country Criteria
mechanization; the sub-sector is informal and carried out illegally; it is mainly unauthorized and undercapitalized; and it is known for the low standards of health, safety and environment.’
These themes are echoed and expanded upon in legal definitions of ASM from the mining laws of many jurisdictions where ASM takes place, including South Africa. As Table I and the discussion below show, the most common factors used to define ASM include the level of capital investment, level of technology, type of mineral, level of production, and the size and depth of mining. A contrast between scholarly and legal definitions indicates that the former refer more frequently to poverty, informality or survival, and
Algeria The Algeria Mining Code (2014) makes provision for an artisanal licence, which is issued for mining exploitation for a period of five years.
Burkina Faso The Burkina Faso Mining Code (2015, a.5) states that artisanal mining (AM) includes ‘all of the operations which consist in extracting and concentrating mineral substances such as gold, diamonds and other gems, coming from primary and secondary outcrops or outcropping and recovering the products merchants using manual and traditional methods and procedures’. Use of mercury, cyanide, and child labour is prohibited. The AM licence holder is mandated to enter into an agreement with landowners. They must compensate the landowner in the case of destroying cultivated fields.
Chad The law defines AM as ‘exploitation using manual or traditional methods and procedures or both at the same time, and which is not based on the prior identification of a deposit or a deposit’ (Chad Mining Code 2018, s .1). The terms AM and small-scale mining (SSM) are used in combination. The same licence is valid for both. AM is legally restricted to alluvial deposits and alluvial mining.
Colombia Colombian Mining Law (2013, d. 933) ‘limits the size of ASM concessions to 150 ha for individuals and 500 ha for groups or associations of traditional miners, and only one concession each’. Communities undertake ASM activities on demarcated land as a livelihood. The law limits ASM activities to the aerial extent determined by the concession agreement.
Cote d’Ivoire Cote d’Ivoire Mining Code (2014, a. 68) defines AM as undertaking of the extraction and concentration of mineral substances and recovery of marketable products using manual and traditional methods that do not use chemicals or explosives.
Democratic AM is a level of mining undertaken by citizens in a specific designated area. An Exploration Card is issued to permit AM activities Republic of to be undertaken (DRC Mining Code, 2018). AM is permitted on an aerial extent determined by the Provincial Head of Mining, Congo (DRC) for not more than one year and at a depth of up to 30 m.
Ecuador The Mining Law of Ecuador (2009) defines AM as ‘mining activities carried out by an individual, a family or an association characterized by the use of hand tools and simple and portable machines to obtain minerals, the sale of which covers only the basic needs of the person or family involved and does not require an investment of more than 150 basic unified salaries (US $39,600)’. Permit holders can possess one permit for 10 years for a determined location, renewable for equal periods.
Ethiopia Ethiopia Mining Operations Proclamation (2013) indicates that AM is manual in nature, with an anticipated annual production, and does not involve the engagement of employed workers. AM is considered a subsistence activity.
Ghana A licence for SSM is issued upon submission by Ghanaians of a capital investment of not less than USD 100,000, including an indication of the number of participants (Ghana Minerals and Mining Act 2006, s. 82). The licence covers all ASM activities and licence holders can mine any area licenced for a period of not more than five years. SSM operations are permissible on an aerial extent of 21 ha. The licence can be transferable and leased. The activity is linked to citizenship, investment, the number of participants, area, and time.
Guinea The Guinea Mining Code (2006) defines artisanal operations as ‘means an activity which consists of small-scale operation using traditional or no mechanized methods’. Artisanal operations refer to precious metals, such as gold and diamonds. Artisanal operations are permissible to persons of Guinean nationality. Artisanal operation permits limit the depths to 30 m and 15 m in cases of operation by lifters and digging, respectively (Guinea Mining Code 2006, a. 93). Areas reserved for artisanal operations and the perimeter thereof are designated by the responsible Minister.
Kenya The Kenya Mining Act (2016) defines AM as ‘traditional and customary mining operations using traditional or customary ways’. The Act defines four permits for the ASM sector to determine duration, area or size, mechanization, and investment level. These four permits are for AM, small-scale reconnaissance, small-scale prospecting, and SSM.
Mali An AM licence is issued to Malian citizens based on capital investment, mechanization, and depth of mining (Mali Mining Code 2012).
Table I
Definitions of artisanal and small-scale mining by country (continued)
Country Criteria
Philippines AM is based on the type of mineral mined. For example, a guano extraction permit is issued for 5 ha for one year (renewable); gemstone and gold panning and sluicing permit 0.2 ha for three months (renewable) (Philippines Mining Act 1995).
Rwanda The SSM licence makes provision for ASM activities but does not make mention of the term ASM. ASM operations can be undertaken within 50 ha of any licenced area for a duration not exceeding 15 years. The mining licence is not restricted to nationals and the holder can relinquish part of the mining area (Rwanda Law on Mining and Quarry Operations 2018).
Senegal Article 39 of the Senegal Mining Code of 2003 states that the permission for artisanal activities of extracting minerals using manual and traditional methods is within an aerial extent of 5 km2 and a depth of 15 m (Senegal Mines and Mineral Development 2015, s. 29(3)).
Sierra Leone The Sierra Leone Mines and Minerals Act (2008) restricts AM to nationals only. AM licences are issued for areas only in specific designated areas for a period of one year, renewable three times, on an area of 0.5 ha and depth of 10 m.
South Africa The mining permit makes provision for ASM activities, though it does not mention the term ASM. ASM operations can be undertaken within 5 ha in any licenced area for a duration of two years, renewable three times (Mineral and Petroleum Resources Development Act 2002, s.27). The mining permit is not restricted to nationals but cannot be transferred or leased.
Tanzania SSM is indirectly defined in the Mining Act of 2010 as a type of operation for which capital investment, including labour and technology, is less than USD 100,000; this entitles one to acquire a Primary Mining Licence (PML), which is valid for a period of seven years and renewable three times. It covers all ASM activities.
Uganda The Uganda Mining Act (2003) defines a licence for ASM activities by a Ugandan citizen with no use of specialized technology or expenditure more than USD 3,000. The licence is issued for a period of two years and can be upgraded and transferred. Licence holders have the right to prospect, mine, and trade. The mining area depends on the type of deposit; for example, the mining area for precious stones is 500 m × 300 m.
Zambia The Zambia Mines and Mineral Development Act (2015, s.29 (3)) defines AM based on the ‘area of land (size of the concession) over which an application for a licence is lodged will be a minimum of one cadaster unit.’ It is also based on technical and financial capacity.
subsistence, while legal definitions highlight the mining method, level of investment, area, depth, and duration: subsistence and poverty are almost never mentioned. Both scholarly and legal definitions suggest that ASM is a less-sophisticated livelihood.
The most common ways of characterizing ASM within the legal perspective are requirements such as the mining method, level of investment, area, depth, and duration. Legal sources characterize ASM according to rights, responsibilities, and obligations. Characterizing ASM by citizenship is common in countries such as Ghana, Uganda, and Mali, where ASM activities are reserved for citizens. In South Africa, the perception is that ASM is largely conducted by foreign migrants.
Most ASM activities are not allowed to operate with high capital investment or mechanization. Countries that have adopted the concept of limited capital investment include Uganda (USD 3,000) and Ecuador (USD 39,600). Use of mechanized equipment is restricted in Ghana. Countries such as Ecuador, Colombia, and Chad characterize ASM as an activity that uses traditional methods; however, use of traditional and/or manual tools may limit production levels and hinder development.
DRC and Tanzania have established zones for ASM exploitation and exploration. Relevant district or provincial mining offices must demarcate areas for artisanal operations. Countries such as Sierra Leone, Senegal, Rwanda, and Colombia characterize ASM based on the size of the mining area. Of these countries, Sierra Leone has the smallest size of 0.5 ha, while Colombia limits an individual concession to 150 ha. Several benefits are associated with this categorization concerning job creation for locals and development of local businesses (Bugnosen, 2003). For this reason, aerial size
grants miners the ability to estimate the amount of investment needed, such as for infrastructure and labour.
The zoning approach used in DRC and Tanzania removes the need for application and processing procedures. It generally occurs in the form of a pronouncement or provisions incorporated into the relevant mining legislation to accommodate specific groups, particularly indigenous members of the community. Landowners in Papua New Guinea are allowed to extract gold from their lands without formal licensing, provided that only panning or other primitive methods are used (Bugnosen, 2003). The principle of free digging is embraced by countries such as Zambia, Uganda, and Philippines to legalize extraction of minerals by landowners or any lawful occupier (Bugnosen, 2003).
This demarcation system provides mining rights over a certain vertical extent or depth of a mineral deposit or given area. Countries that have adopted this concept include Ethiopia, Indonesia, and Papua New Guinea. The depths set by Ethiopia and Philippines, for instance, are 15 m and 50 m, respectively.
There are extremes in the legal definitions concerning time periods of licence validity. Philippines has the shortest time of three months; Tanzania provides the longest time for an ASM licence of seven years. Most countries permit ASM operation for periods between one and five years. These data show that, although there may be consensus on certain key themes in ASM, there is no consensus on the specifications considered when characterizing the activity.
Several mining laws distinguish between artisanal mining (AM) and small-scale mining (SSM). Countries such as Sierra Leone, DRC, Guinea, and Mali have a separate artisanal licence category.
This distinction allows different levels and needs of mining to be appropriately regulated. Countries such as Tanzania, Ghana, and South Africa (mining permit) have a single licence category for the entire range of operations, from AM to SSM. For example, the Mineral and Petroleum Resources Development Act (MPRDA) does not clearly state that a mining permit is for SSM; however, an assumption is created that a mining permit is for this activity because the mineral in question can be optimally mined within two years on an area not exceeding 5 ha.
There are wide-ranging positions on the actors, technologies, practices, and established capital provisions that distinguish SSM from ASM in scholarly literature. Barney (2018, p. 367) practically differentiated three broad groups in ASM: ‘a) micro-scale, informal, artisanal; b) small-scale, illegal, semi-mechanized; and c) mediumscale, illegal, mechanized’. Barney pointed out that; ‘globally, the micro artisanal part of ASM encompasses comparatively independent miners working marginally productive gold tracts, experiencing high levels of vulnerability and holding subordinate livelihood positions, but who also find support through non-market access to gold and other market or subsistence-based ecological resources’.
Specific minerals, such as gold, diamonds, and gemstones, are separately licenced by some countries and are the most common minerals targeted for small-scale licensing. In Guinea, Philippines, and Mongolia, ASM licences are issued within a specific category, such as strategic (including precious metals, gemstones, oil, and coal) and specific (ores and some non-metallic minerals) resources.
The informality and illegality of ASM are highlighted in the scholarly definitions, but only implicit in the legal definitions. ASM is formal when the needs of actors in the sector are fully catered for. Formalization entails that the activity is legal, viable, safe, and environmentally responsible (Mutemeri et al., 2016). If the activity is informal within a legal context, a transition from informal to formality is possible where the regulatory framework is supportive, such as in DRC and Sierra Leone. Sustainable livelihoods are then achieved and enhanced through supportive structures, such as access to markets, financial support, and education and training, especially in environmental management, health, and safety.
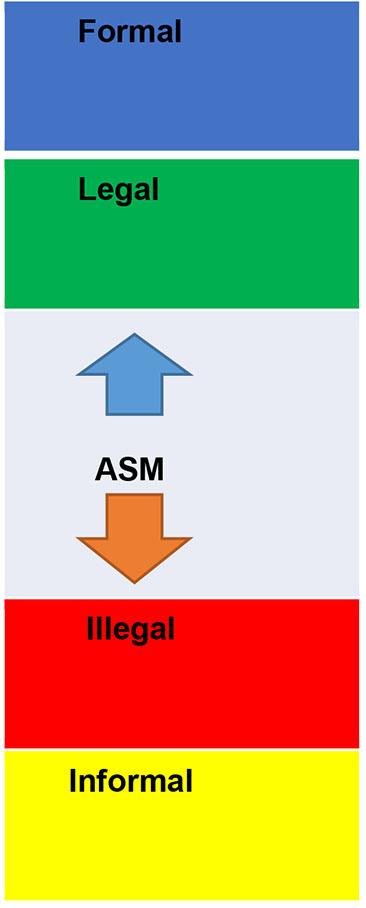
None of the legal definitions highlight the lack of these features as characteristic of ASM. Illegal ASM operates outside of the law, informally, and, in some instances, criminally. Within the South African context, ASM is mostly conducted under precarious conditions in disused mines. Ledwaba and Mutemeri (2017, p.18) comment on informal ASM as ‘illegal, but that it is tolerated because of legitimacy inferred by socioeconomic and political imperatives’. This can be seen when the local or traditional authorities who own the land permit the activity to be undertaken as a livelihood for the poor. Figure 1 illustrates the relationship between types of ASM based on legal status.
The categories of formal/informal and legal/illegal can be used as the basis for a typology of ASM:
➤
➤
Formal/legal: In some jurisdictions, ASM is formal (access to markets, financial support, education and training, payment of taxes, responsible environmental, health, and safety conduct) and legal (in compliance with a specific regulatory framework). This, for example, is the case in Tanzania.
Informal/illegal: South Africa is an example where most ASM activity is both informal and illegal, not supported, conducted outside of the law, and criminalized. There is normally a high degree of irresponsibility because the miners are not registered and therefore not accountable.
➤ Informal/legal: In countries such as Ecuador, Ghana, and Peru, formality is only de jure and not de facto. This is linked with failure to enforce the legal requirements.
➤ Formal/illegal: In certain jurisdictions, such as in Ghana and Philippines, ASM may receive some formal support (possibly through traditional structures) yet operate outside a formal regulatory frame.
The overwhelming categorization of ASM in scholarly literature is that it is an informal and illegal economic activity. The characterization of ASM as illegal persists, because the activities violate the mining permit requirements, health and safety duties, and other mining-related laws. However, the illegality of ASM may be exacerbated by inadequate legal provisions, rather than obvious criminal intent on the part of those undertaking the work (Legal Resource Centre, 2016).
The characterization of ASM can be further enriched by elaborating on negative externalities associated with the sector, a typology of which is presented in Table II.
First, ASM triggers a variety of environment-related impacts. Gunson and Jian (2001) argue that mined land is changed, reducing its utility for other purposes, such as farming. Significant landscape destruction results from operation of AM because the open pits often cause death of both humans and animals, particularly when filled with water. They also serve as breeding grounds for mosquitoes. AM activities may disturb the water table, geological stability, and surrounding ecosystems. Lombe (2003, p. 96) argued that ‘activities such as gold panning along rivers may alter riverbeds and cause siltation which would affect the river flow’. For instance, gold panning on the Zambezi River’s riverbeds in Southern Africa causes heavy siltation, making the river shallower each year. In addition, heavy metals and chemicals like mercury and cyanide also end up in water bodies, causing serious damage to both aquatic life forms and humans (Lombe, 2003). Environmental degradation is the most visible of the negative impacts associated with AM. It may also be difficult to manage environmental impacts, given that the practice is elusive and illegal.
Table II
Negative externalities of artisanal and small-scale mining (adapted from Zvarivadza, 2018)
Environmental Safety and health
Pollution of water sources
Land degradation
Mercury and cyanide pollution
Soil erosion
Dust pollution
Waste, including faecal matter
Spread of diseases
Lack of protective clothing
Poor lighting
Exposure to dust and toxic gases
Unsafe working tools
Poorly supported working conditions
Second, socio-cultural disturbances are an effect of ASM. Several problems arise as a result of the discovery of mineral deposits. For instance, one might submit that migration related to ASM attracts people from diverse socio-cultural backgrounds and with different sets of cultural beliefs and norms. With a reputation for rapid wealth generation, ASM also attracts unlawful and immoral activities like money laundering, substance abuse, theft, and prostitution (Dreschler, 2001). Gyan-Baffour (2003, p. 4) adds that ‘because of breakdown in law and order in most of these mining areas those who have some savings tend to spend most of their savings on alcohol, prostitution, and gambling at the expense of productive investment’. Thus, high rates of prostitution, crime, and sexually transmitted diseases, like HIV/AIDS, have been reported in mining communities (Fisher, 2008). The decay in sociocultural values and increase in criminality in mining areas require clear policy guidelines and administration of AM activities to avert serious negative consequences that may result.
Third, the status of occupational health and safety (OHS) in AM is deplorable. The Intergovernmental Forum on Mining, Minerals, Metals and Sustainable Development (IGF) (2017, p. 22) states that ‘most OHS risks in sub-Saharan Africa (SSA) are borne by women, due to the division of tasks between male and female miners’. Mine accidents range from rock falls, mine cave-ins, to flooding; health hazards include mercury poisoning and silicosis (Hentschel et al., 2002). A study conducted in Tanzania by the World Bank Group (2015) on mercury levels in the breast milk of mothers living at ASM sites found that 22 of the 46 children from these mothers had high levels exceeding the World Health Organization (WHO) limit for public exposure of 1.0 μg/m3. Accidents arise from the absence of knowledge about mining, poor education, and ignorance of risks and dangers. ASM miners also lack guidance on the usage and handling of explosives and deadly chemicals like mercury and cyanide (Hentschel et al., 2002). As a result, they tend to misuse chemicals and explosives, thereby exposing themselves and their communities to many dangers. Another major hazard on ASM sites is poor sanitation: the transitory nature of AM discourages building of sanitation facilities, leading to widespread occurrence of contagious waterborne illnesses like bilharzia and diarrhea (Fisher, 2008).
OHS is not given much priority in AM. Unless operators have formerly worked in large mining companies, artisanal miners are ignorant of the associated risks (MMSD Project Report, 2002); thus, they do not take safety measures like wearing helmets and safety shoes. In addition, the conditions in which they work are appalling, exacerbating the potential for accidents and disease outbreaks. Labour standards are also poor. Yakovleva (2007, p. 36) argued that
Social Economic
Substance abuse
Child labour
Prostitution
Conflicts (turf wars)
Destruction of cultural values and sites
Gender discrimination
Corruption
Mineral-rush effect
Lack of planning
Lack of education
Money laundering
Hindrance to economic growth
working conditions, especially wages, are not standardized. She cites the example of women who are generally paid less than their male colleagues. Although women are not involved in heavy duties like digging, their wages are not equal to the amount of work they do; however, because of high levels of poverty, numerous people are forced to work in these hazardous conditions for very minimal incomes to enable their survival.
Use of hazardous substances puts the health of miners at risk. Artisanal miners and their communities are exposed to mercury, zinc vapour, cyanide, and other acids (Obiri et al., 2010). Mercury is frequently deployed in artisanal gold mining and cyanide use is growing. Mercury can be inhaled, swallowed, or absorbed through the skin, but the health consequences are usually not immediate (Agency for Toxic Substances and Disease Registry, 2024). Inhaling dust and fine particles from blasting and drilling processes can cause respiratory diseases, such as silicosis or pneumoconiosis in adults, and in children who often accompany their parents (Vanka et al., 2022). The Minamata Convention, a legally binding instrument, was initiated in 2013 by the United Nations Environment Programme to reduce trade, supply, and use of mercury and to promote mercury-free technologies in ASM (Minamata Convention on Mercury, 2013). The convention identified ASM as one of the largest anthropogenic sources of mercury pollution, with some 1400 t/a emitted (IGF, 2017). According to the United Nations Environment (2017, p. 27), 51 countries have ratified and 120 have shown interest in signing this convention. Practical efforts to control and reduce the use of mercury include the establishment of National Action Plans in all countries where ASM is undertaken. However, Spiegel (2018, p. 2) criticized the Minamata Convention in that it fails to consider the socioeconomic context of mining sites where power relations of different stakeholders influence the trade and use of mercury.
Although many countries, having endorsed International Labour Organisation (ILO) Convention 182, have abolished the worst forms of child labour, this practice seems to be the norm in many countries where artisanal mining takes place (Hentschel et al., 2002). A huge number of children are involved in ASM in SSA and in other developing countries (Bodenheimer, 2014). Although the exact number is not known, it is estimated that more than two million children worldwide are directly and indirectly involved in mining (ILO, 2004). The poverty associated with AM means that every family member, including children, must participate for survival. It has been observed that each member has a role in the AM family (Lungu, 2007). Lack of money to send children to school and the dearth of nearby schools are some of the claims that parents put forward to explain the involvement of their children
in mining (Hentschel et al., 2002); however, one can argue that the participation of minors in AM places them in hazardous working environments and leads to neglect of their education.
The Global Report on Artisanal and Small-Scale Mining held that children as young as three were being used in ASM (Hentschel et al., 2002). The participation of minors in ASM exposes them to severe and hazardous working conditions, and creates risks to their health (ILO, 2004). Moreover, children may be deprived of their right to education, thus denying them a future, with no employment choices other than following the ways of their forefathers in AM. As a result, formalizing AM would enable an environment that allows for better living and working conditions, comprises decent wages, and eradicates improper work practices. Miners will be obligated to observe and highly regard OHS standards, which would also ensure that just and fair working conditions are put in place and that child labour is eliminated.
Economic negative externalities associated with ASM can be disastrous for individuals, and the community at large, because the activity is primarily informal and illegal. Hence, Zvarivadza (2018, p. 3) states that the sector is difficult to regulate or implement approaches to manage socioeconomic challenges. Irresponsible exploitation of minerals may inevitably result in economic disasters, such as corruption, the tragedy of the commons, shortsighted planning, and lack of collateral security (Buxton, 2013). Thus, the economic implications of ASM can result in localized inflation, destruction of infrastructure, exploitation of labour, discrimination, failure to adapt to technology, and xenophobia due to increase in-migration of people. However, ASM can play an important role in economic growth if governments can absorb this sector as a mainstream activity (Zvarivadza, 2018).
Tragedy of the Commons Theory
A commonly applied theory to the kinds of negative environmental, social, and economic problems outlined above is the tragedy of the commons, popularized by Garrett Hardin (1968) in his seminal essay. The commons is a ‘natural resource shared by many individuals’ (Hardin, 1968). Governance tools to deal with the tragedy of the commons are relevant to a discussion of the formalization of ASM. In this section, we briefly discuss how the tragedy of the commons applies to the negative externalities of ASM.
In ‘The tragedy of the commons’, Hardin pronounced on the fate of a common pasture that was unowned and available to all. Adler (2012, p. 4) pointed out that, in such situations, ‘it is each herder’s self-regard to maximize his use of the commons at the expense of the community at large.’ Assuming logical self-centered pastoralists, Hardin (1968) concluded that each herder would add as many animals as possible to his herd, with the unavoidable result of overgrazing and devastation of the common pasture. Yet the costs of overgrazing the pasture are distributed amongst every user. When all herders respond to these incentives, the pasture is over-grazed and destroyed; hence, the tragedy.
Elinor Ostrom (1992) tackled the governance of commonpool resources in her work, Governing the Commons. She realized that governance of common-pool resources must overcome two obstacles; namely, excludability, which entails that it is difficult to exclude others using or depleting the same resource; and subtractability, which is the tendency for one person’s use to subtract from the value of the common-pool resource (Ostrom, 1992).
ASM involves the extraction of common-pool resources: the environmental resources include land, water, and air, and the
mineral in the ground that has been rendered a common-pool resource by previous formal mining (Saldarriaga Isaza, 2013). ASM may or may not take place under a regulatory framework. If the undertaking is illegal, or if regulations are weakly enforced, the resource is open access and almost any person can dig up the value. Saldarriaga Isaza (2013) point out that when the action is lawful, ‘the mere fact that a miner holds a licence to exploit the resource does not necessarily imply a complete exclusion of other potential miners’. However, a common-pool resource in ASM is normally dependent on social prearrangement amongst operators; in this case, between legitimate and illegitimate miners and between unlawful miners and local authorities (Department of Mineral Resources, 2016).
Hardin (1968) submitted that greater dependence on property rights could avert the tragedy of the commons. As Adler (2012, p. 3) explains, ‘where property rights are well-defined and secure, the tragedy of the commons is less likely since each owner has ample incentive to act as a steward.’ Owners want to preserve essential resources and prevent overuse, both for themselves and for others who value the underlying resource. Adler (2012, p. 2) argues that what Hardin labelled the “common” is more accurately described as an open-access common. He points out that ‘some resources that are owned or managed in common…do not suffer the tragedy of the commons because of community management of some form or another’. Multiple-rights regimes may also be present for the same object; for example, where the state owned the private-property rights to land, then gave demarcated parcels of land to different communities as common property (Challen, 2000). Four general classifications of management regimes are therefore explained in the literature on common-pool resource management: state property, private property, common property, and nonproperty or open access (Campbell et al., 2001) Hardin was further criticized for his assumption of a selfish motive on the part of users of the commons (Ostrom and Hess, 2000).
Ostrom (1992, p. 416) mentions that individuals in proximity could manage common and shared resources; thus, users have the capability to create institutions to manage and govern their own resources. She also identified that self-governance and selforganization could be enhanced by new sets of rules for collective problems (Ostrom, 1992). This assertion has been reinforced by field research conducted in Nepal, Indonesia, Kenya, and Maine (USA) on the management of common-pool resources (Ostrom and Hess 2000, p. 342). Hoadley and Limpitlaw (2004, p. 4) argued that ASM miners have the capacity to create sets of rules and self-govern because formal and informal co-operatives and associations that have internal self-regulation already exist.
Lack of specific and effective legislation and rules for ASM to govern property regimes for the open-access resources that ASM miners use facilitates unsustainability in the sector. Effective legislation should promote institutions that help communities utilize their social capital to build livelihood assets. This conviction is in line with the argument of Davies (1997) that ‘institutions are the social cement which link stakeholders to access to capitals of different kinds, to means of exercising power and so define the gateways through which they pass on the route to positive livelihood adaptation’.
Conclusion
Characterization of ASM identifies that the legal definitions differ from country to country; however, scholarly definitions have established that the activity is poverty-driven, conducted by
individuals, family, or groups of people using traditional or manual tools. The ASM sector is based on different legal statuses: formal, informal, legal, or illegal. The reviewed literature confirms that negative impacts of ASM that have been exacerbated by illegality due to inadequate and inappropriate regulatory frameworks, result in the tragedy of the commons, causing excludability and subtractability. The article highlights that most ASM undertakings, especially in Sub-Saharan Africa, are informal and illegal due to several challenges. The sector is marred by myriad negative environmental, social, and economic externalities, such as accidents, pollution, social ills, and corruption. Suitable formalization and regulatory frameworks could be a viable intervention to the respective challenges bedeviling ASM sustainability.
Acknowledgements
The authors gratefully acknowledge the support of the University of the Witwatersrand.
References
Adler, J.H. 2012. Property rights and the tragedy of the commons. The Atlantic, May, p. 22.
Agency for Toxic Substances and Disease Registry, 2024. https://www.atsdr.cdc.gov/mhmi/mmg46.pdf [accessed 03 June 2024].
Algeria Mining Code 2014, a. 108. http//www.a-mla.org [accessed 21 May 2020].
Armah, F.A., Boamah, S.A., Quansah, R., Obiri, S., and Luginaah, I., 2016. Working conditions of male and female artisanal and small-scale goldminers in Ghana: Examining existing disparities. The Extractive Industries and Society, vol. 3, no. 2, pp. 464–474.
Guinea Mining Code of 2006, Article 93, a. 93. http//www.a-mla.org [accessed 21 May 2020].
Artisanal Gold Council. 2017. What we do: Artisanal Gold Council, Victoria, Canada.
Artisanal Mining Report. 2016. Legal Resource Centre, Johannesburg.
Aryee, B.N., Ntibery, B.K., and Atorkui, E. 2003. Trends in the small-scale mining of precious minerals in Ghana: a perspective on its environmental impact. Journal of Cleaner Production, vol. 11, no. 2, pp.131–140.
Aubynn, A. 2009. Sustainable solution or a marriage of inconvenience? The coexistence of large-scale mining and artisanal and small-scale mining on the Abosso Goldfields concession in Western Ghana. Resources Policy, vol. 34, no. 1–2, pp. 64–70.
Barney, K. 2018. Reassembling informal gold-mining for development and sustainability? Opportunities and limits to formalisation in India, Indonesia and Laos. Between the Plough and the Pick: Informal Mining in the Contemporary World. The Australian National University E-Press, Canberra, Australia, pp. 335–369.
Bodenheimer, M. 2014. Certifying improvement, improving certification: An analysis based on the artisanal and small-scale mining sector, No. S9/2014). Working Paper Sustainability and Innovation, Fraunhofer Society, Munich, Germany, pp. 1–108.
Bugnosen, E. 2003. Small-scale mining legislation: a general review and an attempt to apply lessons learned. The Social Economic Impacts of Artisanal and Small-Scale Mining in Developing Countries, Hilson, G.M. (ed.), CRC Press, London. doi.org/10.1201/9780203971284
Burkina Faso Mining Code 2015, a. 5. http//www.a-mla.org [accessed 21 May 2020].
Buxton, A. 2013. Responding to the challenge of artisanal and small-scale mining. How can knowledge networks help? International Institute for Environment and Development (IIED), London, United Kingdom, Campbell, B., Mandondo, A., Nemarundwe, N., Sithole, B., De Jong, W., Luckert, M., and Matose, F. 2001. Challenges to proponents of common property resource systems: Despairing voices from the social forests of Zimbabwe. World Development, vol. 29, no. 4, pp. 589–600.
Chad Mining Code 2018. http//www.a-mla.org [accessed 21 May 2020].
Challen, R. 2000. Institutions, Transaction Costs, and Environmental Policy: Institutional Reform for Water Resources. Edward Elgar Publishing, Perth, Australia.
Colombia Mining Law 2013, d. 933. http//www.a-mla.org [accessed 21 May 2020].
Cote D’Ivoire Mining Code 2014, a. 68. http//www.a-mla.org [accessed 21 May 2020].
Davies, S. 1997. Livelihood adaptation. Paper for workshop ‘Making Livelihoods Work–Women, Men and Children in Rajasthan'. Institute of Development Studies, Brighton, UK. Department of Mineral Resources of South Africa. 2016. https://www.dmr.gov.za/ [accessed 03 June 2024].
DRC Mining Code 2002. http//www.a-mla.org [accessed 21 May 2020].
DRC Mining Code 2018. http//www.a-mla.org [accessed 21 May 2020].
Dreschler, B. 2001. Small-scale mining and sustainable development within the SADC region. Mining, Minerals and Sustainable Development, vol. 84, pp. 1–165.
Ethiopia Mining Operations Proclamation 2013. http//www.a-mla.org [accessed 21 May 2020].
Fisher, E. 2008. Artisanal gold mining at the margins of mineral resource governance: a case from Tanzania. Development Southern Africa, vol. 25, no. 2, pp. 199–213.
Ghana Minerals and Mining Act 2006, s. 82. http//www.a-mla.org [accessed 21 May 2020].
Goreux, L. 2001. Conflict diamonds: Africa region, Working Paper Series Number 13. World Bank, Africa Region. https:// documents1.worldbank.org/curated/en/216551468741661999/ pdf/multi0page.pdf [accessed 03 June 2024].
Ground, B.N. 2002. The Report of the MMSD Project. Earthscan Publication Ltd, London.
Guinea Mining Code 2006. http//www.a-mla.org [accessed 21 May 2020].
Gunson, A.J. and Jian, Y. 2001. Artisanal mining in the People’s Republic of China. International Institute of Environment and Development, Draft Report, London, England.
Gyan-Baffour, G. 2003. Artisanal mining and poverty. Communities and Small-Scale Mining. Third Annual General Meeting and Learning Event, Elmina, Ghana, pp. 1–5.
Hardin, G. 1968. The tragedy of the commons. Science, vol. 162, no. 3859, pp. 1243–1248.
Hentschel, T., Hruschka, F., and Priester, M. 2002. Global report on artisanal and small-scale mining. Report commissioned by the Mining, Minerals and Sustainable Development of the International Institute for Environment and Development. http://www.iied.org/mmsd/mmsd_pdfs/asm_global_report_ draft [accessed 02 January 2008], p. 2008.
Hinton, J. and Hollestelle, M.R. 2012. Artisanal and small-scale mining in and around protected areas and critical ecosystems project. Methodological toolkit for baseline assessment and response strategies to artisanal and small-scale mining
in protected areas and critical ecosystems, Central Africa, pp. 1–94. https://www.profor.info/sites/profor.info/files/ Methodological%20Toolkit.pdf [accessed 03 June 2024].
Hoadley, M. and Limpitlaw, D. 2004. The artisanal and small-scale mining sector and sustainable livelihoods. Mintek Small Scale Mining Conference, Book of Proceedings, School of Mining Engineering, University of the Witwatersrand, Johannesburg, vol. 9, pp. 1–9.
Intergovernmental Forum on Mining, Minerals, Metals and Sustainable Development (IGF) 2017. Global trends in artisanal and small-scale mining (ASM): A review of key numbers and issues. International Institute for Environment and Development, Winnipeg, Canada. https://www.iisd.org/system/ files/publications/igf-asm-global-trends.pdf
International Labour Organization (ILO) 2004. Action Against Child Labor and Quarrying: A Thematic Evaluation. International Labour Organization, Geneva. Kenya Mining Act 2016. http//www.a-mla.org [accessed 21 May 2020].
Ledwaba, P. and Mutemeri, N. 2017. Preliminary study on artisanal and small-scale mining in South Africa, Report prepared for Open Society Foundation for South Africa (OFS-SA) by the Centre for Sustainability in Mining and Industry, Johannesburg, South Africa. www.osf.org.za/wp-content/uploads/2018/05/ OFS-SA-Report-ASM-03NOV-WEB-OpenSociety-Foundationfor-South-Africa-OSF-SA-Publications.pdf
Ledwaba, P. and Nhlengetwa, K. 2016. When policy is not enough: prospects and challenges of artisanal and small-scale mining in South Africa. Journal of Sustainable Development Law and Policy (The), vol. 7, no. 1, pp. 25–42.
Lombe, W.C. 2003. Small scale mining and the environment: bloom beyond the doom and gloom? Journal of Cleaner Production, vol. 2, no. 11, pp. 95–96.
Lungu, A. 2007. Formalisation of artisanal and small-scale mining in Sub-Saharan Africa: challenges and ways forward. Master’s thesis. Environment and Development. Faculty of Humanities, University of Manchester. https://www.academia.edu/52135325/ Formalisation_of_Artisanal_and_Small_Scale_Mining_in_Sub_ Saharan_Africa_Challenges_and_Ways_Forward
Mali Mining Code 2012. http//www.a-mla.org [accessed 21 May 2020].
Minamata Convention on Mercury. 2013. https:// minamataconvention.org/en [accessed 03 June 2024].
Mineral Resources and Energy Parliamentary Monitoring Group 2016. Combatting illegal mining. Department of Mineral Resources briefing, in presence of Minister. https://pmg.org.za/ committee-meeting/23630/ [accessed 14 April 2020].
Mining and Sustainable Development Project. 2002. Breaking new ground: mining, minerals, and sustainable development. Report. https://pubs.iied.org/pdfs/9084IIED.pdf [accessed 12 April 2020].
Mining Law Ecuador 2009. http//www.a-mla.org [accessed 21 May 2020].
Mutemeri, N., Walker, J.Z., Coulson, N., and Watson, I. 2016. Capacity building for self-regulation of the artisanal and smallscale mining (ASM) sector: A policy paradigm shift aligned with development outcomes and a pro-poor approach. The Extractive Industries and Society, vol. 3, no. 3, pp. 653–658.
Obiri, S., Dodoo, D.K., Armah, F.A., Essumang, D.K., and Cobbina, S.J. 2010. Evaluation of lead and mercury neurotoxic health risk by resident children in the Obuasi municipality, Ghana.
Environmental Toxicology and Pharmacology, vol. 29, no. 3, pp. 209–212.
Ostrom, E. and Hess, C. 2000. Private and common property rights. Encyclopedia of Law and Economics. Edward Elgar Publishing Limited, Northampton, United Kingdom. pp. 1–117. http:// papers.ssrn.com/sol3/papers.cfm?abstract_id=1304699
Ostrom, E. 1990. Governing the Commons: The Evolution of Institutions for Collective Action. Cambridge University Press, Cambridge.
Philippines Mining Act 1995. http//www.a-mla.org [accessed 21 May 2020].
Rwanda Law on Mining and Quarry Operations 2018. http//www.a-mla.org [accessed 21 May 2020].
Saldarriaga Isaza, C.A. 2013. The tragedy of the commons in artisanal gold mining: evaluation of mechanisms of cooperation with simulation and economic experiments, PhD thesis, Universidad Nacional de Colombia. https://repositorio.unal.edu. co/handle/unal/20040
Senegal Mines and Mineral Development 2015, s. 29 (3). http//www.a-mla.org [accessed 21 May 2020].
Sierra Leone Mines and Minerals Act 2008. http//www.a-mla.org [accessed 21 May 2020].
South Africa Mineral and Petroleum Resources Development Act 2002, s. 27. http//www.a-mla.org [accessed 21 May 2020].
Spiegel, S.J., Agrawal, S., Mikha, D., Vitamerry, K., Le Billon, P., Veiga, M., Konolius, K., and Paul, B. 2018. Phasing out mercury? Ecological economics and Indonesia's small-scale gold mining sector. Ecological Economics, vol. 144, pp. 1–11.
Tanzania Mining Act 2010. http//www.a-mla.org [accessed 21 May 2020].
Uganda Mining Act 2003. http//www.a-mla.org [accessed 21 May 2020].
United Nations Environment. 2017. Artisanal and small-scale gold mining. Geneva, Switzerland. http://www.unep.org/ chemicalsandwaste/sites/unep.org.chemicalsandwaste/files/ mercury/Global%20Component%202%20pager.pdf
Vanka, K.S., Shukla S., Gomez, H.M., et al. 2022. Understanding the pathogenesis of occupational coal and silica dust-associated lung disease. European Respiratory Review, vol. 31, pp. 1–17. doi: 10.1183/16000617.0250-2021
World Bank. 2015. Africa Socioeconomic impact of mining on local communities in Africa Report. World Bank Group. Washington, D.C. http://documents.worldbank.org/curated/ en/958951468191636444/Socioeconomic-impact-of-miningon-local-communities-in-Africa
World Bank. 2019. Shining a light on a hidden sector. https://www. worldbank.org/en/news/feature/2019/06/19/shining-a-light-ona-hidden-sector [accessed 23 May 2020].
Yakovleva, N. 2007. Perspectives on female participation in artisanal and small-scale mining: A case study of Birim North District of Ghana. Resources Policy, vol. 32, no. 1–2, pp. 29–41.
Zambia Mines and Mineral Development 2015, s. 29 (3). http//www.a-mla.org [accessed 21 May 2020].
Zvarivadza, T. 2018. Artisanal and small-scale mining as a challenge and possible contributor to sustainable development. Resources Policy, vol. 56, pp. 49–58. u
Affiliation:
1Department of Mining Enagineering, University of Pretoria, Pretoria, South Africa
Correspondence to: K.G. Philo
Email: keaton.philo@up.ac.za
Dates:
Received: 27 Jan. 2023
Revised: 16 Sept. 2023
Accepted: Feb. 2024
Published: June 2024
How to cite:
Philo, K.G., and Webber-Youngman, R.C.W. 2024. A critical investigation into identifying key focus areas for the implementation of blockchain applications in the mining industry. Journal of the Southern African Institute of Mining and Metallurgy, vol. 124, no. 6. pp. 319–330
DOI ID:
http://dx.doi.org/10.17159/24119717/2597/2024
by K.G. Philo1* and R.C.W. Webber-Youngman1
*Paper written on project work carried out in partial fulfilment of MEng (Mining Engineering Degree)
Abstract
Digital information and data are crucial drivers of progress in various industries, including mining, where data-driven decision making optimizes resource extraction, enhances safety, and ensures sustainability. The adoption of digital technologies like artificial intelligence (AI) and the Internet of Things has amplified the importance of digital information. However, the integrity and security of this information are paramount, leading to the exploration of blockchain technology as a potential solution for secure digital value exchange in mining. This research examines blockchain's capabilities, drawing insights from its applications in sectors like banking, government, healthcare, and entertainment, and evaluates their relevance to mining's core value chain processes. The study identifies blockchain's distributed ledger technology, cryptographic security, and decentralization as unique advantages that can revolutionize mining by enhancing transaction speed, reducing costs, and improving supply chain transparency and compliance with sustainability standards. Blockchain's transparent and auditable records can enhance business transparency, fostering trust among stakeholders, including investors and regulatory bodies. The technology's consensus mechanisms and smart contracts further promote trust in collaborative ventures. This research provides a foundational understanding for decision-makers in the mining industry to evaluate blockchain's feasibility and potential return on investment, guiding strategic planning and resource allocation for blockchain applications. By leveraging blockchain, mining companies can optimize operations, improve sustainability practices, and establish a robust foundation for future growth, positioning blockchain as a transformative technology in the sector.
Keywords
Introduction
The mining industry is undergoing a digital transformation, with technologies such as autonomous vehicles and drones being adopted to increase productivity and safety (Bliss, 2018). The World Economic Forum (WEF) predicts that many mining organizations will adopt autonomous mining machines, which will bring an estimated USD 47 billion to the industry by 2025. The WEF highlights four key areas for digital transformation in the mining industry: automation and robotics, a digitally enabled workforce, integrated enterprise systems, and advanced analytics (World Economic Forum, 2017).
The technologies associated with these four themes share a common aspect; namely, the utilization of big data. These technologies produce data, communicate via machine-readable data, or rely on data to operate and perform certain tasks. Hence the availability of data and communication of machine-readable information is imbedded in these four themes. Machine-readable data has become one of the most valuable resources in current times, thus it is important to protect and better manage digital information.
It is evident that artificial intelligence (AI), the Internet of Things (IoT) and blockchain technology (BCT) will play an important role in the digital economy (UNCTAD, 2019). The value of digital information is ever-increasing as more companies utilize these digital technologies to gain deeper insight into their operations and drive this transformation process. As AI and IoT typically rely on the exchange and communication of data, it is important to safeguard and ensure the integrity of data exchange. BCT was identified as being potentially able to provide the mining industry with a trusted system for securely exchanging digital value (Philo and Webber-Youngman, 2021). However, there is still little evidence or understanding of how BCT can be implemented and what benefits the mining industry could obtain.
Table I
Differences between Bitcoin and blockchains
Bitcoin Difference Blockchains
A decentralized digital currency used for commerce on the internet
To create a global, peer-to-peer electronic cash system that allows for fast, inexpensive, and secure transactions without the need for intermediaries such as banks or governments
What is it?
Tamper-evident and tamper-resistant digital ledger implemented in a distributed fashion and usually without a central authority
The goal To provide a secure and transparent way to record and verify transactions across a decentralized network of computers
Bitcoin is limited to trading as a currency Trade
Limited scope as a cryptocurrency
Background
Anything that can be represented digitally, such as currencies, land titles, securities, etc.
Scope Open scope as blockchains can be designed for different use cases
Blockchain technology was first proposed by an individual or group of individuals using the pseudonym Satoshi Nakamoto in a White Paper entitled ‘Bitcoin: A Peer-to-Peer Electronic Cash System.’ The White Paper was published in 2008 and it introduced the concept of Bitcoin, which has since grown to become the first and most wellknown application of BCT.
Understanding the distinction between Bitcoin and blockchains is crucial as it can help to understand the unique properties and capabilities of BCT. Table I explains the important differences between Bitcoin and blockchains.
While BCT is viewed as a relatively ‘new’ technology, in essence it is more of an innovatively constructed combination of different existing technologies such as peer-to-peer (P2P) networking, cryptographic hash functions, distributed timestamping, digital signatures, and Merkle trees (Hileman and Rauchs, 2017). For this reason, BCT applications can be designed for a variety of different use cases but it is fundamentally a new protocol for value transfer via the internet.
At the most basic level, a blockchain is a type of database/ledger that is replicated and managed by a cluster of computers (across a
P2P or decentralized network) with no central authority; it enables the distribution of digital information that cannot be copied or forged (Rosic, 2018).
The research hypothesis for this study is the following: the application of BCT in the mining industry can add value or additional benefits to core business value chain processes. The following are the main questions that this research aimed at answering:
➤ How could BCT be used in the mining industry?
➤ What are the potential benefits for implementation in the mining industry?
➤ Where are the potential focus areas for BCT in mining?
Figure 1 illustrates the research roadmap that was followed during the study, starting with an investigation into BCT use cases in different industries. These use cases were examined to identify what capabilities of BCT are used and the associated benefits. Mining industry use cases were then researched from a technologypush perspective to try and find possible focus areas within the
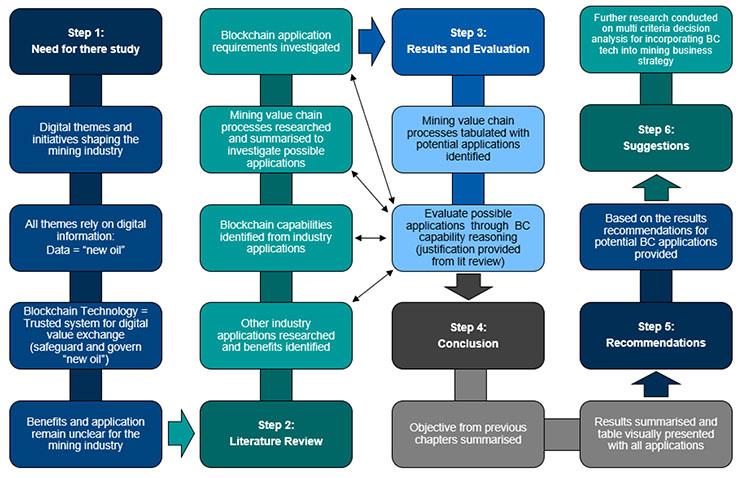
mining industry’s business processes for further research. From the findings of the literature review, the capabilities and value drivers of BCT were mapped to the mining industry’s business processes to highlight potential focus areas for application in mining.
review
Blockchain technology fundamentals
BCT is also commonly referred to as Distributed Ledger Technology (DLT). There are also other terms, such as P2P databases, mutual distributed ledgers, synchronous ledgers, and consensus ledgers. These terms, among others, unfortunately add to the confusion around BCT as they are often interchangeably used. What distinguishes BCT from these other databases or ledgers is the data structure (how data are stored: chain of cryptographically linked blocks) and the data diffusion (how data are shared/communicated: global data broadcast) (Hileman and Rauchs, 2017).
The other characteristics that make BCT unique can be summarized into the following five points (Lansiti and Lakhani, 2017):
➤ The technology is decentralized. This means that it is a distributed database where each party on the blockchain network has access to the entire records and their complete history. Every participant can verify the records of transaction partners directly and without a trusted third party/ intermediary.
➤ The communications/transactions are peer-to-peer (P2P). The data commerce occurs directly between peers instead of through a central node. Each node stores and forwards information to all other nodes.
➤ The blockchain database provides transparency with
Table II
pseudonymity. Every transaction and its associated value are visible to anyone with access to the network. Each user, or node, on the blockchain has a unique address that identifies it (30-plus-character alphanumeric identifier). The transactions occur between these addresses, and users can choose to remain anonymous or provide proof of their identity to others.
➤ The blockchain records are designed to be irreversible When transactions are entered into the database and the accounts are updated, the records cannot be simply altered. The blockchain protocol deploys various computational algorithms and approaches to ensure that the recording on the database is permanent, chronologically ordered, and available to all network participants. All transactions are recorded and cryptographically linked to every transaction that came before them, hence the term ‘chain’.
➤ The blockchain uses computational logic. Owing to the digital nature of the ledger/database, transactions can be tied to computational logic and in essence programmed, creating smart contracts (a smart contact is a program that automatically executes when nodes reach consensus. The nodes in a blockchain are configured to trigger when certain conditions have been met, executing certain pre-defined business functions). Users can set up rules that automatically trigger transactions between nodes.
One of blockchain’s notable features is the ability to transfer value (digital information) securely across a decentralized network. Table II illustrates distinctions between three network architectures; namely, centralized, decentralized, and distributed, while highlighting the positive and negative aspects of each.
Centralized vs decentralized vs distributed systems (Touron, 2019)
Centralized system

Users are connected to a central network owner or ‘server’. The central owner stores data, which other users can access.
Positive aspects:
• Simple/easy deployment
• Can be developed quickly
• Affordable to maintain
• Practical when data need to be centrally controlled
Negative aspects:
• Prone to failures
• Higher security and privacy risks for users
• Longer access times to data for users who are far from the server
Decentralized system
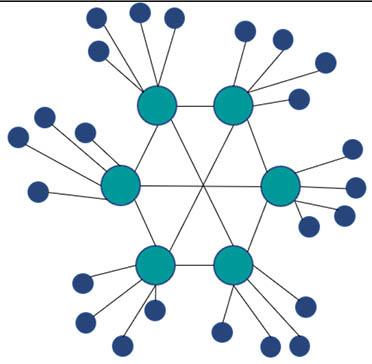
There is no one central owner. Instead, these systems use multiple central owners, each of which usually stores a copy of the resources that users can access.
Positive aspects:
• Less likely to fail than a centralized system
• Better performance
• Allows for a more diverse and more flexible system
Negative aspects:
• Security and privacy risks to users
• Higher maintenance costs
• Inconsistent performance when not properly optimized
Distributed system
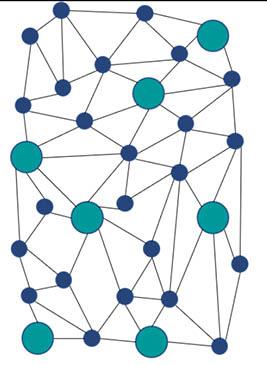
In a distributed system, users have equal access to data, although user privileges can be enabled when needed. The best example of a vast, distributed system is the internet itself.
Positive aspects:
• Fault-tolerant
• Transparent and secure
• Promotes resource sharing
• Extremely scalable
Negative aspects:
• More difficult to deploy
• Higher maintenance costs
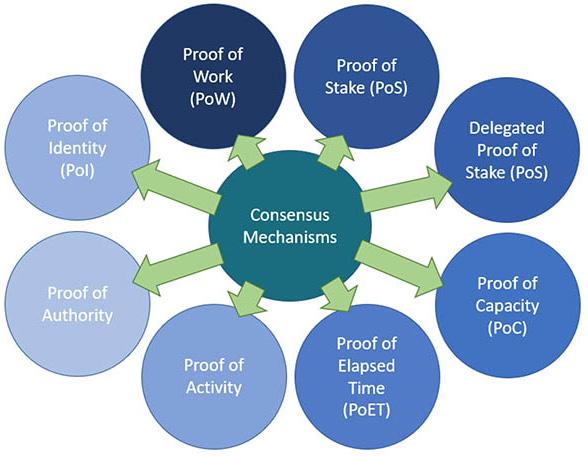
The main concern with centralized systems is that they are prone to failures as there is a central point of attack. With decentralized and distributed systems, the ability to manipulate (attack) or gain control over the system is almost impossible. There is also a trust issue regarding centralized systems (in terms of data access, storage, and usage) as power is concentrated with a few individuals who have administrative rights to the system. These individuals or actors could abuse their authority and misuse private and/or sensitive information, such as the case with the Facebook and Cambridge Analytica data scandal (Criddle, 2020). With decentralized and distributed systems, this power is shared among the network participants and there is no need to trust a centralized entity to act with integrity regarding digital information exchanges.
Most blockchains are maintained by a distributed network of computers (nodes) that need to reach an agreement on the state of the distributed ledger (e.g., number of transactions, transaction value, etc.). In a decentralized system, this poses a challenge as some nodes are likely to fail or may act maliciously. Thus, consensus algorithms are used as a mechanism to build a Byzantine Fault Tolerant (BFT) blockchain. A BFT system can continue operating despite the presence of malicious actors. Figure 2 shows the various consensus mechanisms that are used in different applications.
Each consensus mechanism is designed to achieve consensus in different ways. How consensus is achieved can typically influence three main features of a blockchain; namely, security, decentralization, and scalability. Vitalic Buterin (co-founder of Ethereum) conceptualized a model (Figure 3) named the
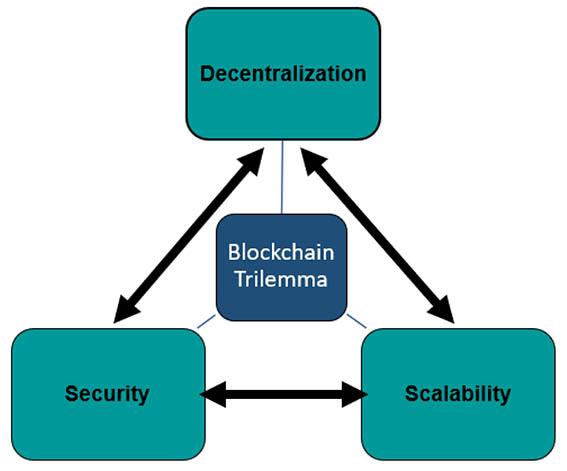
‘blockchain trilemma’, which highlights these features as challenges that programming engineers face when developing a blockchain (CertiK, 2019).
Owing to the inherent design of how blockchains are built (programmed), engineers are forced to make trade-offs between decentralization, scalability, and security. In theory, blockchains must sacrifice one aspect in order to achieve a high degree of the other two components. These components are listed thus (Certik, 2019):
➤ Decentralization – creating blockchain networks that have no central point of control.
➤ Scalability/speed – the ability for a blockchain network to handle an exponential number of transactions.
➤ Security – the ability of a blockchain network to defend itself from malicious attacks, bugs, and black swan events.
When developing a BCT application for the mining industry, it is important to make informed decisions when choosing a consensus mechanism, as different consensus applications will have different outcomes in terms of decentralization, scalability, and security. When a company has set an applicational objective, the desired results can be used to work backwards and identify a suitable consensus mechanism that may align with that objective. A decision tree for choosing an appropriate consensus algorithm was published by Ferdous et al. (2020), which can be leveraged to help develop or select a blockchain for a particular use case.
Industry applications
Blockchain technology offers an innovative way of recording/storing and transferring important data. Data records are grouped together in blocks that are cryptographically linked, ensuring a transparent,
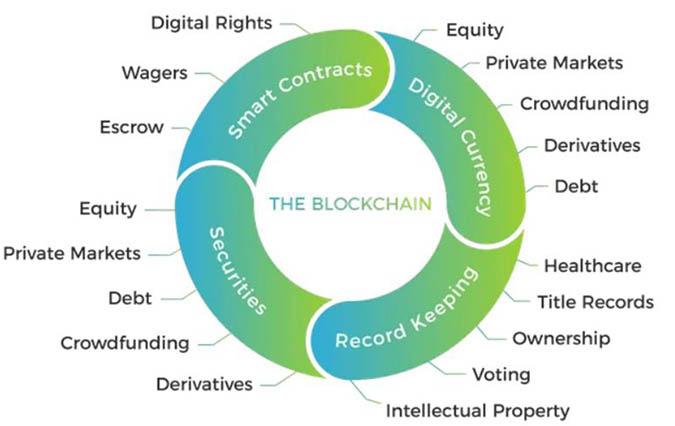
Table III
Summary of blockchain technology applications from the literature review findings
Industry Use cases / Application areas
Banking and Finance Payment systems (local and international)
Securities
Government and Public Goods
Fundraising
Customer KYC (know your customer) and fraud prevention
Public procurement processes
Voting
Central Bank Digital Currencies (CBDC)
Education
Identity management
Payment and taxation
Storing records
Electronic voting systems
Public healthcare
Asset management (Land registry and transactions)
Benefits
• Speed and efficiency improvements in transaction processing
• Reduced intermediaries
• Reduced financial activity costs
• Reduced settlement latency
• Reduced operational and custody risk
• Increased transparency to issuers, end investors, and regulators
• Reduced financial processing costs
• Automated financial services through smart contracts
• Alternative fundraising mechanism ICO (initial coin offering)
• Reduced time to gain access to capital
• Liquidity
• No capital sourcing restrictions (access to global communities)
• Ownership
• Peer-to-peer (P2P) or business-to-business (B2B) loans
• Reduced human labour and expenses (compliance)
• Enhanced identity management
• Security improvements
• Compliance improvements (increased data confidence)
• Reduced onboarding time (financial institutions)
• Speed and efficiency improvements in data processes
• Procedural transparency
• Full traceability of permanent records
• Improved trust (honest disclosure)
• Full traceability of permanent records
• Identity verification
• Transparency and traceability of financial transactions
• Supervision
• Control
• Ownership of digital certificates (National Senior Certificate)
• Automated verification process of certificates
• Tokenized identities
• Improved data management
• Authentication
• Full traceability of payments and tax records
• Speed and efficiency improvements in tax process
• Evidence tampering
• Facilitates mandatory regulatory reporting
• Transparency of voting process
• Enhanced identity management
• Security improvements
• Preservation of historical health data
• Track and trace improvements
• Improved data management and security
• Decentralised registry
• Process automation
Sources
Baur et al., 2018 CBinsights.com, 2021 Wisdomtree.com, 2019
Natrajan and Nuthi, 2022 Symons, 2017
Frankenfield, 2022 Saiedi et al., 2022 Thurman, 2021
CFI, 2021 Cheng et al., 2022 Chirag, 2022 Schram, 2021
Lannquist and Raycraft, 2020
Aburumman et al., 2020 Clavin et al., 2020
Clavin et al., 2020
Aburumman et al., 2020
Clavin et al., 2020
Aburumman et al., 2020
Clavin et al., 2020
Aburumman et al., 2020
Clavin et al., 2020
Hileman and Rauchs, 2017
Aburumman et al., 2020
Calvin et al., 2020
Lannquist and Raycraft, 2020
Ølnes et al., 2017
Table III (continued)
Industry Use cases / Application areas
Insurance
Property and causality insurance underwriting
Property and causality insurance claims processing
Healthcare Supply chain
Patient-centric electronic health records
Verification of medical staff credentials
IoT security for remote monitoring
Media, Entertainment, and Gaming
P2P sales and content distribution
Benefits
• Efficient exchange of information
• Improved risk profiling
•Automation through smart policy
• Enhances client onboarding
• Simplified/automated claim submission
• Reduced fraud loss
• Enhanced customer experience and no manual inspection
•Automated compliance
• Transparency improvements – provenance track and trace of medical goods
• Enhanced patient safety compliance (reporting process for manufacturers and pharmaceutical companies)
• Supply chain optimization (AI tools for accessing blockchain data stored from device manufacturers, pharmaceutical companies, medical institutions)
• Improved patient and healthcare provider experience
• Improved patient data transparency and control
• Process efficiency improvements and reduced costs
• Efficient and faster verification process
• Data monetization of staff competencies
• Transparency and reassurance on staffing capabilities
• Improved IoT security through decentralized device communication
• Smart contract automation of content licensing and payments
• Disintermediation of third-party involvement
• Improved security of content distribution
• Data monetization of staff competencies
• Transparency and reassurance on staffing capabilities
Sources
Arpan and Navin, 2012
Colaco et al., 2022
Colaco et al., 2022
Streamlining of royalty payments
New pricing options for paid content
Monetization of ingame assets
Blockchain-based gaming platforms
Mining Engineering, construction, and handover of the mine site
Compliance and mining lease management
Supply chain
Mineral provenance
• Enhanced data management (content creator)
• Automated royalty payments for content use
• Improved security of content distribution
• Pay-per-use consumption-based model enabling micropayments with cryptocurrencies
• Ownership of virtual assets
• Buy, sell, and exchange NFT (non-fungible tokens) for cryptocurrencies
• Play-to-Earn incentive system
• Enhanced security for online games
• Improved gaming user experience
• Improved trust and work compliance
• Improved data process management and maintenance
• Eliminates the need for intermediaries, reduces administrative costs, and eliminates errors
• Improved supply chain transparency
• Improvedtrust when transparent sourcing of mineral resources is verified on a blockchain
safe, and secure data-exchange process. The technology allows all or specific network participants (depending on private or public applications) to know who they are doing business with as the data records are decentralized, permanently stored, and easily accessible. The data stored on a blockchain can be tamper-proof (changes
Babaei et al., 2023
Oderkirk and Slawomirski, 2020
STLPartners, 2021
Krawiec, 2016
Oderkirk and Slawomirski, 2020
STLPartners, 2021
Sehar et al., 2023
STLPartners, 2021
Camila and Alberto, 2018
ConsenSys.net, 2022
Bamakan et al., 2022
ConsenSys.net, 2022
ConsenSys.net, 2 022
CIOReview, 2019 Kraken.com, 2020
Chirag, 2022
Kalra et al., 2018
Cosgrove, 2019 Kamel et al., 2023.
Cosgrove, 2019
Cosgrove, 2019 Kshetri, 2018
Cosgrove, 2019
on a blockchain need to be authorized by the majority of network participants, i.e., they are consensus-dependent) and or tamperevident (any suspicious data alteration will be recorded), preventing unwanted situations for businesses dealing with important digital information (Goyal, 2018).
Goyal (2018) states that in the future BCT will be used in all industries; it provides four main areas of application: record keeping, digital currencies, smart contracts, and securities. Figure 4 attempts to summarize the applications of BCT from a holistic perspective, but some applications are duplicated, especially with regards to securities and digital currencies. The real benefits of applying BCT within different industries are at present still underutilized.
The literature review investigated different applications of BCT in various industries to identify and summarize the technology’s capabilities and associated benefits. Table III condenses the findings from the literature review and highlights the different applications and associated benefits of using BCT in the banking, government, insurance, healthcare, entertainment, and mining sectors.
Results and discussion
Based on the use cases identified in the literature review, the various applicational capabilities of BCT were deduced, as shown in Table IV. Before a technology is used, it is important to understand what the technology can do. The mining industry can assess these highlighted capabilities of BCT for a better understanding of what the technology can do for their business.
Table V summarizes the identified benefits of BCT found from the literature survey and condenses them into value drivers for
Table IV
Blockchain technology capabilities
BCT capability
Automation
Disintermediation
Improving security measures
Data traceability (track and trace)
Data processing speed and efficiency
Distributed data storage
Tokenization
Enhanced identity management
Data permanence
Tamper-evident
Data control
Smart contracts
Holistic view
the purpose of linking the technology’s capabilities with expected benefits.
Table VI was created by matching the different value drivers from Table V to the associated technological capabilities of BCT, identified in Table IV. This was done using the following reasoning, as explained using the first capability (Automation) as an example.
Automation: BCT is a self-validating network that can automate business applications and logic using smart contracts. Process automation can lead to better data management, resulting in improved data auditability and compliance. All of this may result in efficiency improvements, cost reductions, manual labour reduction, and less administration.
The above example highlights that the value drivers associated with the different capabilities are stackable: one capability could enable the realization of multiple value drivers that may form the premise for a particular business case. Industry leaders can use these capabilities and value drivers to assess whether potential opportunities exist within their own specific operations.
The capabilities and value drivers (Table VI), along with the mining industry 23 value chain definitions and outputs from the Open Group’s Exploration and Mining business process model (which defines the standard business activities for organizations that operate in the exploration and mining sectors), were used to suggest potential applications of BCT. Using the mining industry’s
Description
Blockchains’ self-validating network and the use of smart contracts aids the automatic application of business logic and processes.
BCT can provide disintermediation of third parties. Because BCT uses cryptography and different consensus mechanisms to ensure that data are trustworthy, third-party data validators are no longer required.
Data can be encrypted and shared between multiple nodes, improving overall data security.
All new data added to a blockchain ledger can be known to anyone or only to authorised parties. The provenance and complete history of all data communication/exchange/movement/changes are recorded.
BCT can enable faster data transfers and can streamline tasks to increase process effectiveness. This capability also relates to disintermediation.
Data ownership by a single entity can be reduced, and open access to data without a single point of failure is provided by BCT.
Physical objects can be owned, managed, and digitally transferred if they have a validated unique digital representation (token).
The combination of BCT capabilities integrates different data to verify and manage customer and personal identity data.
Data records on a blockchain can be permanently stored using different cryptographic algorithms and consensus mechanisms.
Users with the proper access can confirm that data has not been altered thanks to the underlying mathematics and cryptography of BCT.
Different permissions (open/closed systems) can be granted to users, enabling a wider range of data control.
Smart contracts on a blockchain enable new product/services and partnerships (e.g., royalty payments).
All authorized parties have access to a single source of truth recorded on the blockchain (same data).
Table V
Value drivers of blockchain technology
Value driver Description
Data sharing
Data security
Data management
Process automation
Transparency
Authentication
Identity management
Ownership
New business processes and marketplace establishment
New products/services
Trust
Track and trace
Compliance
Reconciliation
Auditability
Parties can share real-time data, data history, as well as modifications, enabling collaboration and other value drivers such as track and trace.
Data can be encrypted and stored on multiple nodes with no single point of failure/attack. Blockchain technology offers various levels of data encryption, reducing the risk of data breaches.
BCT enables the unified sharing of real-time data from a single data source, providing data provenance, data authorization, and data-sharing capabilities that all add to better/improved data management.
There is automatic process execution through smart contracts, which may result in efficiency improvements, cost reductions, manual labour reduction, and less administration.
Full transparency of data by authorized parties could lead to additional opportunities such as track and trace, compliance, and cooperation.
The use of public and private key cryptography serves as a basis for authenticating users across multiple networks. This translates into trust in the network, data sharing, and identity management.
BCT enables a process of recording digital identities and the management thereof. There is no longer a need for paper-based systems and manual verification/ authentication processes.
True and verifiable digital ownership of physical and digital assets is provided.
With the increased trust in digital information and use of smart contracts, new business processes and marketplaces could emerge, such as Play-to-Earn and digital rights management.
BCT increases consumer trust in digital goods and services, while also enabling peer-to-peer transactions of digital assets in real time via a shared ledger, the use of smart contracts, and tokenization.
BCT can facilitate and even automate the creation of trust in the digital dominion by cryptographically protecting data, revealing the status and history of data, and providing transparency.
BCT enables the tracking and tracing of data/products within a supply chain because of the ability to provide a holistic view within a blockchain network of trading organizations.
BCT increases the level of data confidence because it is tamper-evident/tamperproof. This enables a more efficient compliance management process as less administration is required to verify information.
BCT can improve data reconciliation processes because of improved data traceability, management, and transparency.
BCT can provide transparency with regards to permanent, tamper-proof records of transactional data, shared among relevant parties. This improves the level of data accountability and auditability. The use of smart contracts can enable automatic auditing on ledgers to assist with compliance management.
different value chain process descriptions as well as the associated output, the applicability of BCT was assessed to identify, if possible, what applications or opportunities exist. These opportunities were identified from a technology-push perspective, using the blockchain capabilities and industry-related benefits, encouraging further research and development within the mining industry.
The results of the study highlighted the different capabilities and value drivers associated with BCT. These capabilities were mapped to the 23 different mining value chain processes by suggesting potential applications. The value drivers were also highlighted in the different mining value chain processes. Figure 5 summarizes the
number of times each capability was identified within the mining industry’s enterprise processes. The top three capabilities are: data traceability, automation, and holistic view.
In addition, the value driver hits are also summarized in Figure 6, highlighting the top three value drivers: transparency, track and trace, and compliance.
As mining companies embark on their digital transformation journey, the industry will need to focus on safeguarding digital information in relation to their day-to-day business operations.
Table VI
Blockchain technology capabilities and expected value drivers
Blockchain technology capability
Automation
Disintermediation
Improving security measures
Data traceability (track and trace)
Data processing speed and efficiency
Distributed data storage
Tokenization
Enhanced identity management
Data permanence
Tamper evident
Data control
Smart contract
Holistic view
Expected applicational value driver
Process automation; data management; auditability; compliance
Trust; process automation; new products/services
Authentication; data security; ownership
Reconciliation; compliance; track and trace; transparency
Process automation; data sharing
Transparency; data security; data sharing
Ownership; new products/services
Authentication; ownership
Compliance; track and trace
Auditability; track and trace
Data management
New business processes and marketplace establishment
Transparency; trust; data sharing
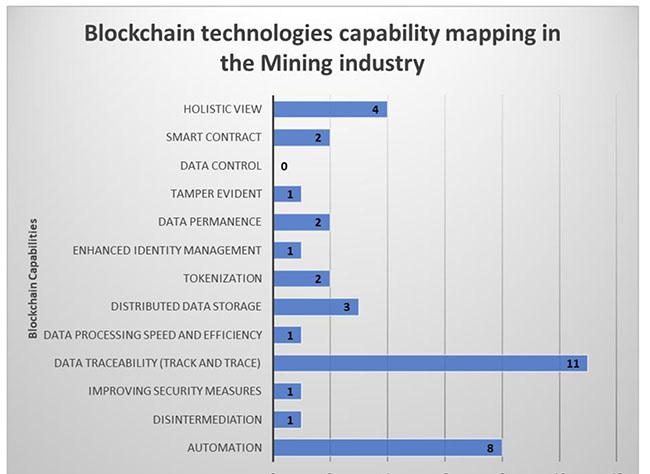
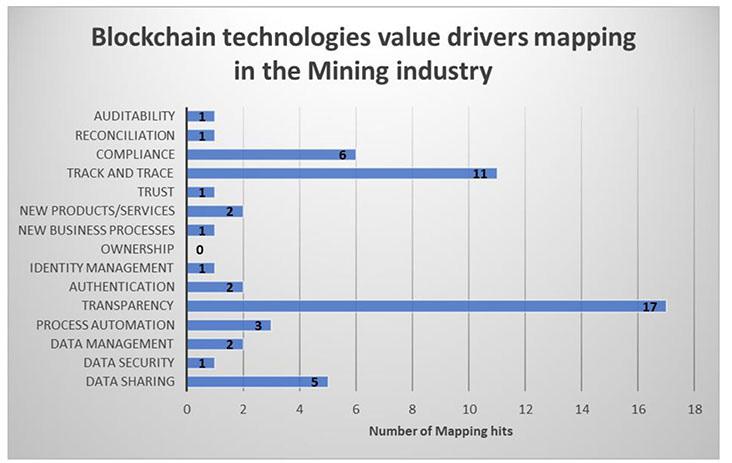
Digital information is becoming more valuable as disruptive technologies such as AI and IoT penetrate business operations. Organizations understand that they need to innovate or risk being disrupted.
The application of BCT has numerous associated benefits. These benefits were identified and are summarized as value drivers in Figure 7. The value drivers can translate to improvements in operational quality and profitability, increasing data transparency within an organization and with relevant stakeholders, as well as pointing to new opportunities for business partnerships, products, and services. These value drivers highlight why the mining industry needs to investigate implementing BCT within their organizations.
Blockchain is a revolutionary technology with the potential to disrupt all industries that use digital information in their business operations. BCT can be viewed as a metaphorical Swiss army knife. It is an extremely versatile technology with applications that can be designed and tailored for specific use cases. The technology’s capabilities range from process automation to tokenization, through to providing a holistic view of all data records. The capabilities identified in this study are summarized in Figure 8.
The capabilities and value drivers were used to identify potential focus areas for applying BCT in the mining industry. These focus areas are application-specific, relating to where data traceability, process automation, and the need for a holistic view occur within the mining industry’s value chain processes.
All new data added to a blockchain ledger can be known to anyone or only to authorized parties, giving access to a single source of truth (same data). Data provenance and a complete history of all data communication/exchange/movement/changes can be recorded on a blockchain ledger. Blockchains’ self-validating networks and the use of smart contracts further enable the automatic application of business logic and processes within the mining industry.
The main benefits of applying BCT in these key applicational areas are improvements in data transparency, efficiencies in tracking and tracing data, and automated compliance.
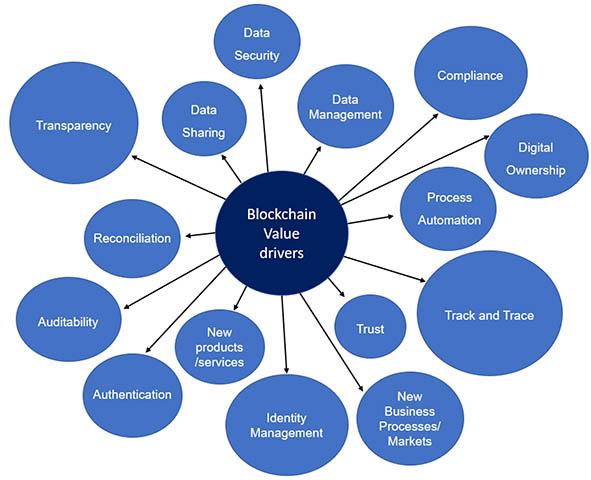
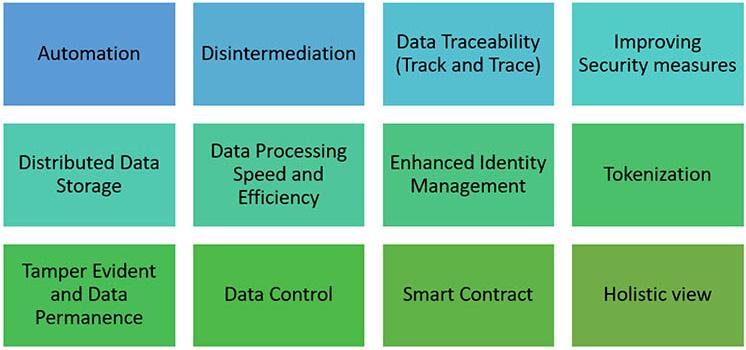
BCT offers a valuable solution for traceability and transparency in engineering design and other non-financial processes. By creating a decentralized, immutable ledger, blockchain allows for the secure and efficient tracking of data and information throughout the entire design process. This means that every step and change made in the process can be easily traced and verified, improving accountability and reducing the risk of errors. Additionally, blockchain's transparency allows for greater collaboration and communication among team members, as well as increased trust and confidence in the final product. Overall, blockchain's ability to provide secure and transparent tracking of non-financial data makes it an ideal solution for a wide range of industries and processes.
It is worth noting that the implementation of BCT in engineering design and other non-financial processes may not always follow the same design as its implementation in purchasing processes and platforms. While both implementations aim to increase traceability and transparency, the specific use cases and goals of each implementation can vary greatly. For example, in purchasing, BCT may be primarily used for tracking financial transactions and ensuring compliance, while in engineering design, it may be used for tracking changes and approvals throughout the design process.
Additionally, the level of decentralization and accessibility may differ between the two implementations, with purchasing
implementations tending to be more centralized and private, while engineering design implementations may be more decentralized and public. Therefore, it is important to consider the unique needs and goals of each specific use case.
The capabilities and value drivers identified in this study can be used to assess what benefits could materialize through BCT applications and how the technological capabilities could deliver value.
Overall, blockchain's ability to provide secure and transparent tracking of non-financial data makes it an ideal solution for a wide range of industries and processes. The focal areas for blockchain integration within the mining industry primarily revolve around business units, processes, and activities that demand a comprehensive perspective, meticulous data tracking and tracing, and streamlined process automation. BCT offers its greatest advantages in situations where a holistic view of operations is essential, ensuring that all stakeholders have access to a single, immutable source of truth. Additionally, blockchain's secure and transparent ledger capabilities are particularly valuable for tracking and tracing data across the intricate web of mining activities, allowing for a precise account of every step and change in the process. Furthermore, its potential for deploying smart contracts enables the automation of complex workflows, enhancing efficiency and accuracy in various mining-related tasks. As such, the
mining industry can harness blockchain's transformative potential by strategically implementing it in these key areas, ultimately revolutionizing the way mining companies conduct and manage their operations.
Recommendations
The recommendations are based on the research results and conclusions, as well as steps a mining company can take towards realising blockchain applicational benefits. To assess the applicability of BCT for the mining industry, the following steps are recommended:
1. The application of BCT requires a specific use case for analysis. Mining industry decision-makers should first have a brainstorming session with all relevant organizational parties. This session should identify specific problems in respect of their operations, employees, and customers (pain points) within the organization that they would like to address.
2. These pain points can be assessed and prioritized according to the effects that they might have on the business’s operations.
3. When the team has decided or concluded that BCT can be a possible solution, then the blockchain value framework can be used, along with the value drivers and capabilities, to assess what value can possibly be gained by addressing the pain points with BCT.
4. These value drivers will form the foundation for discussing potential investment in developing a blockchain ‘proof of concept’ for a specific application.
References
Abrumman, N., Fraij, J., and Szilagyi, R. 2020. Digitalization: The Use Of Blockchain In Public Sector Journal of Business and Economics, vol. 5, no. 2, pp. 72–82. doi: 10.47535/1991ojbe113
Anwar, H. 2018. Consensus algorithms: The root of blockchain technology. https://101blockchains.com/consensus-algorithmsblockchain/#prettyPhoto
Arpan, K.K. and Navin, L. 2012. Diffusion of blockchain in insurance industry: An analysis through the review of academic and trade literature. https://www.sciencedirect.com/science/ article/pii/S073658532030191X
Babaei, A., Khedmati, M., Akbari Jokar, M.R., and Tirkolaee, E.B. 2023. Designing an integrated blockchain-enabled supply chain network under uncertainty. Science Reports, vol. 13, p. 3928. doi.org/10.1038/s41598-023-30439-9
Bamakan, S.M.H., Nezhadsistani, N., Bodaghi, and O. Qu, Q. 2022. Patents and intellectual property assets as non-fungible tokens; key technologies and challenges. Science Reports, vol. 12, p. 2178. doi.org/10.1038/s41598-022-05920-6
Baur, D.G., Hong, K., and Lee, A.D. 2018. Bitcoin: Medium of exchange or speculative assets? Journal of International Financial Markets, Institutions and Money, vol. 54, pp. 177–189. https://www.sciencedirect.com/science/article/pii/ S1042443117300720
Binance Academy. 2018. Byzantine fault tolerance explained. https:// academy.binance.com/en/articles/byzantine-fault-toleranceexplained
Bliss, M. 2018. How technological innovation is impacting the mining sector. IGF Forum. https://www.igfmining.org/resource
Camila, S. and Alberto, N. 2018. The impact odd blockchain on the music industry. Proceedings of 29th European Regional Conference of the International Telecommunications Society (ITS): Towards a Digital Future: Turning Technology into Markets? 1–4 August 2018, Trento, Italy. https://www.econstor.eu/handle/10419/184968
CBInsights.com. 2021. Blockchain disrupting banking. https://www.cbinsights.com/research/blockchain-disruptingbanking/#:~:text=Blockchain%20technology%20provides%20 a%20way,the%20need%20for%20a%20bank
Certik. 2019. The blockchain trilemma. Decentralized, scalable, and secure? https://medium.com/certik/the-blockchain-trilemmadecentralized-scalable-and-secure-e9d8c41a87b3
CFI (Corporate Finance Institute). 2021. Know your client (KYC). https://corporatefinanceinstitute.com/resources/wealthmanagement/know-your-client-kyc
Cheng, F. and Blockinger, J. 2022. Introduction to Quadrata. https://docs.quadrata.com/integration/introduction/ introduction-to-quadrata-web3-passport
Chirag, B. 2022. Blockchain technology for KYC. The solution to inefficient KYC process. (Blog). https://appinventiv.com/blog/ use-blockchain-technology-for-kyc
Cioreview. 2019. How can blockchain technology revamp the gaming industry. https://www.cioreview.com/news/how-canblockchain-technology-revamp-gaming-industry-nid-27761cid-176.html
Clavin, J., Duan, S., Zhang, H., Janeja, V.P., Joshi, K.P., and Yesha, Y. 2020. 22 Blockchains for government: Use cases and challenges. https://ebiquity.umbc.edu/_file_directory_/papers/1057.pdf
Colaco, J., Chatterjee, S., Watson, A., and Singla, V. 2022. Blockchain in insurance. Why should you care? https://www2.deloitte.com/ ca/en/pages/financial-services/articles/blockchain-in-insurance. html
Consensys.net. 2022. What are the benefits of blockchain in media and entertainment? https://consensys.net/blockchain-use-cases/ media-and-entertainment
Cosgrove, L. 2019. How will blockchain technology change the mining industry? https://www.wipro.com/natural-resources/ how-will-blockchain-technology-change-the-mining-industry
Criddle, C. 2020. Facebook sued over Cambridge Analytica data scandal. BBC News https://www.bbc.com/news/ technology-54722362
Ferdous, M.S., Chowdhury, M.J.M., Hoque, M., and Colman, A. 2020. Blockchain consensus algorithms: A survey. https://www.researchgate.net/publication/338738073_ Blockchain_Consensus_Algorithms_A_Survey
Frankenfield, J. 2022. What is an initial coin offering (ICO)? Investopedia.com. https://www.investopedia.com/terms/i/ initial-coin-offering-ico.asp#:~:text=What%20Is%20an%20 Initial%20Coin,a%20way%20to%20raise%20funds
Goyal, K. 2018. How blockchain be applied to various industries. Gazelle Information Technologies. https://gazelle.in/blockchainapplications/#comments
Hileman, G. and Rauchs, M. 2017. Global Blockchain Benchmarking Study. Cambridge University, Centre for Alternative Finance. Lansiti, M. and Lakhani, K., 2017. The truth about Blockchain. Harvard Business Review https://e-tarjome.com/storage/btn_ uploaded/2019-09-25/1569393941_10128-etarjome-English.pdf
Kalra, S., Sanghi, R., and Dhawan, M. 2018. Blockchain-based realtime cheat prevention and robustness for multi-player online games. Proceedings of the 14th International Conference on Emerging Networking Experiments and Technologies, 4–7 December 2018, Heraklion, Greece.
Kamel, M.A., Bakhoum, E.S., and Marzouk, M.M. 2023. A framework for smart construction contracts using BIM and blockchain. Science Reports, vol. 13, p. 10217. doi.org/10.1038/s41598-023-37353-0
Kraken.com. 2020. What is gala games? https://www.kraken.com/ learn/what-is-gala-games-gala
Krawiec, R. 2016. Blockchain opportunities for health care. https://www2.deloitte.com/us/en/pages/public-sector/articles/ blockchain-opportunities-for-health-care.html
Kshetri, N. 2018. Blockchain technology for improving supply chain management: opportunities, challenges, and future research. Journal of Business Research, vol. 39, no. 85, pp. 90–103.
Lannquist, A. and Raycraft, R.D. 2020. Exploring blockchain technology for government transparency: Blockchain-based public procurement to reduce corruption. World Economic Forum Report. https://www.weforum.org/reports/exploringblockchain-technology-for-government-transparency-toreduce-corruption
Natrajan, B. and Nuthi, S.R. 2022. Creating assurance in a blockchain world. Cignity.com. https://www.cigniti.com/blog/ creating-assurance-blockchain-world/#:~:text=Moving%20 securities%20on%20blockchains%20could,up%20to%20 %24160M%20annually
Oderkirk, J. and Slawomirski, L. 2020. Policy Brief: Opportunities and challenges of blockchain technologies in health care Paris, France: Organisation for Economic Co-operation and Development (OECD).
Ølnes, S., Ubacht, J., and Janssen, B.M. 2017. Blockchain in government: Benefits and implications of distributed ledger. Government Information Quarterly, vol. 34, no. 3, pp. 355–364.
Philo, K. and Webber-Youngman, R.C. 2021. Identify and evaluate critical disruptive technologies with the potential to simplify the complexity of the mining ecosystem. Proceedings of 5th Young Professionals Conference, Southern African Institute of Mining and Metallurgy, Johannesburg.
Rosic, A. 2018. Blockgeeks. https://blockgeeks.com/guides/what-isblockchain- technology
Saiedi, E., Mohammadi, A. Broström, A., and Shafi, K. 2022. Distrust in banks and fintech participation: The case of peer-topeer lending. Entrepreneurship Theory and Practice, vol. 46, no. 5, pp. 1170–1197.
Schram, C. 2021. Bloom integrates with Plaid to enable verifiable credentials. https://bloom.co/blog/bloom-integrates-with-plaidto-enable-verifiable-credentials
Sehar, N.U., Khalid, O., Khan, I.A. Rehman, F., Fayyaz, M.A.B., Ansari, A.R., and Nawaz, R. 2023. Blockchain enabled data security in vehicular networks. Science Reports, vol. 13, p. 4412. doi.org/10.1038/s41598-023-31442-w
STLPartners. 2021. Digital health: Five blockchain use cases. https://stlpartners.com/articles/digital-health/5-blockchainhealthcare-use-cases
Symons, P. 2017. Blockchain settlement: regulation, innovation and application; regulatory and legal aspects related to the use of distributed ledger technology in post-trade settlement. Slaughter and May and Euroclear. https://www.euroclear. com/newsandinsights/en/Format/Whitepapers-Reports/ BlockchainSettlement.html
Thurman, A. 2021. A beginner’s guide to raising capital using cryptocurrencies. https://cointelegraph.com/funding-forbeginners/ico-101-a-beginners-guide-to-raising-capital-usingcryptocurrencies
Touron, M. 2019. Centralized vs decentralized vs distributed systems. https://berty.tech/blog/decentralized-distributedcentralized
UNCTAD (United Nations Conference On Trade and Development). 2019. Digital Economy Report 2019.Value creation and capture: Implications for developing countries https://unctad.org/system/files/official-document/der2019_ en.pdf
WEF (World Economic Forum). 2017. Digital Transformation Initiative (DTI): Mining and Metals Industry. White paper. Geneva: World Economic Forumin collaboration with Accenture. https://www.readkong.com/page/digitaltransformation-initiative-mining-and-metals-industry-5997537 Wisdomtree.com. 2019. Bitcoin vs traditional payment. https://www.wisdomtree.eu/-/media/eu-media-files/otherdocuments/research/market-insights/market-insight-bitcoin-vstraditional-payment.pdf u
Affiliation:
1Camborne School of Mines, University of Exeter, Penryn Campus, Cornwall, United Kingdom
Correspondence to:
L.W. Palmer
Email: lukewilliampalmer@hotmail.co.uk
Dates:
Received: 6 Aug. 2018
Revised: 14 Oct. 2023
Accepted: 10 Feb. 2024
Published: June 2024
How to cite: Palmer, L.W. 2024. Compositing and regularization of drillhole data for geostatistical resource estimation. Journal of the Southern African Institute of Mining and Metallurgy, vol. 124, no. 6, pp. 331–338
DOI ID:
http://dx.doi.org/10.17159/24119717/258/2024
by L.W. Palmer1
Abstract
Compositing or regularization of drillhole data is common practice in mineral resource estimation and is deemed a necessary step in producing unbiased estimates of mineral resources and reserves. Commonly, data are collected over irregular distances due to the varying relative thicknesses of lithologies drilled or sampling/assaying strategies. This necessitates data transformation to regular lengths of equal size to ensure that all data have the same sample support. However, there have been few detailed publications on the effect of this process on the composited data that are subsequently taken forward for the estimation process. In this paper, three currently available compositing methods are reviewed and the effects of inappropriate compositing methodologies presented. It is shown through a case study that compositing samples to different lengths leads to changes in the average and variance of the grades in the drillcores in the dataset, which will impact the final estimated value. These differences are exacerbated by breaks or gaps in data where, for a variety of reasons, there has been no data collection or data have been lost. The importance of appropriately treating blank and zero data is also presented. Globally, these differences might be minimal, but locally may be substantial, affecting the efficiency of the estimation and subsequent use of the results in, for example, mine planning and reconciliation. Further detailed investigation of compositing practices is required if the full implications of compositing are to be understood and any induced bias effectively defined.
Keywords
resource estimation, geostatistics, compositing, regularization, drillhole data, bias, uncertainty
Introduction
Data gathered from drilling are extensively used within the mining industry for the purpose of resource estimation and, ultimately, resource delineation. As part of the standard data-processing procedure for resource estimation (or grade-control purposes), it is common practice to composite or regularize multiple samples together and take the results forward for further analysis (Rossi and Deutsch, 2013). The purpose of compositing is to ensure that all samples have the same weighting, so further analyses are not affected by bias. Compositing is a linear-weighted averaging approach, where the sum of the product of the lengths and the measured variables is divided by the total length of all samples considered in calculating a composite value.
Regularization is performed whether solid core, for example, from diamond coring (DC), or chips from rotary air blast (RAB) or reverse circulation (RC) are recovered. Drillholes are commonly non-vertical, to ensure that the best possible intercept with lithologies and/or mineralization is achieved (Biel et al., 2010; Lomberg, 2014; Moorhead et al., 2001). The compositing method may be adjusted to take this into account.
Sampling of core or chips for assay is a complex process. The number and nature of samples taken depends on several factors, including the nature of the geology, the drilling method, the location of the deposit, the cost of obtaining reliable assay results, and the degree of compliance of the project with international reporting codes, such as the SAMREC (2016), JORC (2012), and CIM (2010) codes. If the geology is highly complex, then more samples need to be taken spatially to elucidate the geological picture. If the drilling method is more basic (chip recovery) or poorly executed, sample collection will be less efficient. If the project is located in a challenging or remote environment, the cost of sending samples for assaying increases, which makes it likely that fewer samples will be analysed. If the project is to be compliant with JORC or other reporting codes, then more, and higher quality, samples are likely to be taken.
To illustrate some of the potential issues that poor treatment of drillhole data can cause, a hypothetical example is presented (Figure 1). Here, drilling was conducted across a zone of interest, the results of which will subsequently be used to best delineate a mineralized zone in a gold deposit. Each sample was analysed for gold and arsenic. These two variables, Au (g/t) and As (%), form the basis of the resource estimation.
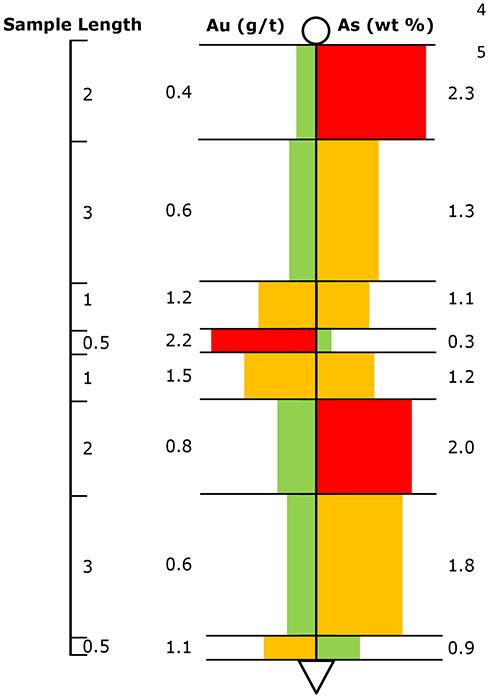
Arsenic has no economic value, but could affect downstream processing efficiency and, ultimately, the value of the project. Higher density sampling was conducted across the area of highest gold mineralization.
The arithmetic average of the gold assay values data is 1.05 g/t, compared with the length-weighted composite value of 0.80 g/t. This shows that the original arithmetic average considerably over-valued the Au grade for this drillhole. In the biased arithmetic average, all samples are equally weighted, irrespective of the length that the sample assay represents; in calculating the average, the 0.5 m sample at 2 g/t receives the same weighting as the 3 m sample at 0.6 g/t. The arithmetic average ignores representivity of the sample, resulting in this grade difference. A composite sample is a more representative value of the grade, and is obtained by weighting every sample assay according to the length it represents. Considering the As data, we see that the arithmetic average under-estimates the actual As levels by selectively over-sampling specific targets where lower values of As are found: the arithmetic average of the As sample data is 1.36% and the length-weighted average is 1.60%.
It is known that the variance of a grade variable decreases as the sample support increases, which is a derivation of Krige’s relationship (Krige, 1951). This is known as the volume-variance relationship, or dispersion variance, and is used in the operation of estimators that make use of the change of support rule, the most common being uniform conditioning (Abzalov, 2014; Chiles and Delfiner, 2012) and its derivatives (Emery, 2008). The volumevariance relationship has also been used as a tool for mine planning (Parker, 1979) and to analyse the variance associated with blending of different size stockpiles (Marques and Costa, 2014).
Previous studies have empirically shown (Figure 2) that as the sample support (size and shape) increases, the variance of data decreases, which causes a corresponding decrease in the variogram sill-and-nugget effect (Clark, 1979). This is highly significant because the variogram is the key tool in the application of geostatistical estimation techniques, such as kriging: any change
Experimental Semi-Variogram
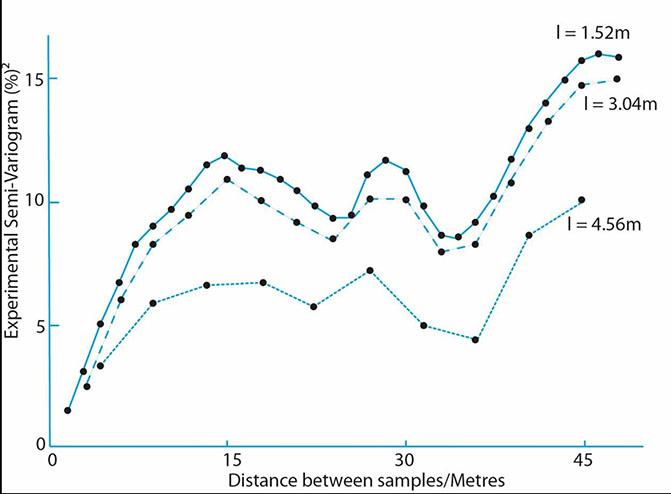
Distance between samples/Metres
to the variogram used will have an impact on the results produced, whether considering estimating (Isaaks and Srivastava, 1989) or simulating (Palmer and Glass, 2014) using the data.
Current published best practice on compositing focuses on the methodology (Noble, 2011; Rossi and Deutsch, 2013; Sinclair and Blackwell, 2002), rather than on how a suitable length for compositing should be selected that does not bias the variance of the data or the variography. An additional important consideration is whether there are unsampled locations present within a database, which can occur for a variety of reasons. Gaps in data can be produced as part of data-cleaning exercises; for example, by removal of data deemed to be spurious during data validation (Rossi and Deutsch, 2013). More commonly, however, the database made available for resource estimation will already contain gaps that have to be accounted for and accordingly treated by the resource estimation team.
Gaps in databases can take two forms: blanks (no value or assay recorded, and treated as a missing value) or true zeros (value or assay recorded, but assigned zero because it is a true zero assay value). Different types of gaps need to be treated in different ways during resource estimation; however, the nature of gaps in sample records is not always apparent. Blanks can be caused by losses in sample during drilling, resulting in no sample being collected or not enough sample being collected for analysis to be conducted. Samples can be lost during analysis or during the digitization of old data, resulting in blanks. Zero values are normally the result of analysis being completed; however, values reporting below the analytical detection limit are also often designated as zero.
In this study, a review is conducted of the contemporary practice of regularization, followed by a short investigation, using real data, into the effect that regularization can have on data variability. The effects on key statistical parameters, such as the average, variance, and variogram, of the composite data are described. The results are discussed with relevance to published recommended practice in the estimation of mineral resources and reserves.
Best practice details three main procedures for producing composites of drillhole data: downhole, by bench, or by domain boundaries (Rossi and Deutsch, 2013; Sinclair and Blackwell, 2002).
Downhole compositing involves splitting the data into regular lengths based on the true length of the sample, regardless of orientation (Figure 3, Case A). This is the most commonly used
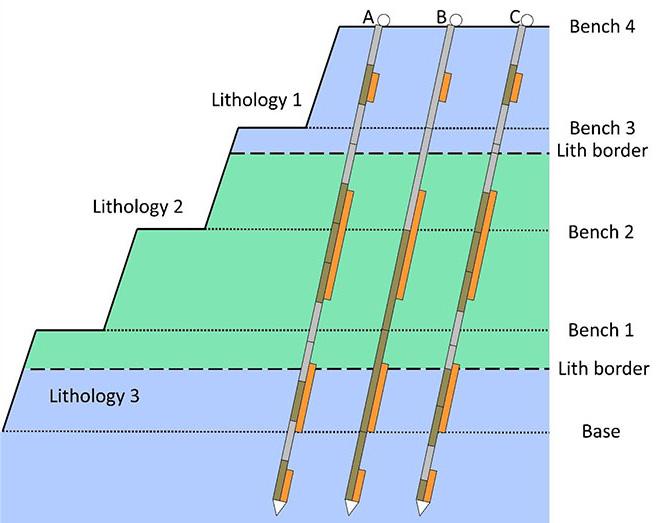
method of regularization and is appropriate in most scenarios, especially when drillholes have been orientated in multiple directions and/or the future bench height is unknown.
Composites are generally calculated using the bench method in open-pit scenarios when the drilling is nearly vertical (Rossi and Deutsch, 2013). Here, the tops and bottoms of benches are defined and the assay values are averaged into these lengths on a lengthweighted basis, regardless of the true length and orientation of the drillhole (Figure 3, Case B). In-pit drilling in more mature mining projects is often vertical, as, by this time, the nature of the geology is fairly well understood and oriented core is an unnecessary complication. Vertical drilling can be used in other circumstances where it is particularly relevant to understand grade by depth in less well-understood deposits.
Regularising to the same height as the blocks can be unsatisfactory in cases where the height of the blocks is unknown or the resource estimator wishes for the block size to be optimized during the kriging parameter optimization process, through methodologies such as Qualitative Kriging Neighbourhood Analysis QKNA (Vann et al., 2003). Compositing to domain boundaries can be performed using either the downhole or bench method, and can be performed earlier in the estimation process, so each geospatial domain taken forward will have its own set of composited samples (Figure 3, Case C). This has the advantage that it becomes apparent early in the data-validation process whether a sample is inside or outside a domain; if the assignment seems inappropriate, it can be adjusted. Difficulties can be encountered if very narrow or small domains are used with a relatively long compositing length, resulting in few samples remaining in the domain for estimation (Dominy et al., 2013).
The length to which samples should be regularized is not so obvious from a review of the literature. It is common practice (although not necessarily best practice) to composite samples to the same height as the blocks for which the estimate will be produced, when this height is known (Rossi and Deutsch, 2013). Theory states that this should be the case, but, in practice, this will have little impact, as the following example illustrates.
A core of 15 cm diameter and 9 m in length was regularized to produce estimates of a 25 m × 25 m × 15 m regular block, assuming a density of 2.75 t/m3. The volume of this block is 9375 m3 and the mass is 25 781.25 t. The practitioner has a choice of regularising
to 15 m (the same as the block height) or to 3 m (which is more representative of the initial sample spacing). If the former is used, the resulting volume of the regularized sample is 0.265 m3 (pr2h = 3.14 × (0.075 m)2 × 15 m); in the latter case, three samples of 0.053 m3 are generated (pr2h = 3.14 × (0.075 m)2 × 3 m), giving a total volume 0.159 m3. The masses of the two sets are 0.729 t and 0.437 t, respectively. The block volume/core volume ratios are 2.83 × 10⁻⁵ or 5.65 × 10⁻⁵ for the 15 m and 3 m composite lengths, respectively. It can be seen that regularising the samples to 15 m does not greatly improved the disparity between the sample and block volumes, but may result in significant smoothing of data and therefore affect the parameters of the variogram: the nugget effect will be lower and the ranges longer, leading to smoothed estimates.
In recent mining and exploration, drill-core sampling is regularly performed down the hole, resulting in little fluctuation in the sample support when different compositing lengths are applied. This is often not the case in many older and historic datasets, where sampling was conducted in a more haphazard fashion, with many changes in drilling type and sampling methods present across an area of interest. In some cases, such as sampling chips from RC or RAB drilling, a single sample might represent an entire drillhole, which is a challenge for the production of resource estimates.
At the bottom of the drillhole (and in gaps in the data), a decision has to be taken whether the last part of sample remaining after compositing has been performed should be kept or discarded (see Figure 4). As with other parts of compositing, little has been concluded concerning the best method to employ (Coombes, 2008). A general rule-of-thumb is to use half the composite length as a cut-off, so if samples are regularized to 3 m, a sample of 1.5 m will be kept and anything else discarded. This can cause problems when drilling stops due to lost core associated with weak ground conditions and corresponding low recovery of core. Weak ground conditions can often be encountered alongside mineralization in deposits such as Mississippi Valley-type lead-zinc and epithermal gold deposits (Robb, 2005; Stevens, 2012), resulting in some sources keeping the sample, even if a low percentage of the composite length remains due to the correlation between gaps in the drillcore and grade (Annels and Dominy, 2003).
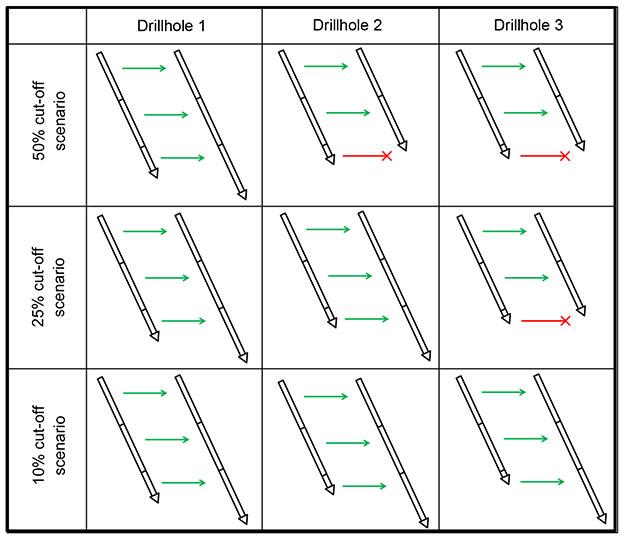
The effects of compositing to different sample supports was investigated in this case study using data for samples collected using DC drilling from a kaolinized granite in Cornwall, Southwest England. Bristow (1993) and Palmer and Glass (2015) provide overviews of the history and genesis of the deposit. Drilling was performed as part of the standard orebody delineation and resource-estimation procedures across the kaolinized mass of the St Austell granite.
DC drilling was employed. The samples were analysed using X-ray fluorescence spectroscopy for elemental Fe, which occurs in minor to trace amounts. Data from eight drillholes were compiled to study the effects of compositing in detail. The most common sample length in the data was 3 m, and ranging between 2 m and 5 m. There are gaps present in the data ranging in length from 1 m to 5 m. The drillholes ranged in depth from 18 m to 40 m. Regularization was performed on each drillhole to a range of lengths, from 50 cm to 20 m. The average (arithmetic mean) and variance of the resulting data were calculated for individual composites in the drillcores and the dataset as a whole.
The statistics for the Fe variable are presented in Table I, along with the original sample lengths present in the data. From a comparison between the arithmetic average of the raw data and the length-weighted average, it can be seen that the sampling generally overestimated the Fe%, relative to the unbiased average. This is unsurprising. Although Fe is not a target element, understanding its concentration in the granite mass is important for process-control purposes, and was thus a focus of sampling effort. For three (DC01, DC07, and DC08) of the eight individual drillholes, the arithmetic average produces a lower estimate of Fe% than the composite Fe%; in the remaining five cases (DC02, DC03, DC04, DC05, and DC06), this biased estimate is higher than the composite Fe%. From interpretation of Krige’s Law, it is understood that the variance of data would decrease as bigger composites are produced, whilst the average remains constant. However, it can be seen that this is not always the case (Figures 5 and 6), especially when drillcores are considered, as is the case here. Most drillholes clearly exhibited the expected downward trend in variance, but drillhole DC03 showed the reverse pattern, with the variance increasing as composite length increased. The most likely cause of this is the clear grade trend seen in this drillhole, where grade generally increased from 0.86% Fe to 5.39% Fe down the hole over six samples. When the sample was composited to increasingly longer lengths, increasingly different
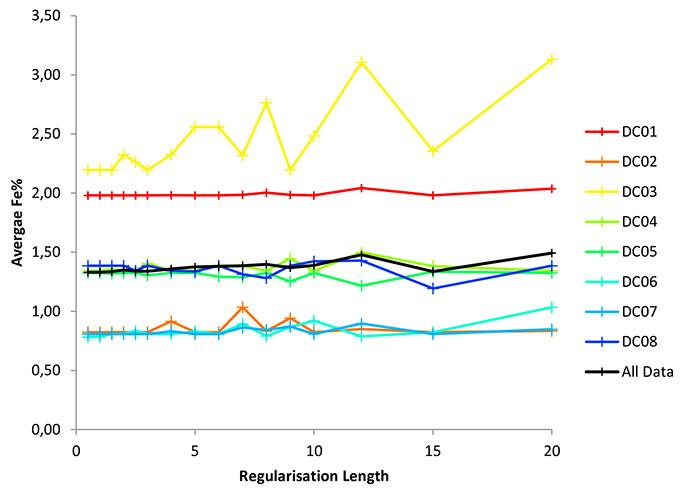
5—Change of average Fe (%) for eight drillholes holes for compositing lengths between 0.5 m and 20 m
samples were brought into contact, thereby increasing the variance. The data here originate from the same geological unit (a kaolinized granite), but this effect could also have been caused by different geological units becoming into contact. This compositing process can thus be seen as a kind of moving-average estimation, with an increasing window size.
Within the general downward trend of the variance that most drillholes display, there are composite lengths that exhibit relatively low variance compared with the surrounding values. This relatively low variance appears to correlate with multiples of the most common composite lengths in the original data; in this case, 3 m. Not all drillholes exhibit this, however, and the relatively large change in variance in DC03 (Figure 6) significantly differs from the overall pattern.
The directional (down-hole) semi-variogram produced from the data regularized to different lengths (Figure 7) displays the predicted pattern. The shorter composite lengths have a lower nugget effect due to more samples with the same grade coming into conjunction as the pre-existing samples are divided. The longer composite lengths have a generally lower sill, although the picture is more complex due to the reduction in sample pairs (Figure 7). The general shape of the variogram is repeated in composite lengths below 4 m and follows a similar pattern above 4 m, but presents a more complex picture with the 5 m and 11 m lengths all having a
Raw average and raw variance are the arithmetic mean and the sample variance, respectively, of the data prior to regularization, excluding blank values. The number of samples is the number of individual assay values in each drillhole, including blanks prior to regularization
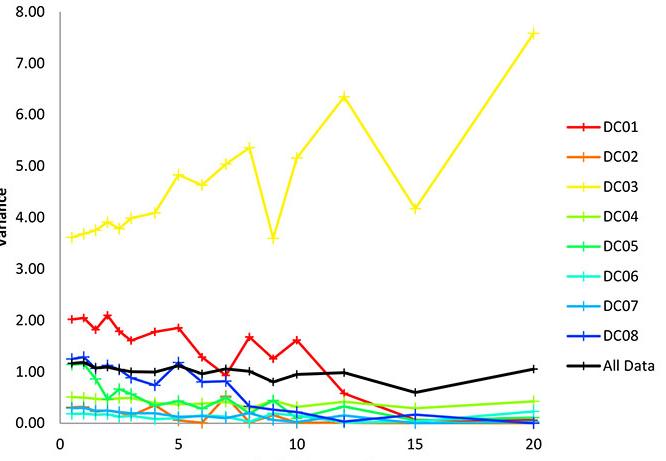
Regularization Length
similar sill to those of the shortest composite lengths of 0.5 m and 1 m. Owing to the short nature of the drillholes, long regularization lengths would not normally be applied (unless they are necessary to conform to bench or block heights) (Clark 1979), but are included here to give a complete picture of the variogram behaviour if long composites are applied. The composite lengths of 12 m and 15 m are made up of four and five points, respectively, which would not normally be used for modelling due to lack of data, and thus losing coherency. Nevertheless, these provide useful illustrations of the effects of applying too great a composite length.
This analysis indicates that it is not readily apparent which composite length to select. If a shorter length is used, then the variance will be overall artificially increased by the increasing chance of differing values coming into contact due to the splitting of samples. At the same time, the nugget effect will decrease because samples split due to the regularization process will have zero variance between them, thereby decreasing the variance at small distances and hence the nugget effect. However, if a longer length is used, detail is lost and the variances decreases. Identifying a stable medium between these extremes is not simple and requires careful consideration by the practitioner.
The drillhole data used in these analyses contained numerous blanks, where sample had not been collected or, if collected, not analysed. The dataset contained 72 assays, with 15 blanks contained
within these analysed samples. The nature and reason for observing blanks is not of interest for the purpose of this study; however, identifying the true reason for blanks in data, as either lack of grade or lack of sample, is key for successful mineral resource estimation. A separate analysis was conducted to investigate the effect that misapplication of treating breaks has on the regularization process. Gaps in the dataset, previously treated as blanks (lack of sample) during the regularization process, were instead treated as zeros (lack of grade in analysed sample) to illustrate the effect of changing this classification (Figure 8). As expected, the average is significantly reduced by the change of classification of blanks to zeros, represented by the negative movement in Figure 8(a). The variance (Figure 8(b)) is also affected by changing the zeros in the data to blanks, although the picture is more complex. The broad pattern is that the variance of the data increased, which is expected due to a lot of the same (zero) values having been removed. However, some drillholes (for example, DC05) displayed the opposite pattern and others (DC02 and DC08) exhibited variances both above and below that of the initial data. Any change to the variance will impact the variogram and thus any geostatistical procedure that follows.
The case study confirms the initial premise that it is probable that unintentional bias is present in drilling campaigns, even with best practice sampling and assaying procedures, and irrespective of the presence or absence of any unavoidable problems associated with sampling procedures. Regardless of whether a particular variable is targeted by the sampling/drilling regime, bias may be produced. Bias can be overcome by the drillcore regularization process, but further bias many be introduced if the full effects of compositing are not understood. Whilst Krige’s Law theoretically explains the changes seen in the variance between different regularization lengths, it does not explain the full picture when real data are used. Drillhole DC03 is an example of this, where the variance increased as composite length increased (although, as a single drillhole, it is important not to read too much into this result). Effects like these could be taken to result from domaining issues, although the data used here was sourced from a single geological domain, so this is not considered a cause. Even within the general pattern of decreasing variance with increasing composite length, the pattern is more complex, with particular lengths that demonstrate relatively lower variances.
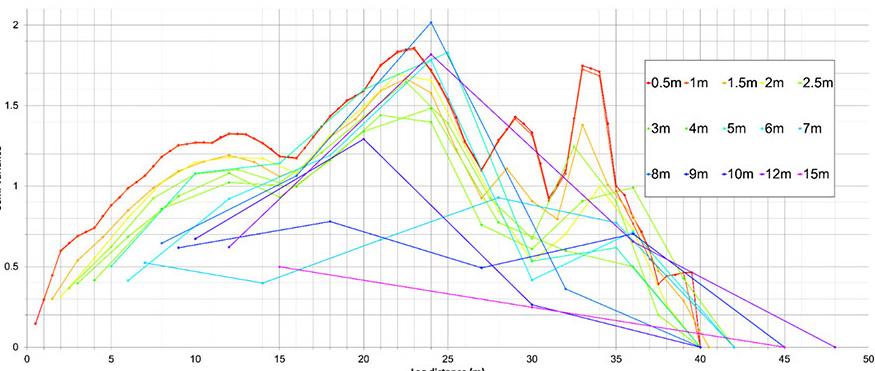
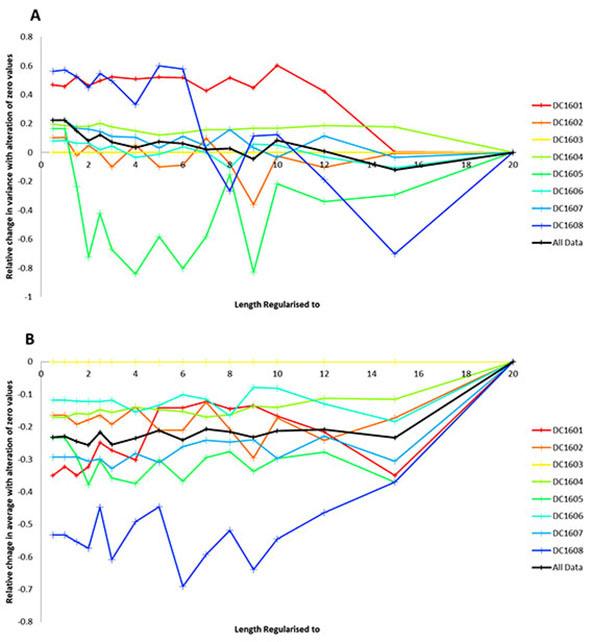
Figure 8—Illustration of the effect of misapplication of zero values on the average (A) and variance (B). Gaps in the data were initially treated as zero values (the correct interpretation) but were subsequently treated as blanks (data not presented) and the relative difference calculated
Globally, the bias produced by regularization may be negligible; however, if small changes in variance are concentrated in a particular area of a deposit, this could lead to significant divergence of local estimates. This is significant for purposes of local grade control or reconciliation between production and reserve data. Ensuring that blanks and zero values are properly assigned is another key stage of data processing. It is shown (Figure 8) that if zeros (lost core, non-sampled, etc.) are treated as blanks, then this greatly decreases the average of the data and can change the variance.
The difference seen in the variograms, which are a key geostatistical tool, produced at different composite lengths presents a complex and unexpected result. Overall, the pattern follows that predicted by Clark (1979), where the longer compositing lengths have lower variances and higher nuggets, but some lengths do not fit this pattern, with longer lengths and actually displaying a higher variance. This makes it more difficult to select an appropriate length to which to regularize, when the basic rules of regularization seem not to hold true. This study highlights that a more detailed investigation into the effects of regularization on variography—and, ultimately, the estimate produced—is undoubtedly warranted, if a best practice solution is to be determined.
This study showed that there has been little recent interest in the process of optimising regularization of drillhole data for the mining industry, despite it long being known that regularization can induce bias into the estimate, by changes to the average, variance, and, ultimately, the variogram of data produced. These changes may be small, but locally significant, resulting in bias in estimates of mineral resources and reserves.
Recent academic and technical focus has mainly been on the practice of regularization, rather than best practice, resulting in a lack of guidance to the practitioner. The effects of potential bias regularization on geostatistical estimates requires further study, with focus on developing an accepted best practice or guidance in what is good practice under certain circumstances, considering the variety of ore deposits, styles of mineralization, and the demands of the regulatory framework of mineral resource estimation.
References
Abzalov, M.Z. 2014. Localized uniform conditioning (LUC): method and application case studies. Journal of Southern African Institute of Mining and Metallurgy, vol. 114, pp. 205–211. http://www.scielo.org.za/scielo.php?script=sci_ arttext&pid=S2225-62532014000300009
Annels, A.E. and Dominy, S.C. 2003. Core recovery and quality: important factors in mineral resource estimation. Applied Earth Science, vol. 112, no. 3, pp. 305–312. http://www.tandfonline. com/doi/pdf/10.1179/037174503225011306
Biel, C., Subias, I., Fanlo, I., Mateo, E., and Acevedo, R.D. 2010. The Arroyo Rojo volcanic-hosted massive sulphide deposit (Tierra del Fuego, southernmost Argentina): geology, mineralogy, petrography and mineral chemistry. Revista Mexicana de Ciencias Geológicas, vol. 27, no. 1, pp. 84–96. http://satori. geociencias.unam.mx/27-1/%2807%29Biel.pdf
Bristow, C.M. 1993. The genesis of the china clays of south-west England – a multi-stage story. Kaolin Genesis and Utilization Murray, H.M., Bundy, W.M., and Harvey, C. C. (ed.). Special Publication, Vol. 1. Clay Minerals Society of America, Chantilly, VA. pp. 171–204. http://geoscienceworld.org/content/kaolingenesis-and-utilization
Chiles, J.-P. and Delfiner, R. 2012. Geostatistics: Modelling Spatial Uncertainty, 2nd edn. Wiley, NJ.
CIM. 2014. CIM Definition of Standards on Mineral Resources and Mineral Reserves. Canadian Institute of Mining, Metallurgy and Petroleum, Quebec, Canada. http://www.crirsco.com/docs/ cim_definition_standards_20142.pdf
Coombes, J. 2008. The Art and Science of Resource Estimation: A Practical Guide for Geologists and Engineers. Coombes Capability, Perth.
Clark, I. 1979. Practical Geostatistics. Elsevier Applied Science Publishers, London.
Dominy, S.C., Annels, A.E., Platten, I.M., and Raine, M.D. 2003. A review of problems and challenges in the resource estimation of high nugget-effect lode-gold deposits. Proceedings 5th International Mining Geology Conference. Australasian Institute of Mining and Metallurgy, Melbourne.
Emery, X. 2008. Change of support for estimating local block grade distributions. Mathematical Geosciences, vol. 40, pp. 271–688. https://link.springer.com/article/10.1007/s11004-008-9148-6
Krige, D. 1951. A statistical approach to some basic mine valuation problems on the Witwatersrand. Journal of the Chemical, Metallurgical and Mining Society of South Africa, vol. 52, no. 6, pp. 119–139.
Isaaks, E.H. and Srivastava, R.M. 1989. Applied Geostatistics. Oxford University Press, New York.
JORC. 2012. Australian Code for the Reporting of Exploration Results, Mineral Resources and Ore Reserves (The JORC Code) The Joint Ore Reserves Committee of the Australian Institute of Mining and Metallurgy, Australian Institute of Geoscientists and Minerals Council of Australia. http://www.jorc.org/docs/ JORC_code_2012.pdf
Lomberg, K. 2014. Best practice sampling methods, assay techniques, and quality control with reference to the platinum group elements (PGEs). Journal of Southern African Institute of Mining and Metallurgy, vol. 114, pp. 53–62. http://www.saimm. co.za/Journal/v114n01p053.pdf
Marques, D.M. and Costa, J.F. 2014. Analysis of the dispersion variance using geostatistical simulation and blending piles. Journal of Southern African Institute of Mining and Metallurgy, vol 114, pp. 599–604. http://www.scielo.org.za/pdf/jsaimm/ v114n8/09.pdf
Moorhead, C.F., Dunham, P.B., Eastwood, G.J., and Leckie, J.F. 2001. Cadia Hill: from discovery to a measured resource –a case study. Mineral Resource and Ore Reserve Estimation - The AusIMM Guide to Good Practice, Edwards, A.C. (ed.). Australasian Institute of Mining and Metallurgy, Victoria. Noble, A.C. 2011. Mineral resource estimation. SME Mining Engineering Handbook, 3rd edition, Darling, P. (ed.). Society for Mining, Metallurgy and Exploration, Englewood, CO.
Parker, H. 1979. Geostatistics: the volume-variance relationship –a useful tool for mine planning. Engineering and Mining Journal, vol. 180, no. 1, pp. 106–123.
Palmer, L.W. and Glass, H.J. 2014. Risk associated with rock type prediction using simulation techniques. Proceedings of the Ninth International Mining Geology Conference, Australasian Institute of Mining and Metallurgy, Victoria. pp. 217–227.
Palmer, L.W. and Glass, H.J. 2015. Comparison of grade modelling methods at Blackpool China Pit, Cornwall. Geoscience in SouthWest England, vol. 13, part 4, pp. 454–458. http://www.ussher. org.uk/journal/00s/2015/11%20Palmer%20&%20Glass%20454458%201.pdf
Robb, L. 2005. Introduction to Ore-forming Processes. Blackwell Publishing, Oxford.
Rossi, M.E. and Deutsch, C.V. 2013. Mineral Resource Estimation Springer, New York.
SAMREC. 2016. The South African Code for Reporting of Exploration Results, Mineral Resources and Mineral Reserves (the SAMREC Code). 2007 Edition as amended July 2009. South African Mineral Resource Committee. https://www.samcode.co.za/ codes/category/8-reporting-codes?download=120:samrecf
Sinclair, A.J. and Blackwell, G.H. 2002. Applied Mineral Inventory Estimation. Cambridge University Press, Cambridge.
Stevens, R. 2012. Mineral Exploration and Mining Essentials. Pakawau GeoManagement, Port Coquitlam, British Coloumbia.
Vann, J., Jackson, S. and Bertoli, O. 2003. Quantitative Kriging Neighbourhood Analysis for the mining geologist - a description of the method with worked case examples. Proceedings of the Fifth International Mining Geology Conference. Australasian Institute of Mining and Metallurgy, Victoria. pp. 215–223. https://www.ausimm.com.au/publications/ epublication.aspx?ID=1311
A SAMCODES profile has been established on LinkedIn, pay a visit to get up to speed with current developments. https://www.linkedin.com/company/samcodessa/
SAMCODES App

The App is in use and the quizzes are current and available for upskilling and comments will also be appreciated.
A new progressive web app (PWA) functionality is being incorporated into the app to activate notifications to users.
The SAMESG Quarterly Quiz is NOW live! Test your SAMESG knowledge and challenge yourself with our latest quiz, available exclusively on the SAMCODES app. Check out our SAMCODES App User Guide for step-by-step instructions: https://lnkd.in/emT8976z
Training programmes
An advanced SAMREC/SAMVAL workshop is planned and timelines will be confirmed in due course.
The SSC Sub-committee for ESG Integration in the SAMCODES will present updates during a slot for the SAIMM “ESG in the Minerals Industry” conference to be held in October 2024. Committee updates
Continuation of incorporation of ESG factors into SAMCODES and recommendations for additions into SAMREC Table 1 and SAMVAL


Liaison with IMVAL for planning of conferences and alignment
for planning of conferences and alignment
SAMOG Code updates continued and will be finalised this year
SAMOG Code updates continued and will be finalised this year


Updates to SAMESG Guidelines 2.0 and ESG definitions guide is ongoing and feedback is expected by August
Updates to SAMESG Guidelines 2.0 and ESG definitions guide is ongoing and feedback is expected by August
Progress is being made on the update of the Industrial Minerals Guidelines and a working document will be released for comment
Progress is being made on the update of the Industrial Minerals Guidelines and a working document will be released for comment
The ESG Working Group is finalising work on incorporating ESG recommendations into the SAMCODES. A feedback session on ESG matters will be hosted later this year after consultations.
The ESG Working Group is finalising work on incorporating ESG recommendations into the SAMCODES. A feedback session on ESG matters will be hosted later this year after consultations.
The Chinese have submitted their Code for approval at CRIRSCO. The SSC is watching this exciting development closely.
The Chinese have submitted their Code for approval at CRIRSCO. The SSC is watching this exciting development closely.
The MRMR conference is planned for October 2024 in Vancouver and all are encouraged to participate.
The MRMR conference is planned for October 2024 in Vancouver and all are encouraged to participate.
The JSE has proposed amendments for simplification to the Section 12 Listing Requirements that may affect the JSE Reader’s Panel The pertinent changes under consideration relate to Category 1 CPRs and the role of the Reader’s Panel Stakeholders have submitted the initial comments and the JSE is currently reviewing these. This process is expected to extend into the new year following the consultations.
The JSE has proposed amendments for simplification to the Section 12 Listing Requirements that may affect the JSE Reader’s Panel The pertinent changes under consideration relate to Category 1 CPRs and the role of the Reader’s Panel Stakeholders have submitted the initial comments and the JSE is currently reviewing these. This process is expected to extend into the new year following the consultations.
Affiliation:
1University of Free State, Institute for Groundwater Studies, Bloemfontein, South Africa
2University of the Witwatersrand, Johannesburg, South Africa
3University of Free State, Geology Department, Bloemfontein, South Africa
Correspondence to: L.S. Mokhahlane
Email: sehai.mokhahlane@wits.ac.za
Dates:
Received: 12 Dec. 2023
Revised: 19 Feb. 2024
Accepted: 5 Apr. 2024
Published: June 2024
How to cite:
Chiweshe, T.T., Mokhahlane, L.S., and Welman-Purchase, M. 2024. Kinetic study of reaction formation of phosphate products from thermal dissolution of wolframite using fusion technique. Journal of the Southern African Institute of Mining and Metallurgy, vol. 124, no. 6. pp. 339–348
DOI ID:
http://dx.doi.org/10.17159/24119717/3215/2024
ORCID:
T.T. Chiweshe
https://orcid.org/0000-0002-9144164X
L.S. Mokhahlane
https://orcid.org/0000-0001-7833042X
M. Welman-Purchase
https://orcid.org/0000-0002-75882728
by T.T. Chiweshe1, L.S. Mokhahlane2, and M. Welman-Purchase3
Abstract
This study examined an alternative technique of extracting tungsten from wolframite ore using a fusion method with ammonium phosphate salt. Current techniques use alkali salts to decompose tungsten ores and use various purification methods to produce ammonium paratungstate, which is a key intermediate precursor in the extraction of tungsten. In this study, a two-step extraction process, which involves thermal decomposition of the ore using fusion and a separation stage, is examined. The novelty of this technique is the ability to completely decompose wolframite ore and form an unstable tungsten oxide phosphate (WO2(PO3)2) compound. The instability of WO2(PO3)2 in deionized water enables selective isolation of tungsten as insoluble precipitates of WO3 and WO2. The decomposition reaction of WO2(PO3)2 is influenced by the presence of oxygen and determined to be first order under ambient conditions. Scanning electron micrographs and X-ray diffraction analysis showed above 80% of the tungsten precipitated compared with the amount that remained in the filtrate solution.
Keywords tungsten, tungsten oxide phosphate, wolframite ore, fusion extraction, ammonium phosphate flux
Introduction
Tungsten is commonly found in nature in the form of tungstate minerals, which are iron–manganese tungstate (wolframite) and calcium tungstate (scheelite). Wolframite [(Fe, Mn)WO4] and scheelite (CaWO4) tungstates are the major sources of tungsten that are of economic importance. Tungsten is widely used in various applications due to its excellent thermal and electrical conductivity, high melting point, hardness, and remarkable strength, such as in steel alloys, electrical wires, light bulb filaments, missile components, and armour-piercing projectiles (aerospace and defence industries) (Han et al., 2021). In South Africa, tungsten occurs in the large Riviera deposits situated in Namaqua Metamorphic Complex situated in the Northern Cape Province (Rozendaal et al., 1994). The estimated ore reserve in this area is ~ 46 Mt, with an average grade of at least 0.22% WO3 (Walker, 1994). China is the major global producer of tungsten, accounting for more than 82%; Vietnam, Russia, Mongolia, Bolivia, Austria, and Rwanda are amongst other top producers.
Tungsten ore is extracted using underground or open-pit mining techniques, depending on the geology and mineralogy of the ore deposits. The ore is usually crushed and ground into fine particles to liberate the tungsten-bearing particles. Beneficiation of the ore is achieved using gravity concentration, magnetic separation, and flotation methods. These processes are sometimes supplemented by other various metallurgical methods, such as leaching, roasting, and magnetic or high-tension separation to obtain clean tungsten concentrate. Leaching and roasting are the most common techniques used in the production of tungsten concentrate. The concentrate is converted to sodium tungstate (Na2WO4) solution via alkali digestion (NaOH, Na2CO3, etc.) at high temperature (Figure 1). The resultant sodium tungstate solution is then further processed to an intermediate product, ammonium paratungstate (APT), which is a precursor to the pyrometallurgical extraction of pure tungsten metal or carbide (Lassner and Schubert, 1999). Although satisfactory tungsten recovery (above 75 %) has been reported using this technique, the process is cumbersome and generates highly toxic waste products (Olayiwola et al., 2023).
Leaching remains the preferred technique for decomposing/digestion of tungsten ores, despite the high production cost involved in this process, as well as the formation of toxic waste products and other heteropolytungstates, [(AsW12O40)3−, (SiW12O40)4−, and (PW12O40)3−] ions, which contain impurities (Goddard, 1982; Lassner, 1995). Various studies have examined the use of different leaching techniques,
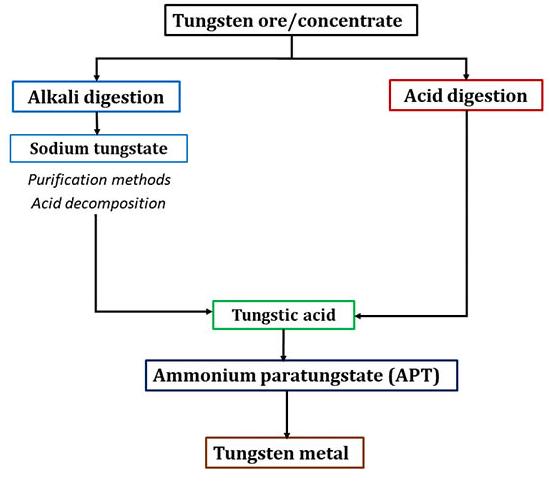
such as alkaline pressure leaching (Luo et al., 2021) and leaching by hydrodynamic and acoustic cavitation (Johansson et al., 2021). Research trends show that these leaching techniques work better with scheelite than wolframite (Gong et al., 2019). The decomposition of wolframite using these techniques is reported to be low (30%–50%) compared with scheelite ores or concentrates. However, leaching techniques that involve roasting with alkali salts are still considered better alternatives in decomposing wolframite ore (Srinivas et al., 2000).
A study carried out by Chiweshe (2019) shows a fusion technique using ammonium phosphate flux that was used to liberate tungsten from wolframite ore. Complete sample dissolution was achieved using moderate temperatures (800ºC) within minutes (~ 20 min). The most intriguing feature was the formation of tungsten oxide phosphate, (WO2(PO3)2), which was found to be unstable in air. The instability of WO2(PO3)2 was accompanied by the formation of a precipitate that was presumed to contain tungsten. This two-step dissolution technique was key in further investigating an alternative procedure for the recovery of tungsten from wolframite ore without the formation of APT. This decomposition process prompted a revisit of this study with the aim of determining the rate at which tungsten is formed, chemical composition of the products, and purity of the isolated tungsten products. The objective of this study was to critically determine factors and conditions involved in the quantitative precipitation of tungsten from wolframite ore using this fusion technique.
Experimental
Chemicals, materials, and glassware
Ammonium hydrogen phosphate, (NH4)2HPO4 and NH4H2PO4 (99%), tungsten(VI) oxide (WO3) (99%), and orthophosphoric acid (H3PO4, 98%) were purchased from Merck Chemicals. The multi-element standard (100 mg/L) was purchased from de Bruyn Spectroscopic Solutions (South Africa). The ceramic crucibles (150 mL) were purchased from Terra Nova Ceramics (South Africa). The quartz cuvettes used for ultraviolet–visible (UV–vis) spectroscopy were supplied by Lasec South Africa. Volumetric flasks were of Blaubrand type grade (A).
Description of wolframite ore
The wolframite ore sample used in this study was obtained from a mine in Namaqualand in the Northern Cape Province of South Africa. The supplied ore was crushed and milled to < 75 μm and supplied in 100 g units. The ore was used in its original state without further purification.
A Malvern Panalytical Empyrean 4kW X-ray diffractometer (XRD) with Cu-K radiation (~ 0.154 nm) in the 3.5–70° 2θ range and a Rigaku Primus IV wavelength-dispersive X-ray fluorescence (WDXRF) spectrometer were used for elemental analysis of the wolframite ore sample. A Lasec heating furnace (Laboratory and Scientific Equipment Company (Pty) Ltd) was used for sample dissolution. The resultant coloured solutions were analysed using a Varian (Cary 50) UV–vis spectrometer. pH measurements were performed using a Eutech CyberScan (pH 1500) meter. Elemental analysis of the filtrate solutions was performed using a PerkinElmer Nexion (model 2000c) inductively coupled plasma mass spectrometer (ICP-MS) using the conditions set out in Table I.
General experimental procedure: Fusion of WO3 and wolframite ore
Complete sample dissolution of WO3 and wolframite samples (1.0 g) was achieved using the fusion method described by Chiweshe (2019). The resultant melts were dissolved in deionized water and acetone. Melts dissolved in deionized water formed purple-coloured solutions whilst a purple-coloured residue formed using acetone. The coloured solutions decomposed to form a colourless solution and grey precipitate. The instability of these solutions was determined using UV–vis spectroscopy. The precipitates were collected, dried at room temperature, and analysed using scanning electron microscopy (SEM), X-ray diffraction (XRD), and TESCAN integrated mineral analyzer (TIMA) analysis. The filtrate solution was analysed for elemental content using ICPMS.
Selected inductively coupled plasma mass spectrometry operating conditions for elemental analysis using kinetic energy discrimination mode
Parameter/Component
Nebulizer gas flow
Auxiliary gas flow
Radio frequency power
Value/Type/Mode
0.96 L/min
1.2 L/min
1100 W
Plasma gas flow 15 L/min
Rinsing time
60 s
Nebulizer Meinhard concentric type A3
Spray chamber Baffled quartz cyclonic
Scanning mode
Dwell time
Replicates
Integration time
Peak hopping
50 ms
3
1 ms
Torch position X (−1.52 mm), Y (−0.33 mm), Z (0.00 mm)
Mode of operation
Standard mode/kinetic discrimination energy (KED) using helium gas
Scanning electron microscopy- energy-dispersive spectroscopy (SEM-EDS) analysis of WO3 and wolframite precipitates
SEM-EDS was used for the analysis of the WO3 and wolframite precipitates. The precipitates were mounted on stubs (Cambridge pin type, 10 mm) using double-sided carbon tape and coated with iridium (± 10 nm) using a Leica EM ACE600 coating system (Austria). Specimens were imaged and analyzed using a JSM-7800F extreme-resolution analytical field-emission SEM (JEOL, Japan).
X-ray diffraction (XRD) analysis of WO3 and wolframite precipitates
Preliminary investigation was conducted on extraction of the unstable purple compound previously identified as tungsten oxide phosphate (WO2(PO3)2) (Loopstra and Boldrini, 1966). This compound was extracted by dissolving the melt in acetone and filtering the mixture. The residue was kept under inert conditions to prevent decomposition. The pure wolframite ore and their precipitates were analysed using a Malvern Panalytical Empyrean XRD diffractometer. The samples were run on zero-background silicon wafers.
TESCAN integrated mineral analysis (TIMA) of WO3 and wolframite precipitates
TIMA was used to determine mineral phases in the isolated WO3 and wolframite precipitates. Elemental and phase maps of minerals were evaluated by EDS using a VEGA3 SEM instrument and X64 TESCAN TIMA 2.4.1. software. The beam specifications were 25 kV accelerating voltage, 43 µA emission current with a working distance of 15.00 mm, a specimen beam current of 17.68 nA, and spot size of 590.00 nm with an absorption current of < 1 pA. The mineral liberation, mineral locking, and mineral association data of minerals of interest were obtained via TIMA software version 2.9.0.
Inductively coupled plasma–mass spectrometry (ICP-MS) analysis of WO3 and wolframite filtrate solutions
Multi-element calibration standards solutions were prepared in the range of 1.0–500 µg/L using original stock solutions. The solutions were acidified using H3PO4 (1.0 mL, 98.0%), including the blank solution, and homogenized before use. Filtrate solutions of WO3 and wolframite samples were qualitatively analyzed for tungsten content and other major elements (Table II).
Results and discussion
Analysis of fusion of WO3 and wolframite ore process and comparison of products
Events leading to the precipitation of tungsten were assessed with an objective of establishing the conditions at which tungsten was isolated from wolframite ore. Pure WO3 was used as a control sample to confirm if the observed chemical changes in wolframite were the result of tungsten. The most notable chemical change (Figure 2(a)) was the formation of tungsten oxide phosphate (WO2(PO3)2) in acidic solution, which decomposed in phases to form a precipitate and colourless solution in both samples. The high acidity in both coloured solutions was attributed to the presence of phosphoric acid that formed during the thermal decomposition of ammonium phosphate salt (flux) as shown in Equation [1]:
It is worth mentioning that both melts were soluble in polar solvents and insoluble in organic solvents. Interestingly, dissolution of the melt using acetone enabled WO2(PO3)2 to be isolated as a residue. The isolated purple product subsequently decomposed, as shown in Figure 2(b), to form a brown and colourless oily liquid that left a permanent mark that never dried. This oily product was viscous and acidic (pH < 1.5), which further confirmed the instability of WO2(PO3)2 in air (oxygen). The stability of WO2(PO3)2 was established under inert conditions because no decomposition was observed.
It was evident from the above results that wolframite ore can be successfully converted into solution using ammonium phosphate fusion without requiring any additional digestion/dissolution steps. The novelty of this technique is the ability to convert tungsten into an unstable WO2(PO3)2 that decomposed to form an insoluble tungsten species. WO2(PO3)2 provided a key step by which tungsten can be selectively isolated from wolframite ore containing a variety of soluble impurities. The rate of decomposition of the purple compound was determined to evaluate the rate at which tungsten precipitated under the prevailing conditions.
Determination of rate of decomposition of WO2(PO3)2 in water
The rate of decomposition of WO2(PO3)2 was determined using UV–vis spectroscopy. The absorbance spectrum of WO2(PO3)2 (Figure 3(a)) showed three peaks with a minor peak at 395 nm, intermediate peak at 640 nm and maximum peak (λmax) at 529 nm.
Table II
Inductively coupled plasma–mass spectrometry analysis comparison of major identified elements in filtrate samples of WO3 and wolframite ore
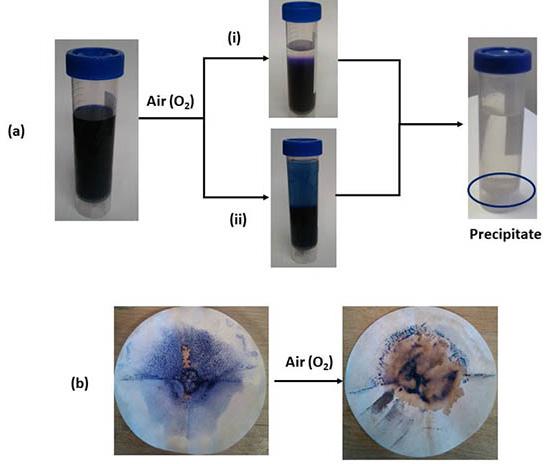
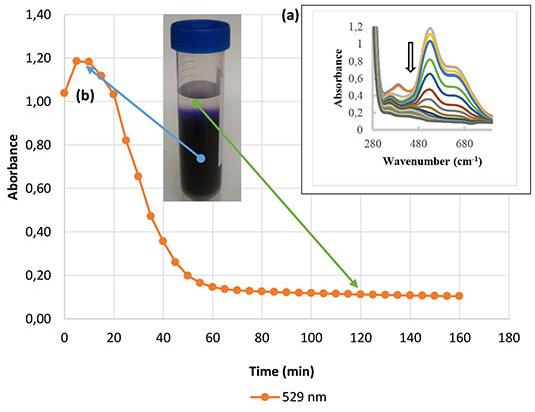
Figure 3(b) shows the decomposition of WO2(PO3)2 recorded at 5 min intervals. The increase in absorbance recorded in the first 5 min was the result of the colour development that occurred during the dissolution phase. Maximum colour intensity was attained shortly after dissolution, which was preceded by decomposition of WO2(PO3)2. The decomposition was influenced by the presence of air (oxygen) and occurred within 1 h.
The rate of decomposition of WO2(PO3)2 was studied by probing the rate of change in colour of the purple solution (WO2(PO3)2) to colourless with time at room temperature, as shown in Figure 3(b). The purple colour change of the solution followed a first-order rate law, which can be expressed by Equation [2], where A(t) is the concentration of WO2(PO3)2 at time (t), A(0) is the initial concentration at time (t0), and λ is the first-order rate constant: [2]
The half-life (t1/2) of WO2(PO3)2 is represented by Equation [3]:
Equations [2] and [3] can be simplified to give the rate of the reaction (Equation [6]):
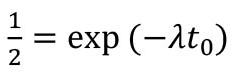
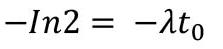
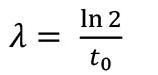
The time taken (t for the complete colour change was 60 min. It was therefore presumed that the rate of decomposition of the purple WO2(PO3)2 was 0.012 min−1
Proposed mechanism
The formation and decomposition of WO2(PO3)2 are postulated to occur according to Equations [8] and [9], respectively:
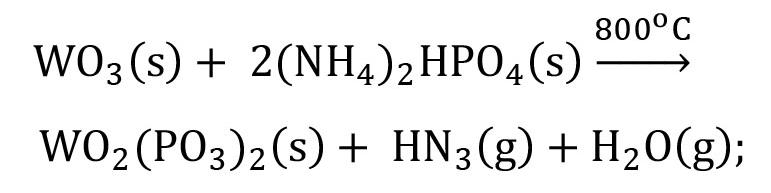
where WxOy = WO2, WO3, or W25O73)
The increase in acidity, as determined from the residue following decomposition of WO2(PO3)2, is postulated to result from the formation of orthophosphoric acid (H2PO3). The formation of H2PO3 shown Equations [1] and [8] accounts for the high acidity (pH < 1.5) of the remaining solution. The variation in the formation of tungsten products was caused by inconsistent decomposition of the WO2(PO3)2, as shown in Figure 3(a).
Characterization of isolated tungsten products
Scanning electron microscopy analysis
SEM images in Figure 4 show micro-crystalline particles of the precipitates from (a) WO3 and (b) wolframite ore analysed at 10 000 µm magnification and spatial resolution of 1 µm. Figure 6 compares the XRD pattern of the precipitates with the corresponding patterns from the ICDD-PDF 2 2021 database. The crystalline particles appeared clustered and isometric (A) whilst some (lower quantity) appeared to be tetragonal in shape (B). SEM images identified the presence of two particles (A and B) in both precipitates with similar faceted morphology. This similarity in morphology suggests the same chemical composition. The occurrence of two different particles (isometric and tetragonal) in both precipitates indicated the presence of more than one product. The EDS analysis in Table III shows elemental estimates of tungsten and impurities in both precipitates. Details of these two different compounds will be included in future studies.
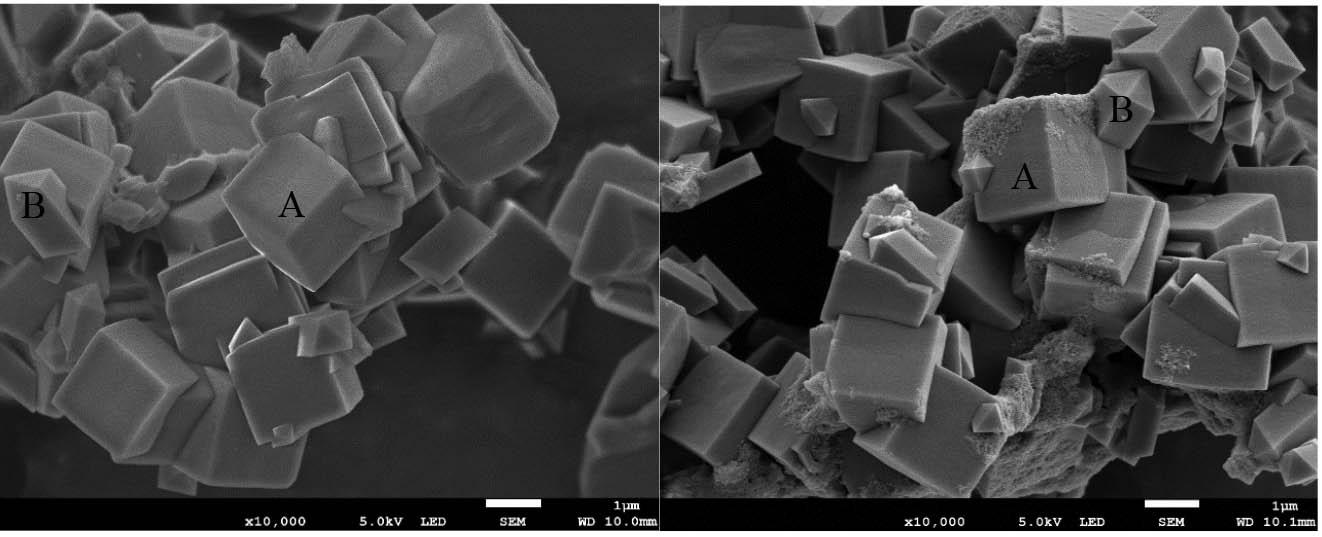
Table III
Energy-dispersive spectroscopy elemental composition of precipitates obtained from WO3 and wolframite ore
Element
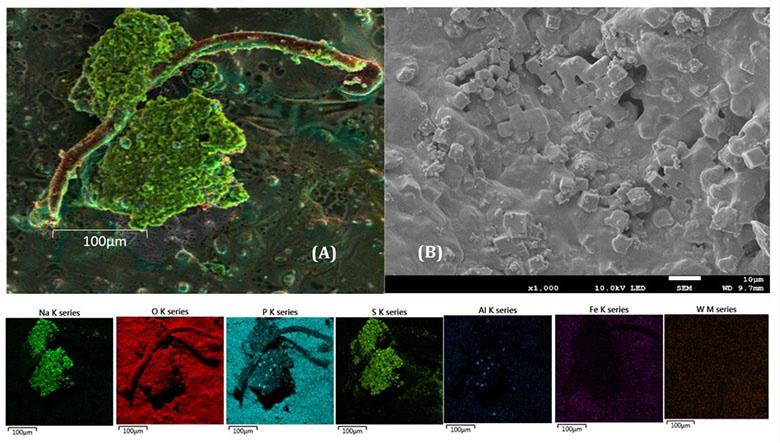
Figure 5 shows micrographs and inserts of the mapping images from the solid product isolated using acetone. The precipitate appeared molten, with visible cubic crystalline particles embedded in the product. The crystal morphology of the particles in this isolated product was the same as in the precipitate; however, the molten state of this product contained impurities that revealed differences in the elemental composition between the precipitate and the isolated solid product. Most elements identified in this molten state were soluble in water and were not present in the precipitate after the decomposition of WO2(PO3)2
X-ray diffraction analysis
Analysis of the precipitates by powder XRD was mainly conducted for phase identification and sample purity. The diffractograms displayed in Figure 6 revealed that the wolframite sample consisted of wolframite, quartz, and elsmoreite. This diffractogram had no similarity to that of the WO3 sample, which was a purchased laboratory-grade chemical. Although these differences were prominent, the profoundness of the similarity in the precipitation products, post fusion, is quite evident. This similarity suggests the presence of similar compounds within the precipitates. The ICDD 01-071-2141 (Loopstra and Boldrini, 1966) of WO3 was referenced as the monoclinic structured variant. Similar compounds
corresponding to WO2 (ICDD 01-071-0614) (Palmer and Dickens, 1979) and W25O73 (ICDD 01-071-0070) (Sundberg, 1976) were detected. Peaks corresponding to WOPO4 (ICDD 00-044-0349) (Kinomura et al., 1988) were also found, which presumably were a remnant of WO2(PO3)2.
TESCAN integrated mineral analysis
The elemental distributions of the wolframite ore sample and isolated precipitates are given in Table IV. All information pertaining to tungsten(VI) oxide (WO3) (99%) was obtained from the supplier and this chemical was not subjected to initial characterization chemical analysis. Tungsten was present in all samples, as expected, with the wolframite recording the highest tungsten content at 47.57 vol.% from the TIMA analysis (Table IV). This is the amount of tungsten in the sample as-received from the mine before any fusion process took place. XRF analyses were utilized to supplement the TIMA analyses: high levels of tungsten were also recorded for the wolframite ore, at 75.8 mass%. A sharp drop in tungsten was observed in the precipitate that formed after the wolframite underwent fusion, with 0.12 vol.% tungsten recorded (i.e., wolframite precipitate) for TIMA analysis. XRF was used to supplement the TIMA analysis and recorded 23.1 mass% tungsten for the wolframite precipitate. These two analytical
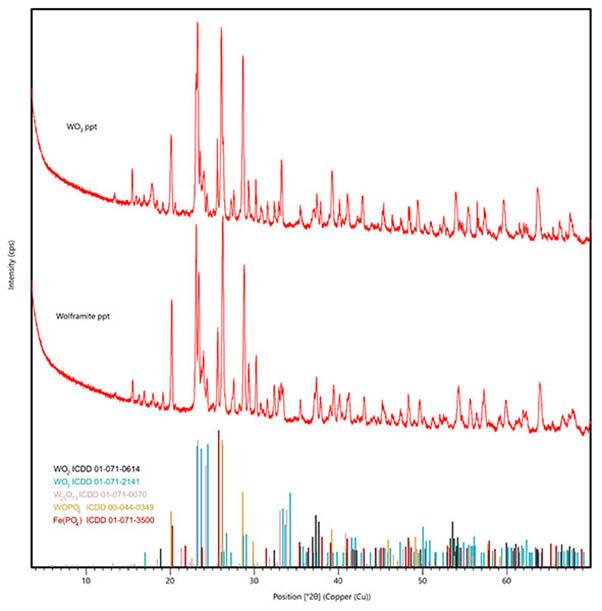
WO2 ICDD 01-071-0614
WO3 ICDD 01-071-2141
WO25 O73 ICDD 01-071-0070
WOPO4 ICDD 00-044-0349
Fe(PO4) ICDD 01-071-3500
techniques showed a sharp decrease in tungsten concentration in the precipitate, which means that the material that precipitated out of solution after the fusion process will likely have lower levels of tungsten and some tungsten will remain in solution. The tungsten(VI) oxide (WO3) (99%) from Merck Chemicals was used as a blank to ascertain the effectiveness of the fusion for a known tungsten-enriched substance (i.e., 99% WO3). Interestingly, the amounts of tungsten recorded after the fusion process from both the WO3 and wolframite precipitates were exactly 0.12 vol.%. This means that the fusion process was effective to almost the same extent and the final precipitates were similar, as seen in the XRD results, regardless of the starting material. The two precipitates contained zirconium, yttrium, silicon, and phosphorus as major elements (Table IV). Phosphorus was introduced by the flux as part of the fusion products. Zirconium and yttrium were likely introduced from the fusion process; for example, oxide refractories such as ZrO2 are normally used as crucible materials due to their excellent thermal properties, but are reported to react and dissolve into the melt during fusion (Song et al., 2022).
The primary phases contained in the samples are displayed in Table V. The wolframite ore recorded the highest wolframite content at 78.5 vol.%. There was a very small volume of wolframite observed in the wolframite precipitate, recording only 0.19 vol.%. This shows that little or no wolframite can be expected to precipitate from solution after the fusion process. However, tungsten and phosphorus compounds were determined in the precipitates from XRD results. The WO3 precipitate also recorded a wolframite concentration of 0.19 vol.%. The XRD results had two very distinct and similar patterns for the two precipitates, although the starting materials were different (i.e., laboratory-grade tungsten oxide and wolframite ore from the mine); however, XRD detected a variety of other tungsten derivative phases that may not be defined within the
[O2θ] (Copper (Cu))
TIMA analysis spectrum. The major phases that precipitated from solution were zircon and xenotime–yttrium, as seen in Table V. These elements were not present in the original materials, so could have been incorporated into the fusion process from the crucible material.
A backscattered-electron image of the wolframite ore is presented in Figure 7 (top). The scan shows that this ore was highly enriched in wolframite (almost all dominant purple colour), with small grains of quartz also present. The two precipitate scans were similar, with zircon grains that mostly had an elongated oval shape and xenotime–yttrium grains generally associated/centred around the zircon. Wolframite was minor compared with the dominant zircon and xenotime–yttrium minerals and its distribution was not associated with any grains or pattern for the two precipitates, as displayed in Figure 7 (middle and bottom). This suggests that the precipitates were composed of almost new products, regardless of the starting material, and the phases that precipitated were more associated with the elements detected from the interaction with the crucible rather than the ore itself.
Comparing the XRD and TIMA results revealed consistency of the starting materials. A large portion of the TIMA results were unclassified: these are believed to be the W–P–O compounds that are expressed in the XRD results. This corresponds with the XRF results, which also detected Fe, W, and P.
The filtrate solution that remained after isolation of the precipitate was analysed to determine the composition of the remaining elements in solution. The pH values of both filtrate solutions (pH 1.2–1.6) were adjusted to pH 4.5–5.5 prior to analysis. The acid matrix of the calibration standards was matched with those of the samples. The KED analysis technique was used for quantitative
Table IV
TESCAN integrated mineral analysis showing elemental distribution in each sample
Table V
Primary phases detected in samples from TESCAN integrated mineral analysis
analysis due to its ability to minimize interferences caused by polyatomic ions. The filtrate solution of WO3 showed the presence of W (328 mg/L), and trace amounts of Fe (2 mg/L) and Al (18 mg/L). The filtrate solutions of wolframite ore showed the presence of four major elements: W (289 mg/L), Fe (88 mg/L), Al (24 mg/L), and Mn (7 mg/L). The source of tungsten in solution is presumed to be from incomplete decomposition of the purple WO2(PO3)2 compound. Although a larger proportion of the tungsten was reported in the precipitate, the precipitation of tungsten was largely influenced by the decomposition reaction.
Conclusion
The use of the ammonium phosphate fusion method was shown to be a promising technique in the extraction of tungsten from wolframite ores. The key beneficial factor in this technique is the
formation of WO2(PO3)2, which decomposed to form various insoluble tungsten species of WO3 and WO2 under ambient conditions; however, both WO3 and wolframite ore revealed similar tungsten concentrations in the filtrate solutions. This was presumed to be the result of incomplete decomposition of WO2(PO3)2 and needs further investigation.
The author would like to thank the Research Fund of the University of the Free State, South Africa, for financial support.
Credit author statement
TTC: Conceptualization - formulation or evolution of overarching research goals and aims, Methodology - Development or design of methodology, Writing - Original draft preparation, Investigation -

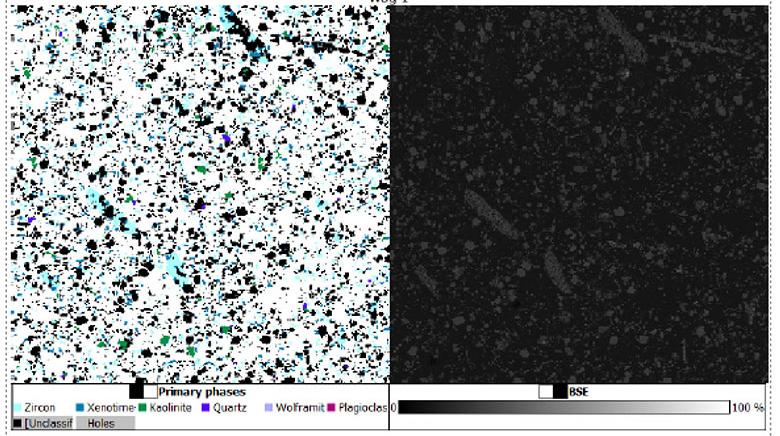
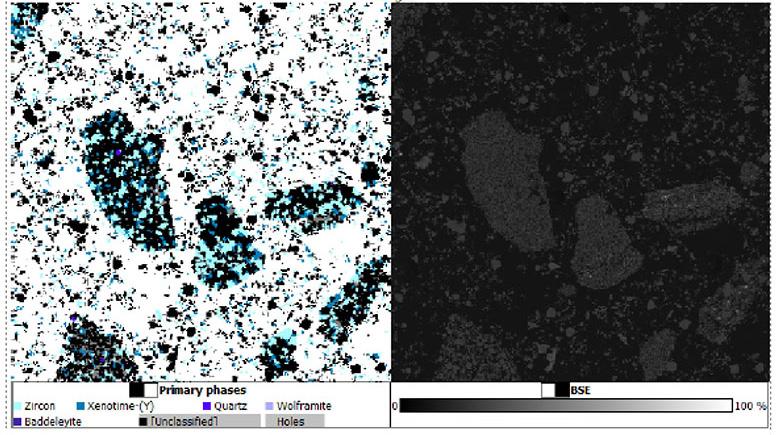
Laboratory analysis and interpretation
LSM: Investigation - Laboratory analysis and interpretation, Writing - Original draft preparation, Writing - Reviewing and Editing.
MWP: Investigation - Laboratory analysis and interpretation, Writing - Original draft preparation.
Conflict of interest
The authors declare that they have no conflict of interest.
References
Chiweshe, T.T. 2019. Characterization of molybdenum and tungsten phosphates compounds prepared using ammonium phosphate salt as flux. Bulletin of the Chemical Society of Ethiopia, vol. 33, no. 1, pp. 103–112.
Goddard, J.B. 1982. Purification of ammonium tungstate solutions. US Patent No. 4,346, 061, Aug. 24.
Gong, D., Zhou, K., Peng, C., Li, J., and Chen, W. 2019. Sequential extraction of tungsten from scheelite through roasting and alkaline leaching. Minerals Engineering, vol. 132, pp. 238–244.
Han, Z., Golev, A., and Edraki, M. 2021. A review of tungsten resources and potential extraction from mine waste. Minerals, vol. 11, p. 701.
Johansson, Ö., Pamidi, T., and Shankar, V. 2021. Extraction of tungsten from scheelite using hydrodynamic and acoustic cavitation. Ultrasonics Sonochemistry, vol. 71, pp. 105408.
Kinomura, N., Hirose, M., Kumada, N., Muto, F., and Ashida, T. 1988. Preparation of a new tungsten(V) phosphate and its polymorph. Journal of Solid State Chemistry, vol. 77, pp. 156 –161.
Lassner, E. 1995. From tungsten concentrates and scrap to highly pure ammonium paratungstate (APT). International Journal of Refractory Metals and Hard Materials, vol. 13, no. 1, pp. 35–44.
Lassner, E. and Schubert, W.-D. 1999. Industrial production. In Tungsten, Lassner, E. and Schubert, W.-D. (eds.), Springer, Boston.
Loopstra, B.O. and Boldrini, P. 1966. Neutron diffraction investigation of WO3 Acta Crystallographica, vol. 21, no. 1, pp. 158–162.
Luo, Y., Chen, X., Zhao, Z., Liu, X., Li, J., He, L., and Sun, F. 2021. Pressure leaching of wolframite using a sulfuric-phosphoric acid mixture. Minerals Engineering, vol. 169, pp. 106941.
Olayiwola, A.U., Du, H., Wang, S.-N., Liu, B., Lv, Y.-Q., and Pan, B. 2023. Cleaner production of ammonium paratungstate by membrane electrolysis-precipitation of sodium tungstate solution. Tungsten, vol. 5, no. 1, pp. 145–159.
Palmer, D.J. and Dickens, P.G. 1979. Tungsten dioxide: structure refinement by powder neutron diffraction. Acta Crystallographica Section B, vol. 35, no. 9, pp. 2199–2201.
Rozendaal, A., Gresse, P.G., Scheepers, R., and de Beer, C.H. 1994. Structural setting of the Riviera W-Mo deposit, western Cape, South Africa. South African Journal of Geology, vol. 97, no. 2, pp. 184–195.
Song, Q., Liang, T., Qian, K., Xing, W., Zha, X., Chen, B., Ma, Y., and Liu, K. 2022. Corrosion resistance of calcium zirconate crucible to titanium-copper melts. Journal of the European Ceramic Society, vol. 42, no. 7, pp. 3321–3331.
Sundberg, M.R. 1976. The crystal and defect structures of W25O73, a member of the homologous series WnO3n-2 Acta Crystallographica Section B: Structural Crystallography and Crystallographic Chemistry, vol. 32, pp. 2144–2149.
Srinivas, K., Sreenivas, T., Natarajan, R., and Padmanabhan, N.P.H. 2000. Studies on the recovery of tungsten from a composite wolframite–scheelite concentrate. Hydrometallurgy, vol. 58, no. 1, pp. 43–50.
Walker, P.W.A. 1994. Riviera tungsten - a discovery case history. Exploration Mining Geology, vol. 3, pp. 349–356. u
25 March 1939–12 January 2024

Sedupe Josiah “Rams” Ramokgopa was born in Orlando East, Soweto, and was raised in a family of political activists. As a teenager, he became involved in the activities of the 1952 Defiance Campaign. After matriculating from Orlando High School, he completed his Honours degree in physics at the University of Fort Hare in 1965 and an MSc in theoretical solid-state physics from Unisa in 1968.
Sedupe moved to Swaziland in 1969, where he took up a post as a mathematics teacher at Salesian High School. Here, he became known as Rams. His political family in Swaziland comprised the struggle leadership in exile of the African National Congress and Pan African Congress.
He remained active in the South African Student Organization and the Black Consciousness Movement. He returned to Johannesburg in 1974 to work as a systems engineer for IBM.
After the Soweto uprising of June 1976, Sedupe was active in forming the Soweto Committee of Ten, which drew up a blueprint for governance of Soweto. After several members were detained in terms of the Internal Security Act, Sedupe became executive director of the Black Community Programmes, the umbrella development organization operating under the Black People’s Convention. Following a massive countrywide clampdown in October 1977 that resulted in the banning of 18 organizations and three publications, Sedupe was detained without trial for 384 days at Modderbee Prison under Section 10 of the Internal Security Act. Upon his release, he was banned for five years, restricted to the Magisterial District of Johannesburg, and under constant surveillance by the security police.
He later served as AZAPO Secretary of Education from 1982–1985, executive director of Funda Centre from 1987–1991, and as a policy specialist at the Development Bank of Southern Africa. Sedupe joined Mintek in 1994 as Vice President responsible for Communications, Information Management, and Human Resources.
In 1999, Sedupe was honoured with the Star of South Africa by former President Nelson Mandela. Sedupe was inducted as President of the South African Institute of Mining and Metallurgy (SAIMM) in 2002. He also founded a gold mining exploration company that was successfully listed on both the Johannesburg and London Stock Exchanges as Central Rand Gold in 2008.
Sedupe passed peacefully on 12 January 2024, preceded by his wife, Thembi. He is survived by his children Dineo and Tumi, and three grandchildren.
Affiliation:
1Fakade Drip Pace Engineering
Solutions, Cape Town, South Africa
2Department of Financial Accounting, University of South Africa, Pretoria, South Africa
Correspondence to:
A. Mabentsela
Email: arthurmabentsela@gmail.com
Dates:
Received: 23 May 2023
Revised: 10 Aug. 2023
Accepted: 24 Apr. 2024
Published: June 2024
How to cite:
Mabentsela, A., and Ceki, B. 2024. The future of Ni-Cu smelting in Botswana: the choice between flashsmelting and top-submerged lance furnaces. Journal of the Southern African Institute of Mining and Metallurgy, vol. 124, no. 6. pp. 349–354
DOI ID:
by A. Mabentsela1 and B. Ceki2
Abstract
The BCL furnace is scheduled to restart operations after being placed on care and maintenance in 2016 due to depressed nickel prices. The decision to start operations after such a stoppage ought to be led by a techno-economic evaluation of process options to make operations more resilient. For BCL, the decision lies between using the existing flash-smelting furnace (FSF) or a top-submerged lance (TSL) furnace. Available studies show that the FSF combined with other converting technologies is cheaper to operate; however, such studies are based on flowsheet simulation results of single copper concentrates and therefore do not provide a full scope of practical capabilities based on smelter operator skills.
Using a t-test on normalized prior operational data from three Cu FSF and two Cu TSL, it was found that the only statistical differences between the operating costs of the FSF and TSL technologies are in the coal use for heating the feed blow and number of rebuilds: the FSF consumes coal to heat the feed blow and the TSL requires 2.4 rebuilds during a course of a single FSF campaign. A summative operating cost comparison over the existing BCL FSF 11-year life shows that BCL can decrease operational costs by some BWP 55.5 million if the operation were to change to the newer TSL technology. The savings derive from reduced coal use, which is normally associated with heating the blow when using the FSF. Despite the TSL carrying added costs of 2.4 rebuilds during a life time of one FSF furnace campaign, the cost associated with the TSL rebuilds of approximately BWP 1.3 million is minimal compared with the overall operational expenditure decrease that BCL will incur on using the TSL technology. In terms of the technology, BCL can have higher Ni–Cu recoveries at lower operational costs by elimination of Ni–Cu losses and eliminating the slag-cleaning furnace by converting to a TSL furnace.
Keywords
BCL smelter, Outokumpu flash smelting, top submerged lance furnace, Ni–Cu smelting
http://dx.doi.org/10.17159/24119717/2822/2024 Introduction
BCL Limited is a nickel–copper (Ni–Cu) mining company owned by the government parastatal Minerals Development Company of Botswana. The mine has operations in Selebe-Phikwe in northeastern Botswana. As part of its mining operations, BCL owns a flash smelter capable of treating 900 kt/a of concentrate (Botswana Chamber of Mines, 2017).
In October 2016, all BCL Group mining operations were placed under care and maintenance due to depressed nickel prices, amongst other reasons. The nickel price had steadily dropped over a period of two years from January 2014 to just below USD 4/lb. Since 2016, the nickel price has increased to ~USD 12/lb in 2023. This means that, in theory, BCL can restart operations; however, restarting operations after such a stoppage is often accompanied by technical changes to operations so as not to suffer the same fate should the metal price fall again (Fichani & Mabentsela, 2019).
Fichani and Mabentsela (2019) have shown process option routes worthy of further study to improve processing of the low-grade Ni–Cu ore and concentrate available in Selebi-Phikwe and neighbouring mines. With regards to smelting, the authors recommended that a trade-off study be done to assess the benefits of switching from the current flash-smelting furnace (FSF) to a top-submerged lance (TSL) furnace. This recommendation was not based on techno-economic considerations, but rather on global trends in the copper smelting industry, which show that TSL furnaces had increased in popularity to comprise some 50% of all new copper smelter installations in 2004 (Schlesinger et al., 2021). In a neighbouring country, Zambia, a copper smelter operator in 2003 chose to upgrade from an electric furnace to a TSL furnace over an FSF (Ross, 2005). The FSF was excluded on the basis of technical complexity for the Zambian environment, not being suited for retrofitting into existing furnace equipment, and high capital cost (Ross, 2005). The TSL was
chosen because of low capital costs, low operating costs, and relative ease of operation (Ross, 2005). It must be pointed out that the above study did not serve as a comprehensive comparison between the two furnace technologies, but rather as a high-level review of each technology. As such, the results of Ross (2005) cannot be used for the BCL case.
In all furnace conversions implemented by TSL companies to date, none have involved the conversion from FSF to TSL (Errington et al., 1997). As such, it is not easy to decide whether or not BCL will be advantaged or disadvantaged with respect to operational cost (OPEX) if it were to make such a conversion. Further, lack of detailed operational data in literature on Ni–Cu TSL furnaces worldwide makes it difficult to compare FSF and TSL furnaces for smelting Ni–Cu concentrates.
Available direct comparisons between FSF and TSL technologies are based on single-point process flowsheet models to calculate environmental impact of copper to blister smelting technologies in the form CO2 production (Alexander et al., 2021; Coursol et al., 2010) or OPEX (Bujaku et al., 2019). In all comparisons, FSF smelting in combination with Peirce–Smith converting or FSF in combination with a flash-converting furnace proved to be most environmentally friendly due to lower CO2 emissions resulting from the use of fossil fuel to generate heat (Alexander et al., 2021; Coursol et al., 2010). Further, the FSF in combination with a flash-converting furnace proved to be operationally less expensive (Bujaku et al., 2019). Modelling for the OPEX comparison was based on a single copper concentrate grade (Table I) and concentrate feed rate of 1.2 mt/a. The applicability of the results of Bujaku et al., (2019) is not known because the study used a single high-copper concentrate grade (see Table I). In comparison, the BCL smelter feed contains 5% Ni, 3% Cu (Legg et al. 2009). Further, a single idealized data point was used by Bujaku et al. (2019), as opposed to data drawn from practice at several smelters. Whether the BCL smelter will be better off, economically and technology-wise, by switching to the newer TSL technology or continuing with the current FSF technology remains unknown, despite these studies.
The objective of this paper was thus to conduct a technoeconomic comparison of FSF and TSL technologies, with the aim of establishing whether BCL would be advantaged with respect to both OPEX and technical capacity by using the existing FSF or implementing a newer TSL furnace.
To prove that TSL technology can treat the BCL low Ni–Cu concentrates, available literature information on past operation of Ni–Cu TSL furnaces is quoted and compared with most-recent BCL operation.
For the techno-economic comparison, a t-test was used on normalized prior operational data from three Cu FSF (PARSA Leyte, Sumitomo Toyo, and Hibi Kyodo Smelting Co.) and two TSL (Mount Isa and Mufulira) to determine whether there is a statistical difference in operational performance with respect to consumable usage between FSF and TSL for copper smelting. A
Table I
Copper concentrate grade (mass %) used in a prior copper smelting technology operating cost study (Bujaku et al., 2019)
Cu Fe S SiO2 CaO MgO Al2O3 Other 27 26 31 8 1 1 3 3
two-tailed t-test (Equation [1]), assuming non-equal equal variance at 95% confidence, is used for trans-technology comparison in each normalized consumable category (Cressie & Whitford, 1986). In this regard, the results of this study are based on practical experience, as opposed to the single-point simulation reported by Bujaku et al. (2019). The null hypotheses of the t-test is that both technologies use the same amount of consumables in each category:
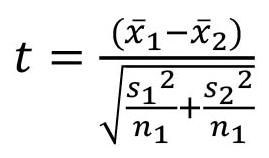
where x 1 is the sample mean of normalized consumables for the three Cu FSF smelters, s1 is the standard deviation of the normalized consumables for the three Cu FSF furnaces, n1 is the number of Cu FSF furnaces considered, x 2 is the sample mean of the normalized consumables for the two Cu TSL smelters, s2 is the standard deviation of the normalized consumables for the two Cu TSL furnaces, and n2 is the number of Cu TSL Cu furnaces considered.
The results of the t-tests were altered where necessary to give information for the Ni–Cu case of BCL. Where there was a statistical difference in the operational usage of consumables between the FSF and TSL, the sum difference in OPEX between the two furnace technologies was taken with respect to conclusions drawn. The three Cu FSF and two TSL were chosen because their operational data are most complete in the open literature. Relative OPEX data for the Cu smelters were back-calculated for the lower Ni–Cu concentrate grade, where necessary, and conclusions are drawn from relative summative results for OPEX consideration.
The OPEX categories considered included silica flux, oxygen, fossil fuel use to heat the feed (concentrate and blow) and holding furnaces, and furnace relining bricks during one FSF campaign life. With respect to the technological comparison, the furnace space demands were compared. Operational data for the Cu FSF were taken from Schlesinger et al. (2021); that for Mount Isa was taken from Arthur et al. (2003, 2005); for Mufulira, Ross (2005) and Burrows et al. (2012) were used. The reason for mapping the results of Cu FSF and TSL to Ni–Cu smelting is because there are no operational Ni–Cu TSL around the world to compare with the BCL smelter.
For the summative OPEX comparison, the cumulative consumable costs were calculated based on local Botswana prices in 2023. The recommendation on whether to change from the current FSF to any of the TSL technologies is based on the cumulative consumables cost of operation.
An FSF consists of three sections: a reaction shaft, where oxidation of the sulfide concentrate takes place to generate molten matte and slag droplets; a settler section, in which molten matte droplets fall and are allowed to separate from the slag by gravity; and the uptake shaft, from which smelting gases are drawn (see Figure 1).
In an FSF, typically that of Outokumpu’s matte smelting, a single concentrate burner is used to evenly distribute dry concentrate feed and enriched air through the top of the reaction shaft (Vaarno et al., 2003). This is achieved by making use of concentric ducts. In the inner duct, enriched air (34%–38% O2) at 260°C is blown vertically down into the reaction shaft. In the central duct, concentrate and flux, in the form of silica, fall through by gravity. At the burner tip of the inner duct, a distributer cone is installed to ensure that enriched air is horizontally blown through the falling concentrate/flux feed
(Schlesinger et al., 2021). As particles, typically < 100 μm, descend the reaction shaft, they react with the enriched air. The oxidation reaction is exothermic in nature: as the particles react, they heat up and melt, forming molten matte already in the reaction shaft and molten slag by reaction with fluxing agent (Schlesinger et al., 2021; Vaarno et al., 2003). The reactions involved are the direct oxidation of copper and nickel sulfide.
The molten matte and slag droplets reach the settler, where they are allowed to separate by gravity, giving a dense sulfide matte and silicate slag. The slag is continuously tapped while the matte is periodically tapped through separate tap holes. The smelting gases, mainly SO2 and N2, the latter coming from the enriched air, are drawn up from the uptake shaft. The total air requirement at the BCL smelter complex is 120 000 Nm3/h at an enrichment ratio of 34%–38% for a concentrate feed rate of 130 t/h (Legg et al., 2009). The air is heated by steam to 260°C. The feed typically comprises 5% Ni, 3% Cu, 30% S, 45% Fe, and 8% SiO2 (Legg et al., 2009). The process produces a matte that has 30%–35 % Cu–Ni with a Ni recovery of 92.3% (Legg et al., 2009). Although flash smelting is autogenous, using latent energy contained in the sulfide bonds, supplementary fuel in the form of pulverized coal at a rate of 52.6 kg/t of dry solid feed is added to the BCL feed to ensure operating temperatures are reached (Warmer et al., 2006).
A TSL furnace is an upright cylindrical furnace that uses a topintroduced submerged lance to introduce enriched air to a bath of molten slag (Figure 2). Cold air is fed in to form a protective skull around the lance to prolong lance usage, thus negating the need to heat the air. Concentrate and flux are fed from the top of the furnace and fall by gravity to the surface of the slag bath through separate feed holes. The lance penetrates the slag bath by a few meters; for example, only by 0.3 m in a slag with a thickness of 1.85–2 m at the Chambishi Copper Smelter in Zambia (Zhao et al., 2019). Usage of oxygen in the bath is indirect. It involves a reaction with iron oxide in the slag bath to form magnetite in the slag. The magnetite is then used inside the furnace to oxidize sulfide containing copper and nickel, resulting in the formation of iron oxide and Cu and Ni sulfide matte. In this regard, iron oxide acts as catalyst in the oxidation of Cu and Ni sulfides (Schlesinger et al., 2021; Vernon & Burks, 1997). The TSL technology is led by two companies: ISASMELT™ and Ausmelt.
Owing to the turbulent environment caused by gas injection inside the furnace, the matte and slag do not separate well inside the TSL furnace, so a settler furnace is needed. Matte and slag are periodically tapped from the TSL furnace from water-cooled tap holes, in the case of ISASMELT furnaces, or continuously from a weir, in the case of Ausmelt furnaces (Schlesinger et al., 2021).
The slag and matte are tapped into a settler furnace, which allows for their separation. To maintain a molten slag and matte, the settler furnace is powered by external sources of fuel, such as electricity, where economics allow, or by fuel to balance heat losses through the settler walls. The separated matte and slag are then separately tapped from the settler furnace for further processing (matte) or discard (slag) (Bakker et al., 2009).
Apart from the energy supplied to the settler furnace, additional fuel is supplied to the TSL furnace in the form of coal or hydrocarbon fuel (Schlesinger et al., 2021).
The typical feed concentrate grade to the BCL FSF smelter is given above. The design capacity of the BCL FSF is 900 kt/a (Botswana Chamber of Mines, 2017). The matte comprised 31.7% Ni–Cu with 92.3% Ni recovery. The slag comprised 0.201% Ni and was discarded (Legg et al., 2009).
Concentrate and sand
Preheated and/or oxygen enriched air
Concentrate burner
Uptake
Reaction shaft
Settler
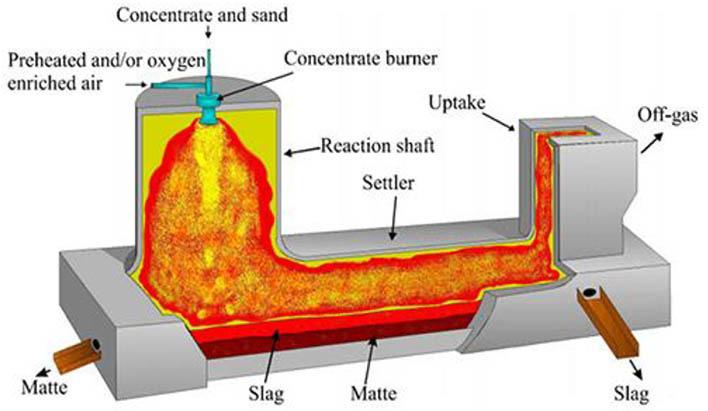
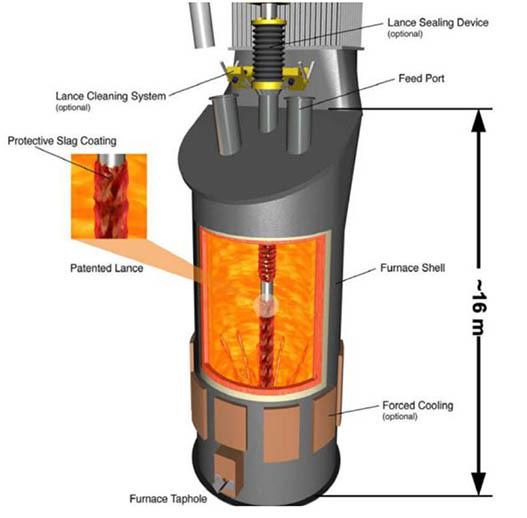
Off-gas
The ISASMELT TSL furnace is able to treat low Ni–Cu concentrates. Agip’s nickel ISASMELT furnace, in Australia, which was commissioned in 1991, treated 60 kt/a concentrate containing 7% Ni and 3.5% Cu to produce a matte of 45% Ni–Cu. Production at Agip was stopped due to depressed nickel prices and the smelter was decommissioned after less than six months of operation (Bakker et al., 2009). Two other Ni Ausmelt TSL smelters exist in China: Jinchuan started in 2008 and Jilin in 2009 (Andrews et al., 2013). In 2013, these were quoted to treat 1.1 mt/a and 0.27 mt/a of Ni concentrate, respectively (Andrews et al., 2013). Interestingly, Jinchuan operated an FSF from 1993 to 2006, and only in 2008 did they add a new TSL (Jinchuan Group Co., LTD., 2023). Little is published on the operation of these two TSL furnaces. Although the Agip furnace treated a much lower feed rate, the capability of ISASMELT to treat Ni–Cu concentrates was proven and has also been proven through pilot-scale test work (Bakker et al., 2009). The Jinhaun and Jilin plants prove applicability of the Ausmelt TSL for Ni–Cu smelting. Therefore, it can be said that TSL technology can treat low Ni–Cu sulfide concentrates.
The TSL carries further advantages of:
➤ Higher nickel and copper recovery than the FSF. This is because the sulfide feed is partially roasted in the reaction chamber in an FSF. Partial roasting of the metal sulfides in the feed can be mistakenly overdone, which leads to formation of nickel
and copper oxides, which are then lost to the slag and need to be recovered via a separate electric furnace (Crundwell et al., 2011).
In a TSL, chance of oxidation of metal sulfide in the feed does exist via reaction [2]. However, unlike the FSF, the oxidation reaction is not the main source of heat and formation of nickel and copper oxides is self-correcting via reaction [3] (Vernon & Burks, 1997): [2] [3]
The OPEX implication of the above is a saving for BCL if it were to run a TSL. The savings arise from not running a separate electrical slag-cleaning furnace to recover nickel and copper after the main FSF furnace.
➤ Ease of smelting high-magnesium concentrate with a TSL. With a FSF, the feed is heated by burning sulfur in the feed. This presents a challenge for high-magnesium concentrates because these produce slags with a melting point near the upper burning temperature limit within the reaction shaft (Crundwell et al., 2011). Therefore, such concentrates do not melt in the reaction shaft, which may lead to loss of nickel and copper because of being locked in solid burnt concentrate
lumps. Corrective measures for this in the FSF is the use of supplementary coal to provide added heat in the reaction shaft. In the TSL, temperature control derives entirely from burning fossil fuel or an equivalent, so is more independent of the reactions necessary to give the sulfide matte. Therefore, the reaction temperature can be increased with ease and without limits, at least within reasonable operating conditions. In this regard, the TSL can treat high-magnesium concentrates better than the FSF.
Operating cost and technological comparison
Raw data and statistical analysis
Raw operational data for three Cu FSF and two TSL are given in Table II; normalized data per furnace operator are shown in Table III. Raw consumable data was normalized per tonne of feed or per tonne of copper in the feed.
The results of the t-test are shown on the right side of Table III by way of the P-value, together with conclusions for the Cu smelting comparison. Analysis of the t-test results and their application to Ni–Cu smelting at BCL is presented in the following section. Note that the BCL figures are not taken into consideration in the t-test.
Technological and operating cost comparison
This section discusses the results of the OPEX and statistical
Raw data for BCL and copper FSF and TSL used in study (Arthur et al., 2005; Arthur et al., 2003; Ross, 2005; Schlesinger et al., 2021)
(Legg, et al., 2009)
feed (kt coal/a)
Inside dimensions (m)
No. of bricks per reline (Glencore, 2022)
1 Combined Ni and Cu %
2 Data not available in open literature
3 Bunker oil energy content = 40 MJ/kg; coal energy content = 21.5 GJ/t
⁴ Combined TSL and settler furnace
⁵ Combined TSL and settler furnace
⁶ General maximum campaign life. Not specific to the furnace operator
⁷ Estimate based on Mount Isa value
Table III
Normalized operational data for copper TSL
comparison carried out on the normalized operational data for Cu smelting and its applicability to Ni–Cu smelting.
It can be concluded from Table III that, despite popular comparisons in past literature (Bujaku et al., 2019), the normalized consumables demand for FSF and TSL furnaces remain largely statistically the same. This is true for silica, oxygen, and coal demands for main and settling furnace usage. Further, despite claims for a lower footprint for the TSL, when statistically compared with FSF furnaces, the TSL furnace technology takes the same overall space when the settling furnace is taken into consideration.
The only statistical differences between the technologies, with respect to the considered items, are in the usage of coal to heat the blow and the number of relinings. The FSF uses more coal (approximately 0.0132 t/t feed for the BCL case) than for an equivalent TSL treating the BCL feed. However, the TSL would have about 2.4 more rebuilds during the time of one FSF furnace campaign. With this in mind, it cannot yet be concluded whether BCL would be better off with an FSF or TSL. A summative economic analysis of the cost of coal compared with a furnace rebuild was then carried out.
Summative operating cost comparison
This section compares the economic implications of the two identified differences in operation between the FSF and TSL (coal use for feed heating and relining). The analysis was carried out using BCL furnace conditions: a feed rate of 900 kt/a, a furnace life of 11 years, and the time period for a single FSF campaign. The TSL furnace refractory lining was assumed to be a chromite–
Table IV
magnesite refractory (Schlesinger et al., 2021) of ~ 220 mm length, with a brick size of 22.9 mm × 10.2 mm × 7.6 mm and density of 3.63 g/cm3. Table IV shows the summative operational cost difference of changing from the existing FSF to a TSL furnace. All values are based on local Botswana costs.
Table IV shows that the summative difference in OPEX for BCL to change from the existing FSF to a TSL is a decrease of approximately BWP 55.5 million. This arises from savings from the lack of need to heat the furnace blow in the TSL furnace. The cost of furnace relining has minimal effect on the summative OPEX difference. This presents rather a different result from previous reports based on a single-point operation simulation (Bujaku et al., 2019).
Conclusions and recommendations
Operations that have had to undergo a stoppage due to economic reasons, such as the product price(s) not meeting OPEX, should reevaluate their OPEX for opportunities to reduce such costs. The objective of such an exercise is to ensure that such operations remain profitable during any future depressed product price. For the BCL smelter, which was placed under care and maintenance in 2016 due to depressed nickel prices, one of the choices to reduce OPEX lies between continuing to use the existing FSF technology or opting to use newer TSL technology.
Using normalized operation data from three copper FSF (PARSA Leyte, Sumitomo Toyo, and Hibi Kyodo Smelting Co.) and two copper TSL (Mount Isa and Mufulira), it was determined that the only statistically significant differences in operational consumables between the two furnace types lies in the usage of coal for heating the blow and number of relinings required during
Comparative operational cost difference on changing from FSF to TSL for the BCL case Units over 11 yr Unit cost (BWP/t) Overall difference (million BWP)
the furnace lifetime of one FSF campaign. The FSF requires coal for heating the feed blow; the TSL requires ~ 2.4 rebuilds in the duration of a single FSF lifetime. Other consumable and technical attributes of the two furnaces that were compared include silica flux, oxygen, fossil fuel use to heat the feed (concentrate and blow) and holding furnaces, and furnace relining bricks.
Technological comparison found that although both the FSF and TSL can treat low Ni–Cu concentrates, higher Ni–Cu recoveries at lower OPEX can be achieved by BCL if it were to convert the existing FSF furnace to a TSL. This is because the TSL technology does not involve partial roasting of the feed, which, in the FSF, poses a risk of fully roasting the sulfide Ni–Cu in the feed, which is then lost as oxides in the slag. To recover the lost Ni–Cu in the slag, the FSF operates with an electric slag-cleaning furnace to recover Ni–Cu oxides in the slag. Such an electric furnace is not necessary for the TSL because oxidation is self-correcting to yield more metal to the matte. Conversion from FSF to TSL will enable the operation to handle higher magnesium concentrates, which pose a problem for the FSF due to their high melting point. There is no statistical difference between the two technologies concerning the plant footprint if the TSL is seen as a combination of the cylindrical section and the necessary settler furnace, as has been previously suggested in literature.
A summative assessment showed that BCL OPEX would be some BWP 55.5 million lower for a TSL over a 11-year equivalent FSF life campaign. These savings originate from not needing to heat the furnace blow. The effect of TSL relining on OPEX is very minimal over this period.
In conclusion, for the considered operational consumables and characteristics of FSF and TSL based on actual performance of operating plants, it was found that the BCL smelter would be cheaper to run if it were to adopt the newer TSL furnace technology. Despite the above, this study does not claim to be an exhaustive comparison of OPEX comparison of the two furnace technologies. OPEX related to tapping activities, tap hole changes, lance usage, and furnace availability were not considered and ought to be included in future studies.
We give thanks to Dr. K. Fichani who helped kickstart this work and Professor Chigwaza who assisted in the statistical analysis.
References
Alexander, C., Johto, H., Lingren,M., Pesonen, L., and Roine, A. 2021. Comparison of environmental performance of modern copper smelting technologies. Clean Environmental Systems, vol. 3, pp. 1–12.
Andrews, R., Matusewicz, R., Aspola, L., and Hughes, S. 2013. Outotec’s Ausmelt top submerged Lance (TSL) technology for the nickel industry. Proceedings Ni-Co 2013. Springer. pp. 315–316. doi.org/10.1007/978-3-319-48147-0_23
Arthur, P., Edwards, J., and Xstrata Technology. 2003. ISASMELTTM - A quiet revolution. Proceedings of European Metallurgical Conference, Gesellschaft der Metallurgen und Bergleute, Hanover. pp. 1–18.
Arthur, P., Hunt, S., and Xstrata Technology. 2005. ISASMELTTM - 25 years of continuous evolution. John Floyd International Symposium on Sustainable Developments in Metals Processing, Australasian Institute of Mining and Metallurgy, Melbourne. pp. 1–24.
Bakker, M., Alvear, G.R.F., and Kreuh, M. 2011. ISASMELTTM-making a splash for nickel. Minerals Engineering, vol. 24, pp. 610–619. Botswana Chamber of Mines, 2017. Botswana Chamber of Mines
news. https://www.bcm.org.bw/proposed-disposal-of-the-bclgroup/ [Accessed 20 October 2019]
Bujaku, A., Johto, H., and Pesonen, L. 2019. Detailed OPEX comparison of modern copper smelting technologies using HSC-SIM modelling. Proceeding of 58th Conference of Metallurgists hosting 10th International Copper Conference 2019, Canadian Institute of Mining, Metallurgy and Petroleum, Vancouver. pp. 1–17.
Burrows, A., Partington, P., Sakala, J., and Mascrenhas, P. 2012. ISASMELTTM at Mufulira - increased flexibility on Zambian Copperbelt. Sustainable Industrial Processing Summit SIPS2011, Volume 6: Aqueous, Low Temperature & Electrochemical Processing. Flogen Star Outreach, Montreal. pp. 217–226.
Coursol, P., Mackey, P., and DiIIaz, C. 2010. Energy consumption in copper sulphide smelting. Proceedings of Copper 2010, Gesellschaft der Metallurgen und Bergleute, Hamburg. pp. 1–22.
Cressie, N. and Whitford, H. 1986. How to use the two sample t-Test. Biometrical Journal, vol. 28, no. 2, pp. 131–148.
Crundwell, F., Moats, M., Ramachandran, V., Robinson, T., and Davenport, W. 2011. Extractive Metallurgy of Nickel, Cobalt and Platinum-Group Metals. Elsevier, Amsterdam.
Errington, W., Edwards, J., and Hawkins, P. 1997. Isasmelt technology - Current status and future developments. Journal of the South African Institute of Mining and Metallurgy, vol. 97, no. 4, pp. 161–167.
Fichani, K. and Mabentsela, A. 2019. A Conceptual Investigation of Treatment Plant and Smelter Technologies for a Possible Re-start of the BCL Mine. In press. Gaborone, Botswana.
Glencore. 2022. https://www.glencore.com.au/operations -andprojects/qld-metals/resourceful/resourceful-july-2022/mountisa-mines-copper-smelter-rebrick-completed [Accessed 26 February 2023].
Hoang, J., Reuter, M.A., Matusewicz, R., Hughes, S., and Piret, N. 2009. Top submerged lance direct zinc smelting. Mineral Engineering, vol. 22, no. 9, pp. 742–751. doi.org/10.1016/j. mineng.2008.12.014
Jinchuan Group Co., Ltd. 2023. http://en.jnmc.com/202207/29/c_793221.htm [Accessed 24 February 2023].
Legg, A., Ntsipe, L., Bogopa, M., and Dzinomwa, G. 2009. Modernisation of the BCL smelter. Journal of the South African Institute of Mining and Metallurgy, vol. 109, pp. 671–676.
Ross, J. and de Vries, D. 2005. Mufulira smelter upgrade project -'Industry' smelting on the Zambian Copperbelt. Glencore Technology. Kitwe, Zambia.
Schlesinger, M., King, M., Sole, K., Davenport, W., Flores, G.R.F.A. 2021. Extractive Metallurgy of Copper. 6th ed. Elsevier, Amsterdam.
Vaarno, J., Jarvi, J., Ahokainen, T., Laurila, T., and Taskinen, P. 2003. Development of a mathematical model of flash smelting and converting processes. 3rd International Conference. on Computational Fluid Dynamics in the Minerals and Process Industries, Commonwealth Scientific and Industrial Research Organisation, Melbourne. pp. 147–154.
Vernon, P. and Burks, S. 1997. The application of Ausmelt technology to base metal smelting, now and in the future. Journal of the South African Institute of Mining and Metallurgy, vol. 97, no. 3, pp. 89–98.
Warmer, A.E.M., Díaz, C.M., Dalvi, A.D., Mackey, P.J., Tarasov, A.V., and Jones, R.T. 2006. JOM world nonferrous smelter survey part IV: nickel sulfide. JOM, vol. 58, no. 4, pp. 58–20.
Zhao, H., Lu, T., Yin, P., Mu, L., and Liu, F. 2019. An experimental and simulated study on gas-liquid flow and mixing behavior in an ISASMELT furnace. Metals, vol. 9. no. 5, pp. 1–13. doi.org/10.3390/met9050565 u
Affiliation:
1Rocscience, Australia
2Gecko Geotechnics LLC, Saint Vincent and the Grenadines
Correspondence to:
A. McQuillan
Email: alison.mcquillan@rocscience.com
Dates:
Received: 10 Mar. 2023
Revised: 31 Jan. 2024
Accepted: 5 Mar. 2024
Published: June 2024
How to cite:
McQuillan, A. and Bar, N. 2024. Forecasting open-pit slope runout distances. Journal of the Southern African Institute of Mining and Metallurgy, vol. 124, no. 6. pp. 355–360
DOI ID:
http://dx.doi.org/10.17159/24119717/2674/2024
ORCID:
A. McQuillan
http://orcid.org/0000-0002-1645-6497
N. Bar
http://orcid.org/0000-0001-7948-2468
by A. McQuillan1 and N. Bar2
Abstract
Geotechnical engineers are routinely tasked with advising suitable stand-off distances below highrisk sections of slopes in open-pit mines that are identified to have potential to deform or collapse. Accurate prediction of failed material runout can mean the difference between continuous safe mining and unwanted high-potential incidents that result in loss of production, equipment damage, injury, or loss of life. This paper updates previous empirical relationships presented by the authors for estimating the volume and runout distance of excavated slope failures, in an open-pit mine operation, using slope geometry as the primary predictor. Cases are sourced from varying slope geometries (fall heights up to 385 m, slope angles up to 80°) and a range of commodities (iron ore, coal, nickel, gold, copper, boron, and limestone), excavated in sedimentary, banded-sedimentary, epithermal, and copper-porphyry deposits, across all six inhabited continents. Analysis of these cases identified positive correlations between slope height and runout distance, and slope height and failed material volume. In general, negative correlations were identified between Fahrböschung angle and slope height, and Fahrböschung angle and failed material volume; however, significant scatter is observed in these datasets. A definitive relationship could not be derived comparing Fahrböschung angle with failed material runout. Slope angle was also found to be a poor indicator of runout. Of the parameters analysed, slope height (i.e., fall height) was found to be the simplest and best predictor of runout distance. This paper presents new charts for predicting failed material runout distance for rock slopes. Relationships are defined for structurally and rock-mass driven slope failure mechanisms at average, 75%, and 95% prediction intervals.
Keywords
rock slope failure, open-pit, failed material runout distance
Introduction
This paper updates previous empirical relationships presented by McQuillan and Bar (2020) for estimating the volume and runout distance of excavated slope failures, in an open-pit mine operation, using slope geometry as the primary predictor. New relationships are presented for two categories:
1. Structurally driven slope-failure mechanisms (i.e., primarily driven by geological structures);
2. Rock-mass-driven slope failure mechanisms.
The presented charts are designed to provide mining operations with an additional tool to select appropriate stand-off distances, or exclusion zones, below identified geotechnical hazards that indicate potential slope failure or observed excessive deformation.
Runout predictions based on the historical performance of slopes with similar geometrical characteristics are considered valuable tools because they can be firmly linked to real-world cases. Without doubting the benefit of numerical analysis, empirical charts can be more valuable in instances where numerical predictions of failed material runout use estimates of material properties that are derived or merely adopted from literature. Further, empirical charts can be utilized in minutes or hours whilst numerical analysis may take several days, weeks, or even months.
The purpose of this study is to provide mining operations with a fast, defensible means of predicting runout distance, using slope geometry dimensions that are readily predictable, or measurable, by both technical and operational personnel. As such, a single measure of slope geometry, using slope height (i.e., fall height), is presented to predict runout distance.
Figure 1 summarizes the geometric parameters measured and analyzed in this study.
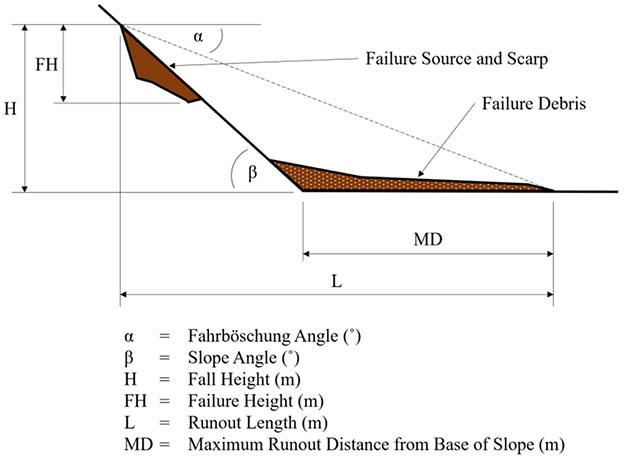
This study is based on 549 slope cases, which is an increase of the 238 slope cases previously published by McQuillan and Bar (2020). Case studies are sourced from open-pit mines in Australia, South America, North America, Asia, Europe, and Africa, and are divided into two categories: (i) structurally driven failure mechanisms; and (ii) rock-mass failure mechanisms. Cases categorized as having a structurally driven failure mechanism include failures driven by planar, wedge, toppling, or step-path mechanisms. Cases attributed to rock-mass failure mechanisms include circular failures (42 cases) and debris flow (13 cases) descriptions.
Cases were sourced from varying open-pit slope geometries excavated across a range of commodities, as outlined in Table I. Cases are derived from the authors’ practical experience and in collaboration with several operating mines. The case studies grouped in the Other (undisclosed) category in Table I are those published by Whittall (2015). As is evident from the data, structurally driven failures account for 90% of slope failures in open-pit mines. Rock-mass-driven failures in open-pit rock slopes are, in comparison, quite rare, accounting for only 10% of the reference database. Circular failure modes account for less than 8% of open-pit slope failures in the database.
Case-study fall heights range from 3 m to 385 m, exhibit slope angles from 19° to 80°, and include linear, convex, and concave slope profiles, excavated in sedimentary, banded-sedimentary, and sulfide-intrusion deposits, across all six inhabited continents.
Table I
Distribution of case-study slope cases by commodity
Individual rock or block-fall failures were excluded from this study as these are considered a different failure mechanism and so different runout (or rollout) behaviour would be observed. For predicting the primary impact and total runout distances of rock falls (i.e., individual rocks falling, rolling, or sliding down a face) in quarries and mines, refer to studies by Robotham et al., (1995), Gkouvailas (2014), Ferrari et al., (2015), and Saroglou and Bar (2017).
Only slope failures with unobstructed runout profiles were included in the study. Failed cases with notes of obstructed or bund (windrow)-impeded runout profiles were excluded because they were assumed to obscure the dataset with conservative measurements of actual runout distance.
For all cases, complete measurements of fall height (H) and maximum horizontal runout distance from the base of the slope (MD) were recorded, as defined in Figure 1. Total slope height, slope angle, and estimated failed material volume (V) are available for most cases and were analysed where measurements were available.
Analysis of the measured parameters illustrated in Figure 1 identified the following relationships, for both structurally driven failure mechanisms and rock-mass-driven failure mechanisms: i. Runout distance increases with increasing fall height (i.e., there is a positive correlation between MD and H), as seen in Figure 2. A distinct linear trend is observed for rock-mass-driven failure mechanisms. This finding is consistent with results reported by Corominas (1996) and McQuillan and Bar (2020). This observation conforms to gravitational potential energy (PE) laws, Equation [1], where the greater the fall height, the greater is the potential energy:
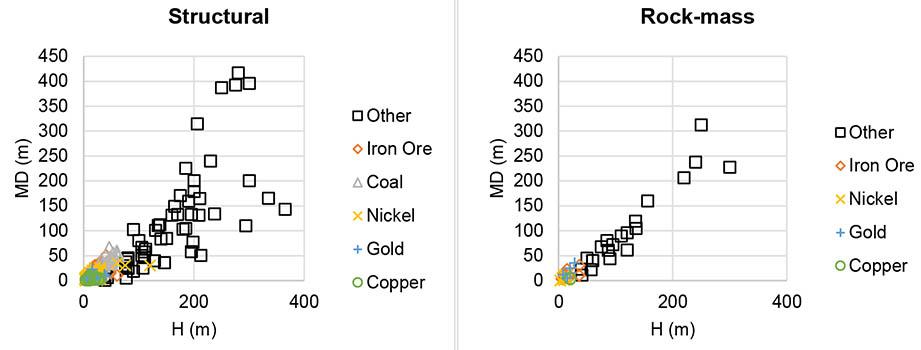
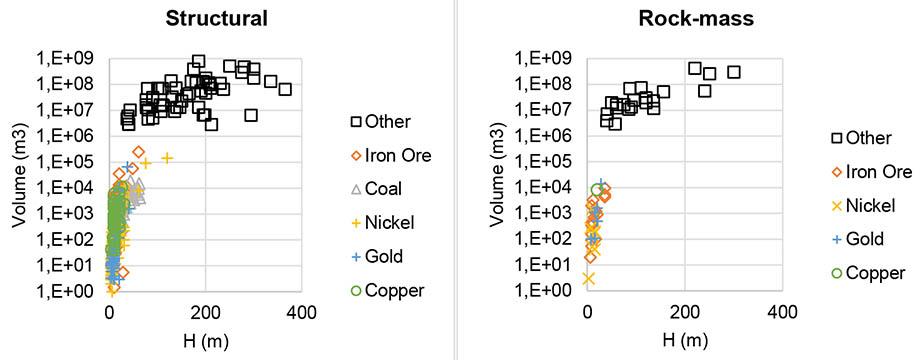
PE = mgh, [1]
where m is mass, g is acceleration due to gravity, and h is height. As material starts to move down a slope, the potential energy converts to kinetic energy (KE) (Equation [2]). The increased potential energy on a higher slope results in higher kinetic energy as the material accelerates, which is observed in longer runout distances in this study.
KE = 0.5mv2 , [2] where v is velocity.
ii. Failed material volume increases with increasing fall height (i.e., there is a positive correlation between V and H), per Figure 3. This finding is consistent with prior results of McQuillan and Bar (2020), and reflects the positive volumetric relationship between slope height and rock mass volume (i.e., the larger the slope (i.e., fall height), the greater the volume of material that exists to run out of the slope face).
iii. Fahrböschung angle generally decreases with increasing runout (i.e., there is a negative correlation between α and MD), as indicated in Figure 4. There is significant scatter in this relationship for slope heights less than 100 m for structuraldriven failure mechanisms, and for slopes heights less than 50 m for rock-mass-driven failure mechanisms. Fahrböschung angle is therefore not considered a reliable predictor of runout distance for open-pit mine excavated slope failures.
iv. Larger failed material volumes are observed with smaller Fahrböschung angles, (i.e., there is a negative correlation between V and α), as observed in Figure 5. There is generally significant scatter in this relationship for 20° < α < 70°, indicating Fahrböschung angle to be an unreliable predictor of runout distance.
v. There is no discernible correlation between MD and slope angle, as indicated in Figure 6. This finding confirms the
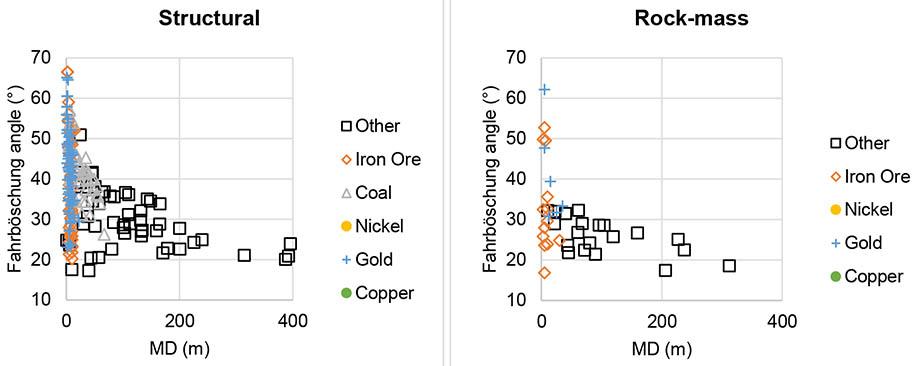
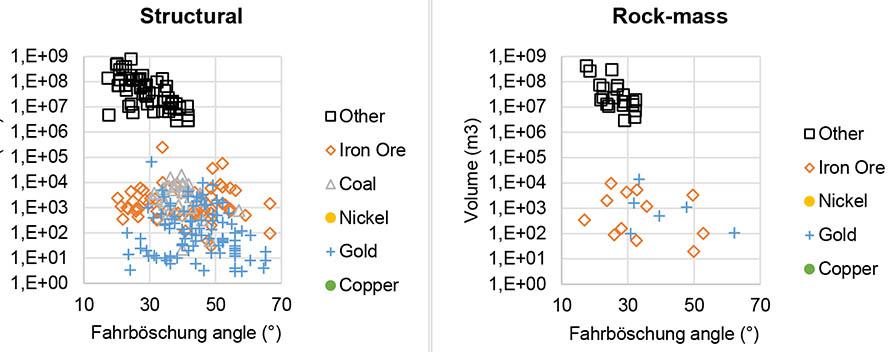
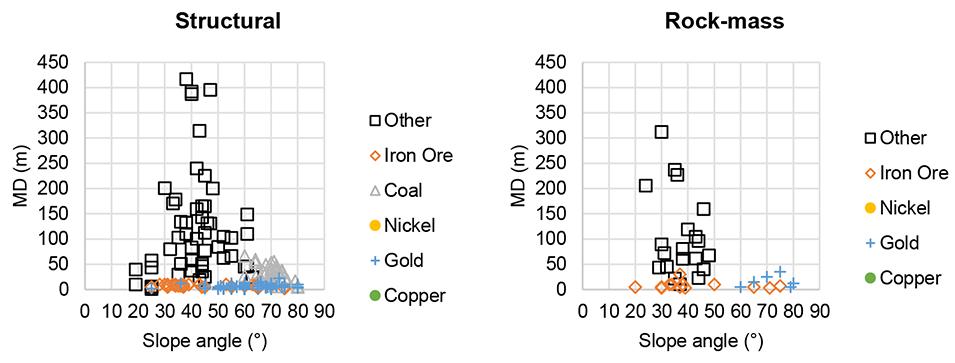
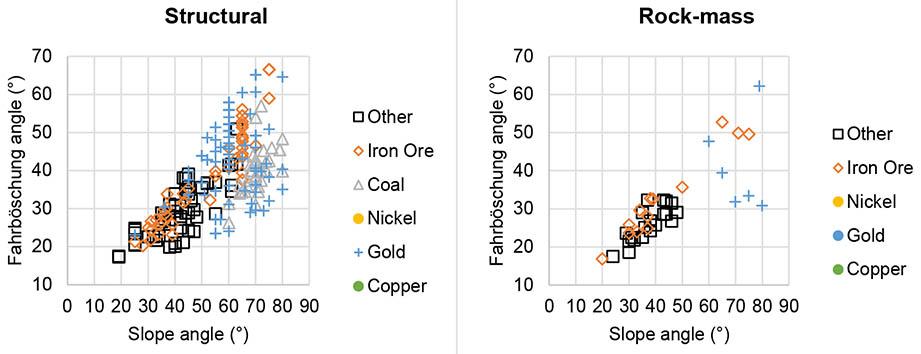
results of McQuillan and Bar (2020), and shows that slope angle is not a reliable predictor of runout distance. Slope angle was previously identified to have little influence on excavated single-bench slope stability (McQuillan et al., 2018); instead, structure orientation (dip and dip direction) relative to slope orientation have a greater influence on slope stability. However, slope angles have been directly related to total rollout distances for individual rock falls (Bar et al., 2016; Saroglou and Bar, 2017).
vi. Fahrböschung angle generally increases with slope angle (i.e., there is a positive correlation between α and slope angle), as per Figure 7. However, there is wide scatter in the data at increasing slope angles.
Where fall height (H) was determined to provide a reasonable, readily predicted (or measured) variable to estimate runout distance (MD), predictive equations were developed to assist mining operations with geotechnical risk management.
Table II summarizes the predictive equations developed for failed material runout distance, using fall height as the prediction variable. Predictive equations are presented for: (i) slope heights less than 100 m, representing typical inter-ramp slope geometries; and (ii) all slope heights in the database. Figure 8 and Figure 9 present these datasets graphically.
Linear regression was applied to the dataset to calculate the average runout distance of each dataset. Prediction intervals of 75%
Table II
Predictive equations for estimating failure material runout distance using slope height, H
and 95% were calculated using linear regression and the Student’s t-distribution (Preston 2000), given by Equations [3] and [4], respectively. The prediction interval is a useful measure of reliability for the prediction of an observation: in this case, runout distance. Prediction intervals of 75% and 95% provide mining operations with conservative estimates of runout distances, and an arguably more-effective (lower risk) stand-off distance.
Prediction interval % = y ^ 0 ± tcrit x SE, [3]
where ŷ0 is the forecast value derived from linear regression, tcrit is the two-tailed inverse of Student’s t-distribution, and SE is the standard error of the data, given by:
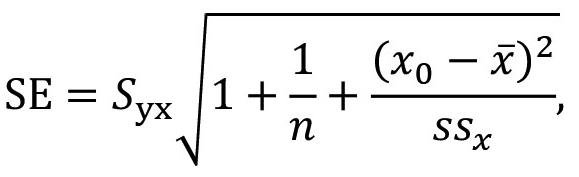
where Syx is standard error of the predicted y-value for each x in a regression, n is number of degrees of freedom, x is the mean, and SSx is the sum of squares of deviation of data points from their sample mean.
Limitations
These empirical relationships are proposed to supplement currently available slope-stability and runout assessment methods and tools. It is not intended, nor advised, that these relationships entirely replace numerical simulations.
Where there is appreciable scatter in the charts, runout predictions should not be specified as a deterministic value, but rather quoted as a range based on the distributions of measurements in the reference database. Smaller stand-off distances than the average distance interpreted from the charts may be justified with
additional controls, rather than using the stand-off zone as an exclusive control.
This study only compared two variables of slope failure to readily predict runout distance. It is recognized that excavated slope failures have complex failure mechanisms that often include multiple driving factors (i.e., slope geometry, rock mass condition, structure orientation, surface condition, water, and degree of weathering) (McQuillan et al., 2018). Furthermore, downslope (floor dip) angle will likely influence runout distance (Hunter and Fell 2003). The scatter observed in the datasets presented in this paper is assumed to be attributed to the various slope conditions included in the case-study database. Tighter correlations in the datasets should be investigated to further define relationships between pre-failure slope conditions and runout. Such multiplevariable comparisons were not completed as part of this study, where the purpose was to rapidly identify data-driven predictors of runout using slope geometry as the primary predictor.
This study contains failures that occurred at single-bench to overall excavated slope scales from open-pit mines. The reference database includes cases with minimum slope heights (fall heights) of 3 m: it is not recommended that the predictive equations be used to estimate runout for slope heights less than 3 m.
The influence of pit floor inclination on runout distance was not included in this study, nor the dimensions and capacity of hard barriers to contain failed material. These are important parameters that also need to be considered in any estimate of runout distance and implementation of exclusion zones below high-risk potential failures.
For runout predictions specifically developed for single-bench failures in coal mines, refer to studies by McQuillan et al. (2018) and Nairn et al. (2021).
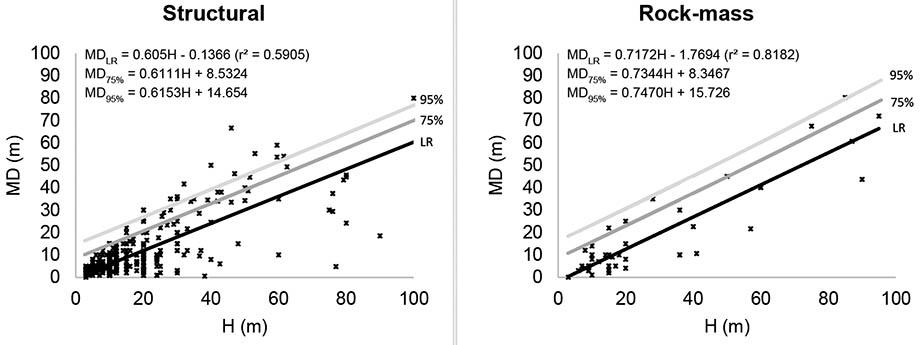
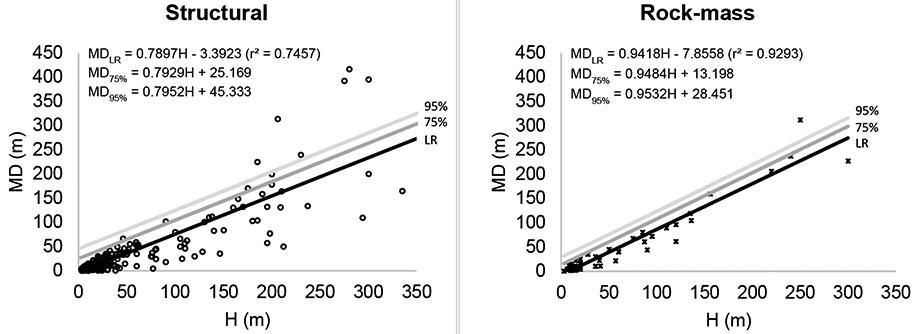
Conclusion
Accurate prediction of runout distance is critical to managing geotechnical risks in an open-pit operation. Predictive charts and equations are proposed to assist geotechnical engineers and mining operations in estimating runout distance below sections of excavated slopes that are identified to have the potential to deform or collapse. The predictive equations are only applicable to excavated slopes.
Predictive equations are based on analysis of 549 failed slope cases from iron ore, coal, nickel, gold, copper, boron, and limestone operations, excavated in sedimentary, banded-sedimentary, epithermal, and copper-porphyry deposits, across all six inhabited continents. Cases include slopes up to 385 m in height and 80° in slope angle.
Analysis of these cases identified positive correlations between slope height and runout distance, and slope height and failed material volume. Analyzed cases showed that Fahrböschung angle, which is often applied in empirical relationships, along with volume, to predict runout distance (Nairn et al., 2021; Ahn, 2023), is generally negatively correlated to slope height and failed material volume (i.e., greater volumes are observed with smaller Fahrböschung angles). However, this is a general trend only and significant scatter is observed in datasets comparing Fahrböschung angle to volume, as well as other slope parameters, including slope angle and slope height. No definitive relationship was derived comparing Fahrböschung angle with failed material runout. Slope angle was also found to be a poor indicator of runout.
Of the parameters analyzed, slope height (i.e., fall height, H) was found to be the simplest and best predictor of runout distance. The use of a single predictor of fall height provides a rapid means of estimating appropriate stand-off distances until additional control measures, such as radar monitoring (including appropriate evacuation protocols) and slope remediation, can be implemented. The use of catchment bunds is considered an additional layer of defence against failure runouts.
The relationships and predictive equations are proposed to supplement existing slope-stability and runout assessment methods, which include numerical modelling. Where scatter is observed in the dataset, any runout estimate should be quoted as a range based on the distributions of measurements in the reference dataset, not quoted as a single value. Runout predictions should be used in parallel with a suite of other controls, such as instrumentation monitoring and hard barriers.
Statements and declarations
The authors declare that no funds, grants, or other support were received during the preparation of this manuscript.
The authors have no relevant financial or non-financial interests to disclose.
Both authors contributed to the development and writing of this paper.
References
Ahn, J. 2023. Application of volumetric runout methods for structurally controlled highwall failures. Australian Geomechanics Journal, vol. 58, no. 4, pp. 85–94. doi.org/10.56295/AGJ5843
Bar, N., Nicoll, S., and Pothitos, F. 2016. Rock fall trajectory field testing, model simulations and considerations for steep slope design in hard rock. Proceedings of the First Asia Pacific Slope Stability in Mining Conference, Brisbane. pp. 457–466. doi.org/10.36487/ACG_rep/1604_29_Bar
Corominas, J. 1996. The angle of reach as a mobility index for small and large landslides. Canadian Geotechnical Journal, vol. 33, no. 2, pp. 260–271.
Ferrari, F., Thoeni, K., Giacomini, A., and Lambert, C. 2015. A new rockfall hazard assessment methodology for open-pit coal mines. Proceedings of Bowen Basin Symposium 2015, Brisbane, pp. 355–362.
Gkouvailas, A. 2014. Enhanced rock fall analysis based on field experiments in quarries. Master’s Thesis, Imperial College, London.
Heim, A. 1932. Landslides and Human Lives (Bergstruz and Menchen Leben). Translated by N. Skermer. BiTech Publishers, Vancouver, B.C. 195 p.
Hunter, G. and Fell, R. 2003. Travel distance angle for 'rapid' landslides in constructed and natural soil slopes. Canadian Geotechnical Journal, vol. 40, pp. 1123–1141.
McQuillan, A. and Bar, N. 2020. Open pit slope failure runout prediction. Proceedings of the International Symposium on Rock Mechanics, Eurock 2020, Trondheim. 8 p.
McQuillan, A., Canbulat, I., Payne, D., and Oh, J. 2018. New risk assessment methodology for coal mine excavated slopes. International Journal of Mining Science and Technology, vol. 28, no. 4, pp. 583–592. doi.org/10.1016/j.ijmst.2018.07.001
Nairn, L., Pasqua, F.D., and Payne, D. 2021. Improved prediction of runout distance for in situ highwall instability in Australian eastern coast coal mines. Proceedings of Second Slope Stability in Mining Conference 2021, Perth. pp. 501–512.
Preston, S. 2000. Teaching prediction intervals. Journal of Statistics Education, vol. 8, no. 3. doi.org/10.1080/10691898.2000.12131 297
Robotham, M.E., Wang, H., and Walton, G. 1995. Assessment of risk from rockfall from active and abandoned quarry slopes. Transactions of the Institution of Mining and Metallurgy Section A, vol. 10, pp. A25–A33.
Saroglou, H. and Bar, N. 2017. Predicting the primary impact and total rollout distances of rock falls based on cases in quarries and mines in Australia and the United Kingdom. Proceedings of the 51st US Rock Mechanics / Geomechanics Symposium, San Francisco. 8 p.
Whittall, J. 2015. Runout exceedance prediction for open pit slope failures. Master’s Thesis, University of British Columbia, Vancouver. u
5-8 August 2024 — 2nd Battery Materials Conference 2024
The Arena, Emnotweni Casino, Mbombela, Mpumalanga
Contact: Camielah Jardine
Tel: 011 538-0237, E-mail: camielah@saimm.co.za
Website: http://www.saimm.co.za
1-3 September 2024 — Hydrometallurgy Conference 2024
Hydrometallurgy for the Future
Hazendal Wine Estate, Stellenbosch, Western Cape, South Africa
Contact: Camielah Jardine
Tel: 011 538-0237, E-mail: camielah@saimm.co.za
Website: http://www.saimm.co.za
4-6 September 2024 — 7TH IFAC Workshop on Mining, Mineral and Metal Processing (IFAC MMM 2024)
Brisbane, Australia
Website: https://ifac.papercept.net/conferences/scripts/ start.pl
5-6 September 2024 — Mine Planning and Design Colloquium 2024
Electra Mining Nasrec, Johannesburg, South Africa
Contact: Camielah Jardine
Tel: 011 538-0237, E-mail: camielah@saimm.co.za
Website: http://www.saimm.co.za
16-17 September 2024 — The Control Conference Africa 2024
Balaclava, Mauritius, Website: https://cca2024.org/
18-21 September 2024 — Infacon XVII 2024 17TH International Ferro-Alloys Congress Beijing, China
Website: https://www.infacon17 net/?sid=2178&mid=577&v=108
29 September-3 October 2024 — IMPC 2024
XXXI IMPC-Internation Mineral Processing Congress 2024
National Harbor, Washington D.C.
Website: https://smeimpc.org/
1-4 October 2024 — Southern African Geophysical Association Windhoek
E-mail: chair@sagaconference.co.za
Website: https://sagaconference.co.za/
16-17 October 2024 — ESGS Conference 2024
ESG in the minerals industry challenges and opportunities
Focus Rooms, Modderfontein, Johannesburg, South Africa
Contact: Camielah Jardine
Tel: 011 538-0237, E-mail: camielah@saimm.co.za
Website: http://www.saimm.co.za
16-17 October 2024 — MESA Africa 2024 Summit
The Edge at Knightsbridge, Bryanston, Johannesburg, South Africa, Website: https://evt.to/asiuosimw
29 October 2024 — 20TH Annual Student Colloquium 2024
Mintek, Randburg, Johannesburg
Contact: Gugu Charlie
Tel: 011 538-0238, E-mail: gugu@saimm.co.za
Website: http://www.saimm.co.za
31 October - 1 November 2024 — SANCOT Symposium 2024
Cullinan Diamond Lodge, Cullinan, Pretoria
Advances in Tunnelling-A Portal to the Future
Contact: Gugu Charlie
Tel: 011 538-0238, E-mail: gugu@saimm.co.za
Website: http://www.saimm.co.za
6-8 November 2024 — MineSafe Conference 2024
Emperors Palace Convention Centre, South Africa
Contact: Camielah Jardine
Tel: 011 538-0237, E-mail: camielah@saimm.co.za
Website: http://www.saimm.co.za
11-12 November 2024 — Mintek@90 Conference 2024
Sandton Convention Centre, South Africa
Contact: Camielah Jardine
Tel: 011 538-0237, E-mail: camielah@saimm.co.za
Website: http://www.saimm.co.za
19-20 February 2025 — Mine Closure Conference 2024
Maslow Hotel, Sandton, South Africa
Contact: Camielah Jardine
Tel: 011 538-0237, E-mail: camielah@saimm.co.za
Website: http://www.saimm.co.za
7-8 April 2025 — 2ND Southern African Hydrogen and Fuel Cell Conference 2025
CSIR International Convention Centre, Pretoria
Contact: Camielah Jardine
Tel: 011 538-0237, E-mail: camielah@saimm.co.za
Website: http://www.saimm.co.za
16-22 November 2025 — The 12TH International Copper Conference (Copper 2025)
Phoenix, Arizona, USA
Website: https://www.extractionmeeting.org/ Extraction2025/Extraction2025/Copper2025/default.aspx
The following organizations have been admitted to the Institute as Company Affiliates
3M South Africa (Pty) Limited
A and B Global Mining (Pty) Ltd
acQuire Technology Solutions
AECOM SA (Pty) Ltd
AEL Mining Services Limited
African Pegmatite (Pty) Ltd
Air Liquide (PTY) Ltd
Alexander Proudfoot Africa (Pty) Ltd
Allied Furnace Consultants
AMEC Foster Wheeler
AMIRA International Africa (Pty) Ltd
ANDRITZ Delkor (Pty) Ltd
Anglo Operations Proprietary Limited
Anglogold Ashanti Ltd
Anton Paar Southern Africa (Pty) Ltd
Arcus Gibb (Pty) Ltd
ASPASA
Aurecon South Africa (Pty) Ltd
Aveng Engineering
Aveng Mining Shafts and Underground
Axiom Chemlab Supplies (Pty) Ltd
Axis House Pty Ltd
Bafokeng Rasimone Platinum Mine
Barloworld Equipment -Mining
BASF Holdings SA (Pty) Ltd
BCL Limited
Becker Mining (Pty) Ltd
BedRock Mining Support Pty Ltd
BHP Billiton Energy Coal SA Ltd
Blue Cube Systems (Pty) Ltd
Bluhm Burton Engineering Pty Ltd
Bond Equipment (Pty) Ltd
Bouygues Travaux Publics
Caledonia Mining South Africa Plc
Castle Lead Works
CDM Group
CGG Services SA
Coalmin Process Technologies CC
Concor Opencast Mining
Concor Technicrete
Council for Geoscience Library
CRONIMET Mining Processing
SA Pty Ltd
CSIR Natural Resources and the Environment (NRE)
Data Mine SA
DDP Specialty Products South Africa (Pty) Ltd
Digby Wells and Associates
DRA Mineral Projects (Pty) Ltd
DTP Mining - Bouygues Construction
Duraset
EHL Consulting Engineers (Pty) Ltd
Elbroc Mining Products (Pty) Ltd
eThekwini Municipality
Ex Mente Technologies (Pty) Ltd
Expectra 2004 (Pty) Ltd
Exxaro Coal (Pty) Ltd
Exxaro Resources Limited
Filtaquip (Pty) Ltd
FLSmidth Minerals (Pty) Ltd
Fluor Daniel SA (Pty) Ltd
Franki Africa (Pty) Ltd-JHB
Fraser Alexander (Pty) Ltd
G H H Mining Machines (Pty) Ltd
Geobrugg Southern Africa (Pty) Ltd
Glencore
Gravitas Minerals (Pty) Ltd
Hall Core Drilling (Pty) Ltd
Hatch (Pty) Ltd
Herrenknecht AG
HPE Hydro Power Equipment (Pty) Ltd
Huawei Technologies Africa (Pty) Ltd
Immersive Technologies
IMS Engineering (Pty) Ltd
Ingwenya Mineral Processing (Pty) Ltd
Ivanhoe Mines SA
Kudumane Manganese Resources
Leica Geosystems (Pty) Ltd
Loesche South Africa (Pty) Ltd
Longyear South Africa (Pty) Ltd
Lull Storm Trading (Pty) Ltd
Maccaferri SA (Pty) Ltd
Magnetech (Pty) Ltd
Magotteaux (Pty) Ltd
Malvern Panalytical (Pty) Ltd
Maptek (Pty) Ltd
Maxam Dantex (Pty) Ltd
MCC Contracts (Pty) Ltd
MD Mineral Technologies SA (Pty) Ltd
MDM Technical Africa (Pty) Ltd
Mech-Industries
Metorex Limited
Metso Minerals (South Africa) Pty Ltd
Micromine Africa (Pty) Ltd
MineARC South Africa (Pty) Ltd
Minerals Council of South Africa
Minerals Operations Executive (Pty) Ltd
MineRP Holding (Pty) Ltd
Mining Projections Concepts
Mintek
MIP Process Technologies (Pty) Limited
MLB Investment CC
Modular Mining Systems Africa (Pty) Ltd
MSA Group (Pty) Ltd
Multotec (Pty) Ltd
Murray and Roberts Cementation
Nalco Africa (Pty) Ltd
Namakwa Sands(Pty) Ltd
Ncamiso Trading (Pty) Ltd
Northam Platinum Ltd - Zondereinde
Opermin Operational Excellence
Optron (Pty) Ltd
Paterson & Cooke Consulting Engineers (Pty) Ltd
Perkinelmer
Polysius a Division of Thyssenkrupp
Industrial Sol
Precious Metals Refiners
Rams Mining Technologies
Rand Refinery Limited
Redpath Mining (South Africa) (Pty) Ltd
Rocbolt Technologies
Rosond (Pty) Ltd
Royal Bafokeng Platinum
Roytec Global (Pty) Ltd
RungePincockMinarco Limited
Rustenburg Platinum Mines Limited
Salene Mining (Pty) Ltd
Sandvik Mining and Construction
Delmas (Pty) Ltd
Sandvik Mining and Construction
RSA(Pty) Ltd
SANIRE
Schauenburg (Pty) Ltd
Sebilo Resources (Pty) Ltd
SENET (Pty) Ltd
Senmin International (Pty) Ltd
SISA Inspection (Pty) Ltd
Smec South Africa
Sound Mining Solution (Pty) Ltd
SRK Consulting SA (Pty) Ltd
Time Mining and Processing (Pty) Ltd
Timrite Pty Ltd
Tomra (Pty) Ltd
Trace Element Analysis Laboratory
Traka Africa (Pty) Ltd
Trans-Caledon Tunnel Authority
Administarator
Ukwazi Mining Solutions (Pty) Ltd
Umgeni Water
Webber Wentzel
Weir Minerals Africa
Welding Alloys South Africa
Worley

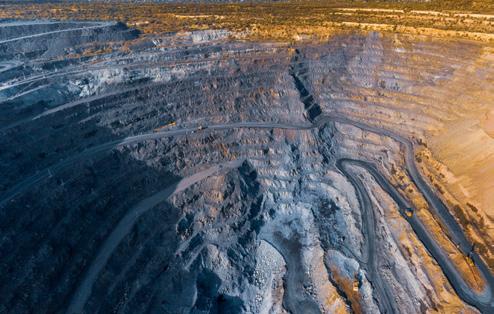
5-6 SEPTEMBER 2024
VENUE: ELECTRA MINING NASREC, JOHANNESBURG
The Southern African Institute of Mining and Metallurgy (SAIMM) Mine Planning colloquiums have consistently highlighted deficiencies in mine planning skills over the years. The colloquium held in 2012, 2014, 2017 and 2019 all emphasized the need for developing skill-sets with various mine planning tools within the context of multiple mining methods.
Newer tools and skills for the future of mining discussed in the 2019 colloquium suggests an acknowledgment of the evolving nature of the industry. This likely includes advancements in technology, such as automation, artificial intelligence, and data analytics, which are increasingly becoming integral to modern mine planning and operations.
By addressing these deficiencies and adapting to newer tools and skills, the mining industry can better meet the challenges and opportunities presented by evolving technologies, and changing market demands.
· Understand strategic plans and their impact to tactical and operational planning
• The importance of mineral resource estimation process and its influence of mine planning and design
• Minerals Processing
• The planning process design criteria – the starting point to good mine planning
• Optimizing the mine plan
ECSA Validated CPD Activity, Credits = 0.1 points per hour attended.
• Equipment selection
• Mine access – haul roads and declines – the neglected area of mining
• Financial technical evaluations and its importance to the mine planner.
• New technologies – Are they appropriate in mine planning.
Submit an abstract to be considered as presentations only at the colloquium.
Prospective presenters are invited to submit titles and abstracts of their presentations in English.
Only in-person presentations will be considered for this colloquium.
Abstracts should be no longer than 500 words and should be submitted to: Camielah Jardine, Head of Conferencing and Events, E-mail: camielah@saimm.co.za
The complete Proceedings volume will be made available on the internet for public access after the colloquium.
1 May 2024 - Submission of Abstracts
1 August 2024 - Submission of Presentation
No marketing presentations will be considered. All presentations must include case studies of actual work implementation.
Delegates attending the Mine Planning and Design Colloquium will also have complimentary access to the Electra Mining Expo Centre on the colloquium days
FOR FURTHER INFORMATION, CONTACT:
Camielah Jardine, Head of Conferences and Events
E-mail: camielah@saimm.co.za Tel: +27 011 538 0237 Web: www.saimm.co.za
Weir Minerals is a leading designer and manufacturer of mine dewatering solutions, slurry pumps, hydrocyclones, valves, screens, centrifuges, crushers, feeders, washers, conveyers, rubber lining, hoses and wearresistant linings for the global mining and minerals processing, sand and aggregate, and power and general industrial sectors. For more information contact us on +27 11 9292600