


As President of the Southern African Institute of Mining and Metallurgy (SAIMM), it is with immense pride and gratitude that I extend my heartfelt congratulations to the founding members, valued Fellows, Members, Associates, Students, Company Affiliates and longstanding SAIMM supporters and key stakeholders of the Institute, on the occasion of our 130th anniversary.
Since its establishment in 1894, SAIMM has been a trusted source of information regarding technological developments in the mining and metallurgical industries in Southern Africa. Our journey over the past 130 years has been marked by significant achievements by the organisation and its members, through innovative research and a steadfast commitment to initiate and implement new ideas.
Throughout the decades, SAIMM has provided a platform for knowledge sharing, professional development, and industry collaboration. We have navigated challenges, embraced opportunities and continually evolved to discuss the needs of our dynamic sector. As we celebrate this historic milestone, we also reflect on the enduring values of integrity, innovation, and community that have guided us.
SAIMM has remained committed to continuously engaging members, with the overarching goal of bringing the mining and metallurgical fraternity, its research and education personnel, and students, together in one organisation. This milestone is a testament to the dedication and hard work of our members, past and present, whose contributions have shaped our Institute into a leader in our field.
Looking ahead, I am excited about the future of SAIMM. We are committed to fostering the next generation of industry leaders, through the Young Professionals Council, driving sustainable practices through our various committees, and promoting the advancement of the mining and metallurgical sector through research. I believe through harnessing the collective efforts of our industry partners, members and key stakeholders, we will continue to strengthen the minerals industry, ensuring a positive impact on society and the economy.
Thank you to our members and partners for your unwavering dedication and contributions. Together, we have built a legacy that we can all be proud of.
The Institute is an unwavering advocate for minerals industry professionals, nurturing their capabilities, and creating an environment where their expertise contributes to the world's development.
We do this by creating a platform for and facilitating substantive, responsible and impactive trans-disciplinary collaboration and fundamentally diversifying the Institute’s membership and its culture.
We will change the way that the world mines though a commitment to informing, educating, convening and engaging with all professionals in the minerals sector.
Here's to celebrating 130 years of technical excellence and to many more years of success and progress.
OFFICE BEARERS AND COUNCIL FOR THE 2023/2024 SESSION
Honorary President
Nolitha Fakude
President, Minerals Council South Africa
Honorary Vice Presidents
Gwede Mantashe
Minister of Mineral Resources and Energy, South Africa
Ebrahim Patel
Minister of Trade, Industry and Competition, South Africa
Blade Nzimande
Minister of Higher Education, Science and Technology, South Africa
President
W.C. Joughin
President Elect
E. Matinde
Senior Vice President
G.R. Lane
Junior Vice President
T.M. Mmola
Incoming Junior Vice President
M.H. Solomon
Immediate Past President
Z. Botha
Honorary Treasurer
E. Matinde
Ordinary Members on Council
W. Broodryk M.C. Munroe
Z. Fakhraei S. Naik
R.M.S. Falcon (by invitation) G. Njowa
B. Genc
S.J. Ntsoelengoe
K.M. Letsoalo S.M. Rupprecht
S.B. Madolo
A.T. van Zyl
F.T. Manyanga E.J. Walls
K. Mosebi
Co-opted Council Members
M.A. Mello
Past Presidents Serving on Council
N.A. Barcza C. Musingwini
R.D. Beck S. Ndlovu
J.R. Dixon J.L. Porter
V.G. Duke M.H. Rogers
I.J. Geldenhuys D.A.J. Ross-Watt
R.T. Jones G.L. Smith
A.S. Macfarlane W.H. van Niekerk
G.R. Lane – TP Mining Chairperson
Z. Botha – TP Metallurgy Chairperson
K.W. Banda – YPC Chairperson
S. Nyoni – YPC Vice Chairperson
Branch Chairpersons
Botswana Vacant
DRC Not active
Johannesburg N. Rampersad
Limpopo S. Zulu
Namibia Vacant
Northern Cape I. Tlhapi
North West I. Tshabalala
Pretoria Vacant
Western Cape A.B. Nesbitt
Zambia J.P.C. Mutambo (Interim Chairperson)
Zimbabwe Vacant
Zululand C.W. Mienie
*Deceased
* W. Bettel (1894–1895)
* A.F. Crosse (1895–1896)
* W.R. Feldtmann (1896–1897)
* C. Butters (1897–1898)
* J. Loevy (1898–1899)
* J.R. Williams (1899–1903)
* S.H. Pearce (1903–1904)
* W.A. Caldecott (1904–1905)
* W. Cullen (1905–1906)
* E.H. Johnson (1906–1907)
* J. Yates (1907–1908)
* R.G. Bevington (1908–1909)
* A. McA. Johnston (1909–1910)
* J. Moir (1910–1911)
* C.B. Saner (1911–1912)
* W.R. Dowling (1912–1913)
* A. Richardson (1913–1914)
* G.H. Stanley (1914–1915)
* J.E. Thomas (1915–1916)
* J.A. Wilkinson (1916–1917)
* G. Hildick-Smith (1917–1918)
* H.S. Meyer (1918–1919)
* J. Gray (1919–1920)
* J. Chilton (1920–1921)
* F. Wartenweiler (1921–1922)
* G.A. Watermeyer (1922–1923)
* F.W. Watson (1923–1924)
* C.J. Gray (1924–1925)
* H.A. White (1925–1926)
* H.R. Adam (1926–1927)
* Sir Robert Kotze (1927–1928)
* J.A. Woodburn (1928–1929)
* H. Pirow (1929–1930)
* J. Henderson (1930–1931)
* A. King (1931–1932)
* V. Nimmo-Dewar (1932–1933)
* P.N. Lategan (1933–1934)
* E.C. Ranson (1934–1935)
* R.A. Flugge-De-Smidt (1935–1936)
* T.K. Prentice (1936–1937)
* R.S.G. Stokes (1937–1938)
* P.E. Hall (1938–1939)
* E.H.A. Joseph (1939–1940)
* J.H. Dobson (1940–1941)
* Theo Meyer (1941–1942)
* John V. Muller (1942–1943)
* C. Biccard Jeppe (1943–1944)
* P.J. Louis Bok (1944–1945)
* J.T. McIntyre (1945–1946)
* M. Falcon (1946–1947)
* A. Clemens (1947–1948)
* F.G. Hill (1948–1949)
* O.A.E. Jackson (1949–1950)
* W.E. Gooday (1950–1951)
* C.J. Irving (1951–1952)
* D.D. Stitt (1952–1953)
* M.C.G. Meyer (1953–1954)
* L.A. Bushell (1954–1955)
* H. Britten (1955–1956)
* Wm. Bleloch (1956–1957)
* H. Simon (1957–1958)
* M. Barcza (1958–1959)
* R.J. Adamson (1959–1960)
* W.S. Findlay (1960–1961)
* D.G. Maxwell (1961–1962)
* J. de V. Lambrechts (1962–1963)
* J.F. Reid (1963–1964)
* D.M. Jamieson (1964–1965)
* H.E. Cross (1965–1966)
* D. Gordon Jones (1966–1967)
* P. Lambooy (1967–1968)
* R.C.J. Goode (1968–1969)
* J.K.E. Douglas (1969–1970)
* V.C. Robinson (1970–1971)
* D.D. Howat (1971–1972)
* J.P. Hugo (1972–1973)
* P.W.J. van Rensburg (1973–1974)
* R.P. Plewman (1974–1975)
* R.E. Robinson (1975–1976)
* M.D.G. Salamon (1976–1977)
* P.A. Von Wielligh (1977–1978)
* M.G. Atmore (1978–1979)
* D.A. Viljoen (1979–1980)
* P.R. Jochens (1980–1981)
* G.Y. Nisbet (1981–1982)
A.N. Brown (1982–1983)
* R.P. King (1983–1984)
J.D. Austin (1984–1985)
* H.E. James (1985–1986)
H. Wagner (1986–1987)
* B.C. Alberts (1987–1988)
* C.E. Fivaz (1988–1989)
* O.K.H. Steffen (1989–1990)
* H.G. Mosenthal (1990–1991)
R.D. Beck (1991–1992)
* J.P. Hoffman (1992–1993)
* H. Scott-Russell (1993–1994)
J.A. Cruise (1994–1995)
D.A.J. Ross-Watt (1995–1996)
N.A. Barcza (1996–1997)
* R.P. Mohring (1997–1998)
J.R. Dixon (1998–1999)
M.H. Rogers (1999–2000)
L.A. Cramer (2000–2001)
* A.A.B. Douglas (2001–2002)
* S.J. Ramokgopa (2002-2003)
T.R. Stacey (2003–2004)
F.M.G. Egerton (2004–2005)
W.H. van Niekerk (2005–2006)
R.P.H. Willis (2006–2007)
R.G.B. Pickering (2007–2008)
A.M. Garbers-Craig (2008–2009)
J.C. Ngoma (2009–2010)
G.V.R. Landman (2010–2011)
J.N. van der Merwe (2011–2012)
G.L. Smith (2012–2013)
M. Dworzanowski (2013–2014)
J.L. Porter (2014–2015)
R.T. Jones (2015–2016)
C. Musingwini (2016–2017)
S. Ndlovu (2017–2018)
A.S. Macfarlane (2018–2019)
M.I. Mthenjane (2019–2020)
V.G. Duke (2020–2021)
I.J. Geldenhuys (2021–2022)
Z. Botha (2022-2023)
S.O. Bada
R.D. Beck
P. den Hoed
I.M. Dikgwatlhe
M. Erwee
B. Genc
R Hassanalizadeh
R.T. Jones
W.C. Joughin
A.J. Kinghorn
D.E.P. Klenam
J. Lake
H.M. Lodewijks
D.F. Malan
C. Musingwini
S. Ndlovu
P.N. Neingo
S.S. Nyoni
M. Phasha
P. Pistorius
P. Radcliffe
N. Rampersad
Q.G. Reynolds
I. Robinson
S.M. Rupprecht
K.C. Sole
T.R. Stacey
D. Vogt
F. Uahengo
International Advisory Board members
R. Dimitrakopolous
R. Mitra
A.J.S. Spearing
E. Topal
D. Tudor
Editor /Chairperson of the Editorial Board
R.M.S. Falcon
Typeset and Published by
The Southern African Institute of Mining and Metallurgy PostNet Suite #212 Private Bag X31 Saxonwold, 2132
E-mail: journal@saimm.co.za
Printed by Camera Press, Johannesburg
Advertising Representative
Barbara Spence
Avenue Advertising


Journal Comment: Value provided by the Institute by T.R Stacey iv
President’s Corner: Relaunch of the Namibian Branch and Rare Earths Conference by W.C. Joughin .
Obituary: A tribute to Dr Evert Hoek
THE INSTITUTE, AS A BODY, IS NOT RESPONSIBLE FOR THE STATEMENTS AND OPINIONS ADVANCED IN ANY OF ITS PUBLICATIONS.
Copyright© 2024 by The Southern African Institute of Mining and Metallurgy. All rights reserved. Multiple copying of the contents of this publication or parts thereof without permission is in breach of copyright, but permission is hereby given for the copying of titles and abstracts of papers and names of authors. Permission to copy illustrations and short extracts from the text of individual contributions is usually given upon written application to the Institute, provided that the source (and where appropriate, the copyright) is acknowledged. Apart from any fair dealing for the purposes of review or criticism under The Copyright Act no. 98, 1978, Section 12, of the Republic of South Africa, a single copy of an article may be supplied by a library for the purposes of research or private study. No part of this publication may be reproduced, stored in a retrieval system, or transmitted in any form or by any means without the prior permission of the publishers. Multiple copying of the contents of the publication without permission is always illegal. U.S. Copyright Law applicable to users In the U.S.A. The appearance of the statement of copyright at the bottom of the first page of an article appearing in this journal indicates that the copyright holder consents to the making of copies of the article for personal or internal use. This consent is given on condition that the copier pays the stated fee for each copy of a paper beyond that permitted by Section 107 or 108 of the U.S. Copyright Law. The fee is to be paid through the Copyright Clearance Center, Inc., Operations Center, P.O. Box 765, Schenectady, New York 12301, U.S.A. This consent does not extend to other kinds of copying, such as copying for general distribution, for advertising or promotional purposes, for creating new collective works, or for resale.
Honorary Legal Advisers
M H Attorneys
Auditors
Genesis Chartered Accountants
Secretaries
The Southern African Institute of Mining and Metallurgy 7th Floor, Rosebank Towers, 19 Biermann Avenue, Rosebank, 2196
PostNet Suite #212, Private Bag X31, Saxonwold, 2132 E-mail: journal@saimm.co.za
Telephone (011) 463-7940 . E-mail: barbara@avenue.co.za
ISSN 2225-6253 (print) . ISSN 2411-9717 (online)


Prediction of physico-mechanical rock characteristics from electrical resistivity tests by S. Kahraman and E. Öğretici
This paper examines the usability of an electrical resistivity test – a non-destructive measurement – for the prediction of physical and mechanical rock characteristics. It was found that electrical resistivity measurement can be reliably used for estimating physical and mechanical rock characteristics.
Impact of Competent Persons’ judgements in Mineral Resources classification by S.K.A. Owusu and K. Dagdelen
This paper investigates the impacts associated with classification results due to different Competent Persons’ judgements, using same drill hole datasets. The varying results from this work underpin the need for the mining industry to develop a uniform Mineral Resources and Reserves classification framework that can minimize or avoid significant discrepancies that lead to potential misleading public disclosures.
Development status of coal industries in the world’s major coal-producing countries by X. Liu and G. Song .......................................................................................
This paper has analyzed the coal production and consumption, coal import and export, and coal prices in China and other major coal producing countries during the past four decades. The analysis shows that global coal production and consumption have declined for the last three years, in striking contrast with the continuous growth for most of the past 35 years. Coal prices rose in the world’s four major coal markets in 2016 after a consecutive four years of declining prices.
Optimizing the cut-off grade for tabular gold deposits, considering the South African gold tax and mineral resource royalty regime by C.C. Birch and F.T. Cawood
This article explores how the profitability ratio in the mineral resource royalty formulae interacts with the gold tax formula in South African gold mines, devising a strategy for cut-off grade optimisation. The study focuses on nine narrow, tabular gold mines. Enhanced resource utilisation reduces necessary development and overall costs, allowing for a reduction in the cut-off grade and ultimately more profit.
Models for analysing the economic impact of ore sorting, using ROC curves by A. Drumond, A.L. Rodrigues, J.F.C.L. Costa, F.G. Niquini, and M.G. Lemos
This study investigates the application of machine learning models trained using data from the output of an ore sorting Dual-Energy X-ray apparatus in a gold mine. The results of the models showed AUC scores up to 0.85 for the classification models and a maximum reward condition Fpr/Tpr around 0.5/0.9 for a simplified economic model.
Influence of blasting charge distribution on the energy required for communition of rock by J.E. Seccatore, M. Cardu, and T. Marin ......................................................................
This study focuses on the influence of blasting on the internal resistance of the fragments of blasted rock; in particular it addresses the influence of the distribution of charges in space. Results show the correlations between charge distributions and the specific energy of mechanical comminution.
Valorization potentials of phosphate tailings at Minjingu mines in Northern Tanzania by D.D. Mdachi, A.M. Rugaika, and R.L. Machunda ............................................................. 415
This study examined phosphate concentrations in phosphate tailings dumps in Minjingu mine, Tanzania. Our investigation revealed that phosphate concentrations in Minjingu phosphate tailings may be sufficient to be recovered for commercial applications.


This year the SAIMM will celebrate its 130th ‘birthday’. In this commentary I would like to focus on the value and service that the Institute has provided to the mining and metallurgical industries.
The SAIMM is a very valuable medium through which members in industry, academics, and researchers can interact with others in seminars and conferences, and through publication in the Journal. These conferences and publications have often focused on Southern African conditions and operations, but numerous international conferences have also been hosted. Such conferences provide opportunity for informal exchange of information between delegates, which adds value beyond that of the published proceedings. The proceedings of the more recent conferences (in the electronic era) are all open access, and it is expected that soon they will be searchable online by keywords. This will make many practical papers readily available. The Journal is also open access, and papers can be easily retrieved through an online search. The Journal has recently been attracting a significant number of contributions from other countries. In the current era in which access to international journals is costly, and many open access journals charge authors for publication, the Institute can be very proud of the fact that it provides the free, open access service to all, and hence value to the mining and metallurgical industries. I would now like to focus further on publication ‘value’.
In his paper ‘Journal impact factors – the good, the bad and the ugly’ in the September 2022 issue of the SAIMM Journal, Professor Francois Malan questioned the value of journal impact factors and numbers of citations as a measure of research excellence. He indicated that there is a growing movement towards an alternative approach. Numbers of citations, and thus impact factors, are open to manipulation by researchers and research organizations to ‘demonstrate’ research excellence. However, there is a significant difference between numbers of citations (often manipulated) and numbers of influential citations. As an example, an academic colleague of mine was invited to co-author a paper to which he had provided editing input. Based on some 200 citations, this proved to be his ‘best’ paper, but it only achieved a single ‘influential’ citation. A citation in a paper that deals with the cited information in some detail is an influential one, rather than a citation that just appears, with no further ‘use’ of its content. I suggest that the value created by a paper would be a significantly better measure of research excellence than citations or impact factors.
In engineering, and particularly in the mining and metallurgical sphere, operators will frequently make use of published information for the benefit of their operation but will rarely prepare any paper in which they would cite that information. Therefore, they have gained value from the published information, and perhaps this is a much better measure of research excellence than citations. In this context ‘value’ has many meanings. It can be financial: for example, a student of mine described a case in which additional geotechnical investigation yielded a projected financial benefit of 70 times the cost of the investigations; but perhaps more importantly it will include ‘benefit to the world values’ such as health and safety, social, environmental, humanitarian, and ecological values.
In the mining and metallurgical industries there are regular examples of significant achievements and problems. Publication of the bases of the achievements, and the causes of the problems, could be of considerable value to other companies in the broader mining sphere and thus create value in general. By way of contrast, an academic publication in an area of scientific interest may achieve many academic citations but provide no real value to the mining and metallurgical industries.
Both industry and research personnel are therefore encouraged to publish solutions to problems and explanations of problems, and thus create value for the benefit of the industry at large. Perhaps mining companies should quantify the value that they aim for in relative terms – for example, to be in the upper quartile regarding safety, to be in the upper quartile regarding environmental control, or to be in the lower quartile of the cost curve. This would give researchers and operators guidelines against which to measure the value of their publications.
There are relatively few mining-related journals published in the world, and the Institute and its members can be proud that our Journal, which has now been in publication for 70 years, is one of those and is internationally recognized. The SAIMM Journal grew out of that of the Chemical Metallurgical and Mining Society of South Africa, which began publication in about 1900. Thus, we can also be proud that the SAIMM has been providing service and value to our own industries and those in other countries for 130 years now. I trust it will continue to do so for many years in the future.
T.R. Stacey


he Namibian Branch of the SAIMM was relaunched on 18 June 2024 in Swakopmund, Namibia. Like several other branches, it had become inactive during COVID. Originally established in 2007, the Branch had been quite active before the pandemic, hosting several local events. A few Namibian-based members collaborated to plan the relaunch to coincide with the Rare Earths Conference scheduled for 18–20 June. I had the privilege of attending the relaunch and Conference to address delegates on behalf of the SAIMM.
The relaunch was attended by 27 delegates and the meeting was opened by Kesia Kariko, a Senior Metallurgist with Andrada Mining at Uis mine. The SAIMM Presidential Address was delivered, followed by the election of the Branch Committee. Tomas Aipanda, a mining engineer and current Mining Shift Superintendent at Swakop Uranium, was elected as Chair, while Himeezembi Hengari, a Mining Lecturer from the Namibian University of Science and Technology (NUST), was elected as Vice Chair. Kesia Kariko was elected Secretary. Tomas Aipanda then presented his plans for the Branch, followed by a keynote presentation by Irvinne Simataa, the Executive Vice President of Swakop Uranium. He highlighted the exciting prospects for mining in Namibia, emphasizing the abundance of critical mineral deposits and the quality of education in the country. The presentation also explored how the Namibian minerals industry could collaborate with the SAIMM.
The day before the Conference and preceding the relaunch, a very interesting workshop on rare earths was presented by Damian Connelly of METS. I took advantage of the opportunity to learn a little bit about rare earths.
Rare earth elements (REEs) have unique and useful properties. They have applications in magnetics, batteries, polishing powders, glass and ceramics, fluid cracking catalysts, autocatalysts, phosphors, and fibre optics. Demand is driven by computers, mobile phones, monitors, TVs, medical equipment, mirrors, cameras, hybrid vehicles, electric vehicles, fuel cells, maglev trains, wind turbines, fluorescent lights, petroleum production, and low-emission vehicle exhausts. It is difficult to imagine how the modern world would function without REEs. Decarbonization will further increase the demand for these critical elements.
The REEs comprise scandium (Sc), yttrium (Y), and the lanthanide series: lanthanum (La), cerium (Ce), praseodymium (Pr), neodymium (Nd), samarium (Sm), europium (Eu), gadolinium (Gd), terbium (Tb), dysprosium (D), holmium (Ho), erbium (Er), thulium (Tm), ytterbium (Yb), and lutetium (Lu). Rare earths occur as oxides, carbonates, phosphates, and silicides in more than 160 minerals, but they are primarily sourced from monazite, bastnasite, and xenotime. These minerals invariably contain significant quantities of uranium (U) and thorium (Th), which are radioactive. The concentration of individual REEs depends on the minerals and nature of the geological deposits in which they are found. The value of the mineral resource depends on the quantities and values of individual REEs. Heavy or yttric REEs (Y and Tb to Lu) are less common and significantly more valuable. The term rare earths is perhaps a misnomer, since the combined REEs are more abundant than carbon in the Earth’s crust, but they rarely occur in mineable concentrations and there are no naturally occurring elemental forms.
In addition to the challenges in finding suitable deposits, the processing of rare earths is difficult, particularly for heavy REEs.Also, there is an increased risk of radiation exposure during processing and the disposal of radioactive waste (waste water and residue) must be carefully managed. Environmental management plans (EMPs) must address surface and groundwater impacts, and prevention of harm to fauna and flora. Environmental, Social and Governance (ESG) aspects are therefore a key component of any REE project.
Currently, China dominates the rare earths market, accounting for approximately 60% of mine production and close to 90% of processing and refining, and perhaps 99.9% of heavy REEs. As recently as 2005, China’s share of global production was 98%, but production in other countries has steadily increased to meet the growing demand, although processing outside of China has clearly not increased to the same extent. China announced a ban on the export of rare earth extraction and separation technologies in December 2023, and introduced further restrictions aimed at protecting supplies in June this year. This highlights the necessity to mine and process REEs outside of China.
Significant REE mineral deposits have been discovered in Southern Africa and there is potential for further exploration. The challenges in unlocking these resources lie in the successful extraction and separation of all REEs and the responsible management of waste disposal.
The Second International Conference on Rare Earths brought together experts to discuss the latest advancements in the exploration, extraction, and processing of REEs. The theme ‘Global Impact and Sustainable Supply’ was particularly apt. Overall, the Conference highlighted the global significance of REEs and the ongoing efforts to optimize exploration, extraction, and processing. The discussions underscored the importance of sustainable practices and innovative technologies in meeting the growing demand for REEs in high-tech and green energy applications. The event served as a pivotal platform for knowledge exchange, collaboration, and fostering advances in the REE industry. Congratulations to the Organizing Committee and the Secretariat for putting together a most successful conference.
W.C. Joughin President, SAIMM
By Jaco Lotheringen, Managing Director, Ukwazi
Wheel scrapers originated in the late 1930’s as a civil engineering application used for earth moving. The scraper has a pan with a front cutting edge that cuts the material into the hopper that has a movable ejection system. Historically, it has been commonly used in the civil engineering industry for land levelling for surface infrastructure development, dam building, and earth moving in the form of shallow salt, coal, sand, or similar type materials over large target areas.
Over the last few years, the use of articulated dump truck (“ADT”) pulled scrapers, transitioned more and more towards conventional mining applications.
This recent drive in the mining industry can largely be attributed to the following three prevailing conditions:

y Reliable, large, heavy duty mining grade ADT pull scrapers are now available in the market, supported by localised infrastructure
y Mining operations are under increasing cost pressure and are continuously looking at ways to improve their production and cost performance
y With the ever-increasing focus on sustainable mining practices, mining houses have increased their focus on methods to reduce their environmental, social and governmental (“ESG”) footprint, specifically with savings on water, reduced diesel consumption and lower emissions as priorities.
In a strategic move set to transform the landscape of earthmoving and mining operations in sub-Saharan Africa, K-Tec Earthmovers, a leading manufacturer of mining-spec earthmoving scrapers, has announced a partnership with Ukwazi, a prominent mining services provider in sub-Saharan Africa. The introduction of ADT pull scraper applications to the sub-Saharan mining sector aims to reduce the cost of dry mining methods for suitable applications and replace problematic wet mining applications.
The available K-Tec, mining-grade ADT pull scrapers range from a maximum load capacity of 30.8t to 68.6t for single units, to 80t in a train configuration, powered by a single, standard 40t ADT power horse. These robust scrapers are easy to deploy, operate and maintain, and are fundamentally very different from the dual-engine motorised scrapers and agricultural specification scrapers historically used in the civil industry. The K-Tec ADT pull scrapers have been moving material for more than 20 years and on all seven continents. They have a proven track record of stripping overburden, mine reclamation, haul road maintenance, and transportation of mineralized material.
The material suitable for ADT pull scraper mining is generally loose material of a sufficient size distribution to be self-loaded, even if it contains isolated boulders of up to 300mm in diameter. When cutting and loading consolidated or partially consolidated in situ material, the hardness must be appropriate for mechanical cutting, based on the material-specific three-piece cutting edge. The targeted material must be sufficiently dry for ADTs to operate safely.
When fully loaded, a third of the load is transferred to the hitch, to promote traction on the ADT horse, and to limit the maximum load per tyre on the pull scraper back axle. The maximum load per wheel for the fully loaded 1237 ADT pull scraper is 10.2t and 14.5t in a train configuration. This is for an 80t load train, pulled by a single 40t ADT. Due to the innovative pull scraper design, the load is well distributed to allow for a balance between traction and load per wheel
for optimal performance, when working under soft underfoot conditions.
3.1. Top soil and soft material for Cutback and Strip mining
The ADT pull scraper mining method for topsoil and softs benches is similar to the conventional load and haul methodology, except that a working bench loader is not required, and that a dozer is not required on the waste stockpile to level the dumped material. The ADT pull scraper mining method is self-loading on the loading bench and self-levelling on the dumping area.
When used in a train configuration, the load safely hauled by a single 40t ADT is double that of the same ADT in a conventional load and haul application. A dozer is required on the loading area for push-assist while loading and to move topsoil and sand in the corners of the block, into the cutting path of the ADT pull scraper train.
3.2. Tailing storage facilities
Where the ADT pull scraper functions as an alternative to wet mining applications, the purpose would be to replace selected hydraulic mining applications in cases where water is scarce or comes at a significant cost, or where the environmental permitting process for wet mining is expected to be problematic. In these cases, the operational cost of dry ADT pull scraper mining is significantly lower than the alternative of conventional load and haul. For wet mining applications, wet material handling to the material destination is required. This comes at a significant capital requirement due to the inherent specialization, complexity of the required infrastructure and reliable bulk services supply (electricity and water).
For dry mining applications, the production rate is generally not limited by mining activities, but more by the capacity of the (wet or dry) material handling, transport and processing systems. This could allow for significantly higher production rates per facility than with other methods. Ukwazi developed safe, efficient and cost-effective TSF slope reclamation mining methods with semi-mobile or fixed load out facilities
and material handling systems based on proven methods previously applied world-wide on TSFs and similar facilities.
Dry sand mining methods are common at heavy mineral sands operations, either as primary production method, for the mining of outlier deposits and for dredge pond construction. This ADT pull scraper application is probably the most used historically.
Salt is produced through solar evaporation from sea water or salt lakes. Based on the exposure to wind and the sun, the water evaporates from the shallow pools, leaving the salt behind. The salt is harvested through dry opencast mining methods when it reached a specific thickness. The salt is either cut by a surface miner or ripped by a dozer or wheel grader and left in windrows. ADT train, pull scrapers self-loads the salt from these windrows, and move it to the central material handling system or process facility.
The use of surface miners is becoming more popular, specifically for bauxite, manganese and salt mines throughout sub-Saharan Africa. The surface miner mining methods are fully integrated with a hauling solution to the targeted destination.
The ‘direct loading’ method is based on direct casting into a truck. The ‘side casting’ method sees the cut material stacked on stockpiles and loaded onto trucks by a front-end loader, resulting in a significant in-pit stockpile inventory requirement. The ‘cut to ground’ method is a popular method due to the inherent de-coupling of the rock breaking, loading and hauling activities. For the ‘cut to ground’ method, the ADT pull scrapers in a train configuration self-load the windrows of broken material and hauls it to the centralized position for a cost effective, and safe solution.
The suitable soil types for the ADT pull scraper mining application is topsoil, sand, soil, clay, hardpan or a high-density sub-soil, coal, salt, material mechanically broken by surface miners or ripped hard layers in a
soft material matrix, mineral residue deposits and TSFs. ADT pull scrapers, operated in a train configuration for appropriate applications, has a significant advantage relative to conventional load mining solutions historically used in sub-Saharan Africa for the following reasons:
y Less capital intensive: Pull scrapers require less equipment (~50% less horsepower) to move the same unit of material over the same distance relative to conventional truck and shovel operations for a lower dry unit cost
y Lower number of staff: Less maintenance personnel and operators for the same unit of material (~50% less personnel) moved relative to a truck and shovel/ excavator operation due to the lower number of engines and the low maintenance requirement of the pull scraper unit. This relates to less personnel exposure to injury and lower dry unit cost
y Lower centre of gravity when dumping material: Due to the high centre of gravity of ADT, the risk of rolling over, specifically while back-tipping in soft or uneven underfoot conditions is negated by the use of ADT pull scrapers
y K-Tec scrapers excel in soft ground conditions In comparison to traditional motor scrapers that only have four tyres, and ADT and shovel/ excavator applications with six tyres per load, the pull scraper and ADT combination has 10 tyres spaced evenly across the machine, providing maximum flotation in soft and wet underfoot conditions
y ESG advantage: Additional to the lower level of carbon emissions relative to a conventional load and haul operation, the pull scraper application has a significant advantage relative to hydrological mining methods because of the water consumption, the associated water contamination and risk of contamination to surrounding areas
y Significantly lower fuel consumption: Because you have less horsepower to move the same unit of material over similar distances. The horsepower reduction is generally more than half. This directly relates to a significant saving in fuel consumption, a lower unit cost and lower levels of carbon emissions
y The basis of operation is close to a continuous operation with loading and dumping while moving with no waiting for trucks as with a conventional load and haul operation.
The demand for metals and minerals continues to increase at a faster pace as the average consumers’ desire for electronic goods and mechanical equipment is not slowing down and the drive to clean energy transitions gathers pace. Highly volatile international inflation rates, the increasing cost of electricity, and ESG factors are just some of the external pressures that drives the upwards trend of mining costs. Internal cost pressures are affected by the fact that fewer large-scale, high-grade mineral deposits are being discovered. A significant portion of the discovered large-scale, high-grade deposits are in remote locations and will require significant capital investment in terms of local and regional infrastructure to unlock the opportunity.
This means that the available and potentially economic mining projects are getting smaller, deeper, have lower economic grades, and lower process recoveries and yields. This results in a higher saleable product cost, increased liabilities and mines that generate less revenue. Deeper ore bodies lead to increased waste stripping costs for surface operations, and capitalintensive underground mines with a lower flexibility on unit cost and production rate.
The role that the mining industry plays in the sustainable supply of metals and minerals is significant. To responsibly sustain our modern society, we need to constantly look at ways to produce more saleable products, despite the challenging physical parameters of the available ore bodies, while ever-increasing our focus on cost-effective sustainable mining practices that are low on harmful emissions and protect scarce water resources. The introduction of ADT pull scrapers have a role to play in the reduction of cost, and diesel and water consumption on sub-Saharan mines.


Affiliation:
1Mining Engineering Department, Hacettepe University, Ankara, Turkey
2Graduate School of Natural and Applied Sciences, Niğde Omer Halisdemir University, Niğde, Turkey
Correspondence to:
S. Kahraman
Email: sairkahraman@yahoo.com
Dates:
Received: 7 Nov. 2023
Revised: 12 Mar. 2024
Accepted: 12 Mar. 2024
Published: July 2024
How to cite:
Kahraman, S. and Öğretici, E. 2024. Prediction of physicomechanical rock characteristics from electrical resistivity tests. Journal of the Southern African Institute of Mining and Metallurgy, vol. 124, no. 7. pp. 361–370
DOI ID:
http://dx.doi.org/10.17159/24119717/3191/2024
ORCID: S. Kahraman
http://orcid.org/0000-0001-7903-143X
by S. Kahraman1 and E. Öğretici2
Abstract
The indirect estimation of intact rock properties is particularly useful for preliminary investigations in engineering projects. In this paper we examine the usability of electrical resistivity, a nondestructive measurement, for the prediction of physical and mechanical rock characteristics. Physico-mechanical tests (uniaxial compression, Brazilian tensile, density, and porosity tests) and electrical resistivity measurements were performed on specimens of 36 rock types. Before the resistivity tests, the specimens were completely saturated with saline solution. Evaluation of the test results showed that there are medium or strong correlations between resistivity and rock properties. There are also strong or stronger correlations between the two parameters for the rock classes. The regression equations developed were statistically tested, and their validity was confirmed. The results were also compared with previous studies. The conclusion is that electrical resistivity measurement can be used for reliably estimating physical and mechanical rock characteristics.
Keywords
electrical resistivity, rock strength, density, porosity
Introduction
Among the characteristics of intact rocks, unconfined compressive strength (UCS), Brazilian tensile strength (BTS), density, and porosity are important parameters. These physico-mechanical rock characteristics are often used in various engineering projects for different purposes. Civil engineers use them, for instance, when designing engineering structures that are constructed on or in rock masses. On the other hand, mining engineers design rock excavation projects using the UCS and BTS. Density and porosity values are essential parameters for geoscientists or engineers working in the field of oil and gas exploration.
Well-prepared, smooth core specimens are essential for conducting standard tests to determine physicomechanical rock characteristics. For very soft rock types, preparing the required samples is difficult and sometimes impossible. On the other hand, direct test methods are overpriced, tedious, and time-consuming for preliminary studies. Therefore, many researchers have recommended the use of indirect test methods to predict the physico-mechanical characteristics of rock formations, especially for preliminary studies (Broch and Franklin, 1972; Gunsallus and Kulhawy, 1984; Sachapazis, 1990; Kahraman, 2001; Ulusay, Gokceoglu, and Sulukcu, 2001; Yasar and Erdogan 2004; Fener et al., 2005; Kahraman, Fener, and Kozman. 2012; Kahraman et al., 2017; Kahraman and Ince, 2023). Schmidt hammer, point load, sonic velocity, and block punch index tests are the common indirect testing methods.
Although they are practical and inexpensive, indirect tests have some disadvantages. They cannot be applied any time and anywhere, and on any type of rock or specimen. Rock specimens are disturbed during point load and block punch index tests. The Schmidt hammer test cannot be conducted on soft or very weak rocks. It is also unreliable for very hard rocks. On the other hand, core specimens of hard rocks can be broken under the impacts of the Schmidt hammer. Although it can be applied to both smooth and unshaped specimens, the conversion factor between the point load index and the UCS varies in a wide range according to rock types or classes. Similarly, the correlations between sonic velocity and rock properties vary considerably according to the rock types or classes.
An electrical resistivity test, which is a nondestructive technique, may be a viable indirect testing technique to predict rock characteristics if good correlations are established for all rock classes. The method can be applied to any type of rock and is simple, inexpensive, and quick.
Electrical conductivity and resistivity have been widely used for the characterization of ground or exploration for subsurface features. Many scientists have used electrical measurements in the laboratory to characterize rock properties and derived correlations with porosity and some other rock properties (Archie, 1942; Brace, Orange, and Madden, 1965; Collett and Katsube, 1973; Shankland and Wa, 1997; Vinegar and Waxman, 1984; Schmeling, 1986; Jodicke, 1990; Chelidze, Gueguen, and Ruffet, 1999; Shogenova et al., 2001; Kaselow and Shapiro, 2004). However, few studies have been carried out to correlate electrical properties with other rock characteristics.
Kate and Sthapak (1995) correlated rock strength to indirect test results and derived a nonlinear correlation between electrical resistivity and UCS. They showed that electrical resistivity increased with increasing UCS. Bilim, Ozkan, and Gokay (2002) conducted electrical measurements and strength tests on synthetic specimens, and found an inverse relationship between voltage drop and rock strength and density. Kahraman and Alber (2006) correlated electrical resistivity to the physico-mechanical properties of core specimens prepared from a fault breccia. They found that the electrical resistivity was strongly correlated to UCS, elastic modulus, density, and porosity values. Vipulanandan and Garas (2008) investigated the correlations between electrical resistivity and the properties of carbon fibre-reinforced cement mortar. They derived reliable equations for the relationships between electrical resistivity and density, Young's modulus, and P-wave velocity. Kahraman and Fener (2008) examined the use of electrical resistivity tests to estimate the abrasion resistance of rock aggregates. They established good correlations between abrasion loss and resistivity. Kahraman and Yeken (2010) investigated the predictability of the UCS and the BTS of magmatic rock specimens using electrical resistivity, and derived reliable relationships between the resistivity and both UCS and BTS. They also derived multiple linear regression equations, which included density and porosity, stronger equations than simple regression equations. Kahraman and Alber (2014) developed reliable relationships between resistivity and the UCS of a fault breccia. Su and Momayez (2017) studied the relationship between electrical resistivity, physico-mechanical characteristics, and the Los Angeles abrasion loss of rocks. They derived reliable relationships between resistivity and physico-mechanical characteristics. However, they found that the electrical resistivity was poorly correlated to Los Angeles abrasion loss. Ince (2018) examined the relationships between pyroclastic rock characteristics and electrical resistivity. He found good correlations between rock characteristics and resistivity values. The correlations between UCS and electrical resistivity for granites were examined by Ranjbar and Nasab (2019), and a very good relationship between the two parameters was found.
In this research, electrical resistivity and physico-mechanical experiments were carried out on 13 metamorphic and 11 sedimentary rocks. The data, together with the results from Kahraman and Yeken (2010), was evaluated to develop predictive relationships between physico-mechanical properties and electrical resistivity.
Thirteen metamorphic and eleven sedimentary rocks were tested. Large blocks of rocks were obtained from marble or stone factories and quarries in Turkey and transported to the laboratory for the experimental studies. The rock types and locations are listed in Table I.
Strength, density, relative porosity, and electrical resistivity values were determined for the rock samples. Average results for each test are given in Table II. Brief explanations of the tests are given in the following paragraphs.
Smooth-cut core specimens with a diameter of 47 mm and length of 95 mm were prepared for the UCS experiments. The stress rate used in the tests ranged between 0.5 and 1.0 MPa/s. Five or more specimens of each rock type were used in in the tests, and average result recorded.
Smooth-cut disc samples 47 mm in diameter and 24 mm in thickness were used for the BTS experiments. To ensure that failure would be visible after 5 minutes of loading, the specimens were continuously subjected to a steady stress rate. Seven or more specimens were used in each test, and the average results recorded.
Well-prepared core specimens were employed to determine density values. Sample volumes were determined using caliper measurements. Sample masses were determined using a bascule with an accuracy of 0.01 g. Three specimens were tested for each rock type, and the averages recorded.
The porosities of the specimens were determined by saturation and caliper techniques. The volume of pores was determined from the dry and wet masses and the sample volume was calculated using caliper readings. Three specimens of each rock type were tested, and the average results recorded.
The parameters influencing the electrical resistivity of rock materials are porosity, the salinity and resistivity of pore fluid, saturation degree, clay content, temperature, and pressure. The salinity of the pore fluid, saturation degree, temperature, and pressure were kept constant during the measurements.
Specimens 54.7 mm in diameter and 50 mm in length were used in the resistivity experiments. Both ends of the specimens were polished to obtain smooth surfaces. The specimens were fully saturated using a 2% (by weight) NaCl solution prepared from distilled water and high-purity salt. Brine resistivity was 0.58 m at room temperature.
The two-electrode technique was implemented for the experiments. Stainless steel discs were used as electrodes. Each specimen was fastened between two electrodes using a hydraulic ram before testing (Figure 1). A pad of filter paper saturated with the brine solution was inserted between the core and the electrodes to provide a good coupling. The electrical resistivity was measured using a resistivity meter.
The resistivity of each sample was measured at three distinct voltage levels. Voltage drops and currents were recorded during the tests. Using the measured parameters, the cross-sectional area, and the length of the sample, the resistivity values were computed from the following equations:

Table I
The rock types and their locations used in the tests
Rock code
Rock type
1 Basalt
2 Andesite
3
Traki-andesite
4 Volcanic bomb
5 Granite
6 Granite (Anadolu grey)
7 Granite (Kaman Rosa)
8 Granite (Kırcicegi)
Location Rock class
Altinhisar/Niğde Igneous
YesilburÇ/Niğde Igneous
Ulukışla/Niğde Igneous
Meke/Konya Igneous
Uckapılı/Niğde Igneous
OrtakÖy/Aksaray Igneous
Kaman/Kırşehir Igneous
Kaman/Kırşehir Igneous
9 Granite (King Rosa) Unknown Igneous
10 Granite (Rosa Porrino)
11 Granite (Pink Porrino)
12 Granite
Porrino/Spain Igneous
Porrino/Spain Igneous
Kozak/Balıkesir Igneous
13 Limestone Bursa Sedimentary
14 Dolomitic limestone
15 Limestone
16 Travertine
Yahyalı/Kayseri Sedimentary
Bunyan/Kayseri Sedimentary
Yıldızeli/Sivas Sedimentary 17 Travertine
18 Travertine
19 Travertine
20 Travertine
21 Travertine
22 Travertine
23 Anhydrite
24 Amphiboleschist
25 Quartzite
26 Micaschist
27 Serpentinite
28 Gneiss
Finike/Antalya Sedimentary
Bucak/Burdur Sedimentary
Demre/Antalya Sedimentary
Godene/Konya Sedimentary
Mut/ĪÇel Sedimentary
Karaman/Konya Sedimentary
Ulukışla/Niğde Sedimentary
Gumuşler/Niğde Metamorphic
Gumuşler/Niğde Metamorphic
Gumuşler/Niğde Metamorphic
Kılavuzkoy/Niğde Metamorphic
Gumuşler/Niğde Metamorphic
29 Marble Kutahya Metamorphic
30 Marble Muğla Metamorphic
31 Marble (Afyon sugar)
32 Marble
Īscehisar/Afyonkarahisar Metamorphic
Gumuşler/Niğde Metamorphic
33 Marble Marmara Island/Balıkesir Metamorphic
34 Marble (Kaplan postu) Īscehisar/Afyonkarahisar Metamorphic
35 Marble Milas/ Muğla Metamorphic
36 Marble Kemalpaşa/Bursa Metamorphic

where R is the electrical resistance, V the voltage drop, I the current, ρ the electrical resistivity, A the cross-sectional area of the sample, and L is sample length.
Three samples were tested for each rock type. Additional specimens were tested when the standard deviation was high.
Regression analysis was performed to evaluate the test results. Regression equations were developed by correlating resistivity values to rock characteristics. As shown in Figure 2, UCS has a strong positive linear correlation with resistivity. The relationship is given by:
where σc is UCS (MPa) and ρ is electrical resistivity (Ω∙m).
BTS is also strongly correlated to resistivity (Figure 3). The relationship is given by: [4]

where σt is tensile strength (MPa) and ρ is electrical resistivity (Ω∙m).
As illustrated in Figure 4, density is strongly correlated to resistivity. The relationship follows a power function. High-density rocks have higher resistivity values than those of low-density rocks. The equation for the curve is: [5]

where γ is density (g/cm3) and ρ is electrical resistivity (Ω∙m).
As indicated in Figure 5, resistivity values strongly correlate to porosity. The function of the relationship is logarithmic. Resistivity increases with decreasing porosity. The data for Altinhisar basalt is an outlier in this correlation. This is most likely caused by the high porosity and high UCS value. High-strength rocks usually have low porosity. The equation of the curve is:
Table II
Average results of the tests
*Data from Kahraman and Yeken (2010

1—The experimental set-up used for measuring electrical resistivity


where n is relative porosity (%) and ρ is electrical resistivity (Ω∙m).


To investigate the relationships between resistivity and rock characteristics for various rock classes, regression analysis was repeated for igneous, metamorphic, and sedimentary rocks. As depicted in Figures 6 to 9, the correlation coefficients of the derived equations for these rock classes are generally higher than those for all tested rocks. Owing to the narrow range of porosity values of the tested metamorphic rocks (less than 1.90%), no correlation between resistivity and porosity could be obtained; therefore, there is no regression curve for the metamorphic rocks shown in Figure 9. The derived regression equations and the correlation coefficients for the rock classes are as follows:

For igneous rocks:


metamorphic rocks:


sedimentary rocks:


Statistical tests should be used to verify the validity of the established equations, even if they have good or strong correlation coefficients. The t- and F-tests are commonly used to validate regression equations. For executing these tests, there should be a normal distribution of parameters. Figures 10 and 11, which are provided as examples, show that the histogram plots have a nonnormal distribution. However, when the number of data points is greater than 30, it can be assumed that the data approaches a normal distribution, and the t- and F-tests can be used.
In the t-test, the computed t-value is compared to the tabulated t-value using the null hypothesis. If the computed t-value is greater than the tabulated t-value, the null hypothesis is rejected. This means that r is significant. The selected confidence level is 95% for this test. As indicated in Table III, the computed t-values are greater than the critical t-values for all derived equations. Therefore, it can be stated that the equations are valid according to the t-test.


To determine whether regressions were meaningful, analysis of variance was conducted. The chosen confidence level is 95% for this test. In the F–test, if the computed F-value is greater than the critical value found in the table, the null hypothesis is rejected, suggesting there is an actual correlation between two variables. As seen in Table III, the computed F-values are greater than the critical values of F for all equations. Hence it can be said that the derived equations are valid as regards the F-test.
Comparison of derived equations with previous equations
Making a detailed comparison between the results of the present research and prior investigations is difficult because the brine resistivity and the testing conditions are different in each study. Only a general comparison can be made. Figure 12 depicts the comparison between Equation [3] (UCS vs. resistivity) and the equations derived by other authors for resistivity values ranging from 50 to 500 Ω∙m. The equation developed by Kahraman and Alber (2006) shows quite a different trend from the other equations, owing to the much lower brine resistivity used (0.0579 Ω∙m). Although the equations derived by Kate and Sthapak (1995) and Ince (2018) are nonlinear, they indicate fairly similar trends to those of Equation [3]. The differences between the models are due to the different brine resistivities used in the studies.
Physico-mechanical and electrical resistivity experiments were conducted on 36 different rock types and the results assessed using regression analysis to develop prediction models for rock
Table III
F-test results Eq.
3.61 2.69 24.91
[14] ±2.22 4.75 2.98 22.53
[15] ±2.22 5.51 2.98 30.39 [16] ±2.22 2.30 2.98 10.30

characteristics. Good relationships were established between resistivity and UCS, BTS, density, and porosity. Estimation models were also derived for igneous, metamorphic, and sedimentary rock classes. The equations derived for rock classes have generally higher correlation coefficients than those of the equations developed for all tested rocks. It is concluded that electrical resistivity measurement is a reliable method for the estimation of physico-mechanical rock characteristics.
References
Archie, G.E. 1942. The electrical resistivity log as an aid in determining some reservoir characteristics. Transactions of the American Institute of Mining, Metallurgical, and Petroleum Engineers, vol. 146, pp. 54–62. https://doi.org/10.2118/942054-G
Bilim, N., Ozkan, I., and Gokay, M.K. 2002. Determination of discontinuities at rock materials by electrical resistance method. Proceedomgs of the 7th Regional Rock Mechanics Symposium,
Ankara. Sensogut, C., and Ozjan, I. (eds).Kozan Ofset. pp. 121–127 [In Turkish].
Brace, W.F., Orange, A.S., and Madden, T.R. 1965. The effect of pressure on the electrical resistivity of water-saturated crystalline rocks. Journal of Geophysical Research, vol. 70, pp. 5669–5678. https://doi.org/10.1029/JZ070i022p05669
Broch, E and Franklin, J.A. 1972. Point-load strength test. International Journal of Rock Mechanics and Mining Sciences, vol. 9, pp. 669–697. https://doi.org/10.1016/01489062(72)90030-7
Chelidze, T.L., Gueguen, Y., and Ruffet, C. 1999. Electrical spectroscopy of porous rocks: a review-II. Experimental results and interpretation. Geophysical Journal International, vol. 137, pp. 16–34. https://doi.org/10.1046/j.1365-246x.1999.00800.x
Collett, L.S. and Katsube, T.J. 1973. Electrical parameters of rocks in developing geophysical techniques. Geophysics, vol. 38, pp. 76–91. https://doi.org/10.1190/1.1440336
Fener, M., Kahraman, S., Bilgil, A., and Gunaydin, O. 2005. A comparative evaluation of indirect methods to estimate the compressive strength of rocks. Rock Mechanics and Rock Engineering, vol. 38, no. 4, pp. 329–343. https://doi.org/10.1007/ s00603-005-0061-8
Gunsallus, K.L. and Kulhawy, F.H. 1984. A comparative evaluation of rock strength measures. Internatonal Journal of Rock Mechanics and Mining Sciences, vol. 21, pp. 233-248. https://doi.org/10.1016/0148-9062(84)92680-9
Ince, I. 2018. Determination of index-strength properties of pyroclastic rocks by electrical resistivity method. OHU Journal of Engineering Science, vol. 7, no. 2, pp. 772–780. https://doi. org/10.28948/ngumuh.444789
Jodicke, H. 1990. Zonen hoher elektrischer Krustenleitfahigkeit im Rhenoherzynikum and seinem nordlichen Vorland. PhD thesis, Münster University.
Kahraman, S. 2001. Evaluation of simple methods for assessing the uniaxial compressive strength of rock. International Journal of Rock Mechanics and Mining Sciences, vol. 38, pp. 981–994. https://doi.org/10.1016/S1365-1609(01)00039-9
Kahraman, S. and Alber, M. 2006. Predicting the physicomechanical properties of rocks from electrical impedance spectroscopy measurements. International Journal of Rock Mechanics and Mining Sciences, vol. 43, pp. 543–553. https://doi.org/10.1016/j.ijrmms.2005.09.013
Kahraman, S. and Alber, M. 2014. Electrical impedance spectroscopy measurements to estimate the uniaxial compressive strength of a fault breccia. Bulletin of Materials Science, vol. 37, no. 6, pp. 1543–1550. https://doi.org/10.1007/ s12034-014-0109-z
Kahraman, S. and Fener, M. 2008. Electrical resistivity measurements to predict the abrasion resistance of rock aggregates. Bulletin of Materials Science, vol. 31, pp. 79–184. https://doi.org/10.1007/s12034-008-0031-3
Kahraman, S. and Yeken, T. 2010. Electrical resistivity measurement to predict the uniaxial compressive and tensile strength of igneous rocks. Bulletin of Materials Science, vol. 33, pp. 731–735. https://doi.org/10.1007/s12034-011-0137-x
Kahraman, S., Fener, M., and Kozman, E. 2012. Predicting the compressive and tensile strength of rocks from indentation hardness index. Journal of the Southern African Institute of Mining and Metallurgy, vol. 112, pp. 331–339. https://www. saimm.co.za/Journal/v112n05p331.pdf
Kahraman, S., Aloglu, A.S., Aydın B., and Saygın, E. 2017. The needle penetration test for predicting coal strength. Journal of the Southern African Institute of Mining and Metallurgy, vol. 117, pp. 587–591. http://dx.doi.org/10.17159/24119717/2017/v117n6a9
Kaselov, A. and Shapiro, S.A. 2004. Stress sensitivity of elastic moduli and electrical resistivity in porous rocks. Journal of Geophysics and Engineering, vol. 1, pp. 1–11. https://doi. org/10.1088/1742-2132/1/1/001
Kate, J.M. and Sthapak, A.K. 1995. Engineering behaviour of certain Himalayan rocks. Proceedings of the 35th US Symposium on Rock Mechanics. Daemen, J.J.K. and Schultz, R.A. (eds). Balkema, Rotterdam. pp. 783–788. https://onepetro.org/ARMAUSRMS/ proceedings-abstract/ARMA95/All-ARMA95/ARMA-950783/130674?redirectedFrom=PDF
Ranjbar, S. and Nasab, S.K. 2019. Determination of uniaxial compressive strength of granite rock samples using electrical resistivity measurement: NDT. EAGE-GSM. Proceedings of the 2nd Asia Pacific Meeting on Near Surface Geoscience & Engineering, Kuala Lumpur, Malaysia, 22-26 April 2019. https:// doi.org/10.3997/2214-4609.201900452
Sachapazis, C.I. 1990. Correlating Schmidt hardness with compressive strength and Young’s modulus of carbonate rocks. Bulletin of the International Association of Engineering Geology, vol. 42, pp. 75–83. https://doi.org/10.1007/BF02592622
Schmeling, H. 1986. Numerical models on the influence of partial melt on elastic inelastic and electrical properties of rocks.
Part II, Electrical conductivity. Phyics of the Earth and Planetary Interiors, vol. 43. pp, 123–135. https://doi.org/10.1016/00319201(86)90080-4
Shankland, T.J. and Waff, H.S. 1997. Partial melting and electrical conductivity anomalies in the upper mantle. Journal of Geophysical Research, vol. 82, pp. 5409–17. https://doi. org/10.1029/JB082i033p05409
Shogenova, A., Joeleht, A., Kirsimae, K., Sliaupa, S., Rasteniene, V., and Babele, A. 2001. Electric properties of siliciclastic rocks in the Baltic Cambrian basin. Proceedings of the 6th Nordric Symposium on Petrophysics, Trondheim, Norway. Backe, K. and Loermans, T. (eds). Norwegian University of Science and Technology, pp. 1–14. http://www.ipt.ntnu.no/nordic/ Papers/6th_Nordic_Shogenova.pdf
Su, O. and Momayez, M. 2017. Indirect estimation of electrical resistivity by abrasion and physico-mechanical properties of rocks. Journal of Applied Geophysics, vol. 143, pp. 23–30. https:// doi.org/10.1016/j.jappgeo.2017.05.006
Vinegar, H.J. and Waxman, M.H. 1984. Induced polarization of shaly sands. Geophysics, vol. 49. pp. 1267–1287. https://doi. org/10.1190/1.1441755
Vipulanandan, C. and Victor Garas, V. 2008. Electrical resistivity, pulse velocity, and compressive properties of carbon fiberreinforced cement mortar. Journal of Materials in Civil Engineering, vol. 20, no. 2, pp. 93–101. https://doi.org/10.1061/ (ASCE)0899-1561(2008)20:2(93)
Ulusay R., Gokceoglu C., and Sulukcu S. 2001. Draft ISRM suggested method for determining block punch strength index (BPI). International Journal of Rock Mechanics and Mining Sciences, vol. 38, no. 8, pp. 1113-1119. https://doi.org/10.1016/ S1365-1609(01)00078-8
Yasar, E. and Erdogan, Y. Correlating sound velocity with the density, compressive strength and Young's modulus of carbonate rocks. International Journal of Rock Mechanics and Mining Sciences, vol. 41, pp. 871-875. https://doi.org/10.1016/j. ijrmms.2004.01.012 u

Dr Evert Hoek2
A
true giant in rock mechanics, rock engineering, and in life1
A tribute to Dr Evert Hoek: 23 August 1933 – 6 July 2024
Over the last week, the world has had to come to terms with the passing on Saturday 6 July of Dr Evert Hoek, a true giant in the fields of rock mechanics and rock engineering, whose work has guided technological developments in all aspects of this field of engineering2 and which shaped the minds of rock engineers and geotechnical engineering practitioners globally.
Evert Hoek was born in Zimbabwe in Southern Africa in 1933 and graduated in mechanical engineering with a BSc and an MSc from the University of Cape Town in 1957. He became involved in rock mechanics in 1958 when he started working in research on problems of brittle fracture in rock associated with very deep mines in South Africa. His degrees include a PhDfrom the University of Cape Town, a DSc (Engineering) from the University of London, and honorary doctorates from the universities of Waterloo and Toronto in Canada and the Polytechnic University of Catalonia in Spain. He is a Fellow of the Royal Academy of Engineering (UK), an International Member of the US National Academy of Engineering, and a Fellow of the Canadian Academy of Engineering. He spent 8 years as a research engineer in the South African Council for Scientific and Industrial Research (CSIR), 9 years as a Reader and then Professor in the Imperial College of Science and Technology in London, 12 years as a consultant with Golder Associates in Vancouver, Canada, and 6 years as an Industrial Research Professor in the University of Toronto. For the 25 years prior to his retirement in 2018, he worked as an independent consultant on review and consulting boards on civil and mining engineering projects around the world.2
Dr Hoek followed in the footsteps of notable scientists and engineers such as Terzaghi, Griffiths, and others, and building on their early work, helped establish the modern-day fields of rock engineering’ and ‘rock mechanics – subjects which still had to be invented when he started work on his PhD in 1958. A 2022 paper by Rocscience titled ‘Principal considerations in rock engineering practice and contributions from Africa’3 celebrates contributions made by rock engineering experts of African origin or association since the 1940s and 1950s, and provides further insight into the impact Dr Hoek’s work had on this field of engineering.
Today, rock engineers and geotechnical engineering practitioners all over the world regularly visits Hoek’s Corner2 which is an online collection of books, published research papers, and an exclusive video lecture series by Dr Hoek, maintained by Rocscience, and his rock engineering course notes ‘Practical Rock Engineering’ has become a seminal reference in the libraries of geotechnical engineering practitioners. Employing the engineering knowledge and understanding shared by Dr Hoek of stress and deformation processes, and of the strength of rock materials both at an intact and at rock mass scale, and methods and techniques he helped develop to analyse and model complex rock engineering problems, geotechnical engineering practitioners are able to better design excavations in rock in both civil engineering and mines, to make the world a safer place to work and live in.
Those who worked with Dr Hoek remember him as a true gentleman, and fondly recall the kind and respectful manner in which he always engaged those he worked with, taught, and mentored, and it is a cherished memory indeed for those who were privileged to meet him in person before he retired in 2018.

Uli Vogler worked with Dr Hoek at the CSIR in the 1950s and helped him develop several ISRM Suggested Methods for rock laboratory testing that are still in use today. He remembers Dr Hoek as a talented and versatile engineer, and shared the following anecdote.
In the late 1950s, during lunchtimes, Evert Hoek helped his neighbour, O.P.M. Prozesky with his research by wiring up instrumentation to record the temperature of bird eggs during incubation in hot desert conditions. Prozesky could thus prove that birds are able to cool off their eggs on hot days. Years later, Prozesky became a well known ornithologist at the then Transvaal Museum and author of the authoritative ‘A Field Guide to the Birds of Southern Africa’.
Evert Hoek was much loved by his family and admired and valued as a friend, teacher, and colleague. A true giant in rock mechanics, rock engineering, and in life, we will miss him greatly. Our thoughts are with his family and friends.1
→ Obituary – In loving memory of Evert Hoek, August 23, 1933 – July 6, 2024
Evert Hoek Obituary - North Vancouver, BC (dignitymemorial.com)
→ A tribute from Rocscience: (25) Post | LinkedIn
→ A trip down memory lane – Rock engineering before computers, by Dr Evert Hoek: Rock Engineering Before Computers | Dr. Evert Hoek (rocscience.com)
References
1https://isrm.net/news/show/672
2https://www.rocscience.com/learning/hoeks-corner
3https://www.geoengineer.org/news/principal-considerations-in-rock-engineering-practice-andcontributions-from-africa
4Photo provided by Dr. Alan Guest
Affiliation:
1Mining Engineering Department, Colorado School of Mines, Golden, Colorado, USA
Correspondence to:
S.K.A. Owusu
Email: oaksolo@yahoo.com
Dates:
Received: 22 Feb. 2021
Revised: 23 Feb. 2022
Accepted: 28 Feb. 2024
Published: July 2024
How to cite:
Owusu, S.K.A., and Dagdelen, K. 2024. Impact of Competent Persons’ judgements in Mineral Resources classification. Journal of the Southern African Institute of Mining and Metallurgy, vol. 124, no. 7. pp. 371–382
DOI ID:
http://dx.doi.org/10.17159/24119717/1538/2024
ORCID:
S.K.A. Owusu
http://orcid.org/0000-0001-7709-578X
K. Dagdelen
http://orcid.org/0009-0003-6650-8616
by S.K.A. Owusu1 and K. Dagdelen1
Abstract
Uncertainty with regard to estimated grades and tonnages of a mineral deposit demands risk assessment in order to build investor confidence and attract the interest of other stakeholders in the success of a project. Uncertainties associated with Mineral Resource estimates can lead to unreliable production schedules and unpredictable cash flows. However, the techniques used in the mining industry to determine these uncertainties are inconsistent, because the important decisions taken in the process are solely dependent on the responsible Competent Person (CP), without limitations. This leads to disparities between different CPs’ results, using data-sets from the same drill-holes. The various standard codes for public disclosure provide guidelines and recommendations for the classification of Mineral Resources and Reserves but do not provide details on, for example, the amount of geological and geostatistical information needed to qualify for each category of Resources and Reserves. The parameters used to generate the classification categories are subjectively assumed by the responsible CP. In this paper we investigate the impacts of different CPs’ judgements on resource classification, using the same data-sets. The results underpin the need for the mining industry to develop a uniform Mineral Resources and Reserves classification framework that can minimize or avoid significant discrepancies that lead to potential misleading public disclosures.
Keywords
mineral resources, mineral reserves, classification, reporting codes, uncertainty
Introduction
Mineral Resource classification plays a key role in the economic assessment of mining projects, as investors typically make investment decisions based on the information used to generate the cash flow analysis. Due to inconsistencies in Mineral Resource reporting by various Competent Persons (CPs), it is crucial to investigate how different resource classification techniques are applied in the mining industry to categorize Mineral Resources as Measured, Indicated, and Inferred, based on the uncertainty assigned to each class. The Mineral Resources report should provide reliable information on the deposit under consideration and define the different Mineral Resource classes, based on the confidence levels assigned to the different blocks of the orebody model. The international standard reporting codes for Mineral Resources promote competence, materiality, and transparency in public disclosure (Shaw et al., 2006).
The principle of competence refers to a responsible, suitably qualified and experienced professional with at least 5 years of relevant experience, who is required to be a member of an organization recognized by the specific reporting code and capable of demonstrating competence among his or her peers. The principle of transparency requires that all available, accurate, and sufficient information is presented. Materiality requires the inclusion of all relevant and reasonable deposit information to enable investors and their advisors to make balanced judgements based on the information presented. To minimize or avoid misleading public disclosures, the standard reporting codes were established to encourage investor confidence in the exploration and mining business. Until the later part of 1980s, there were no industry standards for mineral asset reporting, and this led to doubtful and erroneous reports from individuals as well as companies.
The categorization of Resources and Reserves relies on the judgement of the CP in charge of a project, based on knowledge and experience, in conjunction with others if necessary. Each CP decides on the assumptions used and justifies the outcomes produced from each class of the Mineral Resources. The codes do not prescribe how CPs should conduct their assessments to classify Mineral Resources (Noppe 2014). The inconsistencies in the expected accuracy, precision, and confidence in the classifications can result in varying grades and tonnages of total Mineral Resources calculated by different CPs using the
same drilling data. An effective estimate of Mineral Resources with a credible classification leads to reliable mine designs, efficient production schedules, robust business plans, and solid financial forecasts. The big question is; which CP produces a genuine (or not) Mineral Resources report? One common inaccuracy found in tonnage determination for a deposit is due to the application of an erroneous density or tonnage factor. Parrish (1993) stated that the most common error found when conducting Mineral Resources and Reserves audits is an error in the tonnage factor used to derive the tonnage of the orebody. The density used to convert volume to tons is crucial when determining the real in-situ tonnage and metal content of Mineral Resources, because an error of a few per cent in the bulk density can significantly alter the economic viability of a deposit. This is especially obvious in marginal projects, as the higher the tonnage factor, the lower the tonnage of a deposit, and vice versa. However, the methods used to determine the density considered in the estimation and classification of Mineral Resources are inconsistent.
The importance of bulk density is stressed in the various standard codes such as the Canadian Institute of Mining, Metallurgy and Petroleum (CIM) Mineral Exploration Best Practice Guidelines (CIM, 2018) and the Australasian Institute of Mining and Metallurgy (AusIMM) Guide to Good Practice (AusIMM, 2001). For some projects, there is insufficient data to adequately characterize the assigned density or tonnage factor of the waste and ore, while for others, there are good databases that contain well-documented density determinations. Some CPs in the mining industry assign different tonnage factors to ore and waste, while others assign an average tonnage factor to all rocks, depending on the nature of the deposit as well as their own judgement. Due to the subjectivity and dependency on the CP, the resources classified as Indicated by one CP may be classified as Inferred by another.
Misleading public reports and poor project outcomes
A deceptive Public Report on Mineral Resources due to erroneous estimation and classification assumptions can lead to poor production outcomes. For example, a publicly reported resource mistakenly classified as Indicated rather than Inferred can mislead investors and create future problems, including loss of investor confidence and lawsuits. There have been historical antecedents of some public announcements on Mineral Resources and Reserves where the expected risks and level of maturity of the projects were presented in incorrect contexts, thereby yielding undesired
outcomes. A typical example of an estimation scandal that hit the mining industry is the Bre-X saga in 1997, where the company fraudulently claimed about 47 million ounces of gold in the Busang property in Indonesia (Groia, Bradley, and Jones, 2008).
In the 1980s, an investigation into 35 Australian gold mines showed that 68% failed to deliver the planned head grade (Burmeister, 1988). In North America, a review of about 50 projects found that only 10% achieved their commercial aims and 38% failed within a year (Harquail, 1991). An investigation into the start-up performance of a nine underground base metal mines In Australia established that only 50% achieved the designed production by the third year and 25% never achieved it at all (Ward and McCarthy, 1999). A study in the United States to compare the final feasibility study figure with the average sustained production rate from 60 steeply-dipping tabular deposits established that 35% of the mines were unable to achieve their planned production rates (Tatman, 2001). According to Noppe (2014), one partner in a coal deposit joint venture deal reported double the resource tonnage of the other JV partner, each using the same drill-hole data. This happened because the partner who produced the inflated estimate did not apply the likely mining parameters for the expected underground scenario.
Considering the intensive capital funding and risks of mining projects, BHP Billiton’s Olympic Dam project in Australia is a typical example (Valle, 2011). The project cost was estimated to be US$27 billion, hence huge sums of money would have been lost if the Mineral Resources and Reserves were wrongly classified and the mine failed to meet the production target. In the mining industry, little has been done in terms of investigating the impacts associated with different CP assumptions and judgements applied to classify resources. In this research, we provide quantitative analyses of different CP assumptions, using data-sets for copper and gold projects.
Although other techniques may be used to classify mineral deposits, the two basic methods used in the mining industry for Mineral Resource classification tasks are the geometric and geostatistical techniques. The geometric method considers the amount, proximity, and location of data available to classify resource blocks, while the geostatistical method uses model uncertainty and configuration of the neighbouring data to classify blocks. Figure 1 outlines the two classification techniques.

Table I
A recent survey conducted on the different Mineral Resource classification techniques practiced in the gold mining industry showed that approximately 93% of CPs prefer the use of the geometric method, while 7% use the geostatistical method (Owusu and Dagdelen, 2019). The study was undertaken, using 45 NI 43101 technical reports filed on the System for Electronic Document Analysis and Retrieval (SEDAR) website, to evaluate the state of practice concerning Mineral Resource classification techniques for gold deposits. Public Reports from 2006 to 2018 were compiled and another publicly available general classification reporting guideline from a major gold mining company in the United States was
included. The review covered 20 junior, 20 mid-tier, and five major gold mining companies in North America, South America, Asia, and Africa. Different gold deposit types were covered, including gold-copper porphyries, orogenic gold, breccia pipe, carlin-type, lode and placer, epithermal high- and low-sulphidation, and greenstone belt.
After critical analysis of the classification guidelines used by the various companies, it was established that 43 of the reports applied geometric methods and two combined geostatistical and geometric methods. These included techniques such as drill-hole spacing (DHS), distance to nearest drill-hole (DNDH), number of samples (NS), number of drill-holes (NDH), ellipsoidal search (ES), octant search (OS), drill-hole intercept (DHI), and kriging variance (KV). In most cases, some of the CPs combined multiple techniques like NS and NDH (NS + NDH), DHS and NDH (DHS + NDH), NS and ES (NS + ES). Table I and Figure 2 represent the various classification techniques applied for gold deposits used in the research. In the pie chart, the percentages are rounded to their whole numbers. After evaluating the different reports, it was found that there is currently a lack of uniformity in resource classification reports due to the different assumptions made by individual CPs. Also, it was found that industry players prefer the the geometric method due to its time-saving and simplistic characteristics. Hence, there is a need to develop easier and quicker techniques for the geostatistical method to enhance its use in the resource classification process.
Silva and Boisvert (2014) conducted a similar survey from SEDAR and after reviewing a total of 281 technical reports, found only 120 had sufficient information to determine the techniques used for Mineral Resource classification. The information used for the evaluations included classification technique employed, the chosen criteria, and the drilling pattern. Silva and Boisvert did not provide detailed information in terms of the mineral commodity types, deposit types and locations, company categories, or parameters applied in the classification techniques, among others. According to the investigators, the most commonly used method was the geometric, representing about 80% of the reports. It included the NS technique which constituted approximately 50%, followed by DHS (30%) and KV (about 6%), with the remainder (14%) being unspecified. The techniques used by the various CPs were dependent on either regular or irregular drill-hole spacings.

In most reports, regularly spaced drill-hole data was used for the DHS technique, while NS was applied to irregularly spaced drillhole data. Also, some industry professionals combined the different techniques to classify irregularly spaced data.
Classification is commonly performed on a block-by-block basis but the block volumes are chosen to be reasonably large and contiguous, because of the common perception that confidence in the grade should not change abruptly between adjacent blocks (Deutsch, Leuangthong, and Ortiz, 2016). To provide mining industry professionals with quantitative illustrations to demonstrate classification inconsistencies due to individual CP judgements and assumptions, we assessed data from a single bench at a copper deposit and from a gold deposit. Each case study included data validation, exploratory data analysis, geological modelling, variogram modelling, block modelling, grade estimation, model validation, and resource classification. Different assumptions made by different CPs in some of the SEDAR technical reports were applied to these two data-sets. The differences in the results indicate that the practice of applying individual CP assumptions without limitations creates discrepancies in the outcomes, because each CP has a strong influence on the parameters used to generate Mineral Resource classes.
The bench is 90 m length × 90 m width × 15 m height. The data is considered as synthetic because much geological information is not provided, but it is useful for the purpose of the study. Thus, the research focuses on using the same data to analyse how different CP assumptions can produce varying outcomes. The data is from 36 irregularly spaced vertical drill-holes with a single sample from each hole.
The drill-hole information includes eastings, northings, elevations, and copper assay results. A block model of 7.5 m × 7.5 m × 15 m blocks was created for the data-set, in correspondence to the 15 m bench height. The available data from regularly spaced blast-holes 7.5 m × 7.5 m yields similar statistical results to the exploration data, hence the choice of block size.
Summary statistics of the one-bench copper deposit
Statistical and geostatistical analysis
The distribution of copper in the deposit was analysed using statistical and geostatistical techniques. Table II and Figure 3 show the summary statistics and the histograms of the original composite data and the declustered data respectively. All copper grade units are given as percentages (%Cu). Variogram modelling was generated from the data to determine the spatial continuity of the data points. Considering the inadequacy of the data, good variograms and correlograms could not be created. The geostatistical parameters generated from the correlogram model are shown in Figure 4.
Block modelling and resource estimation
MineSight software was used to generate the block model and the applied interpolation technique was ordinary kriging (OK). For the purposes of this study, an arbitrary tonnage factor of 0.354 m3/t (12.5 ft3/t) was assigned to all rocks. For validation purposes, inverse distance squared (ID2) and nearest neighbour (NN) estimation techniques were used to generate results for comparison. The three


Table III
Grades and tonnages from the three scenarios at different cutoff grades
Table IV
Classification parameters for the three scenarios of the copper deposit
Scenario
1
Measured: 1/3 of sill range Indicated: 1/2 of sill range Inferred: 1
2 Measured: 60% of sill range Indicated: 75% 75% of sill range Inferred: 90% of sill range
3 Measured: 40% of sill range Indicated: 80% of sill range Inferred: 100 – 200% of sill range

models are displayed in Figure 5. The swath plot is another tool used to validate block models, as it shows the moving window mean plots of block grades at different locations. Figure 6 shows how the results from the three estimation techniques were represented well on the swath plot. Table III summarizes the tonnages and grades generated from the three models at different cutoff grades.
Mineral Resource classification was performed to determine the Measured, Indicated, and Inferred classes. Search distances for the scenarios were calculated from different percentages of the variogram range, while the same number of composites and number of drill-holes were assigned to each category in each scenario. Table IV presents the details of the classification parameters for each resource class, using a sill range of 25.6 m (84 ft), number of composite (NC) samples used, and number of drill-holes (NDH) used.
The different classes generated using MineSight are shown in Figure 7. Measured, Indicated, and Inferred Resources are indicated by red, green, and yellow respectively. The different classification results for each scenario in terms of grade, tonnage, and metal content are presented in Table V.
Table V shows the inconsistencies in Mineral Resource classification after the application of different parameters based on different CP assumptions and judgements. As seen in Figure 7, scenario 1 produced few blocks of Inferred class, while scenarios 2 and 3 did not produce any Inferred blocks. Also, scenario 2 produced Measured blocks for the entire deposit, with three blocks of Indicated class. Finally, scenario 3 generated more Indicated blocks than Measured blocks. Although the sample population of the single-bench data is small, the results from each of the three scenarios were generated by considering assumptions used by
CPs in technical reports. This has shown that there can be overly or insufficiently assumed parameters, which can be applied by individual CPs to classify Mineral Resources.
The gold deposit, discovered in 1978, is located in California. The deposit consists of a large but low-grade set of veins, 1829 m (6000 ft) wide and 305 m (1000 ft) deep, in a fault zone. It was formed in a shallow epithermal and hot spring environment with gold and silver as the primary mineral commodities. Other associated minerals in the deposit include mercury, lead, iron, copper, thallium, arsenic, antimony, and zinc (Homestake Mining, Western Mining History,
Table V
Tonnage, grade and metal content of the three scenarios at 0.405 cutoff grade
CP Assumptions
Class
Inferred0.48
Class
2019). This case study considers the gold mineralization in the southern portion of the deposit (6600N – 10500N). This portion generally strikes north-northwest (NNW) and the dip varies depending on the orientation of the vein set.
Three estimation domains were generated after the statistical and geostatistical analyses of the data, as shown in Figure 8. The original axis range values were in feet (ft) and later changed to metres (m) for the purposes of international readership. The variogram models for each estimation domain are shown in Figure 9 and the parameters generated from each variogram are presented in Table VI. The classification parameters of the three different scenarios used for this investigation were created from the assumptions made by the CPs of three companies in the 45 technical reports compiled from SEDAR.
The classification parameters that were used by the CPs included percentage of variogram range for search radius, minimum number of composites, maximum number of composites, number of drillholes, and number of composites per hole. Table VII shows the resource classification parameters for the three geometric scenarios. Brief descriptions of the scenarios are as follows.
Scenario 1 represents the 2018 resource classification parameters used for Coeur Mining, Wharf Mine site technical report in the USA (Jimmerson et al., 2018). Based on the NI 43-101 technical report, OK was used for the estimation and the sample search distance for each class was determined based on a certain percentage of the sill range of the major continuity direction of the variogram. Three classification passes were used to categorize the deposit into Measured, Indicated, and Inferred classes.
Scenario 2 represents the 2008 resource classification parameters used for the technical report of Kinross Gold, Cerro Casale Project in Chile (Henderson et al., 2008). The report shows that the CPs applied ID2 for the estimation interpolation and the search distance for each class was determined based on a percentage of the sill range of the omnidirectional correlogram. There were six classification passes for the three resource classes.


1. Top left: Domain 1
2. Top right: Domain 2
3. Bottom left: Domain 3

Table VI
Variogram parameters for each estimation domain of the gold deposit
Scenario 3 represents the 2017 resource classification parameters applied in the technical report for Barrick Gold, Goldstrike Mine in the USA (Krutzelmann et al., 2017). The report shows that the CPs used ID2 for the estimation interpolation and the search distance for each class was determined based on a certain percentage of the sill range of the major continuity direction of the correlogram. For the Measured class estimation pass, a box search of 12 m × 12 m × 6 m (40 ft × 40 ft × 20 ft) was used to include only composites found within each evaluated block. Thus, blocks
without samples did not qualify for a Measured category. There were five classification passes for the Measured, Indicated, and Inferred classification categories. At cutoff grades from 0.283 g/t to 1.417 g/t (0.010 to 0.050 oz/t), the different mineral resource assumptions applied on each estimation domain from the different scenarios produced different results. Again, this substantiates the discrepancies in Mineral Resource reports in public disclosures due to the application of different CP judgements in the estimation and classification
Table VII
Classification parameters for the three geometric method scenarios
Estimation Pass #
Scenario 1: 2018 resource classification parameters for Coeur Wharf Mine, South Dakota, USA (sill Range, a = 44m)
Scenario 2: 2008 resource classification parameters for Kinross Cerro Casale Project, Chile (sill Range, a = 40m)
1
Range: Omnidirectional range of correlogram 2
Scenario 3: 2017 resource classification parameters for Barrick Goldstrike Mine, Nevada, USA
Table VIII
Domain 1 comparison of the tonnage (t) and grade (g/t) of the three geometric scenarios at different cutoff grades
Table IX
Domain 2 comparison of the tonnage (t) and grade (g/t) of the three geometric scenarios at different cutoff grades
Class Cutoff
Table X
Domain 3 comparison of the
Domain 1 Tonnages of Measured Category
Domain 2 Tonnages of Measured Category
Domain 3 Tonnages of Measured Category

Domain 1 Tonnages for Indicated Category


processes. Tables VIII to X show each scenario’s tonnages and grades generated from domains 1, 2, and 3 respectively at different cutoff grades.
Discussion case study B
The tonnages produced from the three different scenarios in the three domains are shown in Figures 10, 11, and 12 for Measured, Indicated, and Inferred classes respectively.
Measured category
Scenario 3 produced far less tonnage in the Measured class than the other two scenarios in all three domains. In domain 1, scenario 1 generated more tonnage than scenario number 2 at all the cutoff grades. Considering domain 2, scenario 2 produced more tonnage than scenario 1.
Indicated category
Scenario 3 produced far greater tonnage in the Indicated class than the other two scenarios in all the three domains. In domains 1 and 3, scenario 2 generated more tonnage than scenario 1 at all the cutoff grades. Domain 2 produced more tonnage in scenario 2 than
scenario 1 at cutoff grades of 0.28 g/t to 0.85 g/t. At cutoffs of 1.13 g/t and 1.42 g/t, scenarios 1 and 2 produced almost equal tonnages.
Inferred category
Scenario 3 produced the greatest tonnage in the Inferred class in all the domains and at all the cutoff grades. Scenario 2 generated more tonnage than scenario 1 in all three domains. The figures clearly display the differences in tonnages produced from the three CP assumptions applied to the same gold deposit. Converting the Mineral Resources into Mineral Reserves for this deposit after applying modifying factors, including technical, economic marketing, and governmental factors would also produce different results. The differences in the Measured and Indicated Resources shown in Tables VIII–X can have significant impacts on investment, development, and mining production decisions. This is a clear indication of resource classification inconsistencies, since the mining industry lacks a uniform classification framework. Diligent analysis of the classification results produced from the same datasets corroborates the conclusions of Owusu and Dagdelen (2019) from their review of 45 technical reports on SEDAR. Considering
the three scenarios applied on the same data and the corresponding outcomes, it is difficult to distinguish the right results from the wrong, since each CP followed the CIM best practice guidelines.
Mineral Resource classification is a critical factor in the success of a mining business, as it provides the confidence level that can be ascribed to a project. In spite of its importance, the techniques used to determine the uncertainties are applied inconsistently in the mining industry because the parameters utilized in the process are subjectively determined by the responsible CP. We have presented quantitative illustrations of the impacts of different CP assumptions and judgements to demonstrate that varying grades, tonnages, and metal contents can be generated from the same drill-hole data, leading to discrepancies in classification reports. In the 45 technical reports from SEDAR used for this work, the responsible CPs provided reasons for choosing their classification parameters and each report was assumed to be acceptable as per the CIM best practice guidelines for public disclosures.
This work has shown that the practice of applying individual CP assumptions without limitation can cause misleading public disclosures and affect future project outcomes. It underpins the need for a standard or uniform resource classification framework, with particular emphasis on an acceptable range of parameters to be applied per each deposit type, based on the available geological and geometallurgical information. An effective and acceptable uniform framework will help minimize the effects of individual CPs’ assumptions on the Mineral Resource classification process and thus, enhance investor confidence in mineral projects.
References
AusIMM. 2001. Mineral Resource and Ore Reserve estimation –The AusIMM Guide to Good Practice. Edwards, A.C. (ed.). Monograph 23. Australasian Institute of Mining and Metallurgy, Melbourne.
Burmeister, B.B. 1988. From resource to reality: A critical review of the achievements of new Australian gold mining projects during the period January 1983 to September 1987. MSc thesis, Macquarie University, Sydney, Australia.
CIM. 2018. Mineral Exploration Best Practice Guideline. Prepared by the Canadian Institute of Mining, Metallurgy and Petroleum (CIM) Mineral Resource and Mineral Reserve Committee. Adopted by CIM Council November 23, 2018. Montreal, Canada.
Deutsch, C.V., Leuangthong, O., and Ortiz, J.M. 2016. A case for geometric criteria in resources and reserve classification. Annual Report 08. Paper 301. Centre for Computational Geostatistics, Alberta, Canada.
Groia, J., Bradley, J., and Jones, A. 2008. The aftermath of Bre-X: The industry’s reaction to the decision and the lessons we all have learned. PDAC Conference, 4 March 2008. Toronto, Ontario, Canada.
Harquail, D. 1991. Investing in junior mining companies. Proceedings of the 6th Mineral Economics Symposium. Canadian Institute of Mining, Metallurgy and Petroleum (CIM), Montreal, Canada.
Henderson, R.D. 2010. NI 43-101 Technical report for Cerro Casale project, Northern Chile. Public Disclosure on SEDAR. Kinross Gold Corporation, Canada.
Jimmerson, S.J., Nelson, K., Auld, T., Lindsay, E., Hoffer, M.R., Key, J.K., and Lippoth, K.B. 2018. Technical report for the Wharf operation, Lead, South Dakota. Public Disclosure on SEDAR. Coeur Mining Inc., USA.
Krutzelmann, H., Cox, J.J., Evans, L., and Collins, S. E. 2017. Technical report on the Goldstrike Mine, Eureka and Elko Counties, Nevada. Public Disclosure on SEDAR. Barrick Gold Corporation, USA.
Noppe, M.A. 2014. Communicating confidence in mineral resources and mineral reserves. Journal of the Southern African Institute of Mining and Metallurgy, vol. 114, no. 3, pp. 213–222.
Owusu, S.K.A. and Dagdelen, K. 2019. Critical review of mineral resource classification techniques in the gold mining industry. Proceedings of the 39th international Symposium on Application of Computers and Operations Research in the Mining Industry, Wrocklaw, Poland. vol. 3. Routledge. pp. 201–209.
Parrish, I.S. 1993. Tonnage factor – A matter of some gravity. Mining Engineering, vol. 45, no. 10, pp. 1268–1271.
Shaw, W.J., Godoy, M.C., Miller, G., and Larrondo, P. 2006. An approach to more objective classification of mineral resources. Proceedings of the 6th International Mining Geology Conference. Darwin, NT. Australasian Institute of Mining and Metallurgy, Melbourne. pp. 85–89.
Silva, D. and Boisvert, J. 2014. Mineral resource classification: A comparison of new and existing techniques. Journal of the Southern African Institute of Mining and Metallurgy, vol. 114, no. 3, pp. 265–273.
Tatman, C.R. 2001. Production rate selection for steeply dipping tabular deposits. Mining Engineering, vol. 53, no.10, pp. 34–36.
Valle, D.D. 2011. Olympic Dam expansion supplementary environmental impact statement. BHP Billiton, Olympic Dam Mine, South Australia.
Ward, D.J. and McCarthy, P.L. 1999. Startup performance of new base metal projects. Adding value to the Carpentaria Mineral Province, Mountain Isa, Queensland. Australian Journal of Mining, April 1999.
Western Mining History. 2019. Information on Homestake Mining Company, McLaughlin Mine. Napa County, California. https://westernmininghistory.com/mine_detail/10310645/ [accessed 25 June 2020] u
Affiliation:
1State Key Laboratory of Water Resource Protection and Utilization in Coal Mining, China Energy Investment Corporation, China
2School of Civil Engineering, North China University of Technology, China
Correspondence to: G. Song
Email: song.gaofeng@ncut.edu.cn
Dates:
Received: 7 Apr. 2021
Revised: 4 May 2022
Accepted: Feb. 2024
Published: July 2024
How to cite:
Liu, X. and Song, G.
2024. Development status of coal industries in the world’s major coalproducing countries. Journal of the Southern African Institute of Mining and Metallurgy, vol. 124, no. 7. pp. 383–386
DOI ID:
http://dx.doi.org/10.17159/24119717/1504/2024
ORCID:
X. Liu
http://orcid.org/0000-0003-4339-7207
G. Song
http://orcid.org/0000-0002-4337-4622
by X. Liu1 and G. Song2
Abstract
The global coal industry has changed significantly in recent years. In this paper we analyse the coal production and consumption, imports and exports, and coal prices in China and other major coal-producing countries during the past four decades. The analysis shows that global coal production and consumption have declined over the last three years, in striking contrast to the continuous growth for most of the past 35 years. Australia, Indonesia, and Russia have become the world’s major coal providers, while China, India, and the USA, and Germany are the major coal consumers. The world’s, and China‘s, coal industry can be classified into four stages of development: the stable growth phase, stable phase, rapid growth phase, and high-quality phase. Coal prices rose in the world’s four major coal markets in 2016 after four consecutive years of falling prices. The elimination of overcapacity and production-optimizing operations in China could assist in achieving a demand and supply balance.
Keywords coal, production, consumption, import, export, supply and demand balance, coal price
Introduction
China is the world’s largest coal producer and consumer, contributing 47.6% of global coal production in 2019 (BP, 2020). Even so, the Chinese coal industry has been eliminating excess capacity and optimizing its operations since 2015, in order to combat declining coal prices and corporate profits. Other major coal producers, including the USA, India, Australia, Indonesia, Russia, and South Africa, together accounted for about another 38.4% of the world’s total coal production in 2019. The conditions of the coal industry and trends in production and consumption in these countries, however, vary to a large extent.
Since coal production and consumption have serious environmental consequences, the world is shifting to a cleaner, lower-carbon energy mix and coal is expected to be replaced by lower carbon alternatives (Hu et al., 2010; Bian et al., 2010; Bell, Stacey, and Genske, 2000). The imbalance between coal supply and demand also has a significant negative impact on the coal price, company interests, and labourers’ benefits. Therefore, the major coal producers and consumers are accordingly adjusting to a more scientific and sustainable pattern of growth in production and consumption in the domestic industries. In this paper we attempt to summarize the situation of the coal production and consumption in the world in recent years, with emphasis on the Chinese coal industry.
Current situations of major coal-producing countries
Coal production and consumption
Figure 1 compares the coal production and consumption for the six major coal producing countries (excluding China) from 1981-2019. It shows a large discrepancy between different countries, which will be illustrated in detail below.
The USA is the second largest coal producer and consumer in the world. Following the steady increase from 1981-2009, coal production and consumption have been decreasing for the last 12 years. This might be due to the extraordinary boom in shale gas during that period. Both coal production and consumption declined to approximately 640 Mt in 2019. In particular, coal production has varied significantly over the last four years.


India, in contrast, has been increasing coal production and consumption for the last four decades, and has seen the fastest increase in coal production, bypassing the United States in 2015 to become and the world’s second largest coal consumer. India‘s coal consumption has grown faster than production for almost four decades, with 218 Mt imported in 2020.
Australia, on the contrary, shows a higher growth rate of production than consumption. Australian coal production increases linearly, and almost keeps at the same level with India. Consumption, however, maintains at around 1.2-2.5 EJ (about 40–85 Mt) for most of the past 39 years.
Indonesia has also seen a sharp growth in coal production since 1985. Production peaked at 474.6 Mt in 2013 and remained fairly steady until 2018, when it increased again. Consumption shows a clear increasing trend, reaching a maximum of 106.4 Mt in 2013 and then increasing again. However, consumption is increasing at a much slower rate than production.
Coal production for Russia is a V-shaped curve, in striking contrast to the inverted V-shaped curve of the United States. The production decreases and then returns to about 440 Mt in 2019, the same level as in 1985. Consumption, however, shows an overall decline before stabilizing at 200 Mt/a from about 2005.
The trend of coal production in South Africa shows a slight increase from 1981-2019. Both production and consumption have remained fairly stable over the past 15 years.
To better illustrate demand and supply in the domestic coal industries, Figure 2 compares the coal imports and exports of the major coal producers in the world. India has been a net importer of coal since 1983, with imports growing exponentially since 2004. India has become the world’s largest net importer of coal, surpassing China in 2011.
The net exporters among the major coal producers are Australia, Indonesia, Russia, South Africa, and the United States. Of those, Australia has been the largest coal provider in the world for most of the past 39 years. The excess of production over consumption has increased steadily, reaching approximately 11.64 EJ (396 Mt) in 2019. Indonesia is the second largest coal provider, and an exponential growth is observed for the excess of production over consumption from 2003-2019. Russia has steadily increased exports,

becoming the world’s third largest coal provider. The production of coal in South Africa has remained at approximately 100 Mt more than domestic coal consumption since 1998. In contrast, the curve for the United States shows significant fluctuations over the studied period. The difference between production and consumption in 2000, 2003, and 2016 is close to zero, indicating an overall balance between demand and supply.
Figure 3 illustrates the changes in coal prices in China, Japan, Europe, and the USA. It shows that both the Northwest Europe coal market price and the US Central Appalachian coal spot price index were relatively stable before 2000, with significant variations thereafter. The coal prices in the four major coal markets saw an overall increasing trend from 2000-2011, with a marked increase in 2008. This is likely an effect of the 2008 global financial crisis. Coal prices rose in the four major coal markets in 2016 after four consecutive years of decline. Generally, prices were higher in China and Japan, at US$85.9 and 77.6 per ton respectively in 2019, compared to the lowest price of US$57.2 per ton in the USA.

Current situation of the Chinese coal industry
Coal production and consumption
Development of the Chinese coal industry
Chinese and the world’s coal production and consumption during the period 1981-2019 are analyzed in this section. As can been seen in Figure 4a, the development of the Chinese coal industry can be classified into four phases, i.e., the stable growth phase, stable phase, rapid growth phase, and high-quality phase, based on increases in coal production and consumption since 1981. The first 15 years constitutes the stable growth phase, which is characterized by a steady increase in both production and consumption from 1981-1995. During this period, China became the world’s largest coal producer, exceeding US production in 1985, and the world’s largest coal consumer, again by surpassing the USA two years later (BP, 2020). This is followed by the stable phase from 1996-2001, with production and consumption levelling off at around 1350 Mt/a. The following ‘golden age’ from 2002-2012 is characterized by rapidly-growing coal demand and supply, and a noticeable faster growth pattern of production and consumption at an average rate of approximately 220.4 Mt/a (CICER, 2016), with consumption slightly higher than production for most of the years. After peaking at

around 4000 Mt in 2013, both production and consumption started to decline, which is in sharp contrast to the rapid growth over much of the past 30 years. Since then, the Chinese coal industry has entered the so-called high-quality phase. This might be due to the overcapacity-cutting and production-optimizing operations at the end of the ‘golden age’. Affected by the downward pressure on economic growth and excess production capacity, 90% of the coal companies in China ran at a heavy loss during this recession (Zhang, 2015). The fundamental cause of this increasing highquality drive is excess production capacity. Even so, China is still the largest coal producer and consumer, and accounts for nearly 47% of the world’s total share.
Since China is highly influential in the global coal industry, global trends in production and consumption from 1981-2019 follow a very similar pattern to that of China, and can be classified into the same four stages (see Figure 4b), except for a slight difference in the duration of each phase. The stable growth phase ends in 1989 and is followed by a 10-year stable phase from 19891999, which is four years longer than the corresponding Chinese stable phase. The global rapid growth phase begins in 1999, two years earlier than the corresponding Chinese ‘golden age’. This development stage ends at around 2013, similar to China, preceding the high-quality phase. World coal production peaked at 8274.6 Mt in the same year as Chinese production, and decreased to 7460.4 Mt in 2016. Again, this might be due to overcapacity-cutting in the Chinese coal industry.
China‘s coal reserves are unequally distributed across the country, with the bulk of the total proved reserves in the northern and western regions. Coal production is likewise unevenly distributed (Gao et al., 2013; Liu 2008). Figure 5 shows the major Chinese coal producing provinces in 2020. The provinces with production over 100 Mt are Shanxi (1063.1 Mt), Inner Mongolia (1000.9 Mt), Shaanxi (679.4 Mt), Xinjiang (265.9 Mt), Guizhou (119.4 Mt), Anhui (110.8 Mt), Shandong (109.2 Mt), and Henan (104.9 Mt). The total production of these eight provinces accounted for about 90.6% of China‘s total coal production in 2020.
In the domestic coal industry, coal is normally transported from the west to the east, and from the north to the south (Tian, Shang, and Tang, 2006). This is because while most production is located


in the northern and western provinces, the eastern parts of China consumes more coal than the west. Xinjing, Inner Mongolia, Shanxi, Shannxi, and Guizhou in the west are the net exporting provinces, and Henan, Shandong, and Anhui the net importing provinces. China as a whole has been a net importer of coal since 2005, despite the fact that domestic coal production has reached almost 50% of the world’s total. An overall increase in the demand for coal imports is observed during the studied period (Figure 6), with an extraordinarily high demand during 2005-2016, which corresponds to the ‘golden age’ of the Chinese coal industry. In 2016, coal imports reached a peak of 477.6 Mt.
Conclusions
➤ The development of the world’s and China’s coal industries can be classified into four phases: stable growth, stable, rapid growth, and high-quality – based on coal production and consumption.
➤ Global coal production and consumption have declined for the last three years, in striking contrast with the continuous growth for most of the past 35 years. This is largely due to overcapacity cutting in China and the extraordinary boom in shale gas in the USA.
➤ Australia, Indonesia, and Russia have become the world’s major coal providers, while China, India, the USA, and Germany are the major consumers.
➤ Coal prices rose in the world’s four major coal markets in 2016 after four consecutive years of falling prices. Overcapacity cutting and optimization of production in China could assist in balancing demand and supply.
Acknowledgments
This paper was supported by the National Energy Group Technology Innovation Project (SHJT-17-38), Beijing Natural Science Foundation (2204080), and the National Natural Science Foundation of China (52004010). The authors are grateful to the State Key Laboratory of Water Resource Protection and Utilization in Coal Mining for their help.
References
Bell, F., Stacey, T., and Genske, D. 2000. Mining subsidence and its effect on the environment: Some differing examples. Environmental Geology, vol. 40, pp. 135–152.
Bian, Z-F., Inyang, H-I., Daniels, J.L, Otto, F., and Struthers, S. 2010. Environmental issues from coal mining and their solutions. Mining Science and Technology, vol. 20, pp. 0215–0223.
BP. 2020. Statistical Review of World Energy 2020. 69th edn. https://www.bp.com/content/dam/bp/business-sites/en/global/ corporate/pdfs/energy-economics/statistical-review/bp-statsreview-2020-full-report.pdf
China Institute for Coal Economic Research (CICER). 2016. Resolve the excess capacity, out of the mess and realize the development. Coal Economic Research, vol. 36, no. 1, pp. 6–10.
Gao, T-M., Shen, L., Liu, L-T,, and Liu, Y-X. 2013. The inequality of China’s coal resources and its flow paths. Journal of Natural Resources, vol. 28, no. 1, pp. 92–103.
Hu, SI., Hai, P-B., Xiao, H-L., and Chun, H-Y. 2010. Environmental evaluation for sustainable development of coal western China. International Journal of Coal Geology, vol. 81, pp. 163–168.
Liu, J. 2008. The discussion and analysis of our country coal resource distribution “north many south little”. Storage Transportation and Preservation of Commodities, vol. 30, no. 7, pp. 115–116.
Liu, X-J. and Luan, H-B. 2015. A brief analysis of the circumstances of the current coal industry and its trends in China. International Journal of Mining and Mineral Engineering, vol. 6, no. 1, pp. 87–96.
Song, M-L. and Wang, J-L. 2016. Coal price fluctuations in China: Economic effects and policy implications. Journal of Renewable and Sustainable Energy, vol. 6, no. 1, pp., 87–96.
Tian, S-G., Shang, G-X., and Tang, X. 2006. Chinese coal resources octothorpe shaped distributing pattern-regional differentiation and resources economic geographical division. Coal Geology of China, vol. 18, pp. 1–5.
Wang, W-D., Li, S-J., and Han, J-X. 2015. Analysis of the main global coal resource countries’ supply-demand structural trend and coal industry outlook. China Mining Magazine, vol. 24, no. 2, pp. 5–9.
Zhang, X-L. 2016. Analysis on coal industry situation in 2015 and study and judgement on future development. Coal Economic Research, vol. 36, no. 1, pp. 11–14. u
Affiliation:
1School of Mining Engineering, University of the Witwatersrand, South Africa
Correspondence to:
C.C. Birch
Email: clinton.birch@wits.ac.za
Dates:
Received: 15 Nov. 2023
Revised: 12 Mar. 2024
Accepted: 20 May 2024
Published: July 2024
How to cite:
Birch, C.C. and Cawood, F.T. 2024. Optimizing the cut-off grade for tabular gold deposits, considering the South African gold tax and mineral resource royalty regime. Journal of the Southern African Institute of Mining and Metallurgy, vol. 124, no. 7. pp. 387–396
DOI ID:
http://dx.doi.org/10.17159/24119717/3195/2024
ORCID:
C.C. Birch
http://orcid.org/0000-0002-3689-5462
F.T. Cawood
http://orcid.org/0000-0002-0706-1450
by C.C. Birch1 and F.T. Cawood1
Abstract
The South African mineral resource royalty system, initiated in 2010, employs a hybrid ad valorem approach tied to profitability ratios. This rate is then applied to the total revenue from mineral sales. In this article we explore how the profitability ratio in the mineral resource royalty formulae interacts with the gold tax formula as applied to South African gold mines, devising a strategy for cut-off grade optimization. The study focuses on nine narrow, tabular-reef (Witwatersrand) gold mines.
The approach involves a mixed-integer cut-off grade optimizer utilizing Excel Solver, incorporating relevant royalty and income tax formulae. Different mineral resource royalty cost scenarios were examined. Ignoring these costs in the break-even analysis lowers the cut-off grade but slightly boosts profits compared to considering expected costs. The developed optimizer model, recognizing the profitability aspect of the mineral resource royalty and income tax formulae, yielded a 6% lower cut-off grade than the base case. This is significant for increasing mine life. While the profit differences are marginal (0.2% compared to the break-even base case), substantial improvements were noted: a 6% increase in stope tons above cut-off grade, and a 4% rise in total revenue. Enhanced resource utilization (3% extra gold kilograms) reduces necessary development and overall costs, allowing for a reduction in the cut-off grade and ultimately, more profit.
Keywords
cut-off grade, Excel Solver, mineral resource royalties, gold tax formula, financial optimization, cash flow
Introduction
The cut-off grade determines the mine plan, distinguishing between payable ore, unpayable ore, and waste material (Gholamnejad, 2008). Rising costs, including mineral resource royalties, can increase the cut-off grade and reduce mineable reserves. Limited research exists on how mining taxes and royalties influence cut-off grades and the resulting mineral sterilization, reducing mine life. Ideally, both the company and the State should be satisfied, but this balance is rarely achieved (Lilford, 2017).
If mineral resource royalties were based solely on profit, they could be disregarded for cut-off grade calculations, similar to income tax. However, as they are imposed on total sales, ad valorem and mining volume royalties are considered costs in determining the cut-off grade (Hall, 2014). Various forms of royalties, taxes, and levies benefit states, including mineral resource royalties, income tax (with gold mines paying on a sliding scale), employees' income tax, dividends tax, value-added tax, social and labour plan contributions, skills development levy, and excise duties and levies, including the fuel levy (Akinseye, 2019).
The South African mineral resource royalty scheme, established in 2010, utilizes a hybrid ad valorem approach, with the rate dependent on the profitability ratio. This rate is then applied to the base of the total revenue from mineral sales (Cawood, 2010).
The mining companies that the study focuses on are those that exploit the narrow, tabular mineral deposits that characterize the Witwatersrand gold mines of South Africa (Figure 1).
Review of royalty costs in significant gold-producing countries
The following 10 countries have been identified as the world's significant gold-producing countries for 2021. They were selected based on S&P Global Market Intelligence gold production values (S&P Global, 2024):
Australia
Burkina Faso
Canada
China

Ghana Mexico Russia South Africa United States Uzbekistan.
The predominant method used to determine the royalty is some form of ad valorem royalty based on the value of the mineral sold. Some countries allow some costs to be deducted when determining the amount to be paid. The accepted approach for ad valorem royalties is to consider them a mining cost and include the cost in the cut-off grade calculation. The South African hybrid approach. with a profit-based sliding scale applied to the total value of the mineral sales, is unique. This affects how the royalty costs should be considered for the cut-off grade determination.
South Africa has the lowest overall royalty costs of the top 10 gold-producing countries. Compared to the total cash cost (TCC), the effective rate is significantly lower than that of the other countries (estimated to be 3.8% for the mines included in the study compared to a weighted average of 7.9%). However, this favourable situation is partly due to the high overall mining costs in South Africa (US$1390 per ounce) compared to the other top 10 gold producers (average of US$952 per ounce) (S&P Global, 2024). The South African mineral resource royalty formula was developed taking marginal producers into account and yet ensuring the State received fair compensation for the resource depletion (Cawood, 2011). High-cost mines are more likely to end up as marginal mines, which makes this study important in the South African context of poverty and the need to extend the lives of the mines and avoid resource sterilization.
South African gold mines exploiting narrow tabular reefs face high mining costs, making many of them marginal. The associated
mineral resource royalty costs significantly influence the conversion of Mineral Resources to Mineral Reserves when applying an economic cut-off grade (Lomberg and Rupprecht, 2017). Mining companies reviewed during this research project do not appear to take the profitability aspect of the mineral resource royalty formula into account when determining the cut-off grade. Understanding the profitability ratio in mineral resource royalty and income tax rates, derived from the gold formula, is essential in order to mitigate the costs associated with the mineral resource royalty when optimizing the cut-off grade.
Mining companies calculate a cut-off grade to determine the portion of the mineral deposit that can be mined economically. This cut-off grade considers the forecast price of the commodity, the expected mine recovery factor (MRF), the cost to mine the ore and extract the commodity, and the fixed costs for the mine. Using the planned extraction rate, expected recovery factor, total mineral extraction and sales costs, the variable element in break-even grade calculation becomes the in-situ grade of the product. A block will be mined profitably if the grade is higher than the break-even grade.
Mining companies can approach the question of how to consider the mineral resource royalty costs for determining the cutoff grade in six possible ways.
➤ Ignore the implications and continue calculating the cut-off grade in the way it was done before the introduction of the tax
➤ Use the minimum rate (0.5% of total revenue)
➤ Estimate the expected rate that will be applied by looking at historical rates
➤ Estimate the expected rate by modelling the optimized cash flow based on the break-even grade, and then determine the expected rate and use that as an additional cost for break-even grade calculations
➤ Assume that the highest rate will be applied, depending on whether the mine is refining gold (rate of 5%) or selling gold production in an unrefined state (rate of 7%)
➤ Use a profitability optimization model, which applies a variable rate depending on the profitability, and determine if there is a higher profit to be made even if the profitability rate is lower.
In an initial study published in 2016 (Birch, 2016a) it was noted that the mines reviewed considered the mineral resource royalty as a cost and included it in the determination of the cut-off grade. The fundamental purpose of this research is to understand how the profitability ratio in the mineral resource royalty interplays with the gold tax formula applied to South African gold mines and to develop an approach for cut-off grade optimization. To identify the optimal approach, a financial optimizer model has been developed which links the mineral resource block model to the financial model. This optimizer model was developed by Birch and dubbed the BirchOptimiser in his PhD thesis (Birch, 2022).
Two primary forms of taxation are considered for this study: the income tax (in the form of gold tax for gold mines) (South African Revenue Service, 2022) and the mineral resource royalty (South African Government, 2008). The gold taxes and the mineral resource royalty both have sliding scales based on the operation's profitability. In periods of higher profitability, the structure of these taxes results in a higher tax rate. The difference between the two forms of taxation is the base the rates are applied to. Income tax is paid as a percentage of the profit, while the mineral resource royalty is paid on a base allowing for a few deductions – a base close to sale revenue. These two taxes combine to ensure that the State is receiving a higher portion of the revenue at times of high commodity prices, while also providing automatic relief during difficult times.
South Africa introduced two formulae to determine the mineral resource royalty rate. Separate formulae apply to refined and unrefined mineral products. The difference between the refined and unrefined rates was introduced to encourage mineral beneficiation (Akinseye, 2019). The mineral resource royalty is considered a tax-deductible cost in determining the taxable income. This also has an impact on profitability when determining the income tax rate using the gold tax formula. When calculating the rate payable, these formulae consider the company's profitability, with highly profitable companies paying a higher rate (South African Government, 2008). Gold mines are required to refine gold to 99.5% for the refined royalty formula to apply. Rand Refinery is owned by five large South African gold mining companies (Bullionstar, 2022) and all the mines included in this study are owned by these companies. The refined royalty rate will thus be used for this study.
The refined mineral resource royalty rate is calculated as shown in Equation [1] (South African Government, 2008).

where: x is the earnings before interest and tax (EBIT)/ (aggregate gross sales) ratio multiplied by 100 to yield a whole number, and y(r) is the applicable tax rate. This rate is capped at 5%.
The gold mining companies pay income tax based on the gold tax formula shown in Equation [2].

where: x is the profit/revenue ratio multiplied by 100 to yield a whole number, and y(%) is the applicable tax rate.
The gold tax is paid on the taxable profits of the mining company and excludes non-mining income (South African Revenue Service, 2022). The tax has an element of variation due to profitability, which is considered along with the mineral resource royalty when optimizing the cut-off grade.
Tax theory describes an effective tax as one that does not disrupt economic behaviour (Otto and Cordes, 2002; Mangondo, 2006). Businesses primarily aim to generate profits, and income tax, calculated based on profits, does not alter business conduct. Therefore, income tax is considered neutral (Otto and Cordes, 2002).
In general, mineral resource royalties are not neutral unless they are purely profit-based and the royalty is treated as a tax-deductible expense. Royalties are based on total mining revenue, to which base the royalty rate is applied. They are also often treated as an expense, making them deductible for calculating taxable income. This adjustment influences the cut-off grade calculation and determines the economically viable portion of the orebody.
Taylor (1972) defines a cut-off grade as ‘any grade that, for any specific reason, is used to separate two courses of action, e.g. to mine or to leave, to mill or to dump’. A cut-off is generally defined as the amount of metal a ton of rock must contain in order to be sent to the processing plant (Rendu, 2008). This cut-off grade will change as metal prices fluctuate, the mine costs vary, and the project moves through various stages (Lane, 2016).
The basics of cut-off grade theory are described in Hall (2014). This is a comprehensive study of the various techniques used in the mining industry. It includes multiple value measures, including optimizing the discounted cash flow (DCF) and net present value (NPV). Lane (2016) stated that the boundary that distinguishes which material within a mineralized body is to be extracted from the remainder and treated is specified by the cut-off grade, which is, in effect, the economic definition of ore. The cut-off grade is the lowest value at which a specified ore block may be mined profitably for the planning cycle under consideration (Lane, 2016).
The cut-off grade calculation is straightforward. It determines the grade required for an ore unit to return a profit. It is essentially a break-even grade calculation where the volume is known (usually limited due to shaft capacity, mill capacity or some other physical constraint), and the unknown is the in-situ grade of the commodity (Githiria and Musingwini, 2018).
At the break-even grade, total revenue is equal to total costs. Before 2013, gold mining companies used varied methods of reporting their mining costs. Some companies only reported mining and processing expenses and overlooked crucial factors like sustaining capital (Yapo and Camm, 2017). The World Gold Council then established a more consistent reporting method, including the all-in sustaining costs (AISC) and all-in costs (AIC) (Gianfrate, 2017). For this study, the TCC values have been used. Both the AIC and AISC values include off-mine costs and for determining the break-even grade, only on-mine costs are considered appropriate (Meredith, 2021). Equation [3] was used to determine the breakeven grades that are applied as the base case for the comparisons of the various optimized approaches. [3]

where g/t is the break-even grade in grams per ton, TCC is the all-in sustaining costs in US$ per ton, r is the mine recovery factor in %; p is the metal price in US$ per gram, and SM is the ratio of stope tons to milled tons (in %).
The reason for including the stope tons to milled tons ratio in calculating the break-even grade is that all milled tons are taken into account when stating the TCC. It is worth noting that mines do not just mill tons extracted from stopes. Other sources, such as on-reef development, vampings, and waste dilution, also contribute to total production. To determine whether stopes are profitable, the cut-off grade is applied to the in-situ face grade. Ideally, if the unit cost for stoping was available, it could be used directly. Unfortunately, this figure is not provided in companies' annual Resource and Reserve figures (Birch, 2023). The 2023 TCC figures used for this study have been obtained from S&P Global IQ (S&P Global, 2024).
In this study, the base-case cut-off grade will be determined using the basic break-even formula, which incorporates the expected mineral resource royalty cost. This base-case cut-off grade will then be contrasted with the cut-off grades derived from the BirchOptimiser, taking into account the various approaches mines can adopt regarding mineral resource royalty costs. The objective of the optimization strategy is to maximize profits. To achieve this, the BirchOptimiser will be employed to optimize the DCF and maximize the NPV using a 0% discount rate. It is worth noting that although this method can enhance NPV at higher discount rates, it has been observed to considerably reduce the mine's lifespan for a marginal NPV increase (Birch, 2016b). Further details about the BirchOptimiser can be found in Appendix A.
The study considers 2023 as the initial production year, assuming an average gold price of US$1941 per ounce in 2023 (World Gold Council, 2024). The figures for the nine gold mines used for the study are shown in Table I and have been sourced from the companies’ annual Resource and Reserve reports and S&P Global IQ. The companies in this study state that the tons are run-of-mine tons delivered to the plant.
The methodology involves simulating block models based on published Mineral Resources and Reserves. Companies do not release raw block listings into the public domain so an alternative source for block listings is required. The distribution of the grades (in g/t or cmg/t) is determined using the Fit application in Palisade @Risk software and a probability function is derived (Palisade, 2014). This function is then used to populate the grade column in a blank block list. The total number of blocks in the list is selected
so the total Measured and Indicated tonnage matches the published figures (using standard block sizes and the published channel and stoping widths). The resultant simulated block lists were compared to the published curves and are considered adequate for cut-off grade optimization, acknowledging potential variations in mine block sizes (Birch, 2022).
It is assumed that blocks above the cut-off grade are mineable (ore blocks), while those below are not mined. The study accepts a disparity between overall production results and published Mineral Reserves due to these assumptions. Nonetheless, the study's validity remains intact, aiming to identify an optimal approach while considering mineral resource royalty costs in cut-off grade calculations.
The break-even cut-off grade for each mine was set as the base case, determined through Equation [3] using the TCC. These cut-off grades are inserted into a financial model to determine the average mining grade (AMG) and total tons above the cut-off grades. The total stope tons above cut-off grade, profit, resource utilization, and total revenue are then established using a cash flow model. This was repeated using TCC, excluding the expected mineral resource royalty costs.
This is followed by comparing the optimized cut-off grade using the BirchOptimiser where the royalty rate is set to 0%, 0.5%, the royalty cost for the previous year, and the estimated rate for the current year, and 5.0%. These cut-off grades are then inserted into the cash flow to determine the resultant stope tons above the cut-off grade and the resultant milled tons, AMG, and profit.
Finally, the BirchOptimiser is then run, allowing the mineral resource royalty rate to be variable, and the model automatically determines the optimal cut-off grade.
The following was noted for the nine mines.
➤ The cut-off grade determined by the break-even approach including the estimated royalty cost results in the highest cutoff grade (this is the base case).
➤ The cut-off grade determined by the break-even approach excluding the royalty costs is significantly lower and results in higher profit.
➤ The difference between the cut-off grades determined by the break-even approach (with no royalty costs) and those obtained from the BirchOptimiser (with 0% royalty cost) demonstrates the effect of the BirchOptimiser considering the lower profitability in the calculation.
Break-even grades for the mines included in the study (Sibanye-Stillwater, 2022; Harmony, 2023; S&P Global, 2024)
Mine
➤ This resulted in a cut-off grade the same as or slightly lower than the break-even cut-off grade (without royalty costs).
➤ When the BirchOptimiser is allowed to alter the royalty rate automatically, the resultant cut-off grade is lower than when it is set to 0%. This demonstrates that the model is taking the effect of the lower profitability reducing both the mineral resource royalty and gold formula income tax rates into account and allowing more mining to take place. The overall result is higher profit.
The benefits of removing the royalty costs from the break-even grade calculation or adopting the BirchOptimiser approach are demonstrated in the following graphs, which present the combined findings for the nine mines reviewed. The average break-even/ cut-off grade is weighted using the total tons above the break-even/ cut-off grade. The benefit of presenting the break-even cut-off grade (excluding royalty) approach is that the mines could quickly adopt this without changing their current approach for determining their cut-off grades. This results in an average reduction of the cut-off grade by 4%. However, further benefits could be derived by adopting the BirchOptimiser profit-optimized (with variable royalty rate) approach that takes the interplay of the mineral resource royalty and the gold tax profitability into account when determining the cut-off grade. This results in an average cut-off reduction of 6% compared to the base case. This approach is shown to be the best when the overall profit is used as a value measure.
Stope tons above the cut-off grade
Figure 2 shows the difference in the overall tons above the cut-off grade for the three approaches.
It can be observed in Figure 2 that using the break-even grade (excluding royalties) as the cut-off grade increases the tons
above the cut-off grade by 4% of the break-even grade (including royalties). An additional 2% can be mined if the profit-optimized (with variable royalty rate) approach is adopted (as determined using the BirchOptimiser).
Profit
Figure 3 shows the profit difference using the three approaches. The difference in overall profit between the three approaches is very slight, with only an additional 0.2% being gained by adopting the profit-optimized (with variable royalty rate) approach. However, the benefits of increasing the resource utilization and extending the mines’ lives need to consider a broader view of value than purely profits (Birch, 2023).
Resource utilization
An additional benefit to the higher profitability is better resource utilization. Figure 4 shows how the percentage resource utilization increases as the cut-off grade is reduced by excluding the royalty costs from the calculation and using the profit-optimized (variable royalty rate) approach.
There is a 2.0% and 3% increase in resource utilization (in kilograms) noted between the two approaches compared to the base-case approach. This is significant because it would allow more ore to be mined for the same input costs. One of the planning methods used in South African gold mines is the ‘iceberg’ (School of Mining Engineering, 2021). This method determines how much main footwall haulage development is required to ensure sufficient mining face is opened to meet the business plan. One of the key inputs into this calculation is the expected resource utilization (considering cut-off grade and aspects like mining method and geological losses). Increasing the resource utilization by up to 3% would bring significant savings in development costs, reducing the TCC. Figure 5 demonstrates how increasing resource utilization (through a lower cut-off grade) reduces development requirements and costs and further lowers the cut-off grades.


Figure 3—Percentage difference in profit between base-case (break-even grade including royalty costs), break-even grade excluding royalty costs and profit-optimized cut-off grade (using variable royalty rate)

Figure 4—Percentage difference in resource utilization (kilograms) between base-case (break-even grade including royalty costs), break-even grade excluding royalty costs, and profit-optimized cut-off grade (using variable royalty rate)
Total revenue
The increase in total revenue obtained by adopting either the breakeven (excluding royalty cost) or the profit-optimized (with variable royalty rate) approach is displayed in Figure 6.
Figure 6 shows that the total revenue from the mines reviewed could be increased by 2% and 3%, respectively, by adapting either
the break-even (excluding royalty cost) or the profit-optimized (with variable royalty rate) approach. Although the profitability is reduced, the increased mineable reserve results in an overall increase in mining volume and profits. Considering the importance of mining to the overall economy of South Africa, demonstrating that there is a benefit in excluding the royalty costs from the


Figure 6—Percentage difference in total revenue between base-case (break-even grade including royalty costs), break-even grade excluding royalty costs, and profitoptimized cut-off grade (using variable royalty rate)
cut-off grade calculations is considered very important. Although this approach has only been applied to gold mines, many other commodities apply break-even and cut-off optimization approaches. Although they would not enjoy the benefit that a reduced profitability ratio would have on their corporate income tax rate (currently fixed at 27%) (South African Revenue Service, 2022), the benefit the reduced profitability has on the mineral resource royalty rate is expected to be the same.
Conclusions
South African gold mining companies pay income tax and royalties according to a unique formulae system. The mineral resource royalty introduced in 2010 is a hybrid ad valorem model with the profitability of an operation determining the rate, which is then applied to revenue derived from mineral sales. The gold tax formula is used to determine the income tax rate and uses the profitability of an operation in determining the rate. This unique approach poses a
question: Can a decrease in mine profitability actually lower the cutoff grade and lead to an increase in profits because of the dynamics of the two formulae?
This study has examined how the mineral resource royalty cost can be considered when determining the cut-off grade. A base case was established where the cut-off grade was determined using the break-even approach and the estimated royalty costs were included in the calculation. This was contrasted with the cut-off grade being calculated with the break-even approach – excluding the royalty costs. These results were then compared to the optimal cut-off grade determined using a financial optimizer model developed for the study (the BirchOptimiser), which uses an Excel mixed-integer linear programming Solver function. Various approaches were tested using a royalty rate set to 0%, 0.5%, the royalty cost for the previous year, the estimated rate for the current year, and 5.0%. Finally, the BirchOptimiser was allowed to determine the mineral resource royalty rate automatically.
Nine South African gold mines were included in the study. Cost and production information was obtained from the annual Mineral Resource and Reserve reports for the companies. The BirchOptimiser requires a block listing, and these were simulated from the published grade-tonnage curves. The study has shown that total stope tons above cut-off grade, profit, resource utilization, and total revenue can be improved by excluding the royalty cost from the break-even cut-off grade calculation. This results in an average reduction in the cut-off grade by 4%. The BirchOptimiser has identified that additional profit gains can be realized by reducing the cut-off grade further. The average cut-off reduction from the base case, following this approach, is 6%. The reduced profitability results in lower royalty and income tax rates.
While the actual differences in profits obtained from the study are minor (0.2% compared to the break-even base case), significant gains in stope tons above cut-off grade and resource tonnage utilization (6%), and total revenue (4%) can be achieved. The higher resourceutilization (3%) would more than offset the development needed to maintain the mine's target gold output, leading to lower TCC. This, in turn, will allow further reductions in the cut-off grade, and increase profits and the life of mine.
The authors would like to acknowledge the University of the Witwatersrand School of Mining Engineering for assistance during this study.
References
Akinseye, P.O. 2019. Modifying the South African mining royalty regime for optimal mineral resource use and management of mineral rents. PhD thesis, University of the Witwatersrand.
Birch, C. 2016a. Impact of the South African mineral resource royalty on cut-off grades for narrow, tabular Witwatersrand gold deposits. Journal of the Southern African Institute of Mining and Metallurgy, vol. 116, no. 3. https://doi.org/10.17159/24119717/2016/v116n3a4
Birch, C. 2016b. Impact of discount rates on cut-off grades for narrow tabular gold deposits. Journal of the Southern African Institute of Mining and Metallurgy, vol. 116, no. 2. https://doi. org/10.17159/2411-9717/2016/v116n2a2
Birch, C. 2022. Understanding the impact of the South African mineral resource royalty regime on tabular gold deposits: an approach for cut-off grade optimisation. PhD thesis, University of the Witwatersrand.
Birch, C. 2023. Multiple-criteria cut-off grade optimisation utilising Excel Solver. Proceedings of APCOM 2023. Intelligent Mining: Innovation, Vision, and Valu, Rapid City, South Dakota. Society for Mining, Metallurgy & Exploration (SME), Littleton, CO.
Bullionstar. 2022. Rand Refinery. https://www.bullionstar.com/golduniversity/rand-refinery
Cawood, F. 2010. The South African Mineral and Petroleum Resources Royalty Act – Background and fundamental principles. Resources Policy, vol. 35, no. 3, pp. 199–209. https://doi.org/10.1016/j.resourpol.2010.03.003
Cawood, F. 2011. An investigation of the potential impact of the new South African Mineral and Petroleum Resources Royalty Act. Journal of the Southern African Institute of Mining and
Metallurgy, vol. 111, no. 7. https://www.saimm.co.za/Journal/ v111n07p443.pdf
Gholamnejad, J. 2008. Determination of the optimum cutoff grade considering environmental cost. Journal of International Environmental Application & Science, vol. 3, no. 3. pp.186–194.
Gianfrate, G. 2017. All that glitters: Gold mining companies’ market reaction at the issuance of the “All-in Sustaining Costs” guidance. Journal of Accounting and Public Policy, vol. 36, no. 6, pp. 468–476. https://doi.org/10.1016/J. JACCPUBPOL.2017.09.004
Githiria, J. and Musingwini, C. 2018. Comparison of cut-off grade models in mine planning for improved value creation based on NPV. Proceedings of the Society of Mining Professors 6th Regional Conference. Southern African Institute of Mining and Metallurgy, Johannesburg. pp. 347–362.
Hall, B. 2014. Cut-off Grades and Optimising the Strategic Mine Plan. Australasian Institute of Mining and Metallurgy, Melbourne.
Harmony. 2023. Mineral Resources and Mineral Reserves report. 162 pp. https://www.harmony.co.za/business/resources-reserves
Lane, K. 2016. The Economic Definition of Ore. Comet Strategy, Brisbane, Australia.
Lilford, E.V. 2017. Quantitative impacts of royalties on mineral projects. Resources Policy, vol. 53, pp.369–377. https://doi. org/10.1016/j.resourpol.2017.08.002
Lomberg, K. and Rupprecht, S.M. 2017. The 2016 SAMREC Code. Journal of the Southern African Institute of Mining and Metallurg, vol. 117, pp. 1095–1100. https://doi.org/10.17159/24119717/2017/v117n12a1
Mangondo, K. 2006. The economics of gold mining taxation. M.Com dissertation University of South Africa. https://uir. unisa.ac.za/bitstream/handle/10500/2265/dissertation.pdf
Meredith, E.D. 2021. The effect on net present value of cut-off grades applied to various reef types using different mining methods. MSc dissertation, University of the Witwatersrand. Microsoft. 2022. Define and solve a problem by using Solver. https://support.microsoft.com/en-us/office/define-andsolve-a-problem-by-using-solver-5d1a388f-079d-43ac-a7ebf63e45925040 [accessed 22 January 2022].
Minerals Council South Africa. 2022. Gold. https://www. mineralscouncil.org.za/sa-mining/gold [aAccessed 1 December 2022].
Otto, J. and Cordes, J. 2002. The regulation of mineral enterprises: A global perspective on economics, law and policy. Rocky Mountain Mineral Law Foundation, Westminster, CO. Palisade. 2014. Monte Carlo simulation. https://www.palisade.com/ risk/monte_carlo_simulation.asp
Rendu, J. 2008. An introduction to cut-off grade estimation. Society for Mining, Metallurgy & Exploration (SME), Littleton, CO. Sibanye-Stillwater. 2021. Mineral Resources and Mineral Reserves report. 189 pp. https://www.sibanyestillwater.com/newsinvestors/reports/annual/2021/
S&P Global. 2024. S&P Capital IQ Pro. S&P Global Market Intelligence. https://www.:spglobal.com/marketintelligence
The Journal of the Southern African Institute of Mining and Metallurgy
School of Mining Engineering. 2021. MINN7050A Mineral Resource Management course notes. University of the Witwatersrand, Johannesburg.
South African Government. 2008. Mineral and Petroleum Resources Royalty Act 28 of 2008. Government Gazette, no. 521. Pretoria. 13 pp.
South African Revenue Service. 2022. Guide for tax rates/duties/ levies. Pretoria. 119 pp.
Taylor, H.K. 1972. General background theory of cut-off grades. Transactions of the Institute of Mining and Metallurgy, vol. 96(A). pp. 204–216.
World Gold Council. 2024. Gold Demand Trends Full Year 2023. https://www.gold.org/goldhub/research/gold-demand-trends/ gold-demand-trends-full-year-2023 [accessed 10 May 2024].
Yapo, A.G. and Camm, T.W. 2017. All-in sustaining cost analysis: Pros and cons. Proceedings of the SME Annual Meeting, Denver, CO. https://digitalcommons.mtech.edu/cgi/viewcontent. cgi?article=1007&context=mine_engr
The BirchOptimiser performs two functions. The first is to determine the break-even cut-off grade considering the block listing, ore flow, and mining costs (with the various options of considering the mineral resource royalty costs). The second is a financial optimizer that uses the Excel Solver function to optimize the cut-off grades. The optimized cut-off grades can then be compared to the break-even cut-off grades to determine how companies should consider the cost of mineral resource royalties.
The layout for the BirchOptimiser used for this study is presented in a series of tables spread across two Excel sheets (the Blocklist and Cashflow sheets). The various tables are depicted in Figure A-1.
This block listing is created from the geological model and lists all the potential mining areas, estimated grades, and volumes. Based on this block listing, companies declare their Mineral Resources and Reserves into the public domain.
The cash flow used in this study is relatively simple and based on the one used for the Mine Financial Valuation courses presented at
the University of the Witwatersrand School of Mining Engineering. The core components are:
➤ Production
➤ Revenue
➤ Costs
➤ Earnings before interest and tax (EBIT)
➤ Capital costs and tax shield
➤ Mineral resource royalties
➤ Income tax
➤ Cash flow.
The production rate for this study uses the anticipated annual milled tons for the mine as published in the annual reports. The companies also publish the stoping width (SW) and milled width (MW), and this ratio is used to determine how much of the total annual tonnage is expected to be derived from stope faces.
The stope-face tons available to mine above the cut-off grade are determined from the block listing using an Excel = SUMIF function. If the estimated grade of a block is above the cut-off grade, it is included in the available tonnage. The AMG is determined by calculating the total metal in the s above the cut-off grade divided by the total tonnage of those blocks.
The cash flow model is populated with the production assumed to continue until the mineral resource above the cut-off grade is depleted. This is determined by a simple Excel =IF statement where if the remaining tons exceed the projected annual tonnage, the total annual tonnage will be mined, or only the remaining tonnage will be mined. Once the tons are depleted, no more mining takes place. The model only includes the Measured and Indicated resource blocks.
The AMG is associated with the tonnage from the stope faces. The additional tonnage is considered dilution for this study and does not add metal for revenue generation. However, the costs need to be considered because they affect the overall milled costs required to input into the model. If these dilution tons were not considered, the stope mining costs would be understated, affecting the optimal cut-off grades.
The MRF is determined by the mine call factor multiplied by the plant recovery factor. This is applied to the metal mined to determine how much is available to be sold and generate revenue.

This study states the metal price and resultant revenue in US dollars or South African rand. Due to the volatility of the South African rand and uncertainty of the exchange rates, the US dollar has been used.
The 2023 gold price is used for this study. The cash flows are in real (constant) monetary terms and use 2023 costs, so the gold price used is for the same period.
The formula to determine the gross sales revenue is shown in Equation [A-1].

where Au(oz) is the metal recovered in troy ounces, and p is the metal price in US dollars per ounce.
Costs
The TCC figure has been used for this study with the expected royalty costs deducted (because the model determines this from the formula built into it).
Because the AMG results from the cut-off grade, the US dollars per ounce operating expense (OpEx) cannot be used for the model. US dollars per ton OpEx is a more meaningful measure of the mines’ production efficiency for this study and is thus used. The production rates published by the companies for their various individual mines are accepted as the optimal rate considering the constraints on the operations. The published data is accepted because a deeper understanding of the operation is required to identify potential obtained by removing these constraints to increase production and lower the US dollar per ton OpEx.
Earnings before interest and tax
The EBIT is simply the gross sales revenue minus the total costs, as shown in Equation [A-2].

where GSR is the gross sales revenue, and TC is the total costs in US dollars.
The mines included in the study are all mature mines whose initial CapEx is considered recouped. The operational cut-off grade approach regarding the costs included in the study will be accepted. For the gold mines, the refined royalty formula is applied to the gross sales revenue. The gold tax formula determines the income tax rate and is applied to the taxable income. Both of these formulae use the profitability of the mine to determine the rates. The mineral resource royalty is a tax-deductible cost that affects the taxable income amount as well as the profitability used in the gold tax formula. This interplay between the mineral resource royalty and
the gold tax rates has necessitated this approach to the investigation as to which is the optimal approach to deal with the costs of the mineral resource royalty in determining the cut-off grades.
Cash flow
The cash flow is calculated for each year of production. The formula is as follows:

where EBIT is the earnings before interest and tax, MRR is the mineral resource royalty, and it is the income tax in US dollars.
The financial optimizer model created for this study uses the Excel Solver optimization tool to determine the cut-off grade. The Excel Solver is bundled with Excel, a widely used optimization program. Solver can be used to determine an optimal value (maximum or minimum) for a formula in a target cell that is constrained or limited by the values of other formula cells in a worksheet. Solver adjusts the values in the decision variable cell (the cut-off grade) to fulfil the constraint bounds of the cell and provide the desired result for the target cell (the profit) (Microsoft, 2022).
It is important to note that Solver has a few limitations. Firstly, the standard Microsoft Excel Solver is limited to 200 decision variables for both linear and nonlinear problems. Secondly, the limit on constraints depends on the type of model (linear or nonlinear) and the form of the constraints (Frontline Systems, 2023). Finally, it is worth mentioning that both the target cell and the decision variable cell must be on the same sheet for Solver to function properly.
Solver has three algorithms that it uses:
➤ Generalized reduced gradient (GRG) nonlinear (for problems that are smooth nonlinear)
➤ LP Simplex (for linear problems)
➤ Evolutionary (for non-smooth problems) (Microsoft, 2022).
It has been found for the BirchOptimiser model that although the evolutionary approach is the slowest, it is the most reliable. It has been noted that the GRG approach gives inconsistent results, often not changing the initial value input for the cut-off grade. The LP Simplex approach has not been tested because the nature of the model is not considered linear.
The BirchOptimiser determines the tonnage above the cut-off grade and the AMG from the block-listing sheet. The MCF and ratio between stope tonnage and total milled tonnage are also required. These values form the basic inputs into the cash flow sheet, the production rate, metal price, and mining costs. As Solver's cut-off grade varies, the tonnage above the cut-off grade and AMG inputs change to maximize the profit. u
Affiliation:
1UFRGS/DEMIN, Porto Alegre RS, Brasil
2AngloGold Ashanti, Brazil
Correspondence to:
F.G.F. Niquini
Email: fernanda.gontijo.fn@gmail.com
Dates:
Received: 6 Nov. 2023
Revised: 28 Feb. 2024
Accepted: 5 Apr. 2024
Published: July 2024
How to cite:
Drumond, A., Rodrigues, A.L., Costa, J.F.C.L., Niquini, F.G., and Lemos, M.G. 2024. Models for analysing the economic impact of ore sorting, using ROC curves. Journal of the Southern African Institute of Mining and Metallurgy, vol. 124, no. 7. pp. 397–406
DOI ID:
http://dx.doi.org/10.17159/24119717/3186/2024
ORCID:
A. Drumond
http://orcid.org/0000-0002-5383-8566
A.L. Rodrigues
http://orcid.org/0000-0003-4524-4087
J.F.C.L. Costa
http://orcid.org/0000-0003-4375-370X
F.G. Niquini
http://orcid.org/0000-0003-1872-1466
M.G. Lemos
http://orcid.org/0000-0002-9629-3332
by A. Drumond1, A.L. Rodrigues1, J.F.C.L. Costa1, F.G. Niquini1, and M.G. Lemos2
Abstract
The past decade has seen a renewed possibility of using machine learning algorithms to solve a large collection of problems in several fields. Data acquisition for mining operations has increased with the growth in sensor-based technologies, and therefore the amount of information available for mining applications has dramatically increased. Ore sorting equipment is available for separating ore from waste based on differences in physical properties detected by a real-time analyser. The separation efficiency depends on the contrast in these properties. In this study we investigate the application of machine learning models trained using data from the output of a dual-energy X-ray ore sorting apparatus at a gold mine. The particles were first hand-sorted into ore and gangue classes based on their mineralogical composition. Classification models were then used to help decide the balance between the number of true and false positives for ore in the concentrate, with a view to economic parameters, using their receiver operator characteristic (ROC) curves. The results showed AUC (area under the ROC curve) scores of up to 0.85 for the classification models and a maximum reward condition Fpr/Tpr around 0.5/0.9 for a simplified economic model.
Keywords
sensor-based sorting, machine learning, receiver operating characteristic
Mineral deposits are natural anomalies described by their specific physical and chemical properties. These properties directly affect the performance of mining and ore processing equipment. It is desirable to understand the relationships between the mineralization characteristics and the process used in ore dressing. Geometallurgy provides the means to identify these relationships and mathematically model the influence of these variables on the metallurgical response. According to Lechuti-Tlhalerwa, Coward, and Field (2019), ‘Geometallurgy is an interdisciplinary field aimed at describing potential ore deposits in terms that mine planners and economists can use to design and run profitable mining operations’.
Ore sorting by mechanical means is used for the preconcentration of mineral particles. Sorting could be used for various purposes, ranging from initial waste removal to downstream processing. As a unitary processing operation, ore sorters require materials with certain characteristics. Most ore sorting applications require coarse mineral grains and a low flow rate to operate properly. According to Wills and Finch (2015), ore liberation is an important restriction for this technology. The typical throughput per machine ranges from 25 t/h at 25–5 mm particle size to 300 t/h for 300–80 mm. Despite some technological pitfalls, there are numerous advantages of this technology, including significant energy and water savings (Manouchehri, 2003).
Ore sorting equipment can have different or multiple sensors for detecting physical properties (Manouchehri, 2003). A schematic of an X-ray sorting machine is shown in Figure 1. The material is initially fed according to granulometric constraints in step 1. For practical purposes, fines are commonly removed to avoid their interfering with the physical measurements made by the X-ray sensors. The ore is transported by means of a vibratory belt, forming a single layer of particles to allow readings to be acquired from every individual particle. In step 2, particles pass by X-ray sensors and are analysed based on the intensity of their X-ray transmissibility. The physical measurements of each particle are computed and analysed. According to a pre-adjusted mathematical model, the particles are accepted or rejected from the stream in the separation chamber, by a pneumatic apparatus flaps.
There are few published studies in the field of ore sorting specifically focused on ore classification. Von Ketelhodt (2009) tested the viability of optical sorting to process low-grade gold ore that had been
stockpiled for a long time. Von Ketelhodt and Bergmann (2010) employed dual-energy X-ray sensors to concentrate coal, thus reducing downstream water consumption. Dual-energy X-ray ore sorting has also been applied for the classification of rare earth elements (REEs) (Veras et al., 2020). In addition to X-ray techniques, sensors based on the near-visible spectrum have been utilized. Tusa et al. (2020) presented hyperspectral results using visible to near-infrared (VNIR) and short-wave infrared (SWIR) sensors, while Gülcan (2020) evaluated borate sorting using nearinfrared sensors.
Lessard, de Bakker, and McHugh. (2014) conducted an extensive study on the economic impact of using dual-energy X-ray transmission (DE-XRT_ ore sorting of molybdenum ore. They explored which parameters yielded the highest sensitivity for the equipment in order to achieve the best economic outcome.
Li et al. (2020) investigated the use of X-ray fluorescence (XRF) sorting on samples from a porphyry copper mine. XRF is a surface analysis technique, and this work was conducted in a wellcontrolled laboratory environment. The study correlated economic return (net smelter return, NSR) with the cut-off grade.
In this study we investigate the possibilities of modelling the data output from a DE-XRT ore sorting machine (a TOMRA PRO Secondary) for the case of a gold deposit. The output data is multivariate, which is appropriate for machine learning techniques. After training a machine learning model, another parameter (the threshold) is taken into account, which is linked to the true positive rate (the proportion of ore correctly identified by the model relative to the total ore in the data-set) and false positive rate (the proportion of gangue misidentified as ore relative to the amount of gangue in the data-set).
This parameter allows the decision-maker to choose to include more ore in the concentrate, but at the expense of also including more gangue (resulting in dilution). Optimizing this parameter is crucial for achieving the best economic benefits from the process, which aligns with one of the objectives of this paper and is related to a question raised in the literature by Lessard, de Bakker, and McHugh (2014).
A thorough understanding of the sensor variables and operation is necessary beforehand. In the context of this study, the present findings are related to dual-energy X-ray absorptiometry applied to ore from gold deposits. According to Strydom (2010), particle
classification using X-ray transmission sensors is based on the differences in the X-ray absorption of the grains. The absorption of X-rays in turn depends on the atomic numbers of the elements forming the minerals. Each particle is penetrated by X-rays and the difference between the transmitted and absorbed energy results in a contrast of brightness from the various particles. Furthermore, the attenuation of the X-ray emission depends on the grain thickness as well. The phenomenon referred to as transmission damping can be explained by X-ray transmission theory. Lambert’s law indicates that transmission damping is a function of the density and thickness of the material:

where Idet is the detected intensity, I0 is the intensity of the undisturbed beam, µ( ) is the mass absorption coefficient, ρ is the density of the solid, and d is the thickness of the irradiated material.

Lambert’s law can be applied to dual-energy absorption by transmitting high- and low-energy X-ray beams. An advantage is that the particle thickness can be determined using Lambert’s law for the high- and low-energy levels. Jong and Harbeck (2005) showed that the relationship between the detected intensities results in a constant, Cm, which depends only on the properties of the material and the chosen wavelength (Equation [2]). Common values of Cm are related to the atomic number for a specific element.: [2]

Harbeck (2004) demonstrated that different minerals can be distinguished by comparing the degree of transmission of X-rays through the particles at two different energy levels. By examining the brightness levels produced by materials for two different X-ray channels, it is possible to visually interpret a density model.
Figures 2a and 2b show the X-ray images for different channel frequencies. Different wavelengths have different transmission values through the mineral particle: high frequencies penetrate the particle less than low frequencies. Figure 2c shows a scatter plot for the two channel readings (high and low frequency) at every pixel within the X-ray image according to the intensity values of channels with high and low frequencies. Pixels below the calibration curve are considered as low-density pixels, and those above the curve as high-density. The pixels can be counted as the indicator values of high and low densities.


Figure 2—(a) High- and (b) low-energy X-ray images. Each pixel represents the X-ray transmission intensity in greyscale for the two energy levels (frequencies) in the area. (c) Each pixel is represented using the transmission in high energy as the y-value and the transmission in low energy as the corresponding x-value. The grey squares represent the readings from each pixel in (a) and (b) for the two channels. These points are scattered around the previously calibrated curve (continuous black line) for a given mineral. The decision on whether a particle is mineral or gangue is made by comparing the pixel readings from (c) to the calibrated curve
A filtering process might be needed for the data collected by the sensors, as a thick gangue particle can provide similar readings as a thick ore grain.
The data output from the sorter maps four regions: high, medium, low, and dark. To calculate density models for mineral particles, the calibration curve must be adjusted to fit a threshold limit based on several particle measurements. For example, a density curve of 60% means that 60% of the total samples from a given mineral are plotted below the curve.
According to Webb and Copsey (2011), machine learning and pattern recognition developed as an interdisciplinary subject, covering statistics, engineering, computer science, psychology, and physiology, among others. One special characteristic of machine learning modelling is dealing with multivariate problems. The present study requires that a decision must be made about each analysed particle using a multidimensional input vector of data readings representing the corresponding sample. Supervised machine learning methods are appropriate for addressing these multidimensional decision problems when prior sampled data, designated by experts as ore and gangue through hand sorting, is available.
A supervised model trained with ore/gangue designated data can be used to make decisions about whether a new, unknown sample is ore or not, and to present the degree of certainty for this prediction. Supervised algorithms could be used in two main applications: for regression and for classification. The first relates to real target values, whereas the second relates to a categorical value. For a binary output, like ore/gangue, this output is represented by (1) when a particle is ore and (0) when the particle is gangue. Ore sorting can be viewed as a traditional classification problem, since ore and gangue particles are classified into concentrate or the waste streams (Figure 3).
All classification outcomes can be summarized in the confusion matrix (Table I), which provides a comprehensive overview of
true positive, true negative, false positive, and false negative classifications.
Machine learning metrics can be applied to assess the performance of an ore sorting model. These metrics are derived from the confusion matrix, which summarizes the classification results. Equations [3] to [6] present some of the key metrics used in this assessment:

Figure 3—Separation of the feed into concentrate and waste (tailings) streams. Since the concentration process is not perfect, some waste particles could be directed to the concentrate
Table I
Confusion matrix for ore sorting products. Mineral particle in rows and downstream definition in columns. The true positive values and true negative values are considered to be the particles that are correctly directed to their desired downstream destinations. False positives and false negatives indicate incorrectly classified particles
Type


where Tp is true positive, Fp is false positive, Tn is true negative, and Fn is false negative.
In the context of ore sorting classification, terminology that aligns with machine learning concepts is not well-established in the literature. To address this gap and facilitate understanding, we propose the following definitions:
➤ Concentrate ore grade: The proportion of ore in the concentrate stream. This concept is analogous to precision metrics used in machine learning classification problems.
➤ Recovery: The metric which measures the proportion of ore particles in the training set that is sent to the concentrate. This definition is also called the true positive rate (Tpr) in machine learning classification metrics.
Proposing a mathematical model for particle recovery and the ore grade in the concentrate allows the modeller to manage specific conditions related to the equipment to achieve the desired characteristics for the process.
In assessing the performance of mathematical models for ore sorting, the receiver operator characteristic (ROC) curve serves as a crucial tool. This curve provides insights into the relationship
between false positive rate (Fpr) and true positive rate (Tpr), aiding in the evaluation of model effectiveness. The ROC curve (Figure 4) establishes, for a given trained model, a relationship between the false positive rate (Fpr, on the x-axis) and true positive rate (Tpr, on the y-axis). The area under the ROC curve (AUC score) provides a comprehensive measure of the model's performance, ranging from 0 to 1. A higher AUC score indicates better predictive accuracy.
The threshold is the parameter which controls the trade-off between the Tpr and the Fpr given a trained model. For example, for an input particle, the model predicts a 75% probability of it being ore. If the threshold chosen is 50%, the prediction will be ore. If the threshold selected is 90%, the prediction would be gangue. Changing the threshold results in a repositioning along the model, moving within the ROC curve and effectively implementing a trade-off between the amount of gangue in the concentrate and the quantity of ore sent to the reject stream. If the operator wants to value the true positive rate (when the model answers ore, it should really be ore!) the threshold must be set to a higher value, 98% for instance. In this case, the model will behave as point 1 in Figure 4c. The opposite case is when the threshold is set to 0%, returning all the predictions as ore regardless of the particle input. This case is represented by point 4 in Figure 4c. Figures 4a and 4b show the definitions of the true positive rate (Tpr, associated with the ore recovery) and false positive rate (Fpr).
Variables, preprocessing phase, and ore definition
Variables and preprocessing phase
The variables employed in the modelling will be called ‘features’. In this study a mineral sample has 17 features (Figure 5): 16 continuous numerical features related to three different density model calibration curves and a categorical feature corresponding to the origin of the sample in the orebody. The preprocessing phase comprises two stages. The first stage involves replacing the

Figure 4—Example of a ROC curve. The x-axis and y-axis are physically related to properties in the ore sorting equipment. (A) shows the recall and its physical interpretation: the ore portion in concentrate. (B) shows the false positive rate and its physical interpretation: the amount of waste in the concentrate relative to the total amount of waste in the feed. (C) Two different ROC curves: the straight line is the worst model where all predictions are realized randomly. Points 1 and 4 represent the total stream deviations respectively to the tailings and to the concentrate

Figure 5—The features used in the study comprise four numerical features contributed by each DM calibration curve, resulting in a total of 16 continuous numerical features. Additionally, the categorical feature representing the origin of the sample in the orebody is replaced by the probability of each class. As a result, each mineral sample is represented by a vector with 17 entries
numerical features corresponding to the absolute number of pixels in each 'band' with the pixel proportion in each band for each sample. For example, a sample in DM-70 with 40 pixels in high, 20 in dark, 10 in medium, and 30 in low, will be transformed into proportions (0.4, 0.2, 0.1, 0.3) respectively, given that the total number of pixels for this sample is 100.
In the second stage of preprocessing, standardization is applied to each feature and the categorical variable is replaced by the probability of each class in the data-set. Figure 5 lists the numerical features and the categorical feature used to perform the training.
Ore definition
To be classified as ore, a particle must exhibit either the target mineralogy (such as sulphides, quartz, or fine arsenopyrite) or a
(a) Sampling ore particles from distinct domains
(b) Individual analysis of each particle

Figure 6—The definition of the ore class, which is determined based on mineralogy or gold grade. This class serves as the response variable in the ore sorting classification process. Particles are classified as ore if they exhibit the target mineralogy or have gold grades above the specified cut-off value. Any particles not meeting these criteria are classified as waste
grade above the cut-off value of 0.4 ppm. Figure 6 depicts the ore class, illustrating the criteria used for classification. This indicator variable, based on the specified criteria, serves as the response variable for the supervised learning classification algorithms.
The process for calculating the indicators of high, medium, low, and dark proportions according to each density model is shown in Figure 7. The process starts by sampling different regions from the mineral deposit, so that each particle can later be individually analysed according to the X-ray measurements. The images composed of the channels of high and low energy transmitted along the particles are simulated to obtain the proportion of indicators (high, medium, and low densities) for each density model considered. The final supervised database is composed of measurements of the properties of individual rock particles, including the calculated indicators of high, medium, low, and dark proportions according to each density model.
(c) Image of x-ray from each particle for high and low energy channels
(d)
Image simulation for obtaining the proportion of indicators representing the densities in each pixel for each calibration curve

(e)
The database is composed of the proportion of density indicators for each particle according to the specific calibration curve
For each mineral particle it is possible to map the regions of high, medium, low and dark indicators according the adopted calibration curve.
Figure 7—The process of creating the database for ore particles. (a) Particles are sampled from various regions in the mineral deposit. (b) Each particle is individually coded and analysed. (c) Two images are generated based on the high and low channel frequencies from the X-rays. (d) These images are simulated using different density models. The proportions of high, medium, low, and dark pixels are then computed. (e) The final database is composed of the proportion of density indicators for each particle, according to the specific calibration curve
In this study, the labels high, low, medium, and dark correspond to density regions, while DM% represents the density model used. Additionally, a categorical variable representing the mined orebody associated with each particle was introduced. This categorical variable has six possible outcomes. To incorporate the categorical variable into the modelling process, it was encoded into a frequency-based representation. This encoding method assigns numerical values to each category based on their frequency of occurrence in the data-set.
The data acquisition, calibration, and sampling processes were carried out by the technical staff of a mining company in Brazil, as documented in studies by Magalhães et al. (2019) and Dumont, Lemos Gazire, and Robbens (2017). This study focuses on analysing the output data from the ore sorting equipment using samples from these deposits.
After training a machine learning model and obtaining the ROC curve, determination of the optimal combination of true positive rate (Tpr) and false positive rate (Fpr) for the most economical decision depends on various factors, including the value of the concentrate and associated costs. In this section we introduce an economics-based decision model.
To illustrate this decision-making scenario, we present a simple reward (benefit) function model. Unlike a loss function, which aims to be minimized, a reward function seeks to be maximized to increase profit.
Consider an amount M of material to be analysed and processed by the ore sorting equipment. The ore sorting model is already trained and the parameters chosen. The necessary parameters are presented as the general true positive rate Tpr and false positive rate Fpr
Although the sorter operates on a particle basis (not exactly mass), one can create a mathematical formulation considering mass when using the hypothesis that all particles have the same mass, which may be some statistical mean mass established from field data. This will be the case for the formulation in this section.
This mass M to be processed is divided into ore (Mo) and gangue (Mg) masses, so that M = Mo + Mg. The amount of material which is selected as ore by the model in the equipment is given by MoTpr + MgFpr and the amount discarded by MgTnr + MoFnr. The true negative rate Tnr and the false negative rate Fnr are given by:


[7]
[8]
The balance is the reward from the correctly accepted gold (MoTpr), the cost of processing all accepted (as ore) material MoTpr + MgFpr, and the total cost of processing the rejected material MgTnr + MoFnr. This simplified model is based on the benefit of the correctly predicted ore and the relative difference in costs between processing some amount of material as ore or as waste. Expressing this reward function in an equation leads to:

[9]
where B is a parameter related to the financial gain from the specific mineral (gold in this case), Cp is a parameter connected to the processing costs of the accepted material, and Cp2 is another
parameter linked to the processing costs of the rejected material. All these three parameters are in units of dollars per unit mass, e.g. US$ per ton.
Rewriting the reward expression (Equation [9]) yields:

where mo is the fraction of ore in the total mass, Mo/M, and mg is the fraction of gangue in the total mass, Mg/M. The reward function r(Tpr,Fpr) is expressed in the same units as the parameters B, Cp, and Cp2 (for example US$/t) and indicates the amount of money (US$) for an amount of material fed to the ore sorter (t).
Note that r(Tpr, Fpr) depends on two variables. A trained model will yield the relationship between these two variables, which is given by the ROC curves shown previously. When establishing a reward function for an ROC curve, the reward function will take the form r(Fpr).
Although the presented reward function model is simple and limited, it serves as a starting point for decision-making in ore sorting processes. In real mining operations, it is possible to develop a more comprehensive and specific reward function tailored to the unique characteristics of the operation.
One notable factor not accounted for in the cost model is the operational cost of the ore sorting equipment, which includes energy consumption and maintenance costs (Lessard, de Bakker, and McHugh, 2014). However, this cost was intentionally omitted from the model, as its value does not significantly depend on the choice of Tpr and Fpr
In the next step of the analysis, two additional quantities will be calculated and incorporated into the decision-making model. The first is the total mass of concentrate output from the ore sorting process given a specific Fpr. The second is the grade of the concentrate obtained at that Fpr. These additional metrics will provide valuable insights into the operational boundaries and help optimize planning for the ore sorting operation.
The total mass in concentrate is: [11]

where the total mass in the concentrate is given in relation to the mass fed to the ore sorting (M).
The ore grade in the concentrate is given by:

[12]
The question may arise as to when it would be valuable to create a figure illustrating ore mass recovery as a function of Fpr. Interestingly, such a figure has already been produced in the form of the ROC curve (Figure 14). In the ROC curve, the y-axis represents Tpr, which is equivalent to Recall in machine learning terminology. This Tpr value can be interpreted as the total amount of ore in the deposit that can be recovered at a given Fpr
The purposes illustrated in this section were produced and commented mimicking a long-term mine planning analysis. But it would be trivial to change the timeframe planning. By changing mo
and mg according to the deposit estimates in a given time period, the models do not need to be retrained if the original training set is already statistically representative of the deposit as a whole. Even the other parameters, such as Cp and Cp2, can be re-estimated for another time period. For further development of economic models using ROC curves one can refer to Ooms et al. (2010). The results of the economic criteria are presented in a later section.
Results and discussion
Training the ML algorithms, model selection phase
Seven machine learning classification algorithms were tested to build the classification model: random forest (Breiman, 2001), logistic regression (Cox, 1958), K-nearest neighbours (KNN with K = 6) (Cover and Hart, 1967), support vector machine (SVM) with radial basis function (RBF) kernel and linear kernel (Boser, Guyon, and Vapnik, 1995), Gaussian naive Bayes (Duda and Hart, 2001), and AdaBoost (Freund and Schapire, 1996).
The data-set was divided into two parts: 1160 records (approximately 70%) were used in the model selection phase, and the remaining 498 records were held back for evaluating the best-selected model. During the model selection phase, a stratified K-fold cross-validation approach with K = 5 was employed. The evaluation metric used was the AUC score (area under the ROC curve). The results are presented in Figure 8.
Among the tested algorithms, random forest achieved the highest AUC score of 0.798, followed closely by SVM with RBF kernel (0.794) and KNN with K = 6 (0.791). On the other hand, logistic regression, Gaussian naive Bayes, and SVM with linear kernel exhibited poorer performances. All models were initialized with standard parameters from the Scikit-Learn implementations.
Figure 9 displays the ROC curves for all selected machinelearning models. To provide context, a straight line representing random predictions is plotted as a reference. The ROC curve is a valuable measure that assesses the overall quality of a given model across all possible values of Fpr and Tpr. For each trained model, varying the threshold (as discussed previously) results in different Fpr/Tpr values. By visually comparing the ROC curves, different models can be assessed and compared. The AUC scores, presented in Figures 9 and 10, represent the area under each ROC curve. The AUC score condenses the model's performance into a single value, facilitating comparative analysis. Comparison of the AUC scores and visual inspection of the ROC curves shows that the random forest is the model with the best performance.
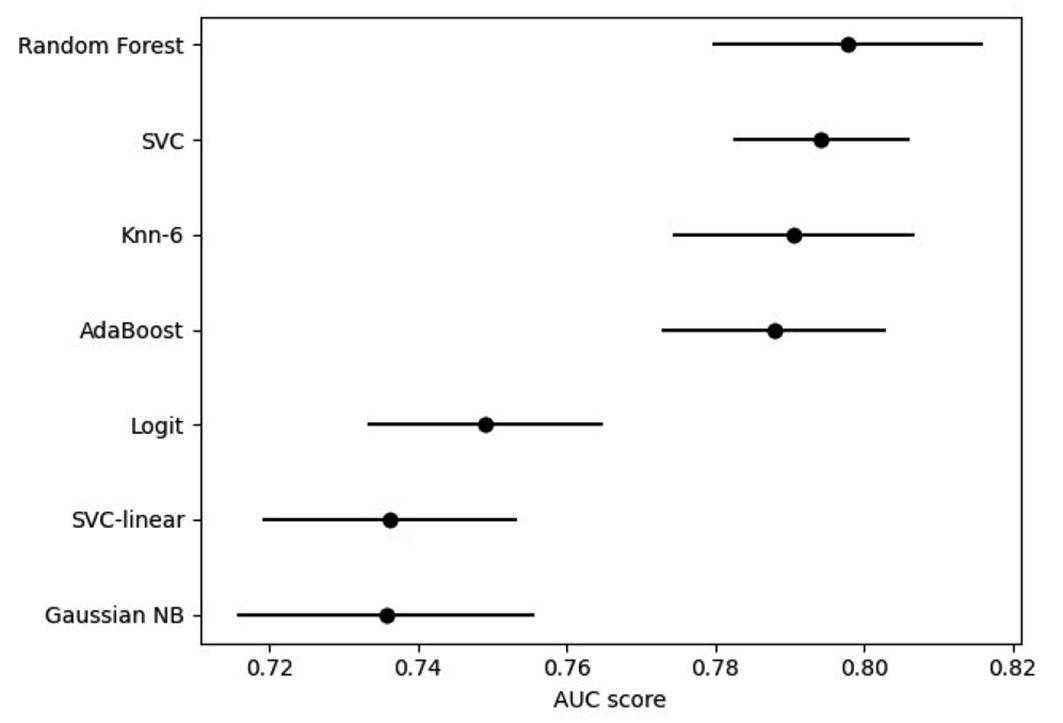
Assessment of performance with evaluation data
After selecting the model, it is crucial to verify its performance using the evaluation data-set to ensure its ability to generalize to new, unseen records. The results presented in Figure 10 indicate an AUC score of 0.783 for the selected random forest model. It is important to note that using the evaluation set to select the best-performing model among previous candidates can lead to overfitting. Overfitting occurs when the model performs exceptionally well on the evaluation set but fails to generalize to new data. This phenomenon, also known as second-order overfitting (Reunanen, 2012), emphasizes the importance of robust evaluation procedures to avoid misleading conclusions.
Results of the economic model
In the economics-based model, the parameters outlined in Table II were utilized. To cover a range of classification methods, several techniques were explored, including random forest, decision trees (Quinlan, 1986), linear discriminant analysis (Fisher, 1936), Gaussian naive Bayes, K-nearest neighbours, logistic regression, neural networks (McCulloch and Pitts, 1943; Bishop, 2006), and support vector classifier.

Figure 9—Receiver operating characteristic (ROC) curves for all supervised machine-learning algorithms utilized in the model selection phase. Among the algorithms tested, random forest achieved the highest area under the curve (AUC) score, with a value of 0.793

10—Result for the random forest model using the previously unseen evaluation
Table II
Parameters used for the economic model
Parameter Value Observations
mo 1.0 × 10⁻⁶ 1 ppm
mg 9.99999 × 10⁻¹ mg = 1 − mo
B 60 000 US$/kg market price
Cp 10 US$/t
Cp2 1 US$/t

Figure 11—Comparison of the rewards r(Fpr) for all trained models. The maxima of each curve are marked with a vertical dashed line. The highest reward is from the RF model at Fpr = 0.75 and r(0.75) = 51.6 US$/t
Figure 11 compares the reward functions for all trained models using B = 6 × 10⁶ referenced in Table II. The best reward is from the RF model, when Fpr = 0.75 and r(0.75) = 51.6 US$/t. It shows good general performance in discriminating ore and waste, which can be seen as the r(Fpr) curve for RF is overall above the others (the AUC scores in Figure 14 also show the same pattern). This offers the decision-maker other strategies for using the reward r(Fpr). For example, the point in the RF reward curve at Fpr = 0.47 and r(0.47) = 50.8 yields almost the same reward as the maximum (51.6), but with a significantly lower value of Fpr = 0.47, which can lead to a compelling cut in costs not taken into account in the economic model. So, the reward curves must be seen as a tool to help in a decision, and not an automatic method to extract the maxima.
Another outcome from Figure 11 is the importance of a welltrained model. A poorly calibrated model embedded in the ore sorting decision can lead to a significantly lower profit, from 30% to 10% less, depending on Fpr
Figure 12 shows the total mass in the concentrate relative to the mass M fed into the ore sorter. The curves for all models are collapsed to a visually straight line due to the low proportion of ore in the mass fed (1 ppm). In this case, Equation [13] is dominated by the term MgFpr, which is a first degree monomial considering the variable Fpr. For an increasing value of mo the curves will take another geometrical form.
The relationship shown in Figure 12 is a convenient method to establish boundaries on Fpr for the desired effect. For example, if the operator wants to reduce the mass in the concentrate (by being more selective), then the initial value for Fpr can be estimated using this graph.

12—Total mass present in concentrate relative to the mass M fed to the sorter. The curves appear to be linear due to the small value of mo, given the definition of the mass in concentrate moTpr + mgFpr
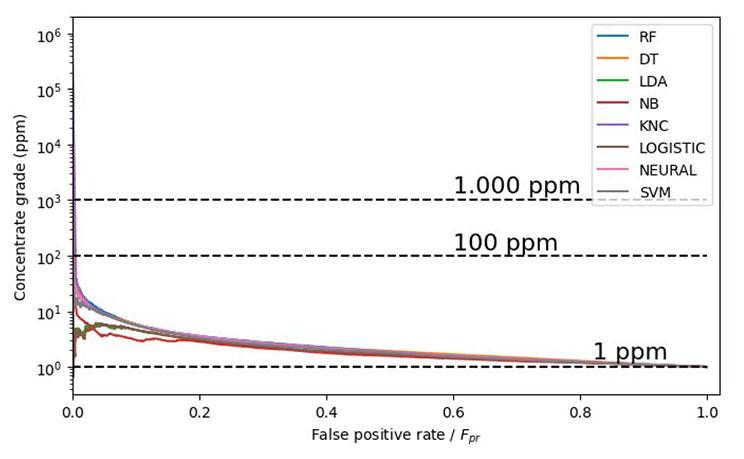
Figure 13—Concentrate grade vs Fpr. When Fpr → 0, the grade tends to 1, i.e., the concentrate is almost exclusively ore. When Fpr → 1 the concentrate grade approaches mo. Horizontal dashed lines mark grades at 1000 ppm, 100 ppm, and 1 ppm
Figure 13 shows the variation in concentrate grade for different values of Fpr. At the lowest values of Fpr the concentrate grade is approximately 1. However, in this case the concentrate mass is near zero (Figure 12). When Fpr approaches 1 the concentrate grade tends to the ore grade of M, which is mo (1 ppm). As stated before, when Fpr = 1 all the material goes to the concentrate.
To illustrate the application of the findings from Figures 9, 12, and 13, consider a scenario where the false positive rate (Fpr) is set to 0.5 and the random forest (RF) model is employed. According to the ROC curve (Figure 9), with an Fpr of 0.5, approximately 94% of the ore will be recovered from the total mass (M) fed into the ore sorting process. Referring to the total mass curve in Figure 12, the total mass of concentrate obtained will be approximately half of the mass (M) fed into the sorting process. Finally, using the concentrate grade curve in Figure 13, at an Fpr of 0.5, the average grade of the concentrate will be approximately 1.8 ppm. This demonstrates how the information from Figures 9, 12, and 13 can be integrated to inform decision-making, allowing operators to assess and optimize ore recovery, concentrate mass, and concentrate grade based on their specific objectives and constraints.
The introduction of innovative ore-sorting equipment presents a promising opportunity for the mining industry, offering the potential to enhance mineral recovery while reducing operational
costs. Central to this improvement is the adaptive adjustment of the sensor decision model within the equipment. In this paper we have shown how multivariate models, particularly in the context of machine learning, can leverage the rich output variables from ore sorting to optimize model parameters, taking economic considerations into account.
By employing a simple profit-cost model, derived from the receiver operator characteristic (ROC) curve of a machine learning model, economic aspects are quantified to inform decisionmaking. Additionally, methodologies for modelling ore recovery, concentrate mass, and ore grade in the concentrate are provided. These resources serve as valuable tools to guide decision-makers, facilitating informed choices rather than automated decisions.
The multivariate modelling phase utilizes data output from the ore sorting equipment, albeit without capturing the full richness of dual-energy X-ray data for each pixel. This presents an opportunity for further enhancement, as leveraging raw dual-energy X-ray data could potentially improve modelling accuracy. Such improvements can be seamlessly integrated into the existing work flow outlined in this paper, allowing for economic-based decisions based on updated ROC curves.
To maximize the potential of this approach, it is recommended that ore sorting equipment manufacturers consider implementing interfaces capable of accepting models trained in high-level programming languages such as Python. This would enable seamless integration of advanced modelling techniques into the ore sorting process, further enhancing its efficiency and effectiveness.
Acknowledgements
This research was supported by Coordenação de Aperfeiçoamento de Pessoal de Nível Superior – Capes, AngloGold Ashanti Brazil and Fundação Luiz Englert.
Conflict of interest
The authors declare that they have no conflict of interest.
Author statement
D.A.D.: Conceptualization, methodology, software, investigation, writing; A.L.R.: Methodology, software, investigation, writing, validation, visualization
J.F.C.L.C.: Validation, resources, supervision, funding acquisition; F.G.F.N.: Writing, validation, visualization
M.L.G.: Project administration, validation, supervision.
References
Bishop, C.M. 2006. Pattern Recognition and Machine Learning. Springer.
Breiman, L. 2001. Random forests. Machine Learning, vol. 45, no. 1, pp. 5–32. https://doi.org/10.1023/A:1010933404324
Boser, B.E., Guyon, I.M., and Vapnik, V.N. 1992. A training algorithm for optimal margin classifiers. Proceedings of the Fifth Conference on Computational Learning Theory. Haussler, D. (ed.). Association of Computing Machinery Press, New York. pp. 144–152.
Cox, D. 1958. The regression analysis of binary sequences. Journal of the Royal Statistical Society: Series B (Methodological), vol. 20, no. 2, pp. 215–232.
Cover, T, and Hart, P. 1967. Nearest neighbor pattern classification. IEEE Transactions on Information Theory, vol. 13, no. 1, pp. 21–27. https://doi.org/10.1109/TIT.1967.1053964
Dumont, J.-A., Lemos Gazire, M., and Robben, C. 2017. Sensorbased ore sorting methodology investigation applied to gold ores. Proceedings of Procemin Geomet 2017. Gecamin, Santiago, Chile.
Duda, R.O., Hart, P.E., and Stork, D.G. 2001. Pattern Classification. (2nd edn). Wiley-Interscience.
Fisher, R.A. 1936. The use of multiple measurements in taxonomic problems. Annals of Eugenics, vol. 7, no. 2, pp. 179-188.
Freund, Y. and Schapire, R.E. 1996. Experiments with a new boosting algorithm. ICML ’96: Proceedings of the Thirteenth International Conference on Machine Learning, Bari, Italy. Morgan Kaufmann, San Francisco, CA. pp. 148–156.
Gülcan, E. 2020. A novel approach for sensor-based sorting performance determination. Minerals Engineering, vol. 146. 106130. https://doi.org/10.1016/j.mineng.2019.106130
Harbeck, H. 2004. Classification of minerals with the use of X-ray transmission. Proceedings of Kolloquim Sensorgestützte Sortierung, Clausthal-Zellerfeld.
Jong, T.P.R. and Harbeck, H. 2005. Automated sorting of minerals: Current status and future outlook. Proceedings. of the 37th Canadian Mineral Processors Conference. CIM, Montreal. pp. 629–648.
Lechuti-Tlhalerwa, R., Coward, S., and Field, M. 2019. Embracing step-changes in geoscientific information for effective implementation of geometallurgy. Journal of the Southern African Institute of Mining and Metallurgy, vol. 119, no. 4. https://doi.org/10.17159/2411-9717/588/2019
Lessard, J., de Bakker, J., and McHugh, L. 2014. Development of ore sorting and its impact on mineral processing economics. Minerals Engineering, vol. 65, pp. 88–97. https://doi. org/10.1016/j.mineng.2014.05.019
Li, G., Klein, B., Sun, C., and Kou, J. 2020. Applying receiveroperating-characteristic (ROC) to bulk ore sorting using XRF. Minerals Engineering, vol. 146, 106117. https://doi.org/10.1016/j. mineng.2019.106117
Magalhães, M.F., Lemos, M.G., Moreira, V.A., and Pereira, M.S. 2019. O uso de tecnologia ore sorting para aumento em recuperação de Au em minério de transição [The use of ore sorting technology for increased Au recovery in transition ore]. Proceedings of XXVIII ENTMME. pp. 1–8. http://www. entmme2019.entmme.org/trabalhos/180.pdf
Manouchehri, H.-R. 2003. Sorting: Possibilities, limitations and future. Proceedings of Konferens i Mineralteknik. Föreningen Mineralteknisk Forskning, Stockholm. pp. 1–2.
McCulloch, W.S. and Pitts, W. 1943. A logical calculus of the ideas immanent in nervous activity. Bulletin of Mathematical Biophysics, vol. 5, no. 4, pp. 115–133.
Ooms, D., Palm, R., Leemans, V., and Destain, M.-F. 2010. A sorting optimization curve with quality and yield requirements. Pattern Recognition Letters, vol. 31, no. 9, pp. 983–990. https://doi. org/10.1016/j.patrec.2009.12.015
Quinlan, R. 1986. Induction of decision trees. Machine Learning, vol. 1, no. 1, pp. 81-106.
Reunanen, J. 2012. Overfitting in feature selection: Pitfalls and solutions. Doctoral thesis, Aalto University School of Science, Espoo, Finland. http://lib.tkk.fi/Diss/2012/isbn9789526045160/ isbn9789526045160.pdf
Models for analysing the economic impact of ore sorting, using ROC curves
Strydom, H. 2010. The application of dual energy X-ray transmissions sorting to the separation of coal from torbanite. Master’s thesis, Faculty of Engineering and the Built Environment, University of the Witwatersrand. http://hdl. handle.net/10539/9804
Tusa, L., Kern, M., Khodadadzadeh, M., Blannin, R., Gloaguen, R., and Gutzmer, J. 2020. Evaluating the performance of hyperspectral short-wave infrared sensors for the pre-sorting of complex ores using machine learning methods. Minerals Engineering, vol. 146, 106150. https://doi.org/10.1016/j. mineng.2019.106150
Veras, M.M., Young, A.S., Born, C.R., Szewczuk, A., Bastos Neto, A.C., Petter, C.O., and Sampaio, C.H. 2020. Affinity of dual energy X-ray transmission sensors on minerals bearing heavy
rare earth elements. Minerals Engineering, vol. 147, 106151. https://doi.org/10.1016/j.mineng.2019.106151
Von Ketelhodt, L. 2009. Viability of optical sorting of gold waste rock dumps. Proceedings of World Gold Conference 2009. World Gold Council, London. pp. 271–278.
Von Ketelhodt, L. and Bergmann, C. 2010. Dual energy X-ray transmission sorting of coal. Journal of the Southern African Institute of Mining and Metallurgy, vol. 110, no. 7, pp. 371–378.

Webb, A.R. and Copsey, K.D. 2011. Statistical Pattern Recognition. Wiley. https://doi.org/10.1002/9781119952954
Wills, B.A. and Finch, J. 2015. Wills’ Mineral Processing Technology: An Introduction to the Practical Aspects of Ore Treatment and Mineral Recovery. Butterworth-Heinemann. u


VENUE: ELECTRA MINING NASREC, JOHANNESBURG
The Southern African Institute of Mining and Metallurgy (SAIMM) Mine Planning colloquiums have consistently highlighted deficiencies in mine planning skills over the years. The colloquium held in 2012, 2014, 2017 and 2019 all emphasized the need for developing skill-sets with various mine planning tools within the context of multiple mining methods.
Newer tools and skills for the future of mining discussed in the 2019 colloquium suggests an acknowledgment of the evolving nature of the industry. This likely includes advancements in technology, such as automation, artificial intelligence, and data analytics, which are increasingly becoming integral to modern mine planning and operations.
Camielah Jardine, Head of Conferences and Events
FOR FURTHER INFORMATION, CONTACT: E-mail: camielah@saimm.co.za Tel: +27 011 538 0237 Web: www.saimm.co.za
ECSA Validated CPD Activity, Credits = 0.1 points per hour attended.
Submit an abstract to be considered as presentations only at the colloquium.
Prospective presenters are invited to submit titles and abstracts of their presentations in English.
Only in-person presentations will be considered for this colloquium.
Abstracts should be no longer than 500 words and should be submitted to: Camielah Jardine, Head of Conferencing and Events, E-mail: camielah@saimm.co.za
The complete Proceedings volume will be made available on the internet for public access after the colloquium.
1 May 2024 - Submission of Abstracts
1 August 2024 - Submission of Presentation
No marketing presentations will be considered. All presentations must include case studies of actual work implementation.
Affiliation:
1Department of Metallurgical and Mining Engineering, Universidad Catolica del Norte, Antofagasta, Chile
2DIATI, Politecnico di Torino, Torino, Italy
3Universidad Técnica Federico Santa María
Correspondence to: T. Marin
Email: tatiane.marin@gmail.com
Dates:
Received: 22 May 2023
Revised: 19 Feb. 2024
Accepted: 28 Mar. 2024
Published: July 2024
How to cite:
Seccatore, J.E., Cardu, M., and Marin, T. 2024. Influence of blasting charge distribution on the energy required for comminution of rock.
Journal of the Southern African Institute of Mining and Metallurgy, vol. 124, no. 7. pp. 407–414
DOI ID:
http://dx.doi.org/10.17159/24119717/2820/2024
ORCID:
J.E. Seccatore
http://orcid.org/0000-0003-4619-1124
by J.E. Seccatore1, M. Cardu2, and T. Marin3
Abstract
The most energy-intensive process in the mining industry is particle size reduction – comminution. The first phase of this process is blasting to fragment the rock from the initial Boussinesq’s halfspace size. Scientific literature demonstrates that the output of a blast in terms of fragment size distribution can be manipulated by varying the specific charge (powder factor) and charge distribution. This study focuses on the influence of blasting on the internal resistance of the blasted fragments; in particular the influence of the spatial distribution of charges. Small-scale blasts were performed on 14 marble blocks using different powder factors and charge distributions. Three control blocks were fragmented by mechanical means for comparison. The results show the correlations between charge distributions and the specific energy of mechanical comminution. Opportunities for adjusting charge diameter and distribution in opencast blasts to improve the performancet of comminution circuits are discussed.
Keywords blasting, powder factor, fragmentation, comminution
Introduction
This study addresses the pre-conditioning of rock for comminution by blasting, and how different spatial distributions of the blasting charges affect fragmentation for the same specific charge. When explosive charges detonate, they produce two effects:
1. They fragment the rock at a macroscopic scale: this is measurable by means of image analysis or sieving.
2. They weaken the rock at a microscopic scale: the result is a system of microfractures within the grains in the blasted fragments, detectable only by microscope analysis. Nevertheless, the presence and extension of these microfractures can be measured by analysing the grindability, e.g. by establishing the Work Index (WI) in a ball mill.
Rock fragmentation at the macroscopic scale as been widely studied and published (Mackenzie, 1967; Clerici et al., 1974; Scott, 1996l Bozic, 1998; Sastry and Chandar, 2004; Morin and Ficarazzo, 2006; Mansfield and Schoeman, 2010; Seccatore et al., 2011; Cardu, Dompieri, and Seccatore., 2012; Dompieri et al., 2012). Results from existing models for predicting the fragment size distribution of the blasted muckpile correlate well with size analyses by sieving. To mention a few, the KUZ-RAM (Cunningham 1983, 2005), the SWEBREC (Ouctherlony et al., 2006), among other studies (Ryu et al., 2009). Recently, the concept of the fragmentation-energy fan was introduced (Ouchterlony, Sanchidrián, and Moser, 2017), where percentiles of the particle size distribution (fragmentation) and the specific charges (energy), when plotted on a log-log graph, fit well in a fan fashion where straight lines tend to converge to a focal point (fan).
Studies on the effects of blast-induced microfractures on grindability are not so common. Nielsen and Kristiansen (1996) pioneered research on this topic: by means of microscopic analysis and laboratory tests they showed that increasing the powder factor (PF) significantly reduces the Bond Work Index (WI: Bond, 1961) due to the presence of microfractures in the material. Seccatore (2019) reviewed the beneficial effects on comminution efficiency. The results of laboratory-scale blasting tests are shown in Figure 1. Table I shows the results obtained by various investigators at the industrial scale.
Katsabanis et al., (2004) performed small-scale tests by charging different configurations and then determined the WI in a ball mill. Their observations led to the conclusion that, in the granites they employed as research material, the effect of the explosive decreases at smaller particle sizes, and that it is not possible to induce microfracturing at a scale smaller than that the mineral grains. From what was previously reviewed, it is evident that the effects of microcracking depend strongly on the lithotype. In the present

work we aim to investigate empirically the influence of different geometrical distributions of the charge on the grindability of the blasted material.
Materials and methods
The research was conducted at the experimental mine of the Research Center for Responsible Mining of the University of São Paulo. The lithology consists of white dolomitic marble with
Table I
a medium to coarse grain size. The blocks for the blasting tests were collected from a single area of the mine. The geomechanical characterization included the tests reported in Table II. Five tests of each type were performed on each sample.
The linear relationship between UCS and IS is 15.5 for the coarse-grained marble and 26 for the medium-grained marble. For both materials the best equation for correlating R and UCS appears to be the one proposed by Kidybinski (1980): UCS = 0.447 exp [0.045 (R + 3.5) + γ].
Blasting tests
Small-scale blasts were performed on 14 marble blocks using different PFs and charge distributions. For every PF, the charges were designed to simulate concentrated and distributed geometries. In particular:
➤ Holes 6 mm in diameter and 60 mm deep were drilled in the blocks.
➤ Each hole was charged with a strand of detonating cord with a linear charge of 10 g/m, yielding a 6 g charge per hole.
➤ Each block was assigned a theoretical PF (PFth). Adjusting the number of holes per block resulted in a PF (PFreal) as close as possible to PFth, i.e. the design PF). Adjusting the geometry of the holes allowed us to simulate different charge distributions.
Two charge distributions were simulated:
Selected studies showing the effects of increased blasting energy on comminution
Blasting practice
Shift from spherical charge to column charge
Drill and blast costs increased by 400%
PF+240%, Specific priming (delays/t) +400%
PF +40% (D&B costs +40%)
PF +42%
PF +25%
PF +33%
P.F. + 65%
Table II
Effects on comminution
WI –10% Granite
Comminution costs –40%, Total production costs –36%
Stops at primary crusher –9%, Electricity consumption at primary crusher –27%–
[20]
Marble Small-scale + simulation [21]
Total production costs –3–4% Marble Full-scale + simulation [22]
Mill throughput +6%, Grinding costs -19% Gold ore
Excavator productivity +14%
Crusher throughput +30%
Grinding throughput +10% Uncited
Mill energy -10%
Comminution energy at SAG
mill -29%, total greenhouse emissions -20%
SAG mill throughput + 14%
Geomechanical properties of marble test specimens
IS: Point load index. R: Schmidt’s hammer rebound
[23]
[24]
[25]
[26]
[26]
• Concentrated charges simulating opencast blasts with large-diameter holes, with large burdens and spacings. An example is shown in Figure 2.
• Distributed charges simulating bench blasts with smalldiameter holes and reduced burden and spacing. An example is shown in Figure 3.
Three control blocks were fragmented mechanically (by hand using a sledgehammer) for comparison of the results. The test blocks and charging characteristics are listed in Table III. All test blasts were conducted on a field to ensure safety.

The blasted material was analysed in two ways:
➤ Sieving tests, to evaluate macrofracturing (i.e. the particle size distribution)
➤ Work Index tests in a Bond ball mill, to evaluate microfracturing by establishing the grinding energy.
The material from each blasted block was first separated in a vibrating sieve column in a dry state. Material from blocks 2, 6, 15, and 16 was sent directly to comminution without sieving due to operational issues in the laboratory.

Results
Sieving results are reported in Figure 4 for blocks simulating concentrated charges and Figure 5 for blocks simulating distributed charges.
Concentrated charges led to a particle size distribution closer to the ‘dust-and-boulders behaviour’, as expected. Distributed charges led to a more uniform particle size distribution, especially as shown by the particle size curves for higher PFs. Figure 6 shows the variation of the passing diameters P80, P50, and P20 with increasing PFreal.
Distributed charges led to a steeper reduction in size for all the passing diameters. The high value of P80 and the increasing value of P20 for PFth = 0.8 kg/m3 with concentrated charges can be seen as another indication of the ‘dust-and-boulders behaviour’. The results for PFth = 0.7 kg/m3 are outliers for all the distributions, both for concentrated and for distributed charges, being systematically higher.
After sieving, the material from every block (both blasted and fragmented mechanically) was crushed in three stages to obtain 100% passing 6#, then fed to the ball mill for the determination of
the WI (Bond, 1961). Figure 7 shows the results and the correlation between WI and PF for concentrated and distributed charges. It is evident that material blasted with distributed charges presents a steeper decrease of WI. This is in accordance with the steeper decrease of particle size seen in Figure 6. Again, as for the particle size analysis, material blasted with PFth = 0.7 kg/m3 stands out as an outlier. No valid explanation could be found for this behaviour, neither for theoretical reasons nor by looking at the execution of the experiments. A hypothesis is that the metamorphic nature of the marble at the experimental mine (see Figure 8) gave rise to a varying lithology, invisible to the naked eye. Samples collected within a few metres of each other might have different lithological characteristics (crystal shape and size, mineralogical composition).
Discussion
The results of this research confirm the general conclusions of previous work (Nielsen and Kristiansen, 1996;, Workman and Elloranta, 2003; Katsabanis et al., 2004, 2008; Elloranta, 2000, 2009): that increasing the specific charge increases the grindability of the


6—Variation of particle size with increasing blasting energy (powder factor) for different percentages passing (a) P80, (b) P50, (c) P20

7—Variation of WI with increasing PF for distributed and concentrated charges. Continuous line: trend for distributed charges; dashed line: trend for concentrated charges. The two outliers were omitted from the regression calculations


blasted material. This research went further and investigated not only the amount of explosive used, but also the influence of the geometrical distribution of the charges.
By creating macro- and microfractures- in the blasted naterial, small charges distributed as uniformly as possible yield better results than large charges concentrated in few areas. The advantages of distributing the charges in the rock are:
➤ The particle size is reduced more significantly with increasing PF
➤ The WI diminishes with a steeper curve with increasing PF.
Both these effects reduce the total energy required to grind the blasted material to the desired particle size. This can be seen by plotting a simulation of Bond's law of total comminution energy (Figure 9). We simulated Bond's law (Equation [1] using the specific WI and the feeding size (F80) corresponding to each charge as obtained during this research. The product size (P80) was deliberately chosen as 2 mm merely for the sake of the simulation. Results are shown in Figure 9. [1]

The graphs show that at very low specific charges, concentrated charges are more favourable for comminution, but at realistic levels of PF for metalliferous and non-metalliferous mines (above 0.5 kg/m3) distributed charge make better use of the energy of the explosive.
Small charges well distributed transmit the explosive energy more uniformly to the rock, leading to better fragmentation and a higher density of microfractures. From an operational point of view, it appears that achieving the PF with small hole diameters and a denser drilling mesh leads to significant benefits for energy consumption during comminution.
Further research is required to address other important issues. Future work is planned to investigate the following aspects.
➤ The influence of the lithotype. As said, the geology of the experimental mine is highly metamorphic, and material with different lithological characteristics is encountered within the same macro-scale environment.
➤ The influence of timing between the holes. The present work employed exclusively simultaneous charges.
➤ The influence of the characteristics of the explosive. Explosives other than PETN will be tested. The VOD of the explosive, in particular, is expected to influence the results.
➤ The scale effect. Full-scale test blasts will be performed. The influence of discontinuities in the rock mass, especially in a metamorphic environment, must be thoroughly investigated. The scale effect will also be applied to the grinding process: energy consumption will be analysed both in the laboratory and in full-scale tests at the processing plant.
Conclusions
The influence of the geometrical distribution of explosive charges on comminution energy was investigated by means of small-scale blasts on marble blocks using different specific charges and charge distributions to simulate both opencast blasts (large-diameter holes, with large burdens and spacings) and bench blasts (small-diameter holes and reduced burden and spacing). The blasted material was analysed in terms of the particle size distribution and the WI. The results obtained are preliminary, but suggest the following.
➤ Concentrated charges result in a particle size distribution closer to the ‘dust-and-boulders behaviour’. Distributed charges lyield a more uniform particle size distribution.
➤ With increasing specific charge, distributed charges result in a greater reduction in particle size than concentrated charges.
➤ Material blasted with distributed charges presents a steeper decrease of WI with increasing specific charge.
Small charges with a distributed geometry transmit the explosive energy more uniformly to the rock, leading to better fragmentation and increased generation of microfractures. This reduces the total energy required to grind the blasted material to the desired particle size. These results suggest that for any given powder factor, reducing the drilling diameter and increasing the drilling density will benefit the comminution process.
Funding
This research was funded by CNPq (Conselho Nacional de Desenvolvimento Científico e Tecnológico) via the grant ‘Special Visiting Researcher Fellowship’ no. 400417/2014-6. ANID (Chilean National Agency for Research and Development) financed this project via the grants FONDECYT 3190485 and FONDECYT 11200114.
Acknowledgments
Flavia Okamoto and Eduardo Pimenta helped with the geomechanical characterization. Jairo Romero Huert and Gustavo Sadao assisted with laboratory work. Many thanks to Sociedade Extrativa Dolomia Ltda. for upport in the Experimental Mine Project: we were helped during the experiments by Fabio Galvão, Lucas Finoti, and Alvaro Rezende. Emeritus Professor Jorge Bettencourt, from the University of São Paulo directed the geological characterization.
Conflicts of interest
The authors declare no conflict of interest.
References
Baranov, E.G. and Tangaev, I.A. 1988. Energy principles for analysis and optimization of mining and ore preparation processes, [Translated from] Fiziko-Tekhnicheskie Problemy Razrabotki Poeleznykh Iskopaemykh, no. 4, pp. 44–57.
Bond, F.C. 1961. Crushing and grinding calculations. A review of Attrition and Attrition Test Methods. Bemrose, C.R. and Bridgwater, J. Powder Technology, no. 49, pp. 97–126.
Božic, B. 1998. Control of fragmentation by blasting. Rudarskogeoloiko-nafini zbornik, Zagreb, vol. 10, p 49–57.
Cardu, M., Dompieri, M., and Seccatore, J. 2012. Complexity analysis of blast-induced vibrations in underground mining: A case study. International Journal of Mining Science and Technology, vol. 22, no. 1, pp. 125–132.
Clerici, C. et al. 1974. Blasting operations in quarry. Mutual influence between blasting and fragmentation. Proceedings of the Congress on Ornamental Stones and Industrial Minerals Mining, vol. 1. Politecnico di Torino.
Cremonese, D.T., Seccatore, J., Passos, A., Marin, T., and de Tomi, G. 2016. Blasting and comminution choices for the management of the mining business. Proceedings of the 42nd Annual Conference on Explosives and Blasting Technique, Las Vegas, NV, 31 January - 3 February 2016. International Society of Explosives Engineers, Cleveland, OH.
Cunnnigham, C.V.B. 1983. The Kuz-Ram model for prediction of fragmentation from blasting. Proceedings of the 1st International Symposium on Rock Fragmentation by Blasting, Lulea University of Technology, Lulea, Sweden, 22–26 August, pp. 439–453.
Cunnnigham, C.V.B. 2005. The Kuz-Ram fragmentation model –20 years on. Brighton Conference Proceedings, 2005. Holmberg, R. et al. (eds). European Federation of Explosives Engineers. pp. 201–210.
Dompieri, M., Seccatore, J., de Tomi, G., and Nader, B. 2012. An innovative approach to mine blast fragmentation management using complexity analysis: Three case studies. IPMM 2012. Proceedings of the 7th International Conference on Intelligent Processing and Manufacturing of Material, Foz do Iguaçu, Brazil, 2-3 September 2012.
https://www.researchgate.net/profile/Jacopo-Seccatore/ publication/269376431_An_Innovative_Approach_ to_Mine_Blast_Fragmentation_Management_ Using_Complexity_Analysis_Three_Case_Studies/ links/55cdea4808aee19936f88db0/An-Innovative-Approach-toMine-Blast-Fragmentation-Management-Using-ComplexityAnalysis-Three-Case-Studies.pdf
Dragano, M.A., Seccatore, J., Cardu, M., Marin, T., and Bettencourt, J. 2019. Influence of blasting charges and delays on the energy consumption of mechanical crushing. Revista Escola de Minas, vol. 72, no. 2, pp. 345–352.
Eloranta, J. 2001. Improve milling through better powder distribution. Proceeedings of the 28th Annual Conference on Explosives and Blasting Technique. Nashville, TN, 28-31 January 2001.
https://www.elorantaassoc.com/download/Papers/E&A_ Improve_Milling_Through_Better_Powder_Distribution.pdf
Fuerstenau, M.C., Chi, G., and Bradt, R.C. 1995. Optimization of energy utilization and production costs in mining and ore preparation. Proceedings of the XIX International Mineral Processing Congress, San Francisco, CA. Society for Mining, Metallurgy & Exploration, Littleton, CO. pp. 161–164.
Joon Kim, S. 2010. An experimental investigation of the effect of blasting on the impact breakage of rocks. MSc thesis. Queen’s University, Kingston, Ontario, Canada
Kanchibotla, S.S. 2000. Mine to mill blasting to maximize the profitability of mineral industry operations. Proceeedings of the 27th Annual Conference on Explosives and Blasting Technique. International Society of Explosives Engineers, Cleveland, OH. pp. 349–359
Kanchibotla, S.S. and Valery, W. 2010. Mine to mill process integration and optimisation – benefits and challenges. Proceeedings of the 36th Annual Conference on Explosives and Blasting Technique, Orlando, FL 7-10 February 2010. International Society of Explosives Engineers, Cleveland, OH.
Katsabanis , P.D., Kelebek, S., Pelley, C., and Pollanen, M. 2004. Blasting effects on the grindability of rocks. Proceedings of the 30th Annual Conference on Explosives and Blasting Technique, New Orleans. International Society of Explosives Engineers, Cleveland, OH.
Katsabanis, P.D., Kim, S., Tawadrous, A., and Sigler, J. 2008. Effect of powder factor and timing on the impact breakage of rocks. Proceedings of the 34th Annual Conference on Explosives and Blasting Technique, Nashville, TN. International Society of Explosives Engineers, Cleveland, OH.
Mackenzie, A.S. 1967. Optimum blasting. Proceedings of the 28th Annual Minnesota Mining Symposium, Duluth, MN. University of Minnesota. pp. 181-188.
Mansfield, S. and Schoeman, J.L 2010. Blasting solutions for rapid mine expansion. Proceedings of the 36th Annual Conference Annual Conference on Explosives and Blasting Technique, Orlando, FL, 7–10 February 2010. International Society of Explosives Engineers, Cleveland, OH.
Morin, M.A. and Ficarrazzo, F. 2006. Monte Carlo simulation as a tool to predict blasting fragmentation based on the Kuz–Ram model. Computers & Geosciences, no. 32, pp. 352–359
Nielsen K. and Kristianen, J. 1996. Blasting-crushing-grinding: Optimisation of an integrated comminution system. Rock Fragmentation by Blasting. Mohanty, B. (ed.). CRC Press, London.
Ouchterlony, F., Olsson, M., Nyberg, U., Andersson, P., and Gustavsson L. 2006. Constructing the fragment size distribution of a bench blasting round, using the new Swebrec function. Rock Fragmentation by Blasting. Mohanty, B. (ed.). CRC Press, London. pp. 332–344.
Ouchterlony, F., Sanchidrián, J.A., and Moser, P. 2017. Percentile fragment size predictions for blasted rock and the fragmentation–energy fan. Rock Mechanics and Rock Engineering, vol. 50, pp. 751–779. https://doi.org/10.1007/s00603-016-1094-x
Ryu, D.W., Shim, H.J., Han, CY., and Ahn, S.M. 2009. Prediction of rock fragmentation and design of blasting pattern based on 3-D spatial distribution of rock factor. International Journal of Rock Mechanics and Mining Sciences, vol. 46, no. 2, pp. 326–332.
Sastry, V. and Chandar, K. 2004. Influence of the initiation system on blast results: Case studies. Fragblast, no. 8, pp. 207–220.
Scott, A. (ed.). 1996 Open pit blast design: Analysis and optimization. Julius Kruttschnitt Mineral Research Centre (JKMRC), University of Queensland, Brisbane. 338 pp.
Seccatore, J. 2019. A review of the benefits for comminution circuits offered by rock blasting. Escola de Minas, vol. 72, no. 1, pp. 133–138.
Seccatore, J., de Tomi, G., Munaretti, E., and Dompieri, M. 2011. Blasting fragmentation management: An innovative approach using complexity analysis. Escola de Minas, vol. 64, no. 4, pp. 525–530.
Workman, L. and Eloantra, J. 2003. Effects of blasting on crushing and grinding efficiency and energy consumption. Proceedings of the 29th Annual Conference on Explosives and Blasting Technique, Nashvill, TN. International Society of Explosives Engineers, Cleveland, OH. u

Affiliation:
1The Nelson Mandela African Institution of Science and Technology, Tanzania
Correspondence to:
A.M. Rugaika
Email: anita.rugaika@nm-aist.ac.tz
Dates:
Received: 22 Jun. 2023
Revised: 11 Oct. 2023
Accepted: 14 Jun. 2024
Published: July 2024
How to cite:
Mdachi, D.D., Rugaika, A.M., and Machunda, R.L. 2024. Valorization potentials of phosphate tailings at Minjingu mines in Northern Tanzania. Journal of the Southern African Institute of Mining and Metallurgy, vol. 124, no. 7. pp. 415–420
DOI ID:
http://dx.doi.org/10.17159/24119717/2857/2024
ORCID:
A.M. Rugaika
http://orcid.org/0000-0002-6313-9136
by D.D. Mdachi1, A.M. Rugaika1, and R.L. Machunda1
Abstract
Sedimentary and igneous rocks are the two primary sources of phosphate that are mined and beneficiated to fertilizer. During the beneficiation process, phosphate is lost into the tailings. We investigated phosphate concentrations in tailings dumps at Minjingu mine, Tanzania using energy-dispersive X-ray fluorescence spectrometry to quantify the chemical compositions. The phosphate content in the tailings varied from 12.91% phosphorus pentoxide (P2O5) in Tailings 2 to 19.61% in Tailings Dump 1. The naturally occurring phosphate concentration in rocks ranges from 3% to 35%, and phosphate tailings from various locations with P2O5 concentrations as low as 6.46-12.65% have been beneficiated to commercial fertilizer. Our investigation revealed that phosphate concentrations in Minjingu tailings may be sufficient to be recovered for commercial applications. Suitable recovery methods are discussed, and we recommend that beneficiation should be performed to minimize the loss of phosphate into tailings. Further research is needed to identify the optimal beneficiation methodology.
Keywords phosphate tailings, valorization, Minjingu mine, phosphorus pentoxide, beneficiation
Introduction
The main source of phosphorus and the primary raw material for manufacturing phosphate fertilizers is phosphate rock (Abouzeid, 2007; Farid et al., 2022). Most global phosphate ores originate from igneous and sedimentary deposits (Alsafasfeh and Alagha, 2017; Liang et al., 2018). Over 80% of phosphate fertilizers used globally are sourced from sedimentary phosphatic deposits (Derhy et al., 2020; El Bamiki et al., 2021). The concentration of phosphorus pentoxide (P2O5) in phosphate ores ranges from 3% to 35% (Notholt et al, 1979).
Phosphate deposits are mined using both opencast (or surface mining) and underground methods (Ptáček, 2016). The most common method is opencast mining, where the overburden is removed to uncover the phosphate reserve (Zhang, 2014). Bulldozers and excavators can be used to remove the topsoil, which can then be stored in stockpiles for later use, or used immediately at other reclamation sites (Mislevy et al., 2015; Toama, 2017).
The global demand for and production of phosphate fertilizers is increasing rapidly, while reserves continue to decrease (Oliveira et al., 2011; FAO, 2019; Safhi et al., 2022). Thus, the need to recover phosphate from tailings has become increasingly important (Jandieri, 2023). According to reserve assumptions and various scenarios for population growth, increasing demand for phosphate fertilizer has directly led to the depletion of phosphatic rock reserves (Wünscher, 2013). Gou et al (2019) reported that there is the possibility of phosphate being lost into tailings during the beneficiation process.
Phosphate tailings are industrial waste generated during the processing of phosphate ores into phosphate fertilizers (Chen et al., 2017). Tailings are widely recognized as a secondary source of phosphorus, which can be successfully utilized for the manufacture of phosphate fertilizer concentrates (Alsafasfeh and Alagha, 2017; Alsafasfeh et al., 2022).
Through beneficiation, the phosphate grade of the concentrate can be increased to between 28% and 35% P2O5 (Ravi et al., 2014; Boujlel et al., 2019; Alsafasfeh et al, 2022). Phosphatic rocks contain variable concentrations of phosphate minerals (Toama et al, 2015). Igneous phosphate rocks are typically low grade (< 5% P2O5) in comparison with sedimentary rock phosphates, but can be upgraded to 30% P2O5 (van Kauwenbergh, 2010).
Phosphatic rocks account for approximately 95% of global phosphate production. Some of the phosphate is lost in the tailings during beneficiation (Toamam et al, 2015). It has been demonstrated
that up to 50% of the P2O5 can be lost during beneficiation (van Kauwenbergh, 2010). Taha et al. (2021) used column flotation to assess the efficiency of beneficiation at a fertilizer manufacturer in Brazil, and found that only 46.2% of the P2O5 was recovered.
In Tanzania, phosphate deposits are found in many different areas, and are of both igneous (Zizi, Ngualla, Panda Hill, SanguIkola, and Nachendezwaya) and sedimentary (Minjingu, Chali Hill, and Chamoto) origin (Mchihiyo, 1991; Jama and van Straaten, 2006). The Minjingu deposit comprises two types of phosphates, soft phosphate and hard phosphate, which both contain > 20% P2O5 and can easily be upgraded to 30% P2O5 by dry screening, making the resultant material suitable for direct fertilizer application (van Kauwenbergh, 1991; Szilas et al., 2008; Mwalongo et al., 2022).
Bulldozers and hydraulic excavators are used in the open-pit mining process at Minjingu Mines and Fertilizers Limited (MMFL); both for the removal of overburden (topsoil, clay, and sand layers) and the excavation of ore. Owing to the soft rock at MMFL, no drilling or blasting is necessary. The phosphatic materials are delivered by dump trucks to the pre-drying area, where they are spread out, crushed, and mixed by bulldozers. The waste clays are dumped in enormous piles. Before transportation to the beneficiation facility, the phosphatic materials must be dried to < 15% moisture (Szilas, 2002). Beneficiation is performed via physical separation rather than chemical means.
Crushing, grinding, screening, scrubbing, heavy media separation, washing, roasting, calcination, and flotation techniques are used to beneficiate low-grade phosphate ore (Liu et al., 2016; Ruan et al, 2019). Arroug et al. (2021) reported that low-grade tailings containing 15.84% P2O5 could be upgraded to 30.7% P2O5 using an organic acid leaching method. Li et al (2021) reported that low-grade phosphate with approximately 12.65% P2O5 was upgraded to 28.68% P2O5 using direct and reverse flotation. Teague and Lollback (2012) found that ultrafine phosphate tailings could be
upgraded from 6.46% to 34.7% P2O5 by flotation, and Alsafasfeh et al. (2022) obtained approximately 84.6% P2O5 recovery from tailings using direct froth flotation.
Khoshjavan and Rezai (2012), El-Midany et al (2013), Shariatiet al (2015), and Ismaila et al. (2020) have reported that phosphatic rocks with high CaO/P2O5 ratios can be beneficiated using calcination. Khoshjavan and Rezai (2012) upgraded low-grade phosphatic rock containing 11.9% P2O5 and 24.49% CaO to 31% P2O5 and 43.12% CaO via calcination and flotation. Ismaila et al. (2020) reported that calcination can be used to reduce the CaO/ P2O5 ratio from 2.5 to 1.65 Shariati et al (2015) indicated that low-grade phosphate deposits containing 9.16% P2O5 and 46.01% CaO could be upgraded to 30.77% P2O5 and 45.11% CaO using calcination and shaking table methods.
Little is known regarding the quantity of P2O5 present in Tanzanian phosphate tailings and how much may be recovered. Therefore, the purpose of this study was to evaluate the amount of phosphate in the tailings at MMFL in northern Tanzania.
The study area is located at Minjingu Hill, near Manyara Lake (3°42ʹ21˝‒3°42ʹ3˝ S, 35°54ʹ56˝‒35°54ʹ14˝ E). Samples were taken from tailings situated near to the open pit (Figure 1).
Samples the were collected at locations shown in Figure 2. There were five designated sample locations in each tailings dump. Three samples were collected at each designated sample location and composited. The samples were ground, dried, and split to obtain representative 50 g samples and packed into clean plastic bags (maximum capacity 1 kg) for analysis.
Sample preparation
All samples were sieved through a 60 µm mesh and dried in an oven at 100°C. A total of 4 g of each sample was mixed with 0.9 g
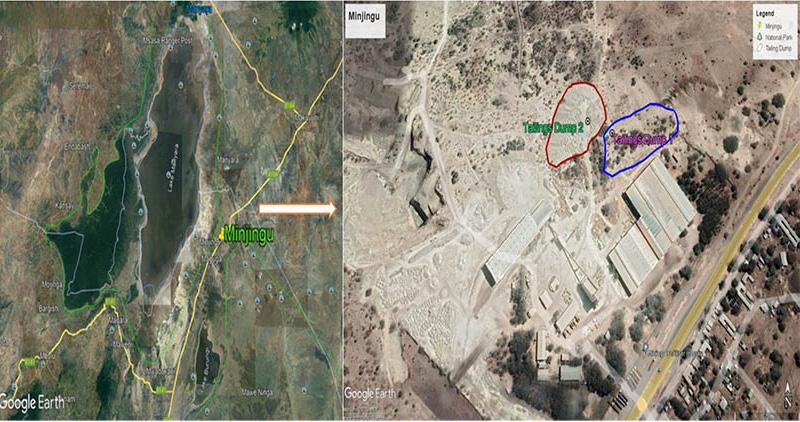

of binder and pulverized for 10 min at 180 r/min. The pulverized material was placed in a cylindrical die of 32 mm diameter and pressed at a hydraulic pressure of 15 bar for 1 min to obtain a durable pellet for X-ray fluorescence (XRF) analysis.
X-ray analysis
Energy-dispersive XRF was used to identify the major elements in the pellets. The measurement time for all major elements in a given sample was approximately 900 s. Elemental concentrations were precisely calibrated using the International Atomic Energy Agency Certified Reference Material Soil 7 (CRM IAEA Soil 7).
Results and discussion
The accuracy of the XRF data was evaluated using the criterion for judging the acceptability of analytical methods (SR criterion) (Oscar et al., 2008):
SR = {(Cx – Cw) + 2σ}/Cw *10, [1] where SR stands for standard random error, CX represents the measured value, CW is the certified value, and δ indicates the standard deviation of the experimental values.
According to this criterion, the difference between a certified value and an acquired analytical data-point can be separated into three categories: excellent (SR ≤ 25%), acceptable (25% < SR ≤ 50%), and unacceptable (SR > 50%). Table I presents data evaluated from three samples of the CRM IAEA Soil-7. The values for Mg, Al, Si, P, K, Ca, and Fe as determined by XRF were all in excellent agreement (SR ≤ 25%), but that for Na was unacceptable (SR > 50%).
Our results revealed that Tailings dumps 1 and 2 had different concentrations of Na2O, MgO, Al2O3, SiO2, P2O5, K2O, CaO,
Table II
Chemical composition of phosphate tailings in Dump 1 Sample
Table I
X-ray fluorescence analysis of the International Atomic Energy Agency Certified Reference Material Soil 7, showing certified (Cw) and measured (Cx) values, standard deviation (SD), and standard random error (SR)
and Fe2O3. The data are shown in Tables II and III, respectively. Typically, a greater R2 value (closer to unity) equates to a better match between a regression model and the data. In this context, the certified and measured concentrations were shown to exhibit strong correlations (Figure 3).
Composition of phosphate tailings
Our elemental analysis results demonstrated that the tailings are mainly composed of CaO, P2O5, SiO2, Na2O, MgO, Al2O3, Fe2O3,

Figure 3—Correlations between measured and certified concentrations (%)
Table III
Chemical composition of phosphate tailings in Dump 2 Sample
and K2O, as shown in Tables II and III. The lowest concentration of P2O5 was found in sample TD21 (12.96 ± 0.02%), and the highest in TD13 (19.45 ± 0.14%). The average P2O5 concentrations in Tailings dumps 1 and 2 were 17.82 ± 0.29% and 14.92 ± 0.40%, respectively. Because phosphatic rocks are the main source of phosphorus, the P2O5 concentration largely determines the ore quality (Mwalongo et al., 2022). There are three different grades of phosphate ores based on P2O5 content: low grade (12%–16% P2O5), medium grade (17%–25% P2O5), and high grade (26%–35% P2O5 (Sengul et al., 2006). According to this classification, the samples from MMFL can be considered as low grade in Tailings dump 2 (Table III) and medium grade in Tailings dump 1 (Table II). The low levels of phosphates
in the tailings reported herein are similar to previous findings in tailings from various other locations across the globe (Oliveira et al., 2011; Teague and Lollback, 2012; Shariati et al 2015; Arroug et al., 2021; Li et al 2021; Yang et al., 2021).
Conclusion
The tailings at Minjingu Mines and Fertilizers Limited (MMFL) contain elevated concentrations of Na2O, P2O5, SiO2, and CaO, with maximum values of 15.09 ± 0.24% (TD23), 19.45 ± 0.14% (TD13), 24.21 ± 0.20% (TD22), and 37.57 ± 0.26% (TD13), respectively. The lowest concentrations of Na2O, P2O5, SiO2, and CaO were 10.58 ± 0.19% (TD11), 12.96 ± 0.03% (TD21), 8.90 ± 0.05% (TD13), and 27.18 ± 0.14% (TD22), respectively. The present study, along with previous research conducted globally, indicates that the P2O5 concentration in MMFL tailings may be amenable to upgrading for the manufacture of commercial fertilizer. We recommend further research to explore an appropriate beneficiation technique for the recovery of phosphate fertilizers from these tailings.
The authors wish to express their appreciation to the Tanzania Mining Commission for financial support of this research. We also thank MMFL management for their cooperation in providing access to collect samples at their mine site. We thank the management of the Tanzania Atomic Energy Agency for the use of their laboratory facilities. Finally, we thank David Wacey, PhD, from Edanz (www. edanz.com/ac) for editing a draft of this manuscript.
Author contributions
D. Mdachi: Conceptualization, funding acquisition, formal analysis, investigation, writing original draft preparation, visualization A. Rugaika: Methodology, review and editing, supervision R. Machunda: Methodology, validation, formal analysis, review and editing, supervision. All authors have read and approved the final manuscript.
References
Abouzeid, A.Z.M. 2007. Upgrading of phosphate ores – A review. Powder Handling and Processing, vol. 19, no. 2, pp. 92–109.
Alsafasfeh, A. and Alagha, L. 2017. Recovery of phosphate minerals from plant tailings using direct froth flotation. Minerals, vol. 7, no. 8. pp.145‒159. https://doi.org/10.3390/min7080145
Alsafasfeh, A., Alagha, L., Alzidaneen, A., and Nadendla, V.S.S. 2022. Optimization of flotation efficiency of phosphate minerals in mine tailings using polymeric depressants: Experiments and machine learning. Physicochemical Problems of Mineral Processing, vol. 58, no. 4, pp. 1–17. https://doi.org/10.37190/ PPMP/150477
Arroug, L., Elaatmani, M., Zegzouti, A., and Aitbabram, M. 2021. Low-grade phosphate tailings beneficiation via organic acid leaching: Process optimization and kinetic studies. Minerals, vol. 11, no. 492, pp. 1–18. https://doi.org/10.3390/min11050492
Boujlel, H., Chebbi, N., Daldoul, G., Fattah, N., Tlil, H., Souissi, F., and Souissi, R. 2019. The beneficiation processes of low-grade sedimentary phosphates of Tozeur-Nefta deposit (GafsaMetlaoui basin: South of Tunisia). Minerals, vol. 9, no. 1, pp. 1–13 https://doi.org/10.3390/min9010002
Chen, Q., Fourie, A., Xin, C., and Zhang, Q. 2017. Utilization of phosphogypsum and phosphate tailings for cemented paste backfill. Journal of Environmental Management, vol. 201, pp. 19–27. https://doi.org/10.1016/j.jenvman.2017.06.027
Derhy, M., Benzaazoua, M., Hakkou, R., and Taha, Y. 2020. Review of the main factors affecting the flotation of phosphate ores. Minerals, vol. 10, no. 12, pp. 1–22. https://doi.org/10.3390/ min10121109
El Bamiki, R., Raji, O., Ouabid, M., Elghali, A., Yazami, K.O., and Bodinier, J.-L. 2021. Phosphate rocks: A review of sedimentary and igneous occurrences in Morocco. Minerals, vol. 11, pp. 11–37. https:// doi.org/10.3390/min11101137
El-Midany, A.A., Abd El-Aleem, F.A., and Al-Fariss, T.F. 2013. Why do relatively coarse calcareous phosphate particles perform better in a static-bed calciner? Powder Technology, vol. 237, pp. 180–185. https://doi.org/10.1016/j.powtec.2013.01.035
Food and Agriculture Organization (FAO). 2019. World fertilizer trends and outlook to 2022. Rome. https://openknowledge.fao.org/server/api/core/ bitstreams/42d5a668-f44c-4976-8540-8efdb0f4d17b/content
Farid, Z., Abdennouri, M., Barka, N., and Sadiq, M. 2022. Graderecovery beneficing and optimization of the froth flotation process of a mid-low phosphate ore using a mixed soybean and sunflower oil as a collector. Applied Surface Science Advances, vol. 11, pp. 1‒11. https://doi.org/10.1016/j.apsadv.2022.100287
Gou, M., Zhou, L., and Then, N.W.Y. 2019. Utilization of tailings in cement and concrete: A review. Science and Engineering of Composite Materials, vol. 26, no. 1, pp. 449–464. https://doi.org/10.1515/secm-2019-0029
Ismaila, A.G., Ibrahim, N., Sani, O.M., and Adamou, Z. 2020. Influence of the calcination time on the dissolution of merchant phosphates from Tahoua (Niger). Research Journal of Chemical and Environmental Sciences, vol. 8, pp. 1–6.
Jama, B. and van Straaten, P. 2006. Potential of East African phosphate rock deposits in integrated nutrient management strategies. Anais da Academia Brasileira de Ciencias, vol. 78, no. 4, pp. 781–790. https://doi.org/10.1590/S000137652006000400012
Jandieri, G. 2023. Increasing the efficiency of secondary resources in the mining and metallurgical industry. Journal of the Southern African Institute of Mining and Metallurgy, vol. 123, no. 1, pp. 1–8. https://doi.org/10.17159/2411-9717/1092/2023
Khoshjavan, S. and Rezai, B. 2012. Beneficiation of refractory rock phosphate by calcination and flotation. Minerals and Metallurgical Processing, vol. 28, no. 4, pp. 187–192.
Li, H., Dzemua, G.L., and Liu, Q. 2021. Beneficiation studies of the low-grade skarn phosphate from Mactung Tungsten Deposit, Yukon, Canada. Minerals, vol. 11, no. 421, pp. 1–14. https://doi.org/10.3390/min11040421
Liang, H., DePaoli, D.W., Jin, Z., and Zhang, P. 2018. Rare earth and phosphorus leaching from a flotation tailings of Florida phosphate rock. Minerals, vol. 8, no. 9, pp. 416‒427. https://doi.org/10.3390/min8090416
Liu, X., Zhang, Y., Liu, T., Cai, Z., Chen, T., and Sun, K. 2016. Beneficiation of a sedimentary phosphate ore by a combination of spiral gravity and direct-reverse flotation. Minerals, vol. 6, no. 2, p. 38. https://doi.org/10.3390/min6020038
Mchihiyo, E.P. 1991. Phosphate potential in Tanzania. Fertilizer Research, vol. 30. no. 2–3, pp. 177–180. https://doi.org/10.1007/ BF01048650
Mislevy, P., Blue, W.G., Stricker, J.A., Cook, B.C., and Vice, M.J. 2015. Phosphate mining and reclamation. Reclamation of Drastically Disturbed Lands, vol. 1980, no. 41, pp. 961–1005. https://doi.org/10.2134/agronmonogr41.c38
Mwalongo, D.A., Haneklaus, N.H., Kivevele, T.T., Lisuma, J.B., and Mtei, K.M. 2022. Uranium in phosphate rocks and mineral fertilizers applied to agricultural soils in East Africa. Environmental Science and Pollution Research, vol. 30, pp. 33898–33906. https://doi.org/10.1007/s11356-022-24574-5.
Notholt, A.J.G., Highley, D.E., and Slansky M. 1979. Raw Materials (Research and Development) – Phosphate. Minerals Strategy and Museum Division, Institute of Geological Sciences, London.
Oliveira, M.S., Ataide, C.H., Barrozo, M.A.S., and Santana, R.C. 2011. Recovery of apatite from flotation tailings. Separation and Purification Technology, vol. 79, no. 1, pp. 79–84. https://doi.org/10.1016/j.seppur.2011.03.015
Oscar, D.R., Castillo, J.R.F., Hernandez, P.G., Lopez, J.O., Munoz, M.S., Padilla, D.B., Rodriguez, K.D., Rodriguez, D.R., Rodriguez, C.M.M., and Rudnikas, A.G. 2008. Evaluation of the hurricanes Gustav and Ike impact on healing mud from San Diego river using nuclear and geochemical techniques. Nucleus, vol. 50, pp. 7–11.
Ptáček, P. 2016. Mining and beneficiation of phosphate ore. Brno University of Technology, Czech Republic. pp. 384–415.
Ravi, B.P., Rodl, I.R., Kumar, P.S., and Krishna, S.J.G. 2014. Sustainable process evolution of low grade phosphate wastes from eastern mines, Khenifiss, Palmeria Desert, Syria. Chemical Engineering and Science, vol. 1, no. 2, pp. 45–51.
Ruan, Y., He, D., and Chi, R. 2019. Review on beneficiation techniques and reagents used for phosphate ores. Minerals, vol. 9, no. 253, pp. 1–18. https://doi.org/10.3390/min9040253
Safhi, A. el M., Amar, H., El Berdai, Y., El Ghorfi, M., Taha, Y., Hakkou, R., Al-Dahhan, M., and Benzaazoua, M. 2022. Characterizations and potential recovery pathways of phosphate mines waste rocks. Journal of Cleaner Production, vol. 374, 134034.
Sengul, H., Ozer, A.K., and Gulaboglu, M.S. 2006. Beneficiation of Mardin-Mazidaği (Turkey) calcareous phosphate rock using
dilute acetic acid solutions. Chemical Engineering Journal, vol. 122, no. 3, pp. 135–140. https://doi.org/10.1016/j. cej.2006.06.005
Shariati, S., Ramadi, A., and Salsani, A. 2015. Beneficiation of lowgrade phosphate deposits by a combination of calcination and shaking tables: Southwest Iran. Minerals, vol. 5, no. 3, pp. 367–379. https://doi.org/10.3390/min5030367
Szilas, C. 2002. The Tanzanian Minjingu phosphate rockPossibilities and limitations for direct application. PhD thesis, Chemistry Department, Royal Veterinary and Agricultural University, Copenhagen, Denmark.
Szilas, C., Borggaard, O.K., Koch, C.B., and Msolla, M.M. 2008. The reactivity of Tanzanian Minjingu phosphate rock can be assessed from the chemical and mineralogical composition. Geoderma, vol. 147, no. 3–4, pp. 172–177. https://doi.org/10.1016/j.geoderma.2008.08.009
Taha, Y., Elghali, A., Hakkou, R., and Benzaazoua, M. 2021. Towards zero solid waste in the sedimentary phosphate industry: Challenges and opportunities. Minerals, vol. 11, no. 11, pp. 1–20. https://doi.org/10.3390/min11111250
Teague, A.J. and Lollback, M.C. 2012. The beneficiation of ultrafine phosphate. Minerals Engineering, vol. 27–28, pp. 52–59. https://doi.org/10.1016/j.mineng.2011.12.007
Toama, H.Z. 2017. Phosphate rock processing and fertilizers production Al-Qaim fertilizers complex, Iraq. Iraqi Bulletin of Geology and Mining, vol. 7, pp. 67–77.
Toama, H.Z., Al-Ajeel, A.-W.A., and Waheeb, H.H. 2015. Beneficiation of Akashat phosphate rocks by flotation process. Engineering and Technology Journal, vol. 33, no. 9, pp. 2255–2268.
Van Kauwenbergh, S.J. 1991. Overview of phosphate deposits in East and Southeast Africa. Fertilizer Research, vol. 30, no. 2–3, pp. 127–150. https://doi.org/10.1007/BF01048645
Van Kauwenbergh, S.J. 2010. World phosphate rock, p. 60. http://pdf.usaid.gov/pdf_docs/Pnadw 835.PDF
Wünscher, R. 2013. A comparison of different phosphorus extraction methods with the phosphorus uptake of wheat. MSc thesis, University of Natural Resources and Life Sciences, Vienna.
Yang, X., Kuusik, R., Piir, I., Tammb, K., Tonsuaadu, K., and Trikkel, A. 2021. Evaluation of Estonian phosphate rock by flotation. Minerals Engineering, vol. 171, pp. 1–10. https://doi. org/10.1016/j.mineng.2021. 107127
Zhang, P. 2014. Comprehensive recovery and sustainable development of phosphate resources. Procedia Engineering, vol. 83, no. 1, pp. 37–51. https://doi.org/10.1016/j. proeng.2014.09.010 u


The Southern African Institute of Mining and Metallurgy in collaboration with the SAIMM Western Cape Branch is hosting the
1-3 SEPTEMBER 2024
HAZENDAL WINE ESTATE, STELLENBOSCH, WESTERN CAPE, SOUTH AFRICA

The world’s dependency on metals has become more evident with the growing demand for metals required to drive advancements in the technological and digital landscape and, the energy transition for a carbon neutral future. This growing demand however, implies that the metal extraction industry will need to play a significant role in providing the world with vast quantities of metals crucial in the building of the necessary infrastructure.
Furthermore, energy and water are two critical inputs in the hydrometallurgical process flowsheets and their increasing shortage suggests the need for the development of processes that take such challenges into consideration. A circular hydrometallurgy approach focusing on innovative research and developments around energy and resource efficient processes based on closing materials and resources loops can therefore, play an important role if the metal extraction sector is to meet the current and future global metal demands. In addition, advancements in the field of artificial intelligence can also allow for the use of innovative tools such as machine learning to better understand, predict and optimise hydrometallurgical processes in a smarter and sustainable manner.
The SAIMM Hydrometallurgy conference, 2024, will bring together internationally and locally recognized scientists and engineers from mining and metal producing companies, project design and implementation entities, equipment and reagent suppliers, research and academic institutions to discuss and share innovative technologies that can assist the global world in meeting the current and future metal demands.
ECSA Validated CPD Activity, Credits = 0.1 points per hour attended

FOR FURTHER INFORMATION, CONTACT:
Camielah Jardine, Head of Conferences and Events
1-3 September 2024 — Hydrometallurgy Conference 2024
Hydrometallurgy for the Future
Hazendal Wine Estate, Stellenbosch, Western Cape, South Africa
Contact: Camielah Jardine
Tel: 011 538-0237, E-mail: camielah@saimm.co.za
Website: http://www.saimm.co.za
4-6 September 2024 — 7TH IFAC Workshop on Mining, Mineral and Metal Processing (IFAC MMM 2024)
Brisbane, Australia
Website: https://ifac.papercept.net/conferences/scripts/ start.pl
5-6 September 2024 — Mine Planning and Design Colloquium 2024
Electra Mining Nasrec, Johannesburg, South Africa
Contact: Camielah Jardine
Tel: 011 538-0237, E-mail: camielah@saimm.co.za
Website: http://www.saimm.co.za
16-17 September 2024 — The Control Conference Africa 2024
Balaclava, Mauritius, Website: https://cca2024.org/
18-22 September 2024 — Infacon XVII 2024
17TH International Ferroalloys Congress Beijing, China
Website: https://www.infacon17 net/?sid=2178&mid=577&v=108
29 September-3 October 2024 — IMPC 2024
XXXI IMPC-International Mineral Processing Congress 2024
National Harbor, Washington D.C.
Website: https://smeimpc.org/
1-4 October 2024 — Southern African Geophysical Association
Windhoek
E-mail: chair@sagaconference.co.za
Website: https://sagaconference.co.za/
16-17 October 2024 — ESGS Conference 2024 ESG in the minerals industry challenges and opportunities
Focus Rooms, Modderfontein, Johannesburg, South Africa
Contact: Camielah Jardine
Tel: 011 538-0237, E-mail: camielah@saimm.co.za
Website: http://www.saimm.co.za
16-17 October 2024 — MESA Africa 2024 Summit
The Edge at Knightsbridge, Bryanston, Johannesburg, South Africa, Website: https://evt.to/asiuosimw
29 October 2024 — 20TH Annual Student Colloquium 2024
Mintek, Randburg, Johannesburg
Contact: Gugu Charlie Tel: 011 538-0238, E-mail: gugu@saimm.co.za
Website: http://www.saimm.co.za
31 October - 1 November 2024 — SANCOT Symposium 2024
Cullinan Diamond Lodge, Cullinan, Pretoria Advances in Tunnelling-A Portal to the Future
Contact: Gugu Charlie
Tel: 011 538-0238, E-mail: gugu@saimm.co.za
Website: http://www.saimm.co.za
6-8 November 2024 — MineSafe Conference 2024
Emperors Palace Convention Centre, South Africa
Contact: Camielah Jardine
Tel: 011 538-0237, E-mail: camielah@saimm.co.za
Website: http://www.saimm.co.za
11-12 November 2024 — Mintek@90 Conference 2024
Sandton Convention Centre, South Africa
Contact: Camielah Jardine
Tel: 011 538-0237, E-mail: camielah@saimm.co.za
Website: http://www.saimm.co.za
19-20 February 2025 — Mine Closure Conference 2025
Maslow Hotel, Sandton, South Africa
Contact: Camielah Jardine
Tel: 011 538-0237, E-mail: camielah@saimm.co.za
Website: http://www.saimm.co.za
7-8 April 2025 — 2ND Southern African Hydrogen and Fuel Cell Conference 2025
CSIR International Convention Centre, Pretoria
Contact: Camielah Jardine
Tel: 011 538-0237, E-mail: camielah@saimm.co.za
Website: http://www.saimm.co.za
21-25 July 2025 — AfriRock Conference 2025
Sun City, South Africa
Contact: Camielah Jardine
Tel: 011 538-0237, E-mail: camielah@saimm.co.za
Website: http://www.saimm.co.za
16-22 November 2025 — The 12TH International Copper Conference (Copper 2025)
Phoenix, Arizona, USA
Website: https://www.extractionmeeting.org/ Extraction2025/Extraction2025/Copper2025/default.aspx
The following organizations have been admitted to the Institute as Company Affiliates
A and B Global Mining (Pty) Ltd
acQuire Technology Solutions
AECI Mining Chemicals, a division of AECI
Mining Ltd
African Pegmatite
Allied Furnace Consultants
AMIRA International Africa (Pty) Ltd
Anglogold Ashanti Ltd
Anton Paar Southern Africa
Arcus Gibb (Pty) Ltd
ASPASA
Axis House Group (Pty) Ltd
Becker Mining (Pty) Ltd
Bluhm Burton Engineering Pty Ltd
Caledonia Mining South Africa
Castle Lead Works
DDP Specialty Products South Africa (Pty) Ltd
De-Tect Unit Inspection (Pty) Ltd
Digby Wells and Associates
EHL Consulting Engineers (Pty) Ltd
Elbroc Mining Products (Pty) Ltd
Epiroc South Africa (Pty) Ltd
Ex Mente Technologies (Pty) Ltd
Exxaro Resources Limited
FLSmidth Minerals (Pty) Ltd
G H H Mining Machines (Pty) Ltd
Geobrugg Southern Africa (Pty) Ltd
Glencore
Gravitas Minerals (Pty) Ltd
Hatch (Pty) Ltd
Herrenknecht AG
Impala Platinum Holdings Limited
IMS Engineering (Pty) Ltd
Ingwenya Mineral Processing
Ivanhoe Mines SA
Longyear South Africa (Pty) Ltd
Malvern Panalytical (Pty) Ltd
Maptek (Pty) Ltd
Micromine Africa (Pty) Ltd
Minearc South Africa (Pty) Ltd
Minerals Council of South Africa
MineRP Holding (Pty) Ltd
Mining Projection Concepts (Pty) Ltd
Mintek
MLB Investments CC
Modular Mining Systems Africa (Pty) Ltd
Murray & Roberts Cementation (Pty) Ltd
Optron (Pty) Ltd
Paterson & Cooke Consulting Engineers (Pty) Ltd
Redpath Mining (South Africa) (Pty) Ltd
Rosond (Pty) Ltd
Roytec Global (Pty) Ltd
Rustenburg Platinum Mines Limited - Union
Salene Mining (Pty) Ltd
Schauenburg (Pty) Ltd
SENET (Pty) Ltd
Sibanye Gold Limited
Sound Mining Solution (Pty) Ltd
SRK Consulting SA (Pty) Ltd
Tomra (Pty) Ltd
Trans-Caledon Tunnel Authority
Ukwazi Mining Solutions (Pty) Ltd
VBKOM Consulting Engineers
Weir Minerals Africa
Zutari (Pty) Ltd