...through the metals we produce Creating a better future

VOLUME 122 NO. 10 OCTOBER 2022


Nolitha Fakude
President, Minerals Council South Africa
Honorary Vice Presidents
Gwede Mantashe
Minister of Mineral Resources and Energy, South Africa Ebrahim Patel
Minister of Trade, Industry and Competition, South Africa Blade Nzimande
Minister of Higher Education, Science and Technology, South Africa
President
Z. Botha
President Elect
W.C. Joughin
Senior Vice President E. Matinde
Junior Vice President G.R. Lane
Incoming Junior Vice President
T.M. Mmola
Immediate Past President
I.J. Geldenhuys
Honorary Treasurer
W.C. Joughin
Ordinary Members on Council
W. Broodryk G. Njowa
Z. Fakhraei S.J. Ntsoelengoe
R.M.S. Falcon (by invitation) S.M. Rupprecht B. Genc M.H. Solomon
K.M. Letsoalo A.J.S. Spearing S.B. Madolo A.T. van Zyl
F.T. Manyanga E.J. Walls M.C. Munroe
Co-opted to Members
K. Mosebi
A.S. Nhleko
Past Presidents Serving on Council
N.A. Barcza C. Musingwini
R.D. Beck S. Ndlovu
J.R. Dixon J.L. Porter
V.G. Duke M.H. Rogers
R.T. Jones D.A.J. Ross-Watt
A.S. Macfarlane G.L. Smith
M.I. Mthenjane W.H. van Niekerk
G.R. Lane–TPC Mining Chairperson
Z. Botha–TPC Metallurgy Chairperson
M.A. Mello–YPC Chairperson
K.W. Banda–YPC Vice Chairperson
Botswana Being established DRC Not active
Johannesburg N. Rampersad
Namibia Vacant Northern Cape I. Tlhapi
North
Pretoria
Zambia
Zimbabwe
Zululand
* W. Bettel (1894–1895)
* A.F. Crosse (1895–1896)
* W.R. Feldtmann (1896–1897)
* C. Butters (1897–1898)
* J. Loevy (1898–1899)
* J.R. Williams (1899–1903)
* S.H. Pearce (1903–1904)
* W.A. Caldecott (1904–1905)
* W. Cullen (1905–1906)
* E.H. Johnson (1906–1907)
* J. Yates (1907–1908)
* R.G. Bevington (1908–1909)
* A. McA. Johnston (1909–1910)
* J. Moir (1910–1911)
* C.B. Saner (1911–1912)
* W.R. Dowling (1912–1913)
* A. Richardson (1913–1914)
* G.H. Stanley (1914–1915)
* J.E. Thomas (1915–1916)
* J.A. Wilkinson (1916–1917)
* G. Hildick-Smith (1917–1918)
* H.S. Meyer (1918–1919)
* J. Gray (1919–1920)
* J. Chilton (1920–1921)
* F. Wartenweiler (1921–1922)
* G.A. Watermeyer (1922–1923)
* F.W. Watson (1923–1924)
* C.J. Gray (1924–1925)
* H.A. White (1925–1926)
* H.R. Adam (1926–1927)
* Sir Robert Kotze (1927–1928)
* J.A. Woodburn (1928–1929)
* H. Pirow (1929–1930)
* J. Henderson (1930–1931)
* A. King (1931–1932)
* V. Nimmo-Dewar (1932–1933)
* P.N. Lategan (1933–1934)
* E.C. Ranson (1934–1935)
* R.A. Flugge-De-Smidt (1935–1936)
* T.K. Prentice (1936–1937)
* R.S.G. Stokes (1937–1938)
* P.E. Hall (1938–1939)
* E.H.A. Joseph (1939–1940)
* J.H. Dobson (1940–1941)
* Theo Meyer (1941–1942)
* John V. Muller (1942–1943)
* C. Biccard Jeppe (1943–1944)
* P.J. Louis Bok (1944–1945)
* J.T. McIntyre (1945–1946)
* M. Falcon (1946–1947)
* A. Clemens (1947–1948)
* F.G. Hill (1948–1949)
* O.A.E. Jackson (1949–1950)
* W.E. Gooday (1950–1951)
* C.J. Irving (1951–1952)
* D.D. Stitt (1952–1953)
* M.C.G. Meyer (1953–1954)
* L.A. Bushell (1954–1955)
* H. Britten (1955–1956)
* Wm. Bleloch (1956–1957)
* H. Simon (1957–1958)
* M. Barcza (1958–1959)
* R.J. Adamson (1959–1960)
* W.S. Findlay (1960–1961)
* D.G. Maxwell (1961–1962)
* J. de V. Lambrechts (1962–1963)
* J.F. Reid (1963–1964)
* D.M. Jamieson (1964–1965)
* H.E. Cross (1965–1966)
* D. Gordon Jones (1966–1967)
* P. Lambooy (1967–1968)
* R.C.J. Goode (1968–1969)
* J.K.E. Douglas (1969–1970)
* V.C. Robinson (1970–1971)
* D.D. Howat (1971–1972)
* J.P. Hugo (1972–1973)
* P.W.J. van Rensburg (1973–1974)
* R.P. Plewman (1974–1975)
* R.E. Robinson (1975–1976)
* M.D.G. Salamon (1976–1977)
* P.A. Von Wielligh (1977–1978)
* M.G. Atmore (1978–1979)
* D.A. Viljoen (1979–1980)
* P.R. Jochens (1980–1981)
* G.Y. Nisbet (1981–1982)
A.N. Brown (1982–1983)
* R.P. King (1983–1984)
J.D. Austin (1984–1985)
* H.E. James (1985–1986)
H. Wagner (1986–1987)
* B.C. Alberts (1987–1988)
* C.E. Fivaz (1988–1989)
* O.K.H. Steffen (1989–1990)
* H.G. Mosenthal (1990–1991)
R.D. Beck (1991–1992)
* J.P. Hoffman (1992–1993)
* H. Scott-Russell (1993–1994)
J.A. Cruise (1994–1995)
D.A.J. Ross-Watt (1995–1996)
N.A. Barcza (1996–1997)
* R.P. Mohring (1997–1998)
J.R. Dixon (1998–1999)
M.H. Rogers (1999–2000)
L.A. Cramer (2000–2001)
* A.A.B. Douglas (2001–2002)
S.J. Ramokgopa (2002-2003)
T.R. Stacey (2003–2004)
F.M.G. Egerton (2004–2005)
W.H. van Niekerk (2005–2006)
R.P.H. Willis (2006–2007)
R.G.B. Pickering (2007–2008)
A.M. Garbers-Craig (2008–2009)
J.C. Ngoma (2009–2010)
G.V.R. Landman (2010–2011)
J.N. van der Merwe (2011–2012)
G.L. Smith (2012–2013)
M. Dworzanowski (2013–2014)
J.L. Porter (2014–2015)
R.T. Jones (2015–2016)
C. Musingwini (2016–2017)
S. Ndlovu (2017–2018)
A.S. Macfarlane (2018–2019)
M.I. Mthenjane (2019–2020)
V.G. Duke (2020–2021)
I.J. Geldenhuys (2021–2022)
S.O.
R.D.
P. den
I.M.
R. Dimitrakopolous*
M. Dworzanowski*
Falcon
R.T.
W.C.

A.J. Kinghorn
D.E.P. Klenam
H.M. Lodewijks
D.F. Malan
R. Mitra* H. Möller
C. Musingwini
S. Ndlovu
P.N. Neingo
M. Nicol*
S.S. Nyoni
M. Phasha
P. Pistorius
P. Radcliffe
N. Rampersad
Q.G. Reynolds
I. Robinson
S.M. Rupprecht
K.C. Sole
A.J.S. Spearing* T.R. Stacey E. Topal* D. Tudor*
F.D.L. Uahengo D. Vogt*
*International
Journal Comment: Mining papers revisit old issues

P. Pistorius
President’s Corner: Why do we need to have this conversation? Why is diversity so important?
Z. Botha
A discrete event simulation approach for mine development planning at Codelco’s New Mine Level

I. Soto, A. Anani, and E. Córdova
This paper presents a discrete event simulation (DES) model that individualizses each of the unit operations in the development cycle in new caving megaprojects. The results indicate an impracticality in that achieving the advance rates scheduled in the original plans is not practical if the unit operations use the status quo. A significant improvement can be achieved by applying instituting changes to the equipment maintenance strategy of the equipment, ore pass availability, and in the initial planning sequence. Recommendations are made.
Evaluation of pre-treatment methods for gold recovery from refractory calcine tailings by P. Mutimutema, G. Akdogan, and M. Tadie . . . . . . . . . . . . . . . . . . . . . . . . . . . . . .
In this study gold recovery from a refractory calcine tailings dam was investigated. Bulk mineralogy of the tailings indicated that gold was present in submicrometren and micrometren sizes, as free gold, and associated with arsenic, sulphur, and silicates. Gold recovery with direct cyanidation was low. Microwave roasting and assisted leaching did not achieve higher recoveries. The investigation confirmed that chemical treatment with NaOH is a powerful tool for gold extraction from refractory tailings.
to copy illustrations and short extracts from the text of individual contributions is usually given upon written application to the Institute, provided that the source (and where appropriate, the copyright) is acknowledged. Apart from any fair dealing for the purposes of review or criticism under The Copyright Act no. 98, 1978, Section 12, of the Republic of South Africa, a single copy of an article may be supplied by a library for the purposes of research or private study. No part of this publication may be reproduced, stored in a retrieval system, or transmitted in any form or by any means without the prior permission of the publishers. Multiple copying of the contents of the publication without permission is always illegal.
U.S. Copyright Law applicable to users In the U.S.A. The appearance of the statement of copyright at the bottom of the first page of an article appearing in this journal indicates that the copyright holder consents to the making of copies of the article for personal or internal use. This consent is given on condition that the copier pays the stated fee for each copy of a paper beyond that permitted by Section 107 or 108 of the U.S. Copyright Law. The fee is to be paid through the Copyright Clearance Center, Inc., Operations Center, P.O. Box 765, Schenectady, New York 12301, U.S.A. This consent does not extend to other kinds of copying, such as copying for general distribution, for advertising or promotional purposes, for creating new collective works, or for resale.
Water production as an option for utilizing closed underground mines by J. Dvořáček, P. Malíková, R. Sousedíková, S. Heviánková, P. Rys, and I. Osičková 571
The closure of a mine does not necessarily mark the tail-end of its life- cycle. Best practice references indicate that there are many viable options post-closure. The production of service water is one such option. Research has proved the practical feasibility of service or process water production. Good prospects for this additional resource can be assumed since with respect to requisite water pumping is required for safety reasons.
Maximum height estimation for mine waste dumps by S. Chai . . . . . . . . . . . . . . . . . . . . . . . . . . . . . . . . . . . . . . . . . . . . . . . . . . . . . . . . . 579
The dumping height of waste dumps will increase gradually, which may induce sliding failure once the dumping height exceeds a critical value. Estimation of the maximum dumping height is crucial to the life-cycle use of a waste dump. In this study, the maximum dumping height is estimated based on the strength -reduction technique by numerical simulations. Good agreements was obtained between numerical results available in the literature and those obtained in this study, suggest indicating the reliability of the results
An improved pillar design methodology by K.V. Jessu, A.J.S. Spearing, and M. Sharifzadeh . . . . . . . . . . . . . . . . . . . . . . . . . . . . . . . . . . 587
Empirical pillar design methods are commonly used in the mining industry. However, the parameters are frequently unknown to the user or ignored. This can result in potentially serious pillar design strength overestimates. Laboratory tests and numerical modelling were used to understand the effects of orientation of pillars, blasting, and presence of discontinuities on pillar strength. The pillar design approach outlined in this paper can better optimize the pillar mining method by considering other generally ignored but important parameters, thus improving safety, productivity, and economic aspects
Application of MR and ANN in the prediction of the shovel cycle time, thereby improving the performance of the shovel-dumper operation – A case study by S. Dey, S.K. Mandal, and C. Bhar 597
Loading and hauling of ore and waste are the key operations of an open cast coal mine. The productivity of a mine can be increased by reducing the cycle time of loading equipment as well as utilizsing dumpers optimally. Developed models are validated by comparing the predicted data with actual field data. With the help of the best model for the prediction of shovel cycle time, the plausible fleet size is determined for optimal to utilise the shovel and dumper utilization optimally and to improve the performance of shovel–dumper operation.
Heat-constrained modelling of calcium sulphate reduction by L.A. Jordan and D. van Vuuren 607
A two-dimensional finite difference model has been developed to describe the reduction of kilogram quantities of dehydrated phosphogypsum contained in a vessel. The model is validated against experimental data. A sensitivity analysis indicated that, at the envisaged process conditions, the behaviour of the system depends much more on the rate of heat transfer than on the rate of the chemical reaction. The model demonstrated a significant increase in accuracy when the thermal conductivity was modelled to increase linearly with temperature rather than compared to assuming a constant value.


Perdefinition, the Journal of the Southern African Institute of Mining and Metallurgy publishes papers related to mining and metallurgy. The Journal publishes about 140 papers every year, with an approximately equal number of contributions related to mining and metallurgy. This edition is somewhat atypical, in that two of the seven papers are related to metallurgy, and five are mining papers. The two metallurgy papers originated in South Africa, specifically, Stellenbosch University and the University of Pretoria. The mining papers were all written outside South Africa. A Czech paper in this edition explores the possibility of using a closed underground mine as a source of service water. Before I started school, in the sixties, my family lived in Potchefstroom. There were regular visits to my maternal grandmother in Pretoria. The national road network was developed only later, and our route took us past a water discharge point of what must have been one of the large West Rand gold mines. I remember my father from time to time remarking on the torrent of discharge water. It will be interesting to read a review on South African efforts to extract underground water to counteract the effects of decanting of mine water, an issue that was somewhat contentious some time ago. Possibly, some contributions from the online conference on Mine-Impacted Water, held middle October, will also find their way in the Journal. The route from Potchefstroom to Pretoria also took us past mine dumps. It is only on skimming a second mining paper, from China, considering factors determining the maximum height of a mine waste dump that I realized that there is (and was) a scientific basis for the proximity of these dumps to a public road.
P. Pistorius University of Pretoria‘Many conversations about diversity and inclusion do not happen in the boardroom


people are embarrassed at using unfamiliar words or afraid of saying the wrong thing — yet this is the very place we need to be talking about it. The business case speaks for itself — diverse teams are more innovative and successful in going after new markets.’
Inga Beale, former CEO of Lloyd’s of London

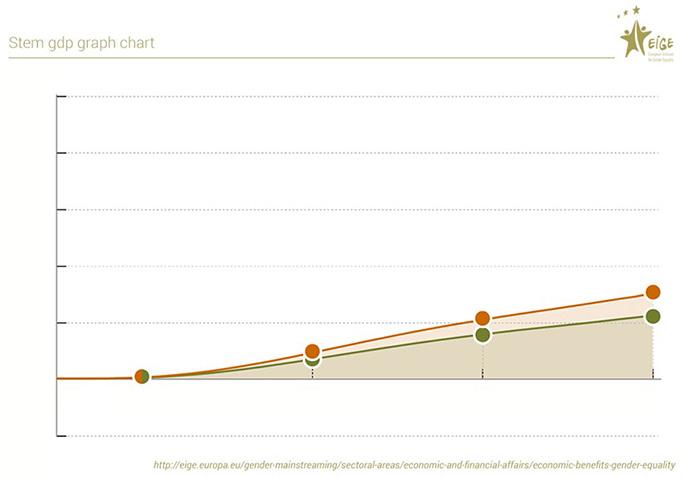
Simplyput, diversity is important because it leads to economic growth (European Institute for Gender Equality). Reducing the gender gap in STEM could help reduce skills gap, increase employment and productivity of women, and reduce occupational segregation, which will foster economic growth. Increasing the participation of women in STEM would contribute to an increase in EU GDP per capita by 2.2 to 3.0% in 2050. According to Christine Lagarde, head of the IMF, IMF research shows that adding one more woman to a company’s management will boost the return on assets by up to 13%. Another IMF report concluded that banks are more stable when they have more women on their boards.
From a neuroscience perspective, there is a scientific need for diversity, so that we may increase our collective creativity and our collective knowledge (different knowledge). The MIT Center for Collective Intelligence found that equal gender brings empathy, innovative solutions, and more ways of doing one thing. They found that diversity and psychological safety equals the highest intelligence. The C Factor (collective intelligence) will always be higher in a diverse group than the intellect of any individual. Neuroscience work by Dr Etienne van der Walt has also shown that creativity, problem-solving, and cognitive diversity cannot be achieved without cultural, ethnic, and gender diversity. We need this diversity to build our own human resilience.
Therefore, the message is clear. It is advantageous to have a diverse work force and to have female leaders, as well as male leaders, in managing positions. This is a balance, a bridge, a collaboration. Barbara Annis, CEO of Gender Intelligence Group (GIG), advocates the value of gender unity. We need both female and male leadership styles to survive, and that is why collaboration is so important. But if diversity and inclusion are so important, why are we not reaching our targets?
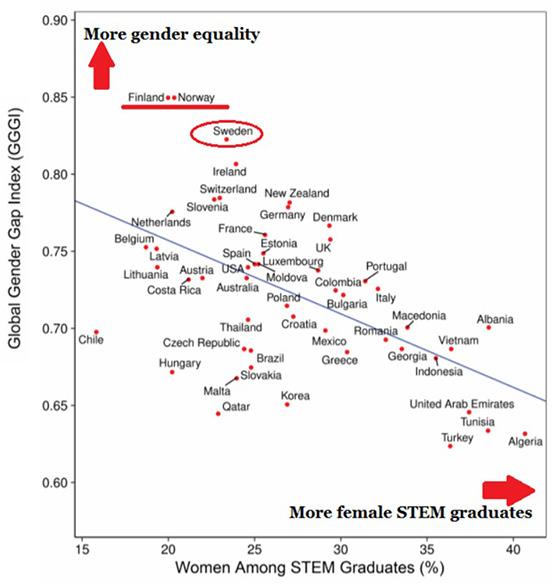
Why, in countries with equal education and opportunity, do women still choose not to enter STEM? This is known as the global ‘educational-gender-equality paradox’ (the more gender equality in a country, the fewer women in STEM). This paradox could have to do with the fact that women in countries with higher gender inequality are simply seeking the clearest possible path to financial freedom. And, often, that path leads through STEM professions. Experts do not have any clear answers; however, they did find that we should focus our efforts on those young, would-be STEM women and form programmes specifically aimed at creating positive environments for girls to interact with STEM ideas (Reinking, 2018).
We are all standing on a burning platform. Across the world, according to UNESCO, women with degrees in computer science represent only 40% of the total, and those with engineering degrees account for just 28%; cloud computing only 14%, and data and AI only 32%. It seems surreal, but women make up more than two-thirds of the world’s 796 million illiterate people (Facts & Figures | UN Women – Headquarters). When looking at South Africa, since 1996, when women were first allowed to work in underground mining, women have come to represent only 14% of the total mining workforce.
How do we go about positive change? Most literature shows eight key practices that everyone must commit to executing as part of their sustainable development goals for gender equality. The SAIMM already plays a role in each of these practices, by providing a platform for networking and dissemination of best practices in diversity and inclusion, by openly communicate drives for change, and by offering mentorship to young would-be STEM women.

Let’s take our own, personal test. If you look at your two closest friends, your square squad, are they the same gender, age, or ethnicity as you? These questions were asked at the SAIMM AGM and although some delegates are seeking diversity in their own lives, most of us are still duplicating.

This month I want to challenge everyone to cultivate a sense of belonging for all and to work on courage enablers so that we can diversify in our own lives as well.
Z. Botha President, SAIMMFor leaders, the challenge is to draw out the expertise and insights that come from different perspectives.
Kelly McDonald, author ‘How to Work With and Lead People Not Like You’
Affiliation:
1Department of Mining Engineering, Pontificia Universidad Catolica de Chile, Santiago, Chile.
2Department of Mining and Geological Engineering, University of Arizona, Tucson, USA.
Correspondence to: A. Anani
Email: angelinaanani@arizona.edu
Dates:
Received: 8 Mar. 2022
Revised: 12 May 2022 Accepted: 14 Jun. 2022 Published: October 2022
How to cite:
Soto, I., Anani, A., and Córdova, E. 2022
A discrete event simulation approach for mine development planning at Codelco’s New Mine Level.
Journal of the Southern African Institute of Mining and Metallurgy, vol. 122, no. 10, pp. 549 560
DOI ID: http://dx.doi.org/10.17159/24119717/2045/2022
ORCID: A. Anani https://orcid.org/0000-00019125-6877
E. Córdova https://orcid.org/0000-00029187-4461

The new caving megaprojects that are planned to go into production in the next decade have scheduled horizontal developments at very high rates, which are difficult to achieve. Research has been conducted that seeks to model the construction times for underground developments to determine the feasibility of achieving the planned rates. However, these previous attempts do not consider all the operational aspects that make up the mine development cycle. Here, we present a discrete event simulation (DES) model that individualizes each unit operation of the development cycle to determine the construction rates that new projects will be able to attain. The developed model was applied to the New Mine Level (NML) of the El Teniente Division (DET). The results indicate that it would be impractical to achieve the advance rates scheduled in the original plans if the unit operations of the mine continue to be executed using the status quo. The metres developed after six years in the sections analysed can be significantly improved by changing the maintenance strategy for the equipment (457 metres increase), orepass availability (194 metres increase), and the initial planning sequence (1 598 metres increase). It is recommended that the mine implements a flexible maintenance strategy, defines a strategy to ensure and increase orepass availability to contractors, and makes use of current simulation tools for a more robust development sequence planning.
mine development, mine planning, caving, OR in natural resources, discrete event simulation.
The depletion of near-surface deposits has pushed the mining industry to transition to the extraction of deeper orebodies by underground mining methods. An essential part of underground mine planning is underground development to access the orebody, which is complex and capital intensive. The geotechnical uncertainties and capital investment requirements result in long development periods, delaying production ramp-up and minimizing the operational flexibility. The rate at which horizontal excavations are developed is an important factor for mine development, since it controls the accessibility of the deposit and the meeting of production goals. However, compared to surface mining, little technological advancement has been made to incorporate the uncertainties surrounding underground development and exploitation in mine planning (Musingwini, 2016).
Additionally, the new caving megaprojects or ‘supercaves’ that will soon commence production are very ambitious in terms of their production goals. These goals relate directly to the kilometres of tunnels that must be developed to achieve them. This is the case for the New Mine Level (NML) of Codelco’s El Teniente Division, a mine located 120 km south of Santiago, Chile, which is used as a case study in this paper. The mine must excavate more than 113 km of tunnels to extend the mine life for at least 50 more years (Díaz, Rojas, and Vargas., 2019). Therefore, important aspects of the production planning exercise should focus more on development planning than on production itself, since production is a result of the development rate (Rocher, Rubio, and Morales., 2011). In this paper, we present a disaggregated approach, using discrete event simulation that takes into account equipment and orepass availability and micro-activities in the drill and blast sequence that affect mine development goals. Based on current practices, we evaluate the feasibility of achieving the planned future development rate at the NML. The research also accounts for the impact of outsourcing mine development to contractors and their access to resources such as ore-passes on long-term development plans. Finally, a feasible medium- to long-term plan is developed using Datamine’s Studio UG with EPS tools, and recommendation made to facilitate achieving the development goals.
As stated, technological advancement in underground mining still lags that in surface mining, including the application of discrete event simulation (DES). Many parameters in a mining operation, such as commodity prices, are characterized by high uncertainty (Singer and Kouda, 1999; Dehghani, and Ataeepour, 2012; Haque, Topel, and Lilford, 2014). Simulation has been used in short-term mine planning to better manage the risks of uncertainty (Paravarzar, Pourrahimian, and AskariNasab 2021). DES is a method that models systems through a sequence of well-defined events, which has proven to be a very useful tool in decision support for the mining industry (Basu and Baafi, 1999; Vagenas,1999; Ahmed, Scoble, and Dunbar, 2014; Greberg et al., 2016; Dindarloo, Osanloo, and Frimpong, 2015) for both existing and future mines. Skawina et al., (2014) compared the use of mechanical excavation and drilling and blasting for underground tunnel development using DES. Similar to our study, their research proves that tunnel development using multiple development faces simultaneously increases performance significantly. The focus of their work, however, involved the comparison of tunnel excavation methods and lacked important factors of mine development planning such as resource availability. Manríquez, Pérez, and Morales (2020) developed a combined mixed-integer linear programming model and DES model to generate optimal short-term production schedules for a bench and fill mine. They conclude that a better mine plan is obtained by accounting for uncertainty using simulation. Musingwini (2016) explored the application of optimization algorithms in underground mine planning. He noted the difficulty in the use of exact methods to solve complex underground planning problems optimally. To overcome challenges in optimizing underground mine planning, he recommends the integration of stochastic optimization in development layout, as demonstrated in this research.
The most common application of DES in underground mines is the selection of equipment to maximize productivity (Runciman, Vagenas, and Baiden, 1999; Salama, Greberg, and Schunnesson, 2014; Park, Choi, and Park, 2016). Salama, Greberg, and Schunnesson, (2014) evaluated the impact of the combinations of trucks and LHDs and equipment sizes on mine productivity using DES. Park, Choi, and Park, (2016) used DES to optimize the number of trucks dispatched to three loading points in a truck-loader haulage system that maximizes productivity.
Greberg et al., (2016) used DES to compare the use of orepasses and trucks for the transport of ore in deep underground mines. Their results indicated that trucks could be economically viable at levels where the costs of managing an orepass become too high. Anani and Awuah-Offei (2017) also used DES to match shuttle-car haulage equipment to the continuous miner (CM) in different sections of a coal panel based on the CM cycle time. They determined that in sections of the coal panel, fewer shuttle cars can be used to extract the coal to achieve the same level of productivity. Anani et al., (2019) applied DES to optimize the extraction parameters in a bord and pillar coal mine. They maximized productivity by optimizing the cut-out distance, fleet size, and panel dimensions of the production system.
Skawina et al., (2018) used DES to evaluate the effects of orepass loss due to failure on loading, hauling, and dumping operations and productivity. The authors also determined the minimum number of orepasses needed to maintain production rates. Similar to our study, they conclude that orepass availability
has a significant impact on the production rate. Although their work does not focus on mine development, the impact of orepass availability on production rate is relevant. Salama et al., (2017) used DES combined with mixed-integer programming to evaluate the net present value (NPV) of an underground operation based on the copper price and increased costs as the mining rate increases. The authors conclude that at greater depth, it is beneficial to increase the mining rate during times of high copper prices, even with an increase in operational cost.
Few works can be found that apply simulation to horizontal tunnel development in small-scale underground mines (Leiva, 2015; Navarro 2012). They do not consider key factors such as the ability to work on multiple faces with a work crew and critical cycle operations such as roof support in the drifts. Previous research does not evaluate the impact of changes in critical operations management on the key performance indicators in mine development. Therefore, we develop a DES model that allows the identification and understanding of the critical operations in the horizontal development cycle in large underground mines. We consider all the unit operations of the cycle and the possibility of working multiple faces with a work crew. We also compare the impact of the original equipment manufacturer (OEM) and a flexible load-haul-dump (LHD) equipment maintenance strategy on the development rate. Lastly, we investigate the effect of orepass availability on the development rate and propose a new development plan that the mine can realistically achieve.
In the following sections, the proposed simulation model is detailed and subsequently applied to a case study of mining sections in El Teniente’s New Mine Level (NML). The results obtained from the simulation are validated with historical data from sections currently in operation at DET, and critical unit operations of the development cycle are identified. Experimental analysis is performed that incorporates changes in the management of critical unit operations and the results compared to existing and planned development rates. Finally, the conclusions and recommendations for future work are presented.
The case study pertains to the El Teniente Division (DET), an orebody exploiyed by a set of different underground projects through caving methods producing around 160 kt/d and a small open-pit operation (20 kt/d) on the surface. The orebody caves naturally after undercutting its base, and the caved material is recovered using drawpoints (Laubscher, 1994). El Teniente mine has been operating since 1904 and produces both copper anodes and copper cathodes. The mine is positioned as the most productive division of Codelco, reaching a production of 459 744 of fine copper in 2018 (Codelco, 2020). This production also positions it as the third most productive mine in Chile, surpassed only by Escondida and Collahuasi (Cochilco, 2019).
Production in Esmeralda, Dacita, Recursos Norte, and Diablo Regimiento, the current underground mines of DET, cannot be maintained through the ensuing decades due to depletion of the reserves. As a result, Codelco has developed a structural megaproject called New Mine Level (NLM), which aims at developing new productive levels at a greater depth than those currently exploited. By doing so, it will increase DET’s copper reserves by more than 2 Gt and thereby extend the life of mine by more than 50 years. This megaproject consists of four productive sections: Andes Norte (North Andes), Pacífico Sur (South Pacific),
A discrete event simulation approach for mine development planning at Codelco’s New Mine
Andes Sur (South Andes), and Pacífico Norte (North Pacific). These sections are expected to enter production in the years 2023, 2030, 2034, and 2038 respectively.
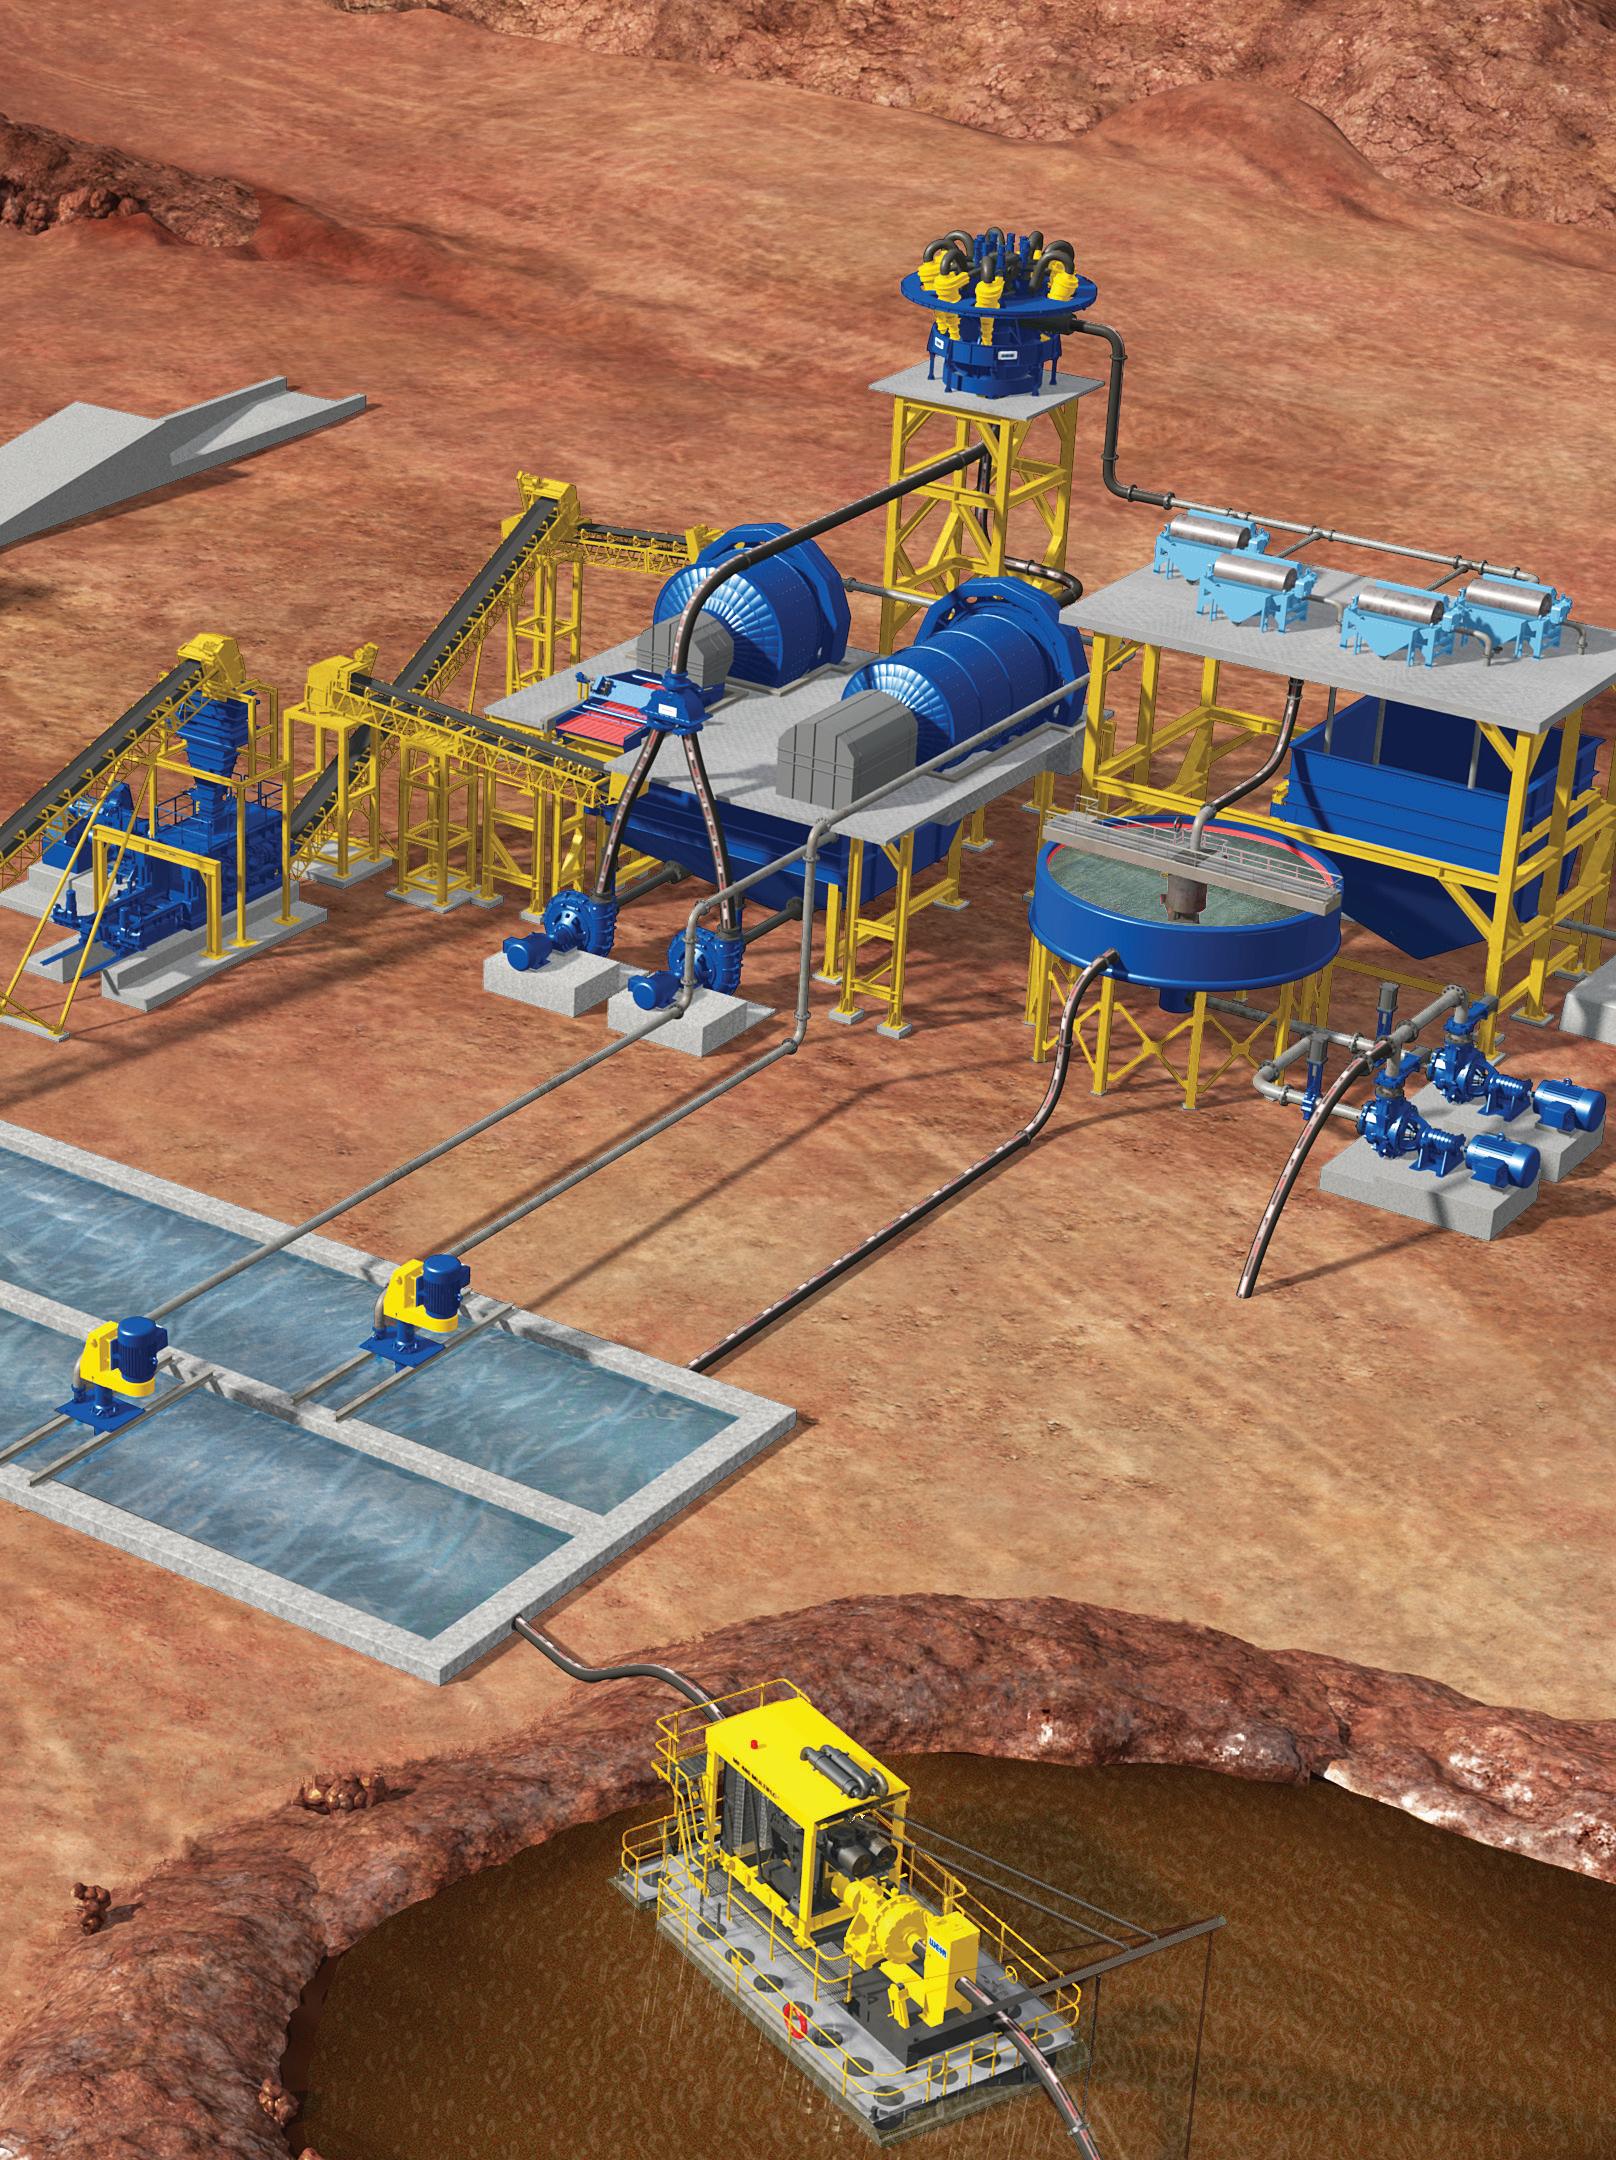
To make production from the NML sections viable, each section must have an undercut level, intermediate transport level, drainage level, ventilation level, and production level. The latter constitutes the largest number of developments. Therefore, the focus of this paper will be on planned developments at the production level. Figure 1 shows an example of an undercut level, where the drilling and loading equipment will undercut the ore deposit; production level, where the LHDs will load the ore from the drawpoints and dump it into the orepasses; and finally the intermediate haulage level where the trucks will circulate to collect the material from the production level and dump it into the orepasses. The orepasses are connected to the conveyor belt of the main haulage system. All these levels belong to the Pacífico Norte (hereon referred to as North Pacific) section of the NML.
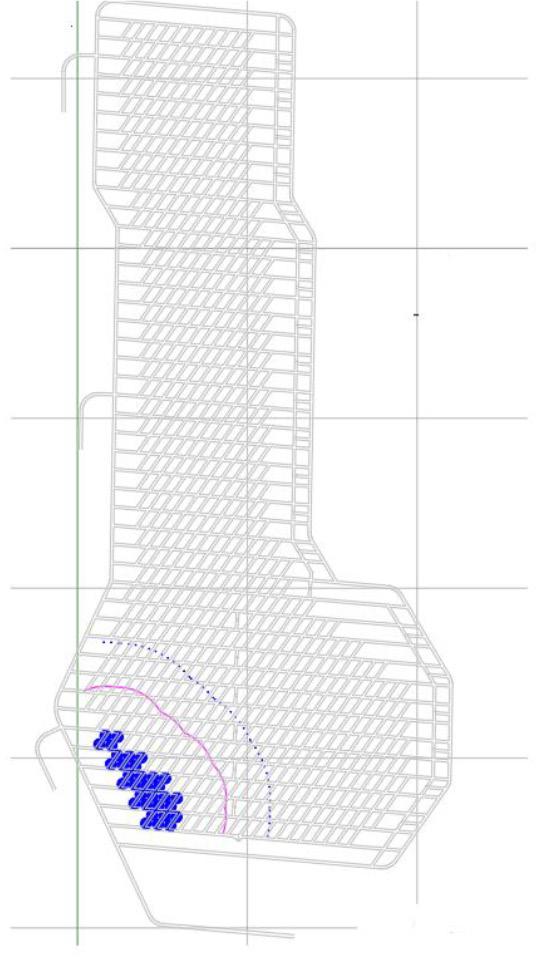
El Teniente mine has within its safety policies provisions to minimize the exposure of equipment and people in the so-called transition zone (TZ), which is defined as ‘That area where the state of the stress is increasing and is under continuous changes, and which generates stress conditions considerably greater than the in-situ condition’ (Lobiano, 2016). This area of increased stress due to mining and developing caves is the abutment stress zone, which moves through the footprint ahead and follows the undercut face. The stresses in this area can be 1.5 to 2 times greater than the main in-situ stress, which in the case of the NML is estimated at around 50 MPa (Hormazabal et al., 2014). DET established a rule to ensure that the development is always ahead of the TZ and leaves a margin of safety. This rule must be respected for each year of mine production. The rule states that ‘Between the transition zone (TZ) and twice the area that it encompasses (2TZ), all tunnels must be developed.’ Therefore, to generate the transition zone, the most external production points of each year must be taken to generate a circumference with a radius equal to the TZ, which for the North Pacific section is 80 m. The process must be repeated, this time taking circles with a radius of 160 m. Figure 2 shows the boundaries of the TZ and 2TZ
for the year 2038. In order to comply with the rule set by DET, all tunnels below the dotted blue line must be developed by the end of the year 2038. The main idea of the TZ is to have the minimum number of workers in the ‘increased stress’ zone; therefore, the developments must be advanced as much as possible before the influence of the abutment stress from the undercutting face reaches these areas.
Mine design or AutoCAD software is used by the mine, taking as input the advance plans of the TZ and 2TZ of each section to obtain the sequence of the horizontal developments. Each segment drawn on the AutoCAD plans corresponds to a horizontal drift at scale. The use of this software is justified since it helps to document changes in construction scheduling (Memon, Majid, and Mustaffar, 2006) and communicates the planning to be carried out very effectively. The plans can be used by workgroups from other areas that do not have knowledge of specific software.
However, AutoCAD has limitations; for example, once the planning process is finished, there will be only one scenario to be evaluated (Ramírez, 2020). That scenario is not necessarily optimal since it is based only on the planner’s own criteria. Therefore, the use of specialized software such as Datamine Studio UG and EPS tools is recommended. Although none of these tools generates optimal plans, they do allow the simulation and evaluation of multiple scenarios quickly and reliably, and therefore are better for choosing a more robust scenario than the initial case. The scenarios consider different precedence rules for plannable activities (MacNeil and Dimitrakopoulos, 2017), on which the simulation model detailed in the following section can be run.

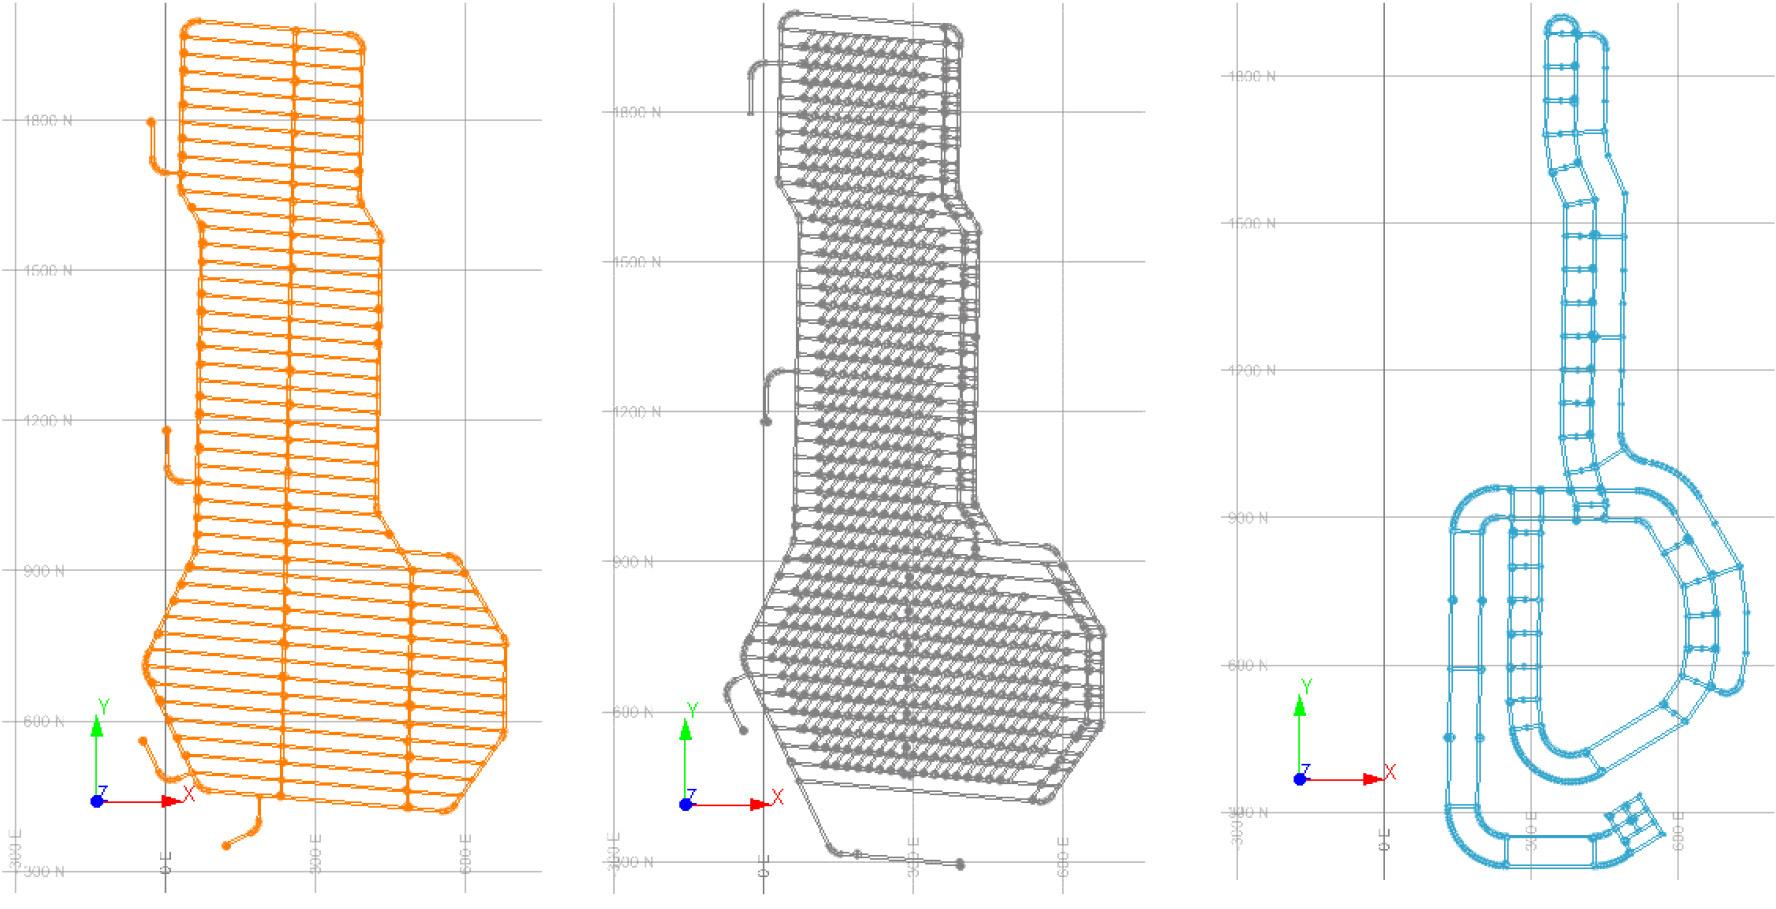
The North Pacific section planning is developed under the assumption that construction starts in 2033 with an open development face, three active faces in the year 2034 and between the years 2039 and 2060, and finally, five active faces between the years 2035 and 2038. An average advance of 45 m per month per face is planned based on these assumptions. In Figure 3, the red coloured segment corresponds to the first development to
be carried out in 2033 in the production level of the North Pacific section. From the figure, the restriction imposed on the 2TZ is satisfied since the development of all the tasks that are below the blue segmented line is planned.
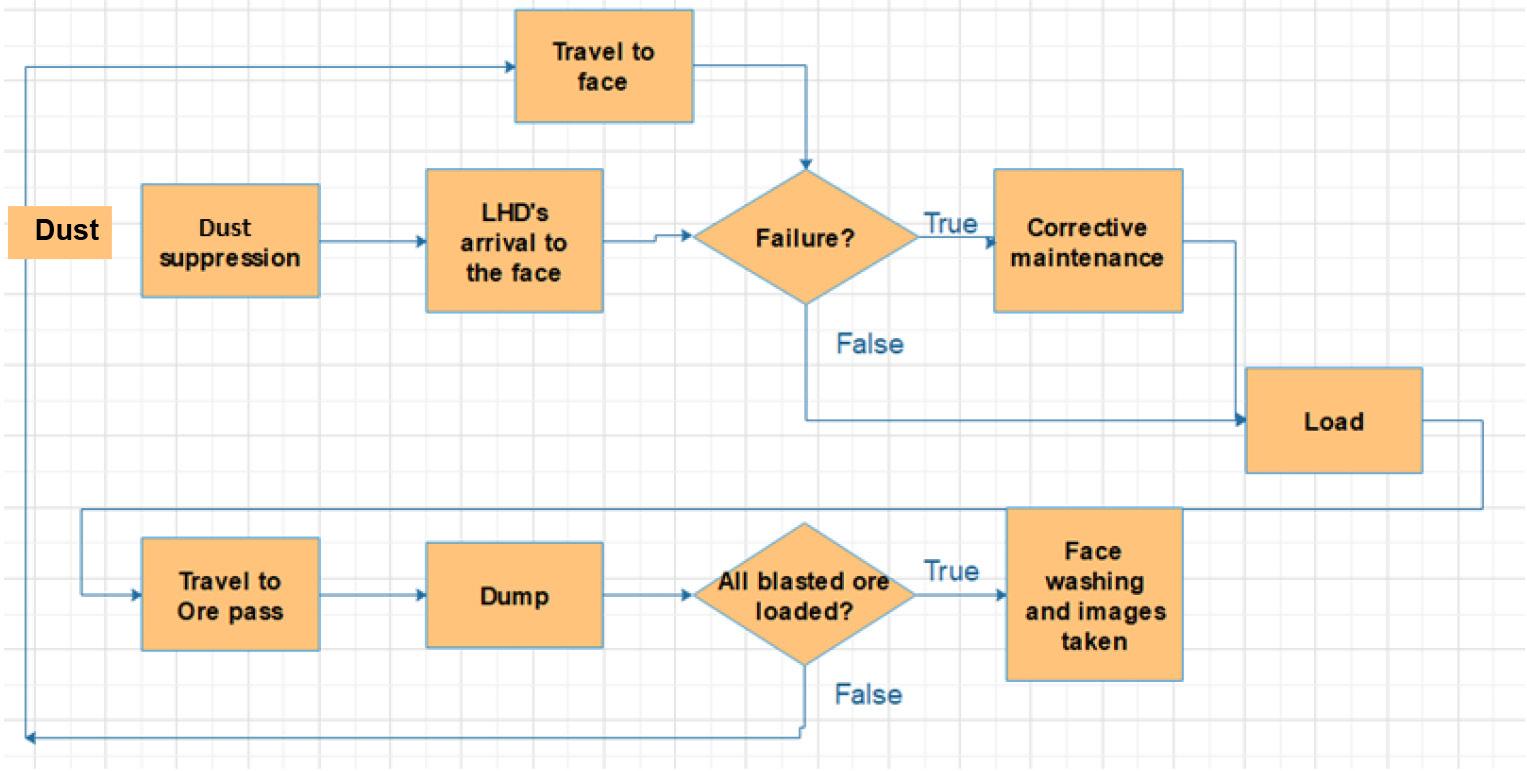
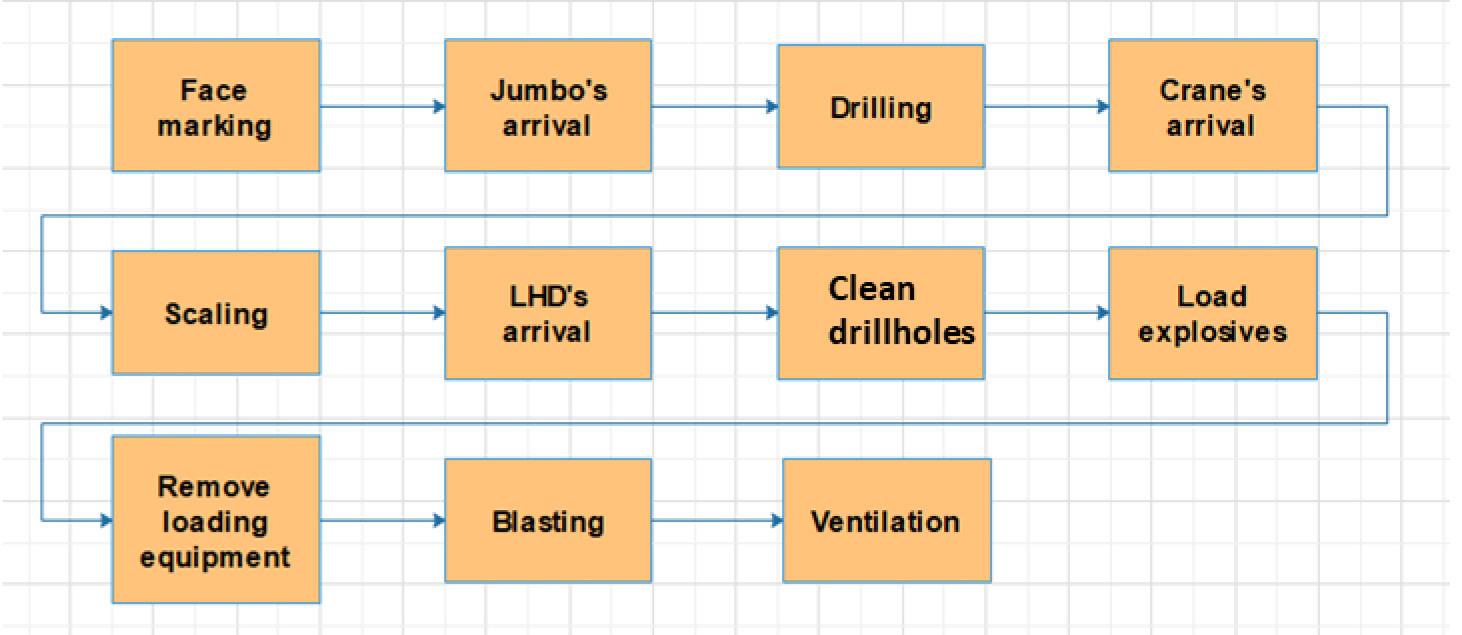
The system to be modelled corresponds to a classic drilling and blasting cycle. The complete development cycle consists of many stages, which can be grouped mainly into muck extraction, ground support, drilling of blast-holes, loading of explosives, blasting, ventilation, and scaling. Muck extraction (Figure 4) corresponds to all the activities necessary to transfer the recently blasted material from the face to an orepass or dumping point. An LHD of 9 cubic yards is used for this task. It is important to note that the availability of the LHD may vary due to failure resulting from hard use and lack of proper maintenance. This will directly affect the equipment performance and consequently the overall cycle (Balaraju, Govinda, and Murthy 2018a).
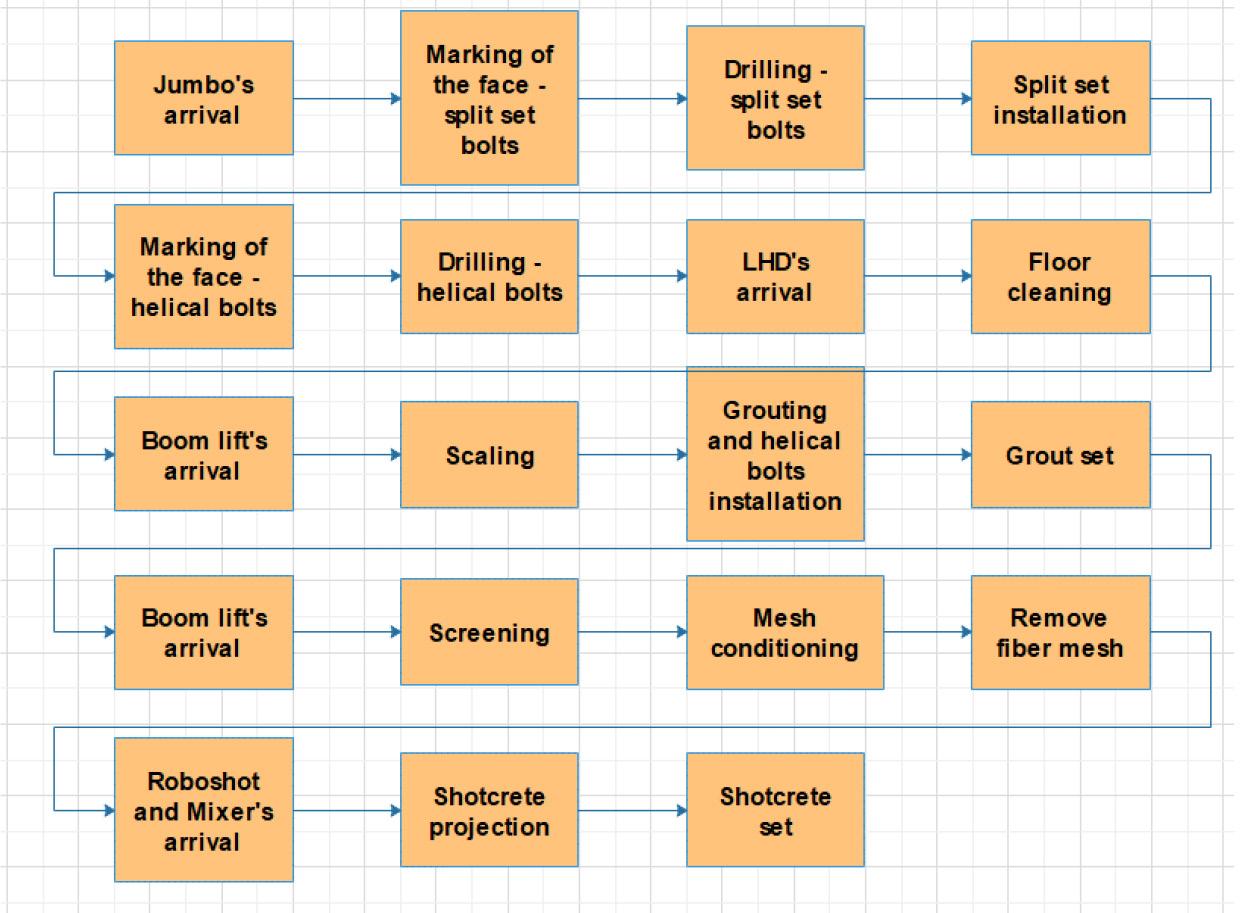
Ground support includes all the activities required to provide support and stability to the developed tunnels and thus minimize the risk of damage to equipment and injuries caused by rockfalls. The resources required for these activities are a crane, jumbo, LHD, roboshot, and mixer. Support of the face begins with the marking of support holes. The jumbo drills the support holes for the installation of the helical bolts and split-set bolts. The crane then enters the face to grout the bolts with a mixture of water, cement, and additives. Once the bolts have set, the crane with a boom lift enters the face for conditioning and installation of the support mesh. The last step in ground supportis the projection of shotcrete using the roboshot equipment. The sum of all these activities constitutes the longest time in the mining development cycle. Figure 5 shows all the necessary support activities.
Blast-hole drilling is carried out by a twin-arm jumbo, which is responsible for drilling the face according to the previously designed blast pattern. For the case study, each blast-hole will have a length of 3.2 m. The loading of explosives requires the use of the lifting crane to load each of the previously drilled holes with the corresponding explosive according to the defined blast pattern. Once each hole is loaded and connected, the shift manager acquires authorization to perform the blasting. Scaling is performed to remove loose rocks from the roof and the face. Unlike other activities, scaling will be necessary whenever loose rock is found. Therefore, it is carried out throughout the development cycle. This activity is considered to be always
performed after muck extraction, bolt drilling, blast-hole drilling, and blasting (Figure 6). The blast face is typically accessed 30 minutes after a blast due to ventilation regulations.
Data was collected for five days in a section currently in production at El Teniente to fit the execution times of each of the unit operations with a probability distribution. Raw data from similar studies in productive sections of DET (Ccatamayo, 2017; Chami, 2012) was used for validation during distribution fitting to select the appropriate distributions. It should be noted that mine production parameters such as productivity (normally distributed) typically follow known probability distributions.
The Arena® Input Analyser software was used to fit the data to different statistical distributions. Input Analyser considers the distribution with the least squared error as the best fit. The Kolmogorov–Smirnov test, goodness of fit test, and visual analysis were used to evaluate the quality of fit. The distributions and the parameters obtained for the unit operations are presented in Table I, and those for the LHD cycle in Table II. The distributions were selected based on data type, the number of data-points, and suitability to the variable type (Rockwell Automation, 2019).
Among the theoretical distributions (Weibull, lognormal, and exponential distributions) used to model equipment failure, the Weibull distribution is the most versatile and better represents the life-cycle of the LHD equipment (Balaraju, Govinda and
Variable studied Distribution Parameters
Ventilation Beta 100 + 44 * BETA (0.501, 0.601)
Gas suppression Beta 15 + 26 * BETA (0.526, 0.501)
Missed hole checking Beta 15.2 + 6.78 * BETA (0.793, 0.636)
LHD arrival Erlang 8 + ERLA (0.968, 2)
Face washing and images taken Triangular TRIA (21,30,38.33)
Jumbo arrival Expo 17 + EXPO (0.69)
Marking of the face - split set Triangular TRIA (6.38,13.6,14.75)
Drilling - split set Triangular TRIA (22.18,26,28.48)
Split set installation Triangular TRIA (14.4,17.35,19.63)
Marking of the face - helical bolts Triangular TRIA (10.45,.18.63,19.95)
Drilling - helical bolts Weibull 107 + WEIB (34.8, 0.794)
Floor cleaning Triangular TRIA (13.73,15.52,20.53)
Boom lift arrival Normal NORM (11.1, 1.37)
Scaling Triangular TRIA (21.83,25.28,40.67)
Grouting and helical bolt installation Gamma 90 + GAMM (35.9, 0.475)
Screening Expo 100 + EXPO (14.8)
Mesh conditioning Triangular TRIA (77, 83.22, 89.98)
Remove fibre mesh Triangular TRIA (6.45,8.5,9.48)
Roboshot and mixer arrival Triangular TRIA (14.22,14.97,15.53)
Shotcrete projection Beta 22 + 16 * BETA (0.543, 0.783)
Shotcrete set 120
Face marking Triangular TRIA (14.23,15.06,21.35)
Shot drilling Normal NORM (147, 10.5)
Crane arrival Normal NORM (9.23, 1.79)
Lifters cleaning Triangular TRIA (13.8,14.88,17.67)
Loading explosives Expo 72+EXPO (10.2)
Remove loading equipment Triangular TRIA (9.22,10.17,11.72)
Blasting Triangular TRIA (5.47,6.18,7)
Variable studied
LHD loading time
LHD dumping time
Distribution Parameter (s)
Normal NORM (58.5, 9.3) (s)
Gamma 8.5 + GAMM (1.44, 6.18) (s)
Travel speed loaded Weibull 0.71 + WEIB (0.782, 2.4) (m/s)
Travel speed unloaded Weibull 1.15 + WEIB (1, 2.45) (m/s)
Murthy, 2018b). Historical data from an LHD of 7 cubic yards and an LHD of 10 cubic yards was taken and adjusted to a Weibull distribution to model the equipment failure rate to simulate the LHD failure. The failure parameter is defined as the number of failures per unit time that can be anticipated (Balaraju, Govinda and Murthy, 2018b). The equipment failure rate fitted with the Weibull distribution to historical data follows Equation [1].
where ß = 3.264 is the shape parameter, t is the hours of use of the LHD, and ηi is the characteristic life of the LHD, which depends on the number of overhauls i, following Equation [2]:
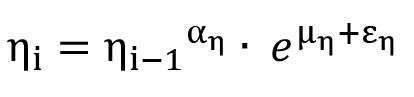
[2]
where aη = 0.371 and μη = 2.875 are drift parameters, and e η is Gaussian noise with mean zero and standard deviation s η = 0.095.
[1]
The failure of the LHD with hours of use in an interval dt occurs when the condition indicated in Equation [3] is met:
After every maintenance overhaul, t returns to zero, reducing the probability of failure compared to that before maintenance was performed. An LHD with i + 1 overhauls and t hours of use will have a higher probability of failure than an LHD with i overhauls and the same t hours of use, since
is more likely.
The Arena simulation software (using discrete event simulation) presents a flexible modelling framework with a hierarchical structure to analyse the impact of changes to a system. A valid model can be used to conduct simulation experiments and predict the performance of the system based on key performance metrics (Rockwell Automation, 2019).
The objective of the simulation is to develop a model capable of predicting real development rates obtained in the current production sections of DET. Arena’s high-level modelling modules were used to simulate the mining system following the operational logic in Figures 4, 5, and 6. The main equipment used in the mining cycle, such as the crane, roboshot, mixer and jumbos, and the orepasses, were modelled as resources. The progress throughout the mining cycle was modelled as an entity, and the LHDs for muck extraction were modelled as transporters. The input data for this model corresponds to the distributions listed in Table I in the previous section. The shift system was modelled for 10 hours, with two shifts per day.
One thousand simulations were run to simulate development at the production level for the first six years. A trial-and-error process based on the stability of the half-width was used to determine the optimum number of simulation runs. Using 100 simulations, the half-width obtained was 1.35% of the mean value. Since the computational cost to simulate this model was only a few minutes, it was decided to use 1000 simulations, obtaining a half-width of 0.46% over the mean value. The simulated time in each simulation was six years, as this is the planned time it takes to incorporate the first drawbell. Therefore, it can be assumed that during these first six years of construction, there are no operational interferences with Codelco’s production LHDs. There are only interferences with Codelco’s development crew, which is reflected in the availability of the orepass.

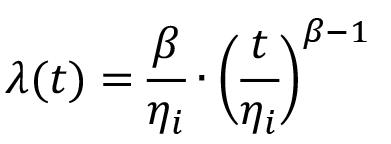
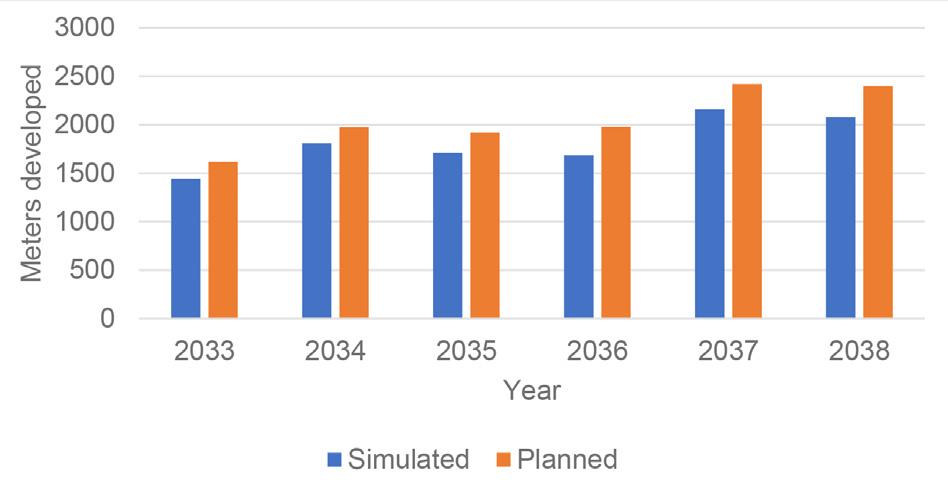
The system modelled was of the production level of the Dacita project in El Teniente, and the model was validated with the data collected from this area. The advances in this section were 3.1 m with a tunnel section of 4.1 x 3.9 m². The average distance between the draw-points and orepasses was 325 m. The simulation results (Figure 7) showed that the model predicted the construction of
1,088.11 m in a single year, 2.31% less than the 1 113.86 m developed in the same period. Given that the difference is less than 3%, we determine that the model is valid for further experimentation. Figure 7 shows the distribution of results (metres developed) obtained from the simulation.
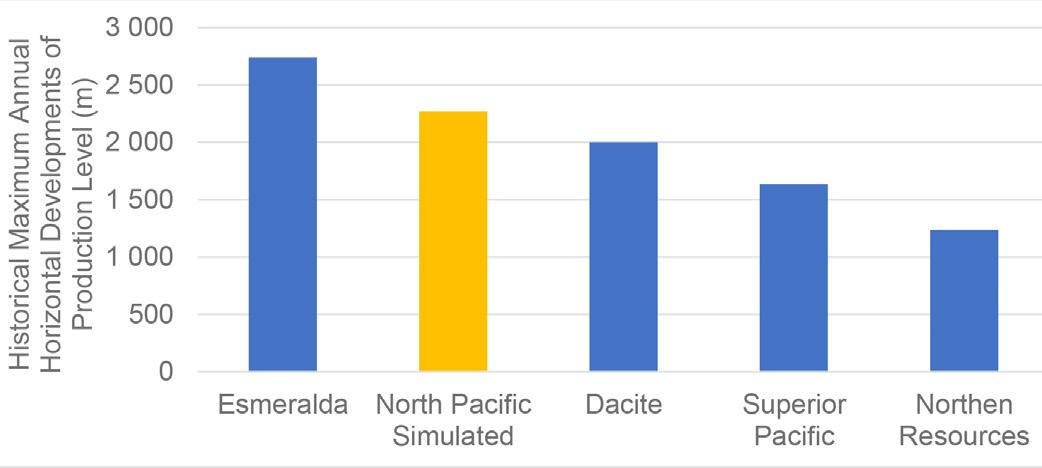
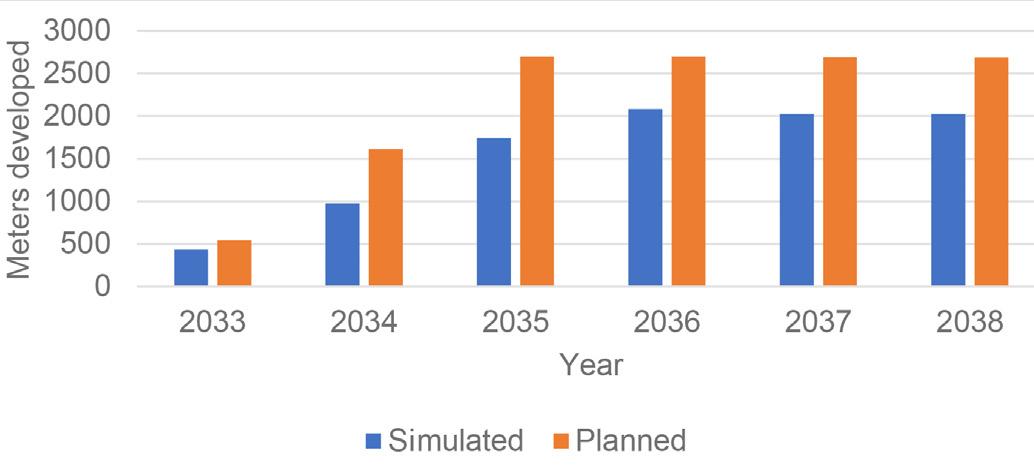
The results of the simulation are compared to the mine development plan for the North Pacific (planned) section (Figure 8) and to the sections of DET (existing) currently in production (Figure 9). From Figure 8, it can be seen that the simulated result is less than the planned development rate as the years pass for North Pacific (future development). This is because the simulation model considers an increase in equipment failure rate due to the accumulated hours of use, while the mine’s long-term plan did not consider this aspect. Figure 8 shows the maximum performance achieved by the simulation, which occurs in 2038 with 2085 m and is compared with the maximum annual performance achieved in each of the most relevant mine sections in DET. Based on current development rates, only one section (Esmeralda) of DET has a higher development rate (in metres per year) than that planned for the North Pacific project (Figure 9). This was only possible because the Esmeralda project had already been in production for several years, and therefore much of the section was already developed, which enabled working with multiple fronts and crews.
According to Ccatamayo (2017), one of the most inefficient operations in the development cycle of El Teniente mine projects is muck extraction. Since much of the time used to carry out this work is non-productive time, it does not contribute to the advancement of the face. As a result, three scenarios are proposed for the experimental analysis, which seeks to reduce non-contributory and non-productive times. In so doing, muck extraction becomes more efficient, thereby improving the development cycle time.
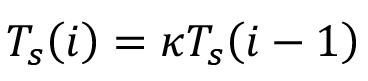
The first experimental scenario involves studying the effect that a change in the maintenance strategy for the LHD equipment has on the development rate. Currently, the strategy is to carry out preventive maintenance on the equipment every 250 hours, following the OEM’s recommendations, and to carry out all necessary corrective maintenance whenever the equipment fails while in operation. The alternative strategy to be evaluated seeks to decrease the interval between preventive maintenance, to take advantage of the fact that once maintained, the equipment is in better condition than before, even if not as good as it was originally (Balaraj, Govinda, and Murthy, 2018a, 2018b; Soto and Pascual, 2018). In this case, the preventive maintenance interval for LHD equipment will be reduced to a constant rate κ, following Equation [4].
where i is an index that indicates the number of overhauls that the equipment has undergone and T s is the recommended interval between preventive maintenance overhauls. Different scenarios were generated for κ values of 90%, 80%, and 70% in the simulation. The remaining input data stayed the same.
In DET, the horizontal development is not carried out by Codelco, but is outsourced to contractors. This is to focus Codelco’s efforts only on the production of ore and not on the preparation of the mine. The parallel work of Codelco and the contractors at the production level generates operational interferences since both tasks must share accesses, routes, and orepasses. Following the line of prioritizing production, the production level orepasses are mostly destined for mineral production, and only a few orepasses are assigned to the contractor to remove the muck. The purpose of this experiment is to study the effect of orepass availability to the contractors for muck removal on the development rate.
The input data used in the model is the same as for the base case, changing only the probability of available orepasses from 92%, which is the average value calculated in the current productive sections of DET, to 83% and 100%. These values correspond to the minimum and maximum values of orepass availability in the same section, respectively. Table III shows the average distance between the drawpoint and the dumping point when the assigned orepass is available and when it is not. It is expected that as the distance between the alternate route and the original route increases, there will be a greater impact on the developed metres as the availability of the orepass varies.
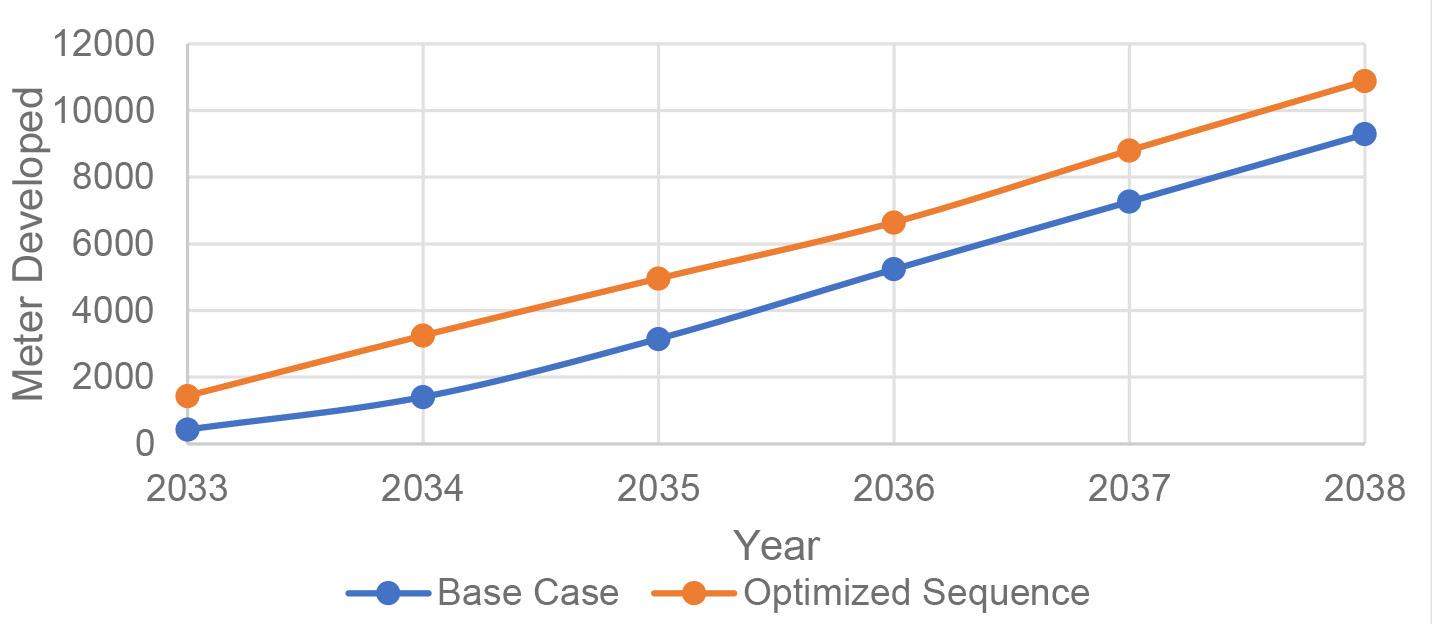
This experiment aims to study the effect of using a newly optimized development sequence on the annual development rate. Datamine Studio UG and EPS software were used to design and generate this sequence, which allows simulating and evaluating multiple developments and construction sequences quickly and easily. This new sequence considers starting the developments in the year 2033 by entering through two different accesses, and then between the years 2034 to 2036, the ability to open and work in three faces simultaneously. In 2037 and 2038, the number of faces that can be opened and worked will increase to five. Between the years 2039 to 2056, four active faces can be maintained, eventually decreasing to a single face from 2057 to the end of the development. This sequence is considered optimum since it
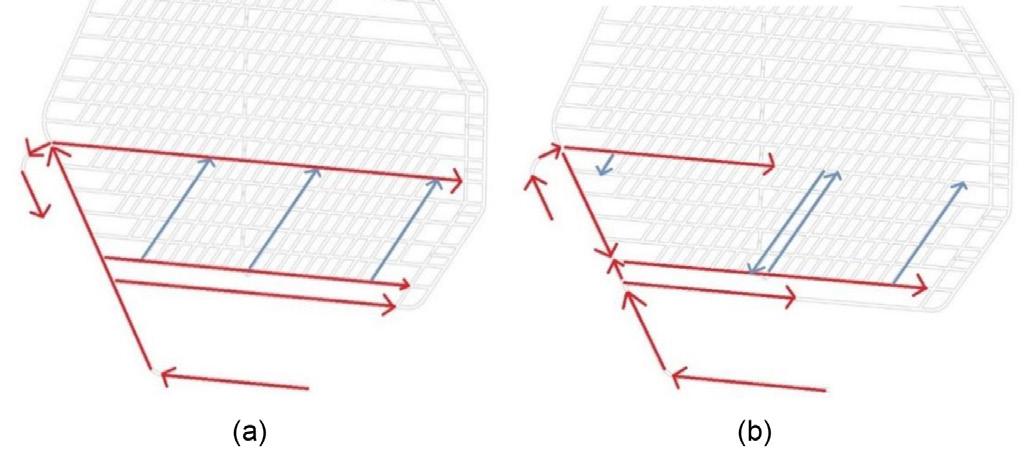
Figure 10—(a) Comparison of base case development sequence vs (b) optimized sequence
Year Distance when orepass is available (m) Distance when orepass is unavailable (m)
2033 700 700 2034 502 1100 2035 333 1036 2036 488 1003 2037 466 1003 2038 1076 1200
reduces the average transport distance between the drawpoint and the orepasses while meeting operational requirements. It also allows the LHD equipment to work in a range of distances where it is more efficient. Furthermore, it allows multi-face work to be started from the first year of development, increasing the efficiency and effectiveness of the work. Therefore, it is expected that implementing the new sequence will increase the metres developed annually compared to the planned design. In Figure 10, the red arrows indicate the development direction of the main accesses, and the light blue arrows the development direction of the extraction drives.
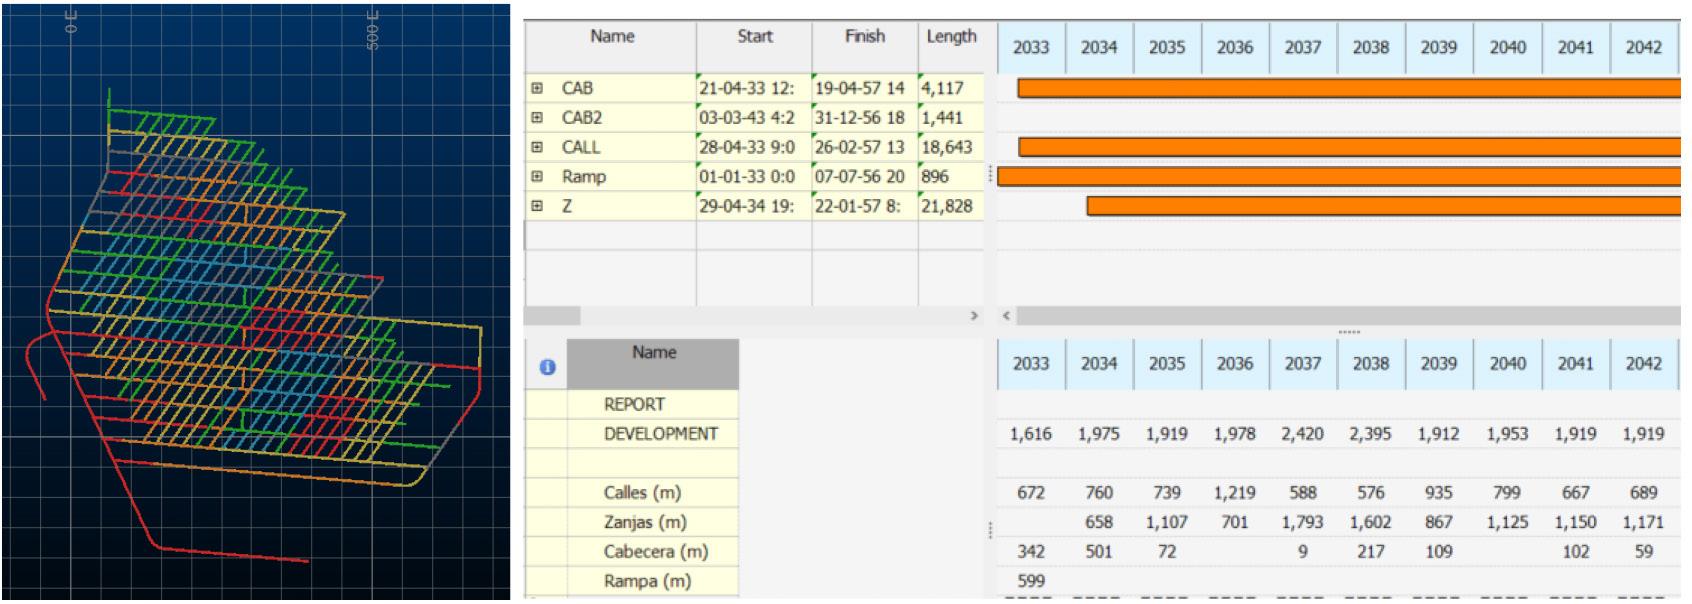
The Gantt chart (Figure 11) details the new sequence planned for the next ten years. The figure shows that in the year 2033, the optimized sequence is able to develop more than 600 m of extraction drive, which gives more flexibility in subsequent years by providing better routes that shorten the average hauling distance. Table IV shows the difference between the year-toyear mean distance for the planned sequence and the optimized sequence.
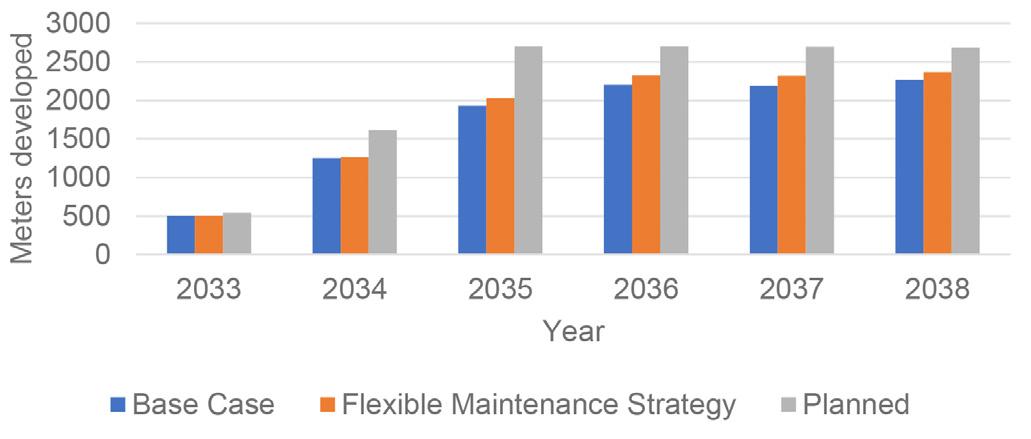
Table V shows the number of preventive and corrective maintenance actions and the corresponding downtime, derived from the simulation according to the parameter κ used. Using the proposed maintenance strategy with a parameter of κ = 80% gives the best results. Figure 12 compares the linear metres built between the OEM and the flexible maintenance strategy. It is noteworthy that after six years, the alternative strategy (κ = 80%) has developed 457 m more than the base case, which corresponds to an increase of 4.42%. This reduces the difference between the simulated and the planned development rate from 20% to 16%. Figure 12, illustrates the benefit of the flexible strategy in the later
A discrete event simulation approach for mine development planning at Codelco’s New Mine
Average
Year
2034
2035
2036
2037
2038
years. In later years, the characteristic life of the LHD is shorter, which causes it to fail more frequently, therefore more frequent preventive maintenance helps reduce the failure rate.
The simulation results indicate that as the availability of orepasses for muck extraction increases, the duration of the global muck extraction cycle decreases by an average of 13 minutes per cycle, while the duration of the complete development cycle decreases by 5 hours. Figure 13 compares the linear metres achieved year-byyear between the base case and the scenarios with 83% and 100% orepass availability. After six years, by increasing the availability of the orepass to 100%, it is possible to advance 194 more metres. Although this result can be considered of little significance, it should be noted that less orepass availability will mean longer mucking times. This will negatively affect the development
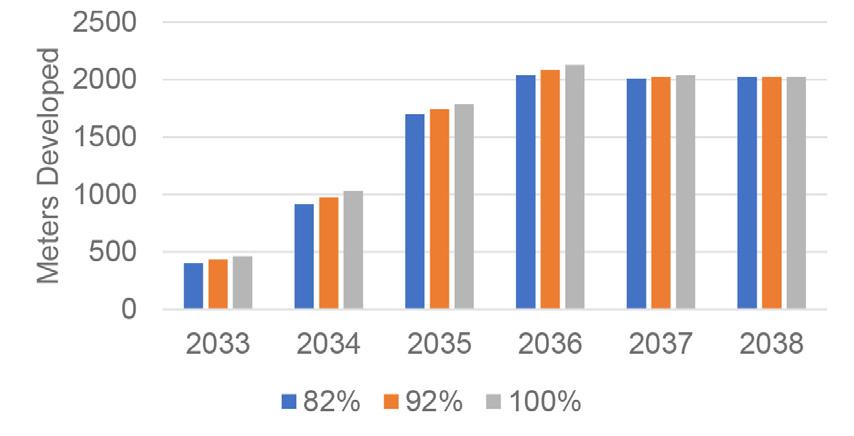
Figure 12—Simulation results
data),
Figure
this material will have to be transported to further dumping points. The benefit of 100% orepass availability has already been seen in the mines currently in production at El Teniente. This, however, has required a greater planning effort by the Codelco. Figure 13 shows the probability density function for the three scenarios. It can be seen that the greater the orepass availability,
the lower the variability presented since it decreases the probability that the LHD will have to travel greater distances to take an alternative route.
Figure 14 compares the linear metres achieved year-by-year between the base case (currently planned sequence) and the newly generated planning sequence. After six years, the new sequence enables the construction of 10 886 metres of tunnels, which is 1 598 metres more than the base case. This benefit is mainly obtained in the first year because the optimized sequence manages to work on an additional face. In the latter years, the optimized sequence performs better even when it works with the same number of faces as the base case, which is explained by the shorter distance between the drawpoint and orepass that is obtained each year. The new sequence is less demanding with the metres required for the first six years of development and better manages the use of work crews. Therefore, compliance with the planned development is more probable (Figure 14).
Estimating the optimal time to perform preventive maintenance depends on striking a balance between production loss due to downtime and unavailability of the equipment during maintenance. This is reflected in the simulation results obtained at a κ value of 80% outperformed that at 70%. Although using a flexible maintenance strategy increased the orepass availability, and the optimized development sequence increased the development and the probability of achieving the planned development rate at the Pacific North section, it is important for the mine to perform a cost-benefit analysis prior to implementing the research findings. Based on the study of the mine, the authors, however, believe that the mine has the resources to carry out the recommended plans, especially since the existing planned development would require more resources to achieve it. The use of a more advanced tool such as Datamine Studio UG and EPS allows for quick changes in the optimal development sequence and would enable as a fast decision-making tool in the case of unwanted incidents such as collapses and temporary loss of access to productive areas.
A simulation model of the development cycle for the El Teniente New Mine Level was presented. The model considers the uncertainty in the execution times of each unit operation of the cycle and allows the evaluation of the development rate through multiple faces. The New Mine Level is a megaproject of DET, the world’s largest underground copper mine. The operation aims to keep the Division’s copper production at 137 000 t/d through deeper mining of the orebody A DES model was developed and validated with historical data from current sections in operation. Three experimental scenarios were analysed using the validated model in the production level of the future North Pacific section of the New Mine Level to evaluate the feasibility of obtaining the planned development target. The results from the simulation experiment are compared with historical data from existing sections. The following observations were made:
➤ The metres developed in the base case simulation using historical data are less than the metres planned for the Pacific North section. This is because operational uncertainties included in the model, such as LHD failure and orepass availability, were not considered in the initial planning sequence, resulting in an overestimation of the development rate.
➤ The metres developed in the base case simulation for the North Pacific section is at the upper limit of the ranges reached by the Division’s current operating mines.
➤ A flexible maintenance strategy for LHDs increases the metres developed by 457 metres after six years.
➤ A 100% orepass availability allows the metres developed after six years to be increased by 194 metres.
➤ By using the proposed optimum development sequence, an increase of 1,598 meters can be achieved after six years as compared to the base case.
This work presents an initial base for evaluating the impact that the improvement of critical unit operations can have on the horizontal development cycle of an underground mine. Past research has not yet studied the relationship between underground mine development and unit operations in a disaggregated way. Reliability analysis of other equipment such as the jumbo and/or the impact of using different blast designs can be evaluated as part of future work. Future work should also include revaluation of the development rate in the New Mine Level sections using the developed model once operation commences. It is also recommended that more data be collected for future analysis.
The authors would like to thank Codelco – El Teniente Division for allowing us to work with them to obtain data from the development cycle and Datamine Software for giving us the software used in this paper.
The authors declare that they have no conflict of interest.
The authors received no financial support for the research, authorship, and/or publication of this article.
A discrete event simulation approach for mine development planning at Codelco’s New Mine
Ahmed, H.M., Scoble, M.J., and Dunbar, W.S. 2016. A comparison between Offset Herringbone and El Teniente underground cave mining extraction layouts using a discrete event simulation technique. International Journal of Mining, Reclamation and Environment, vol. 30, no. 2. pp. 71–91.
Anani, A. and Awuah-Offei, K.,2017. Incorporating changing duty cycles in CM-shuttle car matching using discrete event simulation: A case study. International Journal of Mining and Mineral Engineering, vol. 8, no. 2. pp. 96–112.
Anani, A., Nyaaba, W., Hekmat, A., and Córdova, E.A . 2019. Optimizing cut-out distance for maximum coal productivity. SIMULATION, vol. 95, no. 6. pp. 545–559.
Balaraju, J., Govinda Raj, M., and Murthy, C.H.S.N. 2018a. Estimation of reliability-based maintenance time intervals of Load-Haul-Dumper in an underground coal mine. Journal of Mining and Environment, vol. 9, no. 3. pp. 761–770.
Balaraju, J., Govinda, M., and Murthy, C. 2018b. Reliability analysis and failure rate evaluation of load haul dump machines using Weibull distribution analysis. Mathematical Modelling, vol. 5, no. 2. pp. 116–122.
Basu, A.J. and Baafi, E.Y. 1999. Discrete event simulation of mining systems: current practice in Australia. International Journal of Surface Mining, Reclamation and Environment, vol. 13, no. 2. pp. 79–84.
Ccatamayo Barrios, J.H. 2017. Aplicación de filosofía Lean en la preparación minera, mina El Teniente Codelco Chile. Application of lean philosophy in mining preparation, El Teniente Codelco Chile mine. Master’s thesis, Universidad de Chile, Santiago, Chile. http://repositorio.uchile.cl/ handle/2250/147376
Chami, J. 2012. Optimización de los procesos de Desarrollo y Construcción en minería de block caving caso estudio mina El Teniente Codelco Chile Optimization of Development and Construction processes in block caving mining, case study El Teniente Mine Codelco Chile. Master’s thesis, Universidad de Chile, Santiago, Chile. http://repositorio.uchile.cl/ handle/2250/114467
Cochilco. 2019. Anuario de estadísticas del cobre y otros minerales: 1999-2018 [Yearbook of Copper and Other Minerals Statistics: 1999-2018]. Santiago. Codelco. 2020. Memoria Anual 2019 [Annul report 2019]. Santiago. Dehghani, H. and Ataee-Pour, M. 2012. Determination of the effect of operating cost uncertainty on mining project evaluation. Resources Policy, vol. 37, no. 1. pp. 109–117.
Díaz, M., Rojas, P. and Vargas, M. 2019. Construction of mining projects in El Teniente. Campos, and Morales. The proceedings of the 6th International Conference on Geology and Mine Planning. Santiago, 7–9 August. Geomin, Santiago.
Dindarloo, S.R., Osanloo, M., and Frimpong, S. 2015. A stochastic simulation framework for truck and shovel selection and sizing in open pit mines. Journal of the Southern African Institute of Mining and Metallurgy, vol. 115, no. 3. pp. 209–219.
Greberg, J., Salama, A., Gustafson, A., and Skawina, B. 2016. Alternative process flow for underground mining operations: analysis of conceptual transport methods using discrete event simulation. Minerals, vol. 6, no. 3. p. 65.
Haque, M.A., Topal, E., and Lilford, E. 2014. A numerical study for a mining project using real options valuation under commodity price uncertainty. Resources Policy, vol. 39. pp. 115–123.
Hormazabal, E., Pereira, J., Barindelli, G., and Alvarez, R . 2014. Geomechanical evaluation of large excavations at the new level mine—El Teniente. 3rd International Symposium on Block and Sublevel Caving, Universidad de Chile. pp. 486–500.
Laubscher, D.H. 1994. Cave mining-the state of the art. Journal of the Southern African Institute of Mining and Metallurgy, vol. 94, no. 10. pp. 279–293.
Leiva, F. 2015. Desarrollo de una metodología para la obtención de la major configuración de turnos para la construcción de un túnel horizontal, Minera San Pedro [Development of a methodology to obtain the best configuration of shifts for the construction of a horizontal tunnel, Minera San Pedro]. Thesis, Universidad de Santiago de Chile, Santiago, Chile.
Lobiano Correa, C.H. 2016. Inclusión de interferencias operacionales de origen geotécnico en planificación minera de Panel Caving. [Inclusion of
geotechnical operational interferences in panel caving mine planning], Master’s thesis, Universidad de Chile, Santiago, Chile. http://repositorio. uchile.cl/handle/2250/139851
MacNeil, J.A. and Dimitrakopoulos, R.G. 2017. A stochastic optimization formulation for the transition from open pit to underground mining. Optimization and Engineering, vol. 18, no. 3. pp. 793–813.
Manríquez, F., Pérez, J., and Morales, N. 2020. A simulation–optimization framework for short-term underground mine production scheduling. Optimization and Engineering, vol. 21, no. 3. pp. 939–971.
Memon, Z.A., Majid, M.Z.A ., and Mustaffar, M. 2006. A systematic approach for monitoring and evaluating the construction project progress. Journal of Industrial Engineering, vol. 67, no. 3. pp. 26–32.
Musingwini, C. 2016. Optimization in underground mine planning – developments and opportunities. Journal of the Southern African Institute of Mining and Metallurgy, vol. 116, no. 9. pp. 809–820.
Navarro, C. 2012. Simulación de ciclos de construcción de labores subterráneas mediante el método de Montecarlo, Proyecto Olivo Minera San Pedro. Simulation of underground work construction cycles using the Montecarlo method, Olivo Project Minera San Pedro. thesis, Universidad de Santiago de Chile, Santiago, Chile.
Paravarzar, S., Pourrahimian, Y., and Askari-Nasab, H. 2018. Short-term underground mine planning: A review. Mining Optimization Laboratory, University of Alberta, vol. 780, no. 1. p. 305.
Park, S., Choi, Y., and Park, H.S. 2016. Optimization of truck-loader haulage systems in an underground mine using simulation methods. Geosystem Engineering, vol. 19, no. 5. pp. 222–231.
Ramírez, I.J.S. 2020. Simulación como herramienta para identificar y comprender las operaciones críticas en el ciclo de desarrollos horizontales [Simulation as a tool to identify and understand critical operations in the horizontal development cycle], Master’s thesis, Pontificia Universidad Catolica de Chile, Chile.
Rocher, W., Rubio, E., and Morales, N. 2011. Eight-dimensional planning: construction of an integrated model for the mine planning involving constructability. Proceedings of the 35th International Symposium on Application of Computers in the Minerals Industry Wollongong, Australia. Australian Institute of Mining and Metallurgy, Melbourne. pp. 393 406.
Rockwell Automation. 2019. Arena: User’s guide. Milwaukee, WI.
Runciman, N., Vagenas, N., and Baiden, G. 1999. Evaluation of underground development mining systems using discrete-event simulation. Simulation, vol. 72, no. 1. pp. 4–11.
Salama, A., Greberg, J., and Schunnesson, H. 2014. The use of discrete event simulation for underground haulage mining equipment selection. International Journal of Mining and Mineral Engineering, vol. 5, no. 3. pp. 256–271.
Salama, A., Nehring, M., and Greberg, J. 2017. Financial analysis of the impact of increasing mining rate in underground mining, using simulation and mixed integer programming. Journal of the Southern African Institute of Mining and Metallurgy, vol. 117, no. 4. pp. 365–372.
Singer, D.A. and Kouda, R. 1999. Examining risk in mineral exploration. Natural Resources Research, vol. 8, no. 2. pp. 111–122.
Skawina, B., Greberg, J., Salama, A ., and Gustafson, A. 2018. The effects of orepass loss on loading, hauling, and dumping operations and production rates in a sublevel caving mine. Journal of the Southern African Institute of Mining and Metallurgy, vol. 118, no. 4. pp. 409–418.
Skawina, B., Greberg, J., Salama, A., and Schunnesson, H. 2014. Mechanical excavation and drilling and blasting–A comparison using discrete event simulation. Proceedings of Mine Planning and Equipment Selection, Springer, Cham. pp. 367–377.
Soto, I. and Pascual, R. Using maintenance options to minimise the expected total cost of mining haulage fleets. Proceedings of the 3rd International Seminar on Operational Excellence in Mining, Santiago, 21–23 March 2018. Gecamin, Santiago.
Vagenas, N. 1999. Applications of discrete-event simulation in Canadian mining operations in the nineties. International Journal of Surface Mining, Reclamation and Environment, vol. 13, no. 2. pp. 77–78. u
Affiliation: 1Department of Process Engineering, Stellenbosch University, South Africa.
Correspondence to: M. Tadie
Email: mtadie@sun.ac.za
Dates: Received: 30 Mar. 2022
Revised: 27 Jun. 2022
Accepted: 5 Jun. 2022
Published: October 2022
How to cite: Mutimutema, P., Akdogan, G., and Tadie, M. 2022
Evaluation of pre-treatment methods for gold recovery from refractory calcine tailings. Journal of the Southern African Institute of Mining and Metallurgy, vol. 122, no. 10, pp. 561 570
DOI ID: http://dx.doi.org/10.17159/24119717/2070/2022
ORCID: M. Tadie https://orcid.org/0000-00033111-5188
The South African gold mining industry has a legacy of abundant tailings dams, which have attracted the attention of investors because of their potential as a cheaper secondary gold resource. In this we investigate study gold recovery from a refractory calcine tailings dam. Bulk mineralogy of the tailings indicated silicates and iron oxides to be the most abundant phases. Scanning Electron Microscopy (SEM) showed gold to exist in submicrometre and micrometre sizes, as free gold, and associated with arsenic, sulphur, and silicates e.g quartz and talc. Gold recovery by direct cyanidation was low at 17.3%. Mechanical (ultra fine grinding P80 -16μm) and chemical (alkaline, NaOH) pre-treatment and microwave roasting and microwave-assisted cyanide leaching were investigated to increase gold recoveries. Ultrafine grinding was the most effective, producing recoveries of 66.5%. NaOH pre-leaching of ultrafine milled material increased recovery to 71.5%. Alkaline pre-leaching overall increased recoveries for non-pretreated material, making this process the most preferred because it is less costly than ultrafine grinding. Microwave roasting and microwave-assisted leaching did not achieve higher recoveries than alkaline pre-treatment or fine grinding. The investigation highlights and confirms that chemical treatment with NaOH is a powerful tool for gold extraction from refractory tailings.
gold recovery, refractory calcine tailings, ultrafine grinding, alkaline pre-treatment, microwave.
South Africa has over 500 gold tailings dumps, several of which have the potential to be profitably reprocessed (Janse van Rensburg, 2016). Gold lost to the dumps is attributed to inherent process inefficiencies. Historically and up to 1993, gold lost annually to tailings in South African mines was considered to equate to R8.5 billion, indicating a significant amount of value present in tailings (Metzner, 1993).
The reprocessing of tailings presents an opportunity, via modern technologies, for low-cost recovery of gold. Such activities can be used to supplement revenue for existing operations. Reprocessing tailings for gold recovery can be complex and is dependent on the mineralogy of the dump, which is in turn related to the original orebody characteristics or prior processing. Prior processing of tailings adds to the complexity of the mineralogy, which is either refractory and non-refractory. Typical refractory ores have a high sulphide content, such as those found in the Barberton greenstone belt. High-sulphide ores have been processed in the past by methods such as roasting and calcination. These processes oxidize sulphur species at high temperatures, liberating gold from cyanide-consuming sulphur matrices. High energy costs and SO2 emissions associated with these processes have led to their discontinuation.
Research is ongoing for pre-treatment methods that can be applied to aid gold recovery by cyanidation. Roasting, pressure oxidation (acidic and alkaline), biological oxidation, chlorination, microwaves, and ultrafine grinding have been applied to process refractory ores (Fraser, Walton, and Wells, 1991). Table I shows several pre-treatment methods for gold ores or concentrates. Flotation, biological oxidation, gravity separation, pressure oxidation, ultrafine milling, and sodium hydroxide pre-leach are applied commercially in metallurgical plants (Anderson and Twidwell, 2008; Anderson and McDonald, 2016; Das and Sarkar, 2018). Microwaves are being investigated at the pilot plant level by the University of Nottingham’s microwave process engineering department (Buttress et al., 2017). The use of ultrasound is also being considered (Wang, and Zhang, 2019).
In this research we investigated through gold recovery an analysis of the tailings mineralogy and application of different pre-treatment methods. The aim was to unlock gold from the complex mineralogy and formulate relationships between the prior treatment of the tailings and the gold
Pre-treatment methods for ores, or concentrates
Pre-treatment method
Flotation
Phases in gold-bearing ore or concentrate Reference
Sulphides, silicates, carbonate Allan and Woodcock (2001), Yalcin and Kelebek (2011)
Biological oxidation Silicates, sulphates, sulphides, oxides Asamoah, Skinner, and Addai-Mensah(2018)
Gravity separation and flotation
Sulphides, silicates, carbonate Wang et al. (2019)
Pressure oxidation Sulphides, silicates Koslides and Ciminelli (1992)
Flotation and ultrafine milling or roasting
Sodium hydroxide
Sulphides, silicates Ellis and Gao (2003)
Sulphides, silicates, oxides Mesa Espitia and Lapidus (2015), Snyders et al. (2018)
Microwave roasting Sulphides, silicates, oxides Nanthakumar, Pickles, and Kelebek (2007), Amankwah and Ofori-Sarpong (2011)
Conventional roasting Sulphides, silicates Dunn and Chamberlain (1997), Fernánde, Collins, and Marczak (2010)
Ultrasound
Sulphides, silicates Zhang et al. (2016), Guo, Wang, and Zhang (2019)
extraction behavior. Several potentially viable pre-treatment methods were considered as options, i.e. ultrafine milling as a mechanical technique, sodium hydroxide pre-leach as a chemical technique, and microwave technology (González-Anaya, NavaAlonso, and Pecina-Trevi˜no, 2011; Nanthakumar, Piddes, an Kelebode, 2007; Snyders et al., 2018). These pre-treatment methods were factored in as a mechanism to circumvent any challenges encountered due to the previous roasting and the associated refractory nature of the calcine tailings. Heating using microwave energy was explored to demonstrate the energy requirements to unlock gold by the lixiviant at normal operating conditions.
Material
100 kg of calcine tailings was obtained from a tailings dump in South Africa. The tailings were blended and divided into representative aliquots through cone and quartering, followed by riffle splitting, and finally rotary splitting to obtain 500 g samples.
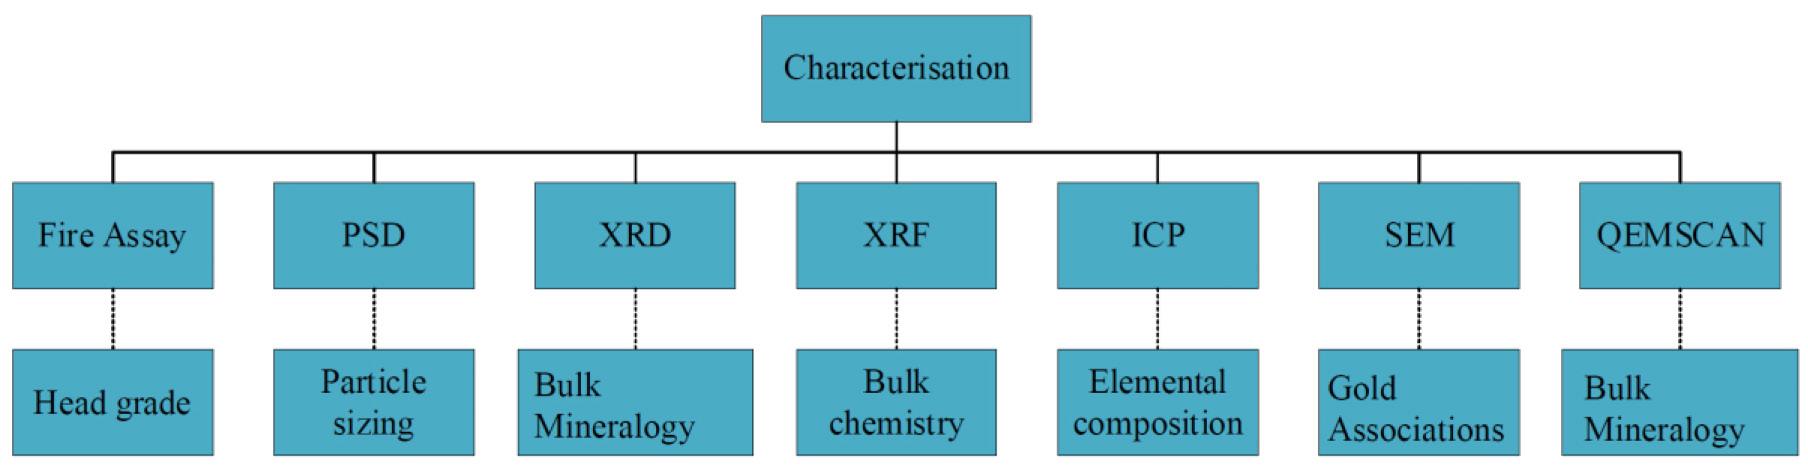
The tailings were characterized using multiple techniques to determine bulk mineralogy gold content and associations, as well as trace element chemistry. Figure 1 summarizes the different techniques applied to sample characterization and the nature of the information obtained.
Nine 100 g samples were analysed by fire assay to determine the head grade. Fire assay results showed an average head grade of 2.96 ± 0.26 g/t, a high grade relative to some run-of-mine operations. The tailings had a P80 of 56 μm, determined using a Micromeritics Saturn Digisizer 5200 laser diffraction particle size analyser.
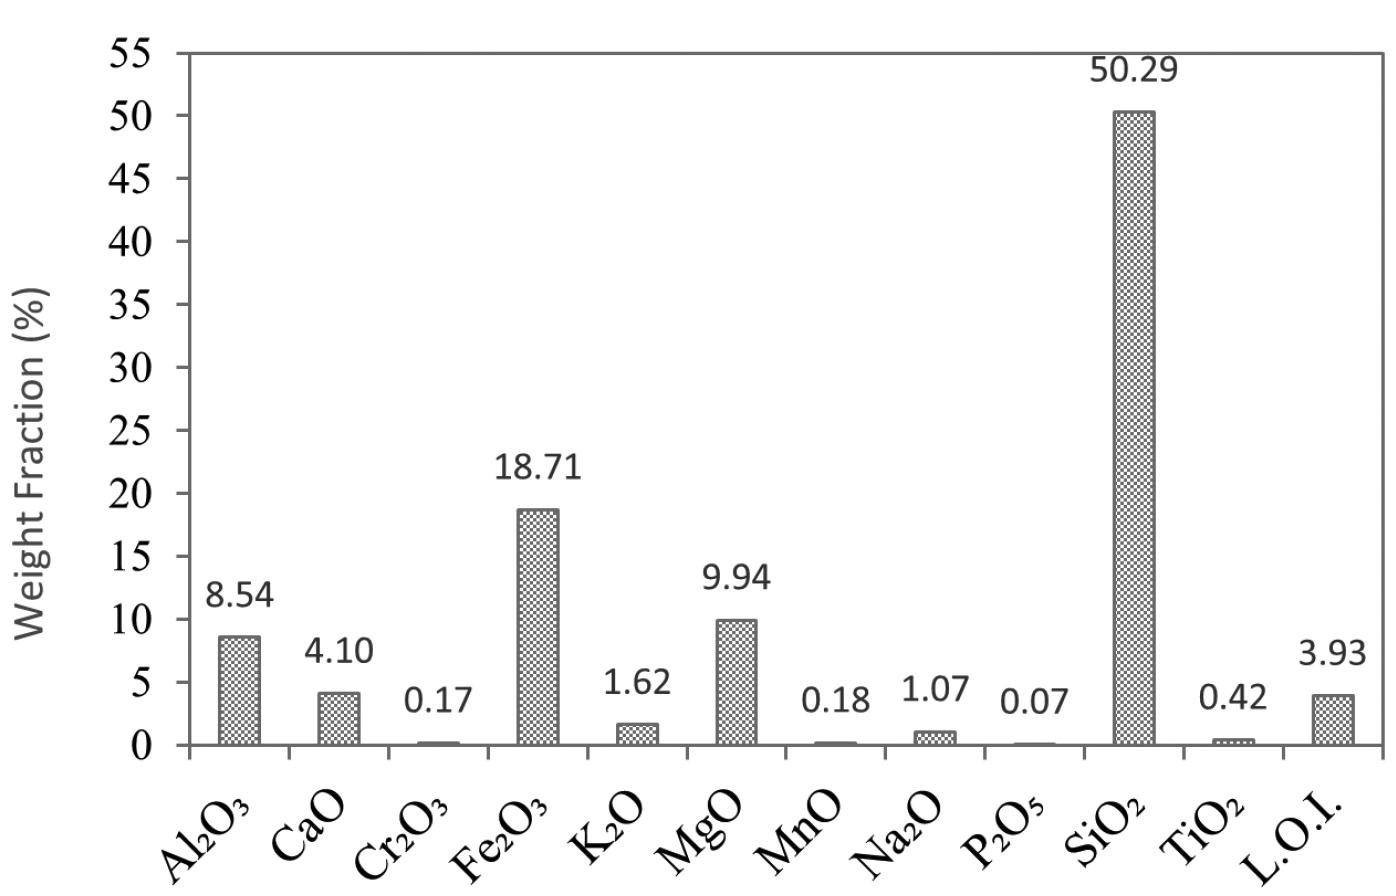
X-ray fluorescence spectroscopy (XRF) was conducted using a PANalytical Axios wavelength-dispersive spectrometer for chemical analysis. Silicon and iron were the major elements in the sample (Figure 2). Significant amounts of sodium, magnesium, potassium, and aluminium were detected. Loss on ignition (LOI) represents the elements (sulphur, arsenic, etc.) that were volatized during analysis.
Trace element analysis was conducted on three composite samples. Samples were digested using six parts nitric acid to one part hydrogen peroxide in a MARS microwave digester. The solutions were analysed using an Agilent 7900 inductively coupled plasma mass spectrometry (ICP-MS) instrument and a Thermo ICap 6200 inductively coupled plasma optical emission spectrometry (ICP-OES) instrument. Results shown in Table II indicate arsenic and sulphur in appreciable quantities, 4 106 ± 246 mg/kg and 5 173 ± 620 mg/kg respectively.
Quantitative X-ray diffraction (QXRD) was performed to determine bulk mineralogy. The sample was analysed with a PANalytical Aeris diffractometer with a pixcel detector and fixed slits with Fe-filtered Co-Kα radiation. Phases were identified using X’Pert Highscore plus software.
Gold particle size and associations were investigated using scanning electron microscopy (SEM)using a Zeiss MERLIN field emission scanning electron microscope. A Zeiss 5-diode back-scattered electron (BSE) detector (Zeiss NTS BSD) and Zeiss SmartSEM software generated BSE images. An Oxford Instruments X-Max 20 mm2 detector attached to the SEM and Oxford Aztec software were used to chemically quantify the samples by semi-quantitative energy dispersive X-ray spectrometry (EDS) and generation of corresponding EDS maps.
Finally, quantitative scanning electron microscopy (QEMSCAN) analysis was performed on the calcine sample. 500 g of the sample was screened into four particle size ranges; +75 μm, -75+38 μm, -38+25 μm, and -25 μm. Two polished sections were prepared for each size fraction. The sections were analysed by a QEMSCAN 650F with two Bruker EDS detectors. Bulk mineral analysis and trace minerals were measured in each section.
Leaching tests were conducted using a 24-hour bottle roll with
sodium cyanide as lixiviant. Unless otherwise stated, the cyanide addition was 2 kg/t. A solids density of 30% solids was used for the leaching tests. Lime was added to adjust the pH 10.5. Liquid samples were collected at 1-hour, 2-hour, and 24-hour intervals and analysed for gold using ICP-OES. The bottle roll tails were water-washed and filtered before oven drying at 50ºC. Dry tailings samples were sent for fire assay.
Ultrafine milling was performed using a pulverizer. A 100 g sample was pulverized for 120 seconds to achieve a P80 of 16 μm.
Analytical-grade sodium hydroxide was used for chemical pre-treatment. The pre-leach was conducted at 25% solids concentration (González-Anaya, Nava-Alonso, and Pecina-Trevi˜no, 2011) for 4 hours. Pre-leaching was conducted in a top-driven stirred glass vessel with temperature-controlled heater at the base of the vessel. Solution samples were collected after 4 hours and analysed for Au, As, Al, Fe, S, Si, and Zn using ICP-MS. Solid tails were washed with deionized water, filtered, and dried in an oven at 50oC before preparation for cyanidation tests. Cyanidation tests were conducted using the methodology described later. A full factorial design was conducted at two levels to investigate the effects of temperature, [NaOH], and particle size. Table III shows the levels and conditions investigated.
Microwave energy was used to facilitate the breakdown of refractory mineral matrices to liberate gold before and during leaching experiments. Microwaves were used as an energy source
ability to apply a high energy density over a short period of
The experiments are a demonstration of the
thermodynamic thresholds to be broken, in
to circumvent the chemical and physical barriers created by prior processing of these tailings. The power densities applied
not reflective of economic conditions
of industrial
results
technology to these
as such.
Evaluation of pre-treatment methods for gold recovery from refractory calcine tailings
A 1000 W, 2.45 GHz Samsung domestic microwave oven was used for the experiments. A standalone beaker containing 300 ml of water was included in the apparatus to prevent excessive reflection of microwaves, thereby protecting the magnetron.
The energy received by the sample was therefore not 100% of the energy dissipated by the microwave device. 60 g of the feed was used for the microwave roasting experiments. Roasting experiments were conducted under two conditions, with moisture in sample and without moisture, for a total roasting time of 20 minutes.
Variables considered in these tests are summarized in Table IV. Leaching of the roasted material followed the same procedure and conditions as described previously.
A 1000 W, 2450 MHz domestic microwave oven was modified to accommodate an overhead stirrer and 1 L reactor vessel.
The microwave unit was insulated and operated in an insulated room for safety. A liquid-to-solids ratio of 6:1 was used for the leaching tests. The pH was set at 10.5, and the pulp was allowed to condition in the reactor for 3 minutes prior to addition of NaCN. Leaching was conducted for 50 minutes. Liquid samples were extracted at intervals of 10, 30 and 50 minutes via a sampling port.
At the end of each experiment, the microwave unit was switched off and the pulp was allowed to cool before washing, filtering, and oven-drying. Variables tested under microwave-assisted leaching included the cyanide concentration and the particle size distribution, as provided in Table V.
XRD, QEMSCAN, and SEM with EDS were used to develop an understanding of the occurrence of gold in the sample and
Quartz (SiO2) 22.4
Haematite (Fe2O3) 12.2
Magnesiohornblende, ferrian (Ca2[Mg4(Al,Fe)]Si7AlO22(OH)2) 25.5
Clinochlore (Mg5Al(AlSi3O10)(OH)8) 5.8
Biotite (K(Mg,Fe)₃(AlSi₃O10)(F,OH)₂) 10.2
Anorthite (CaAl₂Si₂O₈) 14.7
Talc (Mg₃Si₄O10(OH)₂) 7.5
Calcite (CaCO₃) 1.8
relevant mineral associations that might constitute a barrier to extraction. The bulk mineralogy, therefore, played a critical role in identifying and quantifying cyanides as well as understanding the alterations in the sample due to calcination.
XRD analysis was performed to determine the crystalline phase constituents. Results (Table VI) indicate that the major nonmetallic and metallic oxides in the sample are silica and haematite, together making up 37% of the sample. It is proposed that haematite in the calcine tailings is a roasting product of minerals such as pyrite and arsenopyrite in the original ore. Magnesiohornblende-ferrian, biotite, clinochlore, anorthite, and talc are characteristic of minerals originating from amphibolitefacies minerals occurring in the host orogenic gold deposit. These minerals, together with quartz, constitute 86% of the ore. Base metal sulphides were below detection limit, probably due to alteration during calcination. Table II, however, shows sulphur and arsenic content to be as much as 5.2 g/kg and 4.1 g/kg respectively, indicating the presence of some of these base metals.
QEMSCAN results are is shown in Figures 3 and 4 for the bulk mineralogy and the base metal sulphide analysis. The predominant phases are confirmed to be silicates (quartz, feldspar, amphibole and mica) and iron oxides that are a product of the roasting process and from the original orebody. Gold particle size was below the detection limit for the QEMSCAN, indicating the fineness of the gold that is typical in tailings.
Base metal sulphide phases (Figure 4) were identified as predominantly pyrrhotite, arsenopyrite, chalcopyrite, and pyrite. Although Fe oxides (Figure 3) which constitute up to 12 % of the tailings, include sulphides altered from roasting and from prolonged exposure to weathering on the dump, the bulk of the Fe oxides is likely to have originated from the host orebody, since they are present in appreciable amounts.
To determine the gold associations in the sample, SEM was used to detect gold particles, and EDS analysis around the targeted gold particles was used to determine their elemental associations. Based on the known bulk mineralogy, conclusions were drawn to identify the gold associations within these samples. Figure 5 shows SEM images of different gold particles from the sample along with chemical overlay maps from EDS analysis.
Evaluation of pre-treatment methods for gold recovery from refractory calcine tailings
Figure 5a shows gold occluded in a silicate matrix, probably quartz, which is abundant in the sample. In Figure 5b a gold particle is associated with sulphur and arsenic in a silicate matrix. The absence of iron in the sulphur and arsenic association with gold is likely due to incomplete arsenopyrite oxidation during roasting of the host ore. The presence of Mg and Si in the silicate matrix also suggests that the mineral is an amphibole like talc. In Figure 5c a free gold particle is identified. It is therefore evident that the maximum recovery from the sample depends on effective pre-treatment strategies to release trapped gold.
Mineralogical implications for processing Ultrafine milling does not effectively unlock gold-bearing particles
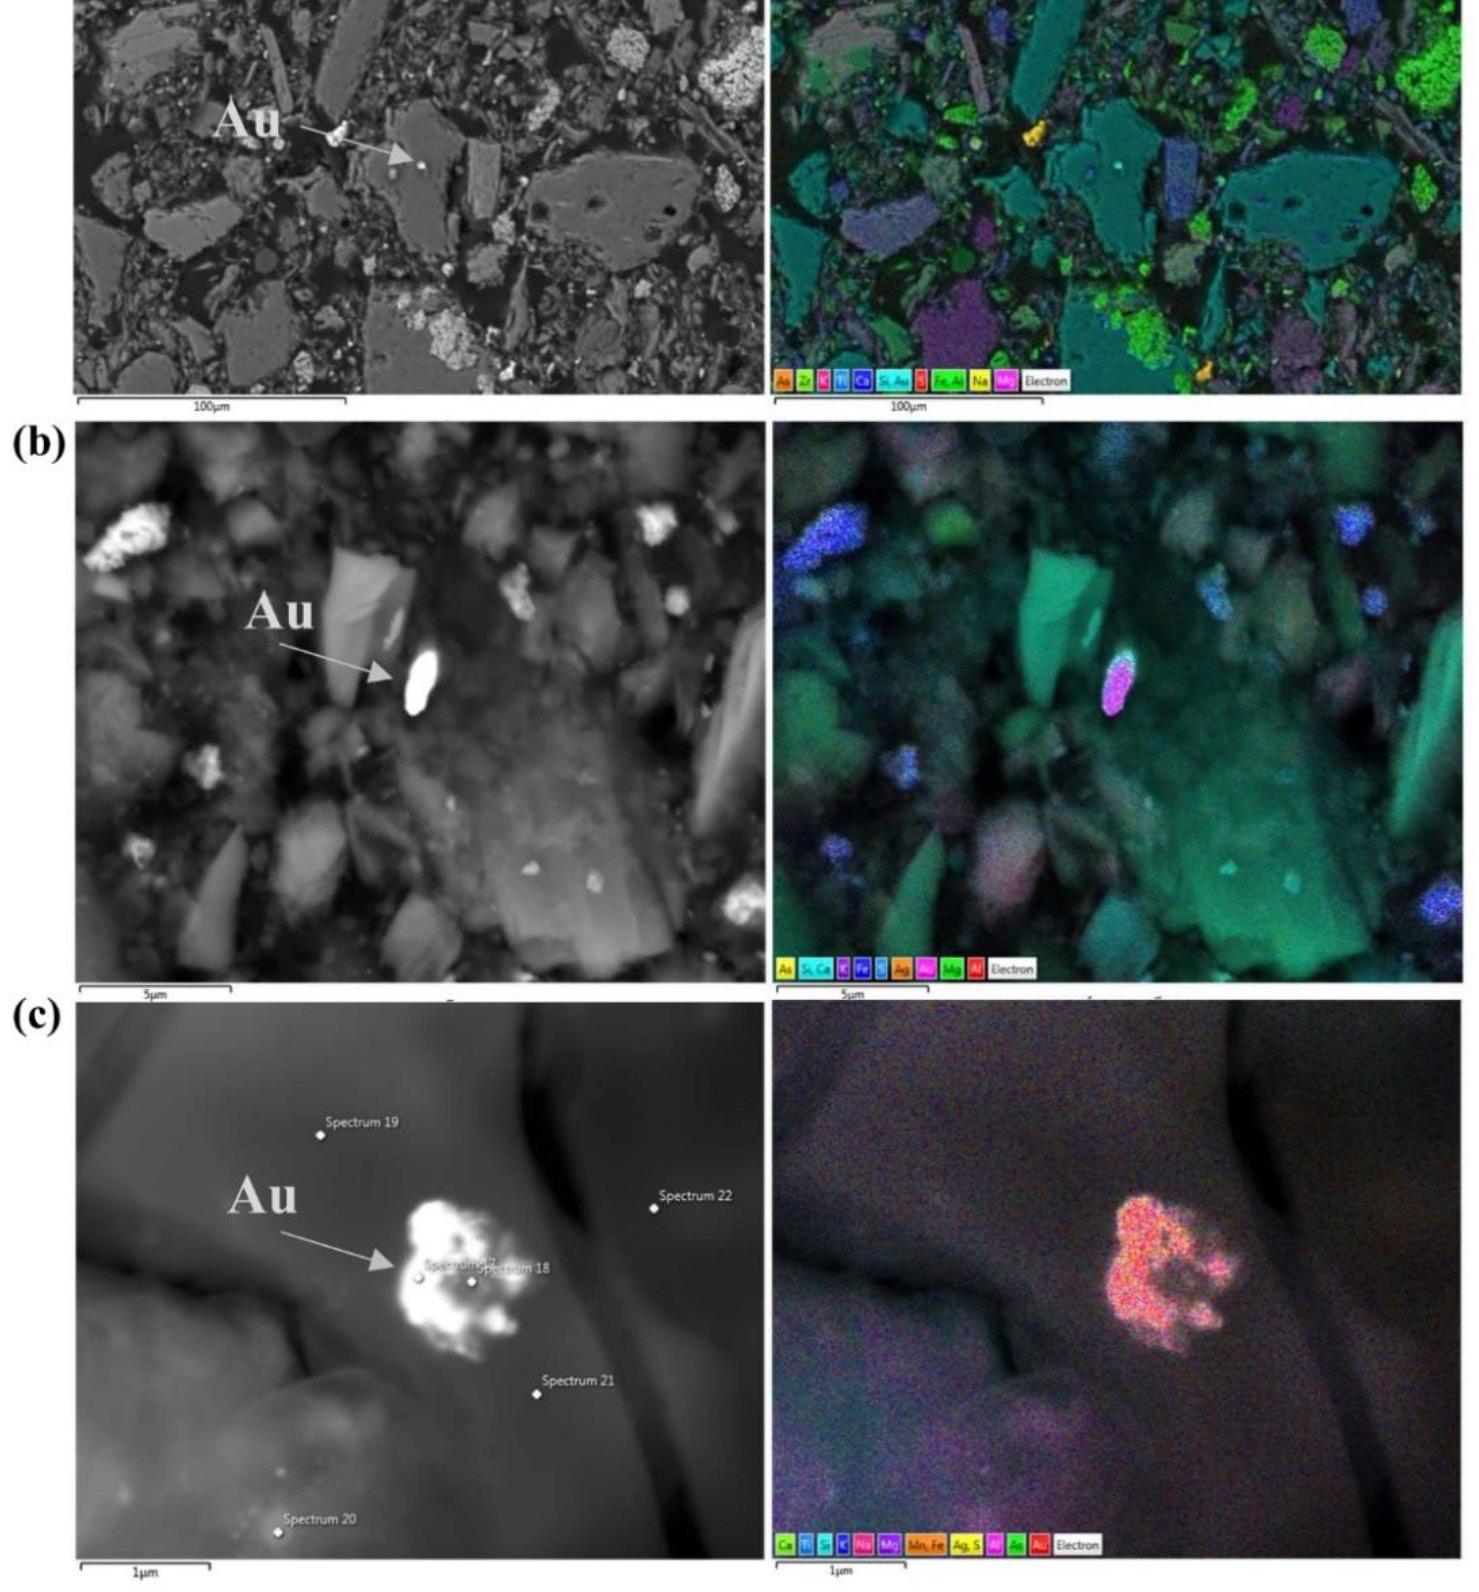
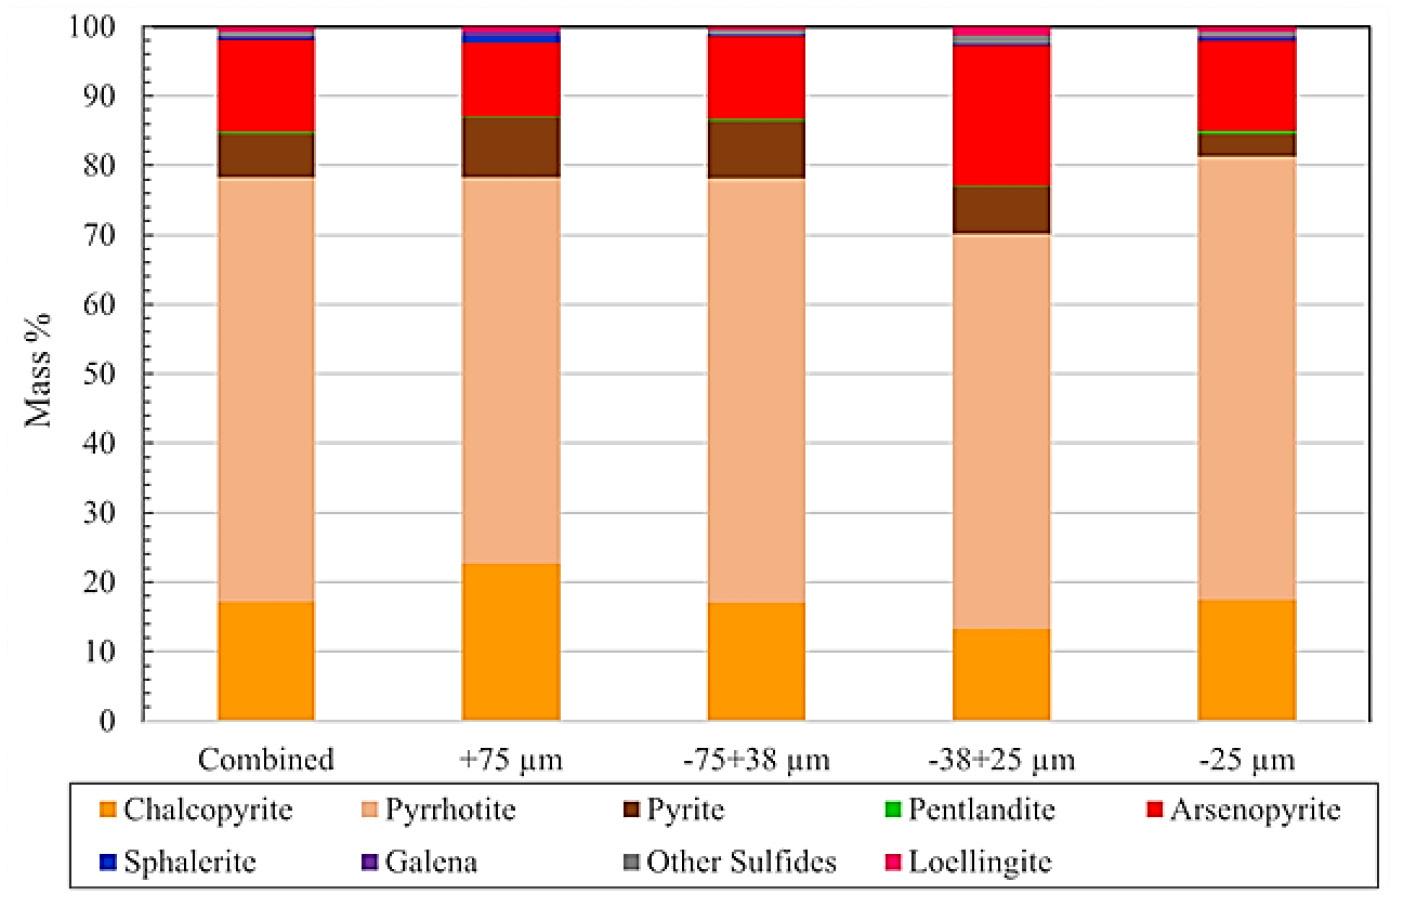
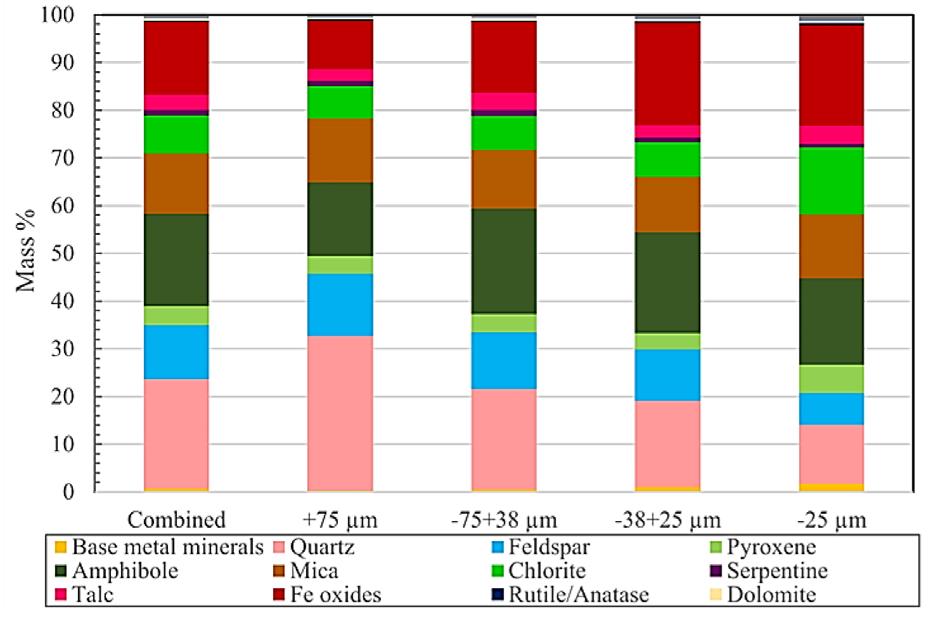
smaller than 1 μm and therefore additional pre-treatment would be necessary to either complement or replace ultrafine grinding in liberating gold (Corrans and Angove, 1991; Harbort et al., 1996). An economic energy input for such an operation will be a strong determinant for proceeding with this strategy.
Gold occluded within quartz is a cause of refractoriness since quartz consitutes a barrier for lixiviant contact. Occlusion of gold in quartz is also known to be typical of calcine (Yannopoulus, 1991), resulting from mobilization of gold into molten quartz during roasting. Liberation of such gold is achieved by both mechanical (fine grinding) and chemical strategies (alkaline pretreatment). NaOH leaches the quartz matrix and renders the gold accessible to the lixiviant (Crundwell, 2014; Snyders et al., 2018).
Gold associated with talc has similar effects to quartz, sulphur, and arsenic. Sulphur is a known oxygen and cyanide consumer, and the primary motivation for calcination. Alkaline pre-treatment may reduce the amount of arsenic, sulphur and talc present in the sample (Darban et al., 2011; Crundwell, 2014; Mesa Espitia and Lapidus, 2015; Snyders et al., 2018).
When the mineralogical barrier constitutes a thermodynamic threshold that cannot be readily crossed by conventional processing methods, alternative techniques with higher energy intensity are necessary. The presence of sulphide phases in this sample is a potential advantage for the application of microwaves as these minerals are known irradiation absorbers and far more effective than quartz and talc (Haque, 1999; Amankwah and Ofori-Sarpong, 2011). Thermal stresses and differential heating responses are a therefore a potential advantage of microwaves and effect the physical unlocking of encapsulated gold. Microwaveassisted leaching, on the other hand, may facilitate specific heating of minerals associated with gold and thus increase the kinetics of dissolution.
Figure 6 shows the results for direct cyanidation of the tailings after ultrafine grinding that without pre-treatment. The refractory nature of the tailings is indicated by a gold recovery after of 17.3 ± 0.54% 24 hours. The low recovery classifies the calcine tailings in the category of highly refractory material. This low recovery confirms of the need for pre-treatment to liberate occluded gold prior to cyanidation. Ultrafine grinding increases recoveries by up to three times (66.5 ± 0.87%) compared with direct cyanidation of the as-received material (Yannopoulos, 1991). It is clear that the gold occurs in this sample as fine gold which is liberated at particle sizes corresponding to those of the material after further grinding.
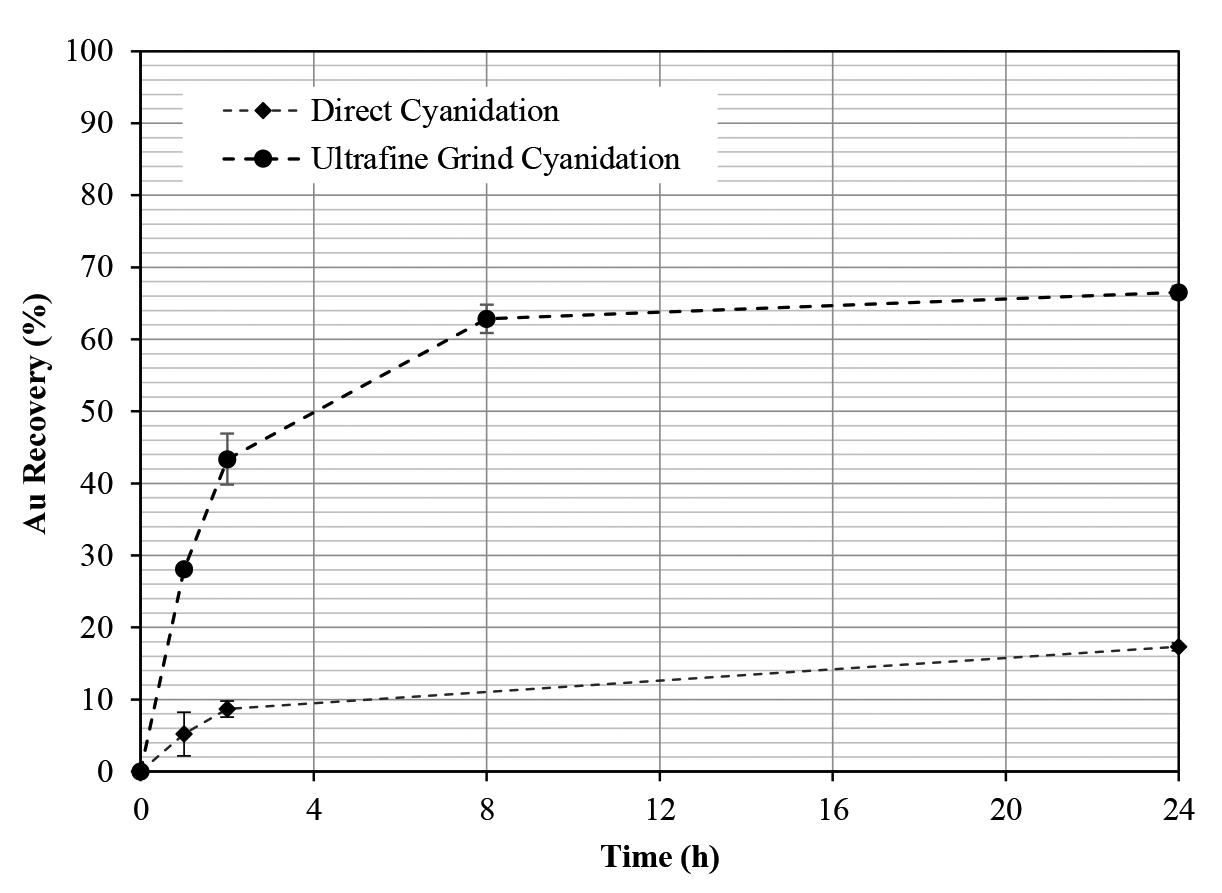
Alkaline (NaOH) pre-treatment
NaOH pre-leaching has been demonstrated to be a useful hydrometallurgical technology for the release of encapsulated precious metals (Snyders et al., 2018). Results after 4 hours of preleaching and subsequent cyanidation for 24 hours are presented in Figure 7.
The as-received tailings material (P80-53 μm) responded differently to NaOH pre-leaching, with a low concentration of NaOH (1M) producing higher recovery at ambient conditions,
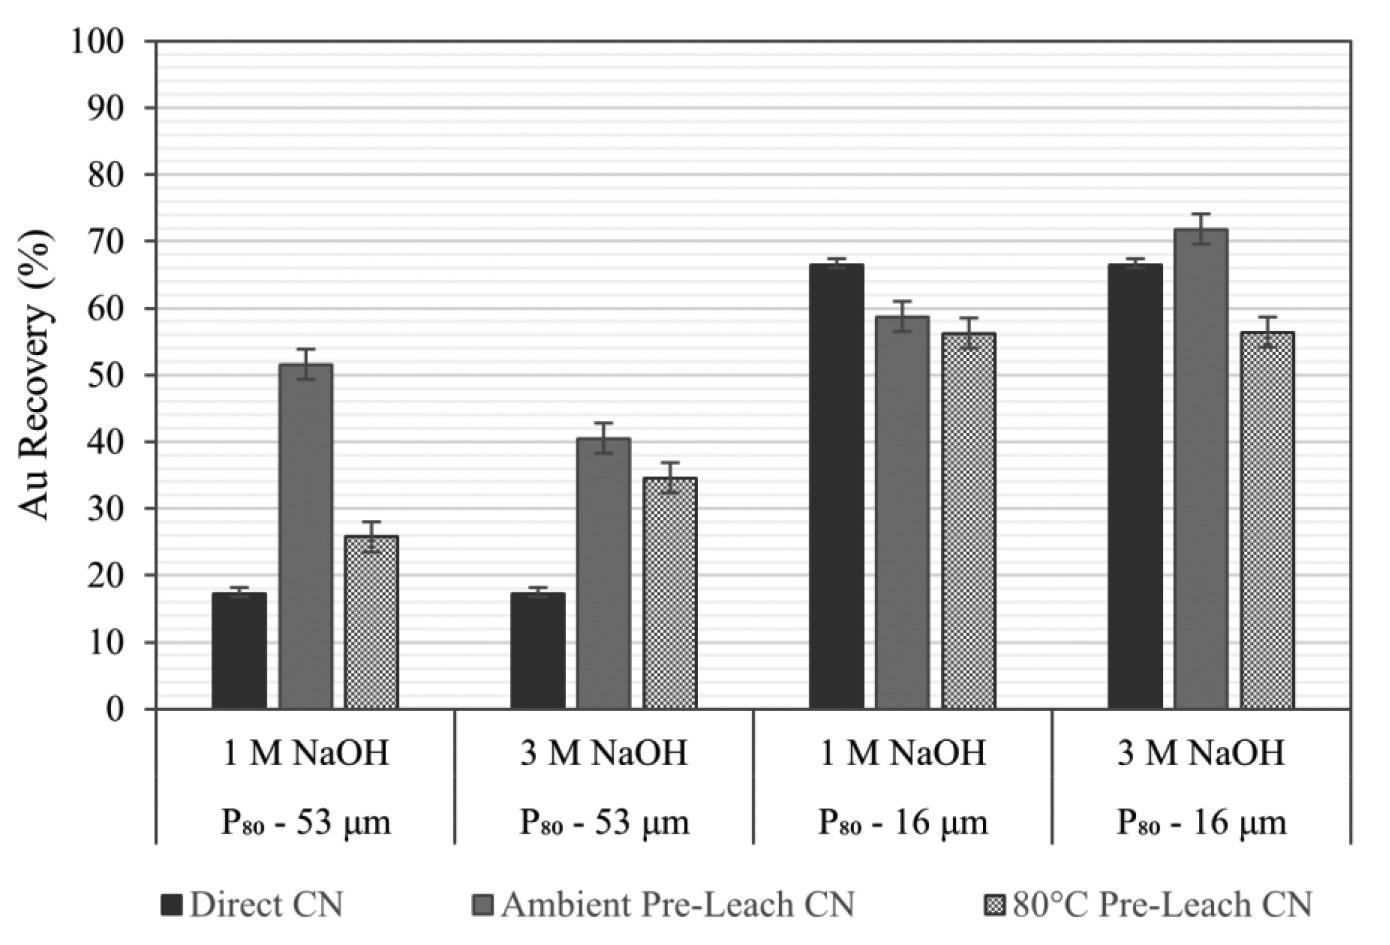
51.6%, compared to a higher concentration (3 M NaOH) which resulted in a Au recovery of 40.5%. Both conditions improved recovery from direct cyanidation without any pre-treatment (17.3%), indicating the effectiveness of chemical pre-treatment in releasing gold from silicate matrices and arsenic- and sulphurbearing material.
At ambient conditions, the recovery of gold from finely ground tailings material was lower than that without pretreatment, especially at NaOH concentrations of 1 M and 3 M. Pre-leaching at 3 M NaOH under ambient conditions, however, produced a response that was marginally higher than that of the ultrafine ground material without pre-treatment and was the only condition to exceed that recovery. The chemical response of the tailings to pre-treatment indicates that the species released from mineral matrices during NaOH oxidation were detrimental to gold leaching and might have been cyanicides.
No direct correlations between low- and high- temperature effects and low and high NaOH concentration effects were observed. These variations indicate that the response of the tailings to gold leaching is likely to be due to a combination of the oxidized species (cyanicides) reducing leaching efficiency and the occlusion of gold (reactivity with CN-) in the minerals reducing the lixiviants access.
The highest recovery (71.8%) was achieved after ultrafine grinding and 3 M NaOH pre-treatment at ambient conditions. The comparison of gold recovery at this condition with that of direct cyanidation suggests that gold liberation is almost at its maximum. The unrecovered gold is likely to be very finely disseminated and inaccessible without significant energy input.
Increasing the temperature during NaOH pre-leaching is expected to increase the rate of reaction according to an Arrhenius relationship and expose more gold (Mesa Espitia and Lapidus, 2015; Snyders et al., 2018). From Figure 7 it is observed that increasing the temperature during pre-leaching resulted in increased recovery of gold for the sample as-received compared to direct cyanidation. However, at ultrafine grind size (P80 –16μm) the recovery of gold after pre-leaching at 80ºC does not exceed the 66.5% obtained without pre-leaching. Au recoveries at 1 M and 3 M NaOH do not show any significant differences. Overall, the low Au recoveries after pre-leaching at high temperature indicate a possible interaction between the pre-leaching products and the tailings material that prevents maximum recovery of gold. This would be in the form of species produced at elevated temperature. The chemical system and aqueous chemistry during pre-leaching are therefore a critical factor in determining the efficiency of
NaOH pre-leaching. To investigate the possible chemical reactions occurring in the pre-leach solutions an elemental analysis of the pre-leach solution is an important first step.
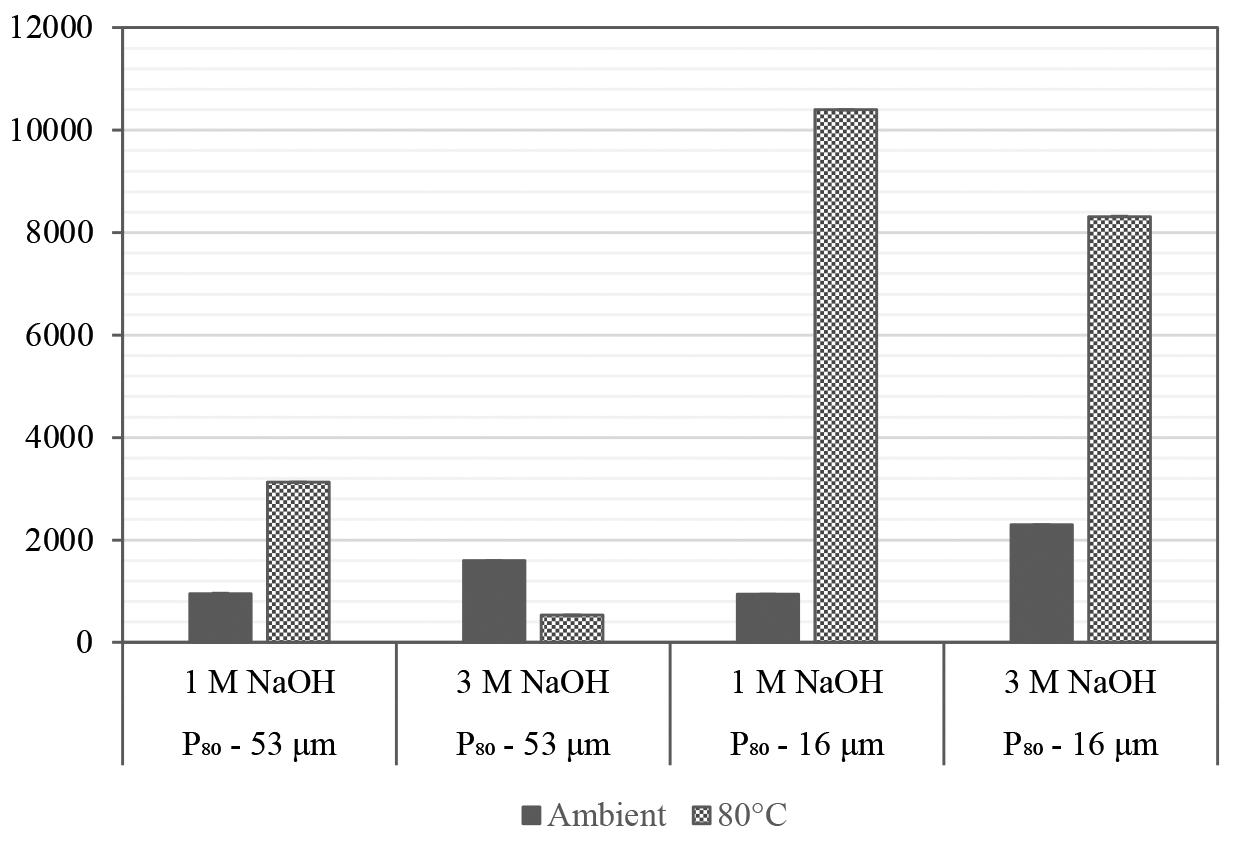
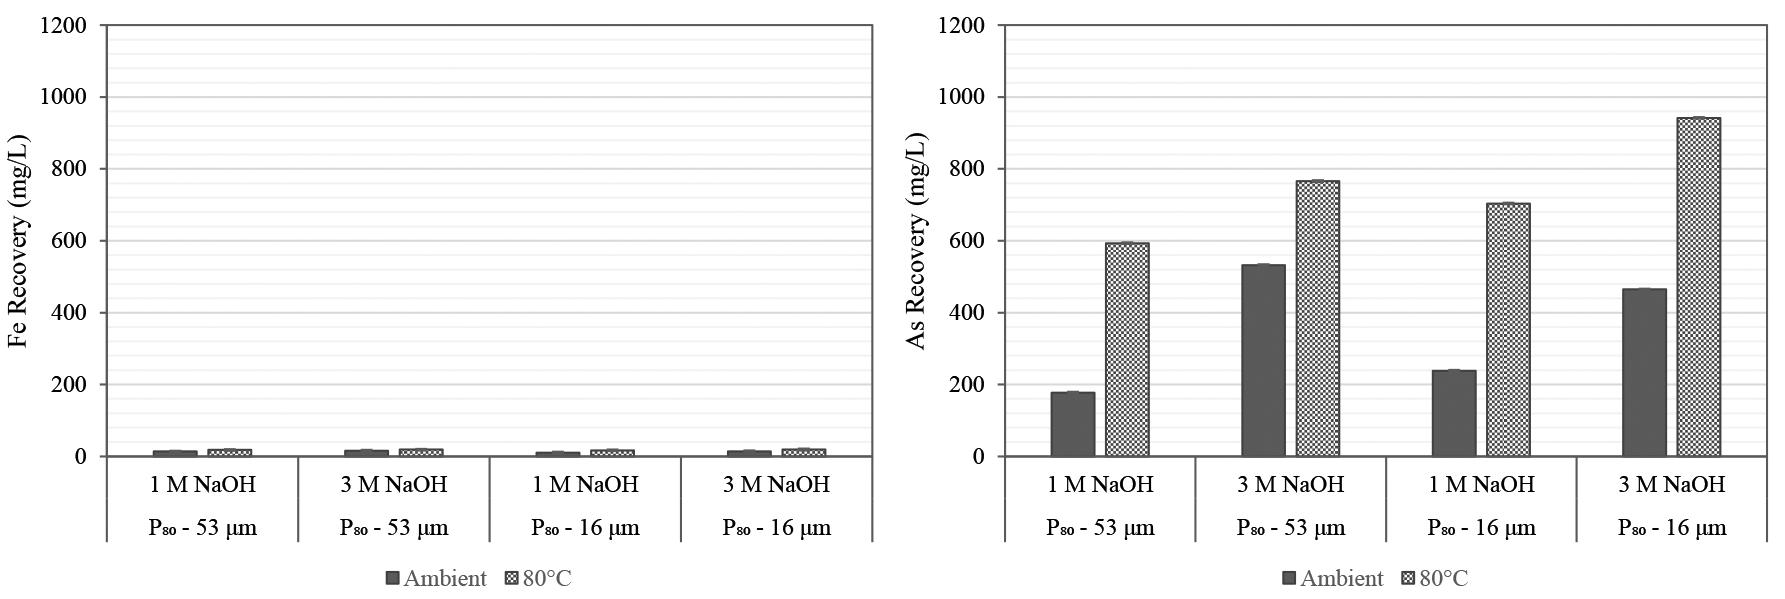
The XRD results (Table VI) on the tailings indicated a predominance of amphibolles as gangue components and a large proportion of quartz. Analyses of the extraction of Al and Si are presented in Figure 8 as a proxy for the dissolution of these minerals. SEM analysis (Figure 11) indicates an association of gold particles with arsenic, which may have originated from arsenopyrite. Figure 9 shows the extraction of As and Fe as a proxy for Fe- and As- bearing phases hosting gold.
From Figure 8, at ambient conditions Si and Al notably show lower extraction than at 80ºC, which is consistent with an Arrhenius relationship on the kinetics of dissolution. Increasing the concentration of NaOH for all conditions consistently results in increased elemental recovery for quartz and amphibole minerals. These high recoveries of elements from the gangue phases would explain why the Au recoveries under all conditions, but specifically at ambient conditions, were higher than those for direct cyanidation with no pre-treatment.
Au recovery from the ultrafine ground material, however, is not consistent with the Al and Si recoveries as this was shown to be lower than that of direct cyanidation. It is possible, however, that the lack of significant improvement in gold recovery after pre-leaching is due to fine grinding exposing available gold to a high degree.
In Figure 9, while Fe extraction is relatively low, As extraction increases with increasing NaOH concentration and temperature. Finally, Figure 10 shows the extraction of sulphur during NaOH
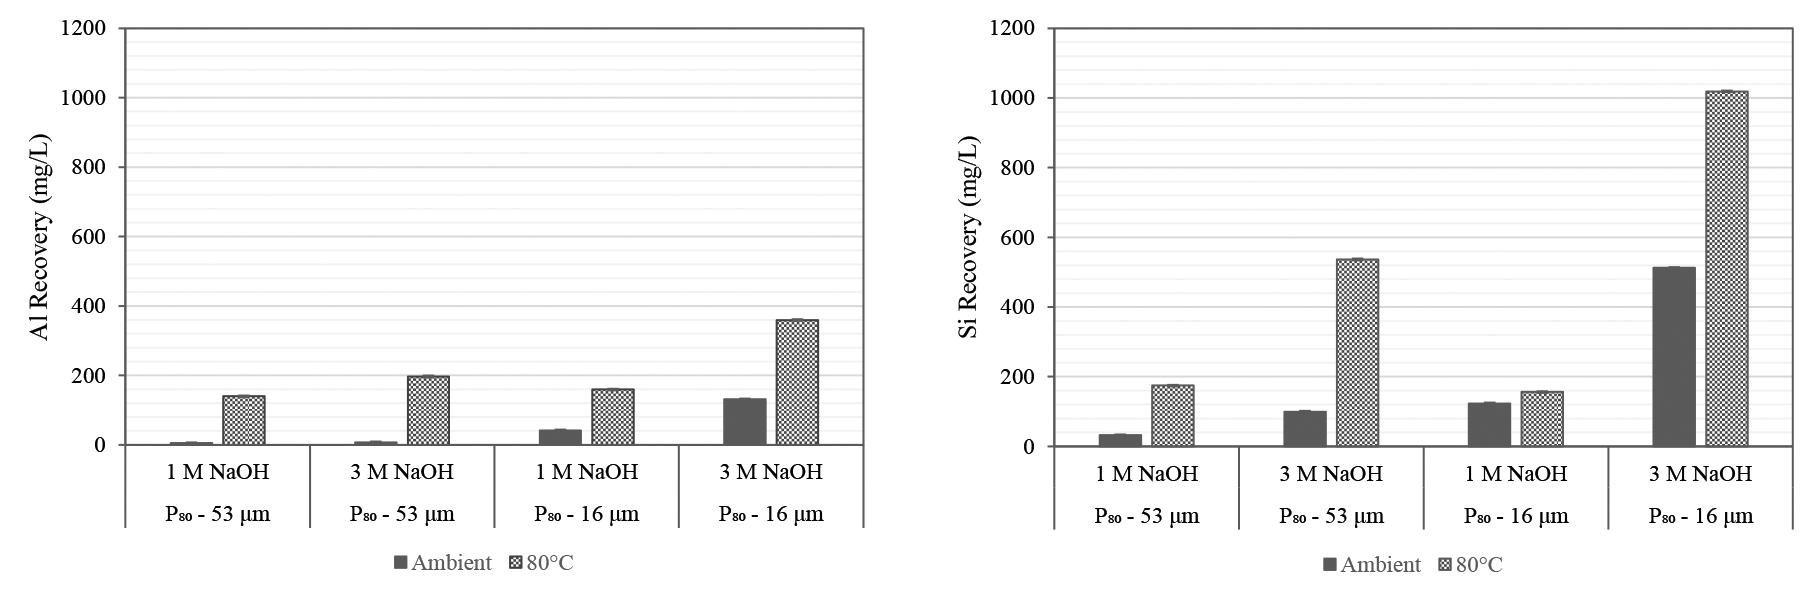
pre-treatment analysed as a proxy for sulphide minerals that were determined by QEMSCAN (Figure 5) to account for up to 0.3% of the tailings. S recovery at ambient conditions increases with increasing NaOH concentration. The release of As and S due to alkaline dissolution also liberates any gold encapsulated in mineral matrices containing these elements and would also account for increased gold recoveries compared to direct cyanidation (Darban et al. 2011, Mesa Espitia and Lapidus 2015).
A comparison of gold recovery after pre-leaching and the extraction of significant elements from the tailings indicates that the pre-leaching mechanism for these tailings is far more complex than the release of gold from encapsulated mineral matrices. In
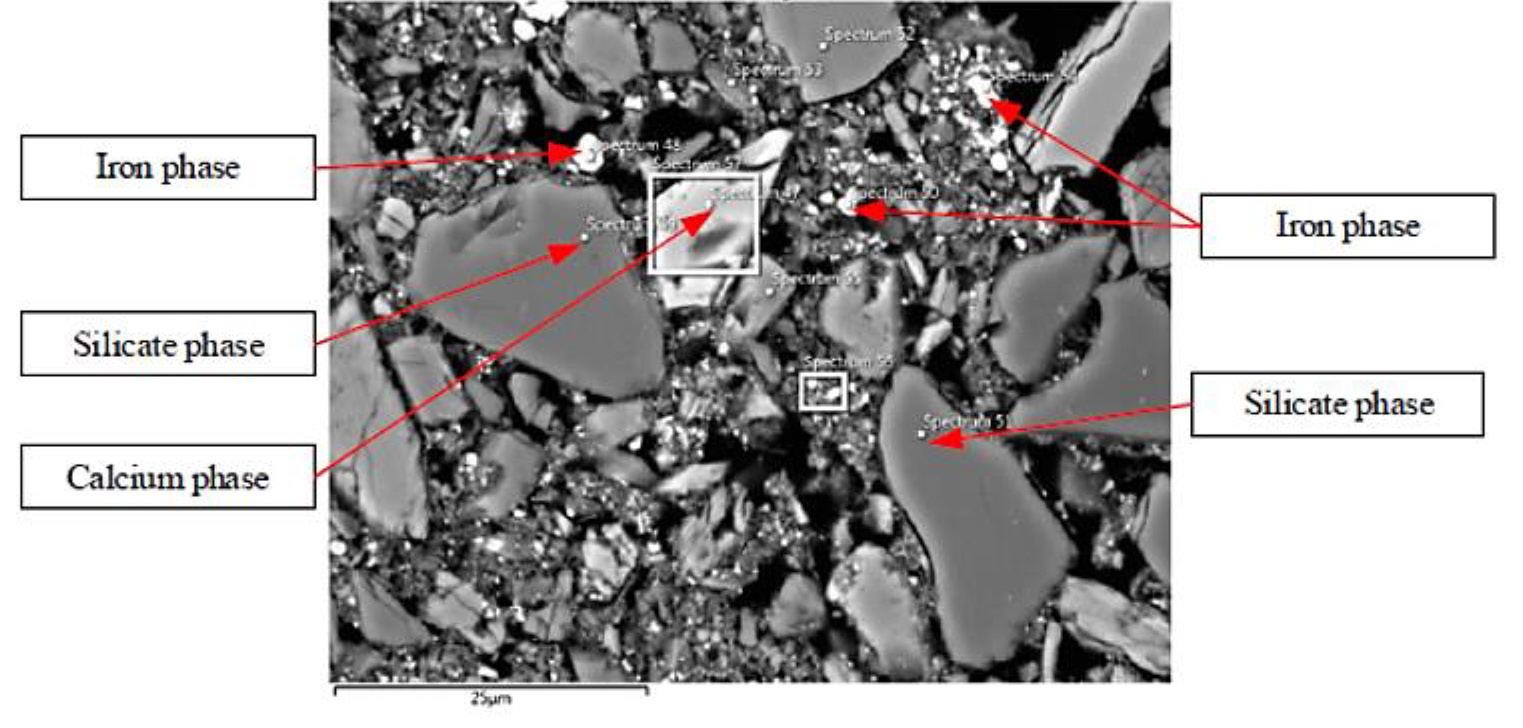
general, high extraction of these elements was accompanied by low gold recoveries. It can be hypothesised that the elements of greater concern are As and S and their associated mineral phases, as these are known to be cyanide consumers.
Decomposition of arsenopyrite and pyrite species in alkaline systems is proposed to produce Fe oxide species and soluble As species, (Bhakt, Langhans, and Lei, 1989; Meng, 2005) Equations [1]–[4].
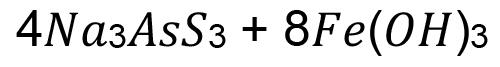
While gold can be mobilized through the oxidation of sulphur and arsenic, the remaining Fe oxide species can act as cyanide consumers and likewise, sulphur species (S2-) and arsenic species reacted with lime to form Ca2AsS3 (Yannopoulos, 1991).
Figure 11 shows a SEM image of the tailings after pre-leaching. Fe phases are identified along with Ca phases and silicate phases which were not completely broken down in the process. Assuming a chemical system involving oxidation of Fe-As-S phases such as that described above, increased sulphur extraction may be accompanied by increased liberation of cyanide-consuming species that can be activated in the leaching stage, resulting in reduced Au recovery. This implies that either longer residence times are required for complete oxidation of cyanide consumers, or stronger lixiviant conditions are required to ensure that the material is completely leached. For the specific samples tested, alkaline pre-treatment, while beneficial due to the release of gold from silicate and amphibolite matrices, is counteracted by the generation of competing cyanide consumers that limit the extent of gold extraction.
Heating in the form of roasting by microwaves was applied to the tailings sample to determine whether the increased energy input could be exploited to further alter the minerals encapsulating gold, and determine whether differential heating of microwave absorbers and non-absorbers could induce lixiviant pathways through generation of cracks for improved gold extraction (Amankwah and Ofori-Sarpong, 2011). In Figure 12, Au recovery from microwave roasting of the sample as received at 30 minutes and 60 minutes is shown compared to an ultra-fine ground sample.
Although it is not expected that all the energy supplied by the microwaves in the set-up is absorbed by the sample, it is apparent that prolonged energy input is required to induce the release of gold from the gangue matrices. After 60 minutes of microwave roasting 43.7% Au recovery is achieved through cyanidation compared to 18.2% after 30 minutes of roasting. For finer material gold recovery increases to (68.4%) after 30 minutes of roasting. This value is marginally higher than that obtained after direct cyanidation of ultrafine ground material with no pre-treatment (66.5%). The observations suggest that ultrafine grinding in this case resulted in maximum exposure of gold for subsequent leaching and defines the maximum recovery barrier.
Figure 12—Direct cyanidation results of microwave roasted samples
SEM analysis (Figure 13) of the material after microwave roasting shows fracture within the silicate matrices which might have been induced by differential heating of adjacent sulphide phases. Figure 13 shows a silicate particle adjacent to an Fe phase that might be an alteration product of an Fe-S phase. As with NaOH pre-leaching, while the oxidation of sulphur phases is beneficial towards liberation of locked or encapsulated gold, the remaining Fe species are still cyanide consumers and therefore the refractory nature of the tailings material is only partially reduced.
Microwaves were further used to aid direct cyanide leaching and investigate improvement in recoveries from the as-received (P8053 μm) and ultrafine (P80-16 μm) samples (Figure 14). Leaching at 2 kg/t NaCN for both the as-received sample and ultrafine sample resulted in low gold recoveries of 3.2% and 15.0% respectively. Increasing the NaCN dosage to 4 kg/t and 8 kg/t, also yielded low gold recoveries at 20.3% and 29.0% respectively from the as-received sample. Although the recovery increases with NaCN dosage, the low values confirm the chemical refractoriness of the as-received sample due to the high concentration of cyanicides as discussed for these tailings (Pooley, 1987; Yannopoulos, 1991).
Increasing the NaCN dosage to 4 kg/t for the ultrafine milled sample had a significant effect on the gold recovery. The attained recovery was 39.5%. Furthermore, doubling the NaCN dosage to 8 kg/t resulted in a 17.4% increase in gold recovery to 56.9%. The significant improvement in gold recovery from the ultrafine milled sample brought about by 8 kg/t NaCN, highlights the benefits of the rapid kinetics associated with microwave-assisted leaching. According to Huang and Rowson (2002) and Krishnan, Mohanty, and Sharma, (2007), thermal convection currents are generated
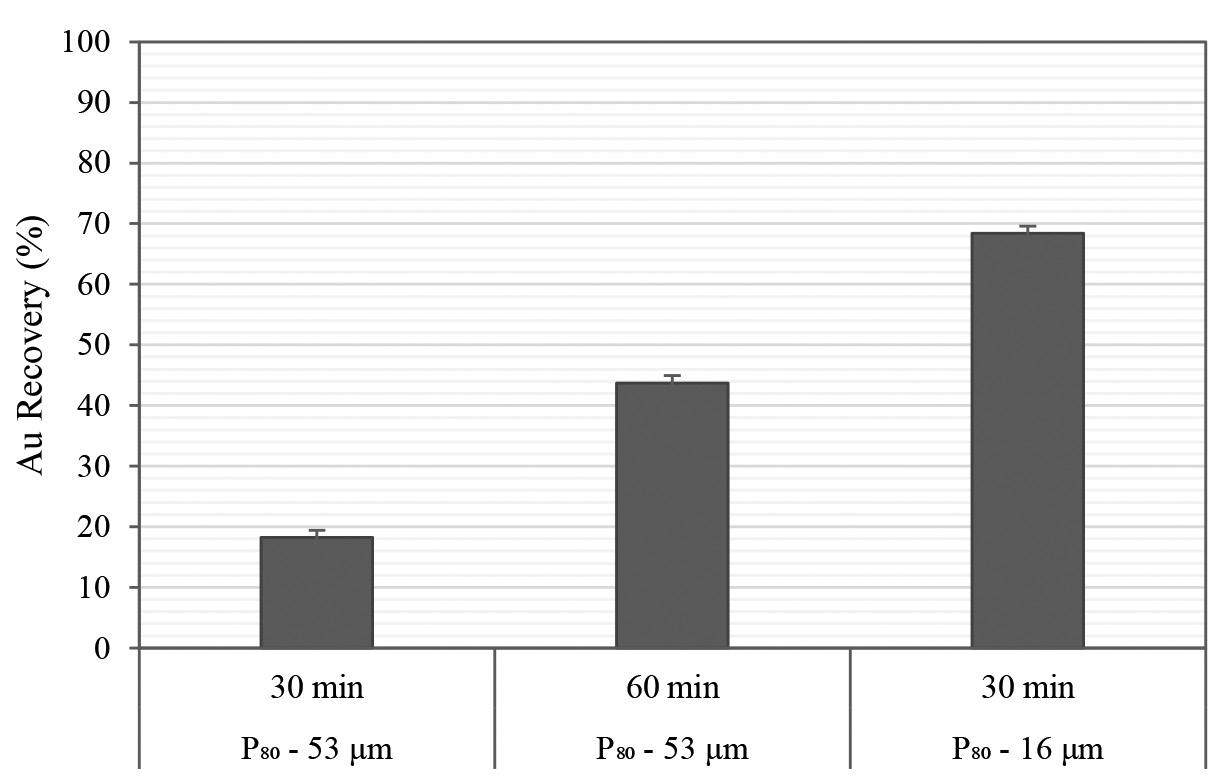
by differential heating responses of the various ore constituents. These convection currents facilitate the rapid removal of reaction products from the solid-liquid interface, allowing rapid exposure of unleached surfaces to continuous lixiviant action. The vigorous nature of the leaching was found to be effective in washing away any passivated gold surfaces, thus exposing them to cyanide action. In an earlier work, Mukendi, Handfield-Jones, and Akdogan, (2000) carried out microwave-assisted cyanide leaching tests on a different refractory materials containing 35% pyrite, 13% arsenopyrite, and 5% pyrrhotite which resulted in gold recoveries of 59%. However, the Au recovery from these tailings was not comparable to that of direct cyanidation after ultrafine grinding, and with such high cyanide consumption, assisted leaching would be uneconomical.
Figure 15 shows a SEM image of the tailings after microwaveassisted leaching. It can clearly be observed that there is exposure of some specifically silicate matrices within the or. However, the liberation of gold to a significant extent remains unattainable.
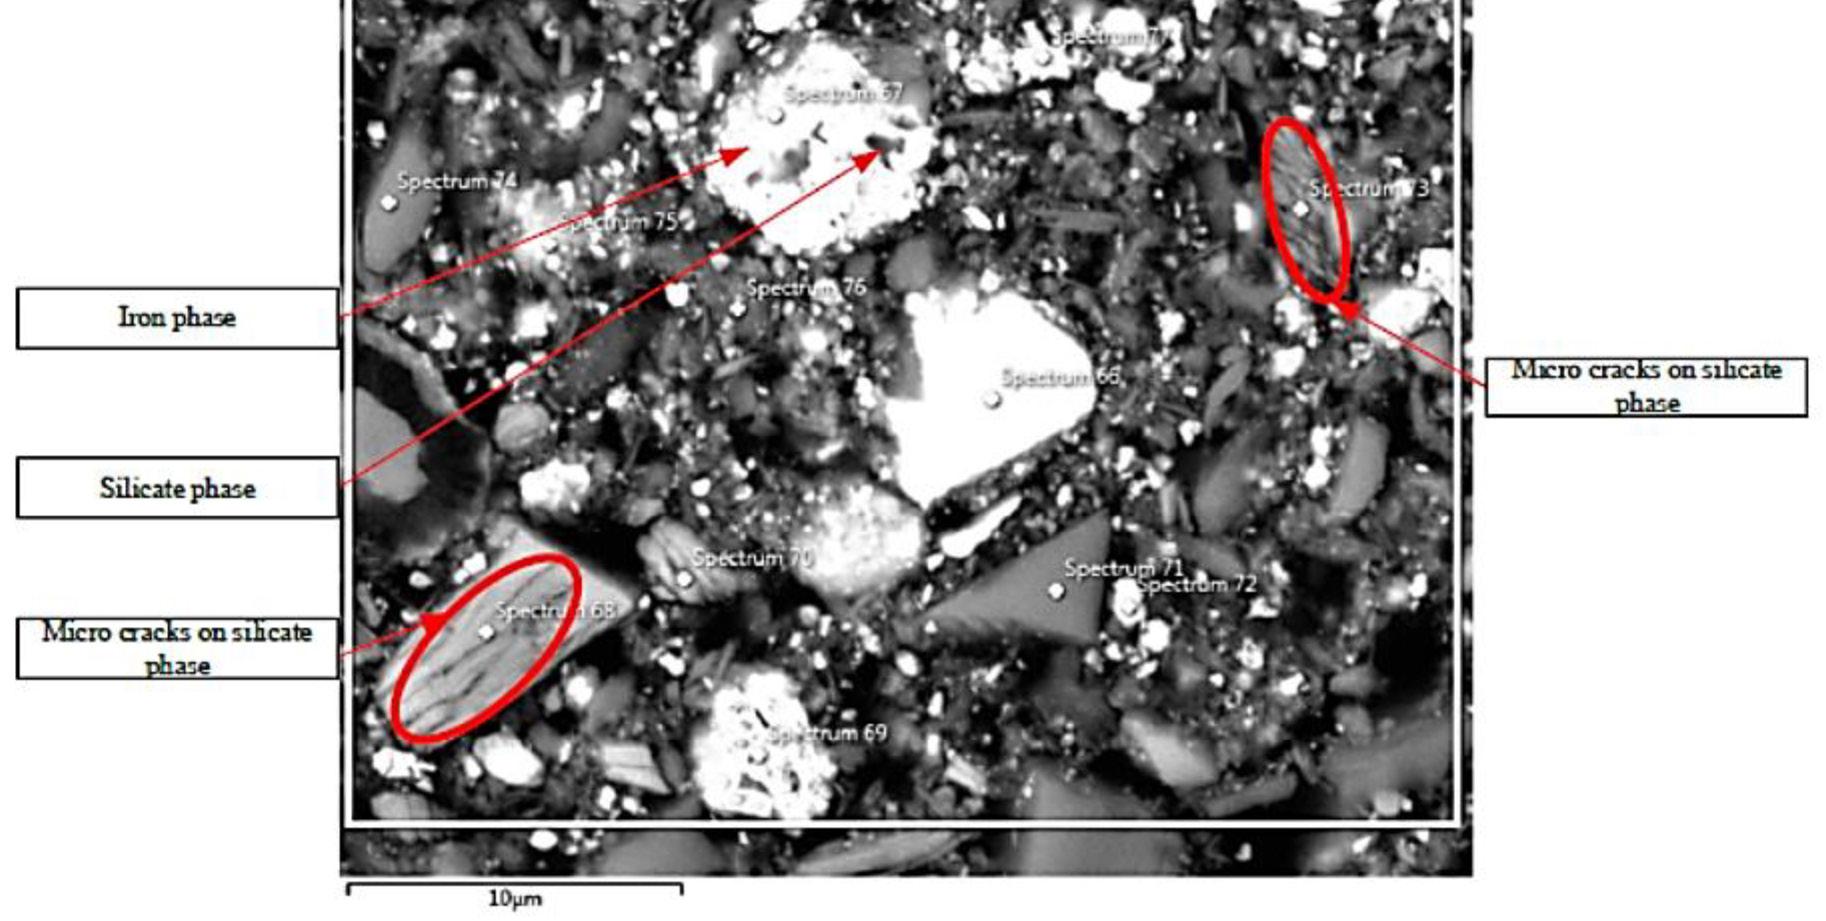
Calcination is an oxidative roasting process historically used in gold mining to remove cyanide-consuming species such as Fe-As-S minerals. The tailings from such a process therefore comprise heat-altered minerals with residual cyanide-consuming species and often with entrapped valuable gold. This research investigated gold recovery from calcine tailings and various pretreatment processes (mechanisms) most suitable for enhancing
gold recovery, such as fine grinding, NaOH leaching, microwave roasting, and microwave-assisted leaching. The refractory nature of the tailings was evident from direct cyanidation of the material (P80 –53 μm) reaching a gold recovery of 17.3% after 24 hours. Fine grinding (P80 -16 μm) resulted in improved liberation of the gold in the sample, increasing the gold recoveries to 66.5%.
Alkaline pre-treatment (NaOH) resulted in the highest gold recovery in the study, 71.6% at a P80 of 16 μm, ambient temperature pre-leaching, and 3 M NaOH. The 5.6% difference with alkaline pre-treatment of finely ground material reflects the percentage of gold that was not mechanically liberated. A recovery of 51.6% was achieved for the tailings sample without fine grinding (P80 –53 μm) at ambient temperature pre-leaching conditions and of 1 M NaOH. High-temperature pre-leaching consistently produced low gold recoveries compared to ambient temperature pre-leaching. High recoveries of detrimental elements such as Fe, As, and S into leaching solutions under these conditions might possibly lead to precipitation of species that increase cyanide consumption during leaching. Although the recovery after alkaline pre-treatment is 14.9% lower than that after two pre-treatment steps including further grinding, the two pre-treatment steps correspond to significant energy consumption and therefore, increased costs.
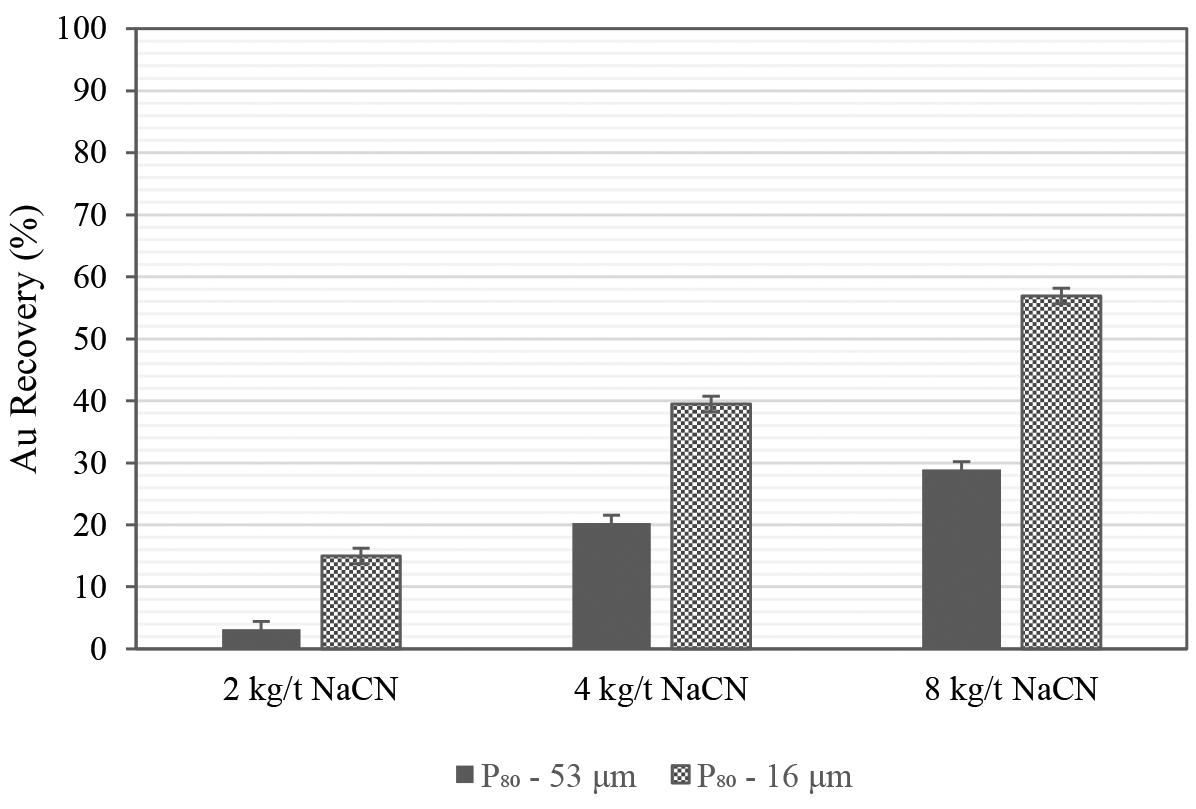
Microwave roasting and assisted leaching improved recovery by 17.3% but were not comparable to alkaline pre-treatment. NaOH pre-leaching is therefore concluded to be the most feasible process option based on low energy consumption and moderate recovery of gold.
The authors acknowledge the funding and support of the Royal Society and African Academy of Sciences through the Future Leaders African Independent Researchers (FLAIR) grant FLR\ R1\191541. The authors would also like to acknowledge Pan-African Mining resources, Barberton Mines.
Allan, G.C. and Woodcock, J.T. 2001. A review of the flotation of native gold and electrum. Minerals Engineering, vol. 14, no.9. pp. 931–962.
Amankwah, R.K. and Ofori-Sarpong, G. 2011. Microwave heating of gold ores for enhanced grindability and cyanide amenability. Minerals Engineering, vol. 24, no. 6. pp. 541–544.
Anderson, G.S. and McDonald, N.W. 2016. IsaMills at Kalgoorlie Consolidated Gold Mines - from the M3000 to the M10000 and Replacement of the Roasters at Gidji Processing Plant. Proceedings of the 13th AUSIMM Mill Operators’ Conference, Perth. Australasian Institute of Mining and Metallurgy, Melbourne. pp. 29–38.
Anderson, C.G. and Twidwell, L.G. 2008. The alkaline sulphide hydrometallurgical separation, recovery and fixation of tin, arsenic, antimony, mercury and gold. Proceedings of the 2008 Global Symposium on Recycling, Waste Treatment and Clean Technology, REWAS 2008, vol. 3. pp. 159–168.
Asamoah, R.K., Skinner, W., and Addai-Mensah, J. 2018. Leaching behaviour of mechano-chemically activated bio-oxidised refractory flotation gold concentrates. Powder Technology. vol. 331. pp. 258–269.
Bhakta, P., Langhans, J.W., and Lei, K.P., 1989. Alkaline oxidative leaching of goldbearing arsenopyrite ores. US Department of the Interior, Bureau of Mines.
Buttress, A.J., Katrib, J., Jones, D.A., Batchelor, A.R., Craig, D.A., Royal, T.A., Dodds, C., and Kingman, S.W. 2017. Towards large scale microwave treatment of ores: Part 1 – Basis of design, construction and commissioning. Minerals Engineering, vol. 109. pp. 169–183.
Crundwell, F.K. 2014. The mechanism of dissolution of minerals in acidic and alkaline solutions: Part II Application of a new theory to silicates, aluminosilicates and quartz. Hydrometallurgy, vol 149. pp. 265–275.
Darban, A.K., Aazami, M., Meléndez, A.M., Abdollahy, M., and Gonzalez, I. 2011. Electrochemical study of orpiment (As2S3) dissolution in a NaOH solution. Hydrometallurgy, vol. 105, no. 3–4. pp. 296–303.
Das, A. and Sarkar, B. 2018. Advanced Gravity Concentration of Fine Particles: A Review. Mineral Processing and Extractive Metallurgy Review, vol. 39, no. 6. pp. 359–394.
Dunn, J.G. and Chamberlain, A.C. 1997. The recovery of gold from refractory arsenopyrite concentrates by pyrolysis-oxidation. Minerals Engineering, vol. 10, no. 9. pp. 919–928.
Fraser, K.S., Walton, R.H., and Wells, J.A. 1991. Processing of refractory gold ores. Minerals Engineering, vol. 4, no. 7–11. pp. 1029–1041.
Fernández, R.R., Collins, A., and Marczak, E. 2010. Gold recovery from higharsenic-containing ores at Newmont’s roasters. Minerals and Metallurgical Processing, vol. 27, no. 2. pp. 60–64.
González-Anaya, J.A., Nava-Alonso, F., and Pecina-Treviño, E.T. 2011. Gold recovery optimization of a refractory concentrate by ultrafine grinding - A laboratory study. Minerals and Metallurgical Processing, vol. 28, no. 2. pp. 95–101.
Guo, P., Wang, S., and Zhang, L. 2019. Selective removal of antimony from refractory gold ores by ultrasound. Hydrometallurgy. vol. 190. pp. 105161.
Haque, K.E. 1999. Microwave energy for mineral treatment processes - A brief review. International Journal of Mineral Processing, vol. 57, no. 1. pp. 1–24.
Huang, J.H. and Rowson, N.A. 2002. Hydrometallurgical decomposition of pyrite and marcasite in a microwave field. Hydrometallurgy, vol. 64, no. 3. pp. 169–179.
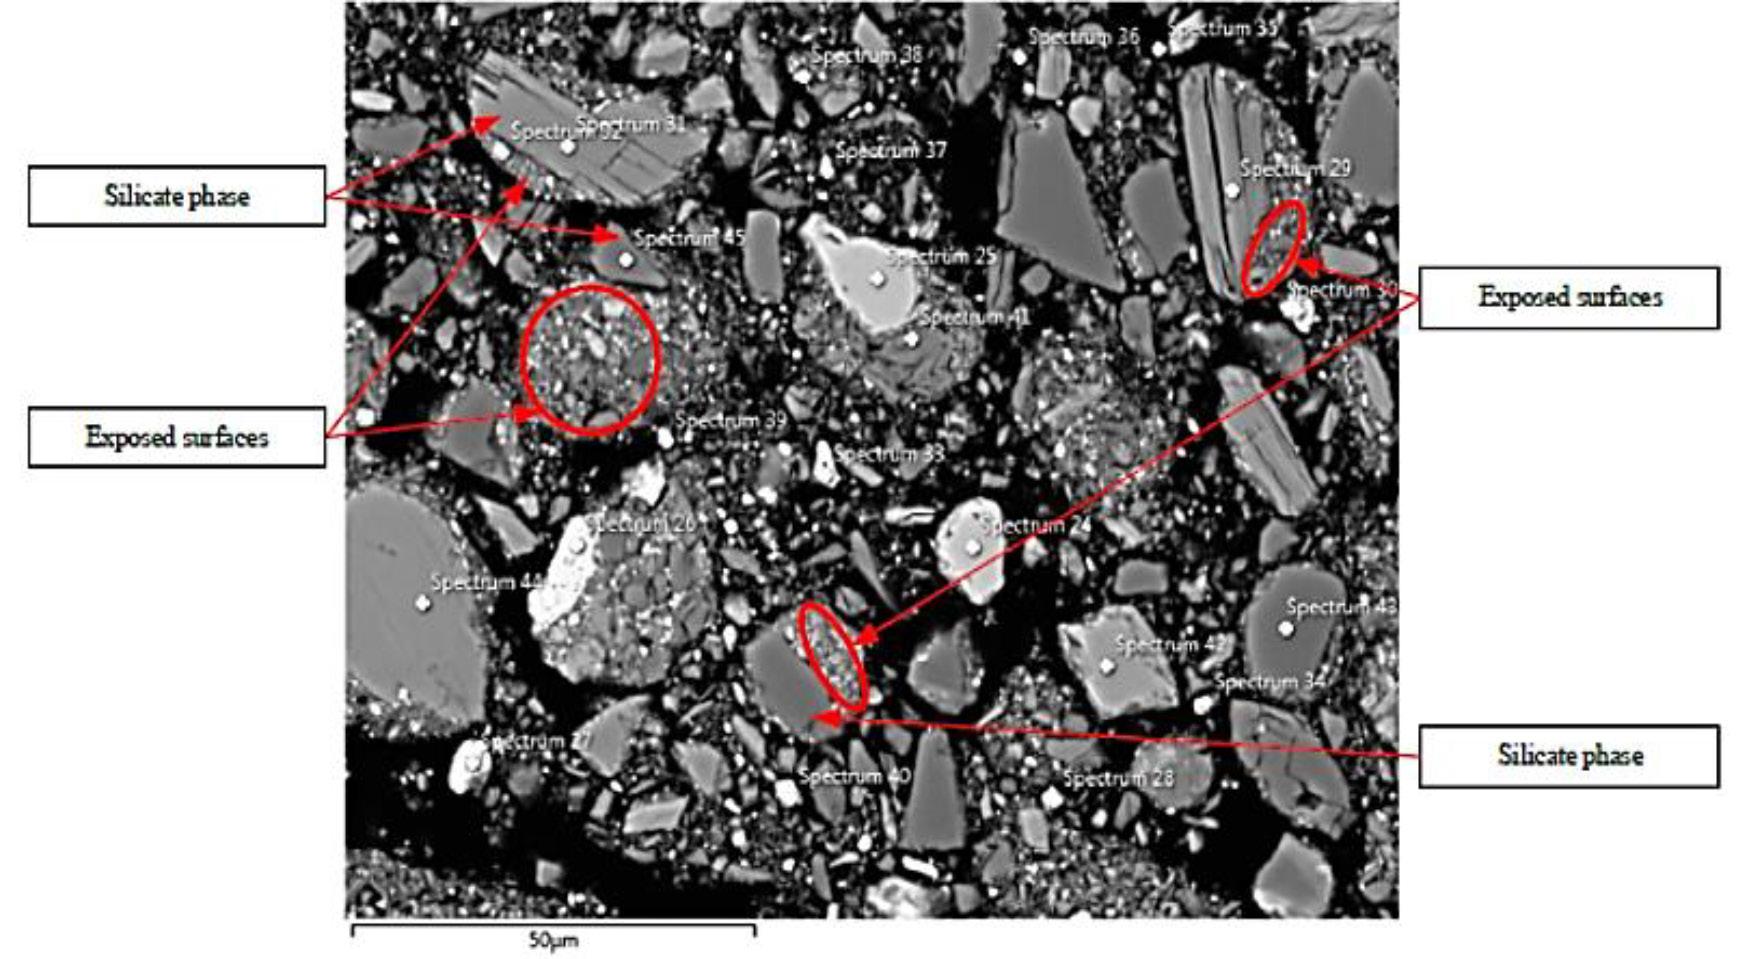
Iglesias, N. and Carranza, F. 1994. Refractory gold-bearing ores: a review of treatment methods and recent advances in biotechnological techniques. Hydrometallurgy, vol. 34, no. 3. pp. 383–395.
Janse van Rensburg, S. 2016. Guidelines for retreatment of SA gold tailings: MINTEK’s learnings. Proceedings of the 23rd WasteCon Conference. pp. 367–376. [Online], https://iwmsa.co.za/sites/default/files/downloads/56. Janse van Rensburg%2C S.pdf
Komnitsas, C. and Pooley, F.D. 1989. Mineralogical characteristics and treatment of refractory gold ores. Minerals Engineering, vol. 2, no. 4. pp. 449–457.
Koslides, T. and Ciminelli, V.S.T. 1992. Pressure oxidation of arsenopyrite and pyrite in alkaline solutions. Hydrometallurgy, vol. 30, no. 1–3. pp. 87–106.
Krishnan, K.H., Mohanty, D.B., and Sharma, K.D. 2007. The effect of microwave irradiations on the leaching of zinc from bulk sulphide concentrates produced from Rampura-Agucha tailings. Hydrometallurgy, vol. 89, no. 3–4. pp. 332–336.
Meng, Y.Q. 2005. New extraction process of carbonaceous refractory gold concentrate. Transactions of Nonferrous Metals Society of China (English Edition), vol. 15, no. 5. pp. 1178–1184.
Mesa Espitia, S.L. and Lapidus, G.T. 2015. Pre-treatment of a refractory arsenopyritic gold ore using hydroxyl ion. Hydrometallurgy, vol. 153. pp. 106–113.
Metzner, G. 1993. Multivariable and Optimising Mill Control—The South African experience. Proceedings of the XVIII International Mineral Processing Congress (IMPC), Sydney. pp. 203–299.
Mukendi, N.D., Handfield-Jones, R.V.R., and Akdogan, G. 2000. Microwave assisted leaching of refractory gold concentrates. Proceedings of the International Congress on Mineral Processing and Extractive Metallurgy, Melbourne, Australia. Australasian Institute of Mining and Metallurgy, Melbourne. pp. 197–199.
Nanthakumar, B., Pickles, C.A., and Kelebek, S. 2007. Microwave pre-treatment of a double refractory gold ore. Minerals Engineering, vol. 20, no. 11. pp. 1109–1119.
Pooley, F.D. 1987. Use of bacteria to enhance recovery of gold from refractory ores. Minprep 87, Proceedings of the International Symposoum on Innovative Plant and Processes for Mineral Engineering, 31 March–2 April 1987. pp. 1–14.
Snyders, C.A., Akdogan, G., Bradshaw, S.M., van Vreden, J.H., and Smith, R . 2018. The development of a caustic pre-leaching step for the recovery of Au from a refractory ore tailings heap. Minerals Engineering, vol. 121, July 2018. pp. 23–30.
Yalcin, E. and Kelebek, S. 2011. Flotation kinetics of a pyritic gold ore. International Journal of Mineral Processing, vol. 98, no. 1–2. pp. 48–54.
Yannopoulos, J.C. 1991. The Extractive Metallurgy of Gold. Van Nostrand Reinhold, New York.
Zhang, G., Wang, S., Zhang, L., and Peng, J. 2016. Ultrasound-intensified leaching of gold from a refractory ore. ISIJ International, vol. 56, no. 4. pp. 714–718. u
Affiliation:
1Faculty of Mining and Geology, VSB-Technical University of Ostrava, Czech Republic.

2Muncipality Bruntál, Czech Republic.
Correspondence to: J. Dvořáček
Email: jaroslav.dvoracek@vsb.cz
Dates:
Received: 26 Nov. 2020
Revised: 14 Feb. 2022 Accepted: 13 Jul. 2022 Published: October 2022
How to cite:
Dvořáček, J., Malíková, P., Sousedíková, R., Heviánková, S., Rys, P., and Osičková, I. 2022 Water production as an option for utilizing closed underground mines. Journal of the Southern African Institute of Mining and Metallurgy, vol. 122, no. 10, pp. 571 578
DOI ID: http://dx.doi.org/10.17159/24119717/1439/2022
ORCID: J. Dvořáček https://orcid.org/0000-00030487-9764
P. Malíková https://orcid.org/0000-00027117-8215
R. Sousedíková https://orcid.org/0000-00031857-7097
S. Heviánková https://orcid.org/0000-00026370-6874
Each mining project goes through the same life-cycle, from prospecting and exploration to closure and post-closure periods. This prompts the question whether the closure of a mine constitutes the end of its life-cycle or whether the decommissioned mine can be employed for some other purpose. Best-practice references indicate that there are many viable options. In our opinion, the production of service water is one such option.
Laboratory research was carried out on the water from a flooded underground coal mine in OstravaKarviná coal district, Czech Republic, concerning the production of service water from pumped minewater. The research proved the practical feasibility of service or process water production. Given the effect of global climate change with regard to water resources, good prospects for this additional resource can be assumed since the water has to be pumped in any case for safety reasons.
underground mine, mine closure, service water production.
Mining activities have for millenia provided minerals, energy, and building materials for human society. The lifespan of mineral deposit exploitation differs, depending on the deposit size, the intensity of mining, renewal of mining, as well as other factors.
Regardless of specific factors, each mining project is subject to the same life-cycle: the search for new deposits (prospecting and exploration), mine development, operation, and closure and postclosure periods (van Zyl, Scoble and Wilson, 2007). The mine life-cycle lengths can be calculated in years, but they can be measured in centuries. Notwithstanding the actual characteristics of the deposit, its exploitation inevitably comes to an end, for a variety of reasons: economic (low commodity price or high operational cost), geological (e.g. decrease in ore grade), technical (adverse geotechnical conditions), regulatory (safety or environmental breaches), policy changes (e.g. mining as a threat to the environment), social or commodity pressures (e.g. from environmental or community action groupings), closure of downstream industries or markets (e.g. coal mines affected by closure of power stations), flooding or inrush (Laurence, 2006).
Mining activities concern artisanal and small-scale mining (Mhangara, Tsoeleng, and Mapurisa, 2020), as well as large multinational companies (Robinson, 2016). Legal mining activities have always been subject to the supervision of state authorities, mainly for safety reasons. In recent decades, supervision and regulation in terms of environmental protection has been increasing. As such, mine closure and post-closure activities have been regulated by national legislation (e.g. Sutton and Weiersbye, 2007; Flores, Lima and Herrmann, 2007; Sutton et al., 2008; Cobby, 2007; Rankin et al., 2007). Legislation related to mine closure or environmental factors is generally concerned with the safety of operations and minimizing the environmental impact of closure. These provisions also concern the technicalities of closing deep underground mines, especially as regards closing of ventilation and entrance shafts.
A good question can be asked, namely, does a mine closure mean the end of the mine life-cycle or can it be employed to serve other purposes?
The history of mining activities in the Czech Republic dates back many centuries. Nevertheless, the last decade of the 20th century witnessed fundamental economic changes, which, together with steadily growing pressure for environmental protection, led to a decline in mining activities and closure of many mines. Deep-level mining of coal, which was one of the most important commodities, was significantly affected.
In the Czech Republic, the basic methods of technical liquidation of underground mines are as follows:
➤ Flooding
➤ Backfill by loose (non-solidified) material
➤ Hydraulic backfill (solidified material)
➤ A combination of the above.
For a long time, flooding of mines has been a typical and most frequently used method of technical closure. Typically, the main mine workings leading to the surface are sealed and the mine is left to nature. The prerequisite for the method is the removal of all machinery and materials which might contaminate the mine water.
This is a frequently applied closure method. The shaft intersections with horizontal workings are closed by dams, and the mining equipment is removed. Cheap, easily available materials are used for backfilling – barren tailings, wash dirt, quarry aggregate, demolition debris, etc. The technical closure of underground mines by loose backfill is incomplete as it concerns only the shaft proper. The remaining underground spaces are left open and become flooded.
In the past, mixtures of ash and wash dirt were used for backfilling purposes, especially for closing of the horizontal workings. In a relatively short time, such mixtures solidify spontaneously, forming a concrete-like material. Both investigations and practical experience have shown that other industrial waste can also be utilized for similar hydraulic backfill provisions. The solidified backfill can be used for packing of all underground workings.
Combinations of the above methods have also been practised –backfill in aqueous medium or hydraulic backfill and backfill by loose material in the same shaft. The combination of the methods is realized by employing the components in approximately equal proportions (Dvořáček and Štěrba, 2006).
Technical liquidation by loose or hydraulic backfill prevents access to underground workings, which excludes the possibility of future repurposing of underground mines. In contrast, a flooded underground mine cannot be considered as irrevocably closed. Mining can be resumed after the water has been pumped out or, following partial dewatering, some method of closing the pit by the backfill medium solidifying in humid environment can be used.
Nevertheless, resumption of mining per se is only one of many repurposing options. Research on the matter has specified many other options for re-using decommissioned mines.
The literature on the subject refers to the following principal options of reusing underground mines:
A place or object that makes a unique contribution to the history of humanity and nature can be listed as a World Heritage Site. The UNESCO World Heritage List includes cultural property, industrial and natural monuments, cultural and natural
landscapes. There are also sites related to the history of mining –e.g. the mines of Rammelsberg and Zollverein coal mine industrial complex in Essen (Germany), the Falun Copper Mountain mining area (Sweden), the mining landscape of Cornwall and West Devon (UK), the Sewel mining settlement (Chile), Jazan Iwami silver mines (Japan) and others (Rybár, 2016). At the end of the 20th century, many mining industry activities were severely restricted in regions with a long mining tradition. As a partial solution to social problems in these regions, mining attractions and museums have been established and are open to the general public. One of the most well-known underground educational guided tours in Europe is the Salt Mine of Wieliczka and Bochnia in Poland (UNESCO World Heritage Centre, 2022). There are dozens of similar mines around the world – e.g. in USA (Crystal Gold Mine in Idaho, Copper Queen Mine in Arizona etc.) (National Mining Association, 2021). The Edgar Mine in Colorado (USA) (Colorado School of Mines, 2022) and Reiche Zeche in Freiberg (Germany) (Grab et al., 2011) offer also education and research opportunities.
Reclamation as a restoring of cultural landscape with the possibility of recreation is more common as regards surface mining (e.g. Stenhouse, Evans, and Thomas, 2006). Recreational repurposing of closed underground mines also occurs. An example is the salt mine of Bochnia, Poland, where 250 m below the surface a full-size field for playing volleyball, basketball, or tennis was created (Popielak and Zięba, 2007). In the same site, speleotherapy has been practised. This is a kind of respiratory therapy that involves inhaling of the mineral-infused air in the micro-climate of a salt mine, which can be beneficial for the treatment of cutaneous disorders, asthma, and other respiratory ailments.
The difference in elevation between the pit opening and the bottom makes the application of the pumped-storage hydroelectricity (PSH) method possible. In times of low electricity demand, excess electrical power is used to pump water into the upper reservoir located at the pit opening. Low-cost surplus (off-peak) electric power is used to run the pumps. When there is a higher demand, water is released back into the lower reservoir through a turbine, generating electricity. Several repurposing projects regarding decommissioned deep underground mines have been implemented in the USA, Finland, and Australia. In the Czech Republic, a pilot-scale pumped-storage hydroelectricity project was implemented at the Jeremenko mine water pit using an elevation difference of 580 m (MPO, 2015).
In a flooded deep underground mine, there is a large rock–water interface across which geothermal heat transfer can occur. This provides for large heat energy reservoirs. The renewable energy of these reservoirs can be tapped by making bores into the existing flooded mines or using their pit openings if available. Pit water is pumped to local heat-exchanger stations, where heat is transferred via heat exchangers to the local heating network. The cooled water is returned to the pit at a similar temperature to minimize the thermal impact. It can also be discharged at the surface. This is called an open cycle. In a closed cycle, the mine water does not circulate, but a heat exchanger is immersed in it
and the heat energy is transferred to the liquid that circulates in the piping system of the heat pump. In summer, pit water can be pumped from shallower parts of the reservoir at a lower temperature and used for cooling. There are many such successful projects worldwide, e.g. in Germany, Holland, Norway, Russia, Spain, Great Britain, the USA, Canada, and the Czech Republic (Hall, Scott, and Shang, 2011; Ramos, Breede and Falcone, 2015; Preene and Younger, 2014; Watzlaf and Ackman, 2006; Janson et al., 2016; Bracke and Bussmann, 2015; Loredo et al., 2017; Korb, 2012; Banks et al., 2019; Michálek et al., 2007; TU Bergakademie Freiberg, 2022).
This may include the use of mine water for irrigation purposes and for the production of drinking water.
Irrigation: An example is a project in South Africa, where mine water discharged into the Upper Olifants River Catchment in Mpumalanga Province, which polluted the local river, was treated. Pollution could be prevented by collecting and treating mine water to a quality where it could be used for irrigation (van Zyl et al., 2001). Another case involves a direct re-use of mine drainage water for agricultural irrigation in the Hunter Valley, Australia (International Association of Hydrogeologists, 2018). At the Butte site in Montana, USA, the Mine Waste Technology Program funded a long-term pumping test on a well that intercepts the 600-foot level of the horizontal workings. Water in the flooded mine could be utilized for irrigating areas that have been revegetated for mine site rehabilitation purposes (Nordwick et al., 2008).
Drinking water production: An older example comes from Northern Upshur County, West Virginia, USA. In 1981, more than 70 towns or villages derived all or part of their water from coal mines. Mines in the southern part of the state had coal seams with a low sulphur content, and acid mine drainage was usually not a problem. Water from the free drainage mines in the north and west part of the region generally had greater hardness, sulphate, iron, and manganese than water from the flooded mines in the southern part of region. Most mine water requires some treatment (Hobba, 1987). A good example is provided by the eMalahleni Water Reclamation Plant, South Africa. The plant treats water from three Anglo American thermal coal operations and from South Witbank Colliery of BHP Billiton. The desalinated water is delivered to the local municipality drinking water system, meeting some 20% of its daily water requirements. This situation can be adaped to alternative sources of water for mining operations: (i) dewatering, (ii) desalination, (iii) mine or residential waste water (Toledano et al., 2014).
When underground uranium mines are flooded after their closure, the level of uranium dissolved in the water increases. Mine water from flooded uranium mines thus represents a significant source of uranium. The Olší-Drahonín uranium deposit in the Czech Republic is an example of uranium recovery as a by-product of running a mine water purification plant. Since 1996, the excess mine water has been purified, using ion exchange technology. In the period 1996–2006, the uranium yield was 1500–3000 kg/a (Michálek et al., 2008).
Development of mining industries is cyclical. Mining activities may be suspended only to be resumed at a later point when
technical or economic problems of extraction and processing of raw materials have been solved (e.g. water inflow) or demand for minerals renewed. Tin production in the Slavkov Forest region, Western Bohemia, Czech Republic could serve an example. Primary deposits have been extracted since the end of the 14th century, and the tin deposit was variably utilized and abandoned, especially in the 17th and 19th centuries. A new pit development was started in 1971. Underground operations were terminated in 1991, and underground workings with a large remaining ore reserve were flooded (Rudné doly, 2014).
Uranium mine No. 16 near Příbram, Czech Republic, was in operation from 1957 to 1991. The construction of an underground cavern reservoir in the granite massif was begun in 1992. In 1998, the filling of the underground storage facility designed for a pressure of 11 MPa, was started, enabling the storage of 72 million m³ of natural gas. This can balance the differences between summer and winter gas consumption and provide compensation for fluctuations in gas consumption and supply (iPROSPERITA, 2018).
Even after a coal mine has been closed, methane continues to leak from the coal deposit underground and can be used as an energy source. The decommissioned mine of Paskov, Ostrava-Karviná Coal Basin, Czech Republic, provides a good example. Its three pits have been closed to depths of 150 to 285 m by gas plugs. A degassing pipeline passes through the plugs, leading to an exhaust station which provides a mixture of methane and air for energy generation purposes. A similar system is in operation in North Rhine-Westphalia, Germany (Trejbal, 2009).
There are many cases of utilizing the underground space of closed mines. Examples of such utilization include offices, warehousing space, and manufacturing in Kansas City limestone mines, USA; cheese aging in Ollomont Mine, Italy; storage of oil in Harsbacka Mine, Sweden; steel company plant and storage of goods in Randolph Mine, USA, (Peila and Pelizza, 1995).
If geological conditions of abandoned mines are suitable concerning permeability and insulation of workings, the mines can be used as depositories for waste, such as fly-ash (e.g. Nakatatsu Mine, Japan), industrial waste (Codana Mine, Italy), or even chemical waste (Walsall Wood Colliery, UK) (Peila and Pelizza, 1995).
Besides purpose-built underground spaces, closed or active deep mines can be utilized for research and various underground activities, like those of the Japan Microgravity Centre of Sunagawa Mine, Japan (Peila and Pelizza, 1995). There are some underground facilities reserved for research activities in the framework of the European Underground Laboratories Association network – underground infrastructures in Switzerland, common coal mine in Poland, the deepest active hard-rock mine in Europe situated in Finland, former silver mine Reiche Zeche in Germany etc. (European Underground Laboratories Association, 2020). Research, education and practical training in actual mining conditions are offered by some of them (Barakos et al., 2019; Mischo, 2015).
Based on the above overview, it can be estimated that harnessing hydrothermal energy from the flooded underground pits after closure constitutes a major benefit for society. Currently, utilizing pit water for the production of drinking or industrial water plays rather a secondary role. Nevertheless, if we consider that there are many renewable energy sources (e.g. sun, wind) relatively easily available and water is an irreplaceable commodity, it can be assumed that utilizing deep underground mine water for the production of drinking or industrial water offers an exceptional potential.
The Ostrava-Karviná basin (OKR) with its four sub-basins is the most significant coal region in the Czech Republic, and the only deep coal deposit that is currently exploited. In the early 1970s, production of coal was in excess of 24 mt/a. In 1991, the process of mine decommissioning and closure began. This has continued ever since, although mining in the Karviná sub-basin is still active. The closed mines in the Ostrava-Karviná district were flooded. For security reasons and to prevent uncontrollable inflows from flooded mines in the Ostrava sub-basin, a system of water level maintenance was implemented in the flooded mines.
The water level of the flooded mines in the Ostrava district is kept at a lower level than that of the interconnections to still active mines in the Karviná part of the Ostrava-Karviná basin. To provide for this purpose, two water pumping stations have been put into operation at the former mines of Jeremenko and Žofie. Pumped water is discharged directly into the local rivers, and the whole process is closely monitored (Martinec et al., 2005).
The total volume of water pumped from the Jeremenko pit reaches approximately 5.5 million cubic metres per annum. Mine water pumping and treatment is a long-term and expensive process. In the Czech Republic, recent climate change occurrence has been associated with rising average temperatures and precipitation decline. The question is whether the pit water can be used for production of industrial or drinking water.
The mine water of the Jeremenko pit falls into the category of natural, very strongly mineralized water of the chemical type, Cl, HCO₃-Na, i.e. brackish water of sodium chloride type. Organic and microbiological pollution of the tested mine water is minimal and in fact negligible, taking the given purpose into account. The composition of the pit water was monitored from March 2020 to October 2020 at regular intervals of 14 days. The monitored indicators were as follows.
➤ Temperature, dissolved oxygen, power of hydrogen (pH) and conductivity were measured by multimeter, (WTW GmBH Multi340i, WTW, Prague, Czech Republic). All parameters were measured according to the standards: ČSN 75 7342 Water quality - Determination of temperature; ČSN ISO 17289 Water qualityDetermination of dissolved oxygen - Optical sensor method; ČSN ISO 10523 Water quality - Determination of pH, ČSN EN 27888 Water quality - Determination of electrical conductivity (ISO 7888:1985)
➤ Turbidity was measured by turbidimetric analysis according to ČSN EN ISO 7027-1. Water QualityDetermination of turbidity - Part 1: Quantitative Methods
➤ Acid neutralizing capacity (ANC₄,₅), basic neutralizing
capacity (BNC₈,₃), chemical oxygen demand (COD), and chlorides (Cl ) were quantified by titrimetric analysis. All parameters were measured according to ČSN 75 7372 Water Quality - Determination of base neutralizing capacity (acidity); ČSN EN ISO 9963-1 Water Quality
- Determination of alkalinity - Part 1: Determination of total and composite alkalinity; ČSN EN ISO 99632 Water Quality - Determination of alkalinity - Part 2: Determination of total and carbonate alkalinity; ČSN EN ISO 8467 Water Quality - Determination of permanganate index; ČSN ISO 9297 Water Quality - Determination of chloride. Silver nitrate titration with chromate indicator (Mohr's method)
➤ Carbonate species (HCO₃ or H₂CO₃) were determined from neutralization capacities according to ČSN EN 75 7373 Water Quality - Calculation of carbon dioxide form (species)
➤ Total dissolved solids (TDS) and dissolved solids (DS) were quantified gravimetrically according to ČSN 75 7346
Water quality – Determination of dissolved solids; ČSN EN 872 Water quality - Determination of suspended solidsMethod by filtration through glass fibre filters
➤ Spectrometric analysis was carried out for lead, cadmium, chromium, copper, nickel, cobalt, barium, lithium, calcium, magnesium, potassium, sodium, iron, manganese, and zinc contents. All elements were measured by atomic absorption spectrometry (AAS) using a Varian AA280FS instrument (Agilent, Santa Clara, CA, USA) (Table I).
The average values for major and minor pit water constituents are listed
Major components
Sodium hydrogen carbonates 2.19 – 2.30 g/L
Chlorides 3.79 – 4.32 g/L
Sodium 2.37 – 3.19 g/L
Total dissolved solids (TDS) 8.34 – 11.56 g/L
Dissolved solids (DS) 8.13 – 11.51 g/L
Conductivity 12.73 – 14.58 mS/cm
pH 6.40 – 7.97
Turbidity: 4.72 – 20.94 NTU
Minor components
Sulphates 180 – 250 mg/L
Calcium 130 – 189 mg/ L
Potassium: 29.9 – 35.3 mg/ L
Magnesium 89.1 – 107.0 mg/L
Chemical oxygen demand (COD) 5.42 – 6.75 mg/L
Iron 0.02 – 0.79 mg/L
Manganese 0.14 – 0.18 mg/L
Zinc 0.02 – 0.05 mg/L
Barium 1.23 – 1.65 mg/L
Lithium 1.44 – 2.05 mg/L
Chromium 1.00 – 20.00 mg/L.
The concentrations of other measured metals, (lead, cobalt, cadmium, nickel, and copper were below the detection limit of the instrument, <1.00 μg/L)).
Based on the measurement results for selected physicochemical indicators, and with regard to the purpose of further use, it is necessary to choose such treatment processes that are able to significantly reduce the concentration of pit water ions. Such processes include membrane and ion exchange processes. For values of dissolved substances above 1 g/L, it is convenient to use membrane processes. At values lower than 1 g/L, ion exchange processes are more suitable (Traiblazer Technologies, 2022). It is often appropriate to combine these processes, for example where it is necessary to remove the maximum amounts of solutes (requirement for some process waters).
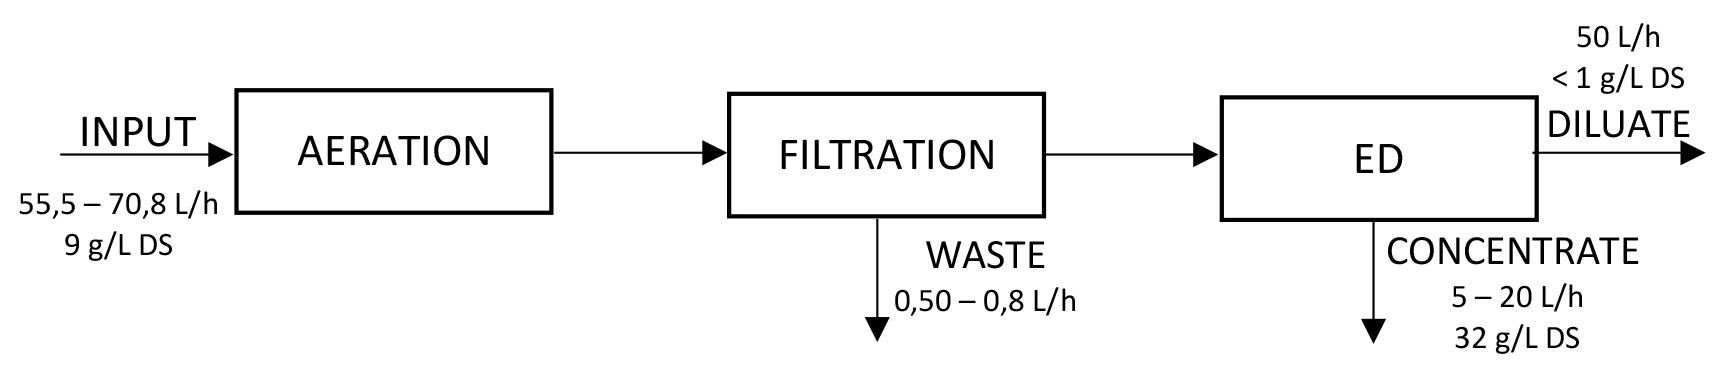
The analysis enables development of a technology for production of service or process water from the treated pit water that meets legislative provisions of the Czech Republic.
According to our research and in terms of electrodialysis (ED) applications, there is an increased risk of high concentration of HCO₃ ions (around 2 g/L) in combination with a higher concentration of Ca2+ ions (around 150 mg/L), which leads to the formation of insoluble salts (CaCO3). This effect might gradually reduce the efficiency of membrane separation, reduce the flow of final products, and degrade their quality. The pit water must be pre-treated. The aim of water treatment and pre-treatment procedures is to minimize the carry-over of other substances into the treated pit water. Therefore, reagent compositions are chosen that correspond to the nature of the composition of the treated pit water, and there is also an obvious focus on the cost of the pretreatment procedures.
Electrodialysis is an electromembrane separation method, the principle of which is based on the migration of ions in an electric field between the cathode and the anode.
Electrodialysis tests were performed by running a batch mode on laboratory-scale unit, EDR-Z/10-1.0 (MEGA, Stráž pod Ralskem, Czech Republic) in laboratory conditions at a potential of 14 V. A 2% Na2SO₄ solution was used as the electrolytic solution. Heterogeneous ion-selective membranes, RALEX®AM(H)-PP and RALEX®CM(H)PP, were used. The effective area of the ED module was 1 344 cm². The ratio of diluate to concentrate was 1:1. Figure 1 illustrates the process.
The results testified to the applicability of the proposed
technology. Addition of oxygen precipitated carbonates and stabilized the pH values. This pre-treatment method ensures reduction of the concentration of HCO₃ ions by 1/2 at the expense of reducing the concentration of Ca²⁺ ions up to tens of units per milligram. The concentrations of the monitored indicators in the diluate and concentrate are given by Table II.
Desalination of 2L of the feed water was tested for 30 minutes reduced the initial conductivity from 13.940 mS/cm to 0.349 mS/cm.
The diluate compositions indicated that the water was of low mineral content and could be used as service or process water or could be further treated by reverse osmosis to produce demineralized water (water free of all solutes).
The concentrate can be used to obtain salts or could by be applied as a kind of technical salt solution, for example to maintain roads in winter. Depending on the degree of concentration, a more concentrated solution can then be obtained.
In the drinking water production, the procedure would be significantly more complicated. In addition to complying with a number of legislative requirements, it would be necessary to supplement the technology by remineralization and disinfection, and it would also be needed to address water transport to consumers across a range of allotments with private and municipal owners. The mine is located in the town centre, which complicates the whole matter of drinking water provision and we do not see this option as feasible at present. Also, costs play an important role.
In the absence of a concrete technical project, costs are difficult to specify. Saving costs for water pumping would be economically interesting because water must be pumped continuously for safety reasons. Furthermore the owner of the pit does not wish to release the necessary economic indicators.
Prima facie, the mine shutdown and decommissioning seem to be the final end of the mine life-cycle, followed only by costs of monitoring, ensuring public health and safety, environmental restoration, and rehabilitation.
Experience suggests that under
can be repurposed in various ways so as to offer significant benefits.
Some options for using closed mines have their alternatives – goods can be stored in surface objects, natural phenomena can also be studied on the surface, energy can be obtained from other sources.
In principle, there is no alternateive for the production of service or drinking water – perhaps with the exception of costly desalination of seawater.
There are increased concentrations of salts in the mine water, and we examined the efficiency of the method of electrodialysis to desalinate mine water.
Considering the current climate change and the condition the drinking water sources, positive expectancy can be assumed for this additional water source.
We used electrodialysis, a well-known method for desalination of water. For the specific conditions of the Jeremenko pit water, we verified the application of the method for the production of service or process water.
Utility water production can be regarded as incidental to the technological and safety urgency of the continuous pumping of the Jeremenko pit water. Pumping prevents overflow from the flooded mines in the Ostrava sub-basin in to the active part of the Ostrava-Karviná coal basin.
The flooding of a mine is not to be considered as a final stage of the mine life-cycle as these are options for future repurposing action, inclusive the use of the mine water.
Banks, D., Athresh, A., Al-Habaibeh, A., and Burnside, N. 2019. Water from abandoned mines as a heat source: practical experiences of open and closed loop strategies, United Kingdom. Sustainable Water Resources Management, vol. 5, March 2019. pp. 29–50.
Barakos, G., de P. Bueno, M., Luukkanen, S., Mischo, H., Zhang, Z., Gonzales, M.S., Holopainen, P., and Remes, A . 2019. The Minetrain Project: Developing an advanced level training program for mining industry professionals in an actual deep mine site. Society for Mining, Metallurgy & Exploration, Littelton, CO. https://www.onemine.org/document/abstract.cfm?docid=249457 [accessed 31 January 2022]
Bracke, R. and Bussmann, G. 2015. Heat storage in deep hard coal mining infrastructures. Proceedings of World Geothermal Congress, Melbourne, Australia, 19–25 April 2015. International Geothermal Association.
Cobby, G. 2007. Western Australian regulatory approach to mining approvals and mine closure. Proceedings of the Second International Seminar on Mine Closure, Santiago, Chile, 16 – 19 October 2007. Fourie, A., Tibett, M. and Wiertz, J. (eds). Australian Centre for Geomechanics, Nedlands, Western Australia. pp. 103–106.
Colorado School of Mines. 2022. Edgar Mine. https://tour.mines.edu/edgarmine/ [accessed 24 January 2022]
ČSN (Czech State Norm). https://csnonline.agentura-cas.cz [accessed 4 February 2022].
Dvořáček, J. and Štěrba, J. 2006. The choice of the technical liquidation of underground mine workings. Proceedings of the First International Seminar on Mine Closure, Perth, Australia, 13–15 September 2006. Fourie, A. and Tibett, M. (eds). Australian Centre for Geomechanics, Nedlands, Western Australia. pp. 257–260.
European Underground Laboratories Association. 2020. The underground laboratories in the EUL. https://undergroundlabs.network/undergroundlaboratories/ [accessed 27 January 2022]
Flores, J.C.C., Lima, H.M., and Herrmann, H. 2007. Mine closure – Legal, social and environmental aspects in Brazil. Proceedings of the Second International
Seminar on Mine Closure, Santiago, Chile, 16–19 October 2007. Fourie, A., Tibett, M., and Wiertz, J. (eds). Australian Centre for Geomechanics, Nedlands, Western Australia. pp. 79–88.
Grab, T., Storch, T., Gross, U., and Wagner, S. 2011. Performance of geothermal thermosyphons using propane. Proceedings of VIII Minsk International Seminar Heat Pipes, Heat Pumps, Refrigerators, Power Source. Minsk, Belarus 12–15 September 2011. doi: 10.1615/HeatPipeScieTech. v2.i/4.60
Hall, A., Scott, J.A., and Shang, H. 2011. Geothermal energy recovery from underground mines. Renewable and Sustainable Energy Reviews, vol. 15, no. 2. pp. 916–924
Hobba, Jr., W.A. 1987. Underground coal mines as a source of water for public supply in northern Upshur County, West Virginia. Water Resources Investigations Report 84 – 4115. US Geological Survey, Charleston, WV. 38 pp.
International Association of Hydrogeologists. 2018. Mining Enterprises & Groundwater. Strategic Overview Series. https://iah.org/wp-content/ uploads/2018/12/IAH_SOS_MiningEnterprisesGroundwater.pdf [accessed 7 October 2020]
iPROSPERITA . 2018. Podzemní zásobník Háje slaví 20 let (The Háje underground reservoir of Haje celebrates 20th anniversary). https://www.iprosperita.cz/ vyrobky-a-sluzby/8952-podzemni-zasobnik-haje-slavi-20-let [accessed 26 January 2022]
Janson, E., Boyce, A.J., Burnside, M., and Gzyl, G. 2016. Preliminary investigation on temperature, chemistry and isotopes of mine water pumped in Bytom geological basin (USCB Poland) as a potential geothermal energy source. International Journal of Coal Geology, vol. 164, July 2016. pp. 104–114.
Korb, M.C. 2012. Minepool Geothermal in Pennsylvania. 2012. Proceedings of the PA AML Conference ‘New Frontiers in Reclamation’, August 2–4, 2012. pp. 1–22. https://2012.treatminewater.com/KorbMinepoolGeothermal2012.pdf
Laurence, D.C. 2006. Why do mines close? Proceedings of the First International Seminar on Mine Closure, Perth, Australia, 13–15 September 2006. Fourie, A. and Tibett, M. (eds). Australian Centre for Geomechanics, Nedlands, Western Australia. pp. 83–94.
Loredo, C., Ordóñez, A., Garcia – Ordiales, E., Álvarez, R., Roqueñi, N., Cienfuegos, P., Peña, A., and Burnside, N.M. 2017. Hydrochemical characterization of a mine water geothermal energy resource in NW Spain. Science of the Total Environment, vol. 576, January 2017. pp. 59–69.
Martinec, P., Schejbalová, B., Hortvík, K., and Maníček, J. 2005. The effects of coal mining on the landscapes of the Ostrava region. Moravian Geographical Reports, The Czech Academy of Science, Institute of Geonics, vol. 13, no. 2. pp. 13–26.
Mhangara, P., Tsoeleng, L.T., and Mapurisa, W. 2020. Monitoring the development of artisanal mines in South Africa. Journal of the Southern African Institute of Mining and Metallurgy, vol. 120, no. 4. pp. 299–306.
Michálek, B., Holéczy, D., Jelínek, P., and Grmela, A. 2007. Využití tepelné energie důlních vod zatopených hlubinných dolů (Utilization of thermal energy from flooded underground mines). Acta Montanistica Slovaca, vol. 12, no. 1. pp. 92–98.
Michálek, B., Rapantová, N., Grmela, A., and Hájek, A. 2008. Quasi – stagnant mine waters of flooded uranium deposits as a utilizable uranium source. Proceedings of the Third International Seminar on Mine Closure, Johannesburg, South Africa, 14 – 17 October 2008. Fourie, A., Tibett, M., Wiersbye, I. and Dye, P. (eds). Australian Centre for Geomechanics, Nedlands, Western Australia. pp. 509–519.
Mischo, H. 2015. Underground experimental mines for technology and mining equipment research and development. Proceedings of SME Annual Conference and Expo and CMA 117th National Western Mining Conference – Mining: Navigating the Global Waters, Denver, USA, 15–18 February 2015. Society for Mining, Metallurgy & Exploration, England, CO. pp. 368–371.
Ministr průmyslu zahájil provoz jedinečné vodní elektrárny v Ostravě. 2015 (Minister of Industry has launched a unique hydroelectric power plant in Ostrava, 2015). MPO, 20 July 2015. https://www.mpo.cz/cz/rozcestnik/promedia/tiskove-zpravy/ministr-prumyslu-zahajil-provoz-jedinecne-dulni-vodnielektrarny-v-ostrave--160566/ [accessed 03 April 2020]
National Mining Association. 2021. Mining Museums and Tours. https://nma. org/about-nma-2/resources/mining-museums-and-tours/ [accessed 27 January 2022]
Nordwick, S., Petritz, K., Manchester, K., Joyce, H., and Bless, D.R. 2008. Resource recovery from flooded underground mines. Proceedings of US EPA/ NGWA Remediation of Abandoned Mine Lands Conference, Denver, Colorado, 2–3 October 2008. US Environmental Protection Agency.
Peila, D. and Pelizza, S. 1995. Civil reuses of underground mine openings: A summary of international experience. Tunnelling and Underground Space Technology, vol. 10, no. 2. pp 179–191.
Popielak, R.S. and Zięba, K. 2007. Medieval salt mine – A modern tourist attraction with an ancient history. Proceedings of the Second International Seminar on Mine Closure, Santiago, Chile, 16 – 19 October 2007. Fourie, A., Tibett, M. and Wiertz, J. (eds). Australian Centre for Geomechanics, Nedlands, Western Australia. pp. 869–877.
Preene, M. and Younger, P.L. 2014. Can you take a heat? – Geothermal energy in mining. Mining Technology, vol. 123, no. 2. pp. 107–118.
Ramos, P.E., Breede, K., and Falcone, G. 2015. Geothermal heat recovery from abandoned mines: a systematic review of projects implemented worldwide and a methodology for screening new projects. Environmental Earth Sciences, vol. 73, March 2015. pp. 6783–6795.
Rankin, M.G., Almenara, A., Rodriguez, A., and Tremblay, G.A . 2007. Abandoned mines in Peru – Prioritisation of environmental remediation. Proceedings of the Second International Seminar on Mine Closure, Santiago, Chile, 16 – 19 October 2007. Fourie, A., Tibett, M. and Wiertz, J. (eds). Australian Centre for Geomechanics, Nedlands, Western Australia. pp. 111–119.
Robinson, I. 2016. The globalization of the South African mining industry. Journal of the Southern African Institute of Mining and Metallurgy, vol. 120, no. 4. pp. 769–775.
Rudné doly. 2014. Útlum těžby ložisek Sn – W rud a likvidace Dolu Stannum (1). (Reducing extraction of Sn – W ore deposits and the liquidation of the Stannum Mine (1)). https://www.zdarbuh.cz/reviry/rd-pribram/utlum-tezbylozisek-sn-w-rud-a-likvidace-dolu-stannum-1/ [accessed 08 October 2020]
Rybár, P. 2016. Banský turizmus (Mining tourism). Edičné stredisko. Fakulta BERG, Košice, Slovenská republika.
Stenhouse, P.B., Evans, C.M., and Thomas, D. 2006. Rehabilitating a historical
coal mine in Wangoloa, New Zealand – A holistic approach to mine closure. Proceedings of the First International Seminar on Mine Closure, Perth, Australia, 13 – 15 September 2006. Fourie, A. and Tibett, M. (eds). Australian Centre for Geomechanics, Nedlands, Western Australia. pp. 279–283.
Sutton, N.W. and Weiersbye, I.M. 2007. South African legislation pertinent to gold mine closure and residual risk. Proceedings of the Second International Seminar on Mine Closure, Santiago, Chile, 16–19 October 2007. Fourie, A., Tibett, M. and Wiertz, J. (eds). Australian Centre for Geomechanics, Nedlands, Western Australia. pp. 89–102.
Sutton, M., Pretorius, H., Nel, J.H., Julyan, F., and Rex, H.G. 2008. Closure planning and estimating within the Southern Africa division of a global gold miner. Proceedings of the Third International Seminar on Mine Closure, Johannesburg, South Africa, 14–17 October 2008. Fourie, A., Tibett, M., Weiersbye, I., and. Dye, P. (eds). Australian Centre for Geomechanics, Nedlands, Western Australia. pp. 145–159.
Toledano, P., Thomashausen, S., Maennling, N., and Shah, A . 2014. A framework to approach shared use of mining – Related infrastructure. Columbia Center on Sustainable Investment, Columbia University. http://ccsi.columbia.edu/ files/2014/05/A-Framework-for-Shared-use_March-2014.pdf [accessed 08 October 2020]
Traiblazer Technologies. 2022. Revolutionary water recovery solutions. https://www.tbtech.co.za [accessed 26 January 2022]
Trejbal, Z. 2009. Possibilities of utilizing gas from abandoned underground mines. GeoScience Engineering, vol. LV, no. 2. pp 29–38.
TU Bergakademie Freiberg. 2022. Reiche Zeche Freiberg. https://geothermie.iwtt. tu-freiberg.de/en-monitoring-exhibition-mine-reiche-zeche-freiberg.html [accessed 26 January 2022]
UNESCO World Heritage Centre. 2022. https://whc.unesco.org/en/list/32 [accessed 11 February 2022]
Van Zyl, H.C., Maree, J.P., van Niekerk, A.M., van Tonder, G.J., and Naidoo, C. 2001. Collection, treatment and re-use of mine water in the Olifants River Catchment. Journal of the South African Institute of Mining and Metallurgy, vol. 101, no. 1. pp. 41–46.
Van Zyl, D.J.A., Scoble, M., and Wilson, G.W. 2007. Mine life cycle systems models and integrated mine closure for sustainability. Proceedings of the Second International Seminar on Mine Closure, Santiago, Chile, 16–19 October 2007. Fourie, A., Tibett, M. and Wiertz, J. (eds). Australian Centre for Geomechanics, Nedlands, Western Australia. pp. 217–223.
Watzlaf, G.R. and Ackman, T.E. 2006. Underground mine water for heating and cooling using geothermal heat pump systems. Mine Water and the Environment, vol. 25, March 2006. pp. 1–14. u
SAIMM is proud to host the Third Copper Cobalt Africa Conference.

To be held in Livingstone, Zambia, this anticipated and prestigious event provides a unique forum for discussion, sharing of experience and knowledge, and networking for all those interested in the processing of copper, cobalt, and base metals in an African context, in one of the world’s most spectacular settings - the Victoria Falls.

The African Copper Belt has experienced a period of some difficulty since the last conference, held in 2018. Owing to the global slowdown in commodity demand during the early stages of the pandemic, many operations scaled down production or were placed on care and maintenance. For those continuing in business, this resulted in considerable focus on process and operating cost optimization, productivity improvements, product quality enhancements, skills development and capacity building, and consolidation of best practice within the industry. Ongoing projects are required to be well-defined and -motivated, and subject to greater technical and financial scrutiny, to ensure that they can rapidly ramp up and deliver immediate value.

The burgeoning global lithium-ion battery market has, however, opened up numerous opportunities in the region for expanded cobalt production and interest in producing high-purity base-metal salts for cathode material applications, as well as consideration of recycling efforts for end-of-life products.
This conference provides a platform for discussion of new and more agile ways of operating and remaining relevant and innovative in a world that has changed considerably since the global COVID-19 pandemic.
Technical topics span the value chain from mineralogy and geometallurgy, through project development, operations and processing, to highpurity value-added products, recycling, and sustainability issues. Selected
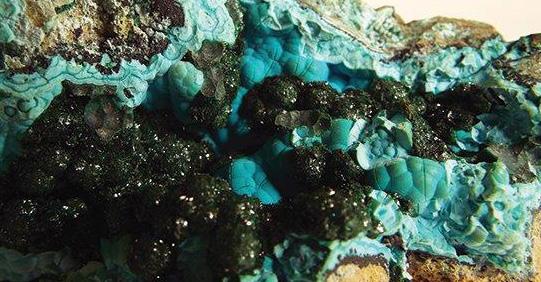
papers on relevant economic issues will also be considered. Industry operators will be able to share technical experience and practices, meet vendors, and learn about new technologies and processes that can add value to their operations. Worldclass plenary speakers will offer a unique opportunity to hear first-hand opinions on the status and overview of the industry.
Two Continuing Professional Development short courses are planned. Hydrometallurgy of Cobalt will focus on the various unit operations in cobalt processing, with relevance to the Copperbelt operations. As a new technology now being implemented in the region, Sulfide Flotation will provide an introduction to this topic for metallurgists, covering both fundamental and practical techniques. Both courses will be presented by leading engineers and accredited by the Engineering Council of South Africa.
For international participants, this conference offers an ideal opportunity to gain in-depth knowledge of and exposure to the African copper–cobalt industry, as well as other base-metal operations and projects in the region, and to better understand the various facets of minerals processing and extraction in this part of the world.
Hosted by the Metallurgy Technical Programme Committee of the Southern African Institute of Mining and Metallurgy (SAIMM), this conference aims to:
Promote dialogue between operators, vendors and service providers on common metallurgical challenges facing the industry;
• Enhance understanding of new and existing technologies that can lead to safe and optimal resource utilization;
• Encourage participation and build capacity amongst young and emerging professionals from the Copper Belt region.
The Organizing Committee looks forward to your participation.

The event is currently planned as an inperson conference only. As necessary, this decision may be revisited should country or international travel requirements change.
•
•
•
•
•
•
•
•
•
•
and
and
and urban mining
treatment and minimization
Affiliation: 1Department of Civil Engineering and Architecture, Zhengzhou University of Science and Technology, Zhengzhou, Henan, China.
Correspondence to: S. Chai
Email: shupeng.chai@outlook.com
Dates:
Received: 15 Dec. 2021
Revised: 18 Mar. 2022
Accepted: 28 Jun. 2022 Published: October 2022
How to cite: Chai, S. 2022
Maximum height estimation for mine waste dump. Journal of the Southern African Institute of Mining and Metallurgy, vol. 122, no. 10, pp. 579 586
DOI ID: http://dx.doi.org/10.17159/24119717/1947/2022
ORCID: S. Chai https://orcid.org/0000-00033600-6132
Waste dumps are widely used to discharge stripped mine wastes in open pit mining methods. As mining progresses, the height of the waste dumps will increase gradually, which may induce sliding failure once the height exceeds a critical value. Therefore, estimation of the maximum dumping height is crucial to the life-cycle use of a waste dump. However, published information about the maximum height of mine waste dumps are extremely rare. In this study, the maximum dumping height is estimated based on the strength-reduction technique by numerical simulations. The influences of dump geometry and properties on the maximum height are investigated. The results show that the maximum dump height decreases as the dump slope inclination angle α or the unit weight of dump materials γ increases, but decreases when the shear parameters of dump materials (cohesion c and internal friction angle ϕ) increase. The maximum height starts to increase with the ground inclination β when shear failure occurs at the interface between the dump and the base. Furthermore the effects of the dump width B, Young’s modulus E, and Poisson’s ratio μ of dump materials on the maximum height are almost insignificant. Good agreement was found between numerical results available in the literature and those obtained in this study.
waste dump, maximum dumping height, numerical models, stability.
In surface mining methods, large quantities of wastes are generated when removing the soil and rock overlying on the ore. This results in great challenges for mine waste management. Some of these mine wastes are used as backfilled materials in the excavated areas or underground mine stopes, but most are deposited on the surface as waste dumps (Bao et al., 2019; Chai, 2020; Rahul, Rai and Shrivasta, 2015; Wang and Chen, 2017; Zou et al., 2018).
Since the waste dump consists of a mixture of loose soil and various rock types, the dump slope is prone to instability. Slope failure at a waste dump can cause serious environmental problems and economic loss, and may even threaten the lives of nearby people (Bao et al., 2019; Blight and Fourie, 2005; Lazăr et al., 2012; Shakesby and Whitlow, 1991; Wang et al., 2020; Zhan et al., 2021). Therefore, it is crucial to ensure the stability of a waste dump slope throughout its life-cycle.
Over the years, extensive work has been conducted on existing waste dumps regarding failure mechanisms (Chen, 2018; Wang and Chen, 2017; Zhan et al., 2021), stability assessment (Adamczyk et al., 2013; Behera et al., 2016; Cho and Song, 2014; Gao et al., 2017; Kainthola et al., 2011; Wang, Zhang, and Lin , 2019), and stabilization of waste dumps (Chaulya et al., 1999; Gilbertson and Williamson, 1974; Rai, Khandelwal, and Jaiswal, 2012; Rajak et al., 2021; Ranjan et al., 2016). The failure of a waste dump during construction has been reported (Blight and Fourie, 2005; Chen, 2018; Kasmer, Ulusay and Gokceoglu., 2006; Poulsen et al., 2014; Steiakakis, Kavouridis, and Monopolis, 2009). Steiakakis, Kavouridis, and Monopolis, (2009), found that the failure of a waste dump at South Field Mine in northern Greece occurred at the third phase of deposition and caused about 2.5 Mm2 of waste materials to flow out of the dump boundary. Thus, research on sound design of waste dumps is valuable, but little detailed work on this aspect is available in the published literature to the author’s knowledge although some efforts have been made to investigate the factors influencing dump stability based on the factor of safety obtained from numerical simulations (Behera et al., 2016; Rai, Khandelwal, and Jaiswal, 2012; Upadhyay, Sharma, and Singh 1990; Yang and Ang, 2009).
Generally speaking, the stability analysis of a waste dump is similar to that of an ordinary slope (Griffiths and Marquez, 2007; Liu, Nian, and Wan, 2010). However, mine wastes are continuously produced by the mining process, thus the height of waste dump increases gradually. Besides, to make the best of the land resources as well as for economic reasons, the footprint of a mine waste dump should be minimized (Verma, Deb, and Mukhopadyay, 2017). Thus, it is of great importance to estimate the maximum height of waste dumps in the design procedure before the dumping operation starts.
In this study, a numerical method is presented to obtain the maximum dumping height of waste dumps under dry conditions. The strength reduction method is applied for the stability analysis of the dump slope using FLAC3D. Then, the influence of dump geometry and properties on the maximum dumping height is investigated. The numerical results are compared results in the literature for validation.
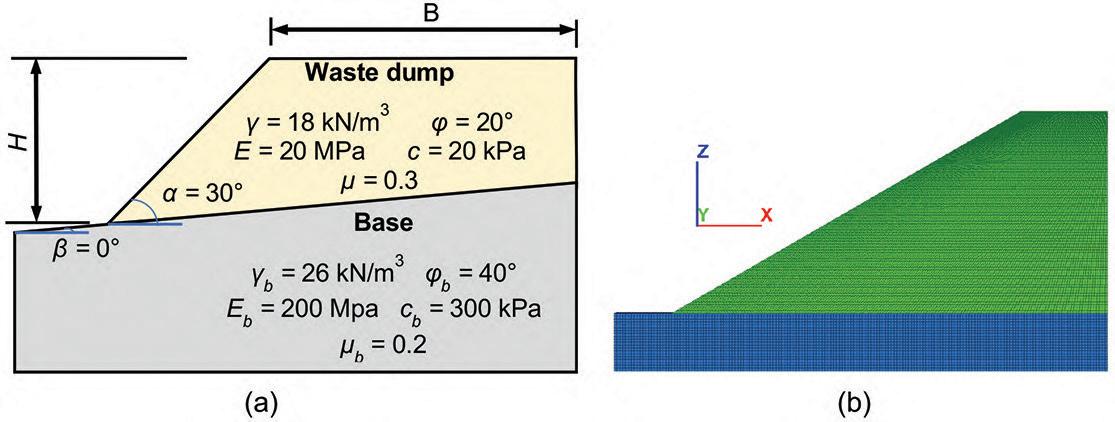
FLAC3D numerical software (Fast Lagrangian Analysis of Continua in 3 Dimensions) is based on the finite difference method, which is applied here for the estimation of maximum heights of waste dumps (Itasca., 2013). The validation of FLAC3D has been conducted by the author based on cylindrical hole problems and detailed descriptions are available in Chai (2020). The strength reduction technique, based on the limit equilibrium method, is used for the dump slope stability analyses with FLAC3D. In this case, a strength reduction factor F r is introduced to obtain the reduced cohesion (cr kPa) and friction angle φr,°) according to Equations [1] and [2].
15 m, which is the horizontal distance from the crest of the dump slope to the back of the dump. A unit thickness in the direction perpendicular to the diagram is used for the length L (m). The inclination angle of the waste dump α (°) and the ground inclination β (°) are selected as 30° and 0°, respectively. The dump and base are both regarded as elastoplastic materials obeying the Mohr-Coulomb criterion. The dump is characterized by dry unit weight γ = 18 kN/m³, Young’s modulus E = 20 MPa, Poisson’s ratio μ = 0.3, internal friction angle φ = 20°, and cohesion c = 20 kPa. The dilation angle ψ (°) and the tensile strength T0 (kPa) of the waste dump are both selected as zero. The base is relatively hard, with unit weight γb = 26 kN/m3, Young’s modulus Eb = 200 MPa, Poisson’s ratio μb = 0.2, internal friction angle φb = 40°, cohesion cb = 300 kPa, tensile strength T0b =100 kPa, and dilation angle ψb =0°.
Figure 1b shows the numerical model of a waste dump built with FLAC³D for the reference case. To simulate a plane-strain condition in FLAC3D, a unit thickness in the y-direction is used in the three-dimensional (3D) model and the front and back boundaries are fixed in the y-direction. Displacements along the left and right lateral boundaries are prohibited in the x-direction. The top boundary of the model is free to move in all directions, while the bottom boundary is fixed in all directions. The optimal mesh size is 0.5 m after a series of mesh sensitivity analyses.
To obtain the maximum height (H m)of the waste dump, a string of numerical simulations is conducted with different dump heights H. The height when the factor of safety F is equal to 1.0 can be regarded as the maximum dumping height H m. Table I shows a detailed sequence of numerical simulations with different dump geometries and properties. Case zero is the reference case used to show the procedure for obtaining the maximum dumping height H m. Cases 1-8 are conducted to investigate how these parameters influence the maximum height H m
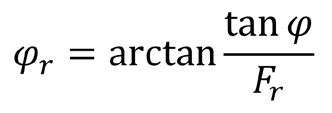
where c (kPa) and φ (°) are the cohesion and internal friction angle of a slope, respectively. A series of numerical calculations is conducted using different values of c r and φr by adjusting F r with a bracketing solution approach. The last stable calculation with a reduction factor F rs and the last unstable calculation with a reduction factor F ru can finally be obtained. Then, the average value of F rs and F ru is calculated as the factor of safety of the studied slope (F) in the numerical analyses.
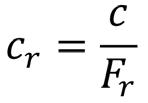
A typical physical model of a mine waste dump is shown in Figure 1a, which is taken as the reference case. The height of the dump H (m) is considered as the vertical distance from the toe of the dump slope to the crest. The width of the dump B is
Figure 2 shows the contours of maximum shear strain increment for the reference case in the last stable and unstable condition with dump height H = 45 m, 40 m, and 35 m. For the last stable cases shown in Figures 2(a), 2(c), and 2(e) there are some elements where the maximum shear strain increment is relatively large, but a continuous sliding surface from the toe to the crest of the dump slope cannot be observed; whereas shown in Figures. 2(b), 2(d), and 2(f) a continuous sliding surface occurred for all three heights, suggesting failure of the dump slope.
According to the numerical results, the factors of safety for the waste dump when H = 45 m, 40 m, and 35 m are 0.971, 1.013, and 1.052, respectively. To obtain the maximum height H m of the waste
additional numerical simulations using different heights H are conducted and the factor of safety F is calculated. Figure 3 presents the variation of F with dump height in the range of 10 m to 50 m for the reference case obtained from FLAC³D. With an increase in the dump height H, the factor of safety F is found to decrease gradually, corresponding well with the existing numerical results (Behera et al., 2016; Kainthola et al., 2011; Yang and Ang, 2009). Therefore, the maximum height of the waste dump for the reference case is about 40 m.
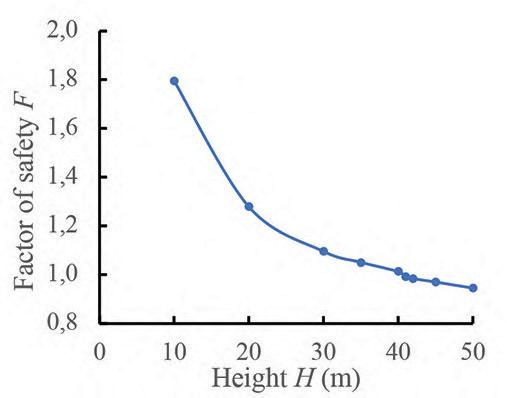
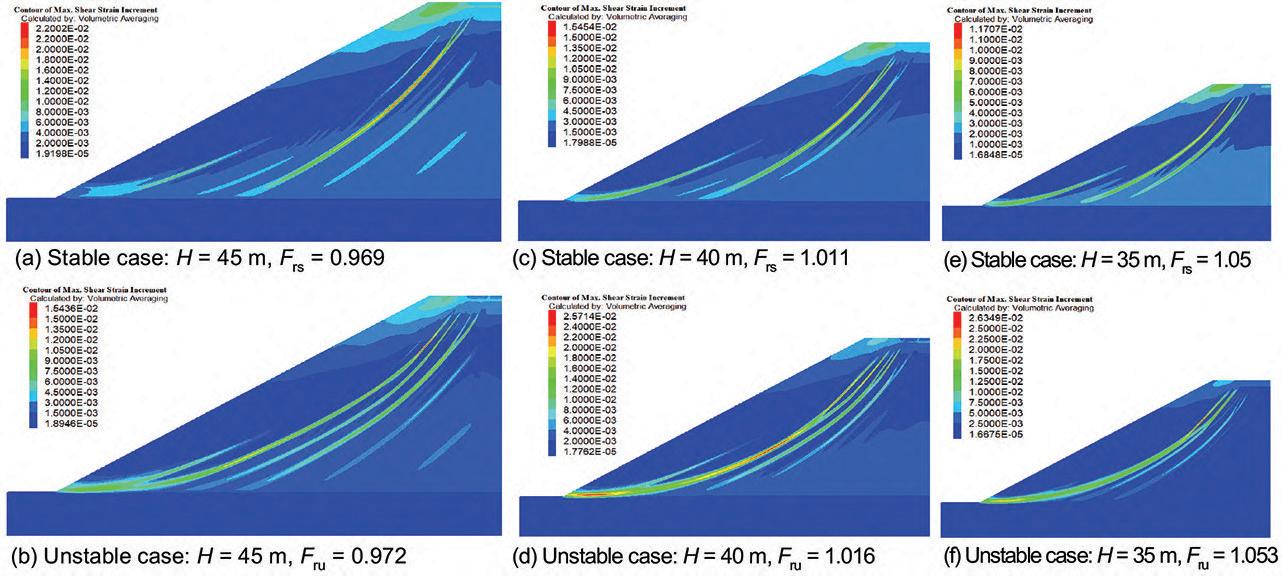
store more mine waste in a dump within a limited land, the dump slope has to be steeper. Ascertaining the effect of dump slope inclination angle α on the maximum height of a waste dump is of great benefit for safe design and construction. Figure 4 shows the variation in the maximum height H m as the inclination angle of the dump slope increases from 25° to 50° (case 1 in Table I) obtained from numerical modelling in FLAC3D. The maximum dumping height H m is 85 m when the inclination angle
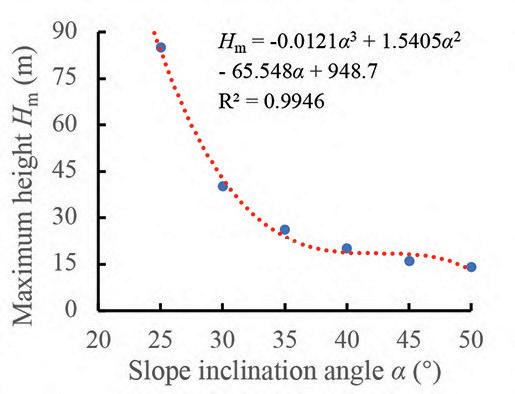
of the dump slope is 25°, decreasing to 14 m as α increases to 50°. An equation based on the curve-fitting technique is also presented in Figure 4, with a correlation coefficient R2 of 0.9946.
on which a waste dump is constructed is
5 presents the variation in the
the ground slope
from
to
in
insensitive to the dump width. This is important because the dump width is desired to be as large as possible to accommodate more waste materials in practice.
Figure 8 shows the influence of the unit weight γ of dump materials on the maximum height H m of waste dumps (case 4 in Table I) obtained from numerical simulations in FLAC3D. The maximum dumping heigh H m is 45 m when the unit weight γ of dump materials is 16 kN/m3, and reduces to 28 m when γ increases to 26 kN/m3. An analytical equation is also given in Figure 8 to estimate the maximum height on the basis of γ.
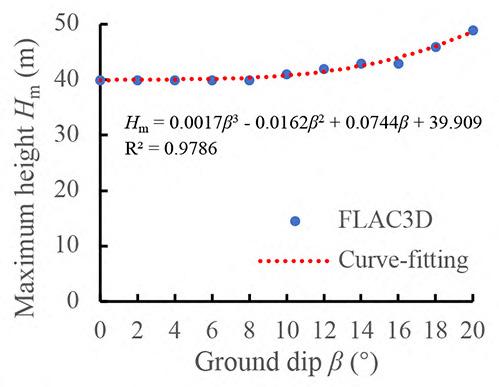
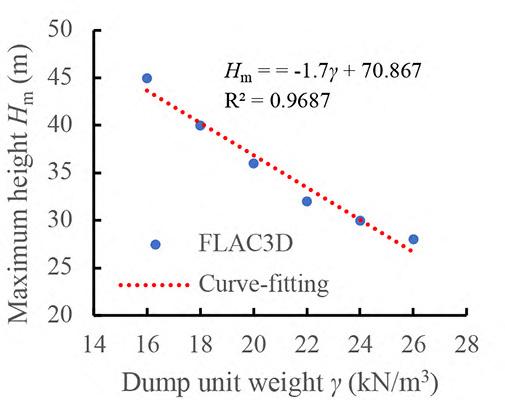
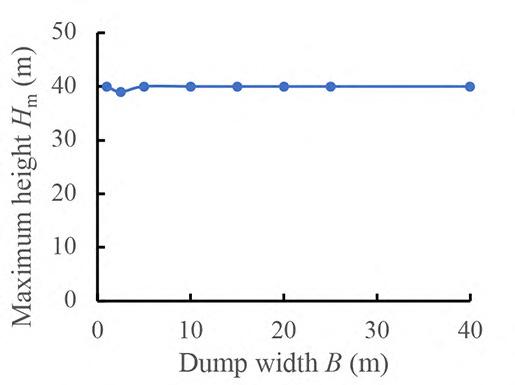
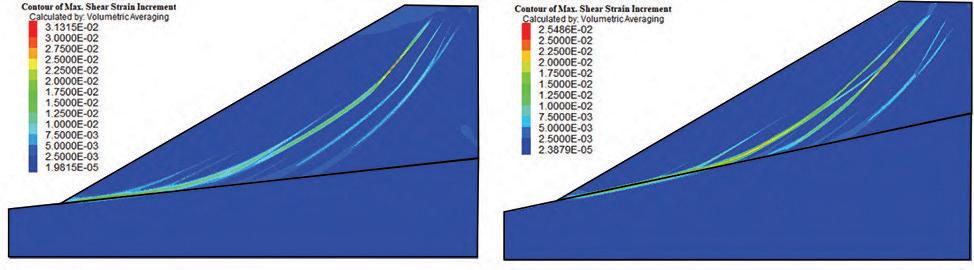
I) and a curve-fitting formula with R2 = 0.9786 (correlation coefficient). The maximum height of the dump remains constant at 40 m when the ground slope β is less than 8°. However, as the slope β increases from 8° to 20°, the maximum height H m increases from 40 m to 49 m. The result indicates a change in the failure mechanism, which can also be confirmed by the contours of the maximum shear strain increment of case 2 shown in Figure 6. As shown in Figure 6a, when β = 6°, the potential sliding surface is tangential to the base and failure occurs inside the dump slope. As β increases to 12° (Figure 6b), the failure surface intersects the base, indicating shear failure of the interface between the dump and the base.
The maximum height H m of waste dumps for different values of dump width B varying from 1 to 40 m (Case 3 in Table I) is presented in Figure 7. The maximum height is seen to be almost
Figure 9 shows the variation of maximum height H m of waste dumps as a function of the dump cohesion c (case 5 in Table I). The maximum dumping height is 20 m when cohesion c is 10 kPa, increasing to 78 m when c = 40 kPa. The results suggest that the maximum height tends to increase linearly as the cohesion c of dump materials increases from 10 to 40 kPa. This is a result of the higher shear strength induced by the increase in dump cohesion c. A linear equation, shown in Figure 9, is proposed based on the curve-fitting method for the estimation of the maximum height H m
The variation of maximum dumping height H m as a function of the internal friction angle φ of dump materials ranging from 5 ° to 25° is exhibited in Figure 10 (case 6 in Table I). The maximum height H m is estimated at 11 m when the friction angle is 5°, and increases rapidly to 91 m when φ = 25°. This also results from the higher shear strength due to the increase in the internal friction
Figure 9—Variation in maximum dumping height H m of a waste dump with cohesion c of dump materials (case 5 in Table I)
Figure 11—Variation in maximum dumping height H m of a waste dump with Young’s modulus E of dump materials (case 7 in Table I)
Figure 10—Variation in maximum dumping height H m of a waste dump with the internal friction angle φ of dump materials (case 6 in Table I)
angle φ of waste dumps. For better estimation of the maximum height, an equation with R2 = 0.9987 (correlation coefficient) is also given in Figure 10.
Figure 11 presents the variation in maximum dumping height H m as a function of Young’s modulus E of dump materials (case 7 in Table 1). It is observed that the maximum height H m is insensitive to variation in Young’s modulus between 20 MPa and 20 Gpa. In addition, Young’s modulus is seen to be related more to the deformation of waste dumps rather than to the stability. For example, the total displacement of the waste dump decreases from 0.52 m to 0.36 m as Young’s modulus increases from 20 MPa to 20 Gpa according to the FLAC3D simulations.
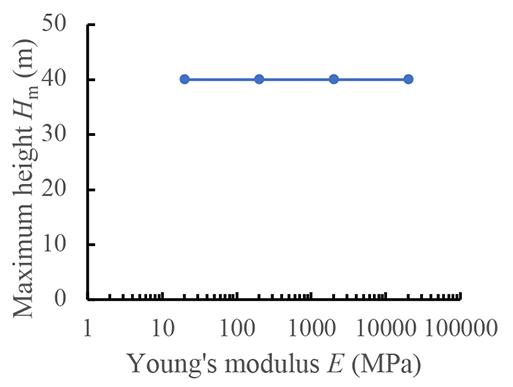
Figure 12 shows the effect of Poisson’s ratio μ of dump materials on the maximum dumping height H m (case 8 in Table I). The maximum height H m remains almost constant when Poisson’s ratio varies from 0.2 to 0.4. Similar to the effect of Young’s modulus, Poisson’s ratio can influence the displacement of waste dumps, especially the horizontal displacement. For instance, the horizontal displacement is 0.33 m for case 8 with μ = 0.2 and H = 40 m, increasing to 0.58 m when μ = 0.4 and H = 40 m.
Figure 12—Variation in maximum dumping height H m of a waste dump with Poisson’s ratio
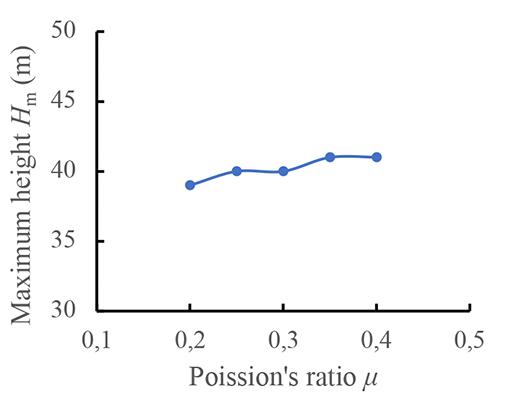
8 in Table
results suggest that FLAC3D is a useful tool for estimating the maximum height of waste dumps. FLAC3D has been validated by investigating cylindrical hole problems (Chai, 2020). To further verify the reliability of the numerical results in this study, two more cases, shown in Table II, are considered to compare with published results in the literature (Griffiths and Marquez, 2007; Liu, Nian, and Wan, 2010; Rai, Khandelwal, and Jaiswal, 2012).
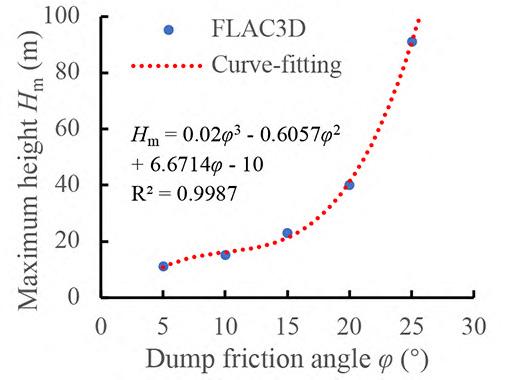
Rai, Khandelwal, and Jaiswal, (2012) applied FLAC to analyse the stability of a two-dimensional (2D) waste dump for verification of numerical results (case A in Table II). The dump geometry and properties are shown in Table II. The base is made up of the same materials as the dump. Using the parameters of case A presented in Table II and a similar numerical model shown in Figure 1b, the factor of safety F is calculated at 1.25. This agrees well with the numerical result of Rai, Khandelwal, and Jaiswal, (2012), in which the factor of safety F was estimated at 1.25.
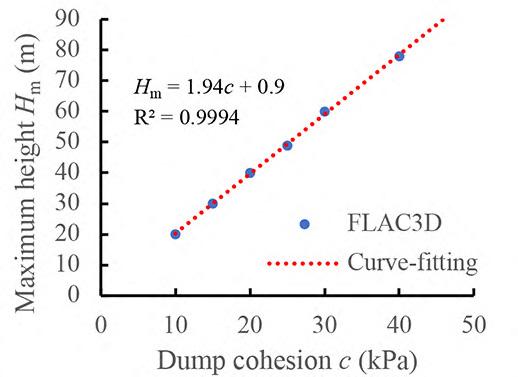
Case B (in Table II) is taken from Griffiths and Marquez (2007) and modified by Liu, Nian, and Wan, (2010) who give more detailed parameters in their article. The same material is also used for the dump and base. The factor of safety for case B simulated using the 2D plane-strain model by ABAQUS is 1.175, with detailed parameters shown in Table II. By applying the parameters of case B to the model constructed in FLAC3D, the factor of safety is estimated at 1.16. The difference between the two values is about 1.3%, suggesting the validation of the numerical result in this paper.
In general, good agreements are observed between the numerical results obtained from FLAC3D and those available in the literature, which largely validates the applicability and reliability of the numerical results in the study.
In this study, a relatively stiff base is considered for the analyses of dump stability. The influences of base properties on the maximum dumping height are also investigated. It is observed that the maximum height is nearly insensitive to the base properties. For instance, as the internal friction angle of the base increases from 10 ° to 40°, the maximum height remains unchanged at 40 m. However, the waste dump may also be constructed on soft ground or a weak layer (Wang and Chen, 2017). Figure 14 shows the contours of maximum shear strain increment for the last unstable case of a waste dump with a 0.5-m-thick weak layer, which is characterized by γW = 21 kN/m3 (unit weight), cW = 0 (cohesion), φW = 10° (internal friction angle), EW = 200 MPa (Young’s modulus), and μW = 0.2 (Poisson’s ratio). Other parameters of the waste dump and the base are the same as those used in the reference case (case zero in Table I). As shown in Figure 14, the waste fails by sliding along the weak layer. The calculated maximum dumping height is 13 m, which is much lower than the maximum height of 40 m for the reference case without the weak layer. Therefore, more detailed investigations of the influence of weak layers on the maximum dumping height are still required.
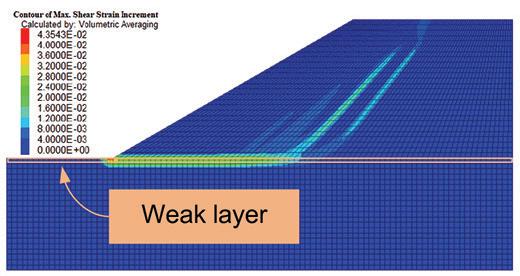
In this study, the maximum dumping height was taken as the height when the factor of safety F = 1.0. However, in practice, a higher safety factor than unity (e.g., 1.2) is usually applied for the consideration of dump stability (Adamczyk et al., 2013; Cho and Song, 2014). The corresponding dumping height can be estimated using the same method as for the reference case. According to Figure 3, the dumping height of the waste dump is about 24 m
for the reference case when F = 1.2. Figure 14 shows the variation in dumping height as a function of slope inclination angle α for factor of safety 1.0 and 1.2. The same trend is obsersved for the influence of slope inclination angle α on the dumping height for both values of F
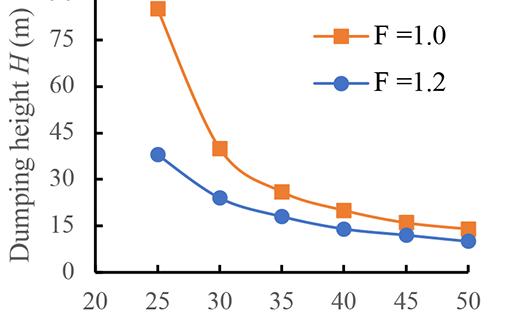
In this study, a totally dry condition is assumed for the waste dump material. This is fairly reasonable, as water can drain quickly from waste dumps consisting of numerous different sizes of rocks. However, in high rainfall areas, the influence of water on the maximum height of waste dumps cannot be neglected. More efforts are needed to fully understand it.
It will be of great value if a single analytical equation can be proposed to estimate the maximum height of waste dumps by incorporating all the factors that have an impact. It seems unrealistic due to the large number of variables. However, the development of artificial neural networks (ANN) may make it possible. Additional work is required regarding this aspect.
Other factors can also be investigated in the future, including heterogenous dump materials, a more complicated dump geometry, the influence of nearby mining activities, etc.
A numerical procedure has been presented for estimating the maximum height of waste dumps under totally dry conditions using plane-strain models constructed in FLAC3D. Extensive numerical simulations were conducted to investigate the influence of dump geometry and properties on the maximum dumping height.
The results indicate that the maximum dumping height decreases as the slope inclination angle α or the unit weight γ of dump materials increases, whereas a higher cohesion c or internal friction angle φ of the dump materials increases the maximum height. The maximum dumping height is almost insensitive to the ground slope β for small values (e.g., β < 8° for case 2). However, as the ground slope β continues to increase (e.g., β > 8° for case 2), the maximum height tends to increase due to the occurrence of shear failure at the interface between the waste dump and the base. The dump width is seen to have a negligible effect on the maximum dumping height. The effects of Young’s modulus E and Poisson’s ratio μ of dump materials on the maximum dumping height are also insignificant.
The above findings are of great benefit for the preliminary design of waste dumps as regards the estimation of the maximum dumping height.
Adamczyk, J., Cała, M., Flisiak, J., Kolano, M., and Kowalski, M. 2013. Slope stability analysis of waste dump in Sandstone Open Pit Osielec. Studia Geotechnica et Mechanica, vol. 35, no. 1. pp. 3–17.
Bao, Y., Han, X., Chen, J., Zhang, W., Zhan, J., Sun, X., and Chen, M. 2019. Numerical assessment of failure potential of a large mine waste dump in Panzhihua City, China. Engineering Geology, vol. 253. pp. 171–183. http://dx.doi. org/10.1016/j.enggeo.2019.03.002
Behera, P.K., Sarkar, K., Singh, A. K., Verma, A.K., and Singh, T.N. 2016. Dump slope stability analysis – A case study. Journal of the Geological Society of India, vol. 88, no. 6. pp. 725–735. http://dx.doi.org/10.1007/s12594-016-0540-4
Blight, G.E. and Fourie, A.B. 2005. Catastrophe revisited – disastrous flow failures of mine and municipal solid waste. Geotechnical and Geological Engineering, vol. 23, no. 3. pp. 219–248. http://dx.doi.org/10.1007/s10706-004-7067-y
Chai, S. 2020. Analytical and numerical studies on the stresses in backfilled stopes and the stability of side-exposed backfill in inclined stopes. Master’s thesis, Polytechnique Montreal, Montreal, QC, Canada.
Chaulya, S.K., Singh, R.S., Chakraborty, M.K., and Dhar, B.B. 1999. Numerical modelling of biostabilisation for a coal mine overburden dump slope. Ecological Modelling, vol. 114, no. 2. pp. 275–286. http://dx.doi.org/10.1016/ S0304-3800(98)00157-4
Cho, Y.-C. and Song, Y.-S. 2014. Deformation measurements and a stability analysis of the slope at a coal mine waste dump. Ecological Engineering, vol. 68. pp. 189–199.
Chen, C. 2018. Failure mode and stability analysis of slope dumped on soft layer. PhD thesis, China University of Mining and Technology (Beijing), Beijing, China.
Gao, S., Zhou, W., Shi, X., Cai, Q., Crusoe, G.E., Jisen, S., and Huang, Y. 2017. Mechanical properties of material in a mine dump at the Shengli #1 Surface Coal Mine, China. International Journal of Mining Science and Technology, vol. 27, no. 3. pp. 545–550. http://dx.doi.org/10.1016/j.ijmst.2017.03.014
Gilbertson, B. and Williamson, D. 1974. Satellite observation of mine-dump vegetation. Journal of the South African Institute of Mining and Metallurgy, vol. 74, no. 7. pp. 295–296.
Griffiths, D.V. and Marquez, R.M. 2007. Three-dimensional slope stability analysis by elasto-plastic finite elements. Geotechnique, vol. 57, no. 6. pp. 537-546. http://dx.doi.org/10.1680/geot.2007.57.6.537
Itasca. 2013. FLAC3D-Fast Lagrangian analysis of continua in 3 dimensions; User’s guide, version 5.01. Itasca Consulting Group, Minneapolis, MN.
Kainthola A., Verma D., Gupte S., and Singh T. 2011. A coal mine dump stability analysis—A case study. Geomaterials, vol. 1, no. 01. p. 1.
Kasmer, O., Ulusay, R., and Gokceoglu, C. 2006. Spoil pile instabilities with reference to a strip coal mine in Turkey: mechanisms and assessment of
deformations. Environmental Geology, vol. 49, no. 4. pp. 570–585. http://dx.doi. org/10.1007/s00254-005-0092-1
Lazăr, M., Faur, F., Dunca, E., and Ciolea, D. 2012. Landslides occurred in Bujorascu Valley dump and stability improvement solutions. Environmental Engineering and Management Journal, vol. 11, no. 7. pp. 1361–1366.
Liu, H., Nian, T., and Wan, S. 2010. Effect of boundary constraint condition on the stability analysis of 3d slope. Journal of Jilin University (Earth Science Edition), vol. 40, no. 3. pp. 638–644.
Poulsen, B., Khanal, M., Rao, A.M., Adhikary, D., and Balusu, R. 2014. Mine overburden dump failure: A case study. Geotechnical and Geological Engineering, vol. 32, no. 2. pp. 297–309. http://dx.doi.org/10.1007/s10706-013-9714-7
Rahul Khandelwal M., Rai, R., and Shrivastva, B.K. 2015. Evaluation of dump slope stability of a coal mine using artificial neural network. Geomechanics and Geophysics for Geo-Energy and Geo-Resources, vol. 1, no. 3. pp. 69–77. http://dx.doi.org/10.1007/s40948-015-0009-8
Rai, R., Khandelwal, M., and Jaiswal, A. 2012. Application of geogrids in waste dump stability: a numerical modeling approach. Environmental Earth Sciences, vol. 66, no. 5. pp. 1459–1465. http://dx.doi.org/10.1007/s12665-011-1385-1
Rajak, T.K., Yadu, L., Chouksey, S.K., and Dewangan, P. K. 2021. Stability analysis of mine overburden dump stabilized with fly ash. International Journal of Geotechnical Engineering, vol. 15, no. 5. pp. 587–597. http://dx.doi.org/10.1080/19 386362.2018.1503780
Ranjan, V., Sen, P., Kumar, D., and Saraswat, A. 2016. Enhancement of mechanical stability of waste dump slope through establishing vegetation in a surface iron ore mine. Environmental Earth Sciences, vol. 76, no. 1. p. 35. http://dx.doi. org/10.1007/s12665-016-6350-6
Shakesby, R. A. and Whitlow, J. R . 1991. Failure of a mine waste dump in Zimbabwe: Causes and consequences. Environmental Geology and Water Sciences, vol. 18, no. 2. pp. 143–153. http://dx.doi.org/10.1007/BF01704668
Steiakakis, E., Kavouridis, K., and Monopolis, D. 2009. Large scale failure of the external waste dump at the 'South Field' lignite mine, Northern Greece. Engineering Geology, vol. 104, no. 3. pp. 269–279. http://dx.doi.org/10.1016/j. enggeo.2008.11.008
Upadhyay, O.P., Sharma, D.K., and Singh, D.P. 1990. Factors affecting stability of waste dumps in mines. International Journal of Surface Mining, Reclamation and Environment, vol. 4, no. 3. pp. 95–99. http://dx.doi. org/10.1080/09208119008944174
Verma, A.K., Deb, D., and Mukhopadhyay, S.K. 2017. Stability analysis of a mine waste dump over an existing dump. Journal of Mines, Metals and Fuels, vol. 65, no. 2. pp. 41–48.
Wang, H., Zhang, J., and Lin, H. 2019. Satellite-based analysis of landfill landslide: The case of the 2015 Shenzhen landslide. International Journal of Geotechnical Engineering. pp. 1–8. http://dx.doi.org/10.1080/19386362.2019.1610605
Wang, J. and Chen, C. 2017. Stability analysis of slope at a disused waste dump by two-wedge model. International Journal of Mining, Reclamation and Environment, vol. 31, no. 8. pp. 575–588. http://dx.doi.org/10.1080/17480930.20 16.1270498
Wang, K., Zhang, S., Wei F., and Yang, H. 2020. A case study of the rapid and long runout landslide at Hong’ao waste disposal site in Shenzhen, China. KSCE Journal of Civil Engineering, vol. 24, no. 3. pp. 727–739. http://dx.doi. org/10.1007/s12205-020-1399-x
Yang, S. and Ang, Y. 2009. Analysis of factors affecting dump stability. Opencast Mining Technology, vol. 3. pp. 4–7.
Zhan, L., Guo, X., Sun, Q., Chen, Y., and Chen, Z. 2021. The 2015 Shenzhen catastrophic landslide in a construction waste dump: Analyses of undrained strength and slope stability. Acta Geotechnica, vol. 16, no. 4. pp. 1247–1263. http://dx.doi.org/10.1007/s11440-020-01083-8
Zou, P., Zhao, X., Meng, Z., Li, A., Liu, Z., and Hu, W. 2018. Sample rocks tests and slope stability analysis of a mine waste dump. Advances in Civil Engineering, vol. 2018. p. 6835709. http://dx.doi.org/10.1155/2018/6835709 u
objective of
Mine managers
Mining companies
Students
tools
techniques
stages of the diamond industry, from exploration
design, processing, to cutting, marketing, and sales.
Geologists
Mineral (diamond)
Mining engineers
Process engineers
Suppliers
Sales/marketing
Diamantaires
COVID-19 and impact on diamond sales
Geology and exploration
Mine expansion projects
Mining, metallurgy, and processing technology
Rough diamond sales and marketing

Cutting, polishing, and retail
Project Management
Financial services and industry analysis
Industry governance, beneficiation, and legislation
Mine-specific case-studies.
www.saimm.co.za
Camielah Jardine,

Affiliation:
1WA School of Mines, Curtin University.
2China University of Mining & Technology.
3Key Laboratory of Deep Metal Mines, Northeastern University.
Correspondence to: A.J.S. Spearing
Email: ajsspearing@yahoo.com
Dates:
Received: 12 Jan. 2022
Revised: 17 Jul. 2022 Accepted: 15 Jul. 2022 Published: October 2022
How to cite:
Jessu, K.V., Spearing, A.J.S. and Sharifzadeh, M. 2022
An improved pillar design methodology.
Journal of the Southern African Institute of Mining and Metallurgy, vol. 122, no. 10, pp. 587 596
DOI ID: http://dx.doi.org/10.17159/24119717/1983/2022
ORCID: A.J.S. Spearing https://orcid.org/0000-00021839-9887
Empirical pillar design methods are commonly used in the mining industry. The parameters within which these methods are valid are frequently unknown to the user or ignored. In addition, empirical design may not consider essential parameters such as blasting effects, orebody dip and the presence of geological structures, which all adversely affect the stability of the pillars. This can result in potentially serious pillar design strength over-estimates. Although the commonly based tributary area method is generally conservative, as the spans are seldom that large relative to the depth, failing to consider other relevant parameters can result in errors. Problems associated with an under-designed pillar can range from a local pillar collapse to a catastrophic chain reaction collapse (or run). Over-designed pillars are generally safe but reduce the extraction of the orebody, thus adversely affecting the profitability of the mining operation. We used laboratory tests and numerical modelling to understand the effects of pillar orientation, blasting and the presence of discontinuities on pillar strength. Reduction factors were developed with these models to be implemented in conjunction with the existing empirical pillar design methods. For any pillar or mine design, once it is implemented, the actual performance of the system must be checked regularly by observation and monitoring and adjusted if needed. The pillar design approach outlined in this paper can better optimize the pillar mining method by considering other generally ignored but important parameters, thus improving safety, productivity, and economic aspects.
pillar, tributary area theory, geological structures, orebody dip, width-to-height (W/H) ratio.
The safe and effective design of pillar systems is vital in many mining methods, especially for room-andpillar mining. From an economic point of view, maximizing the room width and minimizing the pillar size is important, but overall stability and safety are the overriding design considerations. The performance of the hard-rock pillars is mainly affected by the width-to-height ratio and the rock mass properties of the pillars, and the immediate roof and floor strata. Other conditions, however can also influence it to some extent, such as pillar inclination, the orientation of any discontinuities and the effects of adjacent blasting on the pillars. Current empirical design approaches tend not to consider these parameters, although their impact, can be significant. The effects of these factors were investigated and quantified using multiple laboratory-scale tests and numerical analyses on hard-rock pillars.
In any underground mining operation, there are broadly two different categories of pillars: local support pillars and protective pillars. The differences between the two categories of pillars are often not clearly apparent, and there are instances when pillars fulfil both requirements. There are a number of significant differences between the two types of pillars.
Support pillars can be further divided into two classes: pillars that provide local support and pillars that provide regional support. However, pillars often provide both local and regional support. A good example of this is a conventional room-and-pillar mining layout that has been designed with a high safety factor. Local support pillars are often only temporary and are extracted once they have fulfilled their purpose. One of the interesting aspects of local support pillars is that their useful function is often limited to the time when actual mining takes place in their immediate vicinity. Subsequent failure of these pillars can occur, provided the mode of failure is stable. Yielding support pillars fall into this category. Barrier and wide inter-panel pillars are typical examples of pillars that provide regional support.
During mining, it often becomes essential to protect underground and surface structures from the effects of mining. One of the practical means of achieving this is to leave portions of the orebody unmined to form protective pillars. The design criteria for these pillars depend largely on the nature of the structure that needs to be protected. In the case of surface structures, the design criterion is based on the magnitude of the surface movements and strains that can be tolerated by the structure. In the case of underground structures such as bunkers, pump stations, service excavations, etc., it is usually the magnitude of the stresses that determines the size of protective pillars. A common example of this is shaft protection.
The dimensions of a pillar obviously have a significant effect on the strength and the post-failure performance of a pillar, as shown in Figure 1. In addition, the depth (the stress tensor) at which pillars are used is also important as the design approach is different. Rigid or yielding pillars may be required, and the post-failure behaviour of pillars governs whether they fail in a controlled (desirable) or uncontrolled manner (usually sudden and violent). This is illustrated in Figure 2. Strain-softening post pillar failure usually indicates violent pillar failure potential.
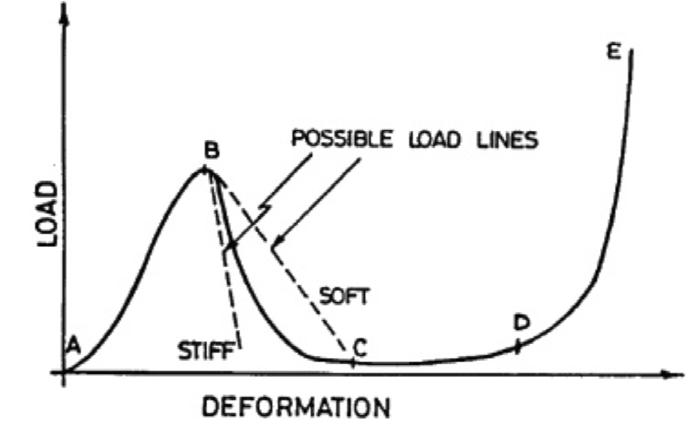
Pillar loading distribution conditions are complex as the pillars are ‘built’ from a non-uniform rock mass and the difficulties in determining the in-situ strength properties of the pillar material dictate that a simplified approach is adopted in the design. Instead of determining the maximum stress that acts in the pillar, the average pillar stress is commonly used as it is easier to estimate. In addition, rather than using the actual strength of the pillar material, empirical formulae that predict the strength of the whole pillar have been developed and modified over time. These
formulae suffer from the constraint that they are site-specific and valid only for the conditions for which they have been derived. Users of such empirical formulae often fail to consider this when using them.
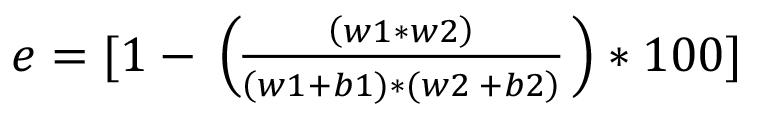
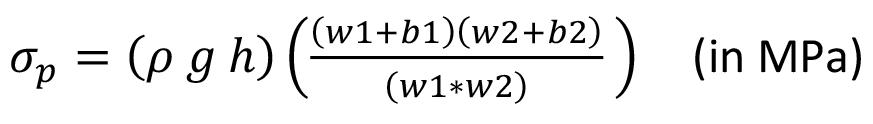
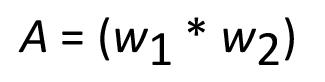
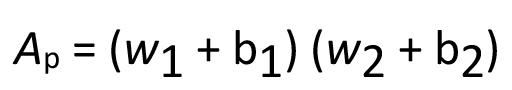
The theoretical pillar stress is usually obtained by using the simplistic tributary area theory (as outlined in Figure 3); otherwise, some form of computer analysis program is used. The tributary area theory ignores the effects of abutments and hence is only applicable where the span of the mining in both directions is at least equal to the depth of mining below the surface. Should this not be the situation, the pillar loads obtained will be substantially higher than the actual pillar loads resulting in a conservative approach, which is at least a safe approximation.
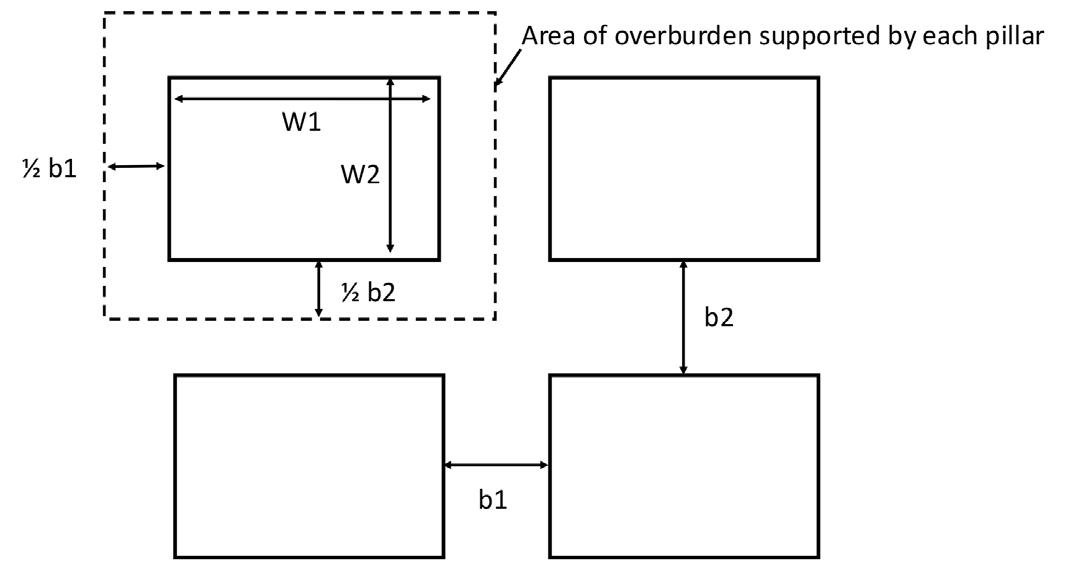
The total tributary area supported by a pillar is:
The area of the pillar is:
Assuming the depth of the pillars to be h (in km) and the average rock density to be r, the overburden stress is:
The pillar load (stress) is, therefore
The percentage extraction (e) is equal to:

The limitations or constraints of tributary area theory are that it:
➤ It is only valid for a flat-dipping pillar (i.e., no pillar shear)
➤ Assumes that the pillars are all evenly loaded, which in reality is seldom the case
➤ Ignores the presence of abutments (which makes it conservative, therefor safer)
➤ Does not account for any mining-induced deformation or failure
➤ Ignores the overburden properties (e.g., the stiffness and geology).
As can be seen from Figure 1, the strength of a pillar is strongly influenced by the width-to-height ratio, and this is a key parameter in all empirical pillar design formulae.
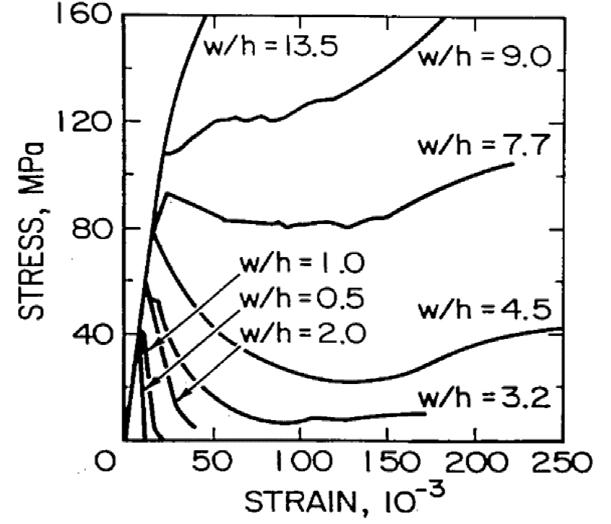
One of the first comprehensive pillar studies was undertaken by Obert, Windes, and Duvall (1946), who conducted tests using various rock types with width-to-height ratios from 0.5 to 3.0. They established the following empirical relationship:
where LDF is the large discontinuity factor.
It should, however, be noted that no pillar failures have been reported at a width-to-height ratios of greater than 3.6. The application of these formulae outside of the parameters included in the database is not recommended under any circumstances.
[6]
where σ0 is the compressive strength of the rock specimen with a width/height ratio of unity.
Pillar design received much more intense focus and research after the Coalbrook Mine disaster in South Africa. On January 21, 1960, a massive pillar collapse occurred, and 437 miners were killed. Salamon and Munro (1967) developed the following formula after investigating stable and unstable coal mine pillars in South Africa:
[7]
where K is a constant depending on the strength of the coal, W is the square pillar width, and H is the effective pillar height. Based on their work, K for South African coal mines was found to be 7.2 MPa.
Bieniawski (1968) developed a pillar strength formula as follows:
It can be seen that none of the above empirical designs (with the exception of Esterhuizen (2008), which is limited to limestone) specifically investigate the effects of dip, blast damage, and the presence of discontinuities. While the data-sets used by the various researchers could have included some of these conditions, their effects would have been largely negated by using averages.
In a detailed study of the failure process of coal pillars, Wagner (1980), showed that the failure commences at the circumference of the pillar and migrates inwards. On the basis of these observations, it was suggested that the ratio of the area, A p, to the circumference, C, of a coal pillar has a strong influence on the pillar strength. Accordingly, the effective width, in metres, of a pillar of irregular shape is defined as:
[8]
where σcc is the strength of a critical sized cubic sample, W p is the smallest pillar dimension, and H is the effective pillar height.
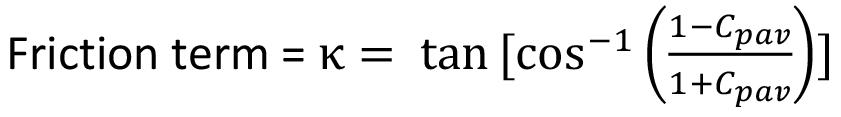
A similar approach to hard-rock pillar investigations was undertaken by Hedley and Grant (1972), who investigated both stable and unstable quartzite pillars in Canadian uranium mines and expressed the strength of the pillars using a similar formula to that used by Salamon and Munro:
[9]
where K is the unit strength of the rock, W is the square pillar width and H is the effective height of the pillar. Based on their work, K for the quartzite was found to be 133 MPa.
Lunder (1994) increased the database to 178 case histories from Canadian mines and included the confinement effect component for pillars with W/H ratio > 1. This is currently the most common empirical approach used in designing the hard rock pillars in mines, as follows:
[10]
where K is the pillar size factor, UCS is the uniaxial compressive strength (MPa), C1 and C2 are the empirical rock mass constants and κ is the friction term which is calculated as:
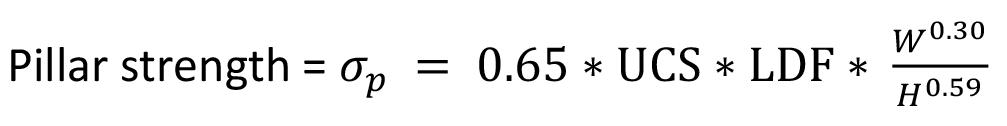
[11]
where A p is the area of the rectangular pillar and C is the circumference.
Rectangular pillars are often used along with main entries in order to limit the number of costly and time-consuming ventilation stoppings, in inclined orebodies to help resist the induced shear caused by mining or help clamp potentially unstable major geological features.
The greatest hazard associated with pillar mining is the potential for massive pillar failure and collapse. Sudden failure is not always preceded by pillar spalling, and once failure starts, it is virtually impossible to control or stop.
Most factor of safety (FOS) calculations for pillars are based on the duration and importance of the specific pillars. For example, in conventional room-and-pillar panel designs, a FOS of 1.6 is generally accepted, while for barrier pillars a FOS of 2.0 is more commonly used.
A relevant empirical design method exercise on a mine must include the following information and investigations:
➤
The unconfined compression strength (UCS), Young’s modulus, and Poisson’s ratio of the orebody itself at numerous locations to determine the distribution of those parameters and an average value and standard deviation
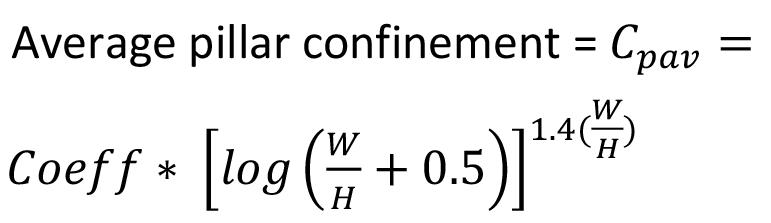
➤
➤
➤
➤
The stratigraphic column at various locations above the orebody to determine the overburden lithology, geological structures, and average rock density
Actual pillar dimensions
Orebody delineation and inclination of the mining method
Depth of damage due to blasting
➤ Major discontinuities and their orientations with respect to the pillars.
Esterhuizen, Dolinar, and Ellenberger., (2008) included discontinuities in the pillar for pillar strength estimation based on numerical modelling as:
[13]
The collection and processing of the above data could give great insight for designing and proving pillar designs by identifying potential instabilities that the use of average stresses and strengths would not typically reveal. This technique can therefore be used to determine the actual FOS required.
Improving the applicability of empirical design equations
Empirically-based pillar design formulae specifically consider failed and unfailed pillars without considering the reasons for failure. In general the following specific effects are not considered:
➤ Blasting on hard-rock pillars ➤ The inclination of the seam or orebody ➤ Orientation of discontinuity with respect to the pillar ➤ Regular monitoring of the pillars and updating the empirical pillar design equations for a specific site.
Laboratory tests and numerical modelling were conducted to develop an understanding of the parameters such as inclination, rectangular shape, inclination, and blasting effects on the strength of the pillars. Laboratory samples were prepared as per the ISRM standards for uniaxial compressive strength, which were then used as a reference for different widths to height of the samples to determine the pillar strength. Numerical modelling was developed in FLAC3D and calibrated with the Lunder and Pakalnis (1997) empirical equation, and all the parameters were then tested to determine their influence on the strength of the pillars.
Laboratory tests were conducted on gypsum, sandstone, and white sandstone samples with diameters of 42 mm and 52 mm (Figure 4). The samples were prepared as specified in ISRM standards with four different W/H ratios. Three specimens were created of each rock type for four different W/H ratios, resulting in 48 specimens in total for testing. Uniaxial compression loading was applied onto the specimens with the servo-controlled computer Program GCTS CATS 1.8. Displacement loading rate of 0.12 mm/min was applied so as to cause failure within 5-10 minutes as per the ISRM standards.
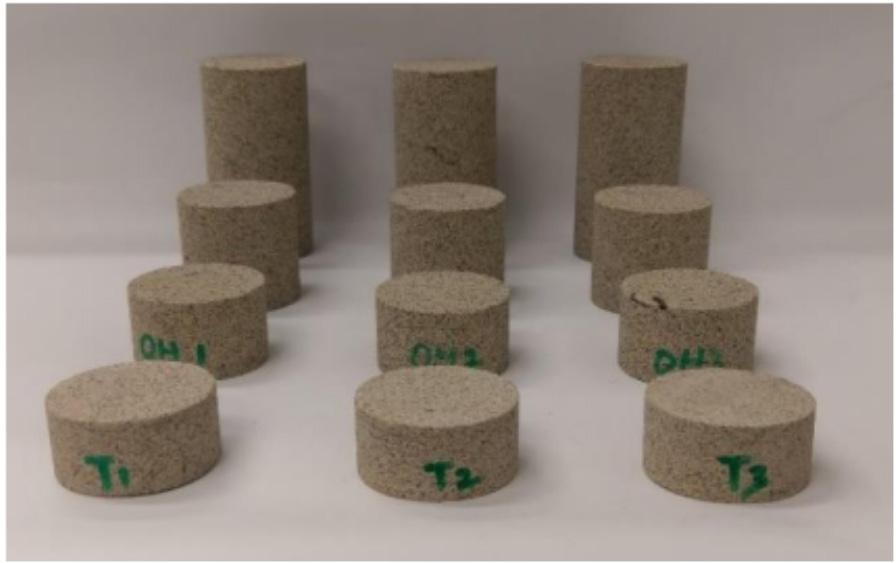
Numerical modelling was conducted using FLAC3D, a threedimensional finite-difference modelling package to simulate the pillars and develop stress-strain curves for pillar strength analysis. The model consists of roof, pillar, and floor with a constant height and varying width and length of the pillar to achieve different width-to-height ratios for square and rectangular pillars with a 75% extraction ratio. The height of the roof and floor were kept at three times the pillar height to avoid the boundary effects. Roller supports were positioned on the sides of the model while fixed supports were positioned at the bottom of the floor. Uniform velocity was applied on the top of the roof to simulate the loading of the pillars (Lorig and Cabrera, 2013).
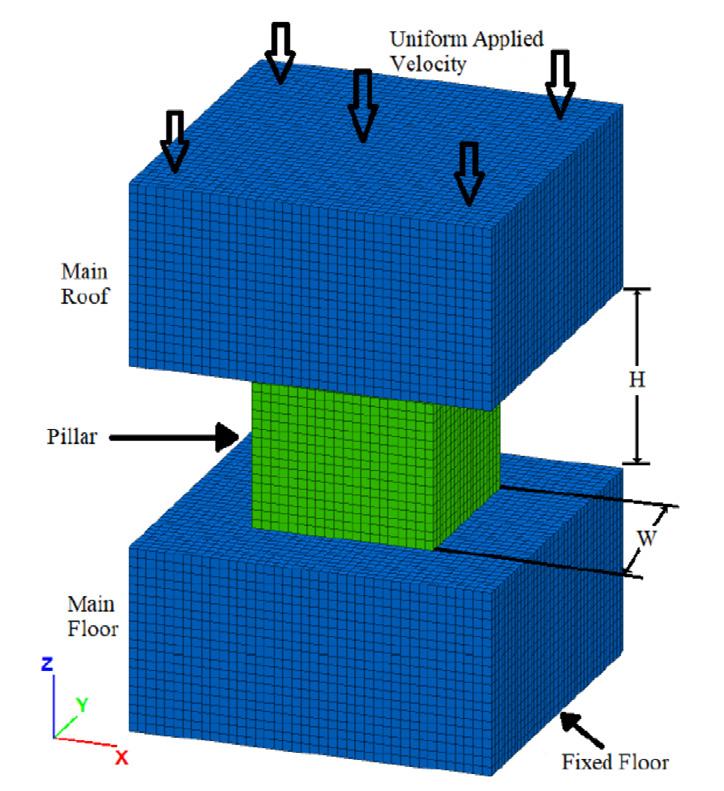
The bilinear strain-hardening/softening ubiquitous joint model is based on the bilinear strength envelope by Kaiser et al. (2000) to simulate the failure mechanism of the pillars realistically. The
rock and joint properties were obtained from Esterhuizen (2006) as shown in Tables I and II.
An increased pillar inclination increases the potential for sliding on weak planes. A series of laboratory tests and numerical modelling were conducted to determine the effect of dip on the strength of pillars (Jessu and Spearing, 2018). Figure 6 shows that pillar strength reduces with the inclination of the pillars and is consistent throughout the width-to-height ratios. For detailed information, see Appendix A. A reduction factor was evaluated to determine the pillar strength at different inclinations as per Equation [15].
Figure 5—FLAC³D numerical model for pillar
Table I
Rock mass properties
Property
Numerical value
Bulk modulus 40 000 MPa Shear modulus 24 000 MPa
Intact unconfined compressive rock strength (UCS) 150 MPa
Cohesion (brittle) 25 MPa
Friction angle (brittle) 0˚
Cohesion (Mohr-Coulomb) 8.1 MPa
Friction angle (Mohr-Coulomb) 47.6˚
Tensile strength 2.7 MPa
Dilation angle 30˚
Table II
Joint properties
Property Value
Cohesion 1 MPa
Friction angle
Tension 0.4 MPa Dilation
Maximum load reduction results:
Limitations of this theory include the inadequate amount of laboratory tests that have been conducted on the samples, which range only between inclinations of 0˚ and 20˚. Another constraint that must be taken into consideration is the range of width-toheight ratios for which experiments are conducted, i.e. W/H ratios of 0.5 and 2.0. The failure mechanisms in the laboratory tests and the numerical modelling show similar results, which indicates the potential for the reduction factor of the FOS for inclined pillars.
In tabular orebodies, rectangular pillars are commonly used. Numerical modelling was undertaken to understand the effects of orebody inclination on the strength of the rectangular pillars (Jessu and Spearing, 2019). Figure 7 shows an example of the effects of orientation of the rectangular pillars with respect to the dip of the orebody. These investigations showed that the rectangular pillars at low width-to-height ratios (less than 1.0) had similar strength in strike and dip directions at all inclinations. Rectangular pillars along the dip showed a marginal increase in strength compared to the rectangular pillars along the strike when the width-to-height ratio was greater than 1.0.
Limitations to the numerical modelling conducted on rectangular pillars include the mining spans, which have always been constant of 75% extraction ratio. The equivalent W/H ratios for the rectangular pillars shown in Figure 7 were calculated using Equation [9]. Width-to-height ratios were only considered in the range of 0.5 to 1.5, and the length was also constrained to only three times that of the width.
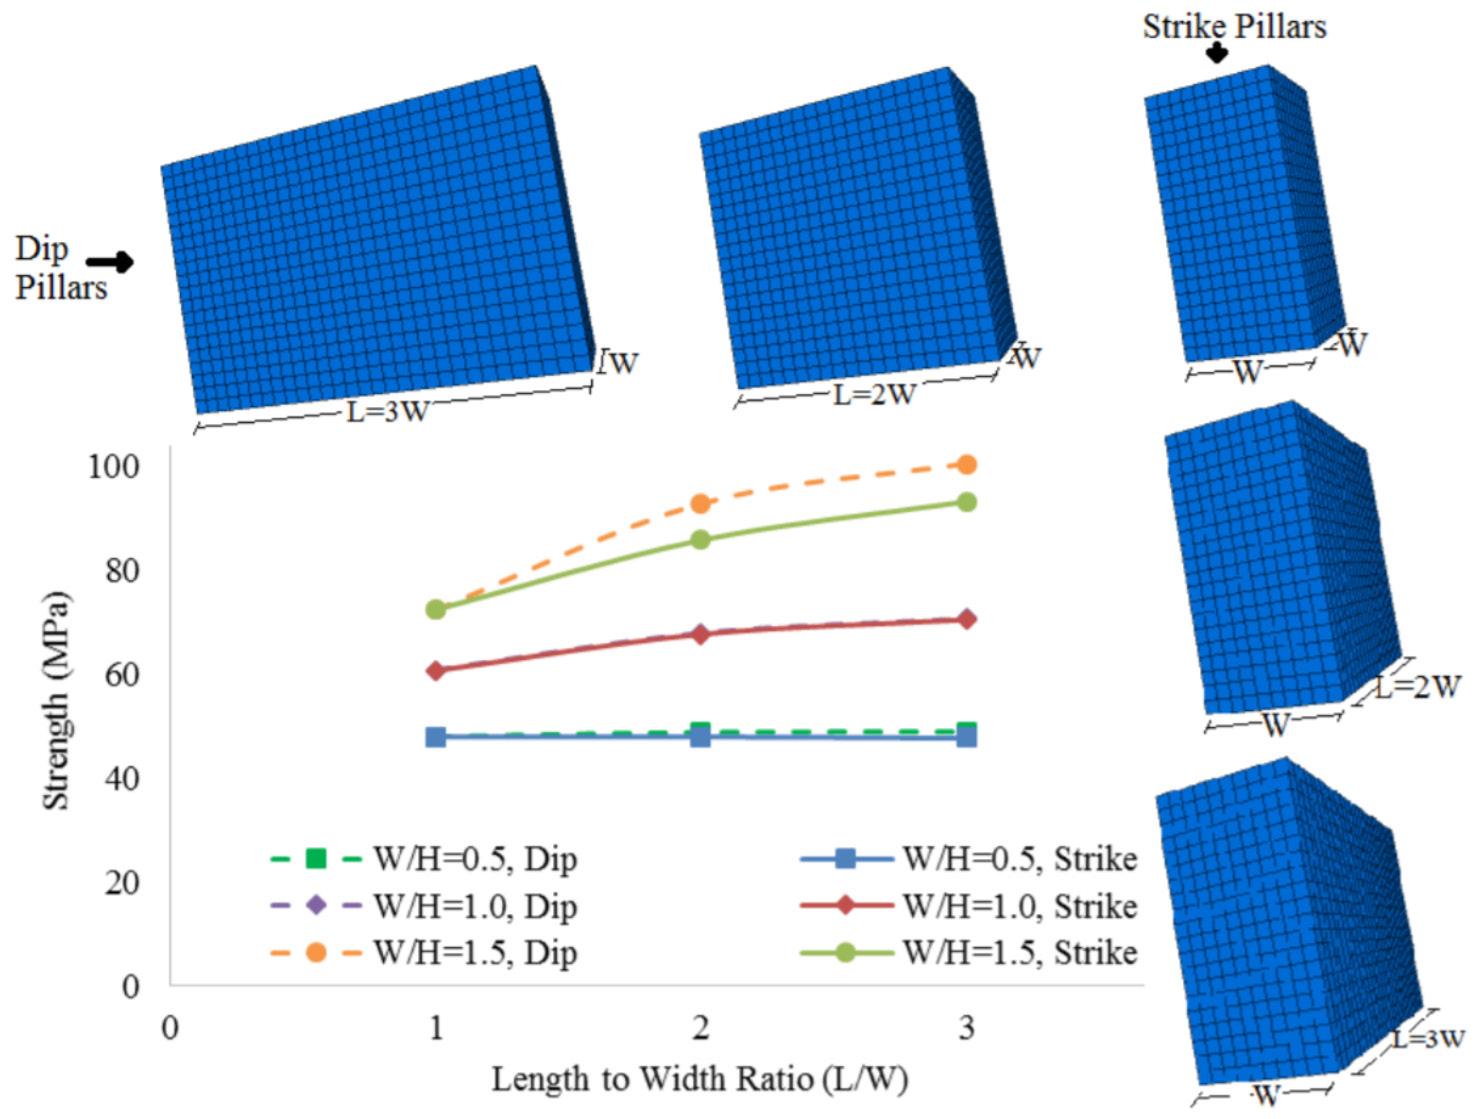
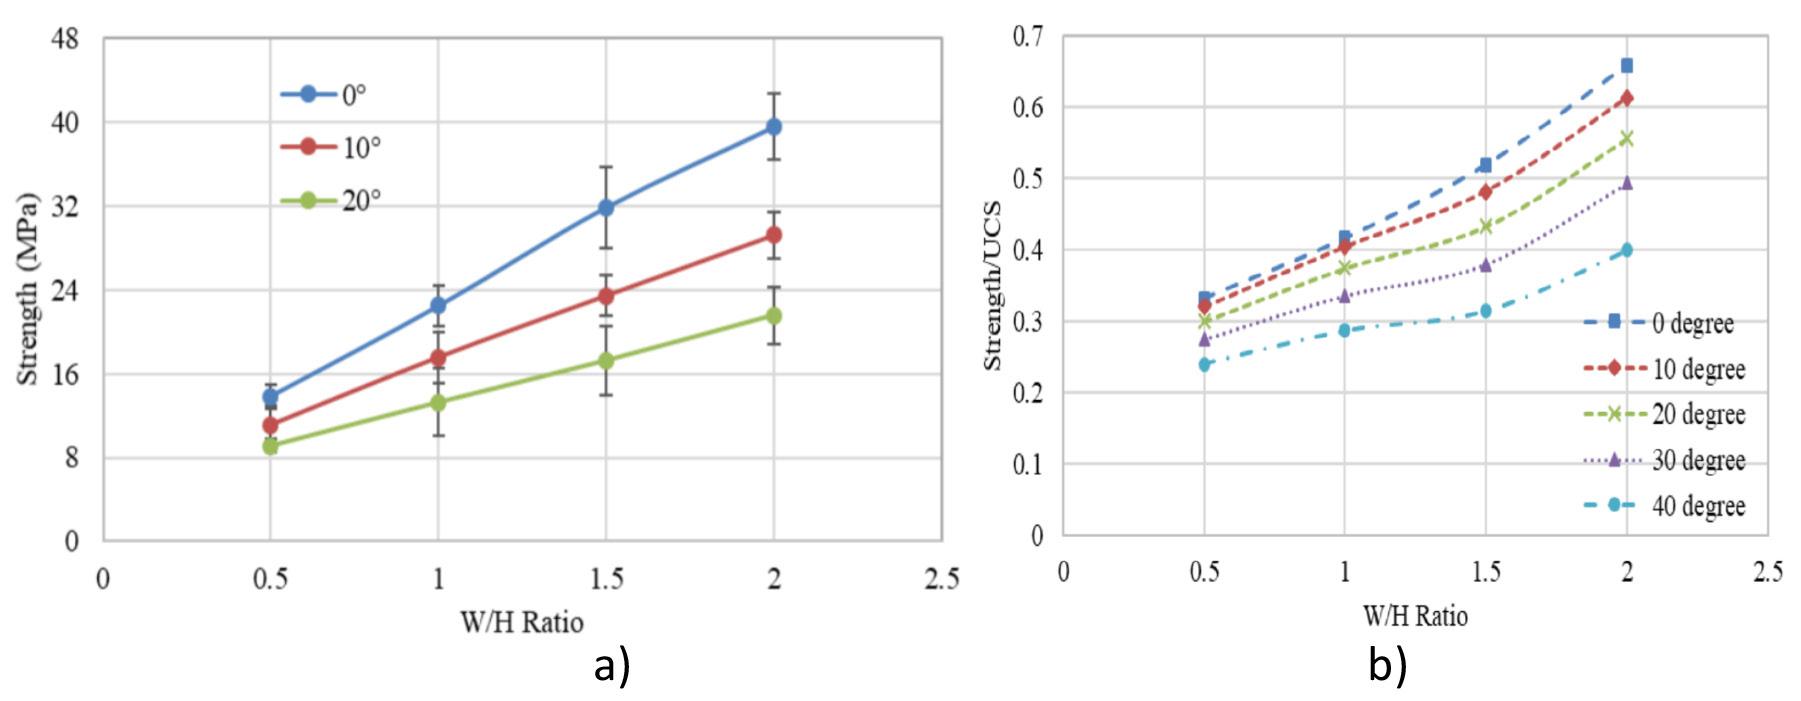
The dip of the discontinuity has a dominant effect on the pillar bearing capacity, specifically when the dip is between 30° and 60°. Jessu, Spearing, and Sharifzadeh (2018) researched the influence of discontinuities in horizontal and inclined pillars. The results show that a discontinuity has a minimal effect on pillars with a larger width-to-height ratio in horizontal pillars. However, in inclined pillars, the effects of a discontinuity are much greater for large W/H ratios than for horizontal pillars. The presence of discontinuities that are in a similar direction to the shear failure mechanism of an inclined pillar reduces the strength of such pillars, as shown in Figure 8.
Charts were developed to determine the reduction factors to be utilized for the presence of discontinuities in horizontal and inclined pillars (Appendix C). For example, the strength of a horizontal pillar with W/H ratio of 0.5 is 50 MPa, and the discontinuity dip angle of 45˚ reduces the pillar strength to 32 MPa due to the shearing along the discontinuity (Figure 8). In inclined pillars, as the brittle failure is dominant also with large W/H ratios, the shearing along the discontinuity is more pronounced.
The effects of discontinuity depend mainly on the properties of the discontinuity. The charts represent only one set of properties for the discontinuity but can be used as a guide towards determining the range of orientations that can affect the horizontal and inclined pillars.
Shock waves and gas-induced fractures from blasting cause deterioration in the rock mass and may create new fractures which consequently decrease the pillar rock strength. Jessu, Spearing, and Sharifzadeh (2018) conducted numerical modelling on the strength of the pillars, accounting for blast damage with the help of a parametric study with factors such as W/H ratio, disturbance factor, and damage thickness. It was determined that slender pillars (W/H < 0.8) do not show any difference in strength even with blast damage on the sides, due to the violent failure of the pillars from the core. Failure of the larger pillars initiates from
the sides, and as the sides of the pillar are damaged due to the blasting, it was determined that the strength diminishes due to the reduction of the pillar core.
The two important factors for blast damage were the damage factor and damage thickness around the pillar. These factors yielded a maximum reduction of about 7% for a W/H ratio of 0.5, 16% for W/H ratio of 1.0, 22% for W/H ratio of 1.5, and 27% for W/H ratio of 2.0. A strength reduction factor was evaluated for a blast damage factor of 1.0 and maximum blast damage of 1 m around the pillar sides, as shown in Figure 9. A linear relationship developed between the average strength factors due to blasting (RFB) and width-to-height ratio of the pillars can be written as: [16]
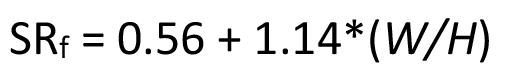
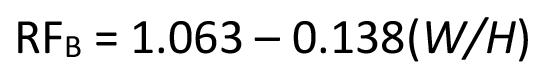
This reduction factor is based on the maximum blast damage that can occur on the pillar, which can be quite conservative. A table (Appendix B) has been developed by Jessu, Spearing and Sharifzadeh (2018) to evaluate the reduction factors for different blast damage factors and blast damage thickness. One of the main limitations is the specific range of the width-to-height ratio (between 0.5 and 2.5).
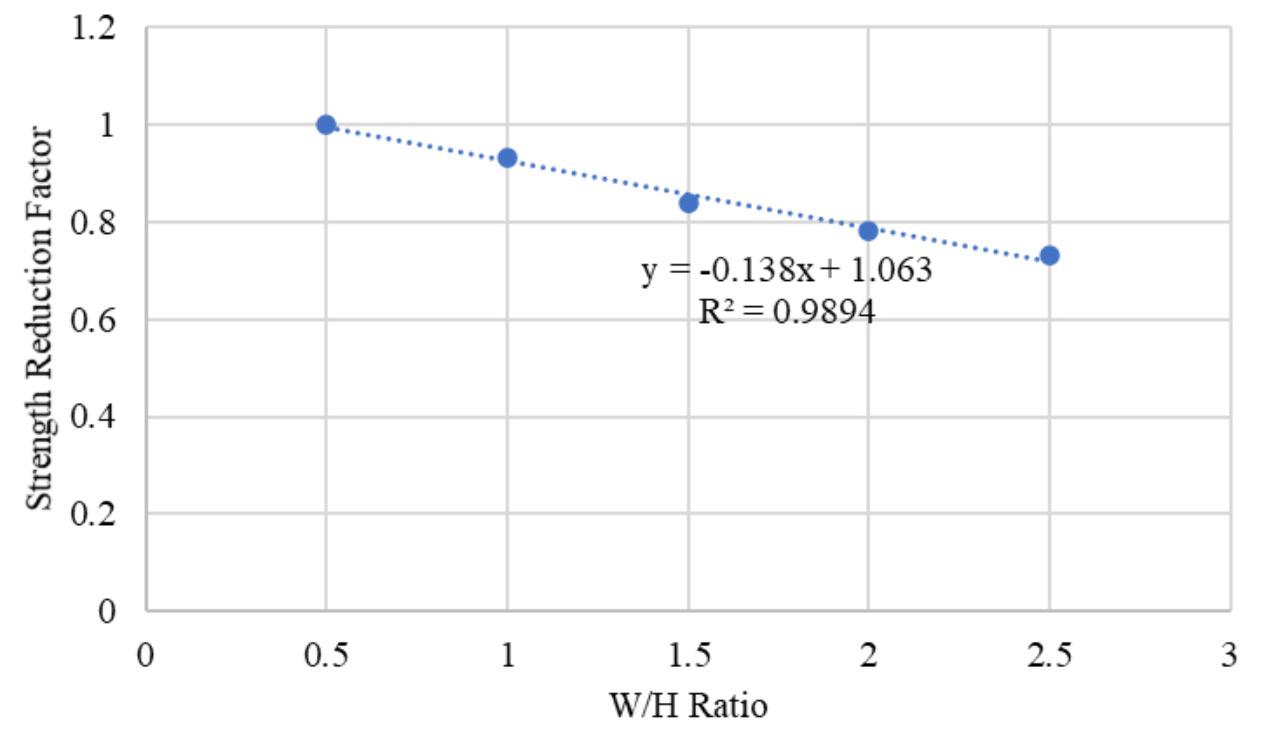
In-situ monitoring to improve the empirical equations Jessu and Spearing (2019) adopted Sakurai’s direct strain evaluation method (Sakurai, 1981) to establish an equivalent equation for the stability of pillars (Figure 10a). This method comprises in-depth analysis of stress-strain curves where the critical strain is defined as the ratio of the peak uniaxial compressive strength (UCS) to the elastic modulus. The strain at the peak UCS is defined as the failure strain. The reduction factor was derived from the ratio of critical strain to failure strain. Laboratory tests were conducted with different width-to-height ratios (Figure 10b) to observe the failure strain and to evaluate the critical strain, from which an equation was developed (Equation [17]).
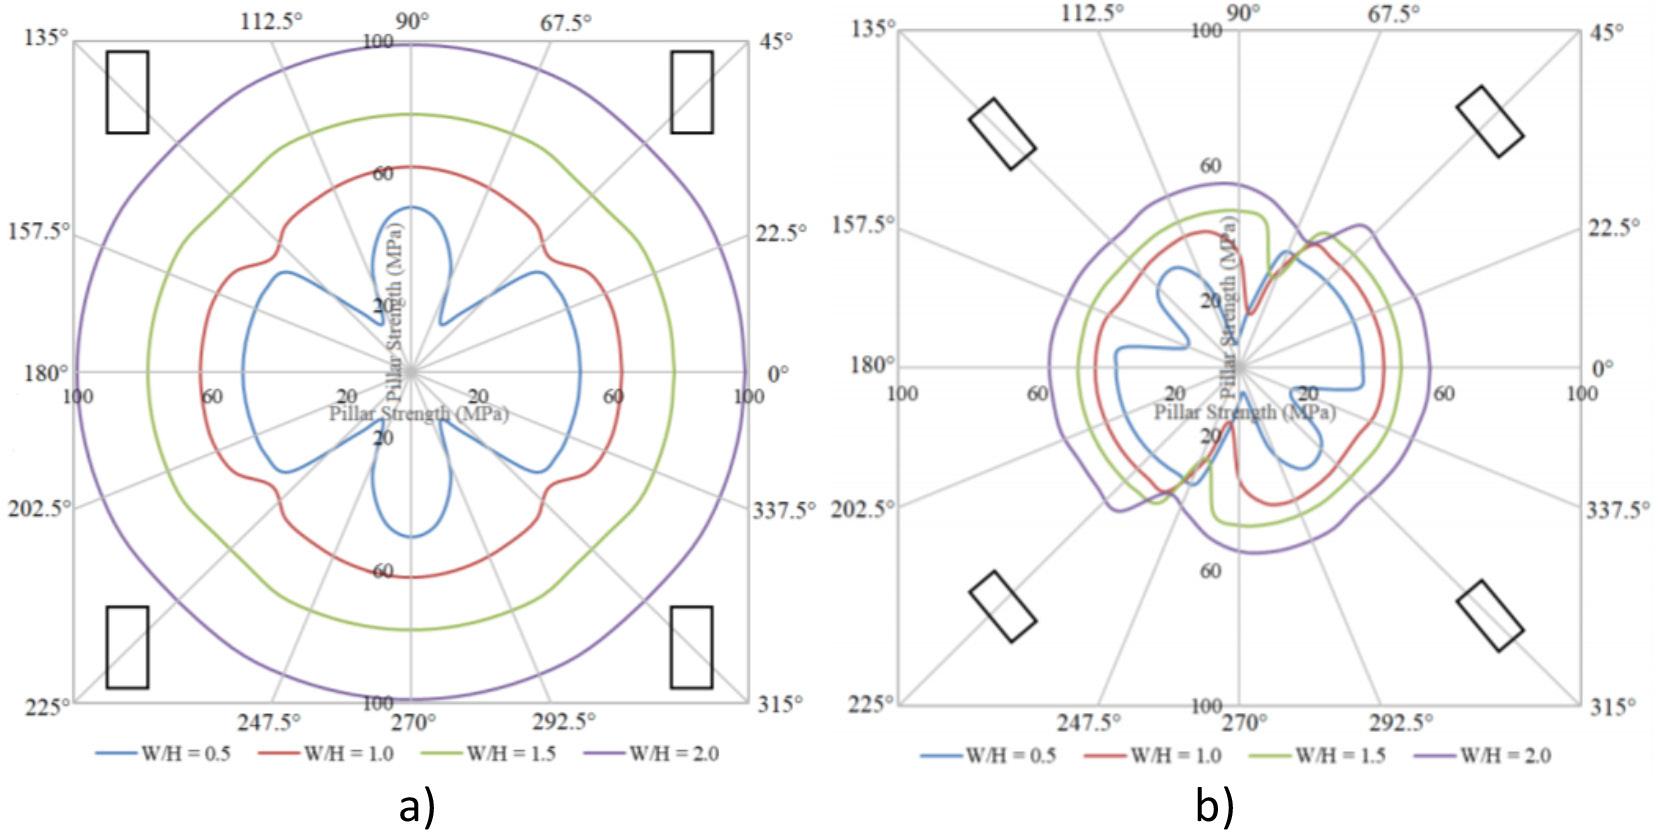
where SRf is a simplified factor, which is the ratio of failure strain (ef ) to critical strain (eC). A flowchart was developed to continuously monitor the in-situ pillars and make the necessary changes to the empirical equations, as shown in Figure 11.
Based on the authors’ experience and knowledge, a new insight into the pillar design process is proposed. For this purpose, a step-by-step procedure, as illustrated in Figure 12, is required to develop a safe and optimized pillar design. As indicated in the pillar design methodology, a large number of factors are involved and contribute to the strength characteristics of a pillar. The first step consists of choosing the most appropriate pillar formula for the specific situation, such as the Salmon and Munro, (1967) equation for coal mines and Lunder and Pakalnis, 1997 equation for hard-rock mines. The second step comprises determining the pillar and room dimensions appropriate for the depth, rock strength, and required extraction ratio with an initial acceptable FOS. Then the various factors, such as the orientation of the orebody, excavation method and presence of geological features are incorporated to design an appropriately sized pillar with final desirable FOS.
Continuous geotechnical monitoring of the pillars needs to be conducted via inspections to improve the performance of the pillars in situ and the pillar design methodology. For example, the monitoring could involve measuring room and intersection width, the actual pillar dimensions, the pillar fracturing using a borescope, and pillar stress changes using flat-jacks. This would guide back-analysis of the empirical equations and can be reformed to improve the performance of the pillars.
Mine local and global stability depend strongly on pillar stability. The failure of one pillar will increase the load (possibly suddenly) on neighbouring pillars, which can cause the failure of other pillars in a domino effect. In this research, therefore, the main factors affecting pillar stability such as pillar inclination and width-toheight ratio were investigated and a comprehensive methodology for pillar design proposed. The following conclusions have been drawn based on the proposed improvised pillar design methodology.
➤ With the step-by-step approach, all the factors such as orientation of the orebody, excavation methods, and presence of geological features can be accounted for when designing the pillars.
➤ When the pillars are monitored in situ, the date can be back-analysed to improve the design process and pillar performance.
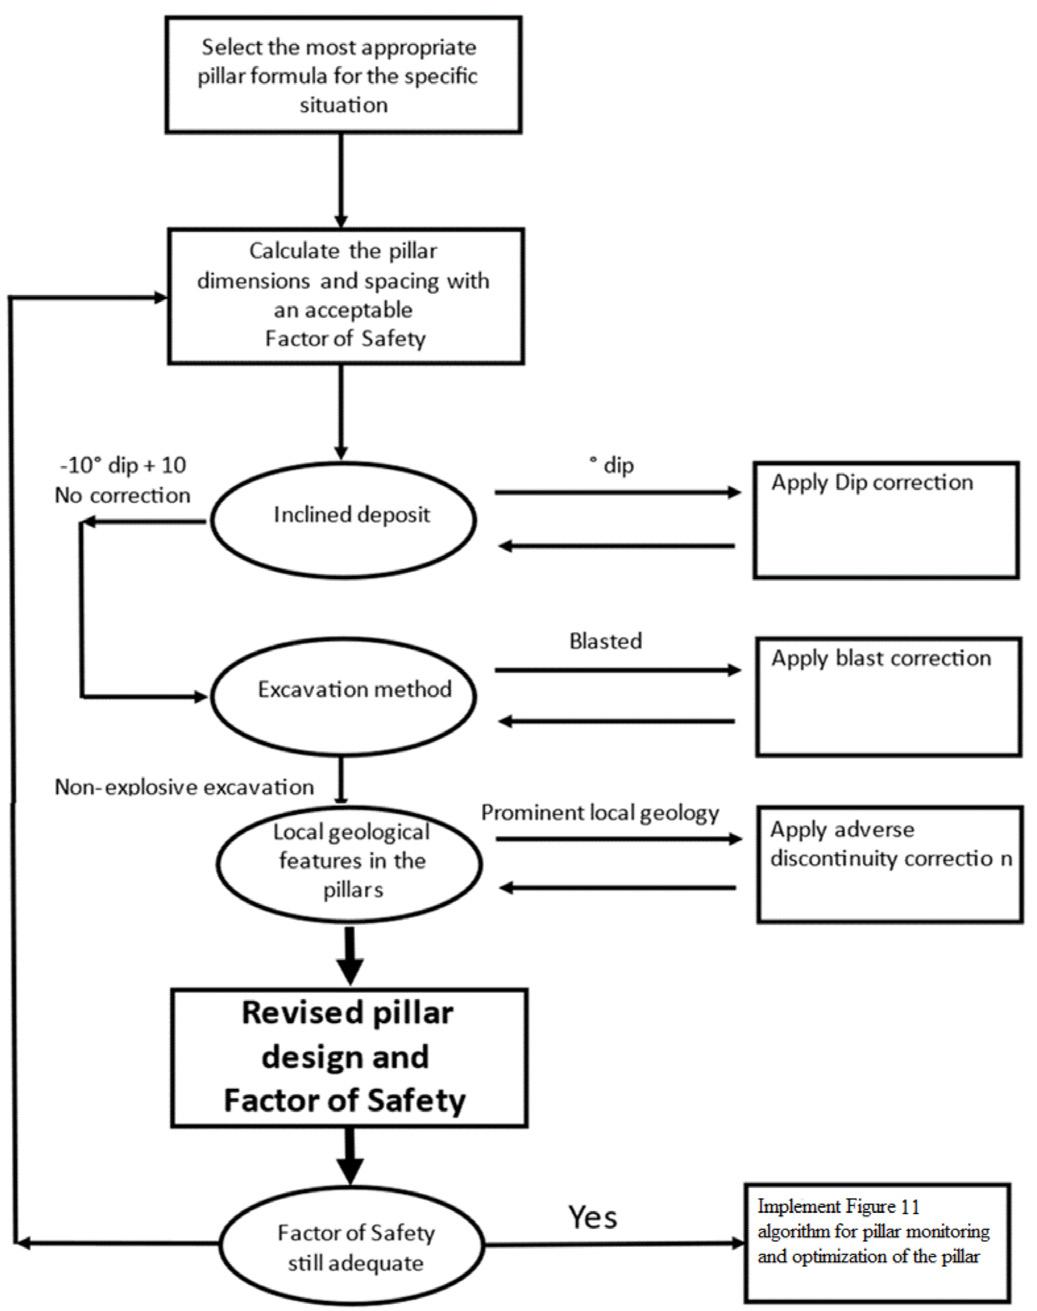
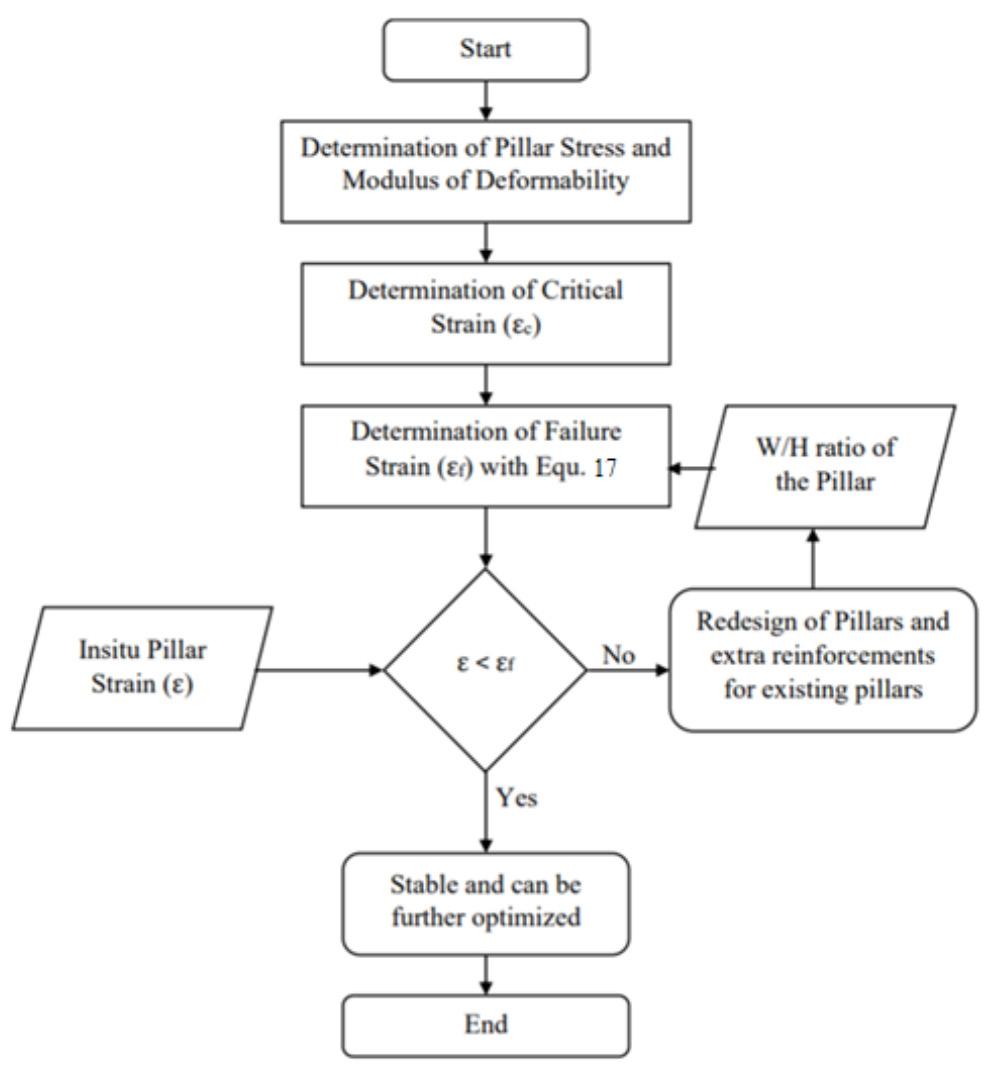
➤ Each factor has a reduction factor, as these factors adversely affect the strength of the pillar compared to horizontal pillars with non-explosive mining method and with minimal presence of geological features.
➤ Limitations to this work on the reduction factors/ corrections include the range of width-to-height ratios investigated (between 0.5 and 2.0), and range of orebody orientations considered from (0˚ to 40˚).
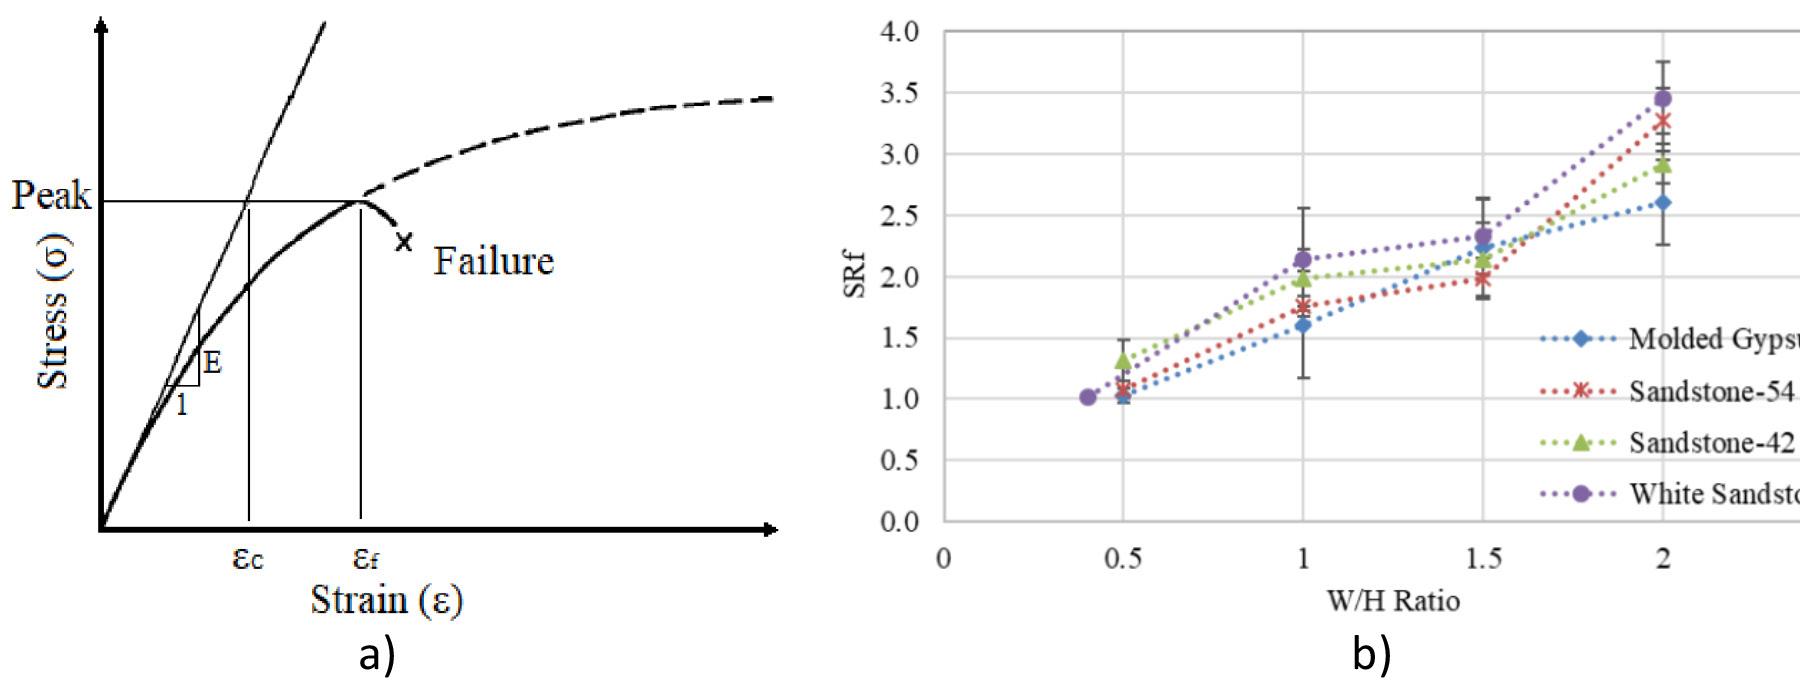
Implementation of the proposed pillar design methodology could optimize mine safety, productivity, and economics.
Bieniawski, Z.T. 1968. The effect of specimen size on the strength of coal. International Journal of Rock Mechanics and Mining Sciences, vol 5. pp. 325–335.
Das, M. 1986. Influence of width to height ratio on post failure behaviour of coal. International Journal of Mining and Geological Engineering, vol. 4. pp. 67–77.
Esterhuizen, G.S. 2006. An evaluation of the strength of slender pillars. Transactions of Society for Mining, Metallurgy, and Exploration, vol. 320. pp. 69–76.
Esterhuizen, G.S., Dolinar, D.R. and Ellenberger, J.L. 2008. Pillar strength and design methodology for stone mines. Proceedings of the 27th International Conference on Ground Control in Mining. Morgantown, WV.West Virginia University. pp. 241–253.
Hedley, D.G.F. and Grant, F. 1972. Stope and pillar design for the Elliot Lake uranium mines. CIM Bulletin. vol. 65. pp. 37–44.
Jessu, K.V., Kostecki, T.R., Spearing, A.J.S., and Esterhuizen G.S. 2018. Effect of discontinuity dip direction on hard rock pillar strength. SME Transactions, vol. 344. pp. 25–30.
Jessu, K.V. and Spearing, A.J.S. 2018. Effect of dip on pillar strength. Journal of the Southern African Institute of Mining and Metallurgy. vol. 118. pp.765–776.
Jessu, K.V. and Spearing, A.J.S. 2019. Direct strain evaluation method for laboratory based pillar performance. Journal of Rock Mechanics and Geotechnical Engineering. vol 11, no. 4. pp. 860–866.
Jessu, K.V. and Spearing, A.J.S. 2019. Performance of inclined pillar with a major discontinuity. International Journal of Mining Science and Technology. vol. 29, no. 3. pp. 437–443.
Jessu, K.V., Spearing, A.J.S., and Sharifzadeh M. 2018. A parametric study of blast damage on hard rock pillars. Energies, vol. 11, no. 7. p. 1901.
Kaiser, P.K, Diederichs, M.S., Martin, C.D., Sharp, J., and Steiner, W. 2000. Underground works in hard rock tunnelling and mining. Proceedings of GeoEng2000, Melbourne Tectonic, Lancaster, PA. pp. 841–926.
Lorig, L.J. and Cabrera, A. 2013. Pillar strength estimates for foliated and inclined pillars in schistose material. Proceedings of the 3rd Internationsal FLAC/DEM Symposium, Hangzhou, China. Paper 01-01. Zhu, H., Detournay, C., Hart, R, and Nelson, M. (eds). Paper 01–01. Itasca International Inc. 2013, Minneapolis.
Lunder, P.J. 1994. Hard rock pillar strength estimation: An applied approach. Maset thesis. University of British Columbia.
Lunder, P.J. and Pakalnis, R . 1997. Determination of the strength of hard rock mine pillars. CIM Bulletin. vol. 90. pp. 51–55.
Ozbay, M.U. and Roberts, M.K.C. 1988. Yield pillars in stope support. Proceedings of the SANGROM Symposium, Swaziland. South African National Group on Rock Mechanics, Johannesburg. pp. 317–326.
Obert, L., Windes, S.L., and Duvall, W.I. 1946. Standardized tests for determining the physical properties of mines rocks. 3891 US Bureau of Mines Report of Investigations.
Sakurai, S. 1981. Direct strain evaluation technique in construction of underground opening. Proceedings of the 22nd US Symposium on Rock Mechanics, American Rock Mechanics Association, Alexandria. pp. 278–82.
Salamon, M.D.G. and Munro, A.H. 1967. A study of the strength of coal pillars. Journal of the South African Insitute of Mining and Metallurgy. vol. 68. pp. 55-67.
Wagner, H. 1980. Pillar design in coal mines. Journal of the South African Institute of Mining and Metallurgy, vol. 80, no. 1. pp. 37–45.
Conceptualization, K.J. and A.S.; methodology, K.J.; software, K.J.; validation, K.J., A.S., and M.S.; formal analysis, K.J.; investigation, K.J.; resources, A.S. and K.J.; data curation, K.J.; writing—original draft preparation, K.J. and A.S..; writing—review and editing, A.S., K.J. and M.S.; visualization, K.J. and A.S.; supervision, A.S.; project administration, A.S. and K.J., funding acquisition, A.S. All authors have read and agreed to the published version of the manuscript.
This research received no external funding but Curtin University kindly provided Kashi Jessu with a PhD scholarship.
Mainly found in the paper Appendices.
Flow chart for the application of dip correction (Figure 13).
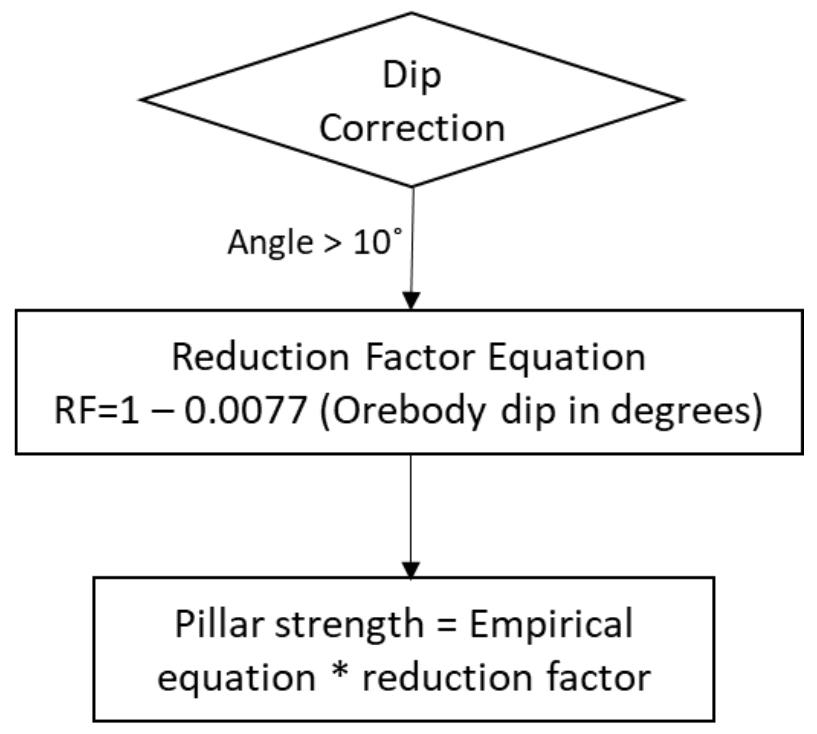
Jessu, Spearing, and Sharifzadeh (2018) developed tables with the help of a parametric study, as shown in Table III.
A flow chart was developed to apply the blast correction for the improved pillar design methodology as shown in Figure 14 (Jessu, Spearing, and Sharifzadeh, 2018).
Charts were developed for all the different discontinuity orientations with respect to pillar inclination to determine the reduction factors (Figure 15).
The flow chart in Figure 16 was developed to apply the adverse discontinuity correction (Jessu and Spearing, 2019; Jessu, Kostecki, Spearing and Esterhuizen,(2018) u.
The Journal of the Southern African Institute of Mining and Metallurgy
Normalized pillar strength
W/H ratio
through
factor Damage
modelling at varying disturbance (D) factors and damage thicknesses
strength
ratio
factor Damage thickness Normalized strength
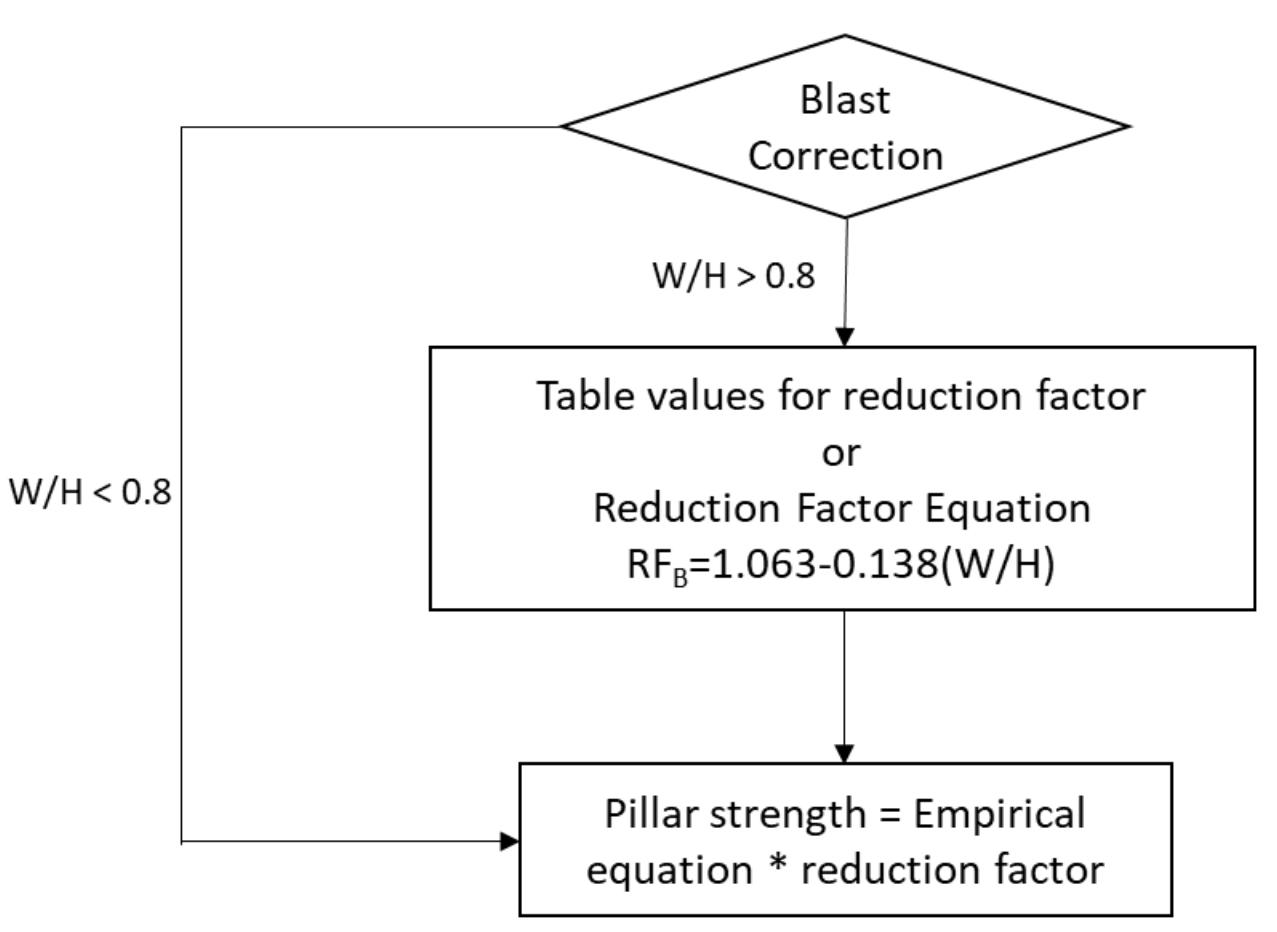
1 0 0 1.00 2 0 0 1.00
1 0.25 0.25 0.98 2 0.25 0.25 0.98
1 0.25 0.5 0.97 2 0.25 0.5 0.96
1 0.25 0.75 0.96 2 0.25 0.75 0.93
1 0.25 1 0.94 2 0.25 1 0.94
1 0.5 0.25 0.98 2 0.5 0.25 0.96
1 0.5 0.5 0.97 2 0.5 0.5 0.92
1 0.5 0.75 0.97 2 0.5 0.75 0.88
1 0.5 1 0.94 2 0.5 1 0.87
1 0.75 0.25 0.99 2 0.75 0.25 0.93
1 0.75 0.5 0.97 2 0.75 0.5 0.86
1 0.75 0.75 0.96 2 0.75 0.75 0.82
1 0.75 1 0.94 2 0.75 1 0.80
1 1 0.25 0.99 2 1 0.25 0.89
1 1 0.5 0.96 2 1 0.5 0.81
1 1 0.75 0.95 2 1 0.75 0.77
1 1 1 0.93 2 1 1 0.78
1.5 0 0 1.00 2.5 0 0 1.00
1.5 0.25 0.25 0.98 2.5 0.25 0.25 1.00
1.5 0.25 0.5 0.96 2.5 0.25 0.5 0.99
1.5 0.25 0.75 0.94 2.5 0.25 0.75 0.95
1.5 0.25 1 0.93 2.5 0.25 1 0.97
1.5 0.5 0.25 0.96 2.5 0.5 0.25 0.98
1.5 0.5 0.5 0.91 2.5 0.5 0.5 0.95
1.5 0.5 0.75 0.88 2.5 0.5 0.75 0.89
1.5 0.5 1 0.86 2.5 0.5 1 0.88
1.5 0.75 0.25 0.92 2.5 0.75 0.25 0.95
1.5 0.75 0.5 0.85 2.5 0.75 0.5 0.89
1.5 0.75 0.75 0.85 2.5 0.75 0.75 0.86
1.5 0.75 1 0.84 2.5 0.75 1 0.83
1.5 1 0.25 0.91 2.5 1 0.25 0.92
1.5 1 0.5 0.86 2.5 1 0.5 0.83
1.5 1 0.75 0.84 2.5 1 0.75 0.79
1.5 1 1 0.84 2.5 1 1 0.73
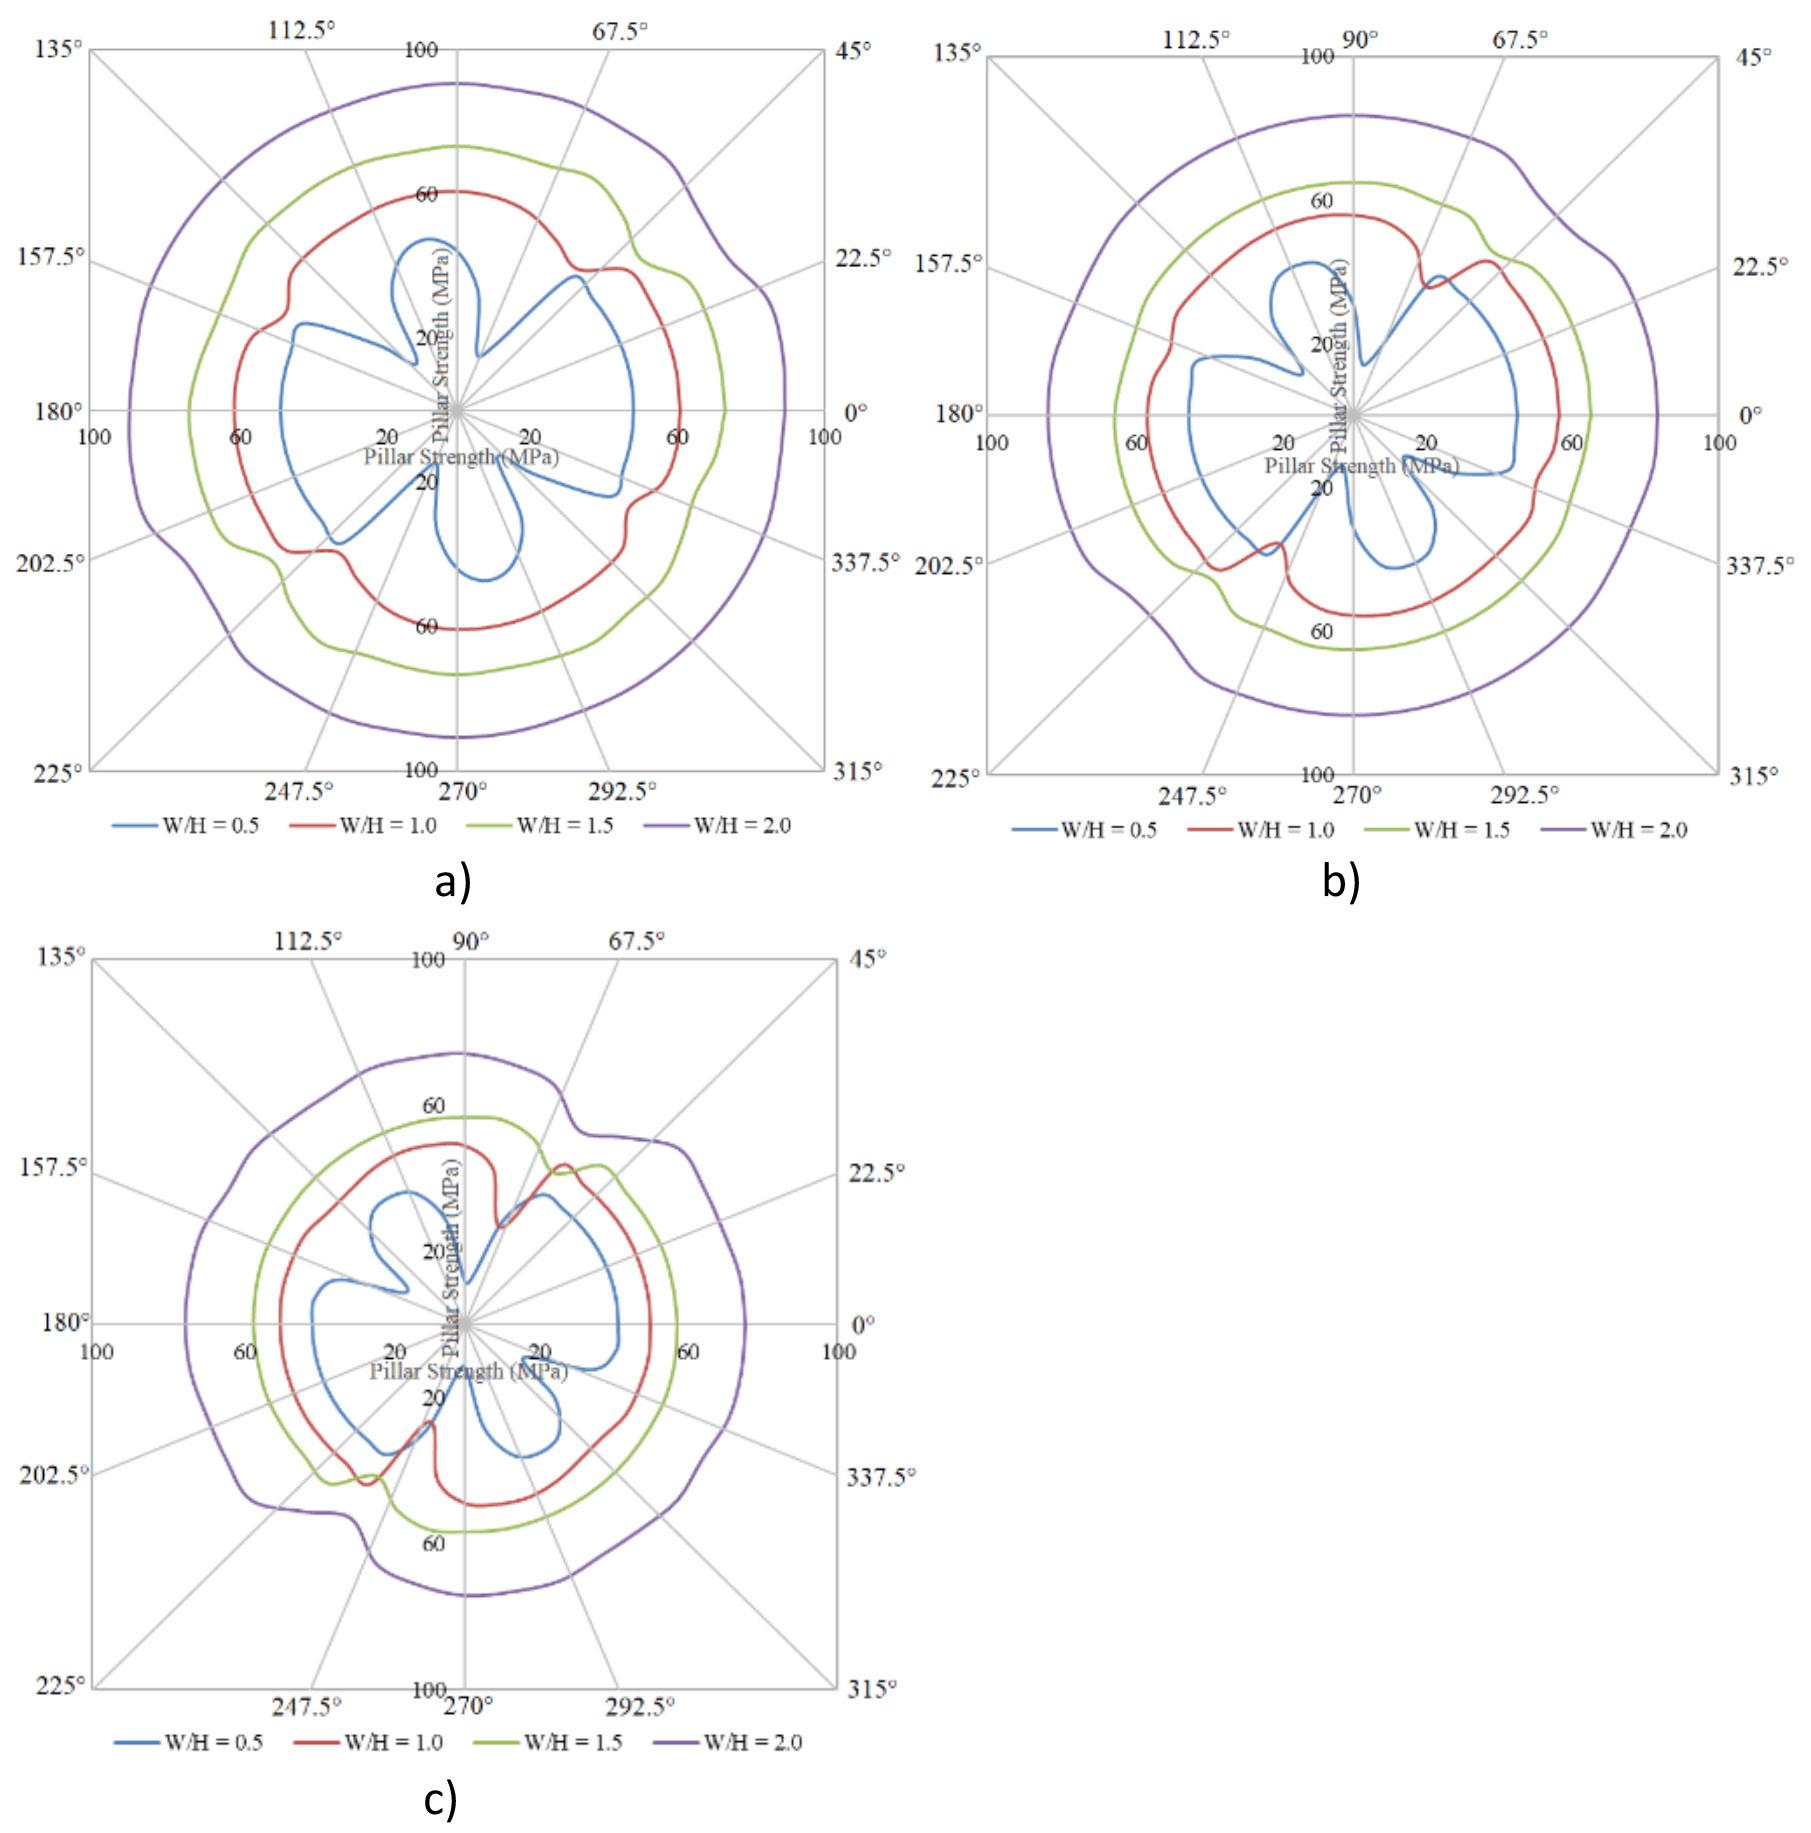
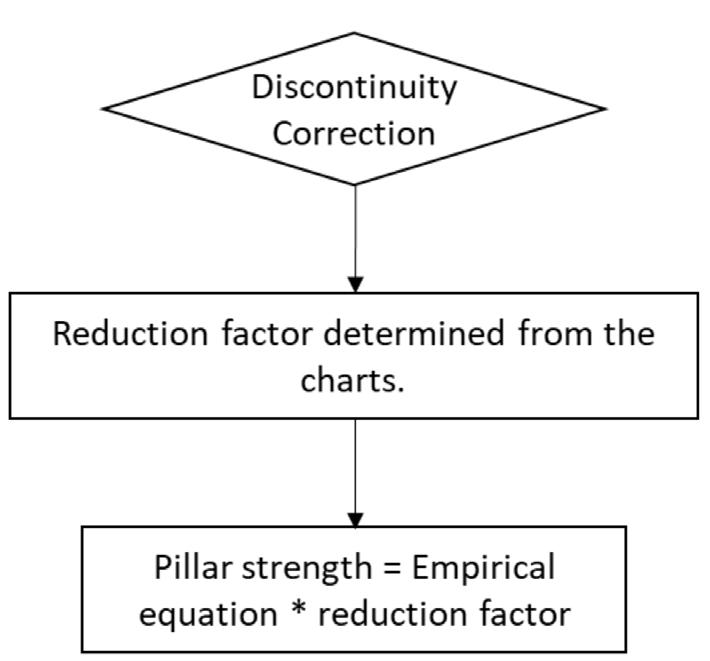
Affiliation:
1CSIR-Central Institute of Mining & Fuel Research, Dhanbad, India. 2Indian Institute of Technology (I.S.M), Dhanbad, India.
Correspondence to: S. Dey
Email: surajitcmri@gmail.com
Dates:
Received: 21 Dec. 2019
Revised: 2 Apr. 2021
Accepted: 26 Jul. 2022
Published: October 2022
How to cite: Dey, S., Mandal, S.K., and Bhar, C. 2022
Application of MR and ANN in the prediction of the shovel cyclt time, thereby improving the performance of the shovel-dumper operation—A case study.
Journal of the Southern African Institute of Mining and Metallurgy, vol. 122, no. 10, pp. 597 606
DOI ID: http://dx.doi.org/10.17159/24119717/1075/2022
Loading and hauling of ore and waste are the key operations of an opencast coal mine and entail a high operational cost. The productivity of a mine can be increased by reducing the cycle time of loading equipment as well as utilizing dumpers optimally. In this paper we discuss the impact of rock type, bucket fill factor, rock fragmentation, the height of the cut, and angle of swing of the bucket on shovel performance. A time study is conducted on shovels in an opencast coal mine with experimental blasts of rocks to assess the impact of different factors on the performance of the shovel. Based on the data, the authors applied multiple regression (MR) and artificial neural network (ANN) techniques to develop different models for the prediction of the shovel cycle time. Developed models are validated by comparing the predicted data with actual field data. With the help of the best model, the plausible fleet size is determined in order to utilize the shovel and dumper optimally and to improve the performance of shovel–dumper operation.
shovel, dumper operation, cycle time, MR, ANN, match factor.
India is the second-largest coal producer in the world, with around 7.9% of global coal production in 2018 (BP Statistical Review of World Energy, 2019). To meet the country's coal demand, most of the coalproducing companies have shifted from underground mining to opencast methods. In the present mining scenario, more than 94% of coal production in India is met by opencast coal mines. (Ministry of Coal, 2019). Proper planning, as well as utilization of the machines used in opencast mines, is of paramount importance for effective and economical coal production.
Rock fragmentation vis-à-vis loading and transportation of the blasted muck are the key modules of production in opencast coal mines and constitute about 50-60% of the total operating cost (Alarie and Gamache, 2002; Doktan, 2002; Hartman, 2002). In the Indian opencast mines, dumpers in conjunction with a shovel are generally used for material handling. The utilization of shovel and dumper needs to be optimized to reduce material handling costs and increase the commercial viability of the mines.
Chaowasakoo, et al. (2017) simulated the most effective real-time truck dispatching strategy for assigning a combination of truck-shovel operations in order to maximize productivity considering the three uncertain parameters, i.e. truck cycle time, the loading time of the matched dumper and shovel, and idle times of trucks and shovels at PT. KitadinTandungMayang’s East Kalimantan production site, Indonesia. Pasch and Uludag (2018) conducted a similar study to optimize the loading-hauling fleet to improve the production of the opencast colliery. The literature reveals that, the match factor (MF) is one of the most important indicators to evaluate the utilization of any shovel – dumper operation (Krzyzanowska, 2017). The MF is defined as the ratio of truck arrival rate to loader service rate, and it is one of the most important indicators to measure the effective utilisation of loading and hauling equipment. The match factor can be determined from Equations – [1] and [2] (Hanby, 1991; Kesimal, 1998).
[1] [2]
where, MFi,i’ is the match factor of ‘i’ type truck and ‘i’’ type loader; xi is the number of ‘i’ type trucks; yi’ is the number of ‘i’’ type loaders; ti,i’ is the time taken to load ‘i’ type truck with ‘i’ type loader; and tX is the average cycle time of the trucks, excluding waiting times.
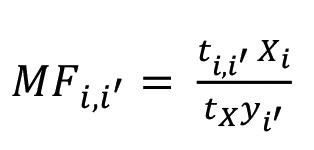
Burt (2008) derived Equation [3] for heterogeneous types of loading and hauling equipment,
where, tX is the average cycle time of all types of trucks; xi is the number of i type of trucks; xi’ is i’ type of loader; ti,i’ is the time taken to serve the truck type i by loader type i’; and ti,h is the cycle time of truck type i on haul route h.
This study emphasizes shovel operation only in the opencast coal mines, where the cycle time of dumper operation is known. The productivity and efficiency of a shovel are affected by several variable factors like muckpile characteristics, loading geometry, practice, operating conditions, and loader design (Singh, 2006). Independent factors like size and type of loading equipment, the experience of the operator, site characteristics, operating conditions of the machine, and rock properties also affect the performance of the shovel (Ceylanoğl, Karpuz, and Paşamehmetoğlu, 1994). Various researchers have established a correlation between rock fragmentation characteristics and the productivity of loading equipment vis-à-vis actual production of a mine (Allen, Hawkes, and Noy, 1999; Doktan, 2002; Michaud, Lizatte, and Scoble, 1997; Singh and Narendrula, 2001).
Researchers have also indicated that production can be enhanced by 3% of reducing the cycle time of loading equipmentby 20% (Hawkes 1998). Kirmanli and Ercelebi (2009), developed an expert system to select the excavator and dumper combination to minimize production cost, whereas a genetic algorithm was used by Marzouk and Moselhi, (2002) to optimize the loader-haul fleet for a particular type of loader and dumper.
Literature reveals that the cycle time of a shovel is affected by different factors. The study of factors affecting the shovel operation and prediction of the cycle time of shovel helps to optimize the utilization of shovel-dumper fleet. Therefore, an effort has been made to study dumper operation to predict the total cycle time of the shovel by applying multiple linear regression (MR) and the artificial neural network (ANN) techniques separately. The major objective is to minimize the total cycle time of the shovel and optimize the shovel–dumper operation to enhance productivity. The developed model was validated by comparing the predicted cycle time from the models output data with actual field values, and encouraging results have been observed.
Production of a shovel is expressed in bank cubic metres per unit time and is always less than the equipment's rated capacity. The production cycle of the shovel consists of four basic components; fill the bucket, swing with the load, dump the load, and return swing for the next load. Bucket fill factor, bench height, swing angle, and rock fragmentation sizes are the major factors affecting the shovel's actual production.
The bucket fill factor is defined as the ratio of the actual volume of material excavated to the nominal volumetric capacity of the shovel bucket; it varies with the rock type. It is predominantly an operational variable and depends upon the loading strategy, operator experience, and willingness to fill the bucket and the angle of repose of the material on top of the bucket (Bozorgebrahimi, Hall, and Blackwell, 2003). An improper
fragmentation results in large boulders, which reduce the bucket fill factor and increase the cycle time of the shovel as well as the waiting time of the dumper.
Bench height, which influences the muck profile and cycle time of the shovel and dumper, is as the vertical distance between crest and toe of the bench (Ercelbi and Basceetin, 2009). For a high bucket capacity shovel (> 2.5 m³), a shallow bench height may incur more passes to fill a dumper and may also involve increased the traversing time along the blasted muck. A higher bench height compared to the maximum digging height of the excavator may reduce the depth of penetration in the blasted muck or more strokes may be required to fill the bucket for one pass. It may result in incomplete removal of blasted muck from the crest of the bench and improper fragmentation in the subsequent blast. Therefore, an optimum bench height with regards to the maximum digging height of the excavator may optimize the cycle time of the excavator.
The angle of the swing of the shovel bucket, i.e., the angle in the horizontal plane between the loading and unloading points of the shovel, directly influences the cycle time of the shovel. Therefore a minimum swing angle can minimize shovel cycle time and waiting time of dumpers during intermittent periods.
Improper fragmentation results in more void spaces in the bucket and an increase in the cycle time of the shovel to fill a dumper. It also increases the time required to handle individual oversize boulders during mucking and increases the total loading time. Neilson (1987) correlated different pass sizes of boulders (50%, 80%, and 90%) with the bucket fill factor of loading equipment. Doktan (2001) indicated that a better-fragmented blast results in a 35% reduction in shovel digging time and a 22% increase in productivity. The author has derived Equation [4] to determine digging time.
where; a = 8.9942, b = 6.8706e-2, X50 = 50% passing size, and Un = Uniformity coefficient
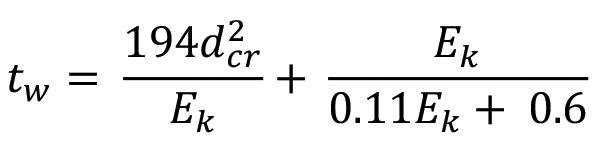
With the help of time study data, Molotilov, Cheskidov, and Norri (2008) derived Equation [5] to calculate bucket fill time and indicated that the bucket size (capacity) should be increased to minimize the effect of fragment size on digging time.
where, tw is the shovel bucket filling time, dcr is fragment size, and Ek is the geometric capacity of a shovel bucket
The study on loading and hauling operations was conducted at Jharia Coalfield, Dhanabd, India. The study was conducted on one 10 m3 and one 5 m3 capacity shovel, which are employed to load overburden on 60 t and 85 t dumpers. The study was conducted in four phases. In the first phase, a time study was done on shovel–dumper operation. In the second phase, the factors that affect the shovel's performance were identified. In the third phase, different models were developed for predicting shovel cycle time
Application of MR and ANN in the prediction of the shovel cycle time, thereby improving the performance
by applying MR and ANN techniques separately, and the models were validated with actual field data. In the fourth and final phase, the best prediction model was applied the the shovel and dumpers that are allocated for material handling operations.
During the first phase of the study, it was observed that the waiting time of the dumper behind shovels is the highest operational delay in a shift hour (Figure 1). Initial data, presented in Table I, shows that the value of the MF is greater than 1.00, which indicates that the utilization of shovels and dumpers is not optimum, and hence the loading–hauling performance is poor. Further, It was also observed that the quality of rock fragmentation was very poor, affecting the shovel cycle time. The initial blasting parameters of the mines are given in Table II.
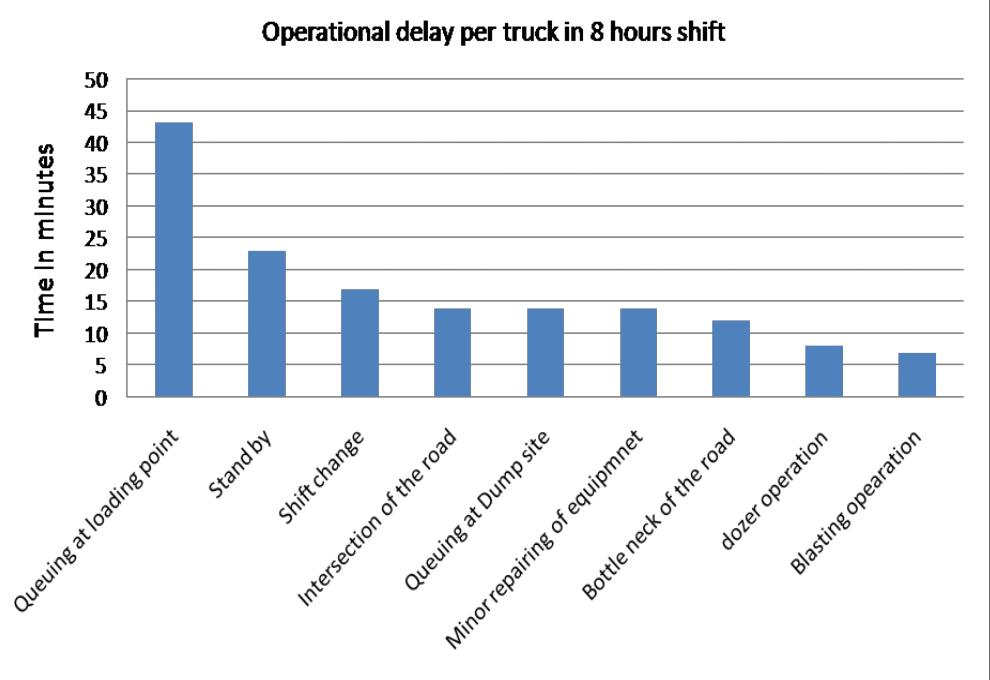
A few experimental blasts were conducted to improve rock fragmentation. Afterwards, a time study of each shovel was done against the loading of rocks of different fragmentation sizes at different heights of cut with varying angles of swing to obtain the cycle time under different conditions. The total loading time of a dumper is calculated from Equation [6].
where Tl is complete loading time, tc is shovel cycle time, n is the number of passes to load the dumper, and a is the time allowance for spotting the shovel to the digging location during one complete loading cycle.
In the above equation ‘n’ depends on the bucket capacity of the shovel, the capacity of the dumper, the fill factor, and swelling factor of the muck. Operational delays due to face cleaning, minor breakdowns of shovels, and dozer operations are not considered in the study. The experimental blasting parameters are tabulated in Table III.
WIPFRAG software was used to determine the rock fragmentation size with the help of a Cannon HD camera. Rock fragmentation was determined by four passing sizes, K100 or 100%, K80 or 80%, K50 or 50%, and K20 or 20% passing sizes. In this study, the average cycle time of shovels is considered for accessing the effect of different factors on shovel performance. MINITAB 17 software was used for statistical analysis of data.
coefficient
factors; the rock fragmentation size (
sizes), the uniformity Index
Application of MR and ANN in the prediction of the shovel cycle time, thereby improving the performance
of rock fragmentation (Un), the angle of swing (As) of the shovel bucket, and the ratio of the height of the cut (or face height) to the maximum digging height of the shovel (Hr) are tabulated in Table IV. The scatter plots of shovel cycle time and different fragmentation sizes are shown in Figure 2.
It is observed from Table IV that the cycle time of the shovel is mainly affected by the quality of rock fragmentation and the swing angle of the shovel. K50, K80, and K100 passing sizes of rock fragmentation and swing angle have a good correlation with the cycle time of the shovel. The uniformity index is not correlated with the cycle time of the shovel. The height of the cut rarely affects the cycle time. However, only three heights of cut were considered in the study. The height of the cut is considered here as the ratio of the height of the cut to boom height.
Based on the available data and correlations between different parameters and average cycle time of the shovel multiple linear regression models were developed, with an assumption that there exists a linear relationship between average cycle time and different factors like fragmentation size and swing angle. Three models were developed using regression analysis, presented in Equations [7], [8], and [9]. All the fragmentation sizes; K20, K30,
K80, and K100, and swing angles are considered for developing Model 1. Similarly, fragmentation sizes K80, K100, and swing angle considered in Model 2, and fragmentation sizes; K50, K100, and swing angle for developing Model 3.
Model 1:
Model 2:
Model 3:
where tc is the cycle time of shovel, K20, K50, K80, and K100 are the fragmentation sizes of materials, and As is the swing angle
Interpretation regarding regression models of the cycle time of shovel
Table V shows the statistical summary of regression analysis conducted using the three developed models presented in Equations [7], [8], and [9]. The following interpretations are made from the data.
(a) The p-value for all the regression models in Table V (0.000) shows that the model estimated by the regression procedure is significant at 0.05.
(b) The higher values of R2 and adjusted R2 indicate that all the three models fit the data well.
(c) For all the three models the predicted R2 value is close to the R2 and adjusted R2 values. Therefore the models do not appear to be over it and have adequate predictive ability.
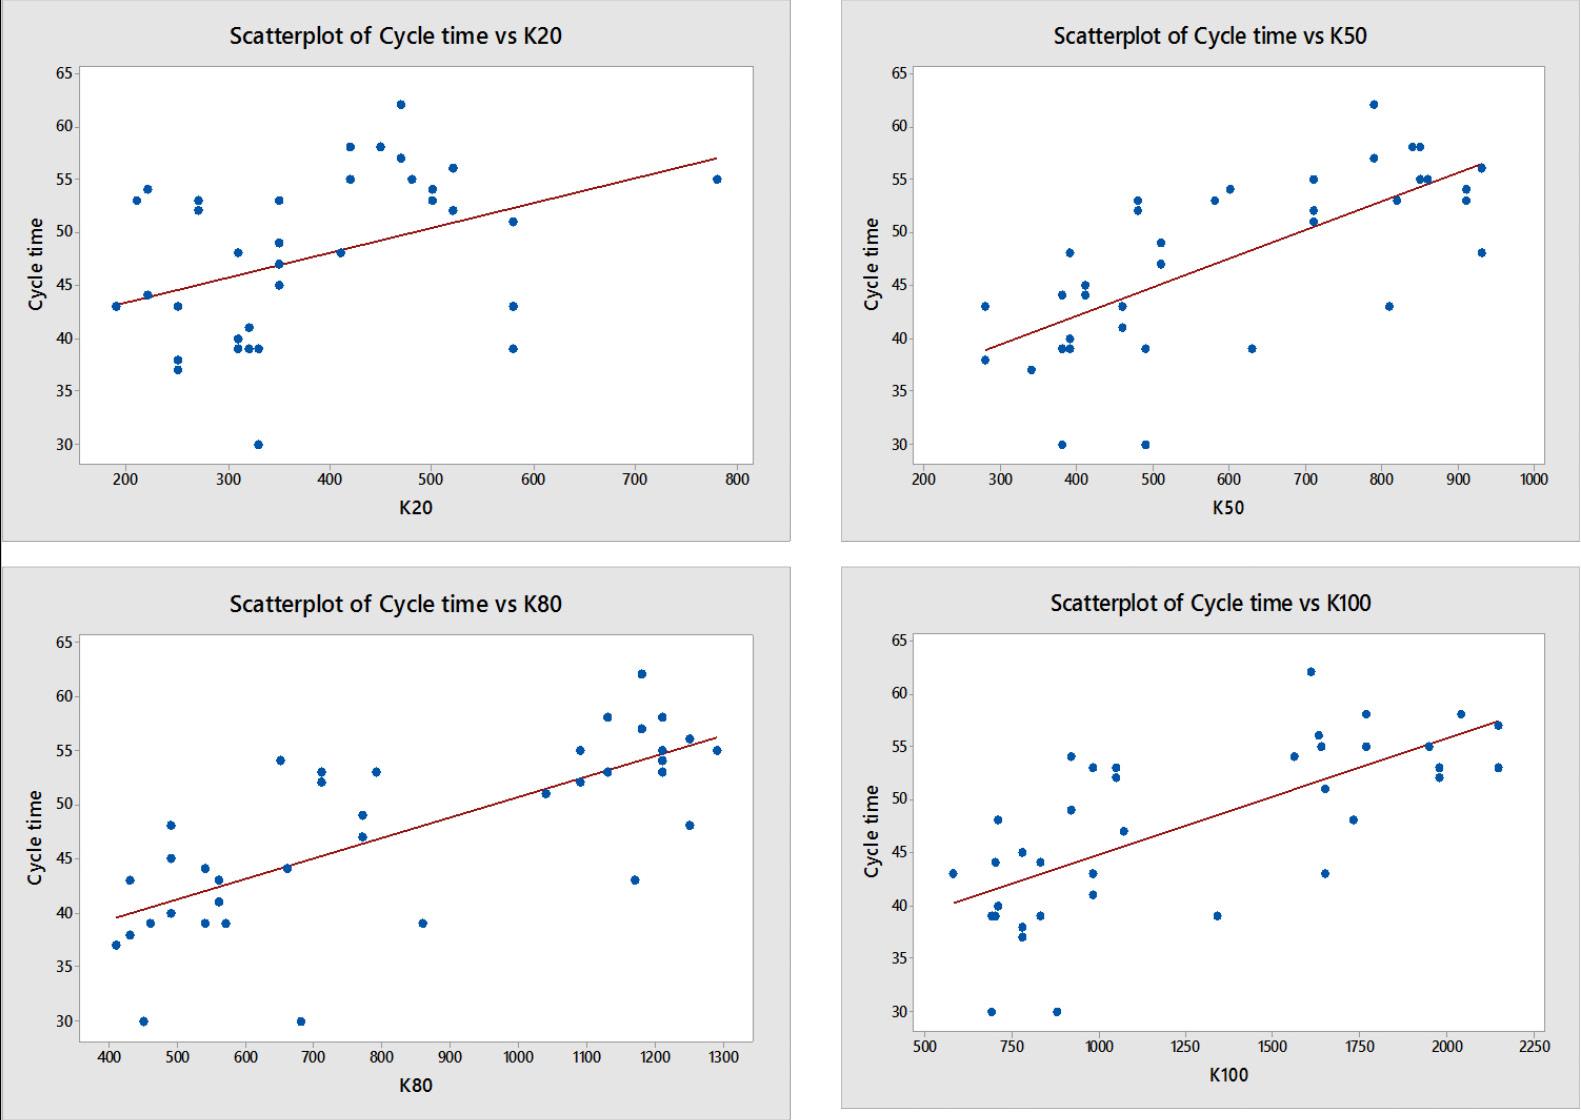
Application of MR and ANN in the prediction of the shovel cycle time, thereby improving the performance
(d) The normal probability plots (Figures 3, 5, and 7) of all three models show an approximately linear pattern consistent with a normal distribution.
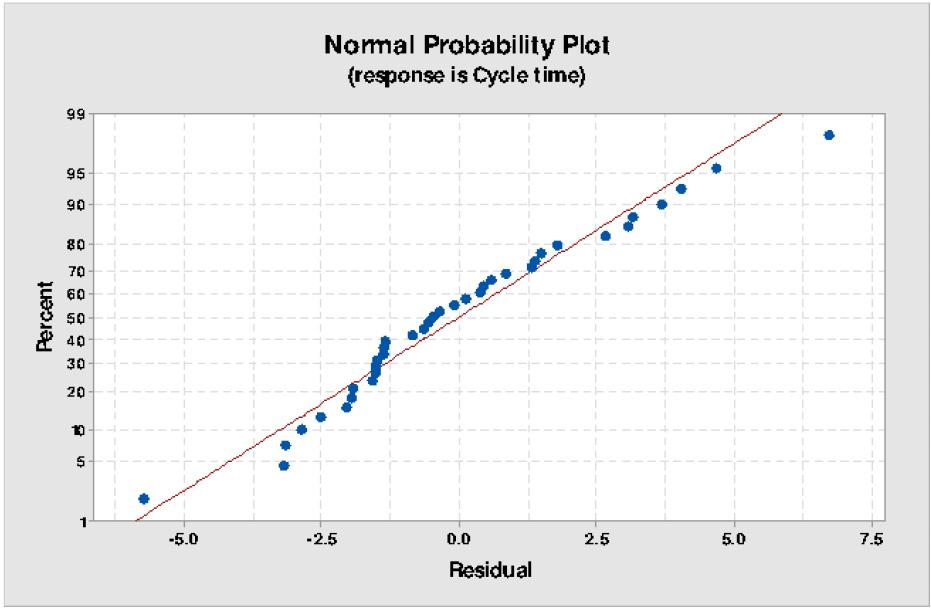
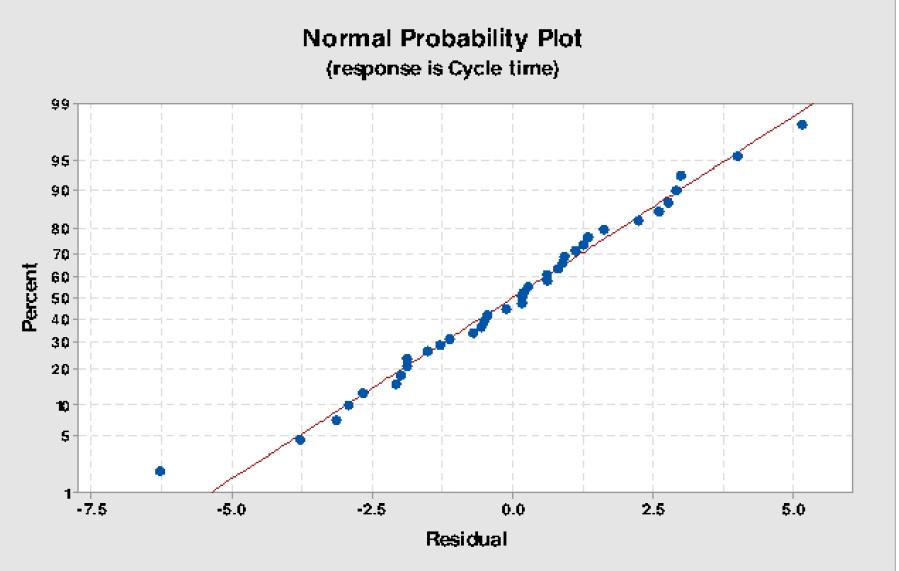
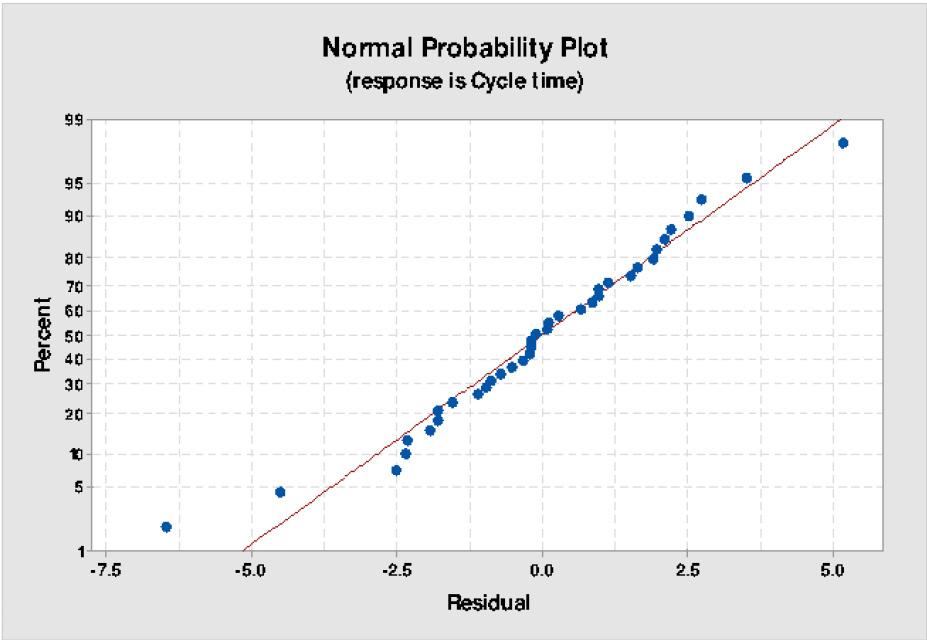
(e) Plots of residuals versus the fitted values (Figures 4, 6, and 8), show that most of the residuals are scattered around the reference line in the same manner.
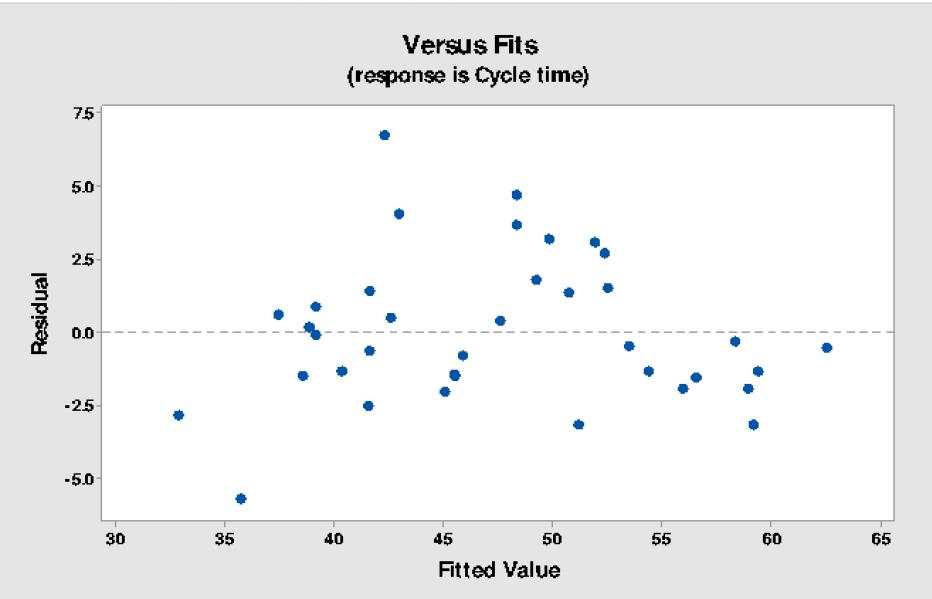
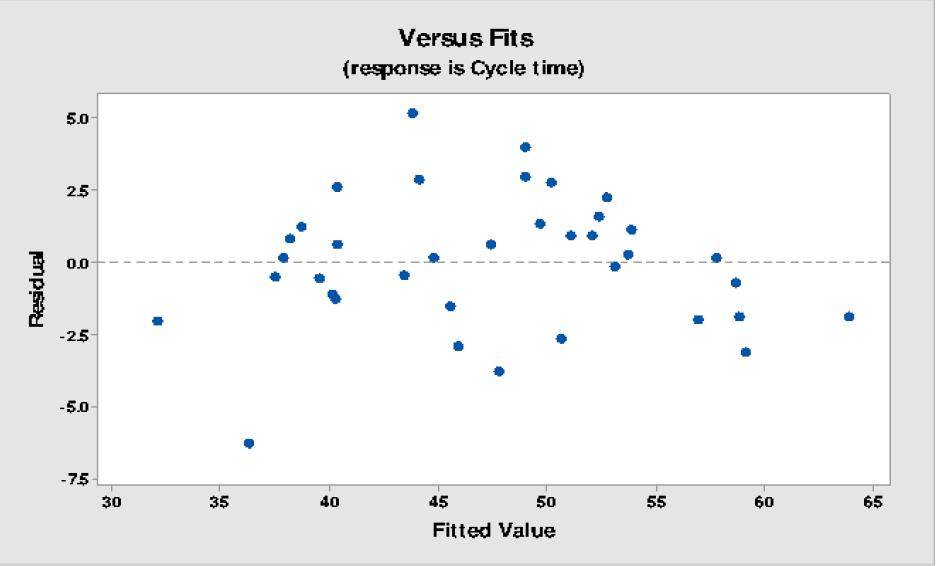
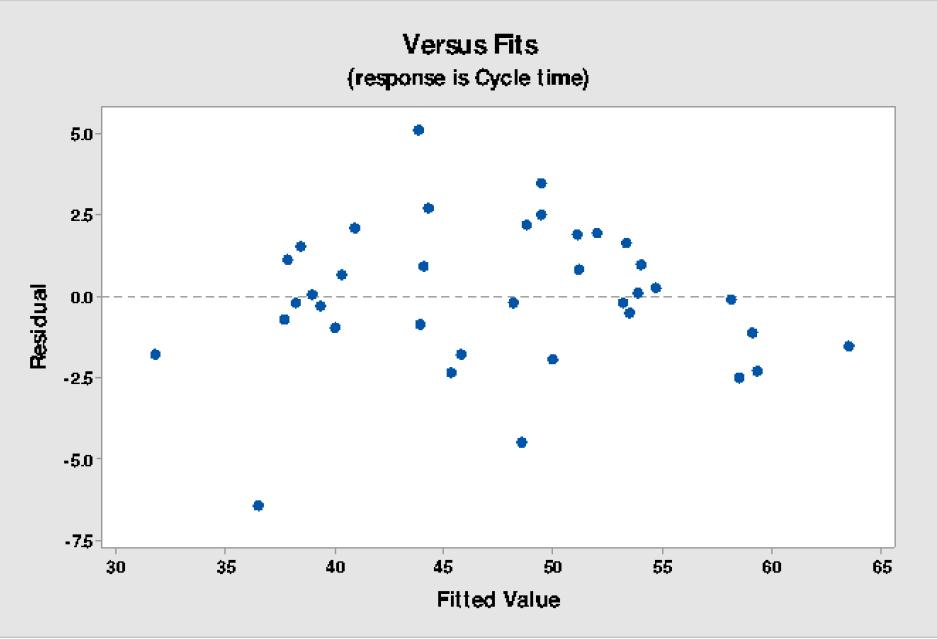
(f) The p-values for all the estimated coefficients of Equation [9] are less than 0.05, and hence they are related to ‘cycle
time’ significantly at an a-level of 0.05, but the estimated coefficient of K80 and As are only significantly related to ‘cycle time’ at an a-level of 0.05 for Equations [7] and [8].
(g) VIF of predictor ‘As’ for all the equations is near to unity, which indicates that it is not correlated to any predictor variable in any equation. For Models 1 and 2 (Equations [7] and [8]), the VIF value of predictors other than ‘As’ is greater than 5 and indicates that severe multi-colinearity may exist among the predictors. For Model 3 (Equation [9]), the VIF value of predictors is less than 5, indicating that the predictor may be moderately correlated.
Application of MR and ANN in the prediction of the shovel cycle time, thereby improving the performance
1 0.000 92.4% 91.2% 89.6% K20-0.102 K50-0.818 K80-0.007 K10-0.214 As-0.000
2 0.000 91.8% 91.0% 89.7% K80-0.000 K10o-0.418 As-0.000
3 0.000 90.1% 89.2% 87.9% K50-0.001 K10o-0.036 As-0.000
The above analysis reveals that Equation [9] (Model 3) is the most suitable for the prediction of the shovel cycle time. During the study, it was observed that in a few cases, the maximum size of fragmentation or K100 enhances the digging time and swing time (with load), and hence the shovel cycle time is increased to a maximum extent. K100 is therefore kept as a variable in all the equations. The mean particle size of fragmentation or K50 can be predicted by Equation [10], developed by V.M. Kuznetsov (Cunningham, 2005). Table V shows the statistical analysis of regression. It is revealed from the analysis that Equation [9] (Model 3) is the most suitable for the prediction of the shovel cycle time. Therefore Equation [9] can be more helpful in predicting the cycle time in the field with the help of this equation.
[10]
where, Xm = mean particle size (cm); Fr = rock factor (varying between 0.8 and 22, depending on hardness and structure), E = powder factor, which is expressed in kilograms of explosive per
K20-2.50 K50- 20.33 K80-27.21 K100-8.04 As- 1.08
K80-7.41 K100-7.41 As- 1.00
K50- 4.64 K100-4.63 As-1.00
cubic metre of rock; Qb = mass of explosive charged in the blasthole kg; RWS = relative weight strength of explosive. ( ANFO =100, TNT = 115).
Prediction of shovel cycle time through ANN
In ANN, the analysis system learns from the sequence of input and output data-sets and gathers the knowledge by detecting the patterns and relationships in data through experience. The effectiveness of ANN depends on the proper analysis of technical parameters, input data, and operating conditions (Schabowicz and Hola, 2007).
Here, three types of networks have been structured for the prediction of average cycle time; the three structures are shown in Figures 9, 10, and 11. Easy NN-Plus software was used for the ANN models. For training of the ANN models, three types of data structures were used for the three networks, Table VI shows the data structures. A total of 37 sets of data were used for each of the three networks. Table VII shows the details and number of layers considered for the three types of structure used for learning or training ANN models.
of MR and ANN in the prediction of the shovel cycle time, thereby improving the performance
of
9
A few experimental blasts were conducted considering different rock fragmentation sizes and angular positions of the shovel relative to the dumper position. The average cycle time of the shovel was predicted by applying all three models developed by MR and the three models developed by ANN. The details of fragmentation sizes and angle of swing (As) are shown in Table VIII. Prediction models were validated after conducting actual studies on shovel cycle time with different fragmentation sizes Table VIII, and the actual and predicted values of cycle time compared. The statistical analysis of actual and predicted data is presented in Table IX. The scatter plot of the actual average cycle time vs predicted/estimated cycle time is shown in Figure 12.
The above analysis reveals that the coefficient of correlation between actual and predicted values for all three models developed by applying the MR technique is higher than for the models developed using ANN. Among the six models developed
percentage of
based on three factors; K50, K100, and As. Therefore,
applied further to predict the
dumper fleet size
time
so that the
be improved.
that the MR Model 3
[9]) is the most efficient in terms of prediction of
time. This model is therefore used for determination
the dumper fleet size and improvement of shovel–dumper
Time allowances for positioning of shovel are to be considered during the calculation of the total loading time of the dumper. The study found that the mean time allowance is different for 10 m3 and 5 m3 shovels. Figure 13 shows the histogram of time allowances is different for 10 m³ and 5 m³ shovels. The mean time allowances for the 10 m³ and 5 m³ shovels are 26.39 seconds and 31.28 seconds, respectively. The histogram shows that the variation in data for 5 m³ shovels is more than that for 10m³ shovels. Six studies were conducted with the calculated total loading time of the dumper with the help of predicted shovel cycle time by multiple regression Model 3 (Equation [9]) and mean time allowances of shovels. Accordingly, the number of each type of dumper to be utilized with each shovel is determined, keeping the value of tMF near 1.00. Instead of a homogeneous fleet (single type of dumper), a heterogeneous fleet comprising two types of dumper is proposed. Table X shows the proposed dumper fleet sizes for the six studies.
Output of regression Model-1 0.95 5.59 2.40
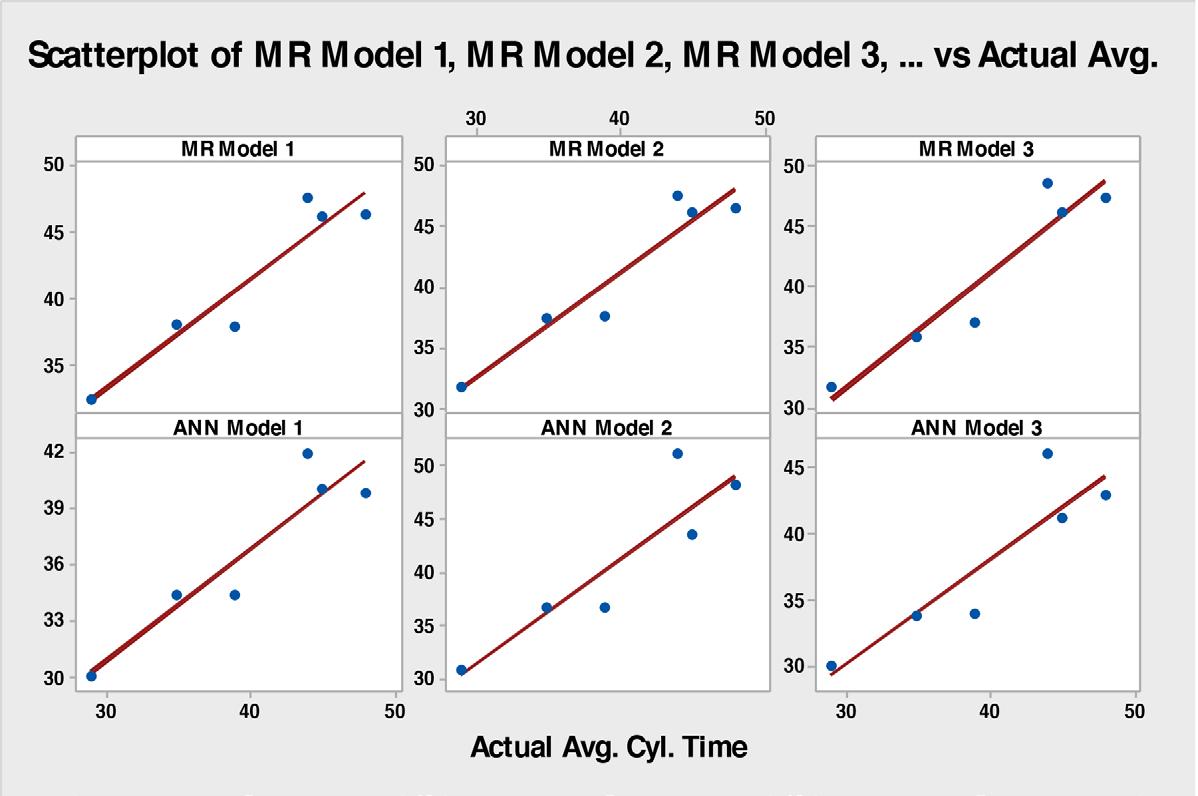
Output of regression Model-2 0.96 5.09 1.76
Output of regression Model-3 0.95 4.58 3.06
Output of ANN Structure-1 0.92 11.76 7.34
Output of ANN Structure-2 0.91 7.80 5.83
Output of ANN Structure-3 0.92 5.83 4.24
error
After conducting the study based on experimental blasts and determining the dumper fleet size against each of the shovels by predicting dumper loading time, the performance of the shovel was studied and is tabulated in Table XI. The study is summarized in Table XII, and the scatter plot of predicted vs actual cycle time of shovels is shown in Figure 14. It was found (Tables XI and XII) that the average production of the 10 m³ shovel, in terms of the average number of buckets of material loaded to dumper per hour, is increased by 19% (from 67 to 79.75), and that of the 5 m³ shovel is increased by 16% from 72 to 83.5. The average waiting time of
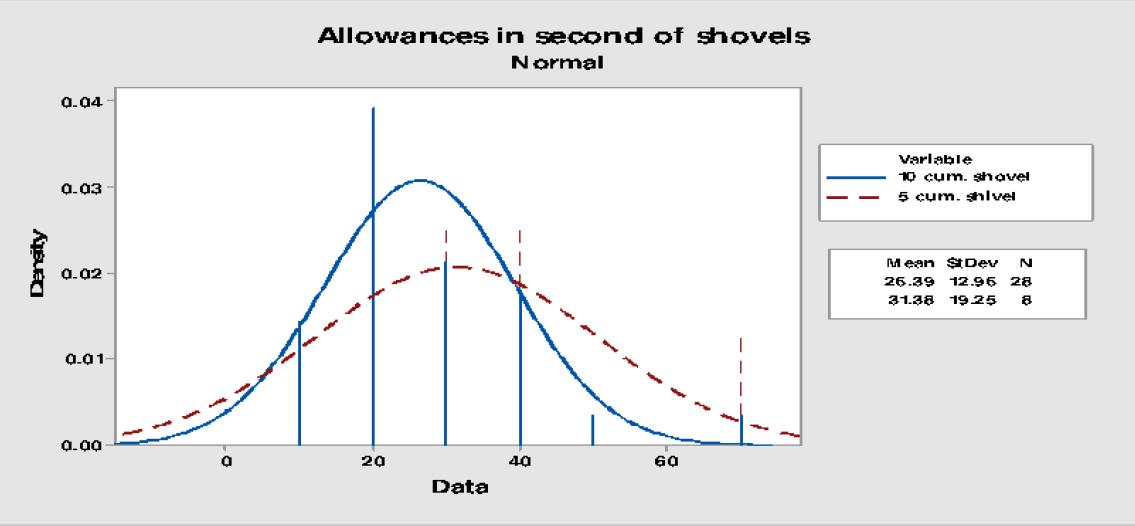
dumpers at the loading point of 10 m³ shovels is decreased by 56% (from 43 minutes or 2580 seconds to 1135.25 seconds), and similarly, for 5 m³ shovels, it is reduced by 42% (from 43 minutes or 2580 seconds to 1496.5 second) in a shift of 8 hours. Therefore the experiments show a significant improvement in loadinghauling or shovel–dumper fleet performance.
The studies demonstrated a strong relationship between blast fragmentation and average shovel cycle time. Fragmentation sizes of K50, K80, and K100 have a good correlation with shovel cycle
Application of MR and ANN in the prediction of the shovel cycle time, thereby improving the performance
the
the most useful tools to predict or
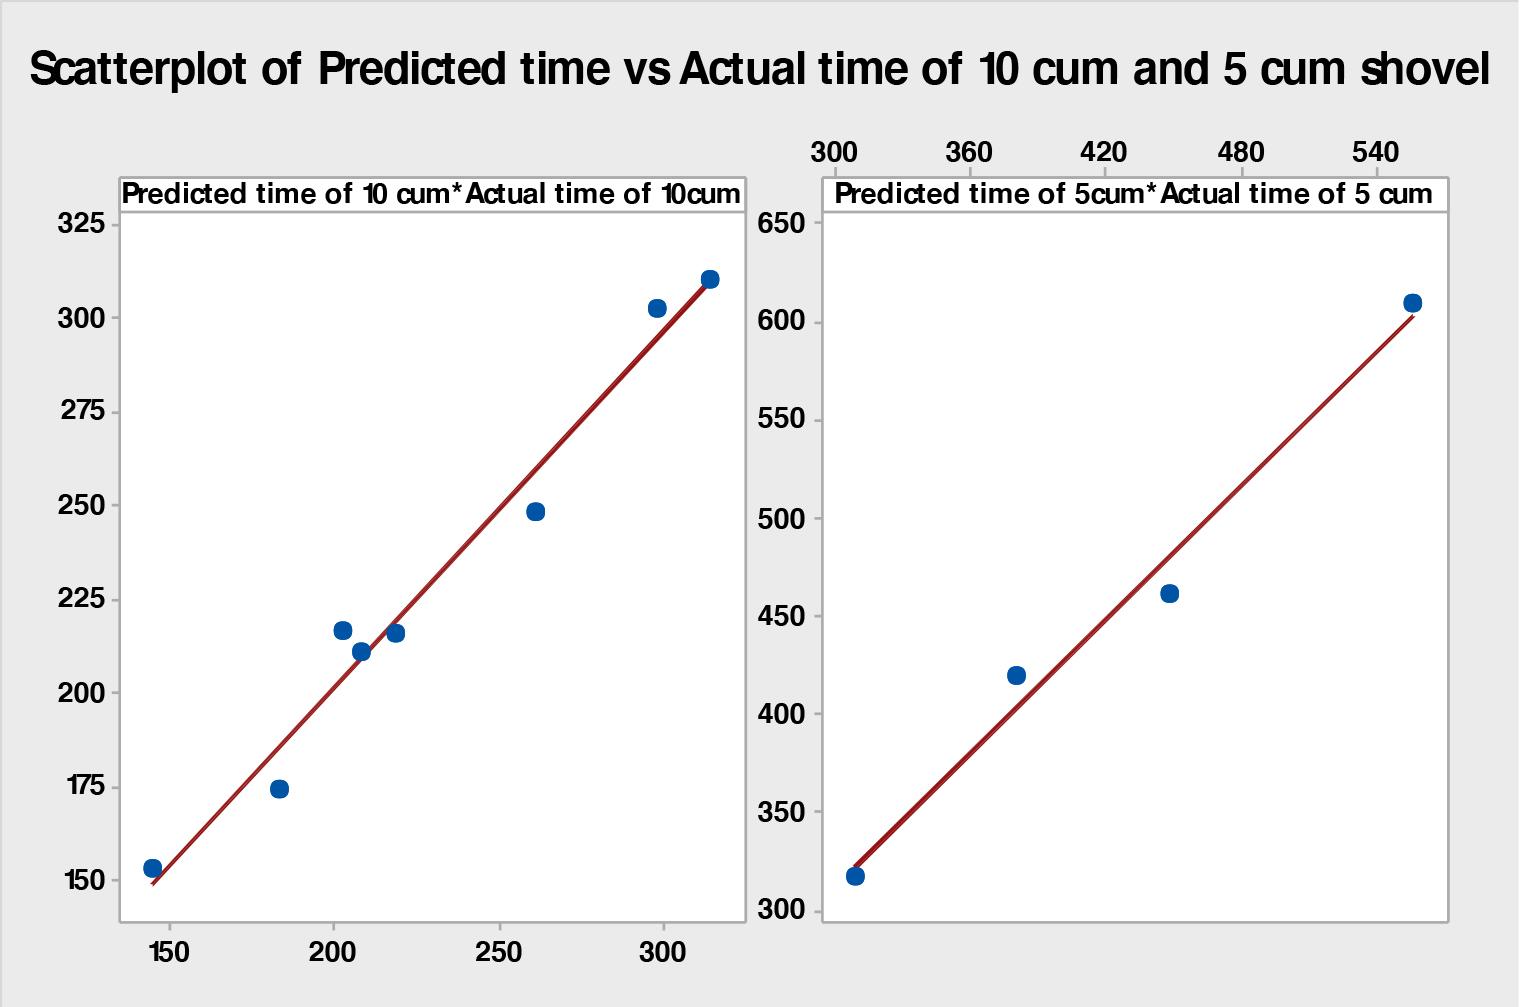
time, and either of these methods can
applied after conducting a time study of loading and hauling
study reveals that the estimation of shovel cycle time with a appropriate blast design improves the productivity of a
that of a 5 m3 shovel by 16%, whereas the operational delay of shovel-dumper operation is decreased by 56% in the case of the 10 m3 shovel and by 42% for the 5 m3 shovel.
by 19%
of MR and ANN in the prediction of the shovel cycle time, thereby improving the performance
Alarie, S. and Gamache, M.
of
used in truck
Kesimal, A . 1998. Shovel-truck productivity and efficiency studies for overburden removal in an open-pit mine. Transactions of the Institution of Mining and Metallurgy, Section A: Mining Industry, vol. 107. pp. 37–40.
system for open
International Journal of Surface Mining Reclamation and Environment, vol. 16, no. 1. pp. 59–76.
Allen, F., Hawkes, P., and Noy, M. Bucket fill factors
A laboratory and field study
implications for blasting. Proceedings of EXPLO ’99. The Australasian Institute of Mining and Metallurgy, Melbourne. pp. 43–46
Bozorgebrahimi, E., Hall, R.A ., and Blackwell, G.H. 2003. Sizing equipment for open pit mining – a review of critical parameters. Transactions of the Institution of Mining and Metallurgy Section A: Mining Technology. vol. 112, no. 3. pp. 171–179.
Burt, C.N. 2008. An optimization approach to material handling in surface mines. PhD thesis, Department of Mathematics & Statistics, Curtin University of Technology.
BP. 2019. Statistical Review of World Energy, 68th edn. London.
A., Karpuz, C., and Paşamehmetoğlu, A.G. Specific digging energy as a measure of diggability. Proceedings of the Mine Planning and Equipment Selection ’94. pp. 489–494.
Chaowasakoo, P., Seppälä, H., Koivo, H., and Zhou, Q. Digitalization of mine operations: Scenarios to benefit in real-time truck dispatching. International Journal of Mining Science and Technology, vol. 27. pp. 229–236
Cunningham, C.V.B. 2005. The Kuz-Ram fragmentation model – 20 years on. Brighton Conference Proceedings. Holmberg, R. et al. (ed.), European Federation of Explosives Engineers, pp. 201–210.
Doktan, M. 2001. Impact of blast fragmentation on truck shovel fleet performance. Proceedings of the 17th International Mining Congress and Exhibition of TurkeyIMCET 2001. Chamber of Mining Engineers of Turkey, Ankara. pp. 376–379.
Doktan, M. A preliminary study of the impact of blast fragmentation on load and haul productivity at Porgera. JKMRC, Brisbane.
Ercelbi, S.G. and Basceetin, A . 2009. Optimisation of shovel-truck system for opencast mining, Journal of The Southern African Institute of Mining and Metallurgy, vol. 109, no. 7. pp. 433–439.
Fourie, G.A. and Dohm, G.C., 1992. Open pit planning and design. Mining Engineering Handbook, 2nd edn. Society for Mining Metallurgy & Exploration, Englewood, Co. pp. 1274–1290.
Hanby, I.R. 1991. Enhancement of dump truck operating efficiency. Transaction of the Institution of Mining and Metallurgy Section A: Mining Technology, vol. 100. pp. 42–47.
Hartman, H.L. 2002. Introductory Mining Engineering, Wiley India.
Hawkes, P. 1998. Using simulation to assess the impact of improvements in drill and blast on down stream processes. Proceedings of Mine to Mill 1998 Australasian Institute of Mining and Metallurgy, Melbourne. pp. 209–217.
Kirmanli, C. and Ercelebi, S.G. 2009. An expert system for hydraulic excavator and dumper selection in surface mining. Journal of the Southern African Institute of Mining and Metallurgy, vol. 109. no. 12. pp. 727–738.
Krzyzanowska, J. 2007. The impact of mixed fleet hauling on mining operations at Venetia mine. Journal of the Southern African Institute of Mining and Metallurgy, vol. 107. pp. 215–224.
Marzouk, M. and Moselhi, O. 2002 Bid preparation for earthmoving operations. Canadian Journal of Civil Engineering. vol. 29. pp. 517–532.
Michaud, P.R., Lizotte, Y.C., and Scoble, M.J., 1997. Rock fragmentation and mining productivity: Characterisation and case studies. Proceedings of the 23rd Annual Conference on Explosives and Blasting Technique. International Society of Explosive Engineers, Austin, TX. pp 275–279.
Molotilov, S.G., Cheskidov V.I, and Norri, V.K. 2008. Mineral mining technology methodical principles for planning the mining and loading equipment capacity for opencast mining with the use of dumpers, Journal of Mining Science. vol. 44, no. 4. pp. 376–385.
Neilson K. 1987. Model studies of loading capacity as a function of fragmentation from blasting, Proceedings of the 3rd Mini-Symposium on Explosives and Blasting Research. pp.71–80.
Paterson, L.B. and Özdoğan, M. 2001. Performance of the bigger, faster and smarter new generation electric mining shovels. Proceedings of the 17th International Mining Congress and Exhibition of Turkey- 1MCET 2001. Chamber of Mining Engineers of Turkey, Ankara. pp. 237–242.
Pasch, O. and Uludag, S. 2018. Optimization of the load-and-haul operation at an opencast colliery. Journal of the Southern African Institute of Mining and Metallurgy. vol. 118, no. 5. pp. 449–456.
Ministry of Coal. 2019. Provisional coal Statistics 2018-19. Government of India, Coal Controller’s Organization.
Schabowicz, K. and Hoła,B., 2007. Mathematical-neural model for assessing productivity of earthmoving machinery. Journal of Civil Engineering and Management. vol. XIII, no. 1. pp. 47–54.
Singh, S.P. and Narendrula, R. 2006. Factors affecting the productivity of loaders in surface mines. International Journal of Mining, Reclamation and Environment vol. 20, no. 1. pp. 20–32.
Singh, S., Glogger, M., and Willock, D. 2001. Effect of fragmentation on loader efficiency. Proceedings of the 27th Annual Conference on Explosives and Blasting Technique. International Society of Explosives Engineers, Warrensville Heights, OH. pp 77–87. u
of
and ANN in the prediction of the shovel cycle time, thereby improving the performance
Affiliation: 1Department of Chemical Engineering, University of Pretoria, South Africa.
Correspondence to: L.A. Jordan
Email: luke.jordan.up@gmail.com
Dates:
Received: 22 Jun. 2021
Revised: 30 Jun. 2022
Accepted: 28 Jul. 2022
Published: October 2022
How to cite: Jordan, L.A, and van Vuuren, D. 2022 Heat-constrained modelling of calcium sulphate reduction. Journal of the Southern African Institute of Mining and Metallurgy, vol. 122, no. 10, pp. 607 616
DOI ID: http://dx.doi.org/10.17159/24119717/1530/2022
ORCID: L.A. Jordan https://orcid.org/0000-00019116-7073
A two-dimensional finite difference model has been developed to describe the reduction of kilogram quantities of dehydrated phosphogypsum. The model’s scope has been limited to focus on the heat transfer and reactions that occur within a mass of material contained in a vessel inside a furnace rather than also including the effects of heat transfer to the vessel. Changes in the heat transfer properties (k, ρ, and C p) are incorporated as the composition of the mass changes as the chemical reactions progress.
The model is validated against experimental data, with samples heated to 1000°C at 3°C min−1 while purging with nitrogen gas. A sensitivity analysis of model predictions to the pre-exponential factor of the reaction rate constant of the main chemical reaction and the thermal conductivity of the powder bed indicated that, at the envisaged process conditions, the behaviour of the system depends much more on the rate of heat transfer than on the rate of the chemical reaction. The model demonstrated a significant increase in accuracy when the thermal conductivity was modelled to increase linearly with temperature compared to assuming a constant value.
carbothermal reduction; phosphogypsum; modelling; waste treatment.
Millions of tons of phosphogypsum- and gypsum-rich solid wastes and sludge are generated by the chemical manufacturing industry and the industrial waste remediation sector. Phosphogypsum is a by-product of the production of phosphoric acid whereas gypsum is a by-product of many other processes, including the production of hydrofluoric, citric, and boric acids, treatment of waste from desulphurization of flue gases from coal-fired power stations, ore smelting, and acid mine water treatment. Although gypsum is widely used in the construction industry, phosphogypsum is generally regarded as unsuitable for further use, and is stored indefinitely in large stockpiles. These stacks constitute substantial expenses for the industry, occupying significant areas of land and being subject to increasingly stringent regulations on waste materials and their disposal. Costs associated with the transportation and storage of phosphogypsum in dumps can be as high as about 18% of the cost of phosphoric acid production, and significantly more with the transition to more reliable hydrotransport of the phosphogypsum.
An alternative approach to the often-expensive management of stockpiles is to treat the waste with the aim of converting it into potentially useful products (de Beer et al., 2015; Tao et al., 2001).
Gypsum waste can represent a good resource for the recovery of elemental sulphur (S) and calcium carbonate (CaCO₃), while in addition to this phosphogypsum can also contain rare earth elements (REEs) that could constitute a potential secondary source of these elements (Kulczycka et al., 2016; Walawalkar, Nichol, and Azimi, 2016).
Sulphur is a key raw material for many manufacturing industries including the production of acids, explosives, fertilizers, insecticides, steel, and titanium dioxide (Cork, Jerger, and Maka, 1986). Cork, Jerger, and Maka (1986) also suggest sulphur’s application as an alternative feedstock to produce polymeric materials. Calcium carbonate is used in a wide variety of commercial applications in two main forms, ground calcium carbonate (GCC) and precipitated calcium carbonate (PCC). GCC features in the manufacture of concrete or Portland cement, lime for use in soil stabilization and acid neutralization, water treatment, and flue gas desulphurization (Oates, 1986). PCC sees extensive use as a filler and tre coating pigment in paper, plastics, paints, rubbers, and adhesives (Windholz, 1983; Zhang et al., 2010a).
REEs have many uses due to their physical and chemical characteristics, which include magnetism, luminescence, conductivity, electro-optical, and nuclear properties (Akah, 2017). Rare earths have contributed to the improvement of the operating efficiency, longevity, miniaturization of components,
and to the complexity and footprint of many industrial, military and aerospace instruments. REE use is further growing as the development of new applications and expansion of current rare earth consumer industries continues (Dutta et al., 2016).
The recovery of sulphur, calcium carbonate, and REEs from gypsum entails inter alia carbothermal reduction of the gypsum to form a sulphide salt that can then be converted into forms that are saleable (van Vuuren and Maree, 2018). It has been suggested that a continuously operated tunnel kiln might be the best type of reactor to use for the carbothermal reduction step, but sufficient information is currently not available to design and construct such a kiln with confidence.
Nengovhela et al. (2007) proposed a multi step - process for the recovery of sulphur and CaCO₃ from gypsum waste. It involves the three following steps:
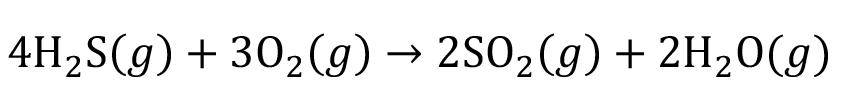
➤ Thermal reduction (850–1100°C) of CaSO₄ to produce calcium sulphide (CaS) using a reducing agent (e.g. solid carbonaceous materials such as coal or activated carbon (Equation [1]), or a reducing gas such as carbon monoxide or hydrogen)
[1]
➤ Direct aqueous carbonation of CaS to produce hydrogen sulphide (H₂S) and CaCO₃ [2]
➤ Sulphur is produced from H₂S via the commercially available Clauss process (Mark et al., 1978): [3] [4]
Although each of these steps has been subjected to a number of studies to develop understanding (de Beer et al., 2014; Brooks and Lynn, 1997; Kato, Murakami, and Sugawara 2012; Ma et al., 2011; Miao et al., 2012; Ning et al., 2011; Ruto et al., 2011; Selim, Gupta, and Al Shoaibi, 2013; Zhang et al., 2010b) and propose alternatives (de Beer et al., 2015; Sliger, 1988), process step 1 is the step of interest. The reduction of the sulphate is straightforward, but not without complications. A secondary reaction, given by [5]
can also occur (initiating at 900°C); however, as this is an oxidative reaction, sufficient excess carbonaceous material serves to mitigate the reaction’s impact (Mbhele et al., 2009; Strydom, Groenewald, and Potgieter, 1997a).
Typically, the reduction to CaS is carried out in a rotary kiln, using charcoal and gypsum as the sources of carbon and sulphate, respectively (Li and Zhuang, 1999).
Several authors have reported that the thermal reduction process occurs via a gaseous intermediate, and can mostly likely be described by (Gorkan et al., 2000; Oh and Wheelock, 1990):
To this end, it has also been found that the presence of O₂ and CO₂ is undesirable as they favour the formation of calcium oxide and calcium sulphate. Thus, as reported by Jagtap, Pande,
[6]
and Gokarn (1990), to effectively favour the formation of CaS from CaSO4 an excess of carbon monoxide (if using a gaseous reducing agent) should be present in the kiln; alternatively, if a solid reducing agent is used, an environment that favours excess amounts of CO in the kiln is desirable (Motaung et al., 2015).
As reported by Yan et al. (2014) and corroborated by Mbhele et al. (2009) and Motaung et al. (2015), temperature plays an important role in the conversion of the sulphate, with increasing temperature yielding an increased reaction ratewith.
Mbhele et al. (2009), who focused on the recovery of sulphur from waste gypsum using activated carbon, investigated several process conditions to determine their impact on the yield of CaS and subsequently sulphur. Naturally, a longer reaction time yielded greater conversions, with sufficient residence time being 20 minutes for a sample of approximately 180 g. It was also found that CaO production (as per Equation [5]) was favoured at low carbon to gypsum ratios, and CaS becomes favoured at carbon to gypsum ratios greater than 2, with higher yields as the carbon content increases. Furthermore, it was found that as the average particle size of the mixture decreases, improved conversions can be achieved. Lastly, Mbhele et al. (2009) estimated that from 1 t of pure gypsum, 0.18 t of sulphur and 0.58 t of CaCO₃ could be recovered.
Although numerous authors have looked at catalytic effects, making use of catalysts such as ferric oxide (Strydom, Groenewald, and Potgieter, 1997b), potassium dichromate (Kale, Pande, and Gokam, 1992), semi-coke additives (Trikkel and Kuusik, 1994), stannous sulphate and vanadium pentoxide (Zadick, Zavaleta, and McCandless, 1972) to achieve increased yields and lower initiation temperatures, this is not applicable to the current study but is worth noting. Furthermore, as the typical choice of kiln to perform the reduction in is a rotary kiln, several authors have also reported the effects of pelletization and binder choice (Finney, Sharifi, and Swithenbank, 2009; Motaung et al., 2015; Nengovhela et al., 2007).
The scope of the model has been limited to focus on the heat transfer within the reacting material contained in the furnace, rather than describing the entire furnace and all the conductive, convective, and radiant heat transfer processes involved. Additionally, the feed of interest has also been limited to a mixture of dehydrated phosphogypsum and coal. The Python language was used in the simulation of the system to solve the relevant finitedifference equations and discretized kinetics.
Heat transfer is modelled using a two-dimensional finite difference approach – in the radial direction of a symmetric slice of the crucible. Çengel and Ghajar (2015) and Welty, Wicks, and Wilson (1969) describe the formulation of the transient model, beginning with the energy balance on a volume element as
where the rate of heat transfer, Q (W), consists of conduction terms for the neighbouring nodes, and ∆E and ė represent the energy content (J) and heat generated from reaction (J) terms for an element, respectively. Noting that ∆Eelement=ρC p ∆T, the
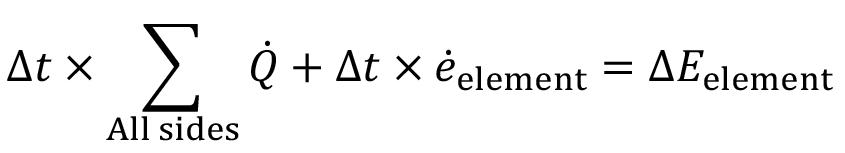
derivation with respect to the r and z directions and time is
which can be achieved by applying the limit as r approaches zero of Equation [9] as
[8]
which, after dividing throughout with k and simplification (noting that α = k/ρC p)
[9]
Using the finite-difference method to approximate the partial derivatives, and noting that the volume element centred around a general interior node (m,n) involves conduction from four sides (right, left, top, and bottom), this then yields
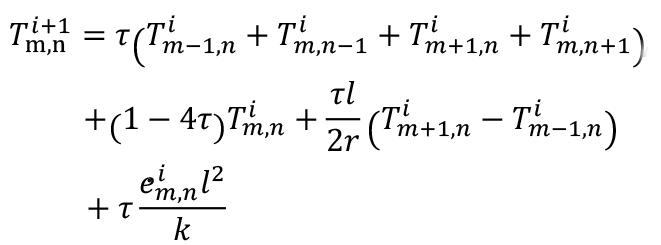
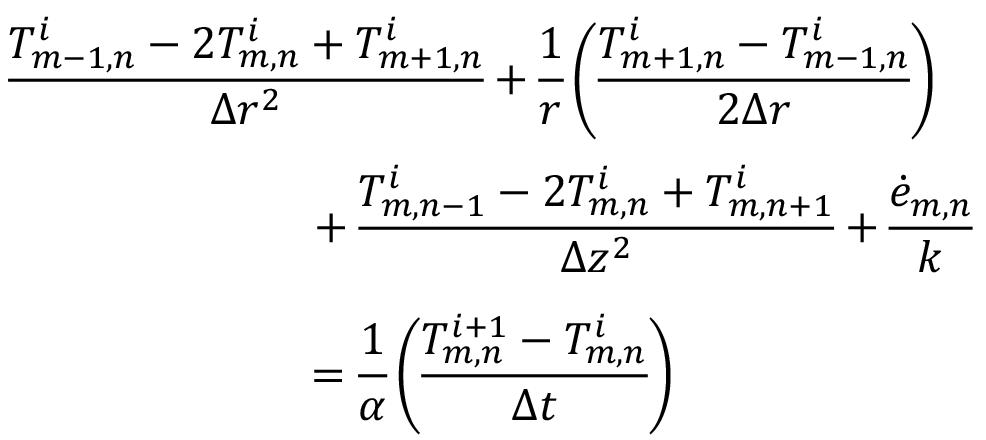
[10]
[14]
The only term affected by the limit, , requires application of L’Hopitals rule. Thus, the equation for the side boundary condition (following the same transformations as above) is
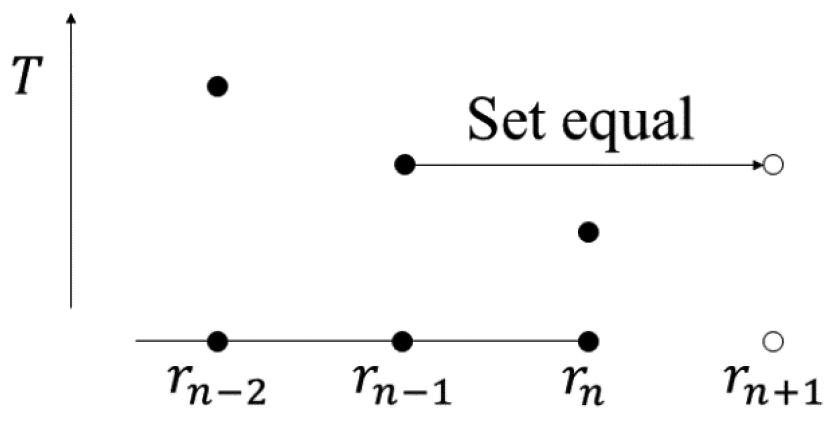
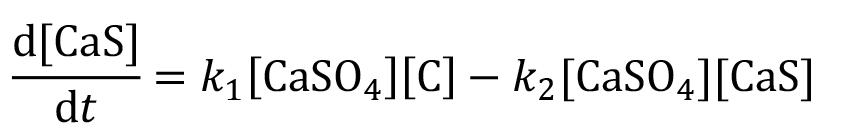
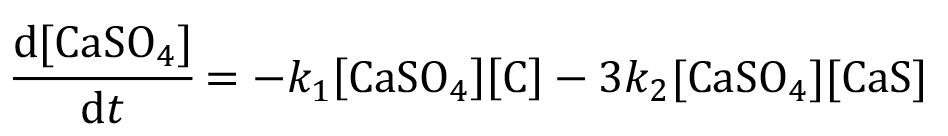
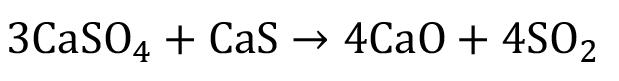
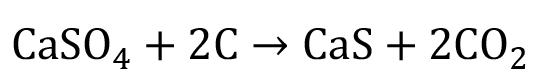
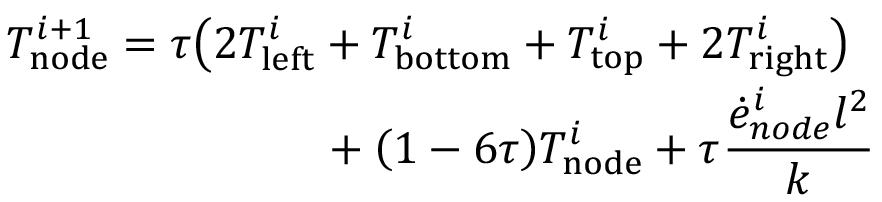
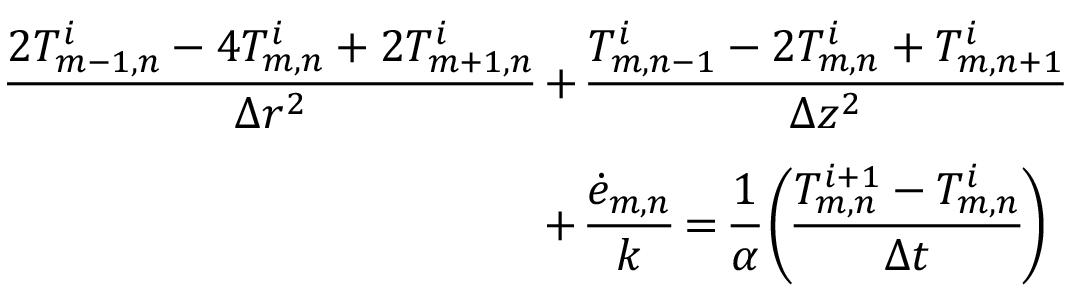
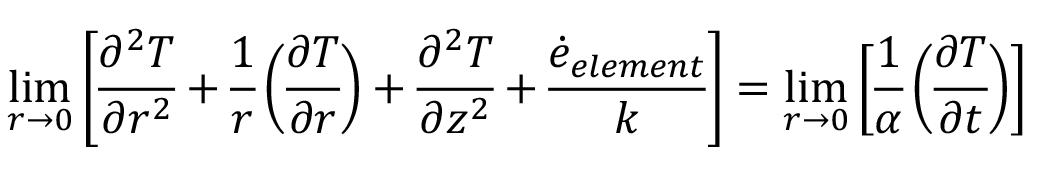
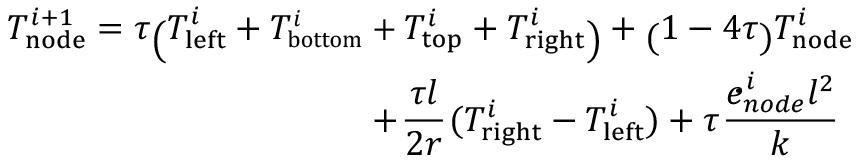
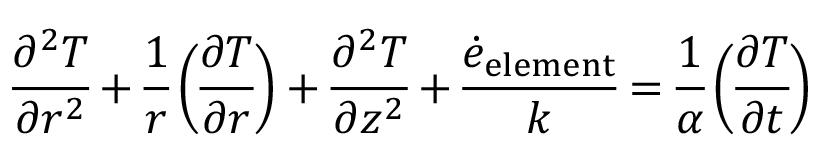
Taking a square mesh (∆r = ∆z = l) and multiplying throughout by α∆t
[11]
And utilizing the mesh Fourier number, τ = α∆t/l², for the final transformation then gives
[12]
Rewritten in a simpler-to-read form, the explicit formulation for the side boundary node is given by
Which, rewriting in a simpler-to-read form, yields the explicit formulation for an internal node:
[13]
To satisfy the insulated and zero-temperature-gradient boundary conditions, the boundary nodes are treated as internal nodes with an additional fictional node set equal to the node preceding the boundary, as demonstrated in Figure 1.
However, as r approaches zero, an accommodation is required,
The reaction and conversion of species present is described by the kinetic model proposed by Kato, Murakami, and Sugawara (2012). It is suggested that the reaction proceeds as follows:
[18] [19]
and, assuming that each rate can be expressed as a first-order reaction with respect to CaSO₄, CaS, and/or C concentrations in the solid phase, the mass balances for the components are given by
[21] [22] [23]
The rate constants, k₁ and k₂, can be expressed using the Arhennius equation [24]
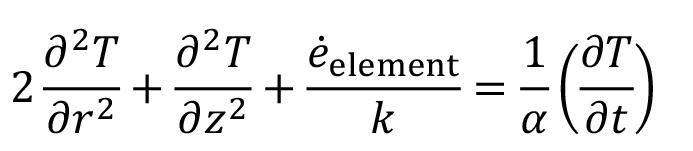

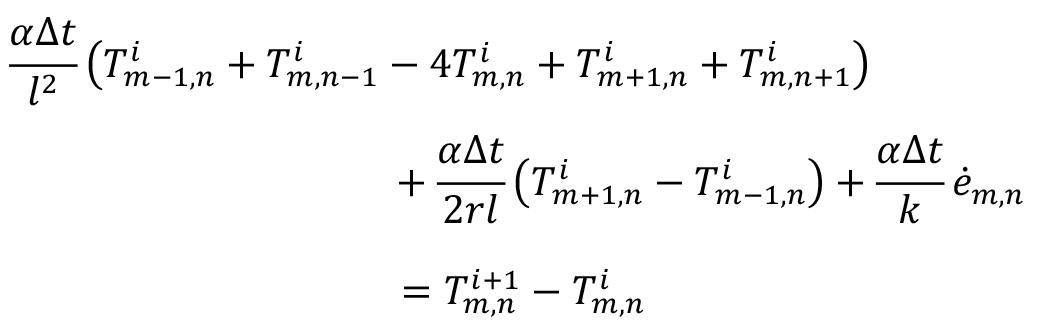
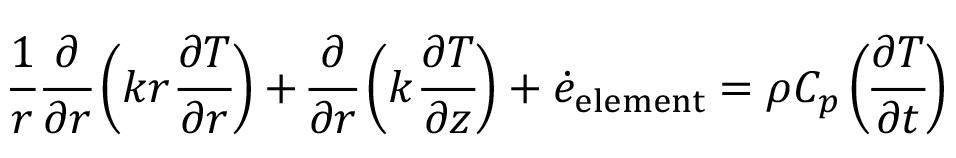
where the kinetic parameters (pre-exponential factor and activation energy) reported by Kato, Murakami, and Sugawara (2012) for a heating rate of 10°C min−1 are k1(0) =3.2 × 10¹⁵ mol-1 s-1, E₁ = 370 kJ mol-1, k2(0) = 1.6×10¹⁵ mol-1 s-1, and E2=400 kJ mol-1 respectively.
Several assumptions have been made for the modelling process for the first instance of the model, and are as follows:
➤ The reaction species form a perfect, uniformly distributed mixture.
➤ Heat generation (ė i node) is given as a constant heat of reaction at 1000°C of 153.43 kJ/mol (Roine, 2018) (as the heat of reaction at 800°C is only 4.8% larger)
➤ Exterior boundary (top and side) temperatures are ramped from ambient according to the given heating rate, each iteration
➤ Concentrations of reaction species are determined using the discretized kinetics, for each node individually
➤ The thermal conductivity (k) of the mixture is calculated using a volume-fraction based average of the initial amounts of dehydrated phosphogypsum and coal charged and kept constant thereafter
➤ The heat capacity (C p) of the mixture is calculated using a mass-fraction based average of the components present for a node at any given time
➤ The reacting mass does not contract
➤ The bulk density (ρB) of the mixture has been measured experimentally as 836 kg m−3 and is varied according to the mass loss as the reduction proceeds
➤ Heat transfer properties (C p, ρB, α, and τ) are calculated for each node, every iteration, at the temperature of the node
➤ The model does not include gangue material (ash and volatiles in coal and impurities in gypsum)
➤ The bottom of the crucible is perfectly insulated. As indicated by assumption 5, the thermal conductivity is a constant over the simulation, calculated using the thermal conductivity of calcium sulphate, 0.43 W m-1 K-1 (though this has been stated to range between 0.43–0.51 W m-1 K-1) (Bejan, 2013; Green and Perry, 2008; Tesárek et al., 2007) and coal, 0.26 W m-1 K-1 (Bejan, 2013; Green and Perry, 2008), and the initial volume fractions of dehydrated phosphogypsum, 0.74, and coal, 0.26.
Using Equation [25], this gives a kmix of 0.377 W m-1 K-1
Modelling is performed by initiating the system at ambient temperature and then ramping up the temperature of the exterior nodes in the finite difference mesh as per assumption 3. This simulates the external heating of the material. The finite difference equations are then used to simulate the transfer of heat into the medium, while each node also simulates the reactions occurring using the discretized kinetics to describe the changes in composition at the node, as per assumption 4. This, in turn, as per assumptions 6 and 9 above, is incorporated as a change in the heat transfer properties (C p, and ρB, which affect α, and τ) used in the finite difference equations. This procedure is then iterated, continuing the ramping of the exterior nodes until equilibrium is achieved.
The heat capacity is calculated using a simple mass-fraction based (or volume-based in the case for k) average, given by
where M is the property in question, and xi is the mass or volume fraction. The bulk density is varied with the mass loss caused by the reaction, assuming the volume of the reacting mass stays constant.
The model can be improved by abandoning assumption 5 and linearly varying the thermal conductivity with temperature in line with the work presented by Godbee and Ziegler (1996), Laubitz (1959), and Luikov et al. (1968). This is expanded in the Model Sensitivity Analysis section below.
Table I
Dehydrated phosphogypsum – major component composition (Oberholzer and Nel, 2020)
Component Mass %
SiO₂ 1.61
CaO 37
H₃PO₄ 1.7605
SO₃ 54.0558
Moisture 0.83
Loss on ignition 6.39
Table II
Coal proximate analysis (Oberholzer and Nel, 2020)
Component Mass %
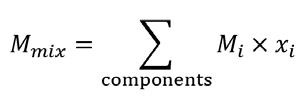
H₂O 2.70
Ash 16.10
Volatile matter 24.8
Fixed carbon 56.4
Total sulphur 0.453
Phosphogypsum, sourced from Foskor, which was dehydrated for 6 hours at 300°C, with an analysis as given in Table I and a heat capacity of 1380 J kg-1 K-1 (Engineering ToolBox, 2003), was used along with coal, with a proximate analysis as given in Table II and a heat capacity of 1090 J kg-1 K-1 (Engineering ToolBox, 2003).
Two in-house-made stainless steel crucibles were used in a medium sized muffle furnace to perform the experiments. Both three- and six-inch diameter vessels were made using 310 stainless steel, with holes drilled through the lids to allow thermocouples to be placed in various locations to capture the temperature profile of the reacting mixture. Figure 2 depicts the thermocouple layout.
Product samples were analysed using a PANalytical X’Pert Pro powder diffractometer in σ σ configuration with an X’Celerator detector and variable divergence- and fixed receiving slits with Fe-filtered Co-Kα radiation (λ = 1.789Å). The mineralogy was determined by selecting the best–fitting pattern from the ICSD database to the measured diffraction pattern, using X’Pert Highscore Plus software. The relative phase amounts (weight %) were estimated using the Rietveld method (X’Pert Highscore Plus). The samples were prepared according to the standardized PANalytical back-loading system, which provides nearly random distribution of the particles.
The experiments were designed around obtaining the temperature profile of the reacting mixture to adequately validate the developed model. Four experiments were performed, maintaining the heating rate (3°C min−1), maximum temperature (1000°C), nitrogen purge gas flow rate (1 L min−1), and reactant composition
Table III
Experiment Crucible diameter Mass loaded (g)
1 3 inch 350
2 3 inch 400
3 3 inch 500 4 6 inch 2000
(mass ratio of 0.35-coal:1-CaSO₄ to obtain a molar ratio of 2.5-C:1CaSO₄) uniformly throughout. Variances in the mass loading for the respective crucibles are detailed in Table III.
Several type-K thermocouples were placed to capture temperature profiles at various heights and radial positions as described in Table IV and graphically shown in Figure 2.
XRD analysis suggests a very high extent of conversion with no
Table IV
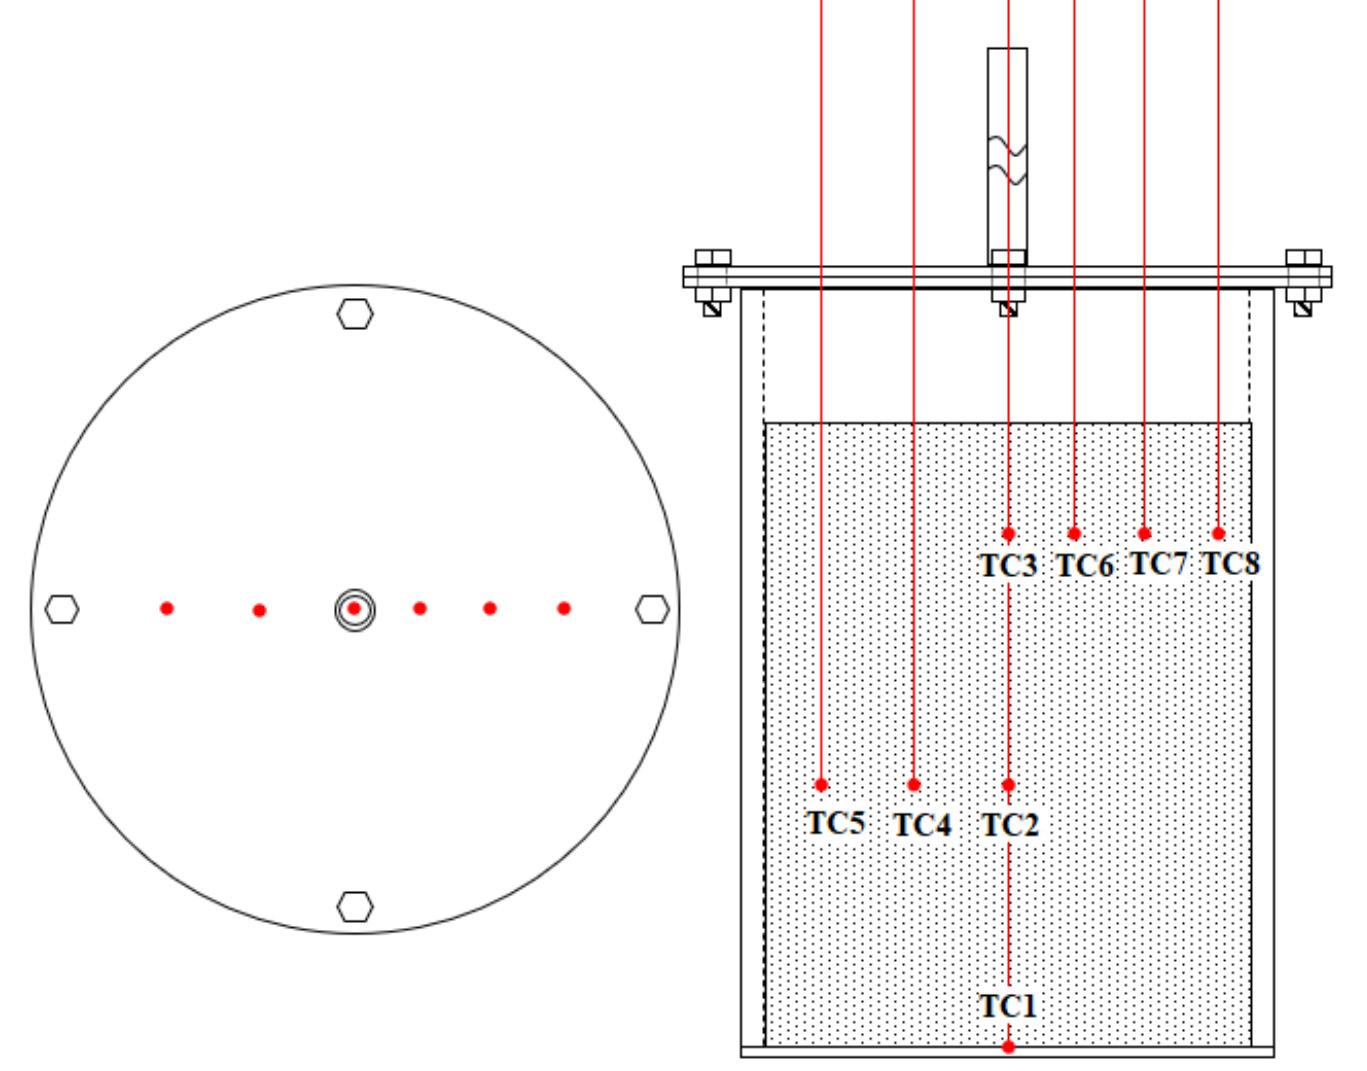
Thermocouple 3-inch crucible 6-inch crucible DFC¹ (mm) DFB² (mm) DFC¹ (mm) DFB² (mm)
TC1 0 0 0 0
TC2 0 70 0 70
TC3 0 120 0 120
TC4 19.4 70 33.6 70
TC5 34 70 62 70
TC6 16 120 26 120
TC7 26.6 120 47.2 120 TC8 37.8 120 68.4 120
1 Distance from centre
2 Distance from bottom
Table V
Relative phase amounts determined from XRD analysis
Experiment no. Oldhamite (CaS) (%)
Quartz (SiO₂) (%)
Apatite (CaF) (%)
Lime (CaO) (%)
1 92.76 2.3 4.8 0.13
2 93.46 2.13 4.41
4 90.38 1.98 7.64
CaSO₄ present in the product samples, and a CaS content varying from 90–93 wt% (Table V). Trace amounts of CaO were also detected. These findings indicate that the reaction occurred as expected, with the primary reduction to CaS dominating the side reaction producing CaO.
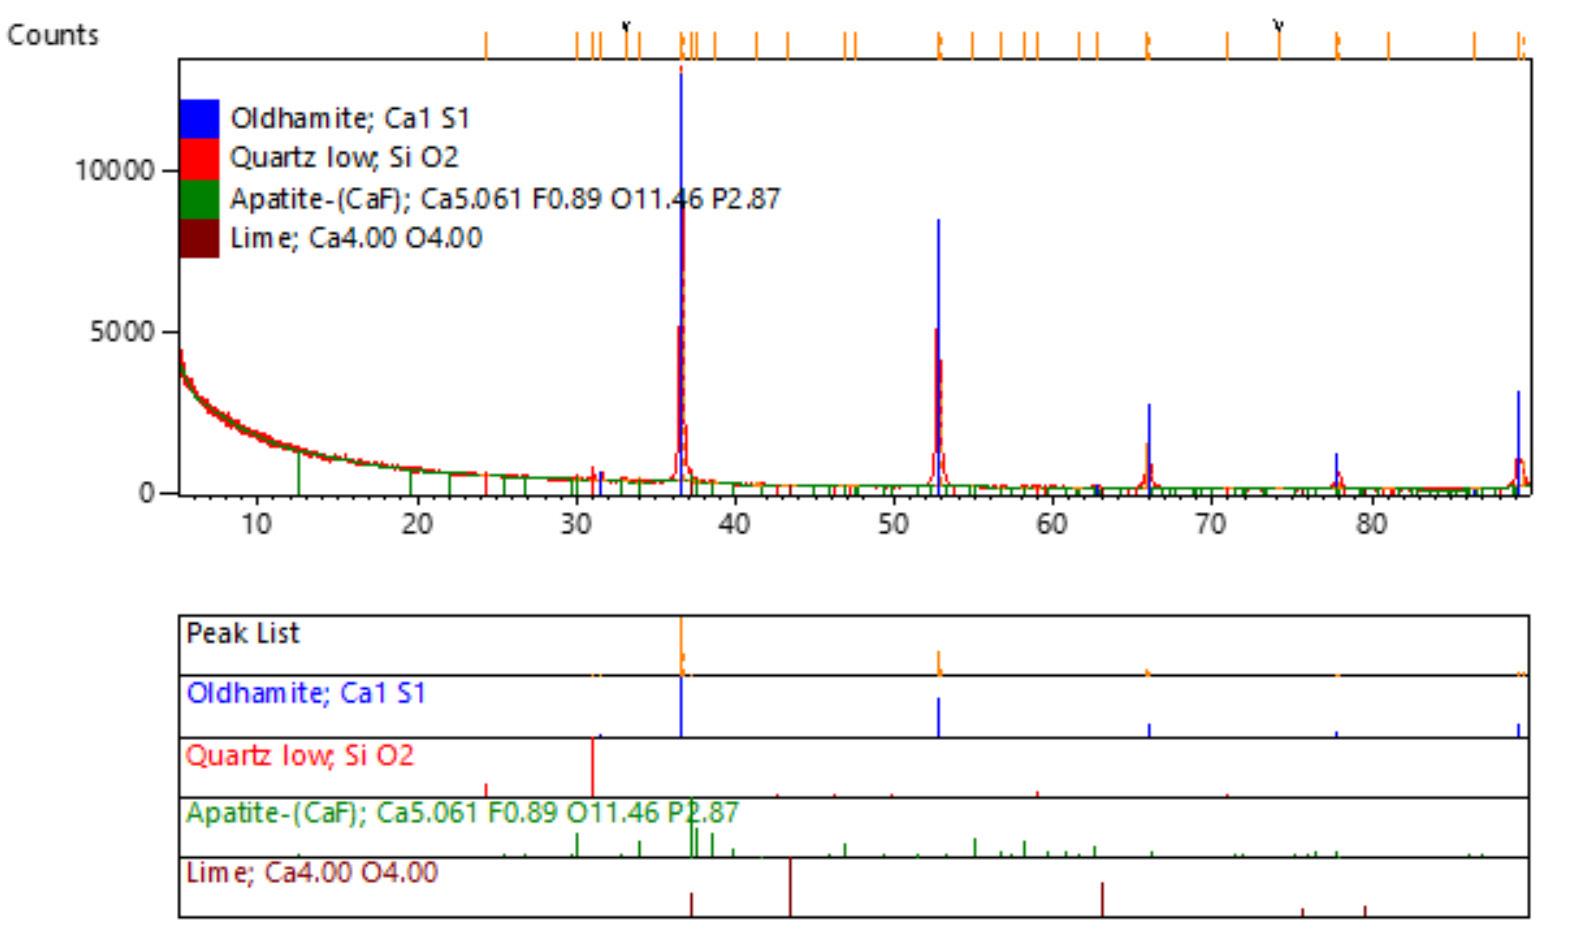
It should be noted that excess carbon is present in the samples; however, the peaks overlap with that of quartz, which is present as an impurity in both the phosphogypsum and coal (Figure 3).
The model was validated by comparing the temperature profiles
of the embedded thermocouples with the equivalent predicted profiles.
The mass load in the three-inch crucible was varied to investigate whether a noticeable difference in the centre-bottom temperature profile could be seen by varying the area available for heat transfer within a constrained environment. The mass load in the six-inch crucible was kept constant and served to investigate the effect of scaling on the heat transfer. When looking at the model results presented in Table VI, although the model lags the experimental results, a general trend is present, where the additional mass causes an increase in the time required to reach 1000°C.
Considering Figure 4, as can be seen by the behaviour of TC1, TC2, TC4, and TC5 in the 350, 450, and 500 g experiments, the increase in height results in slightly delayed profiles as those nodes become more deeply embedded in the material. The packed bed in the 2000 g experiment is of similar height to the 500 g case, but with a much larger crucible diameter, subsequently the temperature profiles of the more embedded nodes are much more delayed. The intermediate plateaus of the more embedded nodes are likely due to the endothermic contribution of the heat of reaction of the more exterior nodes causing a delay or lead-time in the transfer of heat, as well as the endothermic effects within
the node itself counteracting the heat transfer as the reaction proceeds.
Furthermore, Figure 4 shows that the model overestimates the time to final temperature, especially towards the centre bottom. As can be seen over the course of increasing mass, the model’s degree of inaccuracy increases with increasing mass of material and vessel diameter. This suggests several possibilities: that the estimated thermal conductivity is too low, as the experimental nodes all experience faster heating than the model predicts; or that the kinetic parameters presented by Kato, Murakami, and Sugawara (2012) are not an accurate representation for the coal and gypsum used in these experiments and are under-predicting the rate of reaction.
By varying the pre-exponential factor of the reaction rate constant of the CaSO₄ reduction reaction (k1(0) in Equation [20]) or the thermal conductivity of the system, the accuracy for the model can be evaluated and improved. As can be seen by Figure 5 (which compares the 500 g experimental case), increasing the rate of reaction does not have a pronounced effect on the model’s overall accuracy, although it does decrease the time taken for a node to reach the final temperature.
The work by Godbee and Ziegler (1996), Laubitz (1959), and Luikov et al. (1968) on the thermal conductivity of powder beds and porous systems shows that values for k can vary between 0.2 W m-1 K at 25°C and 1 W m-1 K at 1000°C for a variety of different powders. This finding is used as a basis for the variation of the k values in the model. As can be seen in Figure 6, an increase in thermal conductivity results in a significantly closer representation of the experimental data when compared to the base case (k = 0.377) and the increased rate of reaction cases (Figure 5). This suggests that the thermal conductivity plays a more substantial role in determining the heating of the vessel than the rate of the reaction does.
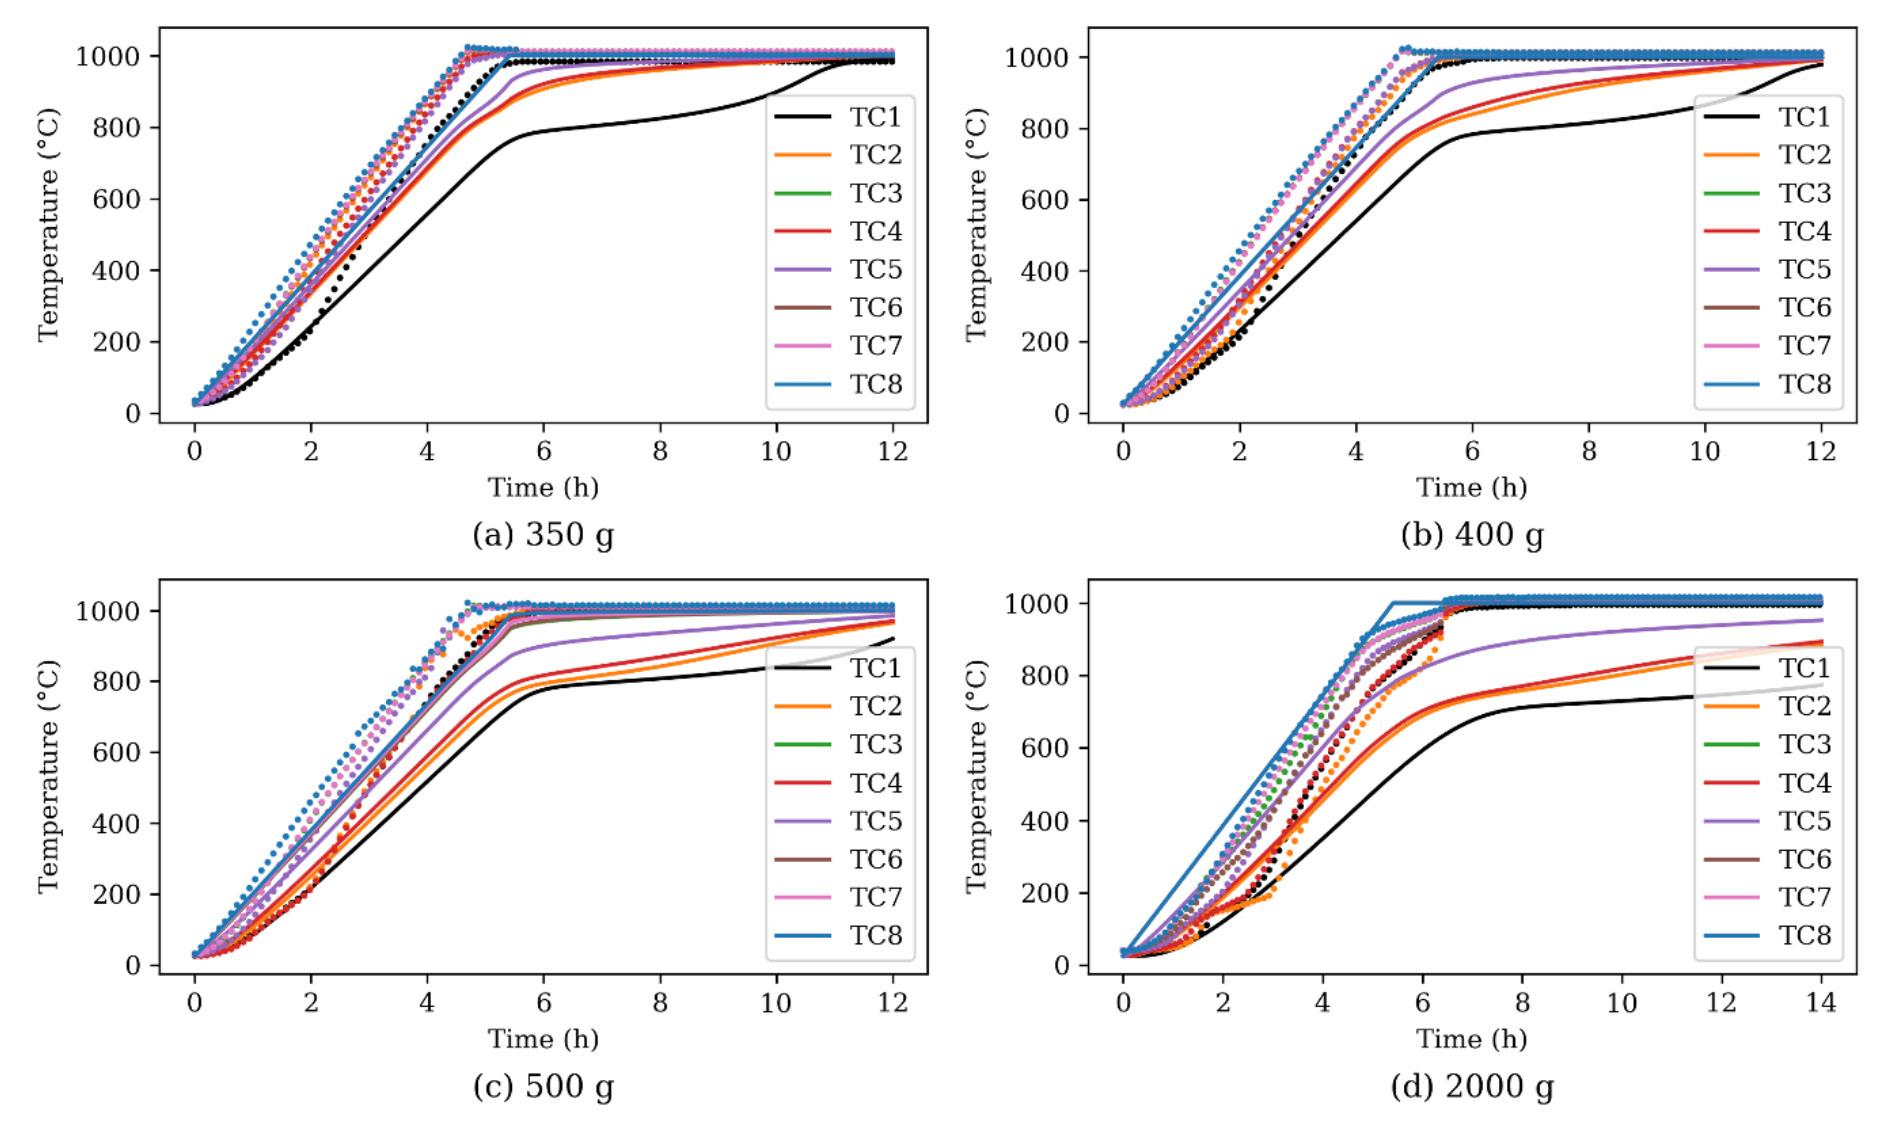
It should be noted, however, that a constant value for k is not necessarily an accurate representation, hence Figure 7 depicts the effects of varying the thermal conductivity of the system linearly with temperature as per Equation [26] (although Laubitz (1959) shows that powders can vary logarithmically or exponentially depending on the powder composition). Equation [26] is derived on the basis that k can be assumed to be equal to 0.377 W m-1 K-1 at 25°C and 1 W m-1 K-1 at 1000°C.
k(T) = 6.39×10⁻⁴T + 0.1865
still some inaccuracy. It is possible that there exists a convective
transfer within the vessel, but more work is required to investigate this. Furthermore, it would be beneficial
investigate whether the heat transfer limitations have a greater effect
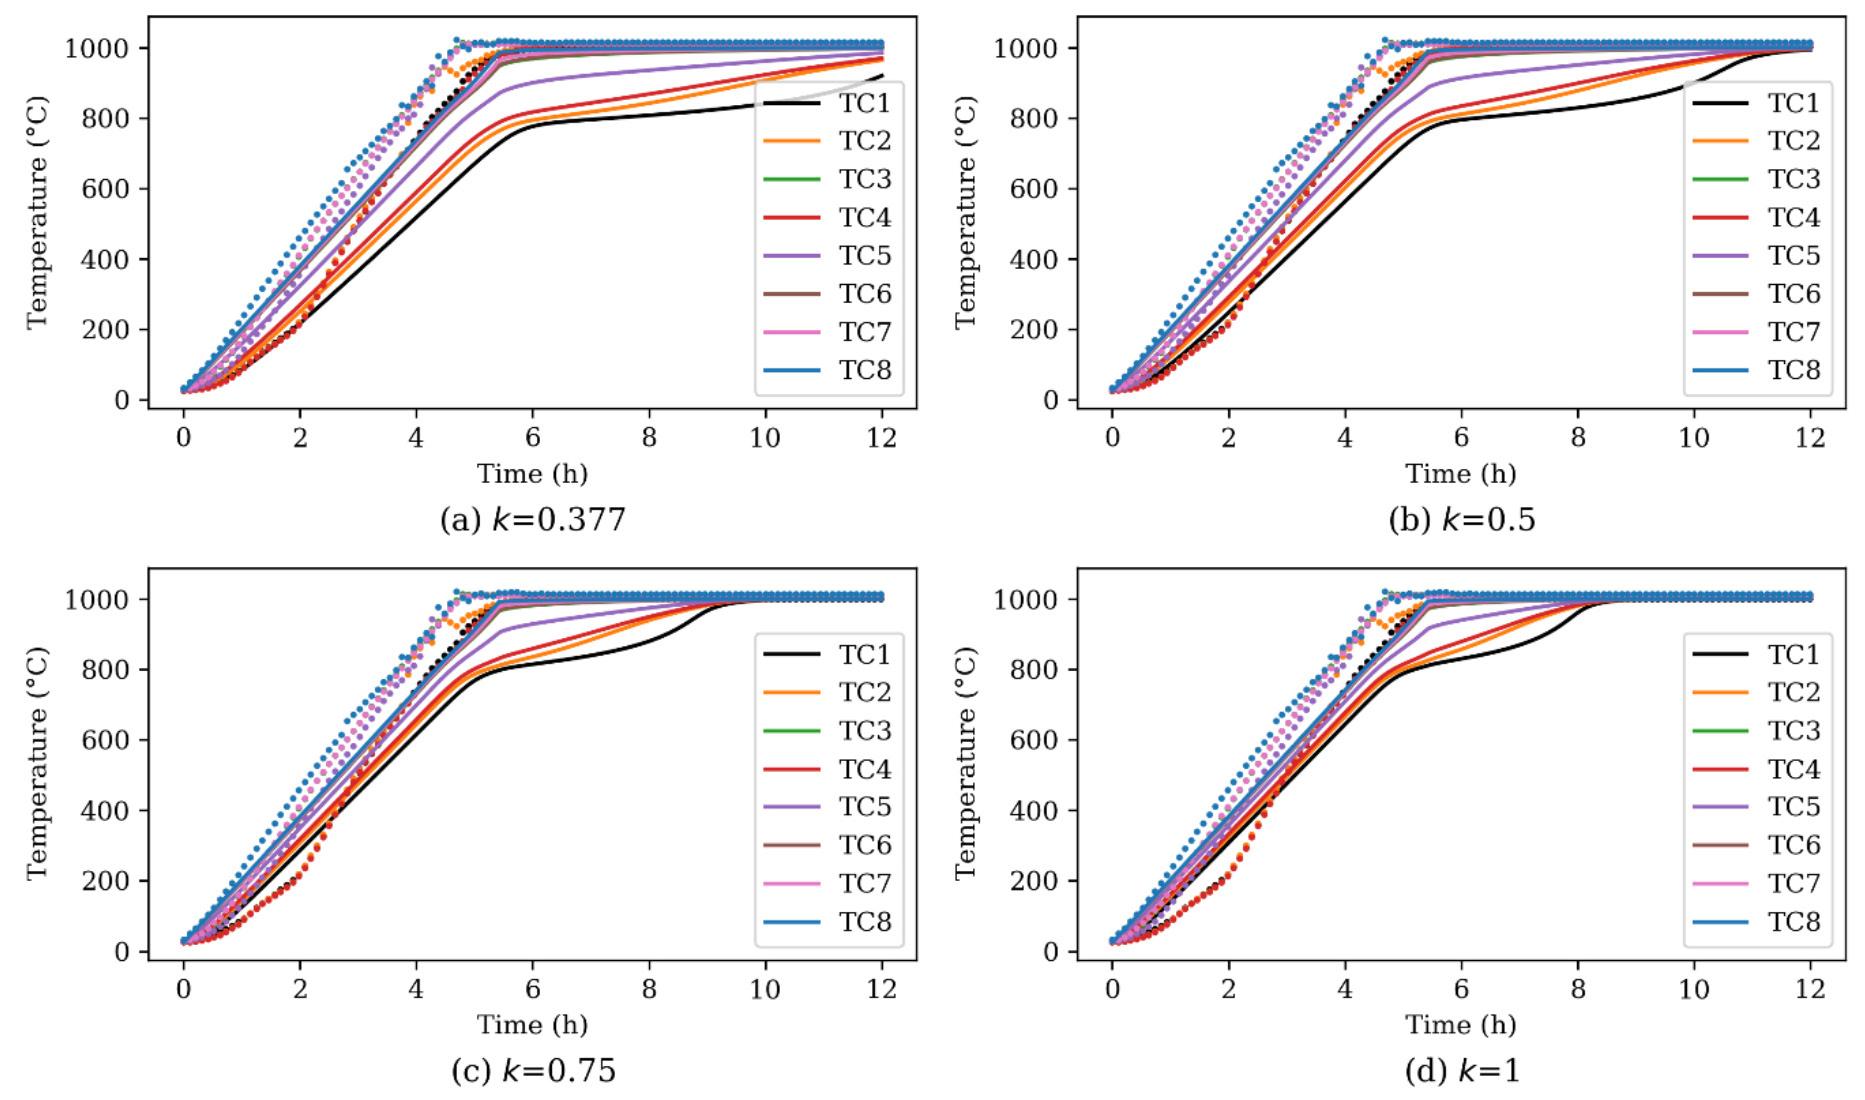
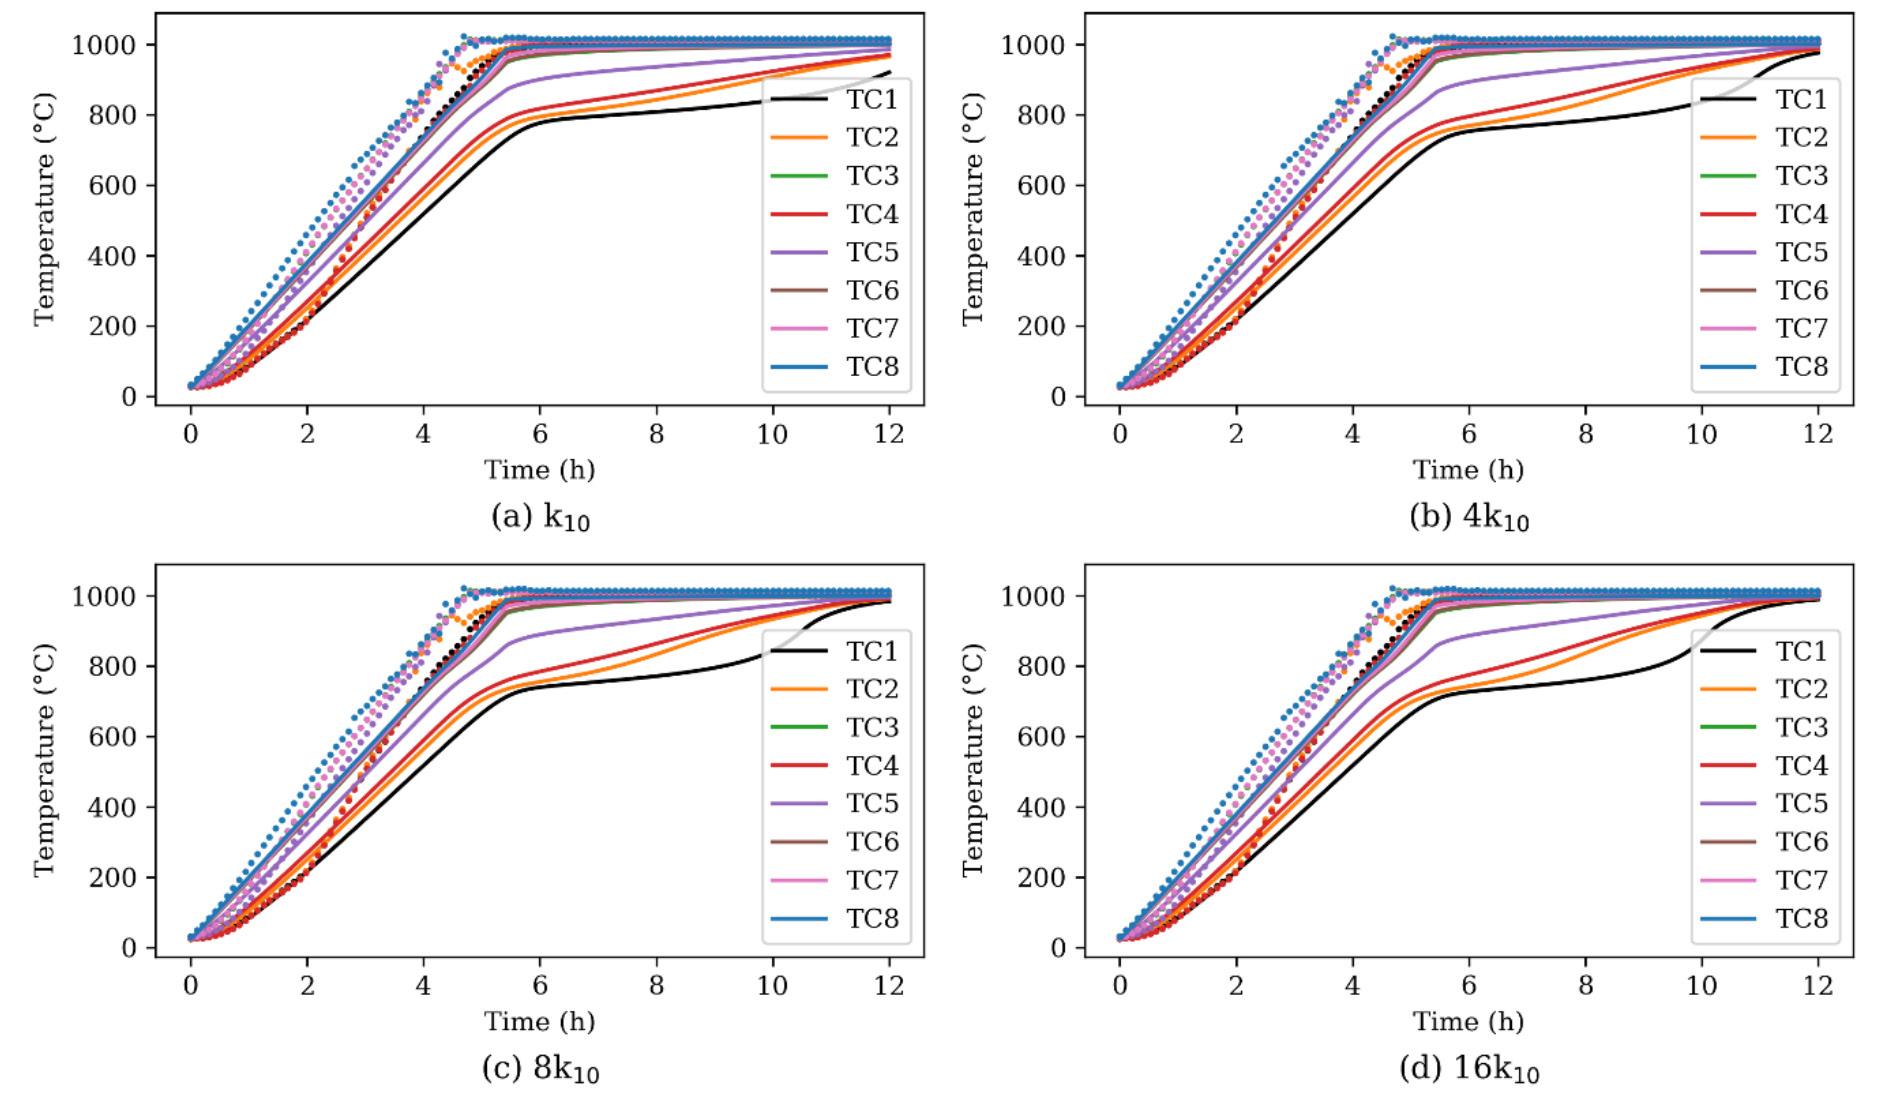
experiments conducted in larger vessels with larger masses, as it is clear from the data obtained that, at the scale and heating rate tested, the heat transfer limitations are not pronounced.
The presented adjustments to the model
conservative results, which is useful in industrial practice, although there is
perform a
to
predict the effect of vessel size on any given mass. A range of different cases with different masses (100–300 kg) and vessel diameters (0.4–1.4 m), using the model with a linearly varying thermal conductivity term and a heating rate of 10°C min-1, was simulated over 48 hours. This sensitivity analysis was used to see which configurations achieved at least 950°C (when the reactions will be virtually completed) within the 48 hours and how long it took. This is depicted in Figure 8, and as can be expected, a shallower material bed tends to achieve temperature faster (with the height sometimes preventing temperature being reached at all).
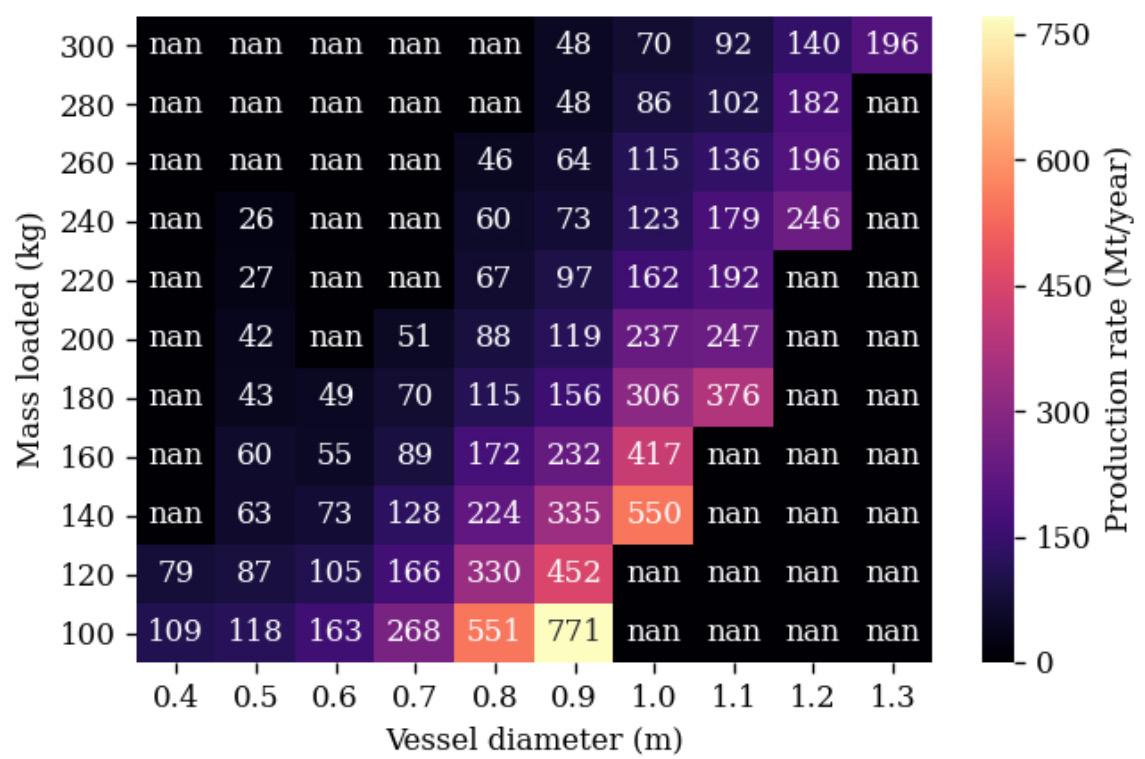
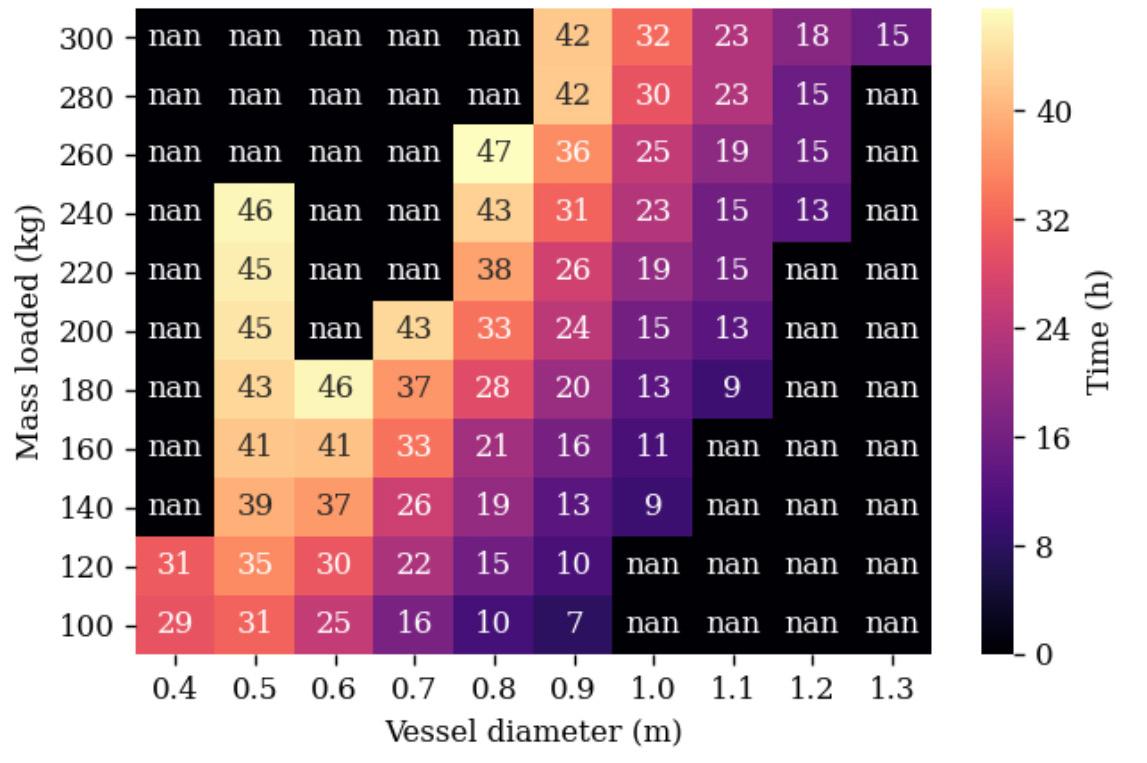
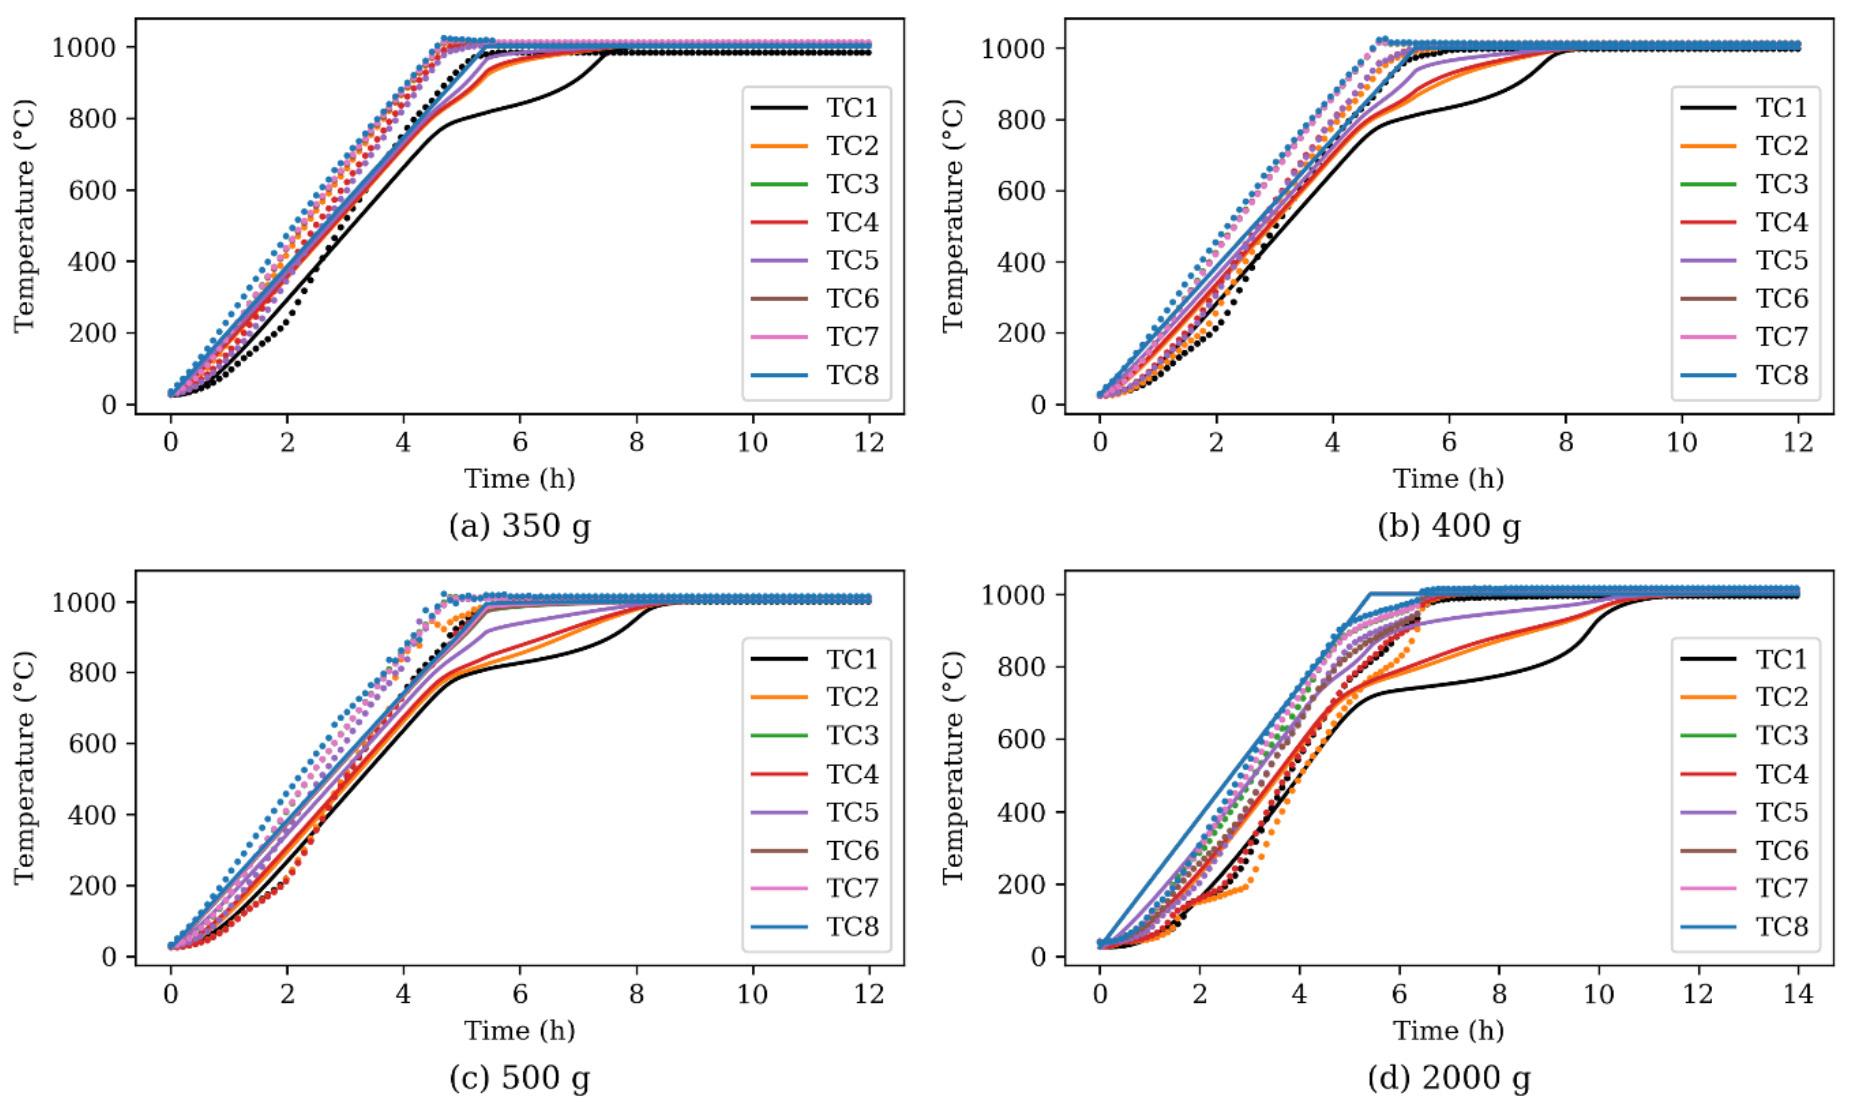
Unrealistically tall vessels, and unsuitably thin material beds were not included and are represented by a ‘nan’ term in the figures (with acceptable heights falling within 20–300% of the vessel diameter). Shallow beds were not included as this analysis is limited to cylindrical vessels, and a configuration where material
heating is primarily dominated by the top layer would be better suited to a cubic/rectangular loading (as the mass loading can be 21.5% greater). The upper limit of the height of vessels and their loading was set to a factor of three vessel diameters for structural stability reasons.
Using several patents for the direct reduction of iron in a tunnel kiln as a guide, the dimensions for a hypothetical tunnel kiln have been set as 4 m × 4 m ×100 m (W × H × L) (Hauxing, 2014; Qingfeng, 2005; Xinzheng, 2020; Yicheng, 2014; Zhongji, 2012). This can be used to estimate a material processing rate. Given the time required to reach 950°C, the residence time in the furnace (with interest limited to the heating and holding at temperature only and not cooling) can be calculated and used to estimate a product throughput for each configuration assuming full conversion.
conversion in this context implies a feed of pure reactants
fully to products (with additional excess
carbon) whereby 1 kg feed yields approximately 0.47 kg product. It should be noted that the number of vessels is maximized for each configuration by stacking multiple layers on top of each other and side by side. Additionally, only 80% of the available area was utilized to allow for sufficient space between vessels and the walls/ roof and consecutive kiln cars.
As per Figure 9, the optimum is a shallow bed (on the edge of the imposed limit on bed height) and a production rate of 771 Mt/a is predicted. This value is a bit large, with direct iron reduction tunnel kilns processing between 100–500 Mt/a (Qingfeng, 2005), but could be achievable. Naturally, at this point of development of suitable technology, these calculations should be deemed as indicative only and should eventually be confirmed by practical results. However, the indications can be used for initial technoeconomic assessments to determine if it is worthwhile to invest further in scaling up the technology.
The model presented describes the heat transfer within a reacting bed of gypsum and coal by means of a two-dimensional transient finite difference method.
The model achieves reasonable results and matches the trends observed in experimental work well. However, it is still recommended that larger scale experiments be conducted as the model shows an increasing inaccuracy as the mass and vessel diameter is increased.
A sensitivity analysis for a hypothetical tunnel kiln was used to determine the optimum cylindrical vessel configuration to maximize the possible material processing rate. The analysis found that a shallower material bed results in a more optimal setup, with more efficient heat transfer. This results in an estimated production rate of 771 Mt/a. Although an actual achievable production rate will only be known once a full-scale plant has been built and operated, the predictions are deemed sufficient to decide whether to further invest in the development of the technology.
The model has good flexibility and can be updated and improved readily. The model shows good suitability for the prediction of the heat transfer within a reacting bed of solid gypsum and coal.
The author would like to extend thanks to the Department of Trade, Industry and Competition of South Africa for sponsoring the project, ROC Water for their part in managing the project, and Foskor for making phosphogypsum available for use for the experiments.
Akah, A. 2017. Application of rare earths in fluid catalytic cracking: A review. Journal of Rare Earths, vol. 35. p. 941.
De Beer, M., Maree, J.P., Liebenberg, L., and Doucet, F.J. 2014. Conversion of calcium sulphide to calci-um carbonate during the process of recovery of elemental sulphur from gypsum waste. Waste Management, vol. 34, no. 11. pp. 2373–2381.
De Beer, M., Doucet, F.J., Maree, .P., and Liebenberg, L. 2015. Synthesis of
high-purity precipitated calcium carbonate during the process of recovery of elemental sulphur from gypsum waste. Waste Management, vol. 46. pp. 619–627.
Bejan, A. 2013. Convection Heat Transfer 4th edn. Wiley.
Brooks, M.W. ánd Lynn, S. 1997. Recovery of calcium carbonate and hydrogen sulfide from waste calcium sulphide. Industrial & Engineering Chemistry Research, vol. 36. pp. 4236–4242.
Çengel, Y.A. and Ghajar, A.J. 2015. Heat and Mass Transfer: Fundamentals & Applications. 5th edn. McGraw-Hill, New York.
Cork, D.J., Jerger, D.E., and Maka, A. 1986. Biocatalytic production of sulphur from process waste streams. Biotechnology and Bioengineering, vol. 16. pp. 149–162.
Dutta, T., Kim, K.H., Uchimiya, M., Kwon, E.E., Jeon, B.H., Deep, A., and Yun, S.T. 2016. Global demand for rare earth resource and strategies for green mining. Environmental Research, vol. 150. pp. 182–190.
Engineering ToolBox. 2003. Specific heat of solids. https://www.engineeringtoolbox.com/specific-heat-solids-d_154.html
Finney, K.N., Sharifi, V.N., and Swithenbank, J. 2009. Fuel pelletization with a binder: Part II-the impacts of binders on the combustion of spent mushroom compost-coal tailing pellets. Energy & Fuel, vol. 23. pp. 3203–3210.
Godbee, H.W. and Ziegler, W.T. 1996. Thermal cConductivities of MgO, Al₂0₃, and ZrO₂ Powders to 850°C. Journal of Applied Physics, vol. 37, no. 1. pp. 40–55.
Gorkan, A.N., Prada, S.D., Pathak, G., and ,, S.S. 2000. Vanadium catalysed gasification of carbon and its application in the carbothermic reduction of barite. Fuel, vol. 79. pp. 821–827.
Green, D.W. and Perry, R.H. 2008. Perry’s Chemical Engineers’ Handbook. 8th edn. McGraw-Hill, New York.
Hauxing, J. 2014. Chinese patent no. CN203534155U.
Jagtap, S.B., Pande, A.R., and Gokarn, A.N. 1990. Effect of catalysts on the kinetics of the reduction of barite by carbon. Industrial & Engineering Chemistry Research, vol. 29. pp. 795–799.
Kale, B.B., Pande, A.R., and Gokarn, A.N. 1992. Studies in the carbothermic reduction of phosphogypsum. Metallurgical and Materials Transactions B, vol. 23. p. 567.
Kato, T., Murakami, K., and Sugawara, K. 2012. Carbon reduction of gypsum produced from flue gas desulfurization. Chemical Engineering Transactions, vol. 29. pp. 805–810.
Kulczycka, J., Kawaski, Z., Smol, M., and Wirth, H. 2016. Evaluation of the recovery of rare earth elements (REE) from phosphogypsum waste-case study of the WIZOW chemical plant (Poland). Journal of Cleaner Production, vol. 113. pp. 345–354.
Laubitz, M. 1959. Thermal conductivity of powders. Canadian Journal of Physics, vol. 37. pp. 798–808.
Li, H.J. and Zhuang, Y.H. 1999. Catalytic reduction of calcium sulfate to calcium sulfide by carbon monoxide. Industrial & Engineering Chemistry Research, vol. 38, no. 9. pp. 3333–3337.
Luikov, A., Shashkov, A., Vasilievv, L., and Fraiman, Y. 1968. Thermal conductivity of porous systems. International Journal of Heat and Mass Transfer, vol. 11. pp. 117–140.
Ma, L., Niu, X., Hou, J., Zheng, S., and Xu, W. 2011. Reaction mechanism and influence factors analysis for calcium sulfide generation in the process of phosphogypsum decomposition. Thermochimica Acta, vol. 526. pp. 163–168.
Mark, H.F., Othmer, D.F., Overberger, C.G., and Seaborg, G.T. 1978. Kirk-Othmer: Encyclopedia of Chemical Technology. 3rd edn. Wiley-Interscience, New York.
Mbhele, N.R., van der Merwe, W., Maree, J.P., and Theron, D. 2009. Recovery of sulphur from waste gypsum. Proceedings of the International Mine Water Conference, Pretoria, South Africa, 19-23 October 2009. https://www.imwa.info/ docs/imwa_2009/IMWA2009_Mbhele.pdf
Miao, Z., Yang, H., Wu, Y., Zhang, H., and Zhang, X. 2012. Experimental studies on decomposing properties of desulfurization gypsum in a thermogravimetric analyzer and multi-atmosphere fluidized beds. Industrial & Engineering Chemistry Research, vol. 51. pp. 5419–5423.
Motaung, S., Zvimba, J.N., Maree, J.P., and Kolesnikov, A. 2015. Thermochemical reduction of pelletized gypsum mixed with carbonaceous reductants. Water SA, vol. 41. pp. 369.
Nengovhela, N.R., Strydom, C.A., Maree, J.P., Oosthuizen, S., and Theron, D.J. 2007. Recovery of sulphur and calcium carbonate from waste gypsum. Water SA, vol. 33. pp. 741–747.
Ning, P., Zheng, S.C., Ma, L.P., Du, Y.L., Zhang, W., Niu, X.K., and Wang, F.Y. 2011. Kinetics and thermodynamics studies on the decomposition of phosphogypsum in different atmospheres. Advanced Materials Research, vol. 160. pp. 842–848.
Oates, J.A.H. 1986. Lime and Limestone: Chemistry and Technology, Production and Uses. Wiley-VCH, Weinheim.
Oberholzer, J.J. and Nel, S.S. 2020. Analytical report: Ash and coal samples. UIS Analytical Services, Pretoria.
Oh, J.S. and Wheelock, T.D. 1990. Reductive decomposition of calcium sulphate with carbon monoxide: reaction mechanism. Industrial & Engineering Chemistry Research, vol. 29. pp. 544–550.
Qingfeng, Y. 2005. Tunnel kiln without exterior combustion chamber and production of direct reduced iron by composite tunnel kiln. Chinese patent no. CN1804049A.
Roine, A. 2018. HSC Chemistry. Outotec, Pori. http://www.outotec.com/HSC
Ruto, S., Maree, J.P., Zvinowanda, C.M., Louw, W.J., and Kolesnikov, A.V. 2011. Thermal studies on gypsum in a pilot-scale, rotary kiln. Proceedings of Water in the South African Minerals Industry. Southern African Institute of Mining and Metallurgy, Johannesburg. pp. 15–17.
Selim, H., Gupta, A.K., and Al Shoaibi, A . 2013. Effect of reaction parameters on the quality of captured sulphur in Claus process. Applied Energy, vol. 104. pp. 772–776.
Sliger, A.G. 1988. The MW Kellogg Company KEL-S Process. Proceedings of the Second International Symposium on Phosphogypsum, Miami, Florida. Florida Institute of Phosphate Research. pp. 89–107.
Strydom, C.A., Groenewald, E.M., and Potgieter, J.H. 1997a. Thermogravimetric
studies of the synthesis of CaS from gypsum, CaSO₄2H₂O and phosphogypsum. Journal of thermal analysis. vol. 49, no. 3. pp. 1501.
Strydom, C.A., Groenewald, E.M. and Potgieter, J.H. 1997b. Thermogravimetric studies of the synthesis of CaS from gypsum, CaSO₄2H₂O and phosphogypsum. Journal of thermal analysis, vol. 49, no. 3. p. 1501.
Tao, D., Chen, S., Parekh, B.K., and Hepworth, M.T. 2001. An investigation of a thermochemical process for conversion of gypsum and pyrite wastes into useful products. Advances in Environmental Research, vol. 5. pp. 277–284.
Tesárek, P., Drchalová, J., Kolísko, J., Rovnaníková, P., and Černý, R. 2007. Flue gas desulfurization gypsum: Study of basic mechanical, hydric and thermal properties. Construction and Building Materials, vol. 21, no. 7. pp. 1500–1509.
Trikkel, A. and Kuusik, R. 1994. Tallinna tehnikaulik. Toimi, vol. 45. pp. 742.
Van Vuuren, D. and Maree, J. 2018. A novel process to recover sulfur, lime and rare earths from gypsum. Department of Chemical Engineering, University of Pretoria.
Walawalkar, M., Nichol, C.K., and Azimi, G. 2016. Process investigation of the acid leaching of rare earth elements from phosphoogypsum using HCl, HNO₃ and H₂SO₄ http://dx.doi.org/10.1016/j.hydromet.2016.06.808
Welty, J.R., Wicks, C.E., and Wilson, R.E. 1969. Fundamentals of Momentum, Heat, and Mass Transfer. 5th edn. Wiley. New York.
Windholz, M. 1983. The Merck Index. 10th edn. Merck & Co., Inc, New Jersey.
Xinzheng, B. 2020. Chinese patent no. CN111359544A
Yan, B., Ma, L., Ma, J., Zi, M., and Yan, X. 2014. Mechanism analysis of CaS transformation in -phosphogypsum decomposition with Fe catalyst. Industrial & Engineering Chemistry Research, vol. 53. pp. 7648–7654.
Yicheng, F. 2014. Chinese patent no. W02014169442A1. Yunusova, S.S. 2004. Composite wall materials and products based on phosphogypsum, obtained by semi-dry pressing. Samara State Architecture Academy.
Zadick, T.W., Zavaleta, R., and McCandless, F.P. 1972. Catalytic reduction of calcium sulfate to calcium sulfide with carbon monoxide. Industrial & Engineering Chemistry Research, vol. 11. pp. 283.
Zhang, W., Li, X., Qu, Z., Zhao, Q., and Chen, G. 2010a. Facile solution synthesis and characterization of CaCO₃ microspheres with urchin-shaped structure. Material Letters. vol. 64. pp. 71–73.
Zhang, W., Li, X., Qu, Z., Zhao, Q., and Chen, G. 2010b. Facile solution synthesis and characterization of CaCO₃ microspheres with urchin-shaped structure. Materials Letters, vol. 64. pp. 71–73.
Zhongji, H. 2012. Chinese patent no. CN102643944A. u
26 October 2022 — 18TH Annual Student Colloquium 2022 Mintek Randburg, South Africa
Contact: Gugu Charlie Tel: 011 538-0238
E-mail: gugu@saimm.co.za Website: http://www.saimm.co.za
2–4 November 2022 — PGM The 8TH International Conference 2022 Sun City, Rustenburg, South Africa
Contact: Camielah Jardine Tel: 011 538-0238
E-mail: camielah@saimm.co.za Website: http://www.saimm.co.za
6-9 November 2022 — Tailings & Mine Waste conference Denver Contact: pnelson@mines.edu
7–8 November 2022 — SANCOT Symposium 2022 ´Tunnel boring in civil engineering and mining´ Wallenberg Conference Centre @ STIAS, Stellenbosch, Western Cape, South Africa
Contact: Gugu Charlie Tel: 011 538-0238
E-mail: gugu@saimm.co.za Website: http://www.saimm.co.za
13–17 November 2022 — Copper 2022 Santiago, Chile Website: https://copper2022.cl/
16-17 November 2022 — MESA Africa Year end International Summit - ‘Successful Manufacturing | The Next Step’
Black Eagle Boutique Hotel and Conference Centre, Johannesburg jane@mesa-africa.org
28 November –1 December 2022 — South African Geophysical Association’s 17TH Biennial Conference & Exhibition 2022 Sun City, South Africa Website: https://sagaconference.co.za/
13-16 December 2022 — 4TH International Conference on Science and Technology of Ironmaking and Steelmaking Indian Institute of Technology Bombay (IIT Bombay) Website: http://stis2022.org/
22-23 February 2023 — Drilling and Blasting Online Short Course 2023
Contact: Camielah Jardine Tel: 011 538-0238
E-mail: camielah@saimm.co.za Website: http://www.saimm.co.za
13-16 March 2023 — 8TH Sulphur and Sulphuric Acid Conference 2023
The Vineyard Hotel, Newlands, Cape Town, South Africa
Contact: Gugu Charlie E-mail: gugu@saimm.co.za Website: http://www.saimm.co.za
24-25 April 2023 — Southern African Hydrogen and Fuel Cell Conference 2023
From fundamentals to accelerated integration Hazendal Wine Estate, Stellenbosch, Cape Town
Contact: Camielah Jardine Tel: 011 538-0238
E-mail: camielah@saimm.co.za Website: http://www.saimm.co.za
11-14 June 2023 — European Metallurgical Conference 2023
Abstracts are to be completed online on https://bit.ly/ Enter2021YPLCfinals
13–15 June 2023 — Copper Cobalt Africa in association with the 10TH Southern African Base Metals Conference 2023
Avani Victoria Falls Resort, Livingstone, Zambia Contact: Camielah Jardine
E-mail: camielah@saimm.co.za Website: http://www.saimm.co.za
19-22 June 2023 — Introduction to Multiple-Point Statistics Online Course
Contact: Camielah Jardine Tel: 011 538-0238 E-mail: camielah@saimm.co.za Website: http://www.saimm.co.za
28-29 June 2023 — SAIMM Digitalisation in Mining 2023
Putting Digital Technologies to Work
The Canvas, Riversands, Fourways Contact: Gugu Charlie Tel: 011 538-0238 E-mail: gugu@saimm.co.za Website: http://www.saimm.co.za
25-26 July 2023 — Diamonds Source to Use 2023 Conference
New Beginnings A brave new (diamond) world Birchwood Hotel and OR Tambo Conference Centre, Boksburg, Johannesburg
Contact: Camielah Jardine Tel: 011 538-0238
E-mail: camielah@saimm.co.za Website: http://www.saimm.co.za
4-7 September 2023 — Geometallurgy Conference 2023 Geometallurgy GEOMET DATA
The Vineyard Hotel, Newlands, Cape Town Contact: Gugu Charlie Tel: 011 538-0238
E-mail: gugu@saimm.co.za Website: http://www.saimm.co.za
27-28 September 2023 — SAIMM Diversity and Inclusion Dialogue 2023 (DIMI) 2023
Intersectionality in the Minerals Industry From Awareness to Action Johannesburg
Contact: Camielah Jardine Tel: 011 538-0238
E-mail: camielah@saimm.co.za Website: http://www.saimm.co.za
The following organizations have been admitted to the Institute as Company Affiliates
3M South Africa (Pty) Limited
AECOM SA (Pty) Ltd
AEL Mining Services Limited
African Pegmatite (Pty) Ltd
Air Liquide (Pty) Ltd
Alexander Proudfoot Africa (Pty) Ltd
Allied Furnace Consultants
AMEC Foster Wheeler
AMIRA International Africa (Pty) Ltd
ANDRITZ Delkor(Pty) Ltd
Anglo Operations Proprietary Limited
Anglogold Ashanti Ltd
Arcus Gibb (Pty) Ltd
ASPASA
Aurecon South Africa (Pty) Ltd
Aveng Engineering
Aveng Mining Shafts and Underground
Axiom Chemlab Supplies (Pty) Ltd
Axis House (Pty) Ltd
Bafokeng Rasimone Platinum Mine
Barloworld Equipment -Mining
BASF Holdings SA (Pty) Ltd
BCL Limited
Becker Mining (Pty) Ltd
BedRock Mining Support (Pty) Ltd
BHP Billiton Energy Coal SA Ltd
Blue Cube Systems (Pty) Ltd
Bluhm Burton Engineering (Pty) Ltd
Bond Equipment (Pty) Ltd
Bouygues Travaux Publics
Caledonia Mining South Africa Plc
Castle Lead Works
CDM Group
CGG Services SA
Coalmin Process Technologies CC
Concor Opencast Mining
Concor Technicrete
Council for Geoscience Library
CRONIMET Mining Processing SA (Pty) Ltd
CSIR Natural Resources and the Environment (NRE)
Data Mine SA
Digby Wells and Associates
DRA Mineral Projects (Pty) Ltd
DTP Mining - Bouygues Construction Duraset
EHL Consulting Engineers (Pty) Ltd
Elbroc Mining Products (Pty) Ltd
eThekwini Municipality
Ex Mente Technologies (Pty) Ltd
Expectra 2004 (Pty) Ltd
Exxaro Coal (Pty) Ltd
Exxaro Resources Limited
Filtaquip (Pty) Ltd
FLSmidth Minerals (Pty) Ltd
Fluor Daniel SA (Pty) Ltd
Franki Africa (Pty) Ltd-JHB
Fraser Alexander (Pty) Ltd
G H H Mining Machines (Pty) Ltd
Geobrugg Southern Africa (Pty) Ltd
Glencore
Gravitas Minerals (Pty) Ltd
Hall Core Drilling (Pty) Ltd
Hatch (Pty) Ltd
Herrenknecht AG
HPE Hydro Power Equipment (Pty) Ltd
Huawei Technologies Africa (Pty) Ltd
Immersive Technologies
IMS Engineering (Pty) Ltd
Ingwenya Mineral Processing (Pty) Ltd
Ivanhoe Mines SA
Joy Global Inc.(Africa)
Kudumane Manganese Resources
Leica Geosystems (Pty) Ltd
Loesche South Africa (Pty) Ltd
Longyear South Africa (Pty) Ltd
Lull Storm Trading (Pty) Ltd Maccaferri SA (Pty) Ltd Magnetech (Pty) Ltd
Magotteaux (Pty) Ltd
Malvern Panalytical (Pty) Ltd Maptek (Pty) Ltd
Maxam Dantex (Pty) Ltd
MBE Minerals SA Pty Ltd
MCC Contracts (Pty) Ltd
MD Mineral Technologies SA (Pty) Ltd
MDM Technical Africa (Pty) Ltd
Metalock Engineering RSA (Pty)Ltd
Metorex Limited
Metso Minerals (South Africa) (Pty) Ltd
Micromine Africa (Pty) Ltd
MineARC South Africa (Pty) Ltd
Minerals Council of South Africa
Minerals Operations Executive (Pty) Ltd
MineRP Holding (Pty) Ltd
Mining Projections Concepts Mintek
MIP Process Technologies (Pty) Limited
MLB Investment CC
Modular Mining Systems Africa (Pty) Ltd
MSA Group (Pty) Ltd
Multotec (Pty) Ltd
Murray and Roberts Cementation
Nalco Africa (Pty) Ltd
Namakwa Sands(Pty) Ltd
Ncamiso Trading (Pty) Ltd
Northam Platinum Ltd - Zondereinde Opermin Operational Excellence
OPTRON (Pty) Ltd
Paterson & Cooke Consulting Engineers (Pty) Ltd
Perkinelmer
Polysius A Division of Thyssenkrupp Industrial Sol
Precious Metals Refiners
Rams Mining Technologies
Rand Refinery Limited
Redpath Mining (South Africa) (Pty) Ltd
Rocbolt Technologies Rosond (Pty) Ltd
Royal Bafokeng Platinum Roytec Global (Pty) Ltd
RungePincockMinarco Limited
Rustenburg Platinum Mines Limited Salene Mining (Pty) Ltd
Sandvik Mining and Construction Delmas (Pty) Ltd
Sandvik Mining and Construction RSA (Pty) Ltd
SANIRE
Schauenburg (Pty) Ltd
Sebilo Resources (Pty) Ltd
SENET (Pty) Ltd
Senmin International (Pty) Ltd
SISA Inspection (Pty) Ltd
Smec South Africa
Sound Mining Solution (Pty) Ltd
SRK Consulting SA (Pty) Ltd
Time Mining and Processing (Pty) Ltd
Timrite (Pty) Ltd
Tomra (Pty) Ltd
Traka Africa (Pty) Ltd
Ukwazi Mining Solutions (Pty) Ltd
Umgeni Water
Webber Wentzel
Weir Minerals Africa Welding Alloys South Africa Worley
The primary purpose of the 1st Hydrogen and Fuel Cells conference is the advancement of green hydrogen technologies in Southern Africa and the global community, by highlighting the power of renewable and sustainable technologies and addressing the emerging challenges— through the exploration of fuel cells, hydrogen storage, and hydrogen generation by way of engagement with industry, academia and government. The conference will provide a platform for high level exchange and networking opportunities with various experts in the field. The two-day conference will feature high-level scientific talks and posters, complemented with keynote and plenary presentations on country overviews, status of leading and major players in the Southern African and global arena.
Will include both inspiring technical talks as well as social networking events
Participants will have the opportunity to directly engage with conference participants to discuss their research
Fuel cell technologies & applications
Performance, durability, design, and manufacturing (from components to systems)
Hydrogen storage technologies
Hydrogen generation technologies
Hydrogen mobility –strategies, safety, roadmaps, transitioning to hydrogen refueling stations (HRS)

Technology status in industry.
The conference presents an attractive programme for researchers, industry players, academic institutions, government, investors, policy makers and potential users of fuel cell and hydrogen technologies. The focus is on building collective know-how and fostering engagement between business, government, science and academic institutions. Participants from all countries are invited and welcome to attend the event.
Camielah Jardine, Head of Conferencing
camielah@saimm.co.za
+27 11 538-0237 Web: www.saimm.co.za
14 November 2022
• Notification of acceptance of abstracts: 31 November 2022
• Deadline of submission of papers: 30 December 2022
The Conference is being organized by the Southern African Institute of Mining and Metallurgy, and individuals are invited to submit papers or presentations or posters for the Conference. Titles and short abstracts (no more than 500 words) on any relevant subject should be submitted in English to: Head of Conferencing, Camielah Jardine
Enquiries may be made at: Tel: +27 011 538-0237 E-mail: camielah@saimm.co.za website: www.saimm.co.za
AND SACNASP CPD POINTS WILL BE ALLOCATED PER HOUR ATTENDED