Globally Minded - Locally Focused
VOLUME 123 NO. 7 JULY 2023

Tailings & Mine Waste
Slurry Pipeline Systems
Mine Backfill
Mineral Processing
Mine Services

Marine Pipeline Systems
Laboratory Services
Courses & Training
We are leading experts in tailings and mine waste. Our holistic solutions balance many competing requirements such as geotechnical stability, geochemical stability, water conservation, social license to operate, people at risk, emissions, risk to operations, and cost.
With over 30 years of experience designing slurry pipeline systems, we are global leaders in this field. Our expertise includes conventional tailings pipelines, thickened and paste tailings disposal systems, and long-distance ore and concentrate pipelines.
Since 1991, our engineers have solved some of the most complex backfill challenges while testing and designing hydraulic, paste and cemented rock fill (CRF) projects all over the world and we remain leaders in the design, execution, and ongoing management support of mine backfill systems.
Honorary President
Nolitha Fakude
President, Minerals Council South Africa
Honorary Vice Presidents
Gwede Mantashe
Minister of Mineral Resources and Energy, South Africa
Ebrahim Patel
Minister of Trade, Industry and Competition, South Africa
Blade Nzimande
Minister of Higher Education, Science and Technology, South Africa
President
Z. Botha
President Elect
W.C. Joughin
Senior Vice President
E. Matinde
Junior Vice President
G.R. Lane
Incoming Junior Vice President
T.M. Mmola
Immediate Past President
I.J. Geldenhuys
Honorary Treasurer
W.C. Joughin
Ordinary Members on Council
W. Broodryk G. Njowa
Z. Fakhraei S.J. Ntsoelengoe
R.M.S. Falcon (by invitation) S.M. Rupprecht
B. Genc M.H. Solomon
K.M. Letsoalo A.J.S. Spearing
S.B. Madolo A.T. van Zyl
F.T. Manyanga E.J. Walls
M.C. Munroe
Co-opted to Members
K. Mosebi
A.S. Nhleko
Past Presidents Serving on Council
N.A. Barcza C. Musingwini
R.D. Beck S. Ndlovu
J.R. Dixon J.L. Porter
V.G. Duke M.H. Rogers
R.T. Jones D.A.J. Ross-Watt
A.S. Macfarlane G.L. Smith
M.I. Mthenjane W.H. van Niekerk
G.R. Lane–TPC Mining Chairperson
Z. Botha–TPC Metallurgy Chairperson
M.A. Mello–YPC Chairperson
K.W. Banda–YPC Vice Chairperson
Branch Chairpersons
Botswana Being established
DRC Not active
Johannesburg N. Rampersad
Namibia Vacant
Northern Cape I. Tlhapi
North West I. Tshabalala
Pretoria Vacant
Western Cape A.B. Nesbitt
Zambia J.P.C. Mutambo (Interim Chairperson)
Zimbabwe A.T. Chinhava
Zululand C.W. Mienie
* W. Bettel (1894–1895)
* A.F. Crosse (1895–1896)
* W.R. Feldtmann (1896–1897)
* C. Butters (1897–1898)
* J. Loevy (1898–1899)
* J.R. Williams (1899–1903)
* S.H. Pearce (1903–1904)
* W.A. Caldecott (1904–1905)
* W. Cullen (1905–1906)
* E.H. Johnson (1906–1907)
* J. Yates (1907–1908)
* R.G. Bevington (1908–1909)
* A. McA. Johnston (1909–1910)
* J. Moir (1910–1911)
* C.B. Saner (1911–1912)
* W.R. Dowling (1912–1913)
* A. Richardson (1913–1914)
* G.H. Stanley (1914–1915)
* J.E. Thomas (1915–1916)
* J.A. Wilkinson (1916–1917)
* G. Hildick-Smith (1917–1918)
* H.S. Meyer (1918–1919)
* J. Gray (1919–1920)
* J. Chilton (1920–1921)
* F. Wartenweiler (1921–1922)
* G.A. Watermeyer (1922–1923)
* F.W. Watson (1923–1924)
* C.J. Gray (1924–1925)
* H.A. White (1925–1926)
* H.R. Adam (1926–1927)
* Sir Robert Kotze (1927–1928)
* J.A. Woodburn (1928–1929)
* H. Pirow (1929–1930)
* J. Henderson (1930–1931)
* A. King (1931–1932)
* V. Nimmo-Dewar (1932–1933)
* P.N. Lategan (1933–1934)
* E.C. Ranson (1934–1935)
* R.A. Flugge-De-Smidt (1935–1936)
* T.K. Prentice (1936–1937)
* R.S.G. Stokes (1937–1938)
* P.E. Hall (1938–1939)
* E.H.A. Joseph (1939–1940)
* J.H. Dobson (1940–1941)
* Theo Meyer (1941–1942)
* John V. Muller (1942–1943)
* C. Biccard Jeppe (1943–1944)
* P.J. Louis Bok (1944–1945)
* J.T. McIntyre (1945–1946)
* M. Falcon (1946–1947)
* A. Clemens (1947–1948)
* F.G. Hill (1948–1949)
* O.A.E. Jackson (1949–1950)
* W.E. Gooday (1950–1951)
* C.J. Irving (1951–1952)
* D.D. Stitt (1952–1953)
* M.C.G. Meyer (1953–1954)
* L.A. Bushell (1954–1955)
* H. Britten (1955–1956)
* Wm. Bleloch (1956–1957)
* H. Simon (1957–1958)
* M. Barcza (1958–1959)
* R.J. Adamson (1959–1960)
* W.S. Findlay (1960–1961)
* D.G. Maxwell (1961–1962)
* J. de V. Lambrechts (1962–1963)
* J.F. Reid (1963–1964)
* D.M. Jamieson (1964–1965)
* H.E. Cross (1965–1966)
* D. Gordon Jones (1966–1967)
* P. Lambooy (1967–1968)
* R.C.J. Goode (1968–1969)
* J.K.E. Douglas (1969–1970)
* V.C. Robinson (1970–1971)
* D.D. Howat (1971–1972)
* J.P. Hugo (1972–1973)
* P.W.J. van Rensburg (1973–1974)
* R.P. Plewman (1974–1975)
* R.E. Robinson (1975–1976)
* M.D.G. Salamon (1976–1977)
* P.A. Von Wielligh (1977–1978)
* M.G. Atmore (1978–1979)
* D.A. Viljoen (1979–1980)
* P.R. Jochens (1980–1981)
* G.Y. Nisbet (1981–1982)
A.N. Brown (1982–1983)
* R.P. King (1983–1984)
J.D. Austin (1984–1985)
* H.E. James (1985–1986)
H. Wagner (1986–1987)
* B.C. Alberts (1987–1988)
* C.E. Fivaz (1988–1989)
* O.K.H. Steffen (1989–1990)
* H.G. Mosenthal (1990–1991)
R.D. Beck (1991–1992)
* J.P. Hoffman (1992–1993)
* H. Scott-Russell (1993–1994)
J.A. Cruise (1994–1995)
D.A.J. Ross-Watt (1995–1996)
N.A. Barcza (1996–1997)
* R.P. Mohring (1997–1998)
J.R. Dixon (1998–1999)
M.H. Rogers (1999–2000)
L.A. Cramer (2000–2001)
* A.A.B. Douglas (2001–2002)
S.J. Ramokgopa (2002-2003)
T.R. Stacey (2003–2004)
F.M.G. Egerton (2004–2005)
W.H. van Niekerk (2005–2006)
R.P.H. Willis (2006–2007)
R.G.B. Pickering (2007–2008)
A.M. Garbers-Craig (2008–2009)
J.C. Ngoma (2009–2010)
G.V.R. Landman (2010–2011)
J.N. van der Merwe (2011–2012)
G.L. Smith (2012–2013)
M. Dworzanowski (2013–2014)
J.L. Porter (2014–2015)
R.T. Jones (2015–2016)
C. Musingwini (2016–2017)
S. Ndlovu (2017–2018)
A.S. Macfarlane (2018–2019)
M.I. Mthenjane (2019–2020)
V.G. Duke (2020–2021)
I.J. Geldenhuys (2021–2022)
Editorial Board
S.O. Bada
R.D. Beck
P. den Hoed
I.M. Dikgwatlhe
R. Dimitrakopolous*
L. Falcon
B. Genc
R.T. Jones
W.C. Joughin
A.J. Kinghorn
D.E.P. Klenam
H.M. Lodewijks
D.F. Malan
R. Mitra*
H. Möller
C. Musingwini
S. Ndlovu
P.N. Neingo
M. Nicol*
S.S. Nyoni
M. Phasha
P. Pistorius
P. Radcliffe
N. Rampersad
Q.G. Reynolds
I. Robinson
S.M. Rupprecht
K.C. Sole
A.J.S. Spearing*
T.R. Stacey
E. Topal*
D. Tudor*
F.D.L. Uahengo
D. Vogt*
*International Advisory Board members
Editor /Chairman of the Editorial Board
R.M.S. Falcon
Typeset and Published by
The Southern African Institute of Mining and Metallurgy


PostNet Suite #212
Private Bag X31
Saxonwold, 2132
E-mail: journal@saimm.co.za
Printed by Camera Press, Johannesburg
Advertising Representative
Barbara Spence
Avenue Advertising
Telephone (011) 463-7940
E-mail: barbara@avenue.co.za

ISSN 2225-6253 (print)
ISSN 2411-9717 (online)
Directory of Open Access Journals

Journal Comment: Copper Cobalt Edition July 2023 by K.C. Sole
President’s Corner: A glass half full for SA for SA exploration and Mining
by Z. BothaCharacterization of firebricks used in copper smelting furnaces of the 19th century, Atacama, Chile
A. Nazer, N. Toro, O. Pavez, and J. Guerrero .
With the cessation of significant copper mining in northern Chile at the end of the 19th century, the copper smelters fell into ruin. Abundant fragments of refractory bricks from the furnaces remain. Characterization studies of samples collected on-site showed that the bricks are silicoaluminous, unlike the magnesium-chromium bricks used by current copper foundries. The compressive strengths were similart to those of currently-used bricks. The majority of the bricks were produced in the UK, with only 10% being manufactured in Chile. The results will contribute to the 19th-century mining and metallurgical heritage of Chile and the UK.
Copper solvent extraction on the African Copperbelt: From historic origins to worldleading status
O.S. Tinkler and K.C. Sole . .
Steady improvements in the performance and efficiency of reagents and equipment, combined with significant developments in leaching and electrowinning for copper cathode production, have made an ever-widening range of copper ore types amenable to solvent-extraction. A large proportion of the growth in copper production in the Central African Copperbelt in recent years is due to the re-emergence of this technology This review provides a brief history of the development and evolution of copper solvent extractants and mixer-settler contactors, and the significance of the Copperbelt region in achieving commercialization and acceptance of the technology.
The use of seawater in copper hydrometallurgical processing in Chile: A review
Á. Astudillo, M. Garcia, V. Quezada, and L. Valásquez . . .
Seawater accounts for 25% of the water consumed by the Chilean copper mining industry. The use of seawater for leaching of copper sulphde minerals, such as chalcopyrite, is beneficial because it provides 20 g/L of chloride, thereby improving the dissolution kinetics. However, the effect on subsequent solvent extraction depends on the pH value. In electrowinning, chloride content must be controlles to avoid pitting corrosion of the stainless steel cathodes, although a low concentration of chloride ions reduces the grain size of the deposited metal and improves the mechanical properties of the cathode.
THE INSTITUTE, AS A BODY, IS NOT RESPONSIBLE FOR THE STATEMENTS AND OPINIONS ADVANCED IN ANY OF ITS PUBLICATIONS.
Copyright© 2023 by The Southern African Institute of Mining and Metallurgy. All rights reserved. Multiple copying of the contents of this publication or parts thereof without permission is in breach of copyright, but permission is hereby given for the copying of titles and abstracts of papers and names of authors. Permission to copy illustrations and short extracts from the text of individual contributions is usually given upon written application to the Institute, provided that the source (and where appropriate, the copyright) is acknowledged. Apart from any fair dealing for the purposes of review or criticism under The Copyright Act no. 98, 1978, Section 12, of the Republic of South Africa, a single copy of an article may be supplied by a library for the purposes of research or private study. No part of this publication may be reproduced, stored in a retrieval system, or transmitted in any form or by any means without the prior permission of the publishers. Multiple copying of the contents of the publication without permission is always illegal.
U.S. Copyright Law applicable to users In the U.S.A. The appearance of the statement of copyright at the bottom of the first page of an article appearing in this journal indicates that the copyright holder consents to the making of copies of the article for personal or internal use. This consent is given on condition that the copier pays the stated fee for each copy of a paper beyond that permitted by Section 107 or 108 of the U.S. Copyright Law. The fee is to be paid through the Copyright Clearance Center, Inc., Operations Center, P.O. Box 765, Schenectady, New York 12301, U.S.A. This consent does not extend to other kinds of copying, such as copying for general distribution, for advertising or promotional purposes, for creating new collective works, or for resale.
Enhancement of shear flocculation of a galena suspension by ultrasonic treatment
K. Esmeli and A. Ozkan ..................................................................
The enhancement of the shear flocculation of galena by ultrasound in the presence of sodium isopropyl xanthate and potassium ethyl xanthate was investigated. Strong flocculation was obtained under alkaline conditions and at a high ultrasound power level. Although ultrasonic treatment increased the negativity of the zeta potential of the galena particles, this did not decrease the flocculation efficiency, showing that the hydrophobic interactions between particles were stronger than the electrical doublelayer repulsion resulting from xanthate adsorption. The findings indicate that ultrasonic treatment promoted the adsorption of surfactants onto the mineral surfaces.
Ground support guidelines for squeezing ground conditions
J. Hadjigeorgiou and Y. Potvin .............................................................
Further to a benchmarking paper by the same authors, published in 2008, in which significant differences were identified in the design and acceptable tolerance for squeezing ground conditions, this paper reviews the progress in design methodology and ground support practice since then. Improved understanding of technical and practical issues associated with squeezing rock conditions has led to the development of ground support guidelines for a range of squeezing ground conditions in hard rock mines.
R. Matjie, J. Bunt, A. Goosen, K. Mphahlele, and R. Uwaoma ..................................
Coal properties associated with wear and damage to grinding equipment during pulverization prior to combustion were investigated. A South African Highveld coal and its density-sparated fractions were crushed, milled, and screened into <75 µm and >75 µm fractions, which were characterized by various techniques. The results indicated that ash yield, mineral matter, petrographic composition, and fixed carbon content had significant effects on the Hardgrove Grindability Index (HGI). Conversely, inherent-moisture and total sulphur had only minor effects on the HGI.
365
371
381


The African Copperbelt, which stretches some 500 km in length, roughly following the northwest–southeast border between the Democratic Republic of Congo (DRC) and Zambia, contains more than 10% of the world’s known copper deposits, and hosts the highest concentration of industrial activity in sub-Saharan Africa outside of South Africa.
In 1867, Scottish missionary and explorer David Livingstone first described the smelting of ore into copper ingots by people living in the Katanga area, who had known and worked the deposits for centuries. Formal exploitation in the DRC (then Belgian Congo) began when the railway line reached Elizabethville (now Lubumbashi) in 1910, under Union Minière du Haut-Katanga (which was nationalized in 1967 as Gécamines, La Générale des Carrières et des Mines). During the early 1930s, this was the largest copper-producing company in the world. Commercial copper mining in Zambia started in 1909 at Broken Hill, Northern Rhodesia (now Kabwe, Zambia). However, exploitation of these ores has long been one of the most complicated geopolitical and economic questions of the region, not only because of colonial (and later nationalistic) rivalries, but also because of the energy-intensive requirements of smelters—pyrometallurgical processing then being the only known technology for treating copper ores.
The first hydrometallurgical operation, comprising leaching and direct electrowinning, started up at Jadotville (now Likasi) in 1929, producing 30 kt/a of copper cathode. This technology could be economically operated at smaller scale, with a lower energy requirement, and in a less technically demanding environment than the traditional pyrometallurgy route. The Luilu operation started in 1960, with leaching and electrowinning for 150 kt/a copper production, as well as producing cobalt metal. Hydrometallurgical processing of copper oxide ores took a major step forward when the inclusion of a solvent extraction step prior to electrowinning was proven at the Tailings Leach Plant (now Konkola Copper) in Zambia in the 1970s. This technology allowed much higher cathode purity to be obtained than could be achieved by pyrometallurgical processes at that time.
Much of the latter part of the 20th century was characterized by rises and falls of the copper price, nationalization and denationalization of the mining industry in both countries, brutal civil wars, assassinations, abrupt changes of governments, many decades of political and economic instability and corruption, and the DRC falling to rank among the poorest countries in the world. Some stability was finally restored to the region in the early 2000s, prompting a cautious return of investment and industrial activity.
In the past 15 years, the DRC has experienced a huge resurgence of activity, with an impressive proportion of the capital spending, project development, operational expansions, and metal value production in the Southern African mining industry now located in this region. The geology and mineralogy of the deposits differ significantly from those in other major copper-producing regions of the world, the ores often having very high grades as well as the presence of cobalt. Both mining and metallurgy present some unique difficulties, not only technical, but also with respect to logistics, supply chain, and legislative issues; however, the region is blessed with large resources of oxide ores, mainly at relatively shallow depths, and a young, ambitious, and eager-to-learn workforce.
The high-grade oxide ores have enabled relatively rapid construction, commissioning, and ramp-up of numerous Copperbelt hydrometallurgical operations in the past decade to produce London Metal Exchange Grade A copper cathode. There are now nearly fifty production sites in the DRC, where copper cathode output has grown from almost zero in 2008 to 1.77 Mt in 2022, and is anticipated to exceed 2.50 Mt by 2025. More than 70% of the world’s recent new projects are in the DRC, accounting for more than 90% of new copper cathode capacity. Earlier this year, the DRC overtook Chile as the leading global producer of hydrometallurgical copper.
Pyrometallurgical production has not been abandoned, however: Ivanhoe Mining is planning the first new smelter in several decades to treat concentrate at the giant Kamoa–Kakula project in the DRC, which is ranked as the world’s largest high-grade copper deposit. Zambian processing has traditionally also focused heavily on pyrometallurgical routes.
The DRC also produces almost 70% of the world’s cobalt. In the 1960s, the highest-quality cobalt cathode in the world was produced at the Luilu plant near Kolwezi (now Kamoto Copper), which hosted engineers from Japan and the USA who came to learn from the African operations. Today, cobalt production from this region has become highly emotive and politicized: some 20% of the country’s supply is sourced from artisanal miners (estimated to exceed 100 000 in the Kolwezi area alone), often working in highly dangerous conditions and employing child labour. Cobalt is an essential component in many formulations of lithium-ion battery cathodes, considered critical to a low-carbon future; however, the precarious nature of the supply chain is driving technological development towards elimination of cobalt from these batteries. Cooperation and good faith between governments, legislators, multinational mining companies operating in the region, and labour are required to ensure that this window of opportunity for cobalt is not missed.
Despite ongoing difficult environments in the Copperbelt mining industry, industrial investment in this region is accelerating, mainly driven by Chinese-owned companies. To supply energy and electrification requirements to meet global decarbonization and sustainability goals, demand for copper is predicted to increase by some 20% by 2030; estimated cobalt demand is somewhat lower. As a major producer of these critical and strategic metals, the African Copperbelt is now slowly positioning to regain some of its former glory as a technical leader and major player on the world mining stage.
Crooks, S., Lindley, J., Lipus, D., Sellschop, R., Smit, E., and van Zyl, S. 2023. Bridging the copper supply gap. https://www.mckinsey.com/industries/metals-and-mining/our-insights/bridging-the-copper-supply-gap Declercq, R. 2022. Katanga and the American world of copper: mechanization, vertical integration, and territorialization of colonial capitalism, 1900–30. Born with a Copper Spoon: A Global History of Copper, 1830–1980. Declercq, R., Money, D., and Frøland, H.O. (eds). UBC Press, Vancouver. pp. 253–273. Etheridge, L. Not dated. Copperbelt region, Africa. https://www.britannica.com/place/Copperbelt-region-Africa Tinkler, O.S. and Sole, K.C. 2023. Copper solvent extraction on the African Copperbelt: From historic origins to world-leading status. Journal of the Southern African Institute of Mining and Metallurgy, vol. 123, no. 7. pp. 349–356.
K.C. Sole Chair of the Organising Committee: Copper Cobalt Africa 2023 (PhD, PrEng, FSAIMM, FSAAE)
As I looked into the future, I started thinking about exploration projects in South Africa. It made me curious since exploration has an immediate socioeconomic impact on our country’s development. Every R1 billion spent on exploration by mining companies potentially contributes about R1.2 billion to the gross domestic product through direct, indirect, and induced impacts. For example, in 2019, mining contributed 7.8% to the gross domestic product, was the largest earner of foreign revenue, and directly employed 454 921 people. During March 2022, the mining industry marked the second most significant quarter-on-quarter increase of 2% in employment. Commentary in the literature suggests that for each mineworker employed, ten people are directly dependent on mining activity. Without a vibrant exploration sector, the life of our industry will be finite. Even so, it seems that exploration activities in South Africa face quite a few challenges, among which financial challenges are mentioned the most. I would like to quote Roger Baxter, outgoing Minerals Council CEO.

‘In the Toronto stock market, they’ve got 1600 listed junior resource companies. On the Sydney stock market, they’ve got about 600, and on the JSE, there are only about 12. Why the difference? Canadians have got a set of specific incentives that encourage the flow-through of venture capital funding from people from a tax perspective to invest in junior resource mining and their listing requirements are generally small and they raise capital, and they go and find deposits. In South Africa, our investment community are generally conservative and favour big mutual funds. Our return on a liquidated company is about 20c in the rand, whereas in a country like Canada, their liquidation and business rescue rules are quite different, so you get a much higher rate of return if you go into a failed company, even if it’s a junior resource company, which is venture capital funded. For some of the smaller companies, to list on any stock exchange is a very expensive business and the cost-benefit of listing on a stock exchange versus raising private equity capital may be a lot more to do on a stock market, so that’s why many are going the private route, but I think there are lessons we can learn from both Canada and Australia. South Africa’s fiscal framework still does not have the same incentives around encouraging junior resource companies to set up in South Africa or to look for capital in South Africa.’

Corroborating these statements, the literature often mentions lack of exploration investment as a key barrier to greenfield exploration activities in South Africa. Specifically, that the lack of listing of exploration companies on the Johannesburg Stock Exchange (JSE) limits access to resources underpinning exploration activities. The lack of diversity of available fiscal/financial instruments for junior miners is a major risk. The literature also has ample commentary on regulatory and policy matters, very specifically mentioning the existing timeframes for exploration and the principle of ‘first come, first served’ as barriers.
So, what is necessary to move forward and create more opportunity and support
South Africa?
Figure 1 shows that our Minerals Council is interacting directly with Government to promote very important initiatives in our industry. First of all, increasing global market share through a cadastral system that would make it easier to apply for the relevant rights designated in the Mineral and Petroleum Resources Development Act (MPRDA). During March 2023 the Department of Mineral Resources and Energy (DMRE), in collaboration with the State Information Technology Agency, issued a Request for Bids in respect of the design, implementation, maintenance, and support of an online mining licencing system to replace the SAMRAD system. If successful, this system could enhance regulatory certainty in the context of applications, speed, and efficiency of processing and dealing with issues of overlapping applications.
Also, tax incentives are necessary to attract investors into exploration ventures. The Canadians have been highly successful in developing these specialist junior exploration companies, largely by using the flow-through share tax incentive model to attract equity investors into the sector. During October 2020 the Minerals Council, in collaboration with advisors including Fasken, one of the largest business law firms in Canada, submitted a
proposal to the National Treasury regarding the introduction of a local tax incentive based on the Canadian flow-through shares model, proposing tax incentives for purchases of equity in entities undertaking exploration activities.
To address regulatory barriers, there are recommendations on the table for appropriate amendments to the regulatory framework to allow for adequate data collection to enable a qualitative-based system (as opposed to ‘first come, first served’), whereby the processing of applications will be determined based on how best applicants will achieve the objectives of the MPRDA.

In summary, there is plenty of positive activity in our industry at the moment. The Minerals Council has been very active in facilitating engagements between the JSE and its junior, emerging, and exploration members and associations. Samuel Mokorosi from the JSE is attempting to make it easier for companies to get onto, and remain on, the exchange, while ensuring that investor protection is of the highest calibre. For example, the Junior Mining Accelerator Programme, aimed at introducing the smaller companies to financial markets and taking the complexity out of listing on the JSE. Two small black entrepreneurial exploration companies are already on the programme, and both have reported that it has really been beneficial. The Exploration Strategy for South Africa’s Mining Industry (Exploration Implementation Plan), published by the DMRE on 14 April 2022, is intended as a roadmap for us to achieve our objective of reviving South Africa’s appeal and market share in the global minerals sector. South Africa’s share of global exploration activity stood at 5% in 2003, but has now declined to below 1%. This comes at a time when the race for rare earth minerals and minerals of the future is at a critical point, thus making the strategic placement of mineral-rich countries a key focus.
At the time of doing this literature survey, there were some major new projects on the horizon, for example, a project by Hive Hydrogen (a partnership between UK-based Hive Energy and South Africa’s Built Africa) to establish a green ammonia export facility. The plant will be developed for an estimated US$4.6 billion (R70.5 billion) at the Coega Special Economic Zone in the Eastern Cape. The facility is expected to produce approximately 780 000 t of green ammonia per year from hydrogen through a process using renewable energy and nitrogen extracted utilizing an air separation unit. The first phase should start operation in 2025, with full operation planned for 2026. An Australian exploration and development mining firm, West Wits Mining, is looking at an underground gold mine in Gauteng. The DMRE approved the mining right application in July 2021. A scoping study estimates total resources at about 29.1 Mt, an average steady-state annual production of 80 000 ounces for 18 years, and a 22-year life-of-mine. The project will be implemented in five stages. The first, development of the Qala Shallows mining area, is underway following the completion of a feasibility study in September 2021. It is expected to provide a 40% of the total output. The estimated peak funding requirement for this stage is US$50 million (R767 million). In renewable energy, the DMRE has announced 25 projects as preferred bidders, of which 19 projects are led by or include foreign investors, as part of the Renewable Independent Power Producer Programme (REIPPP). These projects have a total estimated investment value of R38 billion and involve four major foreign firms.
I choose to focus on these very positive initiatives and I’m choosing to see a bright future for exploration in the South African mining industry.
Z. Botha President, SAIMMWith the increasing demand for paste backfill systems as part of the overall mining cycle, it is vital that any mine considering implementing a new backfill plant should feel confident that their plant will not become a bottleneck for mining operations. Mine backfill systems have evolved significantly during the last few decades with modernised control systems, process equipment technology advances, and a need to limit the operational costs of placing backfill while maintaining the required strength gain underground.
Implementation of a new backfill system on a mine operation requires a thorough understanding of the material properties of the available tailings as well as the impact on the upstream processes once the paste backfill system starts operating. The process design and equipment selection for the backfill system is of vital importance to ensure that the final plant design will satisfy the original design criteria presented by the mine.
Typically, the paste backfill system will consist of dewatering equipment (thickeners and filters), mixing equipment, binder dosing equipment and pumps (centrifugal and positive displacement). Each piece of equipment forms an integral part of the overall backfill production process and operates in conjunction with each other. The proper selection of the equipment is reliant on material sample test work which is representative of that which they will experience in practice.
Developing a material testing program to support the backfill plant engineering and project development process is an important step before commencing with the test campaign. Typical tests to conduct before the design is undertaken are the basic material properties, dewatering test work, backfill strength test work, rheology (flow behaviour) tests and bulk material handling tests. Additional test work such as conventional pipe loop tests may also be needed should the design include the tailings supply pipeline from the source to the backfill plant. The results of the dewatering test work allow the selection of a suitable filtration technology (typically vacuum or pressure filtration) to achieve the desired moisture content of the tailings before mixing it into the paste backfill. Furthermore, the test results are used to determine the required quantity of filter units to ensure that the design throughput of the system is achieved. The filtration rate of the tailings is dependent on various aspects such as particle size distribution (PSD) and minerology, which will be mine specific. Thickening before filtration is common on backfill plant designs and the correct sizing of the thickener diameter, sidewall height, etc. is also achieved with these dewatering test results.
The backfill strength test results (typically unconfined compressive tests) provide the required dosing rates for the sizing of the binder system to achieve the range of backfill strengths targeted by the mine. Furthermore, the test results allow the designers to collaborate with the client and determine suitable binder storage silo sizes to ensure sufficient capacity is available during upset conditions once operational (such as binder delivery logistical challenges). Rheology (flow behaviour) test work results are used to complete the paste reticulation design, including the positive displacement pump (where the system requires backfill pumping) selection, paste pipeline sizing, pipeline required pressure ratings, coupling selection and underground support designs.
The bulk materials handling tests provide inputs to the design of all conveyors, bins and feeders that form part of the paste backfill system. Bin angles, conveyor speeds, etc., can be confidently selected to accommodate the complete design criteria.
Recently, backfill test campaigns have also started including cemented tailings geomechanical (environmental) tests to ensure underground water is not compromised due to paste backfill leaching unwanted metals once placed underground. These tests are part of the environmental approval process before backfilling can commence.
Test work requires the relevant parties (clients and designers) to communicate the sample requirements well in advance and prior to commencing the test campaign. Some of the sampling challenges that may be experienced can include the obtaining of permits to export a sample if the testing laboratory is outside of the country where the mine is located, limited availability of core drill sampling if the plant forms part of a new mine construction, and non-representative samples being provided to the testing laboratory. In cases like these, the option of doing on-site test work exists. Mobile test equipment can be transported to the mine location and actual on-site testing with representative samples can be conducted.
In conclusion, test work to support engineering is necessary to design a robust, fit for purpose backfill plant and the importance thereof should not be underestimated. Test work is typically undertaken before the detail design commences and can put additional pressure on the project schedule. In the long term though, the cost and time impact of completing test work beforehand far outweighs the challenges that may be encountered with a plant that is not performing to specifications.
Affiliation:
1Departamento de Construcción, Universidad de Atacama, Copiapó 1531772, Chile.
2Faculty of Engineering and Architecture, Universidad Arturo Prat, Iquique 1100000, Chile.
3Regional Center for Research and Sustainable Development of Atacama, CRIDESAT, Universidad de Atacama, Copiapó, Chile.

4Departamento de Ingeniería en Metalurgia, Universidad de Atacama, Chile.
Correspondence to:
A. Nazer
Email: amin.nazer@uda.cl
Dates:
Received: 31 Aug. 2022
Revised: 1 Aug. 2023
Accepted: 1 Aug. 2023
Published: July 2023
How to cite:
Nazer, A., Toro, N., Pavez, O., and Guerrero, J. 2023
Characterization of firebricks used in copper smelting furnaces of the 19th Century, Atacama, Chile.
Journal of the Southern African Institute of Mining and Metallurgy, vol. 123, no. 7. pp. 343–348
DOI ID: http://dx.doi.org/10.17159/24119717/2300/2023
ORCID:
A. Nazer http://orcid.org/0000-0002-0176-2344
N. Toro http://orcid.org/0000-0003-4273-3563
O. Paves http://orcid.org/0000-0001-5720-351X
J. Guerrero http://orcid.org/0000-0002-0867-7070
Synopsis
In the 19th century, mining in northern Chile was of great economic importance. Today, the ruins of the copper smelters and abundant fragments of refractory bricks from their furnaces remain. The refractory materials have not been previously studied. the origin, physical and chemical properties, and compressive strength of 10 different samples of historical refractory bricks collected on-site were investigated. The characterization results showed that the bricks are silico-aluminous, unlike the magnesium-chromium bricks used by current foundries. It was determined that 90% of them were produced in the UK and 10% were manufactured in Chile. The phases present are mullite, quartz, cristobalite, and tridymite, and the chemical composition corresponds mainly to SiO2. The compressive strength of the historical bricks is similart to those currently used,. These results may contribute to the knowledge of the 19th century mining and metallurgical historical heritage of Chile and the UK.
Keywords
characterization; firebrick; non-destructive testing; 19th-century smelting; cultural heritage.
Introduction
In the 19th century, the so-called Norte Chico region, nowadays comprising the Atacama and Coquimbo administrative regions, played a fundamental role in the Chilean economy due to its outstanding mining and metallurgical production (Pérez et al., 2021). In northern Chile, valuable secondary veins containing copper-rich minerals were found. On the surface, oxidized copper minerals such as chrysocolla, malachite, and atacamite, were present. However, at greater depths, the richness of the deposit lay in abundant copper sulphides, such as chalcopyrite, chalcocite, and covellite. In the 19th century, the ores exploited were of high grade and were treated by direct smelting. The copper-rich material was sorted manually since mineral concentration technologies did not exist at that time.
In previous studies, the authors located 41 copper smelters in the Atacama Region, which were active during the 19th century and a few until the first decade of the 20th century (Nazer et al., 2016).
The growth of these metallurgical centres gave rise to settlement that housed the mining workers and their families, and which included facilities for commerce, religious worship, art and culture, education, transport (rail links), cemeteries, and offices (Sernageomin, 2020; Toro, et al., 2021). The copper produced was mainly exported to the UK. The copper boom caused a remarkable increase in the population of Atacama, going from 2 000 to 24 000 inhabitants between 1803 and 1872. During the period from 1843 to 1872, the region generated a total income close to 200 million Chilean pesos, with more than half of this amount resulting from exports of copper bars, minerals, and primarily anodes. At the beginning of the 1830s in the province of Huasco, perhaps the most important development in copper mining was the introduction of reverberatory furnaces to replace the sleeve furnace. Reverberatory furnaces required specialized work and the incorporation of new refractory materials (Venegas, 2007).
Nazer et al. (2016) identified four types of copper smelting furnaces that were used in the northern Chile in the 19th century:
➤ ‘Modern system’ reverberatory furnace, in which several of these furnaces were served by a single chimney
➤ ‘Ancient system’ reverberatory furnace, each with its own chimney
➤ Calcination furnace, used to eliminate volatile elements from the mineral concentrates
➤ Sleeve or wind furnace, which used a bellows to improve combustion. This is a clay furnace, of low efficiency, and consumes a considerable amount of firewood.
According to Aracena (1884), the copper smelting process typically involved three successive smelting stages, with an ore feed containing up to 13% copper. The first smelting produced a matte containing 43 to 45% copper, which then underwent a second fusion to increase the grade to 68–70% copper. The third and final smelt produced bars with a purity of 98–99%. This metallurgical process was known as the ‘ancient system’. The average time for the first and second smelts was normally 5¼ hours, while the third smelt took between 27 and 28 hours. Later, a radical innovation reduced the successive smelting stages to just two, resulting in a significant time saving in the production of copper bars. This smelting process was called ‘Napier's improved system’, or ‘reformed system’. Based on historical statistics, Nazer et al. (2016) estimated that approximately 6 t of copper ore and 5 t of coal were needed to obtain 1 t of copper with a purity of 96-97% using the reformed system.
The fusion temperatures in the furnace reached approximately 1200°C. Nazer et al. (2016) studied four samples of copper slags from dumps in the Atacama Region. The slags were chemically classified as acidic slags and consisted mainly of SiO2 (38–49%), Fe2O3 (18–37%), CaO (8–26%), and Al2O3 (5–8%). The mineralogical compositions and structure showed diversity; one sample was amorphous, while the other three had a crystalline structure with some amorphous character. The major mineral phases were diopside, fayalite, magnetite, cristobalite, and clinoferrosilite.
The fall in international mineral prices from 1874 (MemoriaChilena, 2021), together with the inefficient extraction techniques and dependence on foreign capital, created increasing problems for copper mining, which resulted in the closure of numerous operations. In 1879, Chile accounted for 30% of world copper production; in 1890, 9.7%; and, in 1900, only 5.5% (González, et al., 2016). Several factors contributed to this decline, including changes in global copper demand, competition from other copper-producing countries, the growing economic significance of nitrate production, depletion of deposits, the War of the Pacific between Chile and the Peru-Bolivian Confederation, lack of capital, and technological stagnation (Mamalakis, 1967). The inhabitants abandoned the mining towns, which gradually fell into decay.
Few vestiges of copper smelting remain today, and these remnants coukd totally disappear in the future. Figure 1 shows the ruins of a smelter, with only the chimneys remaining standing. These chimneys, the only examples of their kind, have been declared a National Monument of Chile, in the category of Historical Monument (Consejo de Monumentos Nacionales de Chile, 1996).

Among the residues found in the abandoned mining settlements are a great variety of refractory bricks that were used in the copper smelting furnaces, which are mostly broken, with the manufacturers’ names partially or totally missing(see Figure 2). Until now, no studies have been reported that characterize these bricks. The objective of this research was to characterize 10 different types of refractory bricks (Figure 3), using various laboratory techniques to determine the chemical and mineralogical composition, mechanical resistance by a non-destructive method, the density, and in addition to identify the manufacturers. The results of this study can contribute to the knowledge of these materials that are a significant part of the Chilean mining and metallurgical heritage
Refractory bricks were collected from abandoned mining settlements in the Atacama Region, particularly from the towns of Púquios, Pan de Azúcar, Playa Negra, Totoral, Carrizal Bajo, Llanos de Challe, Canto del Agua, Vizcachitas, and Agua Amarga. The bricks collected were in small pieces with the manufacturer's mark printed in bas-relief; smaller quantities of whole bricks were also obtained. The samples were bagged and identified according to their origin and transferred to the laboratory of the Department of Construction at the University of Atacama. The bricks were cleaned by careful brushing to prepare them for physical, chemical, mineralogical, and mechanical characterization.
Refractory bricks were identified by the manufacturer's mark engraved on one of their faces. Subsequently, several bricks of the same brand were selected. An internet search was carried ou to find information about the manufacturers.
Among the large number of refractory brick fragments collected in situ, several carrying the same manufacturer’s mark were found in different mining settlements of the 19th century, so it was

the range 1.46 to 1.99 g/cm3 for the brands Tcarr and Glenboig, respectively.
The chemical analyses are presented in Table III. In general, the bricks containedavery high percentage of SiO2 and Al2O3. The Rufford Stourbridge brick had the highest SiO2 content with a value of 66.90%, while the Barlinnie brick contained 31.25% Al2O3. The bricks in general had a low content of CaO, MgO, and Fe2O3. Given the high values of SiO2 and Al2O3 that the bricks present, they would be classified as the aluminous silica type.
The results of the compressive strength tests of the bricks are presented in Figure 4. The maximum values were obtained for the Rufford Stourbridge and Glenboig bricks, at 41.92 MPa and 40.47 MPa, respectively, while the minimum values was for Garnkirk at 18.79 MPa. The strength of the Ramsay and Garnkirk Patent bricks was 23.13 MPa.
assumed that these were widely used bricks. Of the total samples, only 10 different types were selected and bearing the following manufacturer's marks: Barlinnie, Garkirk, Garkirk Patent, Glenboig, Hannington, Lota, Ramsay, Rufford Stourbridge, Skinner, and Tcarr.

To obtain the samples for characterization in the laboratory, a part of each refractory brick was broken off and ground in a disk pulverizer to a particle size less than 0.075 mm (–200#). The powders obtained were chemically analysed by atomic absorption spectr ometry(Shimadzu 6601F).
The mineral species in the refractory bricks were aidentified by X-ray diffraction (Brucker D8 Advance). Real density was determined by the pycnometer method. The apparent density, on the other hand, was determined on the complete sample according to the NCh 116:2008 method (Instituto Nacional de Normalización, 2008) using an electromechanical scale with a capacity of 6 kgf. To obtain the resistance to compression, the Schmidt hammer (Proseq brand) was used according to the Chilean standard NCh1565:2009 (Instituto Nacional de Normalización, 2009), which is a non-destructive method used to determine the compressive strength of rock samples and construction materials such as concrete. The instrument was calibrated, and to determine the reliability of the results, modern refractory bricks were tested, which had been tested by the destructive method required by current regulations. The procedure applied was as follows: the historical brick samples were polished with a polishing stone, and then the Schmidt hammer was used in a direction perpendicular to the brick surface. In each determination, 20 strokes are applied in different areas of the sample to obtain results with a statistically reliable mean. The values obtained were corrected using the manufacturer's table of values.
The identification of refractory bricks collected in situ was carried out visually on those specimens on which the manufacturer's mark could be easily read. For those brick fragments where identification was not evident, a rigorous internet search was carried out. The origin and manufacturer of the bricks are listed alphabetically in Table I.
The real and apparent densitues of the refractory brick samples are shown in Table II, The real density of the samples varies between 2.57 and 2.76 g/cm3, for the Hannington and Rufford Stourbridge brands, respectively, while the apparent density is in
The mineralogical analysis showed that the phases present consisted of mullite (Al4.56 Si1.44 O9.72), quartz (SiO2), cristobalite (SiO2), and tridymite (SiO2). The relative abundances of the phases are shown in Table IV.
The difference in compressive strength observed between the different bricks would be related to the compaction method of the fresh clay mortar before firing. On the other hand, the compressive strength values can be related to the apparent densities shown in Table II, from which it can be deduced that bricks with a low apparent density have a higher porosity, which adversely affects thw final strength. On the other hand, bricks may have suffered from microcracking due to thermal shock. Refractory materials are formulated to withstand rapid changes in temperature without fracturing. However, when subjected to repeated cycles of heating
Table I
Identification of the refractory bricks studied
Mark Manufacturer Country
Barlinnie William Wilson, Glasgow. Scotland
Garnkirk, Garnkirk Patent
Garnkirk Fireclay Works, Garnkirk, Lanarkshire Scotland
Hannington Hannington and Company, Swalwell, Durham England
Lota Refractarios Lota-Green Limitada, Lota Chile
Ramsay G. H. Ramsay, Derwenthaugh, Gateshead, Durham England
Rufford
Stourbridge Rufford & Co. Stourbridge, Dudley England
Skinner J H Skinner & Co., Marshall-Green Colliery, Witton le Wear, Co.,Durham England
Tcarr Thomas Carr & Son, Newcastle-onTyne England
and cooling, especially if they occur rapidly, microcracks and fissures can arise in the material. These microcracks can weaken the brick's structure over time and affect its performance and durability in high-temperature applications. Moreover, these microcracks or fissures can provide pathways for the entry of gases or liquids into the interior of the brick, which could increase its porosity, consequently impacting its strength and durability. Today's refractory bricks differ from the studied bricks in their chemical composition and mineralogy. The refractory bricks analysed in this study are composed of a high percentage of SiO2 and Al2O3 and can be classified as aluminous silica bricks. The different chemical compositions of the old refractory bricks
Real and apparent densities of refractory bricks studied
Abundance of mineralogical phases in the refractory bricks studied
Table III
Chemical composition of the refractory bricks studied
and those used currently would be related to the type of material smelted. The current grades, with low concentrations of valuable minerals and higher content of gange minerals, require higher temperatures for smelting, necessitating more resistant refractories, regardless of the furnace design. During much of the 19th century, the sleeve furnace was used, which could only process the oxidized minerals in the upper part of the copper deposits; when sulphide minerals were treated, a brittle mixture called ‘sandstone’ resultes, which was discarded as slag (Memoria Chilena, 2021; Folchi, 2001). Later, at the end of the 19th century, the reverberatory furnace, which was able to treat sulphide ores, replaced the sleeve furnace. Therefore, the metal product, as well as the slag, was different from those currently produced in copper furnaces. Possibly, given the metallurgical characteristics of the minerals treated in the sleeve furnaces, refractory bricks were required that were mainly composed of SiO2 and Al2O3, very different from the current ones, which are mainly composed of MgO and Cr2O3 (Table V). On the other hand, according to information on the real density and compressive strength of current refractory bricks (C. Contreras, Engineer at Empresa Nacional de Minería, personal communication) the compressive strength of current refractory bricks ranges from 16 to 39 MPa, while the bricks studied are in the

Table V
Chemical composition (%) of refractory Bbricks used in a current copper smelting (data from: (Lizana, 2018); (Sernageomin, 2020)
range 19 to 42 MPa. A similar situation occurs with the true density, 2.57–2.71 g/cm3 for old bricks and 3.0–3.2 g/cm3 for current bricks. The bricks sampled in this study primarily consisted of SiO2–Al2O3 and showed no signs of contact with slag and matte. Their surfaces were remarkably clean without any crystallized residues resulting from mineral fusion.
Ten types of refractory bricks that were used in 19th century copper smelting furnaces in the Atacama Region of Chile were studied. The samples were found at different sites in the region, so it could be assumed that they were common at the time. Almost all of the bricks studied came from factories in the UK, five of them from England, four from Scotland, and only one from Chile. The chemical characterization indicated that in the bricks are aluminous silica, unlike the refractory magnesia-chrome bricks currently used in copper smelting furnaces. The mineralogical characterization showed a predominance of mullite, cristobalite, and quartz. The apparent densities were in the range 1.46 to 1.99 g/ cm3. The resistance to compression, measured by means of a nondestructive test, was in the range of 18.8 to 41.9 MPa.
No characterization studies have been published on these refractory bricks to date. The results obtained in this study may contribute to the historical heritage of 19th-century mining in Chile.
The authors declare they have no conflict of interest.
The authors thank the Office of the Vice Dean for Research and Postgraduates of the University of Atacama for financing the DIUDA Regular Project N° 22342/2017.
Aracena, F.M. 1884. Apuntes de viaje. La industria del cobre en la Provincias de Atacama y Coquimbo. Valparaíso, Chile.
Consejo de Monumentos Nacionales de Chile, 1996. Decreto Exento n. 357 de Las Chimeneas de Labrar Amplía y fija límites, 2021. https://www.monumentos. gob.cl/servicios/decretos/357_1996
Consejo de Monumentos Nacionales de Chile, 2021. Monumentos Nacionales. https://www.monumentos.gob.cl/
Cochilco, 2020. Base de datos del cobre. [Online]. Available: http://www.cochilco. cl:4040/boletin-web/
Kitching, D. 2021. Old Bricks - history at your feet. https://www.brocross.com/ Bricks/Penmorfa/Pages/england20.htm
Kitching, D. 2021. Old Bricks - history at your feet - Foreign bricks. https://www. brocross.com/Bricks/Penmorfa/Pages/foreign.htm
Folchi, M. 2001. La insustentabilidad de la industria del cobre en Chile: los hornos y los bosques durante el siglo XIX. Rev. Mapocho, vol. 49, pp. 149–175
González, S., Richard, N., Figueroa, V., and Godoy Orellana, M. 2016. Minería en el desierto de Atacama, no. 52.
Instituto Nacional de Normalización. 2008. Norma chilena NCh1116:2008. Áridos para morteros y hormigones - Determinación de la densidad aparente. Santiago.
Instituto Nacional de Normalización, 2009. Norma chilena NCh1565:2009. Hormigón - Determinación del índice esclerométrico. Santiago.
Lizana, D. 2018. Análisis del efecto en los refractarios de convertidores Pierce Smith al adicionar ‘CaO’ y ‘Al2O3’ en las escorias de conversión. Universidad Técnica Federico Santa María
Mamalakis, M. 1967. The American Copper Companies and the Chilean Government, 1920–1967: Profile of an Export Sector. Discussion paper no. 45, Yale University Economic Growth Center, New Haven, Connecticut.
MemoriaChilena. 2021. Capitalismo minero y expansión económica en el Norte Chico: Los ciclos mineros del cobre y la plata (1820-1880). http://www. memoriachilena.gob.cl/602/w3-article-727.html#presentacion
Mosier, D.L. 2021. Imported and out-of-state bricks-Hannington. https://calbricks. netfirms.com/brick.hannington.html
Mosier D.L. 2021. Imported and out-of-state bricks- TCARR. https://web.archive. org/web/20191223120842/https://calbricks.netfirms.com/brick.tcarr.html
Nazer, A., Payá, J., Borrachero, M.V., and Monzó, J. 2016. Caracterización de escorias de cobre de fundiciones chilenas del Siglo XIX. Revista de Metalurgia vol. 52, no. 4. p. 083.
Nazer, A. 2016. Caracterización y determinación de las propiedades cementantes de escorias de cobre del siglo XIX de la Región de Atacama, Chile para su uso en construcción, Doctoral theses. Universitat Politècnica de València, Valencia, Spain.
Pérez, K., Toro, N., Gálvez, E., Robles, P., Wilson, R., and Navarra, A. 2021. Environmental, economic and technological factors affecting Chilean copper smelters – A critical review. Journal of Materials Research and Technology vol. 15. pp. 213–225.
Sernageomin. 2020. Datos Públicos Depósito de Relaves. https://www.sernageomin. cl/datos-publicos-deposito-de-relaves/
Scotland’s Brick and Tile Manufacturing Industry. 2021a. Barlinnie. https:// www.scottishbrickhistory.co.uk/barlinnie/
Scotland’s Brick and Tile Manufacturing Industry. 2021b. Garnkirk. https:// www.scottishbrickhistory.co.uk/garnkirk-3/
Scotland’s Brick and Tile Manufacturing Industry. 2021c. Garnkirk Patent. https://www.scottishbrickhistory.co.uk/garnkirk-patent/.
Scotland’s Brick and Tile Manufacturing Industry. 2021d. Glenboig. https:// www.scottishbrickhistory.co.uk/glenboig-2/
Scotland’s Brick and Tile Manufacturing Industry, 2021e. Ramsay. https:// www.scottishbrickhistory.co.uk/ramsay/
Sellos Extranjeros. 2021. Gran Bretaña (en Ruso), Heddon. http://www.vsmirnov.ru/brit7.htm
Sernageomin. 2020. Anuario de la Minería de Chile 2020. Servicio Nacional de Geología y Minería, Santiago.
Toro, N., Ghorbani, Y.N., Turan, M.D., Robles, P., and Gálvez, E. 2021. Gangues and clays minerals as rate-limiting factors in copper heap leaching: A review. Metals Basel, vol. 11, no. 10. p. 1539.
Venegas, H. 2007. Auge y Caída de la Minería Chilena del Cobre. ¿Una Historia que se Repite? Contribuciones. Científicas y Tecnológicas. pp. 6–19. u


Through GIW® Slurry Pumps, KSB is an innovative partner that provides you with the best and longest wearing slurry solutions. We are your partner over the entire lifecycle of your GIW® slurry pump.

KSB Pumps South Africa is a globally recognized pu mp solutions provider that manufactures globally recognized products locally to the highest quality standards both internationally and locally.
We not only manufacture and service your slurry pumps, we offer total slurry solutions to your industry.
One team - one goal.
KSB Pumps and Valves (Pty) Ltd


Tel: +27-11-876-5600
www.ksb.com/en-za
Level 1 B-BBEE Supplier

O.S. Tinkler1 and K.C. Sole2
Affiliation:
1Solvay, Phoenix, Arizona, USA.
2Sole Consulting, Johannesburg, and University of Pretoria, Pretoria, South Africa.
Correspondence to: K.C. Sole
Email: kathy@soleconsulting.co.za
Dates:
Received: 3 Jul. 2023
Revised: 26 Jul. 2023
Accepted: 2 Aug. 2023
Published: July 2023
How to cite:
Tinkler, O.S. and Sole, K.C. 2023
Copper solvent extraction on the African Copperbelt: From historic origins to world-leading status.
Journal of the Southern African Institute of Mining and Metallurgy, vol. 123, no. 7. pp. 349–356
DOI ID: http://dx.doi.org/10.17159/24119717/2906/2023
ORCID:
O.S. Tinkler: http://orcid.org/0009-0004-4367-2234
K.C. Sole: http://orcid.org/0000-0003-4707-1060
Synopsis
Approximately 20% of current world copper cathode output is produced using a hydrometallurgical process route, generally referred to as the leach–solvent extraction–electrowinning flowsheet. Since its commercialization in the late 1960s, steady improvements in the performance and efficiency of the solvent-extraction reagents and equipment, combined with significant developments in leaching and electrowinning, have made an ever-widening range of ore types amenable to this technology. Following successful implementation on all major continents, a large proportion of growth in recent years derives from the re-emergence of copper solvent extraction in the Central African Copperbelt. This review provides a brief history of the development and evolution of copper solvent extractants and mixer-settler contactors, and the significance of the Copperbelt region in achieving commercialization and acceptance of the technology. The opportunities and challenges presented by the abundant high-grade oxide ores of the Copperbelt are contrasted with the processing of solutions derived from the low-grade mixed oxide–sulfide ore bodies that are prevalent in other geological regions. The current status of hydrometallurgical copper production in the African Copperbelt, within a global context, and a medium-term outlook for the technology are discussed.
Keywords
copper, solvent extraction, review, history, African Copperbelt, Zambia, Democratic Republic of Congo.
Introduction
Prior to the development and commercialization of solvent extraction (SX) as a hydrometallurgical unit operation, copper was recovered from dilute acid leach solutions either by cementation using scrap iron or by direct electrowinning (EW). The leach–cementation process (Equations [1] and [2]) requires large amounts of acid. Other shortcomings include limited markets for the low-quality copper product and the relatively high cost of scrap iron.
Leach: CuO + 2 H+ → Cu2+ + H2O [1]
Precipitation on scrap iron: Cu2+ + Fe → Cu + Fe2+ [2]
As an improvement to this process, recovery of copper by direct EW (Equation [3]) from an impure pregnant leach solution (PLS) has the advantage that acid generated in the spent electrolyte in the EW step can be recycled back to the leach.
Electrowinning: Cu2+ + H2O → Cu + 2 H+ + ½ O2 [3]
The downside is that, even if the copper tenor is high (> 40 g/L), impurities, such as Mn and Fe, build up in the PLS with each leach cycle, which reduces current efficiency and copper cathode quality. To control these elements, a portion of the copper-stripped solution (spent electrolyte) has to be bled out of the process, making the process less economical and introducing potential environmental risks.
The development of copper SX in the mid-1960s changed everything. Direct production of London Metal Exchange (LME) Grade A/AA copper cathode became possible, and the hydrometallurgical flowsheet now known as leach–SX–EW steadily became the default process for copper recovery from oxide ore bodies and existing stockpiles (Schlesinger et al., 2021). At the heart of the process lie the copper-selective extraction reagents that make it all possible.
By the late 1950s, the new technology of liquid–liquid extraction or SX had been commercialized for uranium recovery at Buffelsfontein in South Africa (Sole et al., 2011) using tertiary amine extractants
developed by General Mills1. General Mills had also developed amine systems for extraction of V, Mo, and W from alkaline systems, so there was interest in extending this new technology to other metals. Joe House, who later rose to the position of Vice President of General Mills Chemicals, can be regarded as the ‘father’ of copper SX. General Mills had the foresight and generous policy of allowing its scientists to work one day per week on anything that they were interested in (so-called ‘bootleg projects’), and so it was that Joe House (Figure 1), together with colleagues Don Agers and Ronald Swanson, took on the task of developing an extractant that would be able to recover copper from leach liquors generated from the leaching of low-grade oxide ores and that could not be profitably treated using existing technologies (House, 1985; House, 1989).
The first reagent was LIX 63, an aliphatic hydroxyoxime (Figure 2a), so-called because it was developed in 1963, where LIX stood for liquid ion-exchanger2. Although this extractant was very selective for Cu, it only operated above pH 5, so was unsuitable for treating acidic leach liquors, which typically have 0.7 < pH < 2.2. KELEX 100 (Figure 2b), an 8-hydroxyquinoline structure developed by Shering Berlin, extracted copper below pH 2, but co-extracted considerable amounts of acid. In 1965, LIX 65 became available (Figure 2c): incorporation of aromatic rings into the oxime structure provided an electron-withdrawing effect that allowed copper to be extracted at lower pH values. This reagent operated at about pH 2.5, but it occurred in two isomeric structures: only the anti-isomer could form a complex with copper. However, when used in a continuous extraction–stripping process, complexation with Cu would isomerize all the syn-isomers to the desired anti configuration. Shortening the alkyl sidechain from C12 to C9 (LIX 65N; N for nonyl) (Figure 2d) improved the kinetics. LIX 64 was the first extractant to be commercially employed, comprising a mixture of LIX 65 (40% by mass) with LIX 63 (2%), which acted as a catalyst for copper loading.

Several different blends and other novel copper extractants were tested, but it was the breakthroughs of the C9 ketoxime and C9 aldoxime that ultimately formed the basis of almost all modern extractants. The C9 ketoxime was invented by Shell and marketed as SME 529 (2-hydroxy-5-nonyl-acetophenone oxime (Figure 2(e)) (van der Zeeuw, 1972). The SME 529 technology was purchased by Henkel in 1984 (Kordosky, 2002) and its properties were greatly improved using a new manufacturing process: the resulting product was marketed as LIX 84I. The C9 aldoxime was ACORGA’s P-1
1A question that may be asked is how a food company, General Mills, ended up producing chemicals for use in the mining industry? The processing of a variety of grains and oil seeds into food products resulted in plant fats and oils as byproducts, for which useful applications were sought. Some of the fatty alcohols were ideal for conversion to amines, from which flotation reagents were first developed and later liquid anion-exchangers for solvent extraction. The tertiary amine derived from a mixture of C8 and C10 fatty alcohols was found to be the ideal blend for extraction of uranium, and later became known as Alamine 336.
2LIX is a registered trademark of BASF.
3ACORGA is a registered trademark of Solvay.
(5-nonyl salicylaldoxime (Figure 2f), later known as P-503. A C12 variant of ACORGA P-1 was later developed by Henkel following successful commercialization of C9 aldoxime-based formulations. Today’s copper SX extractants include blends of C9 ketoxime with C9 aldoxime (e.g., LIX 984N); blends of C9 aldoxime with an equilibrium modifier (e.g., ACORGA M5774), and blends of C9 ketoxime, C9 aldoxime, and an equilibrium modifier (e.g., ACORGA OPT5540). Interestingly, the first generation of copper extractants cost around US$ 5.80 per kilogram in 1972 (Price and Tumilty, 1972), which, adjusted for inflation, is about US$ 42 per kilogram today: for context, modern extractants are priced from US$ 15 per kilogram.
If Joe House is regarded as the father of copper SX, every newborn needs a midwife to assist its passage to an independent life: Maxie Anderson can then be regarded as the ‘doula’ of copper SX. Max Leroy Anderson (Figure 3) was an extremely wealthy, larger-thanlife character, who is more well known for making the first crossing of the Atlantic Ocean and North America by hot-air balloon, for which he was awarded the US Congressional Gold Medal (Wikipedia, n.d.). In addition to a wine farm, Maxie Anderson owned a small copper mine in Arizona, which was producing low-grade solution by heap leaching with copper recovery by iron cementation. Not having to account to a board of directors—and always up for a challenge, he took the risky step of introducing a radically different technology into an industry in which the basic methods of making copper had not changed significantly since the Bronze Age (Monhemius, 2014), installing the first commercial copper SX–EW plant at Ranchers Exploration and Development Corporation’s Bluebird Mine in 1968, using LIX 64 as the extractant4. Ken Power, a strong proponent of liquid–liquid extraction of copper, was hired as Rancher’s General Manager, and the first solution was run through the plant in March 1968. Design production of 30 000 pounds per day (13.6 t/d or 4500 t/a) was reached a few months later (miningfoundationsw.org). The SX plant had three extraction stages and two strip stages, and processed a leach solution containing approximately 1 g/L Cu (Flett, 1974). The plant was originally planned to have a eleven-year life, but, owing to the lower-than-expected cost and better-than-expected product quality, continued to operate until 1982, producing in total almost 80 000 t Cu by SX–EW (Anon., n.d.).
4As a quirky footnote to history, Kordosky (2002) reports that initial industry reception of this new technology was hostile: when the R&D director of a large US copper producer predicted at an AIME Annual Meeting that there would never be a pound of copper produced using SX, his comment prompted applause.

Joe House was elected to the US National Academy of Engineers in 1997 for ‘developing and applying solvent-extraction processes for copper recovery from low-grade ores.’ Tragically, Maxie Anderson was killed at age 49 while ballooning in the Alps, but not before he was inducted into the US National Mining Hall of Fame. The African Copperbelt and the rise of copper leach–solvent extraction–electrowinning

After commercialization of leach–solvent extraction–electrowinning (L–SX–EW) at Bluebird, several new acid-leach SX–EW operations were built in quick succession, notably at Bagdad Mining Company in Arizona in 1970, at Nchanga Consolidated Copper Mines Tailings Leach Plant (TLP) in Chingola, Zambia, in 1973 (Holmes and Fisher, 1972; Holmes et al., 1976), and at Anaconda Co. Twin Buttes in Arizona in 1975 (Flett, 1974). Steady adoption continued through the 1970s and began to accelerate in the 1980s with successful implementation at Sociedad Minera Pudahuel’s Lo Aguirre plant in Chile (Lynch et al., 1995), at Miami and ASARCO Ray in Arizona, and at several Phelps Dodge properties in the USA (Dresher, 2001). Through the 1990s, implementation dominated in Chile, where production grew more than tenfold from 1991 to 2001 (Bartos, 2002).
Wide adoption of L–SX–EW in Central Africa could easily have pre-dated that in Chile, but for political upheaval in the region in the 1970s (Declercq, 2022). Tenke Fungurume (TFM) epitomises early potential challenges and rewards of operating in this region. One of the world’s largest and richest known copper reserves, flowsheet development started in the 1970s following demonstration of SX–EW technology at Rancher’s Bluebird Mine. In 1974, La Société Minière de Tenke Fungurume (SMTF) awarded the contract to General Mills to supply LIX 65N as the extractant. In 1976, however, after SMTF had invested more than US$ 240 million in the project and General Mills had produced more than 50% of the first-fill extractant requirement, civil war broke out in (then) Zaire and the entire project was abandoned. General Mills eventually sold the extractant stock to the Nchanga TLP project. In 2009, Freeport McMoRan Copper and Gold reopened the Tenke plant and—33 years later—General Mills’ successor, Cognis, eventually supplied LIX 984N for the first fill of the new SX–EW plant (Cognis, 2008).
After a troubled 40-year period from the early 1970s to the early 2000s, peace finally came to the Democratic Republic of Congo (DRC). The first L–SX–EW operations were not far behind: the first copper cathode was produced in 2008 at Metorex’s Ruashi plant (Metorex, 2008) and Chemaf’s Usoki plant (Shalina Resources, n.d.). As critical road, power, and water infrastructure steadily improved, new operations began to spring up around the towns of Lubumbashi, Likasi, and Kolwezi: the DRC’s growth spurt had finally begun. In Zambia, SX–EW adoption was re-ignited after privatization of Zambia Consolidated Copper Mines (ZCCM) in 1996, peaking at 260 kt in 2008 (Solvay records), although total Zambian copper output (with concentrate and smelter production) reached 765 kt in 2012 (Sikamo et al., 2015).
As SX equipment design advanced and increasingly more efficient extractants were developed, operations became larger and

more cost effective. An excellent illustration of this is a comparison between the Nchanga TLP plant, commissioned in 1973 (Figure 4), First Quantum Minerals’ Kansanshi SX3 Plant, commissioned in 2004 (Figure 5), and TFM Phase I, commissioned in 2009. As shown in Table I, modern SX settlers are wider and shorter than early designs to accommodate higher flows, which results in higher settler flux but reduced organic velocity.

A comparison of the US, Chile, and DRC cathode growth periods (Figure 6) shows just how rapidly a mature technology can be implemented, under the right conditions. L–SX–EW technology was well established in the USA before adoption began to accelerate in Chile in the early 1990s as the full economic benefits over the traditional cementation process became apparent (Bartos, 2002). The growth rate in the DRC over the last 15 years closely mirrors that of Chile in the 1990s. SX–EW production of copper cathode in the DRC has recently surpassed that of Chile, where production has declined over the last decade as oxide ores have been depleted. Chilean copper cathode production in 2022 was just 1.5 Mt (Chilean Copper Commission, 2018), compared with 1.7 Mt in the DRC for the same period (Anon., 2023).

A high-level L–SX–EW flowsheet is shown in Figure 7. Extraction of Cu(II) ions from the PLS generates acid in the SX raffinate, which is recycled back to the leach to dissolve more copper; the stripping reaction consumes acid, which is provided by recycle of the spent electrolyte from EW to the SX circuit as the strip liquor. This flowsheet represents an almost-perfect closed-loop hydrometallurgical process: essentially acid generated by the

decomposition of water is used as the lixiviant for copper. The only additional acid required is for the co-leaching of non-copper minerals.
The variety of leach technologies employed today produce PLS with wide ranges of copper concentration, pH, and impurity content, as illustrated in Table II. To ensure consistent production of LME Grade A/AA copper cathode, copper EW has stringent specifications for the advance electrolyte: 45–50 g/L Cu, approx. 150 g/L H₂SO4, < 2 g/L Fe, < 0.1 g/L Mn, and approx. 30 mg/L Cl. The versatility of modern copper extractants is such that the input stream to SX can vary widely in composition, but a consistent output stream, suitable for production of LME Grade A cathode, is nevertheless generated.
Typical copper concentrations in the pregnant leach solution produced by different commercial leaching technologies Leach technology Cu in PLS
Region Leach technology Primary impurities
North America Dump, heap, vat, in situ, pressure Fe, Mn
South America Heap, vat Fe, Mn, Cl, NO3
Central Africa Agitation, pressure Si, Ca, Co, Mn
To appreciate the remarkable versatility of the L–SX–EW process, it is useful to examine a range of regional characteristics in the main centres where the technology is practised. These include mineralogy, leach technologies, impurities, and climate. A summary is shown in Table III.
North American production is concentrated in the US states of Arizona and New Mexico, and the Northern Mexico state of Sonora. The mines are located in dry, arid areas with summer temperatures as high as 45°C. This is the most mature region for this technology, so the higher-grade oxides ores have long been depleted: most operations now leach low-grade oxide along with low-grade secondary and primary sulfides. The sites are all heap and/or dump leach operations that utilize permanent heaps, rather than the on–off leach pads that are more typical in South America. A thin-layer acid cure is commonly employed to increase leach recovery. Several in-situ leach operations are also under development in Arizona (Seaman et al., 2019). The PLS are typified by low Cu (0.3–3 g/L), high Fe (3–15 g/L), high Mn (1–3 g/L), pH in the range of 1.0–2.5, and temperatures in the range of 5–35°C. Pressure leaching of copper concentrates is commercially practised at Morenci in the USA (Marsden et al., 2007a; Marsden et al., 2007b). The pressure leach PLS contains high levels of both copper and acid (Table II) that are diluted by blending with the heap leach PLS before processing by SX–EW (Green et al., 2018).
Most SX circuits employ a series–parallel flow configuration to allow for high PLS throughput to maintain copper production from the low-tenor feed. The raffinate stages may operate in aqueouscontinuous mixing mode and there is emphasis on organic recovery, such as by increased retention time in the raffinate pond and use of equipment such as pace setters, Jameson cells, and pond skimmers. Typical extractant consumption ranges from 2–5 kg/t cathode.
The South American operations mainly process oxide deposits with an acid-soluble copper grade ranging from 0.4–0.8% by heap leaching. Many are located in the Atacama Desert, where atacamite (Cu2Cl(OH)3) is a common regional mineral, the leaching of which results in elevated levels (1–30 g/L) of chloride in the PLS. Owing to a lack of fresh water, as well as benefits in leaching, several operations now leach in sea water (approx. 20 g/L Cl) and there is a trend towards use of much higher salinity—as high as > 100 g/L Cl, as exemplified by Michilla and Zaldívar that use Cuprochlor-T technology. Chloride is particularly detrimental to copper EW,
causing pitting corrosion of the cathode blanks, so one or more wash stages are used, in conjunction with coalescers, to control chloride transfer to the electrolyte.
Several operations also experience challenges with nitration of the extractant associated with high levels of nitrates dissolved in the PLS. This prompted the development of nitration-resistant reagents. These incorporate a more easily oxidized sacrificial component to reduce attack on the main extractant functionality (Virnig et al., 2003; Yañez et al., 2009). Mantos de la Luna and Pampa Camarones, for example, both contain close to 100 g/L chloride in addition to nitrates, and use ACORGA NR reagents to mitigate the detrimental effects.
Most mines are approaching the end of their oxide lifetime and the SX plants therefore operate at or below design flowrates using a conventional series configuration, such as 2E–2S or 2E–1S. The PLS have low levels of suspended solids owing to being ‘filtered’ through the heap, so extractant consumption ranges from 1–4 kg/t cathode.
The African Copperbelt is situated in the Lualaba and HautKatanga provinces of the DRC and the Copperbelt and NorthWestern provinces of Zambia. Copper ores are significantly richer than in other parts of the world, with grades of 1.5%–5% acid-soluble Cu. The main oxide resources are hosted in malachite (CuCO₃·Cu(OH)₂), azurite (Cu₃(CO₃)₂(OH)₂), and chrysocolla ((Cu,Al)₂H₂Si₂O₅(OH)₄·nH₂O). Cobalt, mainly present as heterogenite (Co3+O(OH)) at grades of 0.2%–0.4% Co, offers a byproduct credit. The high-grade ores and intense wet season (> 1000 mm of rain mainly occurring over a five-month period) favour agitated leaching over heap leaching. Agitated leaching is carried out in stirred tanks at 30–40°C, so the PLS contains high levels of suspended solids (100–250 mg/L). The high silica content of these ores contributes to significant crud formation and a range of other adverse physical effects throughout the hydrometallurgical circuit (Alexander et al., 2018; Kashala et al., 2018; Sole et al., 2018). The PLS is also often characterized by calcium saturation, owing to hosting of the valuable minerals in high-acid-consuming dolomite and limestone deposits.
Extractant consumption in this region has reduced significantly over the years as processing techniques and operational expertise have improved; while once 5–7 kg/t of cathode was common, these days most operations fall in the range of 2–4 kg/t (Sole et al., 2022). Several sites employ a ‘split circuit’ configuration, which produces a high-grade and a low-grade PLS, and has been shown to reduce overall acid consumption (Nisbett et al., 2009). Pressure leaching of copper concentrates is practised at First Quantum Minerals’ Kansanshi operation in Zambia: as at Morenci, the PLS generated is diluted by blending with the leach PLS before processing by SX–EW.
The main centres on the African Copperbelt are shown in Figure 8. Most L–SX–EW operations are in the DRC, where there are now nearly 50 production sites, of which 20 produce more than 40 kt/a Cu as cathode. The remarkable growth in DRC output is illustrated in Figure 9, from almost zero in 2008 to 1.77 Mt/a in 2022, wth an anticipated output of over 2.50 Mt/a by 2024/25. It is significant that some 80% of this production is from Chinese-owned operations (Figure 10).
As further evidence of the enormous growth in this region, Figure 11 and Table IV depict the location and capacity of new L–SX–EW plants commissioned since 2017 and expected to come online within the next two years. These data show that more than
70% of all global recent new projects are in the DRC, accounting for more than 90% of new copper cathode capacity. Despite the well-documented logistics and power challenges—and the everpresent political uncertainly and instability—the enormous resource potential of this region is outweighing these considerations for those companies with an appetite for risk and the incentive to meet the burgeoning demand for the red metal.

Hydrometallurgical processing of copper by SX–EW was originally developed for the treatment of solutions produced by heap leaching of low-grade oxide materials. As demonstrated, the remarkable versatility of modern SX process chemistry has enabled a much wider variety of PLS characteristics to be treated. Oxides are, however, surface resources and have a finite mine lifetime. As these easily accessible minerals are depleted and mining becomes deeper, the necessity arises to treat mixed ore containing low-grade oxides together with low-grade secondary and primary sulfides, which are progressively more refractory towards acid leaching.
Several new leaching technologies have been in development in recent years to exploit the vast tonnages of copper tied up in low-grade sulfide ore bodies (Baxter, 2016; Steiper, 2018, Voigt et al., 2019, for example). Jetti Resources’s catalyst technology has been deployed in the USA for several years and the first South American trial will begin in mid-2023 (Jetti Resources, 2023). Rio Tinto’s Nuton comprises a portfolio of proprietary copper leach-related technologies and capability that offer the potential to economically unlock copper sulfide resources, copper-bearing waste, and tailings, and achieve higher copper recoveries from oxide and transitional material, allowing for significantly increased copper production (Rio Tinto, 2023).
In Chile, many large operations are moving towards addition of chloride to the heap leach operations to enable sulfide processing under ambient conditions, particularly for chalcopyrite: concentrations as high as 100 g/L Cl are employed. The main issue with treating this tuype of PLS is the risk of chloride transfer to the electrolyte. A focus on engineering developments, particularly with respect to SX wash stages, efficiency of removal of entrained


aqueous phase in the loaded organic, and corrosion control, is expected.
In the DRC, with the tremendous growth in L–SX–EW, depletion of high-grade oxide ore is well under way. To maximize the use of existing SX–EW capacity, several projects are considering


roasting of sulfide concentrates. Sulfides can be converted to oxides by roasting at approximately 800°C. The resulting calcine can then be fed to the oxide processing circuit. This technology also enables SO2 off-gases to be converted to sulfuric acid for use in leaching. Owing to the low capital requirements and ease of implementation and use, continued worldwide proliferation of small copper SX–EW operations (< 10 kt/a Cu) is predicted. In line with global sustainability targets, a trend to lower-carbon-footprint diluents is anticipated, as well as a trend to lower-footprint and ‘recyclable’ equipment. An example of the latter is the modular mixer-settlers supplied by Metso Outotec (Hursi et al., 2018), which can be relocated to a new site at end of mine life. Improved dynamic predictive process control using artificial intelligence techniques is also in advanced stages of development and trials.
From its very modest beginnings in the 1960s, supported by visionary scientists and entrepreneurs, copper SX technology has evolved and adapted to currently produce some 4.0 Mt/a cathode, corresponding to approximately 18% of global primary production. The Nchanga Tailings Leach Plant in Zambia, commissioned in 1973, was the first full-scale copper SX–EW plant in the world. Today, the tremendous increase in production in the African Copperbelt over the last 15 years is driving innovation to solve challenges associated with the unique operating conditions in that region. The DRC has now overtaken Chile as the leading producer of SX–EW copper. In conclusion, it is fitting to return to the words of Joe House on his election to the National Academy of Engineers, who described copper solvent extraction as ‘a multimillion-dollar global business built from an idea.’
The authors thank the following colleagues for useful discussions during the preparation of this review: Andrew Nisbett (BASF, USA), Professor John Monhemius (retired, Imperial College, London), and Rod Whyte (retired, Anglo American, South Africa). The contents of this paper are based on a Keynote Address given at the International Solvent Extraction Conference ISEC 2022, Sweden, on 30 September 2022 by KCS and a presentation at Copper Cobalt Africa 2023, Zambia, on 13 June 2023 by OST.
Credit author statement
KCS: Investigation, data analysis, writing - original draft preparation; writing - review and editing; OST: Investigation, data analysis, writing - review and editing
References
Alexander, D., van der Merwe, C., Lumbule, R., and Kgomo, J. 2018. Innovative process design for oxide ores in the Democratic Republic of the Congo. Proceedings of Copper Cobalt Africa 2018. Southern African Institute of Mining and Metallurgy, Johannesburg. pp. 225–238.
Anon. Not dated. Bluebird Copper Mine, Miami, Arizona. https://thediggings.com/ mines/28798
Anon. 2023. Leading copper cathode exporters in DRC: SICOMINES, KCC, and TFM in 2022. Copperbelt Katanga Mining. https://copperbeltkatangamining.com/ leading-copper-cathode-exporters-in-drc-sicomines-kcc-and-tfm-in-2022/
Bartos, P.J. 2002. SX-EW copper and the technology cycle. Resources Policy, vol. 28, no. 3–4. pp. 85–94.
Baxter, K. 2016. Are we any closer to hydromet overtaking smelting for copper sulfide concentrates? Proceedings of ALTA 2016 Nickel Cobalt Copper Conference. ALTA Metallurgical Services, Melbourne. pp. 1–32.
Chilean Copper Commission. 2018. Chile copper production: SX-EW cathodes 1990–2018. https://www.ceicdata.com/en/chile/copper-production-chilean-coppercommission/copper-production-sxew-cathodes
Cognis. 2008. Cognis wins Tenke Fungurume contract…again! TechNews (August). p. 2.
Declercq, R. 2022. Katanga and the American world of copper: mechanization, vertical integration, and territorialization of colonial capitalism, 1900–30. Born with a Copper Spoon: A Global History of Copper, 1830–1980. Declercq, R., Money, D., and Frøland, H.O. (eds). UBC Press, Vancouver. pp. 253–273.
Dresher, W.H. 2001. Phelps Dodge Morenci has converted all copper production to mine-for-leach. Copper Development Association, Inc. https://www.copper.org/ publications/newsletters/innovations/2001/08/phelpsdodge.html
Flett, D.S. 1974. Solvent extraction in copper hydrometallurgy: a review. Transactions of the Institute of Mining and Metallurgy, vol. C83. pp. C30–C38.
Green, C., Roberson, J., and Marsden, J.O. 2018. Pressure leaching of copper concentrates at Morenci, Arizona — 10 years of experience. Minerals and Metallurgical Processing, vol. 35. pp. 109–116. https://link.springer.com/ article/10.19150/mmp.8459
Holmes, J.A. and Fisher, J.F.C. 1972. Development of a process for the extraction of copper from tailings and low-grade materials at the Chingola Division of Nchanga Consolidated Copper Mines, Zambia. Advances in Extractive Metallurgy and Refining. Jones, M.J. (ed.). Institution of Mining and Metallurgy, London. pp. 169–188.
Holmes, J.A., Deuchar, A.D., Stewart, L.N., and Parker, J.D. 1976. Design, construction and commissioning of the Nchanga Tailings Leach Plant. Extraction Metallurgy of Copper, Vol. II. American Institute of Mining and Metallurgical Engineers, New York. pp. 907–925.
House, J.E. 1985. Success stories in speciality chemicals. SRI Newsletter (June). pp. 1–8. House, J.E. 1989. The development of the LIX reagents. Minerals and Metallurgical Processing, vol. 6, no. 2. pp. 1–6.
Hursi, T., Saario, R., and Weatherseed, M. 2018. Development, design and implementation of Outotec’s VSF®X solvent extraction technology. Proceedings of ALTA Nickel Cobalt Copper 2018. ALTA Metallurgical Services, Melbourne. pp. 275–282.
Lynch, A.J., Taylor, A., and Avendaño Varas, C. 1994. Solvent extraction boom in Latin America. Engineering and Mining Journal, no. 12. pp. 18–21. https://www. altamet.com.au/wp-content/uploads/2014/11/Solvent-Extraction-Boom-in-LatinAmerica-EMJ-December-1995.pdf
Jetti Resources. 2023. First Chilean deployment of Jetti’s novel leaching technology at El Abra Copper Mine, majority-owned and operated by Freeport-McMoRan Inc. https://www.jettiresources.com/news-reports/press-releases/first-chileandeployment-jettis-novel-leaching-technology-el-abra-copper-mine-majorityowned-and-operated-freeport-mcmoran-inc/
Kashala, A., Mitshabu, G., Cheng, Y., Bradford, L., Modi, A., and Tshisand, P. 2018. Management of mixing continuity in a solvent-extraction plant with a leach solution of high silica at Ruashi Mining. Proceedings of Copper Cobalt Africa 2018, Southern African Institute of Mining and Metallurgy, Johannesburg, pp. 303–310. Kordosky, G.A. 2002. Copper recovery using leach/solvent extraction/electrowinning technology: forty years of innovation, 2.2 million tonnes of copper annually. Proceedings of the International Solvent Extraction Conference ISEC 2002, vol. 2. Sole, K.C., Cole, P.M., Preston, J.S., and Robinson. D.J. (eds.). South African Institute of Mining and Metallurgy, Johannesburg. pp. 853–862.
Marsden, J.O., Wilmot, J.C., and Mathern, D.R. 2007. Medium-temperature pressure leaching of copper concentrates—Part III: Commercial demonstration at Bagdad, Arizona. Minerals and Metallurgical Processing, vol. 24, no. 6. pp. 218–225.
Marsden, J.O., Wilmot, J.C., and Smith, R.J. 2007. Medium-temperature pressure leaching of copper concentrates—Part IV: Application at Morenci, Arizona. Minerals and Metallurgical Processing, vol. 24, no. 6. pp. 226–236.
Metorex Limited. 2008. Annual Report. https://www.sharedata.co.za/Data/000886/ pdfs/METOREX_ar_08.pdf
Monhemius, J. 2014. A changing environment: Reflections on 50 years of hydrometallurgy. Plenary address: 7th International Symposium on Hydrometallurgy 2014 (Hydro2014), Victoria, British Columbia, Canada, 22–25 June 2014.
National Academy of Engineers. 1998. Memorial tribute to Joe E. House. https:// www.nae.edu/19579/19581/20412/30099/Mr-Joe-E-House
Nisbett, A., Baxter, K., Marte, K., and Urbani, M. 2009. Flowsheet considerations for copper-cobalt projects. Proceedings of Base Metals 2009. Southern African Institute of Mining and Metallurgy, Johannesburg. pp. 139–152. https://www. saimm.co.za/Conferences/BM2009/139-152_Nisbett.pdf
Price, R. and Tumilty, J.A. 1972. An interpretation of some aspects of solvent extraction as related to the extraction of copper using o-hydroxyoximes. Institution of Chemical Engineers Symposium Series, no. 42, paper 18.
Rio Tinto. 2023. Nuton acquires common shares of Regulus Resources. https://www. riotinto.com/en/news/releases/2023/nuton-acquires-common-shares-of-regulusresources
Seaman, B., Vollert, L., and O’Callaghan, J. 2019. In-situ recovery in hard rock applications: Idealistic notion or realistic future processing option? Proceedings of Copper 2019. Canadian Institute of Mining, Metallurgy and Petroleum, Montreal. Paper no. 590358.
Schlesinger, M.E., Sole, K.C., Davenport, W.G., and Alvear Flores, G.R.F. 2021. Extractive Metallurgy of Copper, 6th edn, Elsevier, Oxford. 573 pp. Shalina Resources. Not dated. https://www.shalinaresources.com/ chemafcommissions16000tons.html
Sikamo, J., Mwanza, A. and Mweemba, C. 2015. Copper mining in Zambia – history and future. Proceedings of Copper Cobalt Africa 2015. Southern African Institute of Mining and Metallurgy, Johannesburg. pp. 1–10.
Sole, K.C., Cole, P.M., Feather, A.M., and Kotze, M.H. 2011. Solvent-extraction and ion-exchange applications in Africa’s resurging uranium industry: A review, Solvent Extraction and Ion Exchange, vol. 25, no. 5–6. pp. 869–900.
Sole, K.C., Zaraté, G., Steeples, J., Tinkler, O., and Robinson T.G. 2013. Global survey of copper solvent extraction operations and practices. Proceedings of Copper-Cobre 2013, Vol. IV, Gecamin, Santiago, Chile. pp. 137–148.
Sole, K.C., Crundwell, F.K., Dlamini, N., and Kruger, G. 2018. Silica mitigation in copper solvent-extraction circuits. Proceedings of Copper Cobalt Africa 2018 Southern African Institute of Mining and Metallurgy, Johannesburg, pp. 331–342.
Sole, K.C., Taute, J.J., Tinkler, O.S., Steeples, J., and Zaraté, G. 2019. Global survey of copper solvent extraction: 2018 Operating data and practice. Proceedings of Copper-Cobre 2019. Canadian Institute of Mining, Metallurgy and Petroleum, Montreal. Paper 581100.
Sole, K.C., Steeples, J., Taute, J.J., Zhou, Y., and Parker, J. 2022. Copper solvent extraction: 2022 global survey of operating practice and performance. Proceedings Copper 2022 International Conference. Gecamin, Santiago. pp. 119–132.
Statistica. 2023. Copper production in Democratic Republic of Congo. https://www. statista.com/statistics/1276790/copper-production-in-democratic-republic-of-thecongo/
Stieper, G. 2018. First chalcopyrite copper concentrate leaching using Albion Process™ technology. Proceedings of Hydroprocess 2018, 10th International Seminar on Process Hydrometallurgy. Gecamin, Santiago.
Van der Zeeuw, A.J. 1972. Selective copper extractants of the 5-alkyl-2-hydroxyphenyl alkyl ketone oxime. Institution of Chemical Engineers Symposium Series, no 42. paper 16.
Virnig, M., Eyzaguirre, D., Jo. M., and Calderon, J. 2003. Effects of nitrates on copper SX circuits: a case study. Copper-Cobre 2003, Hydrometallurgy of Copper: Modelling, Impurity Control and Solvent Extraction, Vol. VI, Book 2. Rivieros, P.A., Dixon, D.G., Dreisinger, D.B., and Menacho, J.H. (eds.) Canadian Institute of Mining, Metallurgy and Petroleum, Montreal. pp. 795–810.
Voigt, P., Stieper, G., and Hourn, M. 2019. First commercialization of the Albion Process™ for copper. Proceedings of Copper 2019. Canadian Institute of Mining, Metallurgy and Petroleum, Montreal. Paper no. 576516.
Wikipedia (undated). Maxie Anderson. Available from https://en.wikipedia.org/wiki/Maxie_Anderson
Yáñez, H., Soto, A., Soderstrom, M., and Bednarski, T. 2009. Nitration in copper SX? Cytec Acorga provides a new reagent. Proceedings of HydroCopper 2009. Domic, E. and Casas, J. (Eds.), Gecamin, Santiago. pp. 332–341. u
Affiliation:
1Departmento de Ingeniería Metalúrgica y Minas, Universidad Católica del Norte, Antofagasta, Chile.
2Department of Mining Engineering, Pontificia Universidad Católica de Chile.
Correspondence to: V. Quezada
Email: vquezada@ucn.cl
Dates:
Received: 9 Nov. 2022
Revised: 19 Jul. 2023
Accepted: 9 Aug. 2023
Published: July 2023
How to cite:
Astudillo, Á., Garcia, M., Quezada, V., and Valásquez, L. 2023
The use of seawater in copper hydrometallurgical processing in Chile: A review.
Journal of the Southern African Institute of Mining and Metallurgy, vol. 123, no. 7. pp. 357–364
DOI ID: http://dx.doi.org/10.17159/24119717/2445/2023
Synopsis
Seawater has become a viable alternative for different uses in copper hydrometallurgy. In this paper we review the main physical and chemical characteristics of seawater and how these influence copper production. Reliable data on the use of continental water are reported, and the current use and consumption of seawater in the Chilean mining industry is analysed, indicating the main areas of use and the main problems encountered. Additionally, the influence of the elements in seawaterthat have the most influence on the extractive metallurgy of copper are considered. The Chilean copper mining industry currently consumes approximately 4.1 m3/s of seawater, which corresponds to 25% of the total water used. The use of seawater for the leaching of copper sulphide minerals, such as chalcopyrite, is beneficial because it provides 20 g/L of chloride, thereby improving copper dissolution kinetics.
Keywords
seawater, copper, hydrometallurgy, Chile, leaching, chloride.
Introduction
Owing to the scarcity of water resources required by the mining industry (Kinnunen et al., 2021), it is becoming increasingly difficult to develop new projects. Water is used for a variety of applications, from dust control on roads to metal recovery processes such as leaching and flotation (Gunson et al., 2012). Most of these processes require large volumes of water, which compels the industry to recycle as much as possible and to explore new sources of water (Herrera-León et al., 2019).
In Chile, the most important mining area is in the extreme north, which is characterized by arid and semi-arid conditions (Atacama Desert). Even in the coastal areas, the meteorological stations record annual precipitation levels of less than 3 mm (García and Osses, 2017; Romero, Mendonca, and Catarina, 2012; Sarricolea, Ruiz, and Aravena, 2017). Water scarcity a growing problem for mining companies. Searching for an alternative to replace the use of inland waters is becoming increasingly important, with seawater being one such alternative.
Seawater contains various elements, many of which are provided by erosion of the Earth's crust. Seawater has high salinity (around 3.5%), comprising mainly Na+ and Cl ions, with lesser quantities of Ca2+, Mg2+, SO42−, and HCO3–, among others (Qiu et al., 2016). In addition, the pH of seawater is moderately alkaline, reaching values ranging from 7.2 to 8.2, depending on the amounts of dissolved salts (San Martín et al., 2020). The presence of ions contained in seawater varies depending on the local environmental characteristics. Another component of seawater is organic material, which is contributed by the ecosystem of organisms that proliferate throughout maritime environments (Morales, 2017).
To manage the challenge of water scarcities, there has been a considerable increase in the uses of non-conventional water sources and renewable energies in the mining industry. In Chile, since 2019, 14 companies have used seawater in their processes, including Minera Escondida, Centinela, Antucoya, and Sierra Gorda. Furthermore, in 2019, the use of seawater in copper mining reached 4.06 m3/s, which represents 25% of the water used in mining. Of the water utilized, 1.84 m3/s corresponds to seawater directly used in processes, while 2.22 m3/s is desalinated water (COCHILCO, 2020a). The rise in water consumption in Chilean mining is due to an increase in the production of sulphide copper minerals, which are treated by flotation. It is estimated that the production of concentrates to be processed will reach 890 Mt by 2027 (COCHILCO, 2016), an increase of 89.9% since 2017 (COCHILCO, 2017).
Humans have in the past regarded the ocean as an unlimited resource. It is used as a food source and a means of transport. Approximately 70% of the Earth is covered by water, of which 97.5% is salt water and 2.5% is fresh water, which corresponds to about 35 million km3. Only 0.007% of that amount is suitable for human consumption (Carrión, 2020). According to the Food and Agriculture Organization (FAO), in 2006 Chile recorded withdrawals comprising 92% surface water, 7.8% groundwater, and only 0.2% saline water (FAO, 2015).
Seawater possesses unique characteristics with respect to the distributions of temperature, pressure, and density. Seawater is an effective solvent that dissolves many sediments that come from land. In addition, it has many conservative and non-conservative properties, such as viscosity, density, thermal expansion, and turbidity (Balasubramanian, 2011). Temperature and salinity, which determine the variability of other properties such as density and surface tension, are among the most important. According to Chang et al., (2012), if it assumed that the temperature of seawater is a constant 10°C with salinity of 30 g/kg, the other properties will be as given in Table I.
Seawater contains dissolved ions that represent approximately 3.5% of the composition, while the remaining 96.5% is water (Qiu et al., 2016). The most abundant elements in seawater, in cationic forms, are sodium, magnesium, potassium, and calcium. The most abundant anions are chlorine, sulphate, and bicarbonate. The chemical composition of seawater remains almost constant in the ocean due to thermodynamics. Some salts precipitate when an excess of these ions is created and are incorporated as sediments. Circulation of the oceanic masses allows for constant agitation and mixing of water. Marine biota fix certain salts, such as carbonates
and silicates. These transform into insoluble materials, such as shells, which are added to the sediments in the sea when the animals die (Cisternas and Moreno,2014). The chemical composition of seawater is shown in Table II (Balasubramanian, 2011).
The mass fraction of material dissolved in seawater corresponds to absolute salinity: precisely determining this parameter is practically impossible. Millero et al. (2008) developed a new measure of salinity termed reference salinity. This parameter is used to better represent absolute salinity, based on Knudsen salinity, chlorinity, and practical salinity.
Temperature usually varies according to latitude and depth; for example, at the poles, the temperature in summer is about 3 °C in the deeper areas of the oceans. In the Baltic Sea and North Sea, temperatures vary between 14 and 18°C; and in the Mediterranean between 22 and 27°C. In Cuba, the water temperature is 25°C on average (Flórez and Bernabé Calle, 2015). According to the navy's hydrographic and oceanographic service (SHOA), temperatures in the north of Chile vary between 15 and 20°C, and the annual average from the centre of the country to the city of Arica in the most northern region is 17°C (SHOA, 2022).
Density depends on temperature only if a material is in its pure state; that of seawater also depends on salinity (Cisternas and Moreno, 2014). Fresh water reaches its maximum density at a temperature of 4°C, whereas the maximum density of seawater occurs at its freezing point, which is −1.9°C (Anil et al., 2016). The density of seawater varies between 1020 and 1050 kg/m3, depending on the depth and pressure, because it has a higher density as depth increases (Tenzer, Novák, and Gladkikh, 2011).
In the Chilean copper mining industry, the current total water consumption rate is approximately 18.4 m3/s, of which 12.8 m3/s corresponds to continental waters and 5.6 m3/s is seawater. The use of seawater is projected to increase to 11.0 m3/s by 2030, representing approximately 47% of the water required by copper mining (COCHILCO, 2019). The use of seawater in Chilean copper mining has been driven by over-exploitation of water resources in arid or semi-arid regions, because 76% of the country's surface is affected by desertification, droughts, and degraded soils (Santoro et al., 2021). Average annual availability of fresh water in the north of Chile (Antofagasta region) reaches 53 m3 per capita per year, and values as high as 2 993 535 m3 per capita in the southern zone (Aysén) (Alvez et al., 2020).
The Chilean Copper Commission identifies two types of seawater used in mining: water produced by desalination plants and by seawater impulsion systems. Desalination is carried out to eliminate the elements contained in seawater, thereby obtaining salt-free water. Seawater impulsion systems apply only minor pretreatments to reduce the amounts of impurities that may interfere with the metallurgical processes.
The use of untreated seawater is an unconventional method in the metallurgical extraction of copper. The contained ions can favour or harm processes. For example, the chloride ions in unprocessed seawater can benefit the leaching of certain copper sulphides (Lu and Dreisinger, 2013; Ruiz, Montes, and Padilla, 2011). This positive effect is due to an increase in the porosity of the passivating layer of elemental sulphur that is generated when copper sulphides are leached, allowing for better leaching kinetics (Hashemzadehm Dixon, and Liu, 2019).
Problems with untreated seawater
Desalination of seawater in Chile has been carried out since the 19th century (Hirschmann, 1975), with the installation of the first solar distillation plant by Charles Wilson in 1872. This plant, called Las Salinas, was located near the city of Antofagasta and produced about 20 kL/d of water for human and animal consumption (Arellano-Escudero, 2015). By 2017 there were 11 operating desalination plants and 10 under evaluation in Chile. In 2020 there were 23 desalination plants, of which 14 were associated with industrial mining and 9 were for urban use (MOP, 2020). It is estimated that 15 new desalination plants for mining will be added by 2028, almost equalizing the consumption of seawater and fresh water in mining processes (COCHILCO, 2020b).
Different methods can be used to desalinate seawater, such as electrodialysis (Jiang et al., 2015), solar evaporation (Olive, 2018), distillation (Arellano-Escudero, 2015), and reverse osmosis, the latter being most used due to continuous improvements in membrane technology and energy consumption, which increase performance and efficiency (Ncube and Inambao, 2019). One of the problems of this process is that the discarded brines, which have a high concentration of salts, are usually returned to the sea. Desalination removes approximately 99% of the salts, resulting in a a highly concentrated waste brine with about Tw.ce the salinity of raw seawater. This poses a disposal problem, since it can harm the marine environment if returned to the sea (Ordoñez, 2015). There are also certain problems with using seawater, either raw or desalinated, that affect not only the processes but also cover more general issues, such as transportation to the mine sites, the energy required, and equipment corrosion.
These problems have been studied by researchers and mining companies over the years in efforts to make the use of seawater more economically feasible. The following paragraphs set out the most critical problems in more detail.
Corrosion is damage to metals and alloys through chemical or electrochemical interaction with their environment (Maaß, 2011). Raw seawater is oarticularly corrosive, owing to its high salt content, but corrosion can also occur with desalinated seawater due to its pH values (Schorr et al., 2010). Corrosion reactions can be classified as wet or dry. Depending on the nature of the structural damage, corrosion can be classified as general corrosion, pitting corrosion, crevice corrosion, intergranular corrosion, environmentally induced fracture, de-alloying, galvanic corrosion, and erosion (Kadhim et al., 2021). Pitting and galvanic corrosion are the most common types when using seawater. The corrosion rate of metals depends on their composition and the environment. The concentration of chloride in seawater is the most influential parameter because it accelerates the rate of corrosion (Cisternas and Moreno, 2014).
Pitting is a type of localized corrosion, characterized by formation of irregular cavities on the surface of a metal. This occurs when a metal is in permanent or intermittent contact with liquid, be it ordinary water, seawater, rain, or even humidity (Garita, Rivolta, and Vega, 2013). However, when working with seawater, resistance to pitting corrosion decreases notably, due to the breakdown of the passive protective layer on the surface of the metal (Antony et al., 2010). In the case of copper, pitting corrosion is known as nodular pitting, because pitting piles up in very localized places, forming nodules or small mounds (García, Uruchurtu, and Genescá, 1995). In contrast, galvanic corrosion occurs when two metals immersed in an electrolyte are in electrical contact, and are characterized by
different practical nobilities, that is, by different potentials for free corrosion. When the electrolyte is seawater, a galvanic cell is formed (Palmer, 2012). Seawater facilitates the formation of galvanic cells because it makes the migration of ions possible (Cisternas and Moreno, 2014)
Desalination plants and seawater transport systems entail significant investment and operating costs because the vast majority of mining operations in Chile are located at great distances from the coast and at high altitudes above sea level (EDITEC, 2015). In most cases, the most important costs associated with the use of seawater are transportation of the water to the mine, which often exceed the costs of desalination itself (Herrera, Cisternas, and Gálvez, 2015). Therefore, the energy consumption of seawater impulsion systems is high, requiring the use of fuels that have an impact on the environment.
According to Gálvez and Cisternas (2017), electricity generated for desalination in the north of Chile is based on fossil fuels, with associated environmental effects. To counteract this, solar plants have been implemented as a clean energy source, but not in sufficient numbers. The reverse osmosis process typically uses 3.7–8 kWh/m3. In addition, the higher the sodium chloride content in seawater, the more energy is required for desalination (Ncube and Inambao, 2019). According to García (2017), the average cost for desalinated seawater in Chilean mining is approximately US$5.1 per m3, compared with US$1.6 per m3 for fresh water. This high cost is mainly due to the costs associated with transportation and the desalination process. The great difference in prices between countries is mainly due to fifferences in the cost of electrical energy, height above sea level at which the mine is located, and the distance from the mine to the coast. Approximately 80% of Chilean mining operations are located at an altitude above 3000 m (Carrasco and Vega, 2011).
With the steady depletion of oxidized copper ores and increasing production from sulphide ores, the need arises to find more economical alternatives to process these types of ores. In general, sulphide copper ores are treated by flotation, which requires large amounts of water. Thus, alternatives for hydrometallurgical processes, such as leaching using seawater, are being studied for both oxidized and sulphide copper ores. The latter are most studied, due to their complex behaviour during leaching. The chloride ion, present in seawater, is beneficial for the leaching of copper sulphides because it promotes faster dissolution kinetics (Lu and Dreisinger, 2013). The influence of chloride ions contained in seawater on the solvent extraction (SX) process has also been studied, with the results being similar to use of fresh water, and sometimes even better (Shakibania et al., 2020). Additionally, in the copper electrowinning (EW) process, the presence of chloride ions at a concentration of 0.02 g/L can improve the compaction and smoothness of cathodes (Nkuna and Popoola, 2019).
In Chile, leaching of oxidized copper ores with raw seawater has been carried out for more than 60 years. In 1960, the Diana plant, owned by Compañía Minera de Tocopilla, obtained copper precipitates from agitation leaching. Michilla also used seawater for its leaching processes in 1970. In both plants, copper was precipitated with iron scrap to obtain copper cement (Cisternas and Moreno, 2014).
Copper oxide minerals generally have a high acid solubility, therefore the most widely used extraction method is leaching. These minerals are usually leached in an acidic medium, mainly using sulphuric acid (Deng et al., 2017). The effect of using different acids, such as HNO3 and HCl, has also been studied. Habbache et al., (2009) evaluated different acidic media (H2SO4, HNO3, and HCl) were and compared to determine which gave better copper extraction: HCl achieved the highest dissolution kinetics and copper extraction (99.95%). Senanayake (2007) asserted that high-stability chloro-complexes are formed during dissolution, which increase the adsorption kinetics and, therefore, the dissolution rate.
The effect of chloride ion concentration has also been studied. Nicol (2018) leached malachite in an acidic medium with H2SO4 and chloride ions. The author observed that faster leaching kinetics were achieved by increasing the concentration of chloride ions. A low (10 g/L) chloride concentration was sufficient to improve the leaching kinetics.
In a study by Velásquez and Quezada-Reyes (2018), various leaching tests were carried out on an oxidized copper mineral in solutions of seawater, discarded brine, and distilled water, which had chloride concentrations of 20, 32 and 20 g/L, respectively. In the first experiments, stirred-flask leaching was performed. The seawater test gave a copper recovery of 96% after 90 minutes of leaching. Kinetics of the process were high and extraction exceeded 90% in all the tests within 30 minutes. The second leaching method was carried out in stirred reactors under ambient conditions and 40 g/L H2SO4 was added to each chloride solution. The results indicated that seawater leaching gave a copper extraction greater than 90% after 20 minutes’ leaching. However, the authors indicated that chloride ions did not have a strong effect on copper extraction from copper oxides.
The leaching of sulphide copper ores has been extensively studied. The dominant process for recovery of copper from chalcopyrite is by froth flotation to produce a copper-rich concentrate followed by pyrometallurgical treatment. This is associated with significant disadvantages, including the release of harmful emissions, being capital- and energy-intensive, and uneconomical for low-grade finely disseminated complex sulphide ores (Li et al., 2013).
Hydrometallurgical methods for copper sulphide ores arise as a necessity to lower production costs, especially because chalcopyrite (CuFeS2) accounts for 70% of the world’s copper reserves and is the main future feed (Aguirre et al., 2016; González et al., 2020; Rodríguez et al., 2020; Toro et al., 2020).
One of the main problems when leaching copper sulphides is their slow dissolution rate (Bogdanović et al., 2020) owing to overly slow dissolution kinetics. The slow dissolution kinetics is attributed to passivation, which involves formation of a layer of elemental sulpsur on the mineral surface (Beiza et al., 2019; Hernández et al., 2020; Quezada et al., 2020). However, the nature of this passivating layer has not yet been established with certainty. The layer inhibits contact between the mineral and the oxidizing agents, which reduces the dissolution rate (Córdoba et al., 2008).
Figure 1 represents an example of passivation of chalcopyrite, mainly associated with the presence of elemental sulphur
According to Velásquez-Yévenes-, Malverde, and Quezada (2022), sulphide mineral dissolution, particularly the passivation of chalcopyrite, is governed by redox potential-dependent reactions. Many studies have been devoted to determining the redox potentials at which dissolution is possible and passivation occurs (Beiza et al., 2019). Methods to reverse passivation to increase the effectiveness
of copper sulphide (mainly chalcopyrite) dissolution are being studied. Although encouraging results have been obtained in the laboratory/pilot scale, these are still very expensive treatments to use on an industrial scale. However, some studies indicate that better results can be obtained in chloride media with the addition of cupric ions, because chloride solutions are more aggressive and cuprous ions are stabilized by the formation of chlorine complex ions (Torres et al., 2019). The influence of seawater on this process has been studied since the chloride ions that it contains can contribute to leaching, as discussed below.
Effect of chloride in copper ore leaching
Chloride media generate faster dissolution kinetics in the leaching Chloride media promote faster dissolution kinetics in the leaching of copper sulphide ores. Hernández et al., (2015) studied the effect of Cl- and Cu2+ ions on the leaching of chalcopyrite in seawater and pure water containing 0.32 and 1 M H2SO4. The results indicated that the presence of seawater has a positive effect on the extraction of copper. This can be attributed to the formation of chloride-copper complexes that increase leaching kinetics. However, if extra sodium chloride is added to the seawater to ingrease the concentration above 37 g/L, the high ionic strength decreases the mobility of individual ions from solution to solid and impairs extraction rates.

Torres et al. (2015) compared the effect of using seawater with a concentration of 18 g/L Cl- and synthetic seawater with 30 g/L of Cl-. The results indicated that the extraction of copper increased for both cases, reaching 70% and 75%, respectively. Similar results were shown in a study by Toro et al. (2020), where chalcopyrite was leached with H2SO4 in wastewater and seawater with Cl- concentrations of 39.19 g/L and 19.35 g/L, respectively, as well as only H2SO4. Manganese nodules were used as oxidizing agents for all solutions. The authors indicated that wastewater gave slightly higher copper extraction than seawater, reaching almost 80%. However, it should be noted that the seawater solution had a chloride ion concentration of approximately half that of the wastewater.
Hernández et al. (2020a), using seawater and distilled water at Cl- concentrations of 20 and 40 g/L, and brine containing approximately 36 g/L Cl-, obtained the best copper extraction, approximately 95%, with seawater and distilled water at 20 g/L Cl-.
In the case of distilled water with 40 g/L Cl-, a lower extraction (< 80%) was obtained. These results are in contrast to that of Toro et al. (2020), who obtained better extractions at higher chloride concentrations. However, Lu, Jeffrey, and Lawson (2000) indicated that a chloride ion concentration greater than 17 g/L does not increase the kinetics of leaching. Nevertheless, it is important to have enough chloride ions in solution, because these ions promote the oxidation of copper (I) and iron (II) by dissolved oxygen. However, leaching depends on the operating conditions, because high chloride concentrations can extend the potential window to higher values (Velásquez-Yévenes, Miki, and Nicol, 2010).
Effect of temperature on leaching of copper sulfide ores using seawater
Aguirre et al. (2016) and Ruiz, Montes, and Padilla (2011) showed that copper extraction from sukphides increases with increasing temperature.
The leaching of copper sulphide minerals, especially chalcopyrite, requires approximately 75 to 85 kJ/mol activation energy (Muñoz, Miller, and Wadsworth, 1979). By increasing the temperature the required activation energy is generated to increase the reaction kinetics (Rodríguez et al., 2020).
Hernández et al. (2020b) obtained a copper extraction of 90% from chalcopyrite at a maximum temperature of 65°C using seawater, and 40% extraction at 25°C (Hernández et al. 2020a). These authors also showed that a lower temperature was required to achieve copper extraction close to 90%, a result that differed from that of Rodríguez et al. (2020). This is explained by Bogdanović et al. (2020), who indicated that chalcopyrite leaching in a chloride medium requires a lower activation energy, approximately 42 kJ/ mol. Therefore, a lower temperature is required when leaching in chloride media to achieve high copper extractions.
It has been shown that agglomeration followed by curing improves the extraction of copper from sulphide ores (Hernández et al., 2020a; 2019). The agglomeration process aids permeability of the heap, causing the fine and coarse particles to bind together. Agglomeration improves contact between the mineral and solution, thus achieving a better copper extraction (Quezada et al., 2020). A curing or resting step can make minerals easier to dissolve in the leaching stage, which increases leaching efficiency and decreases processing times. The curing period results in a homogeneous distribution of the acid, and also promotes the inhibition of aluminum silicate minerals (acid consumwes) (Dhawan et al., 2013; Quezada et al., 2018). Velásquez-Yévenes, Torres, and Toro (2018) leached agglomerated chalcopyrite ore with different concentrations of chloride. The resukte suggested that at least 20 kg/t of Cl- ions delivers higher extractions (approximately 20%) compared with no Cl- (approximately 10%). All the tests were performed in column leaching mode. In a more recent study by Quezada et al. (2021), agglomeration and curing were carried out with the addition of NaCl. They obtained 94% copper extraction at 90°C with a concentration of 50 g/l Cl-. The effect of pretreatment of copper sulphides with the addition of seawater has also been studied by Cerda et al. (2018), who used seawater to pretreat a chalcopyrite and bornite ore. The results showed 93% dissolution of copper using a concentration of 90 kg Cl-/t of mineral with 40 days curing at 50°C. In a study by Quezada et al. (2018), agglomeration and curing were carried out using seawater and discarded brine, with Cl- concentrations of 20 and 32 g/L respectively. A curing time of 50 days resulted in a copper extraction of 72% for the discarded brine,
and 68% for the seawater. Hernández et al. (2020b) evaluated the effect of seawater as a source of chloride ions on acid curing. The procedure consisted of creating a mineral paste with NaCl (solid), NaNO3, H2SO4, and seawater, with a moisture content of 15%. The paste was allowed to stand for 3 days before leaching. A copper extraction of 60% was obtained, compared with 25% without the pretreatment step.
Acid leaching in solutions with seawater show better copper extraction kinetics; however, the presence of ions such as Cl–, Na+, Mg2+, K+, and Ca2+ could affect the efficiency of subsequent processes such as SX. Mahmoudi et al. (2020) conducted SX testwork with seawater, using LIX 984N and Acorga M5774 as extractants. Between pH values of 0.5 and 1.5, LIX 984N achieved a greater extraction of copper from solutions that contained at least 20 g/L chloride ion. However, at pH values exceeded 1.5, a higher extraction was obtained from chloride-free solutions. This effect was also observed with Acorga M5774, with the difference being that better extractions from chloride-free solutions ere obtained above pH 1.7. This difference in behaviour can be attributed to the interaction between chloride ions and copper ions, which form CuCl+ and CuCl2 complexes (Puigdomenech and Taxén, 2000). However, for both extractants, when maximum copper extraction was reached, at pH 2.5, the effect of chloride ions was not significant.
To better understand the effect of pH in SX in chloridecontaining solutions, Shakibania et al. (2020) used LIX 984 at different chloride concentrations. The authors reported that copper extraction at pH < 2 was higher at concentrations of at least 20 g/L of chloride ions. Furthermore, in the range from 0–40 g/L chloride, the predominant species were Cu2+, CuCl+ and CuCl3. When the pH was increased to above 2, there did not appear to be a significant difference in copper extraction capacity between systems with and without chloride. Two probable reactions governing copper extraction in chloride systems were proposed where HRorg represents the organic solvent molecules:
It has also been suggested that chloride ions can have an adverse influence on copper SX when low extractant concentrations are used, because a lower concentration gradient is generated between the aqueous and organic phases. In addition, the use of salt water in SX systems requires in changes in the circuit configuration, because an additional washing stage may be required to avoid excessive transfer of chloride and iron to the electrolyte (Shakibania et al., 2020).
EW of copper using seawater has not been studied in depth, but the effect of chloride on the process is known. The electrolyte used in electrowinning typically contains 0.01–0.06 g/L chloride ions. Chloride adversely affects the EW process. When using stainless-steel cathodes, the chloride concentration must be kept below 0.030 g/L to avoid pitting corrosion, therefore a washing stage is incorporated in the upstream SX process (Schlesinger et al., 2021). Coalescers are used in the presence of high concentrations of chloride in the advance electrolyte, which reduce aqueous carry-
over in the organic phase to the SX strip circuit. However, Aragón and Camus (2011) found that better quality copper cathode was obtained in the presence of chloride ions, because chloride reduces the grain size and improves the mechanical properties of the cathode. This is corroborated by a more recent study (Nkuna and Popoola, 2019), which indicates that a chloride ion concentration of 0.02 g/L gave a smoother and more compact cathode. However, nodules and irregularities formed on the cathode at a concentration above 0.025 g/L.
Today, seawater contributes approximately 25% of the main water requirements in the Chilean mining industry. The shortage of fresh water has motivated the mining sector to face the important challenge of looking for new ways and tools to supply its processes. The use of seawater is presented as a viable way to address water scarcity and reduce the use of continental waters.
For hydrometallurgical processes used for oxidized copper ores, seawater can be either beneficial or detrimental. Leaching kinetics are better with chloride, but in general, these ions do not significantly affect the process, as indicated by the successfuk leaching of chrysocolla and atacamite. The use of seawater for leaching copper sulphide minerals, such as chalcopyrite, is beneficial because it provides 20 g/L of chloride. However, the leaching of copper sulphides is, as yet, not economically viable on an industrial scale.
In the SX process, chloride can increase copper extraction at pH values below 2 using LIX 984N and Acorga M5774 at 15% v/v. However, this effect does not occur at pH > 2.5. It should also be borne in mind that with a greater amount of salts in the system an increased number of washing stages may be required to avoid excessive transfer of chloride to the electrolyte.
The chloride concentration in the advance electrolyte must be carefully controlled in copper electrowinning, because pitting corrosion of the stainless-steel cathode ocures at chloride concentrations above 0.03 g/L.
References
Aguirre, C.L., Toro, N., Carvajal, N., Watling, H., and Aguirre, C. 2016. Leaching of chalcopyrite (CuFeS2) with an imidazolium-based ionic liquid in the presence of chloride. Minerals Engineering, vol. 99. pp. 60–66. doi.org/10.1016/j.mineng.2016.09.016
Alvez, A., Aitken, D., Rivera, D., Vergara, M., McIntyre, N., and Concha, F. 2020. At the crossroads: Can desalination be a suitable public policy solution to address water scarcity in Chile’s mining zones? Journal of Environmental Management, vol. 258. p. 110039. doi.org/10.1016/j.jenvman.2019.110039
Anil, M., Reddy, D., Medidi, R., and Genanu, M. 2016. Special properties of water and sea water. International Journal of Science and Research, vol. 3, no. 40. pp. 1–22.
Antony, P.J., Raman, R.K.S., Raman, R., and Kumar, P. 2010. Role of microstructure on corrosion of duplex stainless steel in presence of bacterial activity. Corrosion Science, vol. 52, no. 4. pp. 1404–1412. doi.org/10.1016/j. corsci.2009.12.003
Aragón M.J. and Camus A.J. 2011. Efecto de la concentracion de ion cloruro en la estructura de electrodepósitos de cobre. Revista Latinoamericana de Metalurgia y Materiales, vol. 31, no. 2. pp. 128–133.
Arellano-Escudero, N. 2015. La ingeniería y el descarte artefactual de la desalación solar de agua. Las industrias de Las Salinas, Sierra Gorda y Oficina Domeyko (1872-1907). PhD thesis, Universitat Politécnica de Catalunya, Spain.
Balasubramanian, A. 2011. Properties of seawater. 11 pp. https://www.researchgate.net/publication/309785723_Properties_of_SeawaterDocumentary?channel=doi&linkId=582363e208ae7ea5be71fa4b&showFulltext =true [accessed 19 May 2022].
Beiza, L., Quezada, V., Melo, E., and Valenzuela, G. 2019. Electrochemical behaviour of chalcopyrite in chloride solutions. Metals, vol. 9, no. 1. pp. 1–12. doi.org/10.3390/met9010067
Bogdanović, G.D., Petrović, S., Sokić, M., and Antonijević, M.M. 2020. Chalcopyrite leaching in acid media: A review. Metallurgical and Materials Engineering, vol. 26, no. 2. pp. 177–198. doi.org/10.30544/526
Carrasco, C. and Vega, P. 2011. Una aproximación a las condiciones de trabajo en la gran minería de altura. Cuaderno de investigación N°40. https://www.dt.gob. cl/portal/1629/w3-article-100032.html [accessed 10 January 2022].
Carrión, M. 2020. ¿Cuánta agua hay en el planeta? El Ágora Report, March 20, 2020. https://www.elagoradiario.com/agorapedia/cuanta-agua-planeta/
Cerda, C.P., Taboada, M.E., Jamett, N.E., Ghorbani, Y., and Hernández, P. C. 2018. Effect of pretreatment on leaching primary copper sulfide in acidchloride media. Minerals, vol. 8, no. 1. pp. 1–14. doi.org/10.3390/min8010001
Chang, Daejun; Han, Sang Heon; Yang, and Kyung-won. 2012. Modeling of non-isothermal CO2 particle leaked from pressurized source: I. Behavior of single bubble. Ocean Systems Engineering, vol. 2. pp. 17-31. doi.org/10.12989/ ose.2012.2.1.017
Cisternas, L. and Moreno, L. 2014. El agua de mar en la minería: Fundamentos y Aplicaciones. RIL editores.
Cochilco. 2016. Proyección de la producción de cobre en Chile 2016 - 2027. Dirección de Estudios y Políticas Públicas. Comisión Chilena del Cobre, Santiago, Chile. pp. 1–32.
Cochilco. 2017. Sulfuros primarios : desafíos y oportunidades. Dirección de Estudios y Políticas Públicas. Comisión Chilena del Cobre, Santiago, Chile. pp. 1–40.
Cochilco. 2019. Proyección de consumo de agua en la minería del cobre 20192030. Dirección de Estudios y Políticas Públicas. Comisión Chilena del Cobre, Santiago, Chile. pp. 1–32.
Cochilco. 2020a. Consumo de agua en la minería del cobre al 2019. Dirección de Estudios y Políticas Públicas. Comisión Chilena del Cobre, Santiago, Chile. pp. 1–52.
Cochilco. 2020b. Proyección de consumo de agua en la minería del cobre 20202031. Dirección de Estudios y Políticas Públicas. Comisión Chilena del Cobre, Santiago, Chile. pp. 1–36.
Córdoba, E.M., Muñoz, J.A., Blázquez, M.L., González, F., and Ballester, A. 2008. Leaching of chalcopyrite with ferric ion. Part IV: The role of redox potential in the presence of mesophilic and thermophilic bacteria. Hydrometallurgy, vol. 93, no. 3–4. pp. 106-115. doi.org/10.1016/j. hydromet.2007.11.005
Deng, J., Wen, S., Yin, Q., Wu, D., and Sun, Q. 2017. Leaching of malachite using 5-sulfosalicylic acid. Journal of the Taiwan Institute of Chemical Engineers, vol. 71. pp. 20–27. doi.org/10.1016/j.jtice.2016.11.013
Dhawan, N., Safarzadeh, M.S., Miller, J.D., Moats, M.S., and Rajamani, R.K. 2013. Crushed ore agglomeration and its control for heap leach operations. Minerals Engineering, vol. 41. pp. 53–70. doi.org/10.1016/j.mieng.2012.08.013
EDITEC. 2015. Catastro de plantas desalinizadoras y sistemas de impulsión de agua de mar. Compendio de La Minería Chilena. Santiago, Chile.
FAO. 2015. AQUASTAT Perfil de País - Chile. Organización de Las Naciones Unidas Para La Alimentación y La Agricultura. Rome, Italy.
Flórez, D.A. and Bernabé Calle, B.V. 2015. El agua de mar en la alimentación y en la terapéutica. Boletin Sociedad Española Hidrologia Medica, vol. 30, no. 1. pp. 37–55. doi.org/10.23853/bsehm.2017.0378
Gálvez, E.D., and Cisternas, L.A. 2017. Innovative solutions for seawater use in mining operations. Case Study of Innovative Projects - Successful Real Cases. doi. org/10.5772/intechopen.68191
García, E., Uruchurtu, J., and Genescá, J. 1995. Efecto de los componentes del agua de mar durante el fenómeno de corrosión por picaduras del cobre. Revista de Metalurgia, vo. 31, no. 5. pp. 307–313. doi.org/10.3989/revmetalm.1995.v31.
i5.946
García, J.L. and Osses, P. 2017. Investigaciones en el desierto de Atacama Centro UC Desierto de Atacama – Estación Atacama UC, Oasis de Niebla Alto Patache. Revista de Geografia Norte Grande. pp. 5–10. doi.org/10.4067/S071834022017000300005
García, N. 2017. Costo económico del uso de agua desalada en la minería chilena. Biblioteca Del Congreso Nacional de Chile. pp. 1–4. Santiago de Chile, Chile.
Garita, L., Rivolta, L., and Vega, M. 2013. Evaluación de la corrosión por picadura en aleaciones de aluminio. Ingeniería, Revista de La Universidad de Costa Rica, vol. 23, no. 1. pp. 13–25. doi.org/10.15517/ring.v23i1.11690
González, Y., Ayala, L., Escobar, C., Hernández, P., Sepúlveda, R., and Toro, N. 2020. Chalcopyrite leaching with ionic liquid based on idimazolium, chloride and pyrite in an oxygenated medium. AIP Conference Proceedings, vol. 2281. pp. 1–6. doi.org/10.1063/5.0026186
Gunson, A.J., Klein, B., Veiga, M., and Dunbar, S. 2012. Reducing mine water requirements. Journal of Cleaner Production, vol. 21, no.1. pp. 71–82. doi.org/10.1016/j.jclepro.2011.08.020
Habbache, N., Alane, N., Djerad, S., and Tifouti, L. 2009. Leaching of copper oxide with different acid solutions. Chemical Engineering Journal, vol. 152, no. 2–3. pp. 503–508. doi.org/10.1016/j.cej.2009.05.020
Hashemzadeh, M., Dixon, D.G., and Liu, W. 2019. Modelling the kinetics of chalcocite leaching in acidified cupric chloride media under fully controlled pH and potential. Hydrometallurgy, vol. 189. pp. 105–114. doi.org/10.1016/j. hydromet.2019.105114
Hernández, P.C., Taboada, M.E., Herreros, O.O., Torres, C. M., and Ghorbani, Y. 2015. Chalcopyrite dissolution using seawater-based acidic media in the presence of oxidants. Hydrometallurgy, vol. 157. pp. 325–332. doi.org/10.1016/j. hydromet.2015.09.007
Hernández, P., Dorador, A., Martínez, M., Toro, N., Castillo, J., and Ghorbani, Y. 2020. Use of seawater/brine and caliche’s salts as clean and environmentally friendly sources of chloride and nitrate ions for chalcopyrite concentrate leaching. Minerals, vol. 10, no. 5. p. 477. doi.org/10.3390/ min10050477
Hernández, P., Gahona, G., Martínez, M., Toro, N., and Castillo, J. 2020a. Caliche and seawater, sources of nitrate and chloride ions to chalcopyrite leaching in acid media. Metals, vol. 10, no. 4. p. 551. doi.org/10.3390/ met1004055
Hernández, Pía C., Dupont, J., Herreros, O.O., Jimenez, Y.P., and Torres, C.M. 2020b. Accelerating copper leaching from sulfide ores in acid-nitrate-chloride media using agglomeration and curing as pretreatment. Minerals, vol. 9, no. 4. pp. 1–13. doi.org/10.3390/MIN9040250
Herrera-León, S., Lucay, F.A., Cisternas, L.A., and Kraslawski, A. 2019. Applying a multi-objective optimization approach in designing water supply systems for mining industries. The case of Chile. Journal of Cleaner Production, vol. 210. pp. 994–1004. doi.org/10.1016/j.jclepro.2018.11.081
Herrera, S., Cisternas, L.A., and Gálvez, E.D. 2015. Simultaneous design of desalination plants and distribution water network. Computer Aided Chemical Engineering, vol. 37. pp. 1193–1198. doi.org/10.1016/B978-0-444-635778.50044-9
Hirschmann, J. 1975. Solar distillation in Chile. Desalination, vol. 17. pp. 17–30.
Jiang, Q., Han, Y., Tang, W., Zhu, H., Gao, C., Chen, S., Willander, M., Cao, X., and Lin Wang, Z. 2015. Self-powered seawater desalination and electrolysis using flowing kinetic energy. Nano Energy, vol. 15. pp. 266–274. doi. org/10.1016/j.nanoen.2015.04.036
Kadhim, A., Al-Amiery, A.A., Alazawi, R., Al-Ghezi, M.K.S., and Abass, R.H. 2021. Corrosion inhibitors. A review. International Journal of Corrosion and Scale Inhibition, vol. 10, no. 1. pp. 54–67. doi.org/10.17675/2305-6894-202110-1-3
Kinnunen, P., Obenaus-Emler, R., Raatikainen, J., Guignot, S., Guimerà, J., Ciroth, A., and Heiskanen, K. 2021. Review of closed water loops with ore sorting and tailings valorisation for a more sustainable mining industry. Journal of Cleaner Production, vol. 278. p. 123237. doi.org/10.1016/j. jclepro.2020.123237
Li, Y., Kawashima, N., Li, J., Chandra, A.P., and Gerson, A.R. 2013. A review of the structure, and fundamental mechanisms and kinetics of the leaching of chalcopyrite. Advances in Colloid and Interface Science, vol. 197. pp. 1–32. doi.org/10.1016/j.cis.2013.03.004
Lu, J. and Dreisinger, D. 2013. Copper chloride leaching from chalcopyrite and bornite concentrates containing high levels of impurities and minor elements. Hydrometallurgy, vol. 138. pp. 40–47. doi.org/10.1016/j.hydromet.2013.06.001
Lu, Z.Y., Jeffrey, M.I., and Lawson, F. 2000. Effect of chloride ions on the dissolution of chalcopyrite in acidic solutions. Hydrometallurgy, vol. 56, no. 2. pp. 189–202. doi.org/10.1016/S0304-386X(00)00075-X
Maaβ, P. 2011. Corrosion and corrosion protection. Handbook of Hot Dip Galvanization. Maaß, P and Peißker, P. (eds). Chapter 1. Wiley-VCH Berlin. doi.org/10.1002/9783527636884.ch1
Mahmoudi, A., Shakibania, S., Rezaee, S., and Mokmeli, M. 2020. Effect of the chloride content of seawater on the copper solvent extraction using Acorga M5774 and LIX 984N extractants. Separation and Purification Technology, vol. 251. p. 117394. doi.org/10.1016/j.seppur.2020.117394
Millero, F.J., Feistel, R., Wright, D.G., and McDougall, T.J. 2008. The composition of Standard Seawater and the definition of the ReferenceComposition Salinity Scale. Deep-Sea Research Part I: Oceanographic Research Papers, vol. 55, no. 1. pp. 50–72. doi.org/10.1016/j.dsr.2007.10.001
MOP. 2020. Informe de prensa DGA-MOP. Dirección General de Aguas, pp. 1–7. https://dga.mop.gob.cl/estudiospublicaciones/Documents/Informe de Prensa DGA MOP.pdf
Morales, F. 2017. Estudio del efecto de las interacciones del sistema “Agua de marcal” en procesamiento de minerales. Master thesis, Universidad de Chile, Chile.
Muñoz, P.B., Miller, J.D., and Wadsworth, M.E. 1979. Reaction mechanism for the acid ferric sulfate leaching of chalcopyrite. Metallurgical Transactions B, vol. 10, no. 2. pp. 149–158. doi.org/10.1007/BF02652458
Ncube, R. and Inambao, F. L. 2019. Sea water reverse osmosis desalination: Energy and economic analysis. International Journal of Mechanical Engineering and Technology (IJMET), vol. 10, no. 12. pp. 716–731.
Nicol, M.J. 2018. The kinetics of the dissolution of malachite in acid solutions. Hydrometallurgy, vol. 177. pp. 214–217. doi.org/10.1016/j. hydromet.2018.03.017
Nkuna, E.H. and Popoola, A.P.I. 2019. Effect of chloride electrolyte additive on the quality of electrorefined copper cathode. Procedia Manufacturing, vol. 35. pp. 789–794. doi.org/10.1016/j.promfg.2019.06.024
Nuorivaara, T., Björkqvist, A., Bacher, J., and Serna-Guerrero, R. 2019. Environmental remediation of sulfidic tailings with froth flotation: Reducing the consumption of additional resources by optimization of conditioning parameters and water recycling. Journal of Environmental Management, vol. 236. pp. 125–133. doi.org/10.1016/j.jenvman.2019.01.107
Olive, G. 2018. Desalted water production by a sea water solar desalter aqueduct : Experimental and numerical results. https://www.researchgate. net/profile/Gino-Olive/publication/327369966_TOWARDS_LARGESCALE_SEA_WATER_SOLAR_DESALINATION_THE_SEA_WATER_ SOLAR_DESALTER_AQUEDUCT/links/5b8ac392299bf1d5a737e3b7/ TOWARDS-LARGE-SCALE-SEA-WATER-SOLAR-DESALINATION-THESEA-WATER-SOLAR-DESALTER-AQUEDUCT.pdf
Ordóñez, J.I., Moreno, L., González, J.F., and Cisternas, L.A. 2015. Use of discharged brine from reverse osmosis plant in heap leaching: Opportunity for caliche mining industry. Hydrometallurgy, vol. 155. pp. 61–68. doi.org/10.1016/j.hydromet.2015.04.008
Palmer, D. 2012. Understanding galvanic corrosion. Design News, January 20, 2012
Puigdomenech, I. and Taxén, C. 2000. Thermodynamic data for copper. Implications for the corrosion of copper under repository conditions. Report SKB-TR--00-13. SKB, Stockholm, Sweden.
Qiu, Z., Liu, G., Liu, Q., and Zhong, H. 2016. Understanding the roles of high salinity in inhibiting the molybdenite flotation. Colloids and Surfaces A: Physicochemical and Engineering Aspects, vol. 509. pp. 123–129. doi.org/10.1016/j.colsurfa.2016.08.059
Quezada, V., Velásquez, L., Roca, A., Benavente, O., Melo, E., and Keith, B 2018. Effect of curing time on the dissolution of a secondary copper sulphide ore using alternative water resources. IOP Conference Series: Materials Science and Engineering, vol. 427, no. 1. doi.org/10.1088/1757-899X/427/1/012030
Quezada, V., Roca, A., Benavente, O., Cruells, M., Keith, B., and Melo, E. 2020. Effect of pretreatment prior to leaching on a chalcopyrite mineral in acid media using NaCl and KNO3 Journal of Materials Research and Technology, vol. 9, no. 5. pp. 10316–10324. doi.org/10.1016/j.jmrt.2020.07.055
Quezada, V., Roca, A., Benavente, O., Cruells, M., and Melo, E. 2021. The effects of sulphuric acid and sodium chloride agglomeration and curing on chalcopyrite leaching. Metals, vol. 11, no. 6. p. 873 doi.org/10.3390/ met11060873
Rodríguez, M., Ayala, L., Robles, P., Sepúlveda, R., Torres, D., CarrilloPedroza, F. R., Jeldres, R. I., and Toro, N. 2020. Leaching chalcopyrite with an imidazolium-based ionic liquid and bromide. Metals, vol. 10, no. 2. pp. 1–12. doi.org/10.3390/met10020183
Romero, H., Mendonca, M., and Catarina, D.S. 2012. Socioclimas y glocalización en el Desierto de Atacama. IX Seminário Latino-Americano e V Seminário Ibero-Americano de Geografia Física, Guimaraes, Portugal. pp. 1–12.
Ruiz, M.C., Montes, K.S., and Padilla, R. 2011. Chalcopyrite leaching in sulfatechloride media at ambient pressure. Hydrometallurgy, vol. 109, no. 12. pp. 37–42. doi.org/10.1016/j.hydromet.2011.05.007
San Martín, F., Kracht, W., Vargas, T., and Rudolph, M. 2020. Mechanisms of pyrite biodepression with Acidithiobacillus ferrooxidans in seawater flotation. Minerals Engineering, vol. 145. p. 106067. doi.org/10.1016/j. mineng.2019.106067
Santoro, S., Estay, H., Avci, A.H., Pugliese, L., Ruby-Figueroa, R., Garcia, A., Aquino, M., Nasirov, S., Straface, S., and Curcio, E. 2021. Membrane
technology for a sustainable copper mining industry: The Chilean paradigm. Cleaner Engineering and Technology, vol. 2. p. 100091. doi.org/10.1016/j. clet.2021.100091
Sarricolea, P., Ruiz, Ó.M., and Aravena, H.R. 2017. Tendencias de la precipitación en el norte grande de Chile y su relación con las proyecciones de cambio climático. Dialogo Andino, vol. 54. pp. 41–50. doi.org/10.4067/S071926812017000300041
Schlesinger, M.E., Sole, K.C., Davenport, W.G., and Flores, G.R.A. 2021. Extractive Metallurgy of Copper: 6th edn. Elsevier.
Schorr, M., Valdez, B., Ocampo, J., and Eliezer, A. 2010. Corrosion control in the desalination industry. Desalination, Trends and Technologies, vol. 95. pp. 29–32. doi.org/10.4028/www.scientific.net/amr.95.29
Senanayake, G. 2007. Review of theory and practice of measuring proton activity and pH in concentrated chloride solutions and application to oxide leaching. Minerals Engineering, vol. 20, no. 7. pp. 634–645. doi.org/10.1016/j. mineng.2007.01.002
Shakibania, S., Mahmoudi, A., Mokmeli, M., and Rashchi, F. 2020. The effect of chloride ions on copper solvent extraction from sulfate-chloride medium using LIX 984N. Minerals Engineering, vol. 156. p. 106498. doi.org/10.1016/j. mineng.2020.106498
SHOA. 2020. Temperatura superficial del mar (TSM). http://www.shoa.cl/php/tsm.php [accessed 25 February 2022]
Tenzer, R., Novák, P., and Gladkikh, V. 2011. On the accuracy of the bathymetrygenerated gravitational field quantities for a depth-dependent seawater density distribution. Studia Geophysica et Geodaetica, vol. 55, no. 4. pp. 609–626. doi.org/10.1007/s11200-010-0074-y
Toro, N., Pérez, K., Saldaña, M., Jeldres, R.I., Jeldres, M., and Cánovas, M. 2020. Dissolution of pure chalcopyrite with manganese nodules and waste water. Journal of Materials Research and Technology, vol. 9, no. 1. pp. 798–805. doi.org/10.1016/j.jmrt.2019.11.020
Torres, C.M., Taboada, M.E., Graber, T.A., Herreros, O.O., Ghorbani, Y., and Watling, H.R. 2015. The effect of seawater based media on copper dissolution from low-grade copper ore. Minerals Engineering, vol. 71. pp. 139–145. doi. org/10.1016/j.mineng.2014.11.008
Torres, C.M., Ghorbani, Y., Hernández, P.C., Justel, F.J., Aravena, M.I., and Herreros, O.O. 2019. Cupric and chloride ions: Leaching of chalcopyrite concentrate with low chloride concentration media. Minerals, vol. 9. p. 639. doi.org/10.3390/min9100639
Velásquez -Yévenes, L., Miki, H., and Nicol, M. 2010. The dissolution of chalcopyrite in chloride solutions: Part 2: Effect of various parameters on the rate. Hydrometallurgy, vol. 103, no. 1–4. pp. 80–85. doi.org/10.1016/j. hydromet.2010.03.004
Velásquez -Yévenes, L., Torres, D., and Toro, N. 2018. Leaching of chalcopyrite ore agglomerated with high chloride concentration and high curing periods. Hydrometallurgy, vol. 181. pp. 215–220. doi.org/10.1016/j. hydromet.2018.10.004
Velásquez -Yévenes, L., and Quezada-Reyes, V. 2018. Influence of seawater and discard brine on the dissolution of copper ore and copper concentrate. Hydrometallurgy, vol. 180. pp. 88–95. doi.org/10.1016/j.hydromet.2018.07.009
Velásquez -Yévenes, L., Malverde, S., and Quezada, V. 2022. A Sustainable Bioleaching of a Low-Grade Chalcopyrite Ore. Minerals, vol. 12, no. 4. p. 487. doi.org/10.3390/min12040487 u
Affiliation:
1Department of Mining Engineering, Konya Technical University, Konya, Turkey.
Correspondence to: K. Esmeli
Email: kesmeli@ktun.edu.tr
Dates:
Received: 19 Apr. 2021
Revised: 29 Oct. 2022
Accepted: 26 Jul. 2023
Published: July 2023
How to cite: Esmeli, K. and Ozkan, A. 2023
Enhancement of shear flocculation of a galena suspension by ultrasonic treatment.
Journal of the Southern African Institute of Mining and Metallurgy, vol. 123, no. 7. pp. 365–370
DOI ID: http://dx.doi.org/10.17159/24119717/1600/2023
ORCID: K. Esmeli
http://orcid.org/0000-0001-5699-5199
A. Ozkan http://orcid.org/0000-0002-5780-788X
Synopsis
The enhancement of shear flocculation of a galena suspension by ultrasound in the presence of sodium isopropyl xanthate and potassium ethyl xanthate was investigated by studying the effects of surfactant concentration on flocculation efficiency, contact angle, and zeta potential. Strong flocculation was obtained under alkaline conditions (pH > 9) and a high ultrasound power level (150 W). Although the ultrasonic treatment increased the negativity of the zeta potential of the galena particles, this did not decrease the flocculation efficiency, thereby showing that the hydrophobic interactions between the particle were stronger than the electrical double-layer repulsion resulting from xanthate adsorption. The findings indicate that the ultrasonic treatment promoted the adsorption of surfactants onto the mineral surfaces.
Keywords
ultrasonic treatment, galena, shear flocculation, contact angle, zeta potential.
Introduction
Due to the depletion of high-grade ore reserves, finely disseminated deposite are increasingly being exploited. The fine particles formed during mineral liberation cause many problems downstream, such as during dewatering, transportation, and dust generation. Although flotation is the most common method used for the beneficiation of fine minerals, it has some disadvantages (Song and Valdivieso, 1998). Flocculation, shear flocculation, or selective flocculation techniques are used as alternatives to flotation (Warren, 1975). Flocculation is performed by creating a physical bridge between particles using highmolecular-weight organic polymers. Shear flocculation is an aggregation process that takes place under an appropriate mixing regime after fine grains are rendered hydrophobic using convenient surfactants. Shear flocculation is carried out through the application of sufficient mechanical energy (mixing of suspension) to overcome the energy barrier caused by surface charges on the particles (Warren, 1975). Surfactants known as flotation collectors are generally used to increase the hydrophobicity of particle surfaces. In shear flocculation, the hydrophobic attraction between grains and the merging of hydrocarbon chains between layers of surfactant adsorbed to the surfaces cause particles to aggregate during interparticle collisions (Warren, 1992).
Lead rarely occurs in nature in the free form, and is usually associated with other elements in minerals such as galena (PbS) and the oxides cerussite and anglesite, which are the most common lead minerals. Among these minerals, galena has the highest lead content and is the most important source of lead (Ozun and Ergen, 2019).
Ultrasound propagates in liquids as a wave consisting of successive compression and rarefaction cycles. The rarefaction cycle has negative pressure, and the following compression cycle has positive pressure. The rarefaction cycle overcomes the intermolecular forces binding the liquid, resulting in the formation of microbubbles, while the compression cycle instantaneously causes a localized burst of energy. This phenomenon, which has an important influence on any solid phase in the liquid, is known as cavitation (Onal, Ozer, and Arslan, 2003; Altun, Hwang, and Hicyilmaz, 2009).
Recently, the use of ultrasound waves in mineral processing has increased, and studies have been conducted on its effect on grinding, leaching, and especially flotation (Onal, Ozer, and Arslan, 2003; Altun, Hwang, and Hicyilmaz, 2009; Lemanowicz, Kus and Gierczycki, 2010; Ozkan and Gungören, 2012). In flotation, ultrasound treatment enhances the performance of the reagents used by distributing them more uniformly throughout the suspension (Altun, Hwang, and Hicyilmaz, 2009; Celik, 1989). In addition, distortions at solid-liquid interfaces alter the surface properties of the mineral particles, which affects

the adsorption of collectors and thus the flotation performance (Slaczka, 1987). Although there are few studies of the influence of ultrasonic processes on the sedimentation of minerals, the beneficial effect of ultrasound has also been noted in this regard (Onal, Ozer, and Arslan 2003; Demir et al., 2021). Onal, Ozer, and Arslan (2003) reported that flocculant consumption and settling time decreased as a result of the use of ultrasound in clay flocculation. Burat, Sirkeci, and Onal (2014) and Yang et al. (2022) found similar results in their studies focusing on the effect of ultrasonic treatment on the dewatering of fine coal, and stated that ultrasonic treatment improved flocculation and filtration performance. Few studies, however, have been conducted to investigate the effect of ultrasonic treatment on the shear flocculation of minerals with surfactants. The research reported here is aimed at elucidating the effect of ultrasonic treatment on the shear flocculation of galena using sodium isopropyl xanthate and potassium ethyl xanthate as surfactants, by means of measurements of zeta potential and contact angle.


The sample of galena concentrate used in the experiments was obtained from the Koyulhisar sulphide ore concentrator in Sivas, Turkey. The XRD spectrum of the sample is shown in Figure 1. The analysis revealed that calcite, quartz, and clay were present in low amounts. The sample was dry-ground for 3 hours using a ceramic ball mill. Particle size of the ground sample was determined using a laser diffractometer (Malvern Mastersizer 2000, UK), and the particle size distribution is shown in Figure 2. The prepared sample was 80% passing 40 μm. Sodium isopropyl xanthate (C4H7NaOS2) and potassium ethyl xanthate (CH3CH2OCS2K) were used as anionic surfactants for galena. The reagents were obtained from ECS Chemistry (Istanbul, Turkey) and had a purity of 99.5%. Hydrochloric acid (HCL, Merck) and sodium hydroxide (NaOH, Merck) solutions were used as pH adjusters. The ultrasonic homogenizer (Bandelin HD 3200, Germany) used in the experimental studies is shown in Figure 3. The constant frequency of the device is 20 kHz, and its maximum output power value is 200 W.
In the flocculation experiments, 1 g ground galena cocentrate and 300 cm3 distilled water were added to a glass beaker fitted with fourbaffles and mixed with a magnetic stirrer at a rotational
speed of 500 r/min for 2 minutes. Surfactant was then added and the suspension was conditioned by the ultrasound device for 5 minutes. Following this, the suspension was again stirred with a magnetic stirrer for 2 minutes at the same rotational speed. Then, the suspension was allowed to settle for 1 minute. Finally, a suspension sample of 20 cm3 was taken at a constant depth of 5 cm below the air-liquid interface using a special system for turbidity measurements. The average of three measurements made on this sample was recorded as the turbidity value, and the measurement error was found to be approximately 5%. The degree of flocculation was determined using Equation [1]:
where T0 is the turbidity of the original suspension and Tf is the turbidity of the sample after sedimentation assisted by a surfactant.
The flocculation tests were conducted at a pH of 8.4 (natural pH). The ultrasonic treatment was carried out in batch mode (successive pulsations on for 5 seconds and off for 10 seconds), with the probe centrally located at an immersion depth of 2 cm. The shear flocculation values were determined to be within an experimental error of ± 3%.
A digital turbidimeter (Velp Scientifica, Usmate Velate, Italy) was used to measure the turbidity, and the turbidity values were reported as nephelometric turbidity units (NTU).
A ZetaPlus apparatus (Brookhaven, USA) was used for the zeta potential measurements. The device measures the zeta potential of the sample using the electrophoresis method (Hunter, 1981). Zeta potential measurements were conducted under the same experimental conditions as the flocculation tests. A sample of supernatant was taken and placed in a cell made of plastic. A total of 12 runs for each sample were used for the zeta potential measurements, and the average value recorded.
The contact angle values were measured using a goniometer device (KSV CAM 101, KSV Instruments Finland). The flocs formed during flocculation tests were removed by filtration and dried. Then, cylindrical pellets with a height of 2–3 mm and a diameter of 1.2 cm were prepared from a 0.5 g dried sample by using a hydraulic press. The pellets were prepared using a constant pressure of 25 MPa. A drop of liquid was placed on the pellet surface with a syringe and the device recorded this image. Two angle values (θleft and θright) were determined for each sample, and the contact angle was taken as the average of these two values.
A Zeiss EVO LS10 scanning electron microscope was used to examine the surface morphologies of the ultrasound-treated and non-treated galena particles.
Results and discussion
Figure 4 illustrates the effect of pH on shear flocculation efficiency of the galena suspension at an ultrasound power of 150 W. Flocculation with both sodium isopropyl xanthate (SIPX) and potassium ethyl xanthate (PEX) increased as pH increased, with atrong flocculation obtaines in the pH range of 9–13. The flotation of sulphide minerals with xanthates depends strongly on the pH of the suspension, and because the anionic monomers of xanthates (X–) are more dominant at neutral-alkaline pH levels, high flotation recoveries of galena are usually obtained at moderately alkaline pH values (Ozun and Ergen, 2019). A similar result was evident in the current study, even at high pH. SIPX, the longer-chain surfactant, was more effective than PEX. Long-chain surfactants are known to be more effective in flocculation because the hydrocarbon chain association depends on the carbon number of the adsorbed surfactant chain (Zollars and Ali, 1986; Ozkan, Ucbeyiay, and Aydogan, 2006).

The effects of SIPX and PEX concentration on the flocculation of galena suspension at 40 and 150 W ultrasound power are shown in Figure 5. Flocculation was enhancemed at the higher power setting of 150 W, but at 40 W the flocculation efficiencies were lower than those obtained without ultrasonic treatment. The physical and chemical effects of ultrasonication are known to be complex.
Therefore, different ultrasound intensities and exposure times cause different results (Chen et al., 2020). Flocculation of galena initially increased depending on the surfactant concentrations, and then plateaus were obtained for all three conditions.
Figure 6 presents the effects of ultrasound on the contact angle and zeta potential of galena at various SIPX and PEX concentrations. The contact angle increased with increases in both surfactant concentrations. Song et al. (2000) noted that in the hydrophobic flocculation of galena, the hydrophobicity of the particle surfaces increased as the adsorption of the surfactant increased, which leads to an increase in the contact angle. In our study, the ultrasonic treatment further increased the contact angle values, resulting in more successful flocculation (see Figure 7). Similar results have been observed in some flotation studies. Gungoren et al. (2019) examined the effect of ultrasound on quartz flotation and found that ultrasonic treatment increased the contact angle of quartz with amine. Gungoren et al. (2020) also noted that higher contact angle values were obtained for galena with PEX under optimal ultrasound conditions, but increased ultrasound power and long treatment times adversely affected both contact angle and flotation performance. Xu et al. (2017) stated that the contact angle values of coal increased with the application of a certain ultrasound treatment time, but that ultrasonic treatment in the presence of SIPX and PEX increased the magnitude of the negative zeta potential of galena. Ozkan (2012) also noted that ultrasonic treatment increased the negativity of the zeta potential of hard coal slime samples.
The electrical double layer describes the electrical potential change near a surface, which gives very important information about the behaviour of colloidal particles in contact with a solution. Therefore, the electrical double layer interactions between mineral fines are important in the aggregation process (Verwey and Overbeek, 1948). It can be expected that the increase in the zeta potential will strengthen the energy barrier that prevents particle aggregation. However, the increase in the surface load by xanthate adsorption on the galena surfaces with and without ultrasonic treatment did not suppress the flocculation under the experimental conditions studied. Similar results have also been recorded for various minerals in some studies where ultrasonic treatment was not used (Song et al., 2000, 2001; Duzyol and Ozkan, 2010). As a result, it can be said that xanthate adsorption onto the galena surfaces strengthens the hydrophobic interactions more than the electrical double-layer repulsions. Also, the negative zeta potential and contact angle of galena were further increased as the


concentration of SIPX and PEX increased, due to the adsorption of xanthates on the galena surfaces and the increased adsorption density, depending on the xanthate concentration. It is clear that the flocculation efficiency of galena with or without ultrasonic treatment responded to collector concentration in the same way as the contact angle, which suggests that there is a significant correlation between flocculation and surface hydrophobicity.
The scanning electron micrographs of galena particles treated with and without ultrasound (150 W power, 300 secndso batch treatment, and 10-3 M SIPX concentration) are shown in Figure 8. The images show that the galena surfaces became smoother following ultrasonic treatment. The relationship between the hydrophobicity of various minerals and the surface roughness was studied by Ulusoy and Yekeler (2005). They found that as the surface smoothness increased, the hydrophobicity of the minerals improved. Xu et al. (2017) also reported that the surface of oxidized coal became smoother with increased ultrasound exposure time, which enhanced flotation by removing the oxidized layer. However, with prolonged ultrasonic treatment the surface roughness increased again. Gurpinar and Sonmez (2013) stated that ultrasonic treatment improved collector adsorption by exposing clean surfaces.


The effects of the ultrasonic treatment on the flocculation efficiency, contact angle, and zeta potential of galena at xanthate concentration of 10-3 M are summarized in Figure 9. As seen in the figure, ultrasound enhanced the shear flocculation efficiency
of galena with SIPX and PEX. In addition, higher contact angle values were reached using the ultrasonic treatment in the presence of these surfactants, and this led to more successful flocculation. On the other hand, in the presence of SIPX and PEX, the ultrasonic treatment increased the negativity of the zeta potential of the galena, bu this did not cause a decrease in the flocculation of the suspension.
Galena flocculation was successfully enhanced using ultrasonic treatment at a high power level in conjunction with sodium isopropyl xanthate and potassium ethyl xanthate. The flocculation results were in good agreement with the improvement in the particle surface hydrophobicity, as measured by the contact angle values. The longer-chain surfactant (sodium isopropyl xanthate) was more effective in the shear flocculation, imparting higher contact angles. Although the ultrasonic treatment increased the surface charge of galena particles with these surfactants, this did not cause a decrease in the flocculation efficiency. These results show that the hydrophobic interactions between the mineral fines that resulted from the adsorption of the xanthate ions were stronger than the electrical double-layer repulsion. In other words, this process is closely related to the hydrophobicity of particle surfaces, as in the flotation process. The beneficial effects of ultrasound energy in the flotation process are also observed in the flocculation of galena with these surfactants.
The present study was financially supported by Konya Technical University OYP Fund for project no. 2015-OYP-015.
References
Altun, N.E., Hwang, J.Y., and Hicyilmaz C. 2009. Enhancement of flotation performance of oil shale cleaning by ultrasonic treatment. International Journal of Mineral Processing, vol. 91. pp.1–13. https://doi.org/10.1016/j. minpro.2008.10.003

Burat, F., Sirkeci, A.A., and Onal, G. 2014. Improved fine coal dewatering by ultrasonic pretreatment and dewatering aids. Mineral Processing and Extractive Metallurgy Review, vol. 36, no. 2. pp. 129–135.
Celik, M.S. 1989. Effect of ultrasonic treatment on the floatability of coal and galena. Separation Science and Technology, vol. 24. pp.1159–1166.

Chen,Y., Truong, V.N.T., Bu, X., and Xie, G. 2020. A review of effects and applications of ultrasound in mineral flotation. Ultrasonics Sonochemistry, vol. 60. pp. 104739. https://doi.org/10.1016/j.ultsonch.2019.104739
Demir, I., Gungoren, C., Baktarhan, Y.,Yücel, M., Ünver, I.K., Çinku, K., and Ozkan, S.G. 2021. Ultrasound supported flocculation of borate tailings with differently charged flocculants. Boron, vol. 6, no. 3. pp. 348–58. https://doi. org/10.30728/boron.971892
Duzyol, S. and Ozkan, A. 2010. Role of hydrophobicity and surface tension on shear flocculation and oil agglomeration of magnesite. Separation and Purification Technology, vol. 72. pp. 7–12. https://doi.org/10.1016/j. seppur.2009.12.011
Gungoren, C., Baktarhan, Y., Demir, I., and Ozkan, S.G. 2020. Enhancement of galena–potassium ethyl xanthate flotation system by low power ultrasound. Transactions of Nonferrous Metals Society of China, vol. 30. pp.1102−1110.
Gungoren, C., Ozdemir, O., Wang, X., Ozkan, S., and Miller, J. 2019. Effect of ultrasound on bubble-particle interaction in quartz-amine flotation system. Ultrasonics Sonochemistry, vol. 52. pp. 446–454. https://doi.org/10.1016/j. ultsonch.2018.12.023
Gurpinar, G., Sonmez, E., and Bozkurt, V. 2013. Effect of ultrasonic treatment on flotation of calcite, barite and quartz. Mineral Processing and Extractive Metallurgy, vol. 113. pp. 91–95. https://doi.org/10.1179/037195504225005796
Hunter, R.J. 1981. Introduction to Modern Colloid Science, Oxford Science.
Lemanowicz, M., Kus, A., and Gierczycki, A.T. 2010. Influence of ultrasonic conditioning of flocculant on the aggregation process in a tank with turbine mixer. Chemical Engineering and Procesing, vol. 49. pp. 205–211. https://doi. org/10.1016/j.cep.2009.12.007
Onal, G., Ozer, M., and Arslan, F. 2003. Sedimentation of clay in ultrasonic medium. Minerals Engineering, vol. 16. pp.129–134. https://doi.org/10.1016/ S0892-6875(02)00309-6
Ozkan, A., Ucbeyiay, H., and Aydogan, S. 2006. Shear flocculation of celestite with anionic surfactants and effects of some inorganic dispersants. Colloids and
Surfaces A: Physicochemical and Engineering Aspects, vol. 281. pp.92–98. https:// doi.org/10.1016/j.colsurfa.2006.02.020
Ozkan, S.G. 2012. Effects of simultaneous ultrasonic treatment on flotation of hard coal slimes. Fuel, vol. 93. pp.576–580. https://doi.org/10.1016/j.fuel.2011.10.032
Ozkan, S.G. and Gungoren, C. 2012. Enhancement of colemanite flotation by ultrasonic pre-treatment. Physicochemical Problems In Mineral Processing, vol. 48. pp. 455−462.
Ozun, S. and Ergen, G. 2019. Determination of optimum parameters for flotation of galena: Effect of chain length and chain structure of xanthates on flotation recovery. ACS Omega, vol. 4. pp. 1516–1524. https://doi.org/10.1021/ acsomega.8b02841
Slaczka, A. 1987. Effect of an ultrasonic field on the flotation selectivity of barite from a barite-fluorite-quartz ore. International Journal of Mineral Processing, vol. 20. pp.193–210. https://doi.org/10.1016/0301-7516(87)90066-4.
Song, S. and Lopez-Valdivieso, A. 1998. Hydrophobic flocculation flotation for beneficiating fine coal and minerals. Separation Science and Technology, vol. 33. pp.1195–1212.
Song, S., Lopez-Valdivieso, A., Reyes-Bahena, J.L., and Bermejo-Perez, H.I. 2001. Hydrophobic flocculation of sphalerite fines in aqueous suspensions induced by ethyl and amyl xanthates. Colloids and Surfaces A: Physicochemical and Engineering Aspects, vol. 181. pp.159–169. https://doi.org/10.1016/S09277757(00)00789-5
Song, S., Lopez-Valdivieso, A., Reyes-Bahena, J.L., Bermejo-Perez, H.I., and Trass, O. 2000. Hydrophobic flocculation of galena fines in aqueous suspensions. Journal of Colloid and Interface Science, vol. 227. pp.272–281. https://doi.org/10.1006/jcis.2000.6857
Ulusoy, U. and Yekeler, M. 2005. Correlation of the surface roughness of some industrial minerals with their wettability parameters. Chemical Engineering And Processing, vol. 44. pp. 557–565. https://doi.org/10.1016/j.cep.2004.08.001
Verwey, E.J.W. and Overbeek, J.Th.G. 1948. Theory of the Stability of Lyophobic Colloids. Elsevier, Amsterdam.
Warren, L.J. 1975. Shear flocculation of ultrafine scheelite in sodium oleate solutions. Journal of Colloid and Interface Science, vol. 50. pp. 307–318. https:// doi.org/10.1016/0021-9797(75)90234-9
Warren, L.J. 1992. Shear flocculation. Colloid Chemistry in Mineral Processing Laskowski, J.S. and Ralston, J. (eds). Elsevier, New York. pp. 309–329.
Xu, M., Xing, Y., Gui, X., Cao, Y., Wang, D., and Wang, L. 2017. Effect of ultrasonic pretreatment on oxidized coal flotation. Energy Fuels, vol. 31, no. 12. pp. 14367–14373. https://doi.org/10.1021/acs.energyfuels.7b02115
Yang, A., Liao, Y., An, M., Cao, Y., Yang, Z., Ren, H., Su, H., Zou, Q., and Chen, L. 2022. Effect of ultrasonic pretreatment on flocculation filtration of low-rank coal slurry. Molecules, vol. 27. 6460 p.
Zollars, R.I. and Ali, S.I. 1986. Shear coagulation in the presence of repulsive interparticle forces. Journal of Colloid and Interface Science, vol. 114. pp.149–166. https://doi.org/10.1016/0021-9797(86)90247-X u
Affiliation:
1University of Toronto, Toronto, Canada.
2University of Western Australia, Perth, Australia.
Correspondence to: J. Hadjigeorgiou
Email: john.hadjigeorgiou@utoronto.ca
Dates:
Received: 21 Apr. 2023
Revised: 21 Jun. 2023
Accepted: 28 Jun. 2023
Published: July 2023
How to cite:
Hadjigeorgiou, J. and Potvin, Y. 2023 Ground support guidelines for squeezing ground conditions.
Journal of the Southern African Institute of Mining and Metallurgy, vol. 123, no. 7. pp. 371–380
DOI ID: http://dx.doi.org/10.17159/24119717/2753/2023
ORCID: J. Hadjigeorgiou http://orcid.org/0000-002-56047-3964
Synopsis
In a benchmarking paper published in the SAIMM Journal, Potvin and Hadjigeorgiou (2008) reviewed ground control strategies to manage large deformations in underground hard rock mines. Significant differences were identified in the design and acceptable tolerance between civil and mining engineering practice for squeezing ground conditions. Variations were also noted in ground support strategies between Australian and Canadian mines. In this paper we review progress in design methodology and ground support practice since 2008, including the availability of more effective deformation monitoring, new design tools, greater access to yielding ground support elements, and better installation practices. An improved understanding of technical and practical issues associated with squeezing conditions has led to the development of ground support guidelines for a range of squeezing ground conditions in hard rock mines.
Keywords
hard rock mining, squeezing ground conditions, ground support, yielding support.
In a benchmarking paper published in the SAIMM Journal, Potvin and Hadjigeorgiou (2008) reviewed ground control strategies to manage large deformations in underground hard rock mines. Significant differences were found in the selection and use of ground support between civil and mining engineering practice. Implementing some of the ground support systems used in civil engineering was not a viable option in a mining environment, as they were deemed prohibitively expensive and would result in considerable delays in development and production mining. Further mining constraints in the selection of ground support strategies include the service life of excavations, desired rate of advance, and convergence tolerance limits.
Another observation was the variation in the choices for ground support between Australian and Canadian mines in squeezing ground. The state of knowledge in 2008 did not allow for the development of robust ground support guidelines for mines experiencing significant large deformations (squeezing rock conditions).
A recent follow-up study (Potvin and Hadjigeorgiou, 2020) focused on assessing changes in design methodology and practice since 2008. The study was based on a technical review of recent work, site visits, and an evaluation of best ground support practices at multiple operations. That study provides the foundation for the developed practical design guidelines for supporting excavations susceptible to squeezing ground conditions, presented in this paper.
Potvin and Hadjigeorgiou (2008) summarized the findings of the ‘Squeezing Task Force’ which undertook a comparison of practices between five mines in Canada and Australia and reported considerable challenges in managing very large deformations. In terms of surface support, Australian mines were using a significant amount of fibrecrete, while the Canadian mines relied primarily on weldmesh and dense bolting patterns, at times supplemented with mesh straps. Another significant difference was that reinforcement practices in Australia were strongly driven by ground support installation techniques that relied almost entirely on jumbos.
Potvin and Hadjigeorgiou (2008) concluded that ground support practices must cater for local conditions, rate of convergence, rock mass degradation, and stress level, etc. They also noted that the boundaries of excavations in squeezing conditions are within a zone of heavily broken rock mass that could extend several metres (referred to as a shell). This necessitates that a mine should develop a good
understanding of the squeezing rock mechanisms involved and the role of ground support, such as the behaviour and effect of the reinforced shell, and how to create the optimum shell using highdensity reinforcement.
The Squeezing Task Force noted that not reinforcing the lower walls and floor resulted in a weakness exploited by the deformation mechanism. At the time, the consensus at mine sites was that an easily implemented practical solution for this problem did not exist.

Ground deformation monitoring was shown to be deficient in squeezing ground at most mines, with the absence of reliable records of the complete deformation history. Plate connection was identified as a weak link between the reinforcement and the surface support. It was observed that under high deformation, the head of the bolt and the plate are the first components of the ground support system to fail. It was also concluded that the state of knowledge in 2008 did not allow for the development of ground support guidelines for squeezing ground conditions.
Since 2008, there has been significant empirical and numerical modelling work in managing squeezing ground at mine sites, e.g., Mercier-Langevin and Hadjigeorgiou (2011), Karampinos et al. (2015a, 2015b). During the last 15 years, several mines have investigated the use of new ground support products while also developing improved practices to manage large deformations.
This paper reports on the findings of a recent benchmarking study, including visits to Canadian and Australian mine sites to assess ground support practices in squeezing ground conditions. This information was complemented with interviews and reviews of ground control management plans (GCMPs), as well as a critical review of the most recent technical literature. This has led to the development of ground support guidelines for managing large deformations in hard rock mines.
An important development since the Squeezing Task Force was the Hard Rock Squeezing Index for underground mines based on case studies from operations in Australia and Canada (Mercier-Langevin and Hadjigeorgiou, 2011). This empirical index can provide a first indication of the potential squeezing and the long-term strain level, based on foliation spacing and the stress to strength ratio, as shown in Figure 1.
As illustrated in Figure 2, the most critical factor controlling the deformation is the orientation of the excavation with respect to the foliation. Based on a review of drifts developed at varying angles with respect to foliation and the resulting levels of squeezing, Mercier-Langevin and Hadjigeorgiou (2011) developed a series of squeezing matrices (Figure 3). The squeezing index overcomes the limitations of rock mass classification systems that assume the rock mass behaves as a continuum isotropic material.

The squeezing index approach was further validated and extended from field data at the LaRonde and Lapa mines by Karampinos et al. (2015). The graphs in Figure 4 are based on some of the largest strains recorded in hard rock mines. When used for design purposes, they can indicate the highest anticipated wall-towall and back to floor strain for a given angle of interception.
There are several reported applications of the squeezing index in Canadian and Australian mines, including Marlow and Mikula (2013), Armatys (2012), Mercier-Langevin and Wilson (2013), and Woolley and Andrews (2015). The index is used at several mines as a prediction tool to anticipate squeezing levels for existing or anticipated changes in ground conditions. This enables proactive modifications to ground support strategies and facilitates communication to mine management regarding the increased level of anticipated squeezing.
One of the observations of the Squeezing Task Force reported by Potvin and Hadjigeorgiou (2008) was that ground deformation monitoring was inadequate or lacking at most mines experiencing squeezing ground conditions. Considerable progress has been made since then in the implementation of monitoring strategies.

Consequently, most mines experiencing severe squeezing have now developed a good appreciation of the wall deformation as a function of time/mining activities. Figure 5 shows an example where deformation data, collected using a cavity monitoring survey (CMS), was reconciled to lithological information along a drift to better understand the evolution of squeezing over time.


A more recent source of monitoring data widely used in underground mines is based on LiDAR technology to measure the convergence of excavations with a high level of precision and high resolution (Figure 6).

There are significant benefits from monitoring the evolution of drive convergence over time. For example, convergence measurements can be used along with damage information to calibrate numerical or empirical models. Convergence measurements can be used to provide an indication of the magnitude of observed deformations and provide an indication of the deformation potential, to assess the suitability of different ground support strategies at a specific mine site.
Numerical modelling is frequently used to reproduce or forecast the level of deformation in hard rock mines. Several publications deal specifically with squeezing rock conditions using a variety of continuum and discontinuum stress analysis models of varying complexity, e.g., Beck, Kassbohm, and Putzar (2010), Yadav and Sharan (2019), Karampinos et al. (2015). Although it is possible to calibrate a numerical model to reproduce field conditions, this is more challenging for squeezing ground.
Well-calibrated continuum models can arguably reproduce the large deformations in excavations in weak, homogeneous, and isotropic rock masses. Continuum models cannot, however, capture the observed squeezing mechanism driven by the presence of geological structures. It has been argued that explicit representation of foliation in continuum finite difference and finite element models, following extensive calibration, can potentially represent the squeezing mechanism in hard rock mines. Although continuum models can simulate comparable deformation levels to those measured in the field, they cannot allow any block rotation or relative movement of blocks, and consequently cannot capture the buckling mechanism in foliated ground.
Examples of the role of reinforcement and support using 3D continuum stress analysis models have been provided by Vakili et al. (2013) and Bouzeran et al. (2019). These types of numerical experiments are useful to understand the interaction between different parameters. Arguably, It is only though discontinuum modelling that it is possible to capture the full interaction of ground support in foliated ground conditions (Karampinos, Hadjigeorgiou, and Turcotte, 2016; Garza-Cruz et al., 2019). It is interesting to note that although in a well documented study at George Fisher Mine, Bahrani and Hadjigeorgiou (2019) demonstrated that discontinuum model resulted in a more realistic representation of the rock mass behaviour than a continuum model, they concluded at the time that running discontinuum models in this case did not meet the practical requirements for routine engineering analyses at a mine where multiple excavations are the norm.
There has been significant progress in ground support practices at mine sites since the benchmarking study of 2008. For example, the majority of the mines consulted in 2008 suggested that it was not practical to reinforce the lower walls close to the floor. It is now recognized that mines can successfully install reinforcement low on the wall (Figure 7). This is reflected in the more successful ground standards for squeezing rock conditions.

Another development has been the increasing use of cable bolts as part of the ground support standards in ore drives where large deformation is anticipated (Figure 8). However, there is no consensus whether debonding is necessary, or whether cable bolts naturally debond as they assume loading. Where the depth of fracturing extends well in the rock mass, the use of long reinforcement has been shown to be critical in controlling squeezing ground.
The other significant development is the greater availability of ground support with higher yielding or energy absorbing capacity. Since the introduction of paddled energy-absorbing rockbolts by Li (2010), different versions have become available from several suppliers. Similarly, following the application of the resin rebar hybrid bolt (Mercier Langevin and Turcotte, (2007), a resin grouted rebar installed inside a friction stabilizer, several manufacturers have developed mechanical point anchor bolts designed to fit inside a friction rockz. In addition to good yielding performance, the solid bar inside the friction bolt offers additional shear capacity that is useful in squeezing conditions (Potvin and Hadjigeorgiou,
and select an adequate ground support system. It is recognized that the ground support system behaviour must match the rock mass response to mining activities. More specifically, the displacement capacity of the reinforcement and surface support must be able to accommodate the rock mass deformation. Hence, forecasting the deformation is a critical step in developing ground support guidelines.
2020). Furthermore, to overcome some of the installation issues in very fractured ground, self-drilling hollow pumpable rockbolts are beginning to receive greater attention (Knox and Hadjigeorgiou, 2023) with several types being available.
Another development is the recognition at several mines experiencing severe squeezing conditions that rehabilitation may be inevitable. This has led to considering planned rehabilitation as part of the overall ground support strategy to minimize disruption to the operation.


In order to facilitate the design process, a ground support guidelines framework has been developed. The five steps in developing the guidelines are illustrated in the schematic in Figure 9. Each step is discussed in detail in the following sub-sections, culminating in a series of ground support guidelines for a range of squeezing ground conditions.
The first step is to determine the failure mechanism as this will have a significant impact on ground support requirements. Based on the authors’ involvement during the last 15 years with squeezing ground conditions in metalliferous mines from around the world, it is concluded that there are two prevalent failure or squeezing mechanisms. The most common relates to highly anisotropic rock masses, or foliated ground, which results in severe buckling of the walls, when the drives run parallel to the foliation (Figure 10).
The second, and less common mechanism in mining, occurs in isotropic rock masses where the intact rock is very weak or heavily altered. In these cases, the joint matrix may also result in very broken ground and small block sizes. Under elevated stress, the drive tends to experience heavy radial shearing, with high convergence and bulging of walls (Figure 11) without the distinct deformation pattern of opposite corners of foliated ground.

The significance of being able to identify the failure mechanism cannot be underestimated. This will dictate the choice of analytical, empirical, and numerical tools that are appropriate for the observed mechanism.
It is important to assess the magnitude of anticipated deformation in order to adopt the correct ground control management strategy

Deformation can be forecast using empirical methods, numerical modelling approaches, or simply by local experience based on convergence measurements. Industry experience indicates that if the displacement of the supported rock mass is expected to exceed 300 mm from the walls or back, ground support rehabilitation will be required.
Potvin and Hadjigeorgiou (2008) summarized several classification systems to describe the level of squeezing in tunnelling. MercierLangevin and Hadjigeorgiou (2011) adopted the system proposed by Hoek (2001) for mining applications. However, it was recognized that there was a need for greater granularity for mining excavations that displayed convergence exceeding 10%. This led to a revised guideline by Hadjigeorgiou et al. (2013) where 10–35% strain was defined as pronounced squeezing, and extreme squeezing as more than 35% strain (Table I).
The use of a squeezing classification system, as in Table I, based on strain magnitude facilitates comparison between excavations of different size. For the purposes of selecting ground support to match the anticipated deformation level in mining drives it is possible to further simplify the process. Table II provides a simplified approach that can be used to establish suitable ground support strategies as a function of anticipated deformation of the ground support as a result of squeezing.
It is recognized that conventional ground support elements cannot survive deformations greater than 100 mm. This would be described as ‘no or low squeezing’ ground conditions. When deformation exceeds 100 mm (moderate squeezing), a ground support system capable of sustaining larger deformation is required. This would involve installing yielding reinforcement elements that use debonding or other elongation enhancement mechanisms. The success of the ground support system is dependent on strong connection between the reinforcement and surface support elements. It is the experience of most mines working in squeezing
ground conditions that ground support systems generally will not survive deformation larger than 300 mm (heavy squeezing). In this case, the support strategy should account for at least one pass of rehabilitation.
For low and moderate squeezing conditions, the support strategy is to avoid rehabilitation by designing a ground support system capable of sustaining rock mass deformation up to 300 mm. In heavily squeezing ground, however, rehabilitation is generally inevitable given current ground support practice. Taking this into consideration it is important to plan for rehabilitation so that it can be completed with minimal disruption to the operation.
There are three phases of deformation generally encountered when mining in squeezing ground (Figure 12). The first phase initiates immediately after the development round is taken (a). Convergence is rapid at first and slows down with time (segments a to b). It is estimated that total wall convergence from this first episode could be in the order of 0.5 m and that the layer of the broken zone inside the wall can extend to around 2 m. The second phase of convergence (segments b to c in Figure 12) is characterized by slow to very slow convergence that is generally controlled by the installed ground support system. This convergence phase lasts until stoping nearby is undertaken (c), which initiates the third phase of deformation. Total convergence during the third phase can be in the order of 1.5 m (1 m in addition to the previous 0.5 m) and the thickness of the broken zone can extend up to 6 m in total (another 4 m added from the initial deformation phase), point (d).
There are two fundamental ground support strategies that can be used to manage convergence due to development and stope mining. The first strategy requires the use of ‘sacrificial support’ and relies on installing the initial ground support system with the intent for it to absorb most of the first phase of deformation (between points a and b in Figure 12) triggered by development mining. The sacrificial ground support is then stripped towards the end of phase
Classification system
Hoek (2001), Mercier-Langevin and Hadjigeorgiou (2011)
Hadjigeorgiou et al. (2013)
Table II
Ground support options for squeezing ground conditions
Conventional ground support systems should be adequate
support system capable of sustaining larger deformation, e.g., yielding or debonding. System should ensure good connectivity and load distribution between reinforcement and surface support
Establish a two-stage ground support strategy. This can involve the installation of sacrificial support or planned rehabilitation. Employ yielding support systems.
1, purging the broken rock mass, and installing a stronger and more deformation resistant ground support system. The intent is for the rehabilitated ground support system to be capable of sustaining the anticipated deformation of phases 2 and 3 triggered by stope mining. Therefore, the success of the sacrificial support strategy depends on the deformation capacity of the rehabilitated support system versus the intensity of convergence during phase 2 (duration and slope between points b and c) and phase 3 (between points c and d) in Figure 12.
From a practical perspective it is advisable that the sacrificial support system is designed to be easily rehabilitated. Common strategies involve the use of friction rock stabilizers (e.g., split sets), mesh, as well as cable bolts. Fibre-reinforced shotcrete is avoided, as it is difficult to rehabilitate. The tail portion of the cable bolts remains in place after rehabilitation and provides pre-reinforced support as the ground is being stripped. It may be necessary to rehabilitate twice if the first pass of rehabilitation is completed too early within the first phase and the rehabilitated support does not survive the second phase of deformation.
A second strategy of ‘planned rehabilitation’ involves scheduling rehabilitation of the ground support as soon as possible before the third phase of deformation commences when nearby stopes are extracted. The initial support system must cater for deformation for the duration of phases 1 and 2 (from points a to c in Figure 12), allowing the serviceable life of the ground support system to extend to the stope mining phase. Andrews (2019) provides a successful example of planned rehabilitation scheduled and completed just prior to longhole stoping at Agnew gold mine (Figures 13 and 14).

Potvin and Hadjigeorgiou (2008) concluded the benchmarking study by recognizing that there is no unique solution to
controlling large-scale deformations in rock. However, based on developments during the last 15 years, it is possible to provide some practical guidelines for squeezing ground. The design process illustrated in Figure 15 and the proposed guidelines discussed in this section are based on the deformation classification in Table II.
It is anticipated that there will be some variations in the described guidelines from mine to mine, This is understandable given local experience and practice. The principles, however, behind these recommendations seem to be quite universal among mines dealing successfully with squeezing ground.

There are no specific guidelines for low or no squeezing ground conditions. Under these conditions the normal ground support standards from the mine should apply. An example of ground support guidelines for normal ground conditions, i.e. excluding squeezing- and rockburst-prone ground, has been provided by Potvin and Hadjigeorgiou (2016) (Figure 16).


The ground support guidelines were developed based on a comprehensive review of ground control management plans in Australia and Canada. These countries use the Q rock mass quality index (Barton, Lien, and Lunde, 1974) to characterize the ground conditions and specifically exclude squeezing or rockburst conditions that may require the use of yielding ground support systems.

Moderate squeezing is defined as when the anticipated displacement of any supported walls is between 100 and 300 mm. The aim of ground support under these conditions is to mitigate the need for rehabilitation. There are two main approaches that can be pursued depending on the choice of surface support, i.e., whether to apply fibre-reinforced shotcrete.
Figure 17 gives an example of a ground support guideline for moderate squeezing conditions using fibre-reinforced shotcrete as surface support. This involves the application of 50 mm of fibrereinforced shotcrete floor-to-floor and in-cycle. The minimum specifications for the fibre-reinforced shotcrete are 32 MPa UCS and over 450 J toughness at 40 mm deflection as defined in ASTM C1550-12 (2012).

This guideline requires the installation of high energy capacity rockbolts and mesh (down to 0.5 m from the floor) over fibrecrete with a bolt density of approximately 0.65 bolts per m2 (1.1 × 1.4 m). Typical reinforcement includes hybrid bolts, paddled energy-absorbing rockbolts, and debonded bolts, The bottom two rows of bolts should have a flat head (e.g., friction stabilizers) to minimize damage to the ground support by mining equipment.
Another strategy for moderate squeezing ground is to employ mesh, as opposed to fibre-reinforced shotcrete, as the principal surface support (Figure 18). This involves the installation of high energy capacity rockbolts and mesh (down to within 0.5 m of the floor), approximately 0.8 bolts per m2 (1.1 × 1.2 m). Rockbolt options include hybrid bolts, paddled energy-absorbing rockbolts, or debonded bolts. In order to mitigate damage to the ground support by mining equipment it is recommended that the bottom two rows of bolts should have flat heads.

If the guidelines for moderate squeezing ground conditions (Figures 17 and 18) are not successful in mitigating the need for rehabilitation, it is recommended to increase bolt density to approximately one bolt per m2. In addition, the use of straps and/ or 6 m long twin/plain strand cable bolts can provide a more robust ground support system.
Under heavy squeezing conditions, empirical evidence suggests that rehabilitation is inevitable. This imposes an additional constraint on the selection of a first-pass ground support system. For example, shotcrete applied in the first pass is difficult to rehabilitate. The objective of a first-pass system is to keep the excavation operational up to 300 mm displacement from any walls. When wall displacement reaches 200–300 mm, or before a nearby stope is extracted, rehabilitation is implemented. The twopass system is summarized below:
First-pass ground support for heavy squeezing ground (Figure 19):


➤ Install 2.4 m friction rock stabilizers (46 mm diameter) at approximately 0.7 bolts per m2 density (approximately 1.2 × 1.2 m). If the intent is to further delay rehabilitation work it may be advantageous to install high-energy capacity bolts, such as hybrid rockbolts, or paddled energy-absorbing bolts. The bottom row of bolts should be within 0.3–0.5 m of the floor.
➤ Install 5.6 mm wire, 100 mm square mesh down to the floor
➤ Install 6 m long cable bolts twin strands/plain, approximately 0.3 bolts per m2 (approximately 1.5 × 2.0 m). Installation of cables lags (12–50 m) to allow initial displacement.
The combined bolt density (cables 0.3 bolts per m2 and rockbolts 0.7 bolts per m2) of the first pass is approximately 1.0 bolts per m2. Rehabilitation is generally required when any wall displacement reaches 200–300 mm. An ongoing rehabilitation schedule and priority list is maintained.
Second-pass (rehabilitation) involves the following actions (Figure 20):

➤ Strip the drive wall(s) to approximately 1.5 m depth.
➤ Apply 50–75 mm fibre-reinforced shotcrete (32 MPa UCS and 450 J toughness at 40 mm displacement) floor-to-floor. Install high-energy capacity and shear-resistant bolts e.g., hybrid bolts or paddled energy-absorbing rockbolts, approximately 0.7 bolts per m2. Apply mesh floor-to-floor over fibrecrete. The bottom two rows of bolts are flat head bolts. Use mesh straps (or Osro straps) at mesh overlaps.
➤ Spray a thin protective layer of shotcrete over mesh, from 1.5 m high down to the floor.
Despite the anticipated heavy squeezing, the aim is still to ensure that there will be no disruption to mining. The initial support should keep the drive serviceable up to just before stope mining begins (Figure 12), when rehabilitation is scheduled to occur.
➤ Apply 50–75 mm fibre-reinforced shotcrete (32 MPa UCS and 450J toughness, at 40 mm displacement) floor-to-floor and in-cycle.
➤ Install high-energy and shear-resistant rockbolts, approximately 0.7 bolts per m2, and mesh down to the floor over fibrecrete. The bottom row of bolts should be within 0.3–0.5 m of the floor.
➤ Use 0-gauge mesh straps (or Osro straps) at mesh overlaps, reinforced with cable bolts.
➤ Install 6 m long twin/plain strand cable bolts, approximately 0.3 bolts per m2. The installation of cables should lag behind (12–50 m) to allow the initial displacement of excavation. The cable bolts should preferably be installed using large plates with two hole for double barrel and wedges (e.g., Figure 8).

➤ Spray over the mesh a thin protecting layer of shotcrete, from 1.5 m to floor (Figure 21). If the shotcrete protection layer is not adopted, consider using flat head bolts for the bottom one or two rows of bolts.

If the damage before the planned rehabilitation is tolerable, it may be more effective not to repair immediately (Andrews, 2019). Ideally, rehabilitation is scheduled to be implemented just before localized stress changes from mining nearby stopes occur (Figure 12). It is good practice to establish rehabilitation priorities and ensure that the rehabilitation schedule is adhered to.
There has been significant progress in our understanding of how to best manage very large deformations in underground hard rock mines. A critical understanding of the squeezing rock mechanism is vital in selecting the appropriate analysis and design tools.
A greater emphasis on monitoring the deformation can provide a reliable estimate of the severity of squeezing as well as the effectiveness of mitigating ground support measures. This is particularly useful in deciding the optimal time for rehabilitation.
It is now recognized that there are significant advantages in using yielding ground support as well as long reinforcement. Mines have also demonstrated that they can install ground support to the floor, which was identified as a major weakness in the past (Potvin and Hadjigeorgiou, 2008).
The plethora of new ground support elements provides significant choices to mining operations. As more data becomes available on their field performance it will be possible to continue to modify the ground support strategies.
The ultimate goal is to design and install a cost-effective ground support system that will not require rehabilitation. Currently there are two pragmatic options in severe squeezing ground. The first strategy involves the use of sacrificial ground support and the second involves planning the timing of rehabilitation. In this context, quality site-specific deformation data can contribute to identifying the optimal timing for installation/rehabilitation of ground support.
The authors are grateful for the opportunity to work with multiple mines experiencing squeezing problems over the last twenty years. The benchmarking study was funded by the Ground Support Systems Optimisation Phase 2 research project at the Australian Centre for Geomechanics, University of Western Australia. Project sponsors were Agnico Eagle LaRonde mine, BHP Olympic Dam mine, DSI Underground, Epiroc, New Concept Mining, Fero Strata Australia (now DSI Underground), Garock Pty Ltd, Gold Fields Australia Pty Ltd, IGO Limited, IAMGOLD Corporation, Westwood mine, Jennmar Australia, the Minerals Research Institute of Western Australia (MRIWA), Newcrest Mining Limited, Cadia Valley Operations, and Sandvik Australia Pty Ltd.
Andrews, P.G. 2019. Ground support selection rationale: A Gold Fields perspective. Proceedings of the Ninth International Symposium on Ground Support in Mining and Underground Construction. Hadjigeorgiou, J. and Hudyma, M. (eds). Australian Centre for Geomechanics, Perth. pp. 15–28.
Armatys, M. 2012. Modification des Classifications Géomécaniques pour les Massifs Rocheux Schisteux. Master’s thesis, École Polytechnique de Montréal, Montreal.
ASTM C1550-12. 2012. Standard test method for flexural toughness of fiber reinforced concrete (using centrally loaded round panel), ASTM International, West Conshohocken, PA.
Bahrani, N. and Hadjigeorgiou, J. 2018. Influence of stope excavation on drift convergence and support behavior: insights from 3D continuum and discontinuum models. Rock Mechanics and Rock Engineering, vol. 51, no. 8. pp. 2395–2413.
Barton, N., Lien, R., and Lunde, J. 1974. Engineering classification of rock masses for design of tunnel support. Rock Mechanics and Rock Engineering, vol. 6, no. 4. pp. 189–236.
Beck, D.A., Kassbohm, S., and Putzar, G. 2010. Multi-scale simulation of ground support designs for extreme tunnel closure. Proceedings of the Second International Symposium on Block and Sublevel Caving. Potvin, Y. (ed.). Australian centre for geomechanics, Perth. pp. 441–453.
Bouzeran, L., Pierce, M., Andrieux, P., and Williams, E. 2019. Accounting for rock mass heterogeneity and buckling mechanisms in the study of excavation performance in foliated ground at Westwood mine. Deep Mining 2019: Proceedings of the Ninth International Conference on Deep and High Stress Mining. Joughin, W. (ed.). Southern African Institute of Mining and Metallurgy, Johannesburg. pp. 29–44.
Garza-Cruz, T., Bouzeran, L., Pierce, M., Jalbout, A., and Ruest, M. 2019. Evaluation of ground support design at Eleonore Mine via bonded block modelling. Proceedings of the Ninth International Symposium on Ground Support in Mining and Underground Construction. Hadjigeorgiou, J. and Hudyma, M. (eds). Australian Centre for Geomechanics, Perth. pp. 341–356.
Hadjigeorgiou, J., Karampinos, E., Turcotte, P., and Mercier-Langevin, F. 2013. Assessment of the influence of drift orientation on observed levels of squeezing in hard rock mines. Proceedings of the Seventh International Symposium on Ground Support in Mining and Underground Construction Brady, B. and Potvin, Y, (eds). Australian Centre for Geomechanics, Perth. pp. 109–118.
Hoek, E. 2001. Big tunnels in bad rock. Journal of Geotechnical and Geoenvironmental Engineering, vol. 127, no. 9. pp. 726–740.
Jones, E. and Hancock, E. 2019. Managing the deformation of ground support and reinforcement. ACG Monitoring Performance of Ground Support Workshop, Sudbury, 22 October 2019.
Karampinos, E., Hadjigeorgiou, J., Turcotte, P., and Mercier-Langevin, F. 2015. Large-scale deformation in underground hard-rock mines. Journal of the Southern African Institute of Mining and Metallurgy, vol. 115, no. 7. pp. 645–652.
Karampinos, E., Hadjigeorgiou J., Hazzard J., and Turcotte P. 2015. Discrete element modelling of the buckling phenomenon in deep hard rock mines. International Journal of Rock Mechanics and Mining Sciences, vol. 80. pp. 346–356.
Karampinos, E., Hadjigeorgiou, J., and Turcotte, P. 2016. Discrete element modelling of the influence of reinforcement in squeezing conditions in a hard rock mine. Rock Mechanics and Rock Engineering, vol. 49. pp. 4869–4892.
Knox, G. and Hadjigeorgiou, J. 2023. Performance of conventional and energy-absorbing self-drilling hollow core rockbolts under controlled laboratory conditions. Rock Mechanics and Rock Engineering. https://doi. org/10.1007/s00603-023-03288-1
Li, C.C. 2010. A new energy-absorbing bolt for rock support in high stress rock masses. International Journal of Rock Mechanics and Mining Sciences, vol. 47, no. 3. pp. 396–404.
Marlow, P. and Mikula, P.A. 2013. Shotcrete ribs and cemented rock fill ground control methods for stoping in weak squeezing rock at Wattle Dam Gold Mine. Proceedings of the Seventh International Symposium on Ground Support in Mining and Underground Construction. Potvin, Y. and Brady, B. (eds), Australian Centre for Geomechanics, Perth. pp. 133–148.
Mercier-Langevin, F. and Hadjigeorgiou, J. 2011. Towards a better understanding of squeezing potential in hard rock mines. Mining Technology, vol. 120, no. 1. pp. 36–44.
Mercier-Langevin, F. and Turcotte, P. 2007. Evolution of ground support practices at Agnico Eagle’s LaRonde Division - Innovative solutions to high stress yielding ground. Rock Mechanics – Meeting Society’s Challenges and Demands. Proceedings of the 1st Canada–US Rock Mechanics. Symposium Eberhardt, E., Stead, D., and Morrison, T. (eds). Taylor & Francis, Vancouver. pp. 1497–1504.
Mercier-Langevin, F. and Wilson, D. 2013. Lapa mine – Ground control practices in extreme squeezing ground. Proceedings of the Seventh International Symposium on Ground Support in Mining and Underground Construction Potvin, Y. and Brady, B. (eds). Australian Centre for Geomechanics, Perth. pp. 119–132.
Potvin, Y. and Hadjigeorgiou, J. 2008. Ground support strategies to control large deformations in mining excavations. Journal of the Southern African Institute of Mining and Metallurgy, vol. 108, no. 7. pp. 397–404.
Potvin, Y. and Hadjigeorgiou, J. 2020. Ground Support for Underground Mines. Australian Centre for Geomechanics, Perth. 520 pp.
Russo, G. 2008. A simplified rational approach for the preliminary assessment of the excavation behaviour in rock tunnelling. Tunnels et Ouvrages Souterrains, no. 207 (May-June 2008).
Yadav, P. and Sharan, S. 2019. Numerical investigation of squeezing in underground hard rock mines. Rock Mechanics and Rock Engineering, vol. 52. pp. 1211–1229.
Wolley, C.E. and Andrews, P. 2015. Short term solution to squeezing ground at Agnew Gold Mine. Proceedings of the International Seminar on Design Methods in Underground Mining. Potvin, Y. (ed.). Australian Centre for Geomechanics, Perth. pp. 199–214. u
Affiliation:
1Centre of Excellence in Carbon-Based Fuels, School of Chemical and Minerals Engineering, North-West University, Potchefstroom, South Africa.
2School of Physical and Chemical Sciences, North-West University, Potchefstroom, South Africa.
Correspondence to: R. Matjie
Email: matjie4@gmail.com
Dates:
Received: 25 Oct. 2021
Revised: 17 Oct. 2022
Accepted: 17 Oct. 2022
Published: July 2023
How to cite:
Matjie, R., Bunt, J., Goosen, A., Mphahlele, K., and Uwaoma, R. 2023
Effect of chemical, mineralogical, and petrographic properties on the grindability of a South African Highveld coal.
Journal of the Southern African Institute of Mining and Metallurgy, vol. 123, no. 7. pp. 381–390
DOI ID: http://dx.doi.org/10.17159/24119717/2423/2023
ORCID: R. Matjie http://orcid.org/0000-0002-2839-3729
J. Bunt http://orcid.org/0000-0003-3051-2528
A. Goosen http://orcid.org/0009-0005-2731-0986
R. Uwaoma http://orcid.org/0000-0002-3306-9878
Synopsis
Coal properties that are associated with wear and damage of grinding equipment during pulverization prior to combustion were investigated. A South African Highveld feed coal and its beneficiated fractions were crushed to <1 >0.25 mm particles for the grindability tests. These particles were milled and screened into <75 µm and >75 µm fractions, which were analysed by different techniques to establish a correlation with the conventional Hardgrove Grindability Index (HGI). The <1.5 g.cm-3 float fraction, which contained 93 vol.% (mineral matter free) total -macerals, 9% kaolinite, and had the lowest HGI (57) (hardest to grind) was pulverized for 15, 30, 60, and 120 minutes for particle size distribution analysis. This analysis indicated that the content of <75 µm particles increases with increased grinding time. The >1.9 g.cm-3 sink fraction, with the highest HGI (76), 44% kaolinite, and 20 vol.% total macerals, was ground easily to generate the highest proportion of <75 µm particles. Based on higher correlation coefficients (R2 = 0.77–0.91), the ash yield, mineral matter, petrographic composition, and fixed-carbon have significant effects on the HGI. Conversely, the inherent moisture and total sulphur (R2 = 0.48–0.62) have only minor effects on the HGI. Results from this investigation could be implemented in the preparation of a suitable pulverized fuel with little equipment wear, as well as utilizing mineralogical and petrographic compositions. Finally, the effect of microlithotypes and maceral types in South African feed coals on the HGI should be investigated in further pulverization and grindability studies.
Keywords
coal, mineralogy, petrography, grindability, Hardgrove Index.
Introduction
South African power stations utilize low-rank C bituminous coal for electricity and steam production (Falcon and Falcon, 1987; Falcon and Ham, 1988; Borrego, Alvarez, and Menéndez, 1997). These coarse run-of-mine (ROM) coals (<120 to >6.7 mm particle size) are ground to produce pulverized fuel (PF) (<75 µm particles) for combustion (Falcon and Falcon, 1987). The Grootegeluk opencast coal mine owned by Kumba Resources (Pty) Ltd, situated west of Lephalale in Limpopo Province, produces very coarse ROM coal (1000 mm, 55-60% ash yield) (Jeffrey, 2005). At Grootegeluk, primary crushers are utilized to reduce these large lumps to <150 mm particles without producing excessive fines. This material is then beneficiated to yield various products (semi-soft coking coal, high-ash steam coal (middlings, 35%), Corex coal, medium-phosphorus pulverized coal injection (PCI) coal, and sized steam coal). The bulk of the beneficiated high-ash coal (14.2 Mt/a) is transported by conveyor to Eskom’s Matimba and Medupe power stations to produce electricity. If the calorific value (CV) and percentage ash yield do not meet requirements for combustion, this coal is blended with low-ash coking coal (6–15% ash yield) to produce a suitable combustion PF with a ≤35% ash yield (air dry basis (a.d.b), <0.5–1% total sulphur (a.d.b), 40–55% fixed-carbon (a.d.b), and CV (15-25 MJ/kg)) with low equipment wear propensity.
According to Falcon and Falcon (1987), vitrinite macerals contained in SA low-rank coals impart a Hardgrove Grindability Index (HGI) value of 24 and these coals are very difficult to grind due to their elastic behaviour. While vitrinite macerals present in mid- to high-rank bituminous coals (HGI value of 84) are easiest to grind, grindability decreases again in the anthracite range. The HGI values of inertinite
(45–50) vary slightly in low-rank bituminous coals, including South Africa coals, and remain consistent throughout the bituminous and semi-anthracite range (Steyn and Minnitt, 2010, Mangena, 2001, Engelbrecht et al., 2010).
Studies on South African coals have shown that three factors – the inherent moisture content, percentage ash yield, and volatile matter content – greatly influence the HGI (van Vuuren, 1978; Falcon and Falcon, 1987). Coals with lower HGI values have high inherent moisture and volatile matter contents along with low ash yields.
Grinding of coal incurs a significant energy cost (5 to 15 kWh/t– (Sligar 1998; Khoshjavan, Khoshjavan, and Reza, 2013). The presence of mineral matter, including quartz, pyrite, and microcline in the coal particles, which are harder than steel, can contribute significantly to equipment wear during pulverization or milling (Falcon and Falcon, 1987; Tiryaki and Dikmen, 2005; Deniz, 2011). The extraneous or discrete minerals in the coals are those minerals which are not associated with the carbon matrix. These minerals damage equipment, decreasing its operational lifespan and subsequently resulting in power station or boiler shutdowns, and increased costs for repairs or purchasing new equipment.
Furthermore, Honaker, Mohanty, and Crelling (1996) and Vranjes et al. (2018) found that vitrinite and liptinite (reactive macerals) and inertinite (inert maceral) behave differently due to their elastic and microhardness properties during grinding and pulverization of Illinois No. 6 seam and Ukrainian coals respectively. Determination of coal maceral microhardness could possibly define the behaviour of Indian coals during grinding/pulverization (Nag et al., 2022).
Trimble and Hower (2003) found that the proportions of liptinite and liptinite-rich microlithotypes in the Eastern Kentucky coals significantly influence the HGI due to their hardness and resistance to grinding. Additionally, the coal rank (0.75–1.00% vitrinite reflectance maximum, Rmax) as well as vitrinite-, liptinite-, and kaolinite-rich mono- and bimaceral monomacerite affect HGI values. According to Hansen and Hower (2014) and Hower, Graese, and Klapheke (1987), the bimacerite, duroclarite, clarodurite, the bimacerite microlithotype durite, and monomacerite microlithotype, and liptite in coal negatively contribute to HGI. This implies that coals with these lithotypes require a greater energy input to grind. The monomacerite microlithotype vitrite and silicates (generally clays) in the coal samples contribute positively to the HGI (higher HGI values, easier to grind.
Idris et al. (2022) measured the HGI values of blends of Malaysian low- and high-grade coals by a bomb grindability index. The cross-validated model was developed using a multilinear regression. This model achieved improved HGI predictions for the coal blends, with a coefficient of determination R2 = 0.9416. Hower et al. (2021) also used HGI as a predictor of the behaviour of Kentucky and non-Kentucky coals during breakage, grinding operations in coal mining, beneficiation, handling, and pulverization.
Numerous research studies of the relationship between mechanical properties, grindability, and cuttability of coal have concluded that these relationships correlate strongly with the HGI (Tiryaki and Dikmen, 2005). Other factors that influence the HGI are coalification (coal rank), volatile matter, fixed-carbon, moisture, total sulphur, carbon, oxygen, nitrogen, and hydrogen (Khoshjavan, Khoshjavan, and Reza, 2013). Taking carbon (C) content as an example, if the C content is higher than 60%, the HGI of the coal increases to the maximum range (30–60) (Falcon and Falcon, 1987;
Hansen, and Hower, 2014; Khoshjavan, Khoshjavan, and Reza, 2013).
Therefore, an improved understanding of the role of these harder minerals, harder macerals, and their composition in South African feed coals during PF comminution for combustion in power stations is needed. The grindability information (optimum grinding time of dry coal particles to produce sized power station feed coal), determined here by assessing density-fractionated samples with different proportions of mineral matter, macerals, chemicals, and microlithotypes, which has not been previously investigated using this novel grindability procedure, may enable operators to better estimate wear rates of susceptible equipment as well as to enhance production efficiencies. The results from this study could also be implemented by research institutions to further investigate the effects of the types of macerals and microlithotypes on the HGI of South African coals from the different coalfields.
In this study, the effects of petrology and mineralogical properties on the grindability and particle size distribution (PSD) of Highveld feed coal and its density-separated fractions were investigated. X-ray diffraction (XRD), X-ray fluorescence (XRF), proximate, petrographic, HGI, and ultimate analyses of the feed coal and its density-separated fractions were undertaken. Furthermore, mineralogical and Malvern Mastersizer analyses of the samples were used to correlate coal properties with the grindability (HGI values) of the coals.
Coal sampling, preparation, density separation and methods
The Highveld Coalfield is situated in South Africa’s Mpumalanga Province, where low-medium rank C bituminous coal of Permian age is mined from two economic seams (Falcon and Falcon, 1987; Falcon and Ham, 1988). In this study, approximately 600 kg of a representative Highveld feed coal was sampled at an operating colliery following the International Organization for Standardization (ISO) 18283 and ISO 13909-4 procedures.
A density fractionation method using 1.5 g.cm-3 to 1.9 g.cm-3 organic dense media (mixtures of tetrabromoethane, perchloroethylene, and benzene) was followed to produce different density-separated fractions from the <120 >6.7 mm feed coal used in this study, as also applied by Rautenbach et al. (2019). The density fractionation work was conducted at General Society of Surveillance (SGS) laboratories`according to the SANS/ISO 7936 method.
The cumulative mass percentage curve is presented in Figure 1. It is apparent that the density separation was successful in producing samples for the HGI measurements at SGS laboratories and grindability tests. As expected, the cumulative mass of the density-separated fractions increases with an increase in the density of the organic liquids, and this data was used to determine a blending strategy to produce a suitable combustion PF.

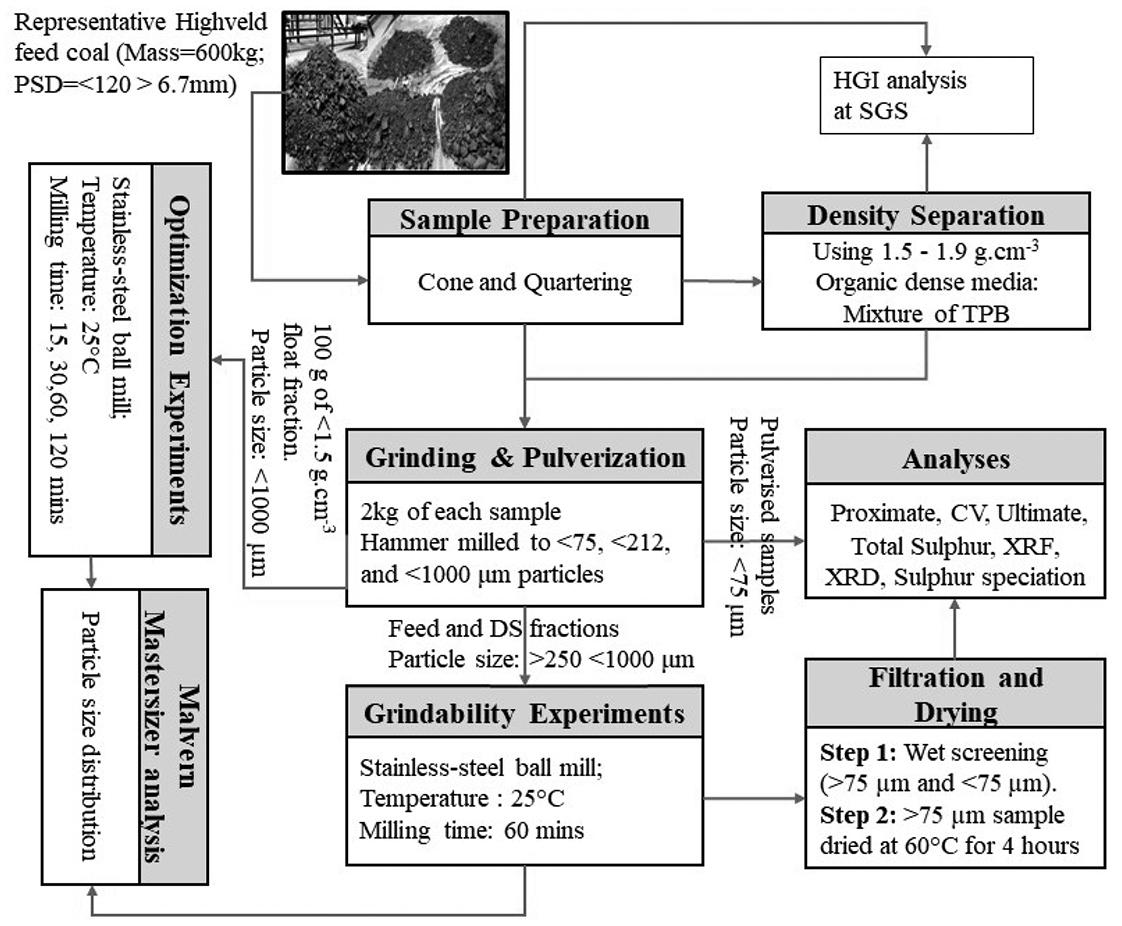
Prior to pulverization and density separation, representative samples were submitted for HGI analysis at the SGS laboratories in Secunda. The remaining feed coal and density-separated fractions were ground and pulverized to prepare samples (<75, <212, and >250<1000 μm particles) for the selected analyses.
A schematic diagram showing the coal sampling, preparation, density separation, grindability experimental procedure and analytical methods for Highveld coal and density–separated fractions is presented in Figure 2.
Each sample (2 kg) of either coarse feed coal or coarse density–separated fraction was hammer milled to produce a size fraction >250<1000 mm for the grindability experiments. The air dried particles (about 100 g) were added into the stainless-steel ball mill and were milled for 60 minutes. Each sample was weighed before and after to ensure that no loss of sample occurred during milling. The grindability test was conducted five times to test the replication of the experimental results. The milled dry sample (about 1 g) was taken for the PSD determination prior to wet screening.
50 g of the milled air dried particles were wet screened using a 75 mm sieve and 2 L water to produce both ground coarser (>75 mm) wet–cake and a finer (<75 mm) coal slurry. The slurry was pressure filtered to separate the wet solids (<75 mm particles). These solids as well as the coarser screened particles (>75 mm) were dried at 60 °C for 4 hours and weighed.
From the wet screening results, it was found that the <1.5 g.cm-3 float fraction contained the lowest percentage mass of the finer (<75 mm) coal particles due to its high content of vitrinite which is hard to grind (Table V). Also, the lowest HGI value (56.5) was for the <1.5 g.cm-3 float fraction (Figure 5). Thus, this density fraction was used for the optimization experiments. In each experiment, a 100 g sample of the dry <1.5 g.cm-3 float fraction was subjected to ball milling for 15, 30, 60, and 120 minutes. The optimization experiment was conducted in duplicate to test the replication of the results. The sample was weighed before and after milling (before wet screening tests) and 1 g of each air dried milled sample was submitted for the PSD analysis using the Malvern mastersizer 3000.
Standard procedures were used to determine the percentage ash yield (ISO 1171), inherent moisture (ISO 11722), and volatile matter content (ISO 562 and 1170) of the samples as well as the CV measurement at SGS laboratories. The fixed-carbon content in each sample was calculated by difference (100 minus the sum of percentage ash yield, inherent moisture, and volatile matter contents).
The ultimate analysis (ISO 12902-CHN instrumental method) was followed to determine the proportions of organic elements (C, H, N) in the feed coal and density-separated fractions at SGS laboratories. In addition, the ASTM D4239 standard method was used to measure the total sulphur content by the A632 sulphur determinator.
The feed coal and density-separated fractions were submitted to SGS Laboratories in Trichardt for the sulphur analyses. The ISO 157 method, Standard Part 11, 1959, was followed to quantify the different sulphur forms (pyritic, sulphate, and organic) as well as mineral sulphur (the sum of pyritic and sulphatic sulphur).
XRF analysis (Norrish and Hutton, 1969; ASTM D4326-13) was followed to determine the proportions of inorganic elements contained in the ashes of the feed coal, the density fractions, and samples produced from the grindability experiments, using a PANalytical Axios MAX XRF instrument at North-West University (NWU) Potchefstroom campus.
The pulverized feed coal, density fractions, and coal samples from experiments (<75 μm) were analysed using a PANalytical X’Pert Pro X-ray diffraction (XRD) instrument equipped with a Co X-ray tube and X’Celerator detector, with Rietveld-based X’Pert
HighScore Plus software at NWU Potchefstroom campus (Rietveld, 1969; Speakman, 2012). Each solid sample was spiked with 20% Si (Aldrich, 99.9% purity) and subsequently micronized in a McCrone micronizing mill. Crystalline and amorphous phases were identified and quantified using X’Pert Highscore Plus and an ICDD (International Centre for Diffraction Data) program. Quantification of the phases was based on the Rietveld method.
The feed coal and density fractions were submitted to SGS laboratories, Trichardt, for HGI measurement following the ISO 5074:1994 standard method.
Polished blocks of feed coal and beneficiated fractions were assessed using a Zeiss Axio Imager petrographic microscope fitted with a fossil Hilgers system for vitrinite reflectance determination (based on ISO7404 part 3), housed at the University of Johannesburg. A semi-automated point counting stage for maceral analysis was utilized in accordance with ISO 7404-4 at 500× magnification under oil immersion. The 0.900 YAG calibration standards were used. Maceral results are reported on a volume per cent basis and macerals are included in the count not determined by calculation. The entire surface of each polished block was assessed.
The pulverized coal samples were submitted to NWU laboratories in the Potchefstroom campus for the PSD analysis. A Malvern Instrument Mastersizer 3000 (Malvern Instrument, 2015) was used to determine the PSD of the dry samples produced after the milling tests at the different time intervals, before the wet screening tests.
As expected, the major differences in the proximate analysis results
and sulphur speciation analyses
of the feed coal and density fractions (on an air-dried basis) are the percentage ash yield and fixed-carbon content (Table I). The >1.9 g.cm3 sink fraction has the highest ash yield (74% a.d.b) and the lowest fixed-carbon content (12% a.d.b) of all the samples, including the feed coal. The ash yield increases from the lowest density fraction (<1.5 gcm-3 float fraction) to the highest (>1.9 g.cm-3 sink fraction) (Table I). Also, the volatile matter content and the percentage fixed-carbon are higher in the float fractions (< 1.5 g.cm-3, <1.7 g.cm-3, and <1.9 g.cm-3 floats) than in the >1.9 g.cm-3 sink fraction and feed coal. The <1.7 g.cm-3 float sample has a higher ash yield (22% a.d.b) and a lower VM (25% a.d.b), and fixed-carbon content (49% a.d.b) than the <1.5 g.cm-3 float sample (used to produce good quality PF). The results from earlier studies indicate that coals with high ash yields and higher moisture content had high HGI values (Shahzad et al., 2014 (a); Shahzad et al., 2014 (b); Babu, Lawrence, and Sivashanmugam, 2017). This implies that the coals used in these earlier grindability studies are soft and easy to grind.
Furthermore the >1.9 g.cm-3 sink fraction sample (used to produce poor quality PF), with a higher ash yield and lower content of fixed-carbon, could possibly be ground with ease.
The highest volatile matter and fixed-carbon contents (a.d.b), along with the lowest percentage ash yield, are evident in the <1.5 g.cm-3 float fraction, which could be an indicator that this fraction should be the hardest to grind. By inference, the hardness of the <1.5 g.cm-3 float fraction may be directly responsible for high equipment wear during the preparation of the fine PF particles for combustion (Tiryaki and Dikmen, 2005).
The ultimate analysis results for the feed coal and density fractions are shown in Table I. As expected, lower concentrations of nitrogen and hydrogen along with higher concentrations of carbon were detected in the float samples (<1.5 g.cm-3, <1.7 g.cm-3, <1.9 g.cm-3) and the feed coal sample compared to those of the >1.9 g.cm-3 sink fraction. Also, the elemental analysis of the density fractions indicates that the proportions of C, H, and N decrease with increasing particle density. The <1.5 g.cm-3 float fraction contains
Note: a.d.b.: air-dried basis
the highest volatile matter, which correlates to the contents of carbon, oxygen, nitrogen, and hydrogen. The ultimate results are also comparable with those of the previous studies on Highveld coals (Rautenbach et al., 2019; Matjie et al., 2016).
Khoshjavan, Khoshjavan, and Reza (2013) used an artificial neural network (ANN) method to investigate the effects of other chemical constituents (carbon, nitrogen, oxygen, hydrogen, and total sulphur (organic and pyritic), all on a dry basis) on the HGI of coal. The results for the coals of the same rank from their study show that the carbon, hydrogen, nitrogen, and oxygen contributed significantly to the HGI results. Therefore, the higher proportion of carbon in the <1.5 g.cm-3 float fraction could be linked to the microhardness properties of the organic matter during the grindability experiments. This would probably result in wear and damage to plant equipment during the production of PF.
Total sulphur and sulphur speciation results are presented in Table I. As expected, proportions of pyrite in the density fractions increase with an increase in the density of the organic liquid used for the density separation. This can be attributed to the presence of pyrite that is associated with extraneous rock particles (mudstone, siltstone, and sandstone) in South African feed coals and lithofacies (Faure, Willis, and Dreyer, 1996; Matjie, van Alphen, and Pistorius 2006). The results obtained in this study are also consistent with those from other Highveld coals (Tsemane et al., 2019; Matjie et al., 2018).
Table II
The presence of harder minerals such as pyrite can, depending on the particle shape and mode of occurrence in the coal particles, potentially be related to the erosion or wearing of the gasification and combustion process equipment during pulverization (Falcon and Falcon, 1987). In addition, Kogut et al. (2021) found that the HGI decreases with an increase in the total sulphur content in Polish coking coals; total sulphur is generally associated with pyrite.
The XRF analysis indicates the inorganic elements present in the ashes of the feed coal and its density fractions (Table II). All inorganic elements are associated with mineral matter (minerals and non-mineral inorganics). Higher proportions of Si and Al are likely associated with kaolinite and microcline in the rock fragments (mudstone, siltstone, and sandstone) identified by the XRD analysis (Tables II and III). Also, a higher proportion of Si is linked to both quartz and clay minerals present in the samples. In previous studies on Highveld coals (Rautenbach et al., 2019), it was observed that there is an increase in Si and AI in the heavier sink fraction. Our XRF results (Table II) are consistent with those results. The ash yield, mineral matter, and inorganic elements contained in the coal samples can affect the grindability (Babu, Lawrence, and Sivashanmugam, 2017).
The XRD analysis of the feed coal and its density–separated fractions indicate that these samples contained significantly high
Chemical composition of ashes (inorganic elemental oxides oxides) of feed coal and its density-separated fractions (SO3- free, wt.
Table III
Mineralogical composition of feed coal and density-separated fractions (wt. %)

proportions of kaolinite, mineral matter and quartz with lesser proportions of dolomite, pyrite, and calcite, and a minor proportion of microcline and traces of illite and anatase (Table III). As the density of the organic liquid decreased, the proportions of quartz and kaolinite significantly decreased in the density–separated fractions (Table III). A higher concentration of amorphous organic carbon significantly decreased in the density–separated fractions as the density of the organic liquid increased. The proportion of mineral matter increased in the density–separated fractions with an increase in the density of the organic liquid. The <1.7 g.cm-3 float fraction has the highest proportions of dolomite and calcite compared to density fractions. This implies that the pyrite, quartz, and kaolinite which are associated with the extraneous rock fragments (mudstone, siltstone, and sandstone) are mostly concentrated in the > 1.9 g.cm-3 sink fraction samples, and inherent pyrite, quartz and kaolinite associated with a small proportion of carbon containing particles. These XRD results are consistent with the XRD data obtained from the previous mineralogical studies on Highveld coal samples (Matjie et al., 2016; Rautenbach et al., 2019).
The random vitrinite reflectance values (RoV%) of the feed coal and density fractions are presented in Table IV. The vitrinite reflectance analysis indicates that the samples represent medium rank C bituminous coal as per the ECE-UN 1988 in-seam classification scheme. The standard deviation is low. The <1.9 g.cm-3 float sample and >1.9 g.cm-3 sink sample with high ash yield contained very few collotelinite (vitrinite) particles and hence the samples were not suitable for reflectance analysis. The reflectance results from the other samples ( <1.5 g/cm-3, <1.7 g.cm-3, and feed coal) indicate uniform results for South African coals (Falcon and Falcon, 1987; Borrego, Alvarez, and Menéndez, 1997).
The maceral compositions (reported as percentage by volume) of the feed coal and beneficiated fractions are shown in Table V. Micrographs of the <1.5 g.cm-3 float fraction and the >1.9 g.cm-3 sink fraction are presented in Figures 3 and 4 respectively. The vitrinite content increased from 15.3 vol.% in the feed coal to 33.3
Table IV
Vitrinite reflectance analysis (RoV%)
M: Medium rank C; * C too low: collotelinite too low
Table V
vitrinite; (ii) Banded vitrinite and (lighter shade) inertinite, with very small, included quartz minerals; (iii) Banded coal with (dark) liptinite, (medium grey) vitrinite, and (light) inertinite. The image is dominated by inertinite; (iv) Particle enriched in liptinite; (v) Fluorescent image of (iv); (vi) Banded vitrinite with a clean vitrinite band on top and a band of vitrinite with included clays and pyrite (reflected light, oil immersion, x500, scale included 100 microns)
vol.% in the <1.5 g.cm-3 float fraction and decreased to 14.2 vol.%, 3.9 vol.%, and 4.5 vol.% in the <1.7 g.cm-3 float fraction, <1.9 g.cm-3 float fraction, and >1.9 g.cm-3 sink fraction respectively as the density of the organic liquid increased. The inertinite content
Maceral group composition and total minerals of the feed coal and its density-separated fractions (vol. %)

remained similar in the feed coal and the <1.5 g.cm-3 float fraction, increasing to 62.3 vol.% and 56 vol.% in the <1.7 g.cm-3 float fraction and <1.9 g.cm-3 float fractions respectively. The content of liptinite, which is a more ductile maceral and thus harder to grind (Trimble and Hower, 2003; Rejdak, Micorek, and Hower, 2018), increased from 4 vol.% in the feed coal to 5.9 vol.% in the <1.5 g.cm-3 float fraction and decreased to 3.7 vol.% and 1.7 vol.% in the <1.7 g.cm-3 and <1.9 g.cm-3 float fractions respectively.
When comparing the petrographic results it is evident that there is a decrease in vitrinite and liptinite contents as the density of the organic liquid is increased. This resulted in the highest vitrinite and liptinite contents reporting in the <1.5 g.cm-3 float fraction (hard to grind). Furthermore, the >1.9 g.cm-3 sink fraction (softest to grind) is characterized by the lowest proportions of inertinite (14.1 vol.%), vitrinite and liptinite (1.2 vol.%), and the highest proportion of mineral matter (80 vol.%). These results are consistent with maceral data of coal samples obtained in previous studies (Rautenbach et al., 2019). Also, the petrographic results of the sink fraction agree with the XRD results of this material in terms of a higher mineral matter content.
The HGI values obtained using a standard HGI analysis are depicted in Figure 5. It is clear that the HGI values of the density fractions increase with an increase in the particle density produced from the density separation experiments. The <1.5 g.cm-3 float fraction achieved the lowest HGI value of 56.5 (hardest to grind) compared to 68.6 and 62.6 for the feed coal and the <1.7 g.cm-3 float fraction respectively. However, the >1.9 g.cm-3 sink fraction had the highest HGI value (76), and is thus softest to grind.
The higher proportion of total macerals with a higher carbon content as well as a higher proportion of liptinite (6 vol.%, Table V), together with the lower kaolinite content (9%, Table III) present in the <1.5 g.cm-3 float fraction are attributed to the hardness of this fraction, which can be linked with the equipment wear during preparation of the PF.
Coals which have lower HGI values grind or pulverize with difficulty and subsequently result in erosion and damage to the plant crushers and pulverizer parts (Falcon and Ham, 1988; Sligar, 1998; Deniz, 2011). Furthermore, these materials require high energy to pulverize. On the other hand, the >1.9 g.cm-3 sink fraction with a higher mineral matter content and higher ash yield, as well as a lower macerals content, exhibited the highest HGI value. This fraction can be pulverized or ground with ease to produce PF of poor quality (due to the lower carbon content) without damaging the crusher parts. It has also been reported that Afsin-Elbistan (Turkey) coals or rocks containing higher ash yields, as well as soft mudstone, can be milled very easily (Ürünveren et al., 2017; Bhattarai et al., 2007).
The percentage of dried finer particles passing a 75 µm sieve after milling the <1000 μm >250 μm coal samples (feed coal, <1.5 g.cm-3 float fraction, <1.7 g.cm-3 float fraction, <1.9 g.cm-3 float fraction, and >1.9 g.cm-3 sink fraction) for 1 hour are 59.4, 56.4, 58.3, 63.6, and 66.9 respectively.

The <1.9 g.cm-3 float fractions and >1.9 g.cm-3 sink fraction contain significantly higher mineral matter (Tables III and V) compared to the other samples, which contained higher proportions of <75 µm particles. This formation of finer particles can be ascribed to the high proportion of mineral matter present, consisting of soft mudstone rock fragments (kaolinite and spherical quartz particles or quartz grains) (Wetzel and Einsele, 1991; Bhattarai et al., 2007), and lower contents of carbon and total macerals (Tables I and V). Also, the >1.9 sink fraction had the highest HGI value, which is associated with the softness of the sink particles. This fraction can thus be milled/ground easily during the grindability experiments without wearing the mill or crusher parts.
Due to higher proportions of total macerals and carbon (Tables I and V) as well as lower mineral matter content (Tables III and V) and a lower HGI value (Figure 5) in the <1.5 g.cm-3 float fraction, this sample contained the lowest proportion of <75 µm particles. Therefore, this fraction contained harder particles which were ground with difficulty during the grindability study. This sample can be linked with the erosion or damage to the crusher or mill parts during the preparation of PF. On the other hand, 40.6, 47.6, 41.7, 36.4, and 33.1% of the coarser particles (>75 µm) of the coal samples respectively, were retained on the 75 µm sieve during the wet screening procedure.
From the one-hour milling experiments the <1.5 g.cm-3 float was identified as the fraction hardest to grind, which is related to the high proportion of total macerals and carbon. Results show that the percentage of <75 µm particles increase with an increase in the grinding time (Table VI) with the CV of 27.5 MJ/kg (Table I). This implies that more energy, which is not economically favourable, is required to grind the hard particles present.
The results for the density fractions in this investigation can be used in the coal preparation plant to produce a suitable PF (20–32% ash yield, 0.5-1% total S, 40–55% fixed-carbon, and CV of 15–25 MJ/kg) for feeding to South African boilers.
PSD results for the feed coal and density fractions after grinding for 1 hour are depicted in Figures 6. It is apparent that the PSD curves shift to the left-hand side (more fine particles) with increasing grinding time. Thus, the >1.9 g.cm-3 sink fraction with a high HGI value, containing significant proportions of mineral matter and ash yield as well as a lower total macerals content, being easier to grind generated significant amounts of finer particles (<75 µm) compared to the other samples (Figure 6). Furthermore, the <1.5 g.cm-3 float fraction which contained the highest contents of carbon, fixedcarbon, and total macerals and the lowest mineral matter content and ash yield, produced only a small amount of fine particles (<75 µm) and retained a higher proportion of coarse particles (>75 µm) compared to the >1.9 g.cm-3 sink fraction. This sample (Figure 6) is comparatively difficult to gring, which can subsequently contribute to the damage and erosion of equipment during pulverization and result in a low production efficiency due to the energy consumption for grinding as well as more frequent boiler shutdowns.

Effect of grinding time on PSD of the <1.5 g.cm-3 float fraction
PSD results for the selected hard (<1.5 g.cm-3) float fraction with the lowest HGI value pulverized for different times are illustrated in Figure 7. It can be seen that the longer the grinding time, the more the PSD curves shift to the left-hand side of the figure. This means that significant amounts of finer particles (<75 µm) are produced after grinding for 120 minutes. As expected, the number of finer particles increases with an increase in the grinding time. Thus, more energy is needed to grind the sample with the lowest HGI value (higher hardness). A lower HGI (hard) coal and a higher HGI (soft) coal should therefore be blended at the optimum ratio to prepare a feedstock for PF production while taking into account the combustibility and reactivity of carbon.

HGI correlation coefficients (R2)

R2 values were calculated for the correlation between the chemical, mineralogical, and petrographic results (Tables I, III, and V) for the feed coal and its density fractions and their HGI values. For example, the inherent moisture content was correlated with the HGI
Percentages of <75 µm particles at different grinding times
float fraction

of the coal samples using Results Set 1 of the measured HGI values (Figure 5) and Results Set 2 of the inherent moisture values (Table I), as well as by Equation [1].
The calculated R2 values are presented in Figure 8. It can be observed that the inherent moisture (dry) and total sulphur (dry) have minor effects on the HGI values, while ash yield (dry), mineral matter (dry), fixed-carbon (dry), amorphous organic carbon (dry), and total macerals (dry) have significant impacts. Kogut et al (2021) confirmed that the inherent moisture (dry), oxygen (dry), and total sulphur (dry) have the least effects on the HGI values of coals evaluated in their studies, and volatile matter (dry), carbon (dry), hydrogen (dry), nitrogen (dry), and fixed-carbon (dry) have substantial effects.
Sengupta (2002) found that the higher R2 of 0.94 was achieved with the HGI being correlated with proximate analysis results for coal using a statistical grindability index (SGI). The SGI was found useful for evaluating coal behaviour during the pulverization of coarse coal to produce PF. Idris et al. (2022) developed a model
➤ XRD analysis detected significant proportions of kaolinite and quartz, with lesser proportions of dolomite, pyrite, and calcite and traces of illite, microcline, and anatase in the feed coal and its density fractions. The highest proportions of quartz, kaolinite, and total mineral matter were evident in the >1.9 g.cm-3 sink fraction, where they are associated with fragments of soft mudstone, siltstone, and sandstone.
➤ The >1.9 g.cm-3 sink fraction, which had a high mineral matter content and ash yield, as well as a low total macerals content, had the highest HGI value. This material can easily be milled to produce pulverized fuel (PF) of poor quality without damaging the plant crusher parts.
that yielded better HGI predictions for blends of low-grade and high-grade coal, with R2 = 0.94 using proximate, ultimate, and HGI results.
Some soft mudstone particles with associated kaolinite and lower carbon content in the >1.9 g.cm-3 sink fraction could possibly be broken or ground with ease to generate more fines or dusts during grinding (Hower, Graese, and Klapheke, 1987; Bhattarai et al., 2007; Wetzel and Einsele, 1991). These sink samples may thus have a higher HGI value. On the other hand, the float samples containing higher proportions of carbon associated with macerals and lower proportions of inherent mineral matter (including kaolinite and quartz) can be harder to grind than the sink fraction. These float fractions are thus postulated to have lower HGI values and a higher organic carbon content, thereby requiring higher energy to grind (Sligar, 1998; Deniz, 2011).
A range of techniques (proximate and ultimate, sulphur speciation, total sulpur, XRF, XRD, HGI, PSD, and petrology) was used to investigate the effects of chemical, mineralogical, physical, and petrographic properties on the HGI of a feed coal and its density fractions. Factors that are associated with damage to plant equipment were calculated to R2 values and correlated with the measured HGI, and further time-based grindability tests were conducted.
➤ Proximate results indicate that the >1.9 g.cm-3 sink fraction generated the highest ash yield and mineral matter, and had the lowest contents of fixed-carbon and volatile matter. The <1.5 g.cm-3 float fraction contained the highest volatile matter and percentage fixed-carbon compared to the <1.7 g.cm-3 and <1.9 g.cm-3 fractions. The high volatile matter and fixed-carbon contents, along with the low ash yield, could potentially contribute to the hardness of the <1.5 g.cm-3 float fraction as shown in the grindability tests.
➤ Ultimate analysis results show that the float fraction samples (<1.5 g.cm-3, <1.7 g.cm-3, <1.9 g.cm-3) and the feed coal sample contained higher carbon, nitrogen, and hydrogen than the >1.9 g.cm-3 sink fraction.
➤ The sulphur analysis detected pyrite in the coal particles. Depending on the shape, size, and mode of occurrence of the particles, which are harder than coal, pyrite may contribute to the wearing of equipment during pulverization of the feed coal in preparation for gasification and combustion.
➤ Due to the high proportions of mineral matter (kaolinite and quartz)) in the <1.9 g.cm-3 float fraction and >1.9 g.cm-3 sink fraction, these samples yielded more finer particles (<75 µm) and fewer coarser particles (>75 µm) during the laboratory grindability tests. The <1.5 g.cm-3 float fraction generated the least finer particles (<75 µm) and the highest proportion of coarser particles (>75 µm) due to higher contents of total macerals and carbon and lower mineral matter content, which resulted in the lowest HGI value. This fraction contained harder particles which were ground with difficulty. The hardness of these particles can be linked with equipment wear during the preparation of PF.
➤ Results also show that the percentage of finer particles (<75 µm) increases with an increase in the grinding time during the milling of the <1.5 g.cm-3 float fraction, while the percentage of coarser particles (>75 µm) decreases. More energy, which is not economically favourable, is required to grind these harder <1.5 g.cm-3 float fraction particles with higher proportions of total macerals and fixed-carbon.
➤ PSD results from the milling tests indicate that the <1.5 g.cm-3 float fraction (the hardest sample) produced a small number of fine particles and a significant number of coarse particles compared to of the >1.9 g.cm-3 sink fraction (the softest sample).
➤ From the measured HGI results, the calculated R2 values for inherent moisture, ash yield, and contents of fixed-carbon, total sulphur, total minerals (kaolinite and quartz), total mineral matter, amorphous organic carbon, and total maceral content are 0.48, 0.89, 0.91, 0.62, 0.77, 0.79, 0.79, and 0.85 respectively. Based on the R2 values, the inherent moisture (dry basis) and total sulphur (dry) have only minor effects on the HGI values. On the other hand, the ash yield, mineral matter, sum of proportions of kaolinite and quartz, fixedcarbon, amorphous organic carbon, and macerals (all on a dry basis) have significant impacts on the HGI values.
These results indicate that in commercial combustion plants, a blending strategy of coals with different mineralogical and petrological properties should be adopted to generate a suitable PF with 20–32% ash yield (a.d.b), <0.5–1% total sulphur (a.d.b), 40–55% fixed-carbon (a.d.b), and calorific value 15-25 MJ.kg-1 with low equipment wear propensity and no influence on the efficiency or erosion of the boiler. It is highly recommended that the effects of the types microlithotypes and macerals on the grinding (HGI) of South African feed coals and their density fractions be studied during pulverization tests.

The authors thank SGS SA (Pty) Ltd laboratories, Secunda for
preparation of the coal samples for the experiments at North-West University; in particular Morne van Zyl of SGS laboratories, Prof N. Wagner of the University of Johannesburg, Geology Department, Dr Sabine Verryn of XRD Analytical and Consulting, Mrs. B Venter and the analysts of the School of Chemical and Minerals Engineering, North-West University, as well as SGS analysts for analyses following the proximate, ultimate, sulphur speciation, HGI, XRD, XRF, petrographic, and PSD test work, respectively. The authors acknowledged NWU fourth-year student, Miss Anne Goosen for extracting this manuscript from her research report. The information presented in this paper is based on research financially supported by the SA Research Chairs Initiative (SARChI) of the Department of Science and Technology and the National Research Foundation of South Africa (Coal Research Chair Grant No. 86880). Any opinion, finding, or conclusion or recommendation expressed is that of the authors and the NRF does not accept any liability in this regard.
Babu, K.A., Lawrence, A., and Sivashanmugam, P. 2018. Grindability studies on blended coals of high-ash Indian coals with low-ash imported coals. International Journal of Coal Preparation and Utilization, vol. 38, no. 8. pp. 433–442. doi: 10.1080/19392699.2017.1281254
Bhattarai, P., Marui, H., Tiwari, B., Watanabe, N., and Tuladhar, G.R. 2007. “Depth-wise variation of physical and mechanical properties of mudstone in relation to weathering -cases in several landslides in Niigata Prefecture. Journal of the Japan Landslide Society, vol. 44, no. 2. pp. 79–89. doi:10.3313/JLS.44.79
Borrego, A.G., Alvarez, D., and Menendez, R. 1997. Effects of Inertinite content in coal on char structure and combustion. Energy and Fuels, vol. 11, no. 3. pp. 702–708.
Deniz, V. 2011. Effects of two important parameters on capacity of a laboratory jaw crusher of different coals: Choke feed level and effective reduction ration. International Journal of Coal Preparation and Utilization, vol. 31, no. 6. pp. 335–45. doi:10.1080/19392699.2011.576657
Engelbrecht, A.D., Everson, R.C., Neomagus, H.W.P.J., and North, B.C. 2010. Fluidized bed gasification of selected South African coals. Journal of the Southern African Institute of Mining and Metallurgy, vol. 110. pp. 225–30.
Falcon, R.M.S. and Falcon, L.M. 1987. The petrographic composition of Southern African coals in relation to friability, hardness, and abrasive indices. Journal of the Southern African Institute of Mining and Metallurgy, vol. 87, no. 10. pp. 323–36. doi: 10.10520/AJA0038223X_1745.
Falcon, R. and Ham, A.J. 1988. The characteristics of Southern African coals. Journal of the Southern African Institute of Mining and Metallurgy, vol. 88, no. 5. pp. 145–161.
Faure, K., Willis, J. P., and Dreyer, J. C. 1996. The Grootegeluk formation in the Waterberg Coalfield, South Africa: Facies, palaeoenvironment and thermal history — Evidence from organic and clastic matter. International Journal of Coal Geology, vol. 29, no. 1–3. pp. 147–86. doi: 10.1016/0166-5162(95)00029-1.
Hansen, A.E. and Hower, J.C. 2014. Notes on the relationship between microlithotype composition and Hardgrove grindability index for rank suites of Eastern Kentucky (Central Appalachian) coals. International Journal of Coal Geology, vol. 131. pp. 109–112.
Honaker, R.Q., Mohanty, M.K., and Crelling, J.C. 1996. Coal maceral separation using column flotation. Minerals Engineeirng, vol. 9. pp. 449–464.
Hower, J.C., Graese, A.M., and Klapheke, J.G. 1987. Influence of microlithotype composition on Hardgrove grindability for selected eastern Kentucky coals. International Journal of Coal Geology, vol. 7. pp. 227–244
Hower, J.C., Bagherieh, A.H., Dindarloo, S.R., Trimble, A.S., and Chelgani, S.C. 2021. Soft modelling of the hardgrove grindability index of bituminous coals: An overview. International Journal of Coal Geology, vol. 247. 103846.
Idris, A., Man, Z., Bustam, A., Rabat, N.E., Uddin, F., and Mannan, H.A. 2022. Grindability and abrasive behavior of coal blends: Analysis and prediction. International Journal of Coal Preparation and Utilization, vol. 42. no. 4. pp. 1143–1169. doi:10.1080/19392699.2019.1694009
Jeffrey, L. 2005. Challenges associated with further development of the Waterberg Coalfield. Journal of the South African Institute of Mining and Metallurgy, vol. 105. pp. 453–457.
Khoshjavan, S., Khoshjavan, R., and Reza, B. 2013. Evaluation of the effect of coal chemical Properties on the hardgrove grindability index (HGI) of coal using artificial neural networks. Journal of the Southern African Institute of Mining and Metallurgy, vol. 113. pp. 505–510.
Kogut, K., Cablik, V., Matusiak, P., Kowol, D., Suponik, T., Franke, D. M., Tora, B., and Pomykala, R. 2021. A study on the hard coal grindability dependence on selected parameters. Energies, vol. 14. 8158. doi: 10.3390/ EN14238158
Malvern Instruments Ltd. 2015. 'Mastersizer 3000 User Manual.' MAN047407EN-00.
Mangena, S.J. 2001. The amenability of some South African bituminous coals to binders briquetting. MTech Chemistry. Faculty of natural sciences, Technikon Pretoria, South Africa.
Matjie, R.H., Van Alphen, C., and Pistorius, P.C. 2006. Mineralogical characterization of Secunda gasifier feedstock and coarse ash. Minerals Engineering, vol. 19, no. 3. pp. 256–261. doi:10.1016/J.MINENG.2005.06.010
Matjie, R.H., Li, Z., Ward, C.R., Bunt, J.R., and Strydom, C.A. 2016. Determination of mineral matter and elemental composition of individual macerals in coals from Highveld mines. Journal of the Southern African Institute of Mining and Metallurgy, vol. 116, no. 2. pp. 169–180. doi:10.17159/24119717/2016/v116n2a8
Matjie, R.H., Lesufi, J.M., Bunt, J.R., Strydom, C.A., Schorbet, H.H., and Uwaoma, R. 2018. In situ capturing and absorption of sulfur gases formed during thermal treatment of South African coals. ACS Omega, vol. 3, no. 10. pp. 14201–14212. doi:10.1021/ACSOMEGA.8B01359/ASSET/IMAGES/ LARGE/AO-2018-01359M_0008.JPEG
Nag, D., Das, B., Singh, R., Sriramoju, S., Meshram, A., and Dash, P.S. 2022. Effect of Grinding Behavior on Liberation of Coal Macerals. ISIJ International, vol. 62, no. 1. pp. 99–103. https://doi.org/10.2355/isijinternational.
ISIJINT-2021-209
Norrish, K., and Hutton, J.T. 1969. An accurate X-ray spectrographic method for the analysis of a wide range of geological samples. Geochimica et Cosmochimica Acta, vol. 33, no. 4. pp. 431–453. doi: 10.1016/0016-7037(69)90126-4
Rautenbach, R., Strydom, C.A., Bunt, J.R., Matjie, R.H., Campbell, Q.P., and Van Alphen, C. 2019. Mineralogical, chemical, and petrographic properties of selected South African power stations’ feed coals and their corresponding density-separated fractions using float-sink and reflux classification methods. International Journal of Coal Preparation and Utilization, vol. 39, no. 8. pp. 421–446. doi:10.1080/19392699.2018.1533551
Rejdak, M., Micorek, T., and Hower, J.C. 2018. Influence of selected factors of Polish coking coals on the Hardgrove grindability index (HGI). International Journal of Coal Preparation and Utilization, vol. 41, no. 11. pp. 789–802. doi:10. 1080/19392699.2018.1526790
Rietveld, H.M. 1969. A profile refinement method for nuclear and magnetic structures. Journal of Applied Crystallography, vol. 2, no. 2. pp. 65–71. doi: 10.1107/S0021889869006558.
Sengupta, A.N. 2002. An assessment of grindability index of coal. Fuel Processing Technology, vol. 76, no. 1. pp. 1–10. doi: 10.1016/S0378-3820(01)00236-3
Shahzad, M., Iqbal, M.M., Hassan, S.A., Saqib, S., and Waqas, M. 2014(a). An assessment of chemical properties and hardgrove grindability index of Punjab coal. Pakistan Journal of Scientific and Industrial Research Series A; Physical Sciences, vol. 57, no. 3. pp. 139–144.
Shahzad, K.S., Kanwal, S., Nawaz, N., Sheikh., and Muni, S. 2014(b). Effects of moisture and coal blending on the hardgrove grindability index of Pakistani coals. International Journal of Coal Preparation and Utilization, vol. 34. pp. 1–9. doi:10.1080/19392699.2013.776961
Sligar, J. 1998. The Hardgrove grindability index. https://www.acarp.com.au/ Media/ACARP-WP-5-HardgroveGrindabilityIndex.pdf.
Speakman, S.A. 2012. Introduction to PANalytical X’Pert HighScore Plus v3. 0. MIT Center for Materials Science and Engineering. http://prism.mit.edu/xray/ HighScore%20Plus%20Guide.pdf
Steyn, M., and Minnitt, R.C.A. 2010. Thermal coal products in South Africa. Journal of the Southern African Institute of Mining and Metallurgy, vol. 110. pp. 593–599.
Tiryaki, B. and Dikmenik, A.C. 2005. Effects of rock properties on specific cutting energy in Llinear cutting of sandstones by picks. Rock Mechanics and Rock Engineering, vol. 39, no. 2. pp. 89–120. doi: 10.1007/S00603-005-0062-7
Trimble, A.S., and Hower, J.C. 2003. Studies of the relationship between coal petrology and grinding properties. International Journal of Coal Geology, vol. 54. pp. 253–260.
Tsemane, M.M., Matjie, R.H., Bunt, J.R., Neomagus, H.W.J.P., Strydom, C.A., Waanders, F.B., Van Alphen, C., and Uwaoma, R. 2019. Mineralogy and petrology of chars produced by South African caking coals and densityseparated fractions during pyrolysis and their effects on caking propensity. Energy and Fuels, vol.33, pp. 7645−7658.
Ürürnveren, A., Altiner, M., Kuvvetli, Y., Ural, O.B., and Ural, S. 2020. Prediction of hardgrove grindability index of Afsin-Elbistan (Turkey) low-grade coals based on proximate analysis and ash chemical composition by neural networks. International Journal of Coal Preparation and Utilization, vol. 40, no. 10. pp. 701–711. doi:10.1080/19392699.2017.1406350
Van Vuuren, M.C.J. 1978. A Survey of the hardgrove grindability indices from colliery product samples. Fuel Research Institute of South Africa, vol. 62. pp. 57–68.
Vranjes, S., Misch, D., Schoberl, T., Kiener, D., Gross, D., and Sachsenhoffer, R.F. 2018 Nanoindentation study of macerals in coals from the Ukrainian Donets Basin. Advances. In Geosciences, vol. 45. pp. 73–83.
Wetzel, A. and Einsele, G. 1991. On the physical weathering of various mudrocks. Bulletin of the International Association of Engineering Geology, vol. 44. pp. 89–100. doi: 10.1007/BF02602713 u
15 September 2023 — The Overberg Geoscientists Group Hydrometallurgy for the Future
Harold Porter Gardens, Bettys Bay
Contact: Hennie Greeff
E-mail: hennie.greeff@gmail.com
28 September 2023 — Cape Mining Club Event
Cape Town Beach Bar
Contact: Candice
E-mail: candice@capeminingclub.com
Website: https:/capeminingclub.com/
21-21 September 2023 — 6th Young Professionals Conference 2023
The Canvas, Riversands, Fourways
Contact: Gugu Charlie
Tel: 011 538-0238
E-mail: gugu@saimm.co.za
Website: http://www.saimm.co.za
26-27 September 2023 — DIMI SAIMM Diversity and Inclusion Dialogue 2023
Intersectionality in the Minerals Industry From Awareness to Action
Avianto, Muldersdrift Johannesburg, South Africa
Contact: Camielah Jardine
Tel: 011 538-0237
E-mail: camielah@saimm.co.za
Website: http://www.saimm.co.za
10-12 October 2023 — 11th International Symposium on Ground Freezing 2023
London
Website: https://www.iom3.org/events-awards/11thinternational-symposium-on-ground-freezing.html
24-26 October 2023 — Next Generation Tailings –Opportunity or Risk?
Emperors Palace Conference Centre, Kempton Park, Johannesburg, South Africa
Contact: Camielah Jardine
Tel: 011 538-0237
E-mail: camielah@saimm.co.za
Website: http://www.saimm.co.za
11-13 October 2023 — 11TH International Ground Freezing Symposium 2023
London, United Kingdom
E-mail: events@iom3.org
Website: https://www.iom3.org/events-awards/11thinternational-symposium-on-ground-freezing.html
7 November 2023 — 19th Annual Student Colloquium
Mintek, Randburg
Contact: Gugu Charlie
Tel: 011 538-0238
E-mail: gugu@saimm.co.za
Website: http://www.saimm.co.za
7-9 November 2023 — Hydroprocess 2023 14TH International Conference on Process Hydrometallurgy
Sheraton Hotel, Santiago, Chile
Website: https://gecamin.com/hydroprocess/index
15 November 2023 — Carbon Tax Colloquium 2023
South Africa and the context of the global mining industry
54 on Bath, Rosebank, Johannesburg, South Africa
Contact: Camielah Jardine
Tel: 011 538-0237
E-mail: camielah@saimm.co.za
Website: http://www.saimm.co.za
28 November 2023 — MineSafe Online Conference 2023
Contact: Camielah Jardine
Tel: 011 538-0237
E-mail: camielah@saimm.co.za
Website: http://www.saimm.co.za
2024
13-14 March 2024 — Southern African Pyrometallurgy 2024 International Conference
Pyrometallurgical modelling- now and into the future
Misty Hills Conference Centre, Johannesburg, South Africa
Contact: Camielah Jardine
Tel: 011 538-0237
E-mail: camielah@saimm.co.za
Website: http://www.saimm.co.za
21-23 May 2024 — The 11th World Conference of Sampling and Blending 2024 Hybrid
Misty Hills Conference Centre, Johannesburg, South Africa
Contact: Camielah Jardine
Tel: 011 538-0237
E-mail: camielah@saimm.co.za
Website: http://www.saimm.co.za
27-31 May 2024 — Nickel-Cobalt-Copper Lithium-Battery Technology-REE 2024 Conference and Exhibition
Perth, Australia
Website: https://www.altamet.com.au/conferences/alta-2024/
18-20 June 2024 — Southern African Rare Earths 2ND International Conference 2024
Swakopmund Hotel and Entertainment Centre, Swakopmund, Namibia
Contact: Camielah Jardine
Tel: 011 538-0237
E-mail: camielah@saimm.co.za
Website: http://www.saimm.co.za
3-5 July 2024 — 5TH School on Manganese Ferroalloy Production
Decarbonization of the Manganese Ferroalloy Industry
Boardwalk ICC, Gqeberha, Eastern Cape, South Africa
Contact: Gugu Charlie
Tel: 011 538-0238
E-mail: gugu@saimm.co.za
Website: http://www.saimm.co.za
1-3 September 2024 — Hydrometallurgy Conference 2024 Hydrometallurgy for the Future
Hazendal Wine Estate, Stellenbosch, Western Cape, South Africa
Contact: Camielah Jardine
Tel: 011 538-0237
E-mail: camielah@saimm.co.za
Website: http://www.saimm.co.za
The following organizations have been admitted to the Institute as Company Affiliates
3M South Africa (Pty) Limited
acQuire Technology Solutions
AECOM SA (Pty) Ltd
AEL Mining Services Limited
African Pegmatite (Pty) Ltd
Air Liquide (PTY) Ltd
Alexander Proudfoot Africa (Pty) Ltd
Allied Furnace Consultants
AMEC Foster Wheeler
AMIRA International Africa (Pty) Ltd
ANDRITZ Delkor(Pty) Ltd
Anglo Operations Proprietary Limited
Anglogold Ashanti Ltd
Anton Paar Southern Africa (Pty) Ltd
Arcus Gibb (Pty) Ltd
ASPASA
Aurecon South Africa (Pty) Ltd
Aveng Engineering
Aveng Mining Shafts and Underground
Axiom Chemlab Supplies (Pty) Ltd
Axis House Pty Ltd
Bafokeng Rasimone Platinum Mine
Barloworld Equipment -Mining
BASF Holdings SA (Pty) Ltd
BCL Limited
Becker Mining (Pty) Ltd
BedRock Mining Support Pty Ltd
BHP Billiton Energy Coal SA Ltd
Blue Cube Systems (Pty) Ltd
Bluhm Burton Engineering Pty Ltd
Bond Equipment (Pty) Ltd
Bouygues Travaux Publics
Caledonia Mining South Africa Plc
Castle Lead Works
CDM Group
CGG Services SA
Coalmin Process Technologies CC
Concor Opencast Mining
Concor Technicrete
Council for Geoscience Library
CRONIMET Mining Processing
SA Pty Ltd
CSIR Natural Resources and the Environment (NRE)
Data Mine SA
DDP Specialty Products South Africa (Pty) Ltd
Digby Wells and Associates
DRA Mineral Projects (Pty) Ltd
DTP Mining - Bouygues Construction
Duraset
EHL Consulting Engineers (Pty) Ltd
Elbroc Mining Products (Pty) Ltd
eThekwini Municipality
Ex Mente Technologies (Pty) Ltd
Expectra 2004 (Pty) Ltd
Exxaro Coal (Pty) Ltd
Exxaro Resources Limited
Filtaquip (Pty) Ltd
FLSmidth Minerals (Pty) Ltd
Fluor Daniel SA ( Pty) Ltd
Franki Africa (Pty) Ltd-Jh
Fraser Alexander (Pty) Ltd
G H H Mining Machines (Pty) Ltd
Geobrugg Southern Africa (Pty) Ltd
Glencore
Gravitas Minerals (Pty) Ltd
Hall Core Drilling (Pty) Ltd
Hatch (Pty) Ltd
Herrenknecht AG
HPE Hydro Power Equipment (Pty) Ltd
Huawei Technologies Africa (Pty) Ltd
Immersive Technologies
IMS Engineering (Pty) Ltd
Ingwenya Mineral Processing (Pty) Ltd
Ivanhoe Mines SA
Kudumane Manganese Resources
Leica Geosystems (Pty) Ltd
Loesche South Africa (Pty) Ltd
Longyear South Africa (Pty) Ltd
Lull Storm Trading (Pty) Ltd
Maccaferri SA (Pty) Ltd
Magnetech (Pty) Ltd
MAGOTTEAUX (PTY) LTD
Malvern Panalytical (Pty) Ltd
Maptek (Pty) Ltd
Maxam Dantex (Pty) Ltd
MBE Minerals SA Pty Ltd
MCC Contracts (Pty) Ltd
MD Mineral Technologies SA (Pty) Ltd
MDM Technical Africa (Pty) Ltd
Metalock Engineering RSA (Pty)Ltd
Metorex Limited
Metso Minerals (South Africa) Pty Ltd
Micromine Africa (Pty) Ltd
MineARC South Africa (Pty) Ltd
Minerals Council of South Africa
Minerals Operations Executive (Pty) Ltd
MineRP Holding (Pty) Ltd
Mining Projections Concepts
Mintek
MIP Process Technologies (Pty) Limited
Modular Mining Systems Africa (Pty) Ltd
MSA Group (Pty) Ltd
Multotec (Pty) Ltd
Murray and Roberts Cementation
Nalco Africa (Pty) Ltd
Namakwa Sands(Pty) Ltd
Ncamiso Trading (Pty) Ltd
Northam Platinum Ltd - Zondereinde
Opermin Operational Excellence
OPTRON (Pty) Ltd
Paterson & Cooke Consulting
Engineers (Pty) Ltd
Perkinelmer
Polysius A Division Of Thyssenkrupp
Industrial Sol
Precious Metals Refiners
Rams Mining Technologies
Rand Refinery Limited
Redpath Mining (South Africa) (Pty) Ltd
Rocbolt Technologies
Rosond (Pty) Ltd
Royal Bafokeng Platinum
Roytec Global (Pty) Ltd
RungePincockMinarco Limited
Rustenburg Platinum Mines Limited
Salene Mining (Pty) Ltd
Sandvik Mining and Construction
Delmas (Pty) Ltd
Sandvik Mining and Construction
RSA(Pty) Ltd
SANIRE
Schauenburg (Pty) Ltd
Sebilo Resources (Pty) Ltd
SENET (Pty) Ltd
Senmin International (Pty) Ltd
SISA Inspection (Pty) Ltd
Smec South Africa
Sound Mining Solution (Pty) Ltd
SRK Consulting SA (Pty) Ltd
Time Mining and Processing (Pty) Ltd
Timrite Pty Ltd
Tomra (Pty) Ltd
Trace Element Analysis Laboratory
Traka Africa (Pty) Ltd
Trans-Caledon Tunnel Authority Administarator
Ukwazi Mining Solutions (Pty) Ltd
Umgeni Water
Webber Wentzel
Weir Minerals Africa
Welding Alloys South Africa
Worley
MINE SAFETY, HEALTH AND ENVIRONMENT CONFERENCE
28 NOVEMBER 2023 — ONLINE CONFERENCE - VIA ZOOM ONLY
29 NOVEMBER 2023 — INDUSTRY AWARDS DAY EMPERORS PALACE CONVENTION CENTRE


The conference is centered on improving safety, health and environmental practices within the mining and metallurgical industry. It seeks to create a platform for knowledge-sharing and idea exchange among various stakeholders, including mining companies, Department of Mineral Resources and Energy (DMRE), Minerals Council South Africa, labour unions, and health and safety practitioners at all levels within the industry. The main objectives of the conference are as follows:


Promoting Learning: The conference aims to facilitate a space where attendees can learn from each other’s experiences and best practices. This will help enhance overall safety and environmental standards in the mining and metallurgical sector.
Addressing Safety, Health, and Environment: The conference will focus on discussions related to safety and health issues within the industry, including the well-being of employees, contractors, and local communities. It will also emphasize the importance of reducing the environmental impact of mining and metallurgical processes.
Enhancing Relationships with Local Communities: Recognizing the significance of local communities, the conference will address the issues surrounding their relationship with mining companies. This can include concerns about environmental effects, community engagement, and socioeconomic impacts.
Zero Harm Approach: The conference will highlight the importance of adopting a ‘zero harm’ approach to health and safety in the mining and metallurgical sector. This means striving for an injury-free and accidentfree workplace.

Value-Based Approach: A value-based approach to health and safety implies that these aspects are not just compliance-driven but are deeply ingrained in the organizational values and culture. This conference aims to encourage discussions and strategies to promote such a value-based approach.
Addressing Key Challenges: The conference will tackle major challenges in the mining industry, such as logistics, energy usage, and safety concerns related to employees, contractors, and communities.
By bringing together diverse stakeholders and sharing their expertise and experiences, this conference hopes to foster a safer and more sustainable mining and metallurgical industry. It emphasizes the importance of collaboration and collective efforts to address the complex challenges faced by the sector.
Sponsorship opportunities are available. Companies wishing To partner on this event should contact the Conference Coordinator.
The conference should be of value to:
• Safety practitioners
• Mine management
• Mine health and safety officials

• Engineering managers
• Underground production supervisors
• Surface production supervisors
• Environmental scientists
• Minimizing of waste
• Operations manager

• Processing manager
• Contractors (mining)
• Including mining consultants, suppliers and manufacturers
• Education and training
• Energy solving projects
• Water solving projects
• Unions
• Academics and students
• DMRE
Call for presentations on the topics of safety, health and environment
Prospective authors are invited to submit titles and abstracts of their presentations in English and not longer than 500 words. Abstracts should be submitted to: Camielah Jardine, Head of Conferencing, E-mail: camielah@saimm.co.za
11 530 0237 Web: www.saimm.co.za


We acknowledge that the intent of carbon tax is to change user behaviour and reduce climate impact. SAIMM wants to evaluate ways to reduce its impact and ensure business viability.

This Colloquium, on the South African Carbon Tax, will provide an understanding of our own unique situation, in South Africa, compared to in the context of the global mining industry. This SA Carbon Tax policy was introduced by the SA government in June 2019, aimed at reducing the country’s greenhouse gas emissions. The aim of the tax is to create a financial incentive for companies to reduce their emissions by switching to cleaner technologies and adopting sustainable practices. Revenue generated from the tax should be used to fund initiatives aimed at promoting energy efficiency and renewable energy. In short: it should be a policy instrument that supports international commitments, a source of revenue that can be used to support initiatives that promote renewable energy, which will in turn create new opportunities for businesses and promote job creation. In specific studies published between 2016 and 2022, it show the negative impact of the carbon tax on economic growth is minimized when the revenue is fed back into the economy. The way carbon tax revenue is recycled back into the economy is important in terms of the extent of emissions reductions achieved. Is the South African carbon tax revenue being recycled efficiently? Or even correctly? Moreover, SA Carbon Tax and its implications for industry, necessitates an evaluation of alternatives to fossil fuel use.

This Colloquium will host presentations from universities, research institutes, development banks and renewable energy supply companies.
This colloquium will will endeavour to create a platform for discussion around the following questions:
Are we, in the minerals and metals industry, adequately informed to answer questions about any Carbon Tax policy (National or Global)?
Are we projecting negativity due to the general discontent with the current state of affairs –economic, social and political?
What is our definition of recycling tax revenue ‘efficiently’? Does this depend on perspective?

Is the Minerals and Metals Industry clear on their expectations of and from the South African Carbon Tax policy?
What exactly do we want as professionals and as an Industry?
What options do we as an Industry have? Do we have an option to influence the policy and the tax revenue recycling at all?
Can we ask assistance to analyze the positive and negative aspects of our current strategy and its execution?