
VOLUME 123 NO. 9 SEPTEMBER 2023

Presidential Address
Managing geotechnical uncertainty and risk in mining by
W.C. Joughin


VOLUME 123 NO. 9 SEPTEMBER 2023
Managing geotechnical uncertainty and risk in mining by
W.C. Joughin

William Joughin was born in Johannesburg in 1967. He attended school in Johannesburg, matriculating at Parktown Boys High in 1985. William then studied at the University of the Witwatersrand for a BSc Eng. (Mining), which he completed in in 1989.
After a year of national service in Kroonstad and Pretoria, William started working for Anglo American Gold Division as a mining graduate. The first three years were spent on Elandsrand (now Kusasalethu) and Western Deep Levels East (now Tau Tona). During this time, he started an MSc Eng degree in engineering management.
William then transferred to the rock engineering department, where he discovered his real passion.
He was seconded to integrated Seismic Systems International (now the Institute of Mine Seismology) to learn about mine seismic networks and rockburst management. He worked as a mine seismologist and a rock engineer for the next five years, on President Steyn no. 4 shaft (now Bambanani), then on Vaal Reefs no. 8 shaft (now Great Noligwa), Libanon, and Kloof gold mines. During this time, he completed his MSc Eng and a GDE in Rock Engineering, as well as the Chamber of Mines Rock Mechanics Certificate, Advanced Rock Engineering Certificate, and Mine Manager’s Certificate of Competency.
William decided to move from mining operations to consulting in 1998, joining SRK Consulting as a Senior Mining Engineer (Rock Engineering). During the first few years, he worked on consulting projects for several mines and research projects for SIMRAC and DeepMine. In 2002, William arranged a three-year secondment to South Deep Gold Mine, where he worked as a senior rock engineer to gain experience in drift-and-fill and longhole stoping mining methods.
Upon his return to consulting in 2005, he started to develop his own client base and lead research and consulting projects. In 2009, William was elected as a Partner and head of the mining geotechnical department for SRK SA. In 2016, he was elected as a director and then served as Chairman of SRK SA from 2018 to 2023. He is a director of SRK Global. William is fortunate to have had the opportunity to visit and provide consulting services for mines in 18 countries on six continents. He currently serves on rockburst management advisory boards for El Teniente, Chile and Kiruna, Sweden.
William has published over 50 articles on rock engineering and is the recipient of an SAIMM gold medal and the Alec Wilson Award (SANCOT) for outstanding papers. He has co-written two chapters on risk-based design in the book Ground Support in Underground Mines (Potvin and Hadjigeorgiou, 2020) produced by the Australian Centre for Geomechanics.
William is a Past President of the South African National Institute of Rock Engineering (SANIRE), and a Past Vice President for Africa of the International Society for Rock Mechanics (ISRM).

He joined the SAIMM as a student and has been a Council member since 2008. William has chaired three international rock engineering conferences and two schools at joint SAIMM and SANIRE conferences. He is a member of the Publications Committee and served as Treasurer since 2020. William married Sharon, an accountant, in 1999 and they have two boys, Michael (22) and Brandon (20). Michael is studying animation and Brandon is studying film-making, both at the SAE Academy in Rosebank.

OFFICE BEARERS AND COUNCIL FOR THE 2023/2024 SESSION
Honorary President
Nolitha Fakude
President, Minerals Council South Africa
Honorary Vice Presidents
Gwede Mantashe
Minister of Mineral Resources and Energy, South Africa
Ebrahim Patel
Minister of Trade, Industry and Competition, South Africa
Blade Nzimande
Minister of Higher Education, Science and Technology, South Africa
President
W.C. Joughin
President Elect
E. Matinde
Senior Vice President
G.R. Lane
Junior Vice President
T.M. Mmola
Incoming Junior Vice President
M.H. Solomon
Immediate Past President
Z. Botha
Honorary Treasurer
E. Matinde
Ordinary Members on Council
W. Broodryk M.C. Munroe
Z. Fakhraei S. Naik
R.M.S. Falcon (by invitation) G. Njowa
B. Genc
K.M. Letsoalo
S.B. Madolo
S.J. Ntsoelengoe
S.M. Rupprecht
A.T. van Zyl
F.T. Manyanga E.J. Walls
K. Mosebi
Co-opted Council Members
M.A. Mello
Past Presidents Serving on Council
N.A. Barcza C. Musingwini
R.D. Beck S. Ndlovu
J.R. Dixon J.L. Porter
V.G. Duke M.H. Rogers
I.J. Geldenhuys D.A.J. Ross-Watt
R.T. Jones G.L. Smith
A.S. Macfarlane W.H. van Niekerk
G.R. Lane – TP Mining Chairperson
Z. Botha – TP Metallurgy Chairperson
K.W. Banda – YPC Chairperson
S. Nyoni – YPC Vice Chairperson
Branch Chairpersons
Botswana Vacant
DRC Not active
Johannesburg N. Rampersad
Limpopo S. Zulu
Namibia Vacant
Northern Cape I. Tlhapi
North West I. Tshabalala
Pretoria Vacant
Western Cape A.B. Nesbitt
Zambia J.P.C. Mutambo (Interim Chairperson)
Zimbabwe Vacant
Zululand C.W. Mienie
*Deceased
* W. Bettel (1894–1895)
* A.F. Crosse (1895–1896)
* W.R. Feldtmann (1896–1897)
* C. Butters (1897–1898)
* J. Loevy (1898–1899)
* J.R. Williams (1899–1903)
* S.H. Pearce (1903–1904)
* W.A. Caldecott (1904–1905)
* W. Cullen (1905–1906)
* E.H. Johnson (1906–1907)
* J. Yates (1907–1908)
* R.G. Bevington (1908–1909)
* A. McA. Johnston (1909–1910)
* J. Moir (1910–1911)
* C.B. Saner (1911–1912)
* W.R. Dowling (1912–1913)
* A. Richardson (1913–1914)
* G.H. Stanley (1914–1915)
* J.E. Thomas (1915–1916)
* J.A. Wilkinson (1916–1917)
* G. Hildick-Smith (1917–1918)
* H.S. Meyer (1918–1919)
* J. Gray (1919–1920)
* J. Chilton (1920–1921)
* F. Wartenweiler (1921–1922)
* G.A. Watermeyer (1922–1923)
* F.W. Watson (1923–1924)
* C.J. Gray (1924–1925)
* H.A. White (1925–1926)
* H.R. Adam (1926–1927)
* Sir Robert Kotze (1927–1928)
* J.A. Woodburn (1928–1929)
* H. Pirow (1929–1930)
* J. Henderson (1930–1931)
* A. King (1931–1932)
* V. Nimmo-Dewar (1932–1933)
* P.N. Lategan (1933–1934)
* E.C. Ranson (1934–1935)
* R.A. Flugge-De-Smidt (1935–1936)
* T.K. Prentice (1936–1937)
* R.S.G. Stokes (1937–1938)
* P.E. Hall (1938–1939)
* E.H.A. Joseph (1939–1940)
* J.H. Dobson (1940–1941)
* Theo Meyer (1941–1942)
* John V. Muller (1942–1943)
* C. Biccard Jeppe (1943–1944)
* P.J. Louis Bok (1944–1945)
* J.T. McIntyre (1945–1946)
* M. Falcon (1946–1947)
* A. Clemens (1947–1948)
* F.G. Hill (1948–1949)
* O.A.E. Jackson (1949–1950)
* W.E. Gooday (1950–1951)
* C.J. Irving (1951–1952)
* D.D. Stitt (1952–1953)
* M.C.G. Meyer (1953–1954)
* L.A. Bushell (1954–1955)
* H. Britten (1955–1956)
* Wm. Bleloch (1956–1957)
* H. Simon (1957–1958)
* M. Barcza (1958–1959)
* R.J. Adamson (1959–1960)
* W.S. Findlay (1960–1961)
* D.G. Maxwell (1961–1962)
* J. de V. Lambrechts (1962–1963)
* J.F. Reid (1963–1964)
* D.M. Jamieson (1964–1965)
* H.E. Cross (1965–1966)
* D. Gordon Jones (1966–1967)
* P. Lambooy (1967–1968)
* R.C.J. Goode (1968–1969)
* J.K.E. Douglas (1969–1970)
* V.C. Robinson (1970–1971)
* D.D. Howat (1971–1972)
* J.P. Hugo (1972–1973)
* P.W.J. van Rensburg (1973–1974)
* R.P. Plewman (1974–1975)
* R.E. Robinson (1975–1976)
* M.D.G. Salamon (1976–1977)
* P.A. Von Wielligh (1977–1978)
* M.G. Atmore (1978–1979)
* D.A. Viljoen (1979–1980)
* P.R. Jochens (1980–1981)
* G.Y. Nisbet (1981–1982)
A.N. Brown (1982–1983)
* R.P. King (1983–1984)
J.D. Austin (1984–1985)
* H.E. James (1985–1986)
H. Wagner (1986–1987)
* B.C. Alberts (1987–1988)
* C.E. Fivaz (1988–1989)
* O.K.H. Steffen (1989–1990)
* H.G. Mosenthal (1990–1991)
R.D. Beck (1991–1992)
* J.P. Hoffman (1992–1993)
* H. Scott-Russell (1993–1994)
J.A. Cruise (1994–1995)
D.A.J. Ross-Watt (1995–1996)
N.A. Barcza (1996–1997)
* R.P. Mohring (1997–1998)
J.R. Dixon (1998–1999)
M.H. Rogers (1999–2000)
L.A. Cramer (2000–2001)
* A.A.B. Douglas (2001–2002)
S.J. Ramokgopa (2002-2003)
T.R. Stacey (2003–2004)
F.M.G. Egerton (2004–2005)
W.H. van Niekerk (2005–2006)
R.P.H. Willis (2006–2007)
R.G.B. Pickering (2007–2008)
A.M. Garbers-Craig (2008–2009)
J.C. Ngoma (2009–2010)
G.V.R. Landman (2010–2011)
J.N. van der Merwe (2011–2012)
G.L. Smith (2012–2013)
M. Dworzanowski (2013–2014)
J.L. Porter (2014–2015)
R.T. Jones (2015–2016)
C. Musingwini (2016–2017)
S. Ndlovu (2017–2018)
A.S. Macfarlane (2018–2019)
M.I. Mthenjane (2019–2020)
V.G. Duke (2020–2021)
I.J. Geldenhuys (2021–2022)
Z. Botha (2022-2023)
Editorial Board
S.O. Bada
R.D. Beck
P. den Hoed
I.M. Dikgwatlhe
R. Dimitrakopolous*
B. Genc
R Hassanalizadeh
R.T. Jones
W.C. Joughin
A.J. Kinghorn
D.E.P. Klenam
J. Lake
H.M. Lodewijks
D.F. Malan
R. Mitra*
H. Möller
C. Musingwini
S. Ndlovu
P.N. Neingo
S.S. Nyoni
M. Phasha
P. Pistorius
P. Radcliffe
N. Rampersad
Q.G. Reynolds
I. Robinson
S.M. Rupprecht
K.C. Sole
A.J.S. Spearing*
T.R. Stacey
E. Topal*
D. Tudor*
D. Vogt*
*International Advisory Board members
Editor /Chairperson of the Editorial Board
R.M.S. Falcon
Typeset and Published by
The Southern African Institute of Mining and Metallurgy
PostNet Suite #212
Private Bag X31
Saxonwold, 2132
E-mail: journal@saimm.co.za
Printed by
Camera Press, Johannesburg
Advertising Representative
Barbara Spence
Avenue Advertising Telephone (011) 463-7940
E-mail: barbara@avenue.co.za
ISSN 2225-6253 (print)
ISSN 2411-9717 (online)

Directory of Open Access Journals


Journal Comment: A mineralogical phoenix rising out of the ashes …? by S.O. Bada
Presidential Address: Managing geotechnical uncertainty and risk in mining by W.C. Joughin .
Optimization of shape factor by the response surface method, and the effect on sphalerite flotation recovery by T. Uysal
Modelling and optimization of different morphological parameters were investigated by the response surface method (RSM) using the central composite full design method. The average error between the optimization results and the experimental results was lower than 6%, and R2 values greater than 90% were obtained. The study shows that RSM can be effectively applied in finding the economic optimum conditions for obtaining maximum flotation recovery with minimum flotation reagent consumption.
THE INSTITUTE, AS A BODY, IS NOT RESPONSIBLE FOR THE STATEMENTS AND OPINIONS ADVANCED IN ANY OF ITS PUBLICATIONS.
Copyright© 2023 by The Southern African Institute of Mining and Metallurgy. All rights reserved. Multiple copying of the contents of this publication or parts thereof without permission is in breach of copyright, but permission is hereby given for the copying of titles and abstracts of papers and names of authors. Permission to copy illustrations and short extracts from the text of individual contributions is usually given upon written application to the Institute, provided that the source (and where appropriate, the copyright) is acknowledged. Apart from any fair dealing for the purposes of review or criticism under The Copyright Act no. 98, 1978, Section 12, of the Republic of South Africa, a single copy of an article may be supplied by a library for the purposes of research or private study. No part of this publication may be reproduced, stored in a retrieval system, or transmitted in any form or by any means without the prior permission of the publishers. Multiple copying of the contents of the publication without permission is always illegal. U.S. Copyright Law applicable to users In the U.S.A. The appearance of the statement of copyright at the bottom of the first page of an article appearing in this journal indicates that the copyright holder consents to the making of copies of the article for personal or internal use. This consent is given on condition that the copier pays the stated fee for each copy of a paper beyond that permitted by Section 107 or 108 of the U.S. Copyright Law. The fee is to be paid through the Copyright Clearance Center, Inc., Operations Center, P.O. Box 765, Schenectady, New York 12301, U.S.A. This consent does not extend to other kinds of copying, such as copying for general distribution, for advertising or promotional purposes, for creating new collective works, or for resale.

Energy efficiency in the South African mining sector: A case study at a coal mine in Mpumalanga by C.M.D. Majola and K.E. Langerman .......................................................
We investigated the effectiveness of South Africa’s National Energy Efficiency Strategy (NEES) in improving energy efficiency in the coal mining sector. Trends in energy intensity (i.e. energy use per unit of saleable product) relative to a multi-year baseline were used as an appropriate metric for energy efficiency. The evidence suggests that the NEES has been ineffective in promoting energy efficiency in South African coal mines. We propose that greater success could be achieved by monitoring and reporting on energy intensity at the process level, and by incentivizing energy efficiency gains.
451
The needle penetration index for estimating the physico-mechanical properties of pyroclastic rocks by S. Kahraman and I. Ince .................................................................. 463
A study was conducted on the predictability of the physico-mechanical properties of pyroclastic rocks from the needle penetration index (NPI). Pyroclastic rocks were sampled from ten different locations in Turkey. Very strong correlations were found between NPI and both UCS and BTS. Strong correlations were also found between NPI and density and porosity. The NPI can therefore be used to predict these properties in pyroclastic rocks.
A study of different grinding aids for low-energy cement clinker production by S.R.M. Zan and K.E.H.K. Ishak
471 Cement production consumes significant energy, because the clinker requires very fine grinding. The use of grinding aids in ball milling can enhance grinding efficiency and significantly improve the particle size distribution while decreasing energy consumption, which can help reduce the costs and CO2 emissions associated with cement production.


A mineralogical phoenix rising out of the ashes …?
n the last two centuries there have been significant changes in the way energy is generated. In countries that lack other natural resources such as hydropower, energy has traditionally been derived from solid, liquid, or gaseous fossil fuels. A mix of factors, including geological resources and technological advances, as well as political and economic pressures, has led to the selection of energy sources in each country. Over time, energy selection has been influenced by the availability of resources, the cost of production, and more recently by environmental impact.
In almost all of the world’s major industrialized nations, coal has been the primary source of power generation and a significant contributor to economic growth. But with the evolution of today’s complex energy mixes, the role of coal and its sister fossil fuels (oil and gas) is gradually changing. In the past two decades, the percentage of global energy produced from coal has decreased from 87% to 84%. Coal’s continued economic importance is due to its abundance, low cost, wide applications, and security of supply. The future role of coal will depend on a combination of factors, including mining pollution and the emission of CO2 and other greenhouse gases from coal-fired power generation. It is believed that these emissions have contributed to global warming and climate change, resulting in severe pressures from political and environmental quarters.
In recognition of its value in supplying safe, secure, and reliable energy, coal now needs to be used in a variety of clean coal processes as the world moves towards its Just Energy Transition. This approach has been taken widely by China and other countries in the Far East. No doubt South Africa will follow suit in due course.
However, the value of coal is now being recognized for a very different purpose. Coal is considered as an important source of carbon, rare earth elements, and related mineral-based commodities which are vital components in all high-tech, high-value advanced materials of the future. These include a range of products vital for use in the manufacture of renewable energy equipment.
This awakening to the new and alternative value of coal began in the USA and is now spreading globally, to the extent that coal is now regarded by some international bodies as one of the most valuable mineral commodities available. For these reasons, coal is now being termed in some quarters as ‘carbon ore’ and regional centres manufacturing high-tech high-value carbon-based products as ‘carbon valleys’, the equivalent of Silicon Valley in the USA.
Against this background, South Africa is now at an important crossroad.
On one hand, the country is undergoing a significant energy transition from coal to other sources of energy due to its commitments to meeting net-zero carbon emissions in the near future. On the other hand, a further and more innovative opportunity is now opening up for the use of coal in a highly efficient, responsible, and far more economically and nationally significant manner.
This new approach embraces a new coal-carbon value chain which, if followed, would lead to the development of new industries, increased employment opportunities, and the production of innovative products of considerable value in the fast-evolving world of modern construction, transport, and aerospace applications.
Such an approach would entail the recognition of coal as a high-value ‘carbon source’ yielding products of much greater value than simply producing a megawatt of heat or power that is gone in a flash. Furthermore, the use of carbon for production purposes would meet South Africa’s goal of capturing and use of carbon to achieve a low-carbon economy.
Comment (continued)
The US Department of Energy (DOE) has predicted that over the next 25 years, industries that manufacture coal-to-carbon products in coal mining communities could generate 280 000 to 480 000 jobs using low-skilled to highly skilled artisans. The DOE predicts that the global market for advanced carbonbased materials and products will reach over $96 billion this year. To give an example, Dialead carbon fibres from Mitsubishi Chemical Carbon Fiber and Composites USA are produced from a high-performance coaltar pitch. The carbon fibre is being used to manufacture aircraft structural components, pressure vessels, wind turbine blades, and various items of sporting equipment, among other products.
With such expansion in this field, the American National Coal Council estimates that the tonnage of coal used in product manufacture has the potential to equal that utilized for power generation in coming years. In South Africa, a further benefit would be the dual use for coal being mined, namely full use of both the better grades for export, Eskom, or industry, and full use of lower grades for carbon-based products. The sources of the latter materials include coal fines, discards, coal tar pitch, and low-grade run-of-mine coal. Such precursors are the low-cost throw-away/discarded products of coal mining, and their use would also thereby serve the country’s interests in the circular economy as it applies to coal mining.
The forms of advanced carbon materials for which South African coals can be used include carbon fibre, carbon foam, graphene, carbon nanotubes, activated carbon, and coal composites. The expectation is that these will replace or complement conventional materials in the production of aerospace and electric vehicles, as well as in robotics and energy storage. In the latter scenario, carbon products will enhance the capacity and performance of lithium-ion batteries and be utilized to securely store and transport hydrogen in various forms.
At the University of the Witwatersrand and elsewhere, research and development is currently underway to establish South African coals as the source for advanced high-value products. This requires collaboration between all stakeholders (government, industry, research institutes, and others) to support this endeavour in order for the industry to reach its full potential. If successful, in due course South Africa could be the ‘Carbon Valley of Southern Africa’.
In these ways, the often-denigrated mineral called coal could become the bright and shining Phoenix of the mineral industry, literally rising out of the ashes.
S.O. Bada
MISTY HILLS CONFERENCE CENTRE
JOHANNESBURG, SOUTH AFRICA

The Southern African Pyrometallurgy Conference series has covered a range of themes since the first edition in 2006. The Southern African Pyrometallurgy 2024 International Conference will structure a programme which covers crucial aspects of this continually evolving and exciting field towards sustainable pyrometallurgy. It is envisaged as an international conference on pyrometallurgy with a Southern African flavour.
Many new developments have taken place in southern African Pyrometallurgical plants since the previous conferences of this series, and it is hoped that this event will provide an update on operational developments.
The conference will cover a wide spectrum of activities within pyrometallurgy. Contributions are anticipated from operating plants, universities, research organisations and engineering companies, so that the full spectrum of pyrometallurgical activities can be covered with a special focus on decarbonisation, energy and resource efficiency and cleaner processes.
International participation is encouraged, with some broad overview papers covering international trends to be presented by experts in various topical technologies and commodities.
• Pyrometallurgists
• Process engineers
• Smelter managers
• Researchers
• Postgraduate students
• Academics.
• Sustainable, socially responsible, environmental, energy conscious smelting
• Update on plant operations and new projects
• Staying competitive in an electrically constrained environment
• Digital transformation in pyrometallurgy: are smelters smarter now?
• Circularity in Pyrometallurgy
• Education – how do we sustain and grow our talent pool?
Papers or presentations are invited on any topic related to the conference.
Prospective authors are invited to submit titles and abstracts of their papers in English. The abstracts should be no longer than 500 words and should be submitted to:
Camielah Jardine, Head of Conferencing Tel: +27 (11) 538 0237
Email: camielah@saimm.co.za
• Abstract Submission: 4 September 2023
• Abstract Acceptance: 25 September 2023
• Paper Submission: 30 October 2023
• Conference: 12-14 March 2024
FOR FURTHER INFORMATION, CONTACT:
Camielah Jardine, Head of Conferencing
E-mail: camielah@saimm.co.za
Tel: +27 11 530 0238 Web: www.saimm.co.za

Affiliation: 1SRK, South Africa.
Correspondence to: W.C. Joughin
Email: wjoughin@srk.co.za
Dates:
Received: 14 Sept. 2023
Published: September 2023
How to cite: Joughin, W.C. 2023
Presidential Address: Managing geotechnical uncertainty and risk in mining.
Journal of the Southern African Institute of Mining and Metallurgy, vol. 123, no. 9. pp. 435–444
DOI ID:
http://dx.doi.org/10.17159/24119717/2023/2023
by W.C. Joughin
Synopsis
The science of soil mechanics is 100 years old, and rock mechanics is about 80 years old. While methods of analysis and design have been developed and have evolved over time, these are relatively young sciences. The rapid increases in computing power and new technologies have enabled more sophisticated modelling and monitoring. However, there are still many aspects of soil and rock mechanics that are not well understood. Geotechnical failures, which have major consequences, still occur. These consequences may include environmental damage, major production holdups and associated loss of revenue, damage to infrastructure, and loss of life.
High-consequence events, which are rare, are more difficult to anticipate and to design for, because by their nature they involve extraordinary circumstances or conditions, often geological in nature. The risks are usually mitigated by conservative designs and monitoring. Detailed geotechnical investigations help us to understand the natural variability of soil and rock masses and identify unusual or unexpected conditions. Investigating and researching major geotechnical failures is essential to enable these unusual circumstances to be anticipated.
In the past, severe unanticipated events may have been treated as natural events or ‘acts of God’. However, society now has much greater expectations and it is essential to have policies and procedures in place that enable appropriate management of these rare, high-consequence risks. A good example is the Global Industry Standard on Tailings Management (GISTM), which was introduced after the catastrophic dam collapse at Vale’s Corrego de Feijao mine in Brumadinho, Brazil.
The address will explain the concepts of uncertainty and variability, and how they should be taken into account in geotechnical design. The challenges facing geotechnical engineers, mine owners, and managers will be discussed. referencing a number of real case studies.
Keywords
uncertainty, variability, risk, consequences, environmental, social, production, revenue, damage, geotechnical, soil mechanics, rock mechanics, design, mine layouts, GISTM, tailings dam, pillar, failure, mechanism, model, seismic, rockburst.
Introduction
Modern soil mechanics is generally considered to have begun in 1925, when Karl Terzaghi published his book Erdbaumechanik auf bodenphysikalischer Grundlage (Earthwork Mechanics based on the Physics of Soils). These theories were applied to rocks more than 20 years later and the science of rock mechanics became established. Methods of analysis and design have been introduced and applied, and have evolved over time. More recently, the rapid growth in computing power has resulted in more sophisticated analyses, and together with improved monitoring techniques, our understanding of geomechanics has grown considerably.
Despite this, geotechnical failures with major consequences still do occur. This is partly due to failure to transfer and apply the knowledge that has been gained, but also there are aspects of geomechanics that are not well understood.
Geotechnical engineering is subject to a lot of uncertainty and variability which need to be considered in the design process and in the management of geotechnical risks. This subject is discussed by several authors (Stacey, 2003; Christian, 2004; Stacey, Terbrugge, and Wesseloo, 2006; Hadjigeorgiou and Harrison, 2012; Joughin, 2017; Hadjigeorgiou, 2019; Wesseloo and Joughin, 2020; Joughin et al., 2020). These terms can be defined as follows.
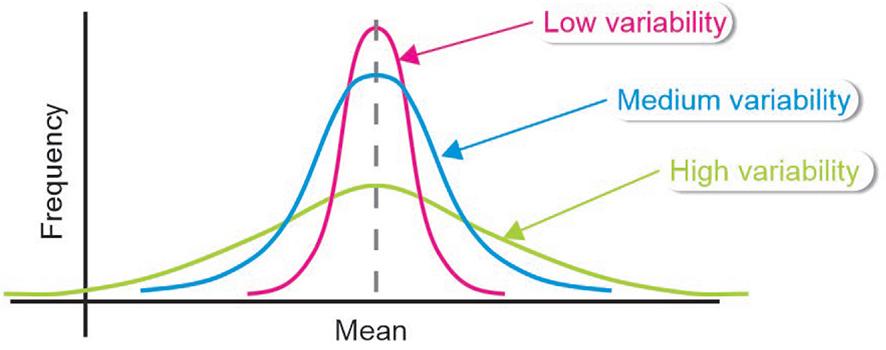
➤ Variability is a property of nature. Rock mass and soil properties, as well as loading conditions, span a large range of values, which can vary in space and time. Variability can be described with statistics and the probabilities related to variability can be interpreted in terms of frequency of occurrence (Figure 1).
➤ Uncertainty is a state of mind and is a function of our lack of knowledge. which can be reduced with more measurement and improved understanding. It may arise due to insufficient data, sampling bias, measurement errors, unknown or unexpected loading conditions, lack of knowledge of credible failure mechanisms, and imperfect models to represent failure mechanisms. Probabilities related to uncertainty are best interpreted as a degree-of-belief.
Geotechnical data is invariably insufficient, due to timing and cost. Often the method of sampling prevents the collection of data at the tails of distributions. The weakest material properties and the most extreme loading conditions might not be recognized. This can give the impression that there is low variability, when there is in fact high variability. In nature, frequency distributions are rarely simple normal distributions, such as in Figure 1, but are generally more complex. They are more commonly exponential or lognormal, tend to be skewed, and may be multimodal, such as when there are different material types or different loading conditions. This highlights the importance of understanding the geological controls and potential loading conditions, in order to be able to recognize what important data may be missing from the sample of data collected.
Geotechnical engineers learn about failure mechanisms by observing failures and describing them. Unusual failure modes, from which others could learn, are not often observed or have not been described. Mathematical models that are used to represent the failure mechanisms can vary in complexity, but are always simpler than reality. The aphorism ‘all models are wrong, but some are useful’ is very apt.
Learning from uncommon high-consequence events
Stacey (2003) posed the question ‘Rock engineering - good design or good judgement?’ and suggested that good judgement is essential in rock engineering design. However, to apply good judgement, it is essential to learn from geotechnical failures. Low-consequence incidents that occur frequently are observed by many people and the failure mechanisms and simple models are generally well understood. Good practices can be implemented to prevent or limit the occurrence of such incidents.
Uncommon geotechnical failures are not as well understood and can have severe consequences, such as:
➤ Loss of life
➤ Environmental and social impacts
➤ Production delays, revenue loss, and force majeure
➤ Loss of infrastructure and equipment.
It is therefore essential that detailed investigations are carried out in a transparent manner whenever these failures do occur. The knowledge gained from these investigations needs to be transferred by publishing, sharing at conferences, and through training courses. Unfortunately, this often does not happen because of legal implications or company policies.
This address describes some uncommon, high-consequence events through case studies on the following topics, which have been well documented:
➤ Tailings dam failures
➤ Hard rock pillar collapses
➤ The Kiruna MW 4.2 seismic event.
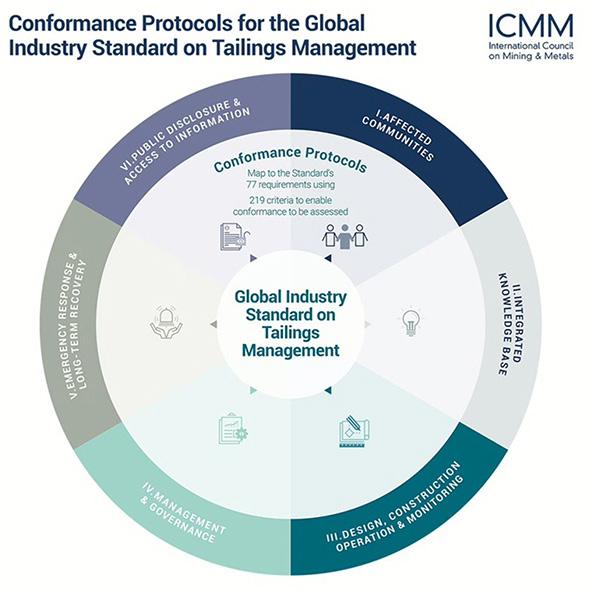
The catastrophic dam failure at Vale’s Corrego de Feijao mine in Brumadinho, Brazil resulted in the loss of almost 300 lives, in addition to the major environmental and social consequences and business interruption. This followed several other highly publicized tailings dam failures, which also had major environmental and social impacts, and triggered a global response. This resulted in the development of the Global Industry Standard on Tailings Management (GISTM) (https://globaltailingsreview.org/globalindustry-standard). The standard is directed at operators, who are required to take responsibility for and prioritize the safety of tailings facilities through all phases of the life-cycle, including closure and post-closure. There are six topics that must be addressed (Figure 2).
Most South African tailings storage facilities are constructed using the upstream method, which is not suitable for significant water storage, and are more vulnerable to seismic loading. This method of construction is not allowed in certain countries. However, tailings management practice in South Africa has generally been very good (SANS 10286). The risks are mitigated through managing the rate of rise, good drainage characteristics of materials, good drainage design, storm water design, geotechnical investigations, slope design, and structured monitoring. When hazardous conditions are encountered, additional data is collected to reduce uncertainty or dewatering and buttressing are implemented to improve stability.
GISTM incorporates learnings from investigations of catastrophic dam failures and sets out requirements to address the uncertainties in tailings dam behaviour, which include:
➤ Identifying brittle failure modes and addressing them with conservative design criteria. Brittle failure involves a sudden loss in strength (the Brumadinho failure is an example),
which is more difficult to anticipate or monitor and hence a more conservative and more expensive approach is required to manage the risk. Some tailings or foundation materials tend to have brittle characteristics and will behave in a brittle manner under certain circumstances and with certain triggers. Most tailings dam designs in South Africa did not originally include the identification of brittle materials. Specialized sampling and testing methods are required to determine the degree of brittleness, and this is the subject of ongoing research. Conservative approaches are being applied until such time that the operator can demonstrate that brittle behaviour is not a concern.
➤ Dam breach analyses are required to be carried out to determine the potential consequences of a failure. This involves simulating the flow of tailings downstream from the facility to assess the potential impact on communities and watercourses. The results of the analyses are essential for determining the consequence classification for the dam. The extent of breaches (release volumes) is the subject of ongoing research.
➤ Seismic loading can possibly trigger a dam failure (through liquefaction), so it a requirement to carry out a seismic hazard assessment using probabilistic and deterministic methods. In Southern Africa, the seismic hazard is low compared with other parts of the world, and most of the seismic activity is mining-induced, rather than due to tectonic activity. Therefore, this was not previously considered an important criterion for tailings design. Guidelines are now specified for different consequence classifications and post-closure.
➤ As a result of climate change, extreme flooding events need to be considered in the design of tailings dams. GISTM requires operators to consider the Maximum Probable Precipitation (PMP) and Probable Maximum Flood (PMF) for Extreme Consequence Classification facilities and post-closure requirements. This influences the storm water drainage design and freeboard management.
GISTM also defines specific roles and responsibilities:
➤ Accountable Executive (AE)
➤ Responsible Tailings Facility Engineer (RTFE)
➤ Engineer of Record (EOR)
➤ Independent Tailings Review Board (ITRB).
MacRobert et al. (2022) carried out a survey of the tailings community of practice to determine the required traits and qualifications of the individuals that fulfil these roles, since little guidance is provided in the GISTM. The authors suggest ideal requirements for GISTM appointees based on an analysis of the survey. One of the challenges for the global mining industry is to educate and train sufficient suitable qualified engineers to fill and support these roles.
Another challenge that arises is addressing the important requirement to meaningfully engage with affected communities, while still grappling with the uncertainties. In particular, the assumptions applied in the dam breach analysis affect the extent of the downstream area impacted by the breach, which determines the communities that are likely to be affected.
The SAIMM has established a Tailings Working Group in collaboration with the South African Institute of Civil Engineers (SAICE) to address the Southern African mining industry requirements.
Hard rock pillar collapses
In most shallow, narrow, tabular hard-rock mines (gold, platinum, and chrome mines of the Witwatersrand Gold ields, Bushveld Complex, and Great Dyke), pillars are generally very stable, due to the high strength of the rock. In fact, some mines are reaching the end of their life and are investigating partial extraction of pillars, because they were probably larger than necessary. Pillars have traditionally been designed using tributary area theory and the hard rock pillar formula (Hedley and Grant, 1972). While this method has worked reasonably well for most shallow narrow, hard-rock tabular mines, it is very basic and does not take some of the geotechnical complexity into consideration. Malan and Napier (2011) provide an excellent review of pillar design in narrow, tabular, hard-rock mines, which highlights several challenges and uncertainties that still need to be resolved.
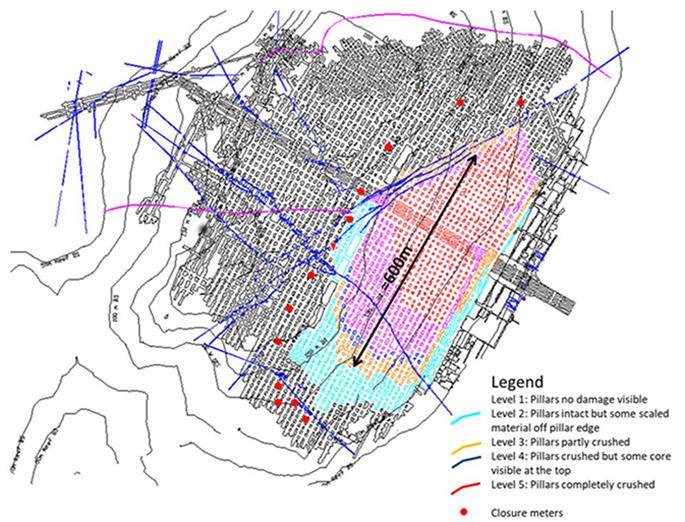
While most mines only need to deal with the challenges of pillar cutting and localized instabilities, there have been at least three incidents where major pillar collapses have occurred (Spencer, 1999; Walls and Mpunzi, 2017; Muaka et al., 2017; Malan and Couto, 2023a, 2023b). In all three cases, the pillar collapse affected a large area, including the larger protection pillars supporting the central decline cluster, preventing access to the mining area. New accesses needed to be developed, taking many months, during which time there was no production. Fortunately, the pillars deteriorated gradually over many months, exhibiting ductile rather than brittle failure. As the extent of mining increased the deteriorating pillars would transfer load to adjacent pillars, until eventually even the larger decline protection pillars failed. This allowed mine management to implement visual and instrumented monitoring, and all workers were safely evacuated prior to the collapses. Figure 3 shows a mine plan of the pillar collapse at Everest Platinum Mine in December 2008.
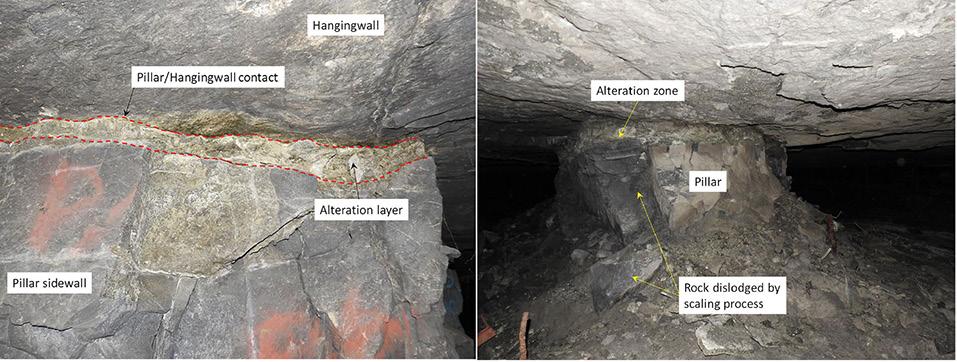
The main difference between these collapsed areas and other operations is that there were weak alteration layers in the pillars that significantly reduced their strength (Figure 4). These weak layers contained clay and were more than a hundred times weaker than the rock comprising most of the pillar. If exposed to water, the clayfilled layers became even weaker. Weak layers change the failure mechanism in the pillar.
Pillars are loaded vertically in compression and deform horizontally outwards. Shearing occurs within the weak layer, due to the horizontal deformation. Since the low strength material has less resistance to shearing, tensile splitting occurs along sub-vertical joints or through intact rock much more easily. Loose rock blocks at the pillar edges topple and become dislodged, reducing the pillar size and therefore its strength. The failed pillars then transfer load onto adjacent pillars, which become overloaded and fail.
At Everest Platinum Mine (Couto and Malan, 2023a, 2023b) the weak layer was consistently at the hangingwall contact, while at Wonderkop Chrome Mine (Spencer, 1999) it was consistently at the footwall contact. At another operation, the weak layer (a shear zone) undulated so that it was sometimes within the hangingwall, sometimes within the pillar, and sometimes in the footwall. The pillar failure mechanism varies depending on where the weak layer is located.
The empirical pillar strength models are unable to represent the effect of different modes of failure and the considerably lower strength of the pillar. Tributary area theory and elastic numerical models do not address the load transfer from failed pillars.
Pillar scale numerical models
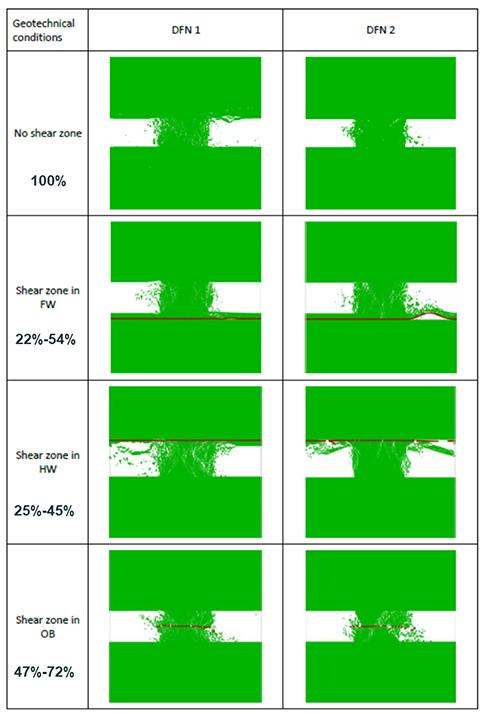
It is possible to numerically model the details of the failure mechanism in a single pillar. Figure 5 shows the results of twodimensional distinct element models, which are described in more detail in Muaka et al. (2017). For these models, two discrete fracture networks were created to represent two possible permutations of the natural jointing in pillars (left and right columns). The range of joint characteristics (dip, dip direction, spacing, persistence and shear strength) was determined from underground mapping. Models were then analysed with no weak layer (shear), and with weak layers in the footwall, hangingwall, and within the orebody. The strength of the weak layer was determined by collecting samples underground and testing them in a soil mechanics laboratory.
The failure mechanisms were represented realistically in the models, including buckling of the hangingwall and footwall heave, when the weak layer is located in the hangingwall or footwall, respectively. Each combination of joints and weak layer, and different pillar sizes produces a unique result. Therefore, it is useful to present the reduction in strength as a function of the location of the weak layer, and to show it as a range of percentages. The weak layer effectively reduced the strength of the pillar to between 22% and 72% of an equivalent pillar with no weak layer, taking all the models into consideration. It is also apparent that when the weak layer is in the hangingwall or footwall, there is a greater strength reduction, than when it is within the orebody.
The type of complex model described above is only useful to gain an understanding of the variability in pillar strength due to the presence of a weak layer. It is not practical to carry out this type of complex modelling on a mine-wide scale, even with currently available computing power.
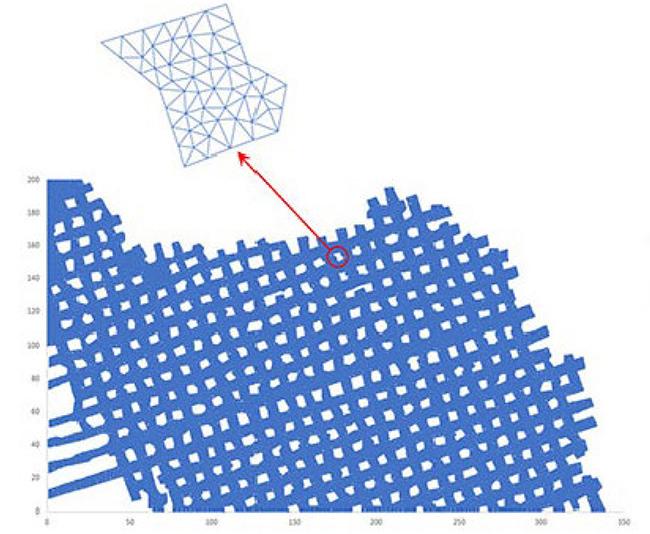
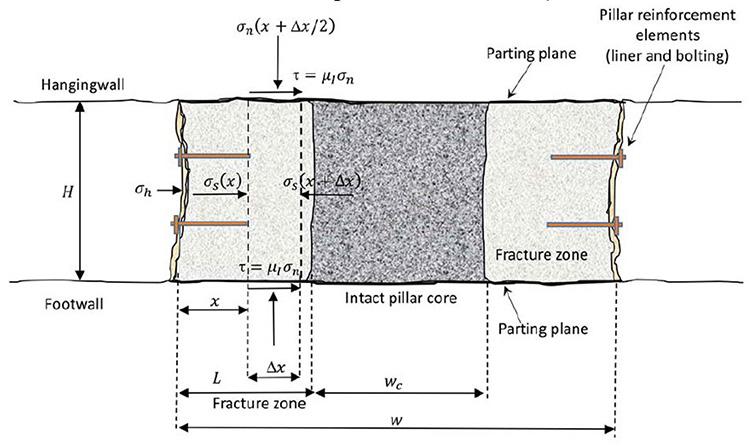
Boundary element elastic modelling is much simpler and enables mine-scale modelling of pillars (Figure 6). Limit equilibrium models (Figure 7) have been incorporated in these codes to provide a simple representation of the pillar failure mechanism (Napier and Malan, 2007, 2021, 2023; Esterhuyse, and Malan, 2023; Ile and Malan, 2023; Couto and Malan, 2023a, 2023b). The limit equilibrium model effectively represents a shearing layer at both the hangingwall and footwall contacts and progressive spalling of the pillars. As pillars in the model fail, they transfer load to adjacent pillars, which enables the simulation of a pillar collapse on a mine scale. The effect of support, such as backfill, can also be simulated using the limit equilibrium model.
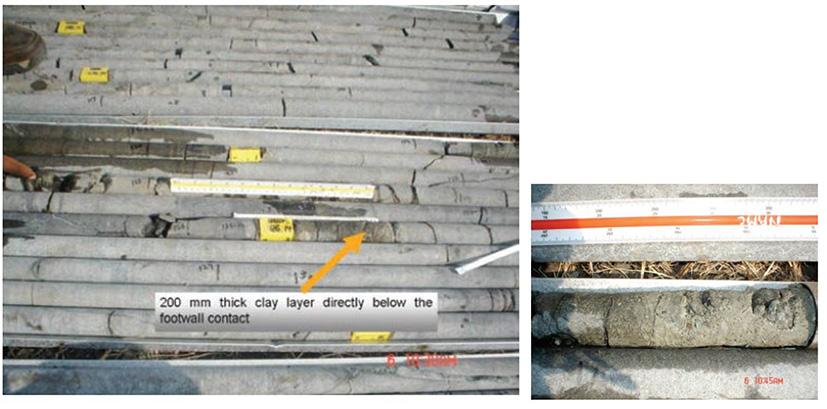
During geotechnical investigation for a new mine, it can be quite a challenge to find these weak layers in borehole core (Figure 8). Invariably, when the geotechnical investigation is carried out for mine design purposes in hard rock mines, all of the core has already been drilled using double tube drilling. However, triple tube drilling is normally carried out for geotechnical purposes to prevent the washing out of fine materials, such as clays. The recovery of hard rock with double tube drilling is normally very good, but any fine soil material is lost. In these circumstances, the only way to determine that there is a problem is to diligently measure the core recovery to identify core loss. It is possible to determine that there is, say, 20 cm of core loss within a drill run of 3 m, but the actual location cannot be determined, nor can the material characteristics.
In all three cases cited, core loss was not identified as a persistent problem and the weak layers were not identified until mining started. The pillars, including the decline protection pillars, were designed using tributary area theory and the hard rock pillar formula.
To address this challenge, it is necessary to diligently log core recovery, identify core loss in close proximity to the orebody, and carry out additional triple tube drilling to determine the exact
location and material properties of the weak layers. It is also suggested that a structural geologist should analyse the data to interpret and model the weak layer and its potential location within pillars throughout the mine.
Managing uncertainty through mine design
Given that it is very difficult to find weak layers in drill core and determine the potential effect on pillars at the project stage, the early mine design needs to take this uncertainty into consideration. Increasing the factor of safety in a conventional pillar design may not be sufficient, because the actual pillar strength may be as low as 1/5 of the typical pillar strength determined using simple empirical methods.
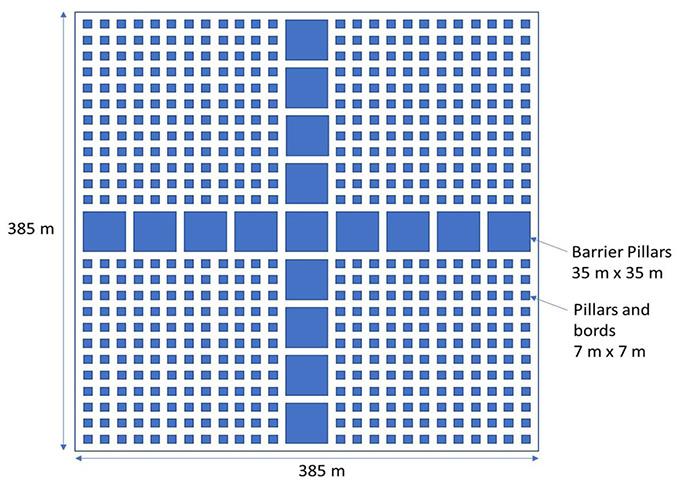
Incorporating a system of very wide barrier pillars to compartmentalize the mine is an effective way of mitigating the effect of pillar failures (Figure 9). The effects of geological weaknesses in very large barrier pillars are far less significant than in small pillars. Couto and Malan (2023b) analyse different barrier pillar layouts.
It is good practice to design these barrier pillars pragmatically and conservatively, given the uncertainties. The example in Figure 9 is a good approach because the barrier pillars incorporate three pillars and two bords. If the weak layer is not present or does not have a significant effect on the pillar strength, the bords can easily be extracted at a later stage when the uncertainties have been resolved.
The barrier pillars do not affect productivity and profitability. They could be included in the mine reserves, but initially defined as Probable Reserves and later as Proven Reserves when confidence has been established. Therefore, it is smarter to design larger barrier pillars than to attempt to optimize them, before sufficient information is available.
Most importantly, the central decline cluster and other important access ways must be protected by barrier pillars. The barrier pillars should therefore be designed on a risk management basis, using simple methods. It is better to be approximately correct and manage the risk, than to be precisely wrong.
Optimization of pillars should incorporate more sophisticated methods and models once the pillar composition and behaviour are well understood.
The Kiruna MW 4.2 seismic event
In May 2020, Kiirunavaara mine (Kiruna) in Sweden experienced a major seismic event, which caused extensive damage over more than 1000 m in tunnels on several levels (Boskovic 2022; Dineva et al., 2022; Svartsjaern et al. 2022; Mawson et al., 2022). The Swedish National Seismic Network (SNSN) recorded it as a moment magnitude MW 4.2 seismic event, which is considerably larger than any seismic event previously experienced at Kiruna and was felt several thousand kilometres away. A total of 20 000 aftershock events were recorded within 24 hours, by the mine seismic network. The largest of the aftershocks was local magnitude ML 1.4. Importantly, no-one was exposed in the area at the time of the MW 4.2 seismic event and re-entry was only permitted after the seismicity returned to normal levels. Details of the MW 4.2 seismic event, aftershocks, detailed analyses and damage, and rehabilitation strategies have been published at RASIM10 (Boskovic 2022; Dineva et al., 2022) and CAVING2022 (Svartsjaern et al., 2022; Mawson et al., 2022), and a workshop on the incident was held at CAVING2022. All the information in this section has been drawn from these publications.
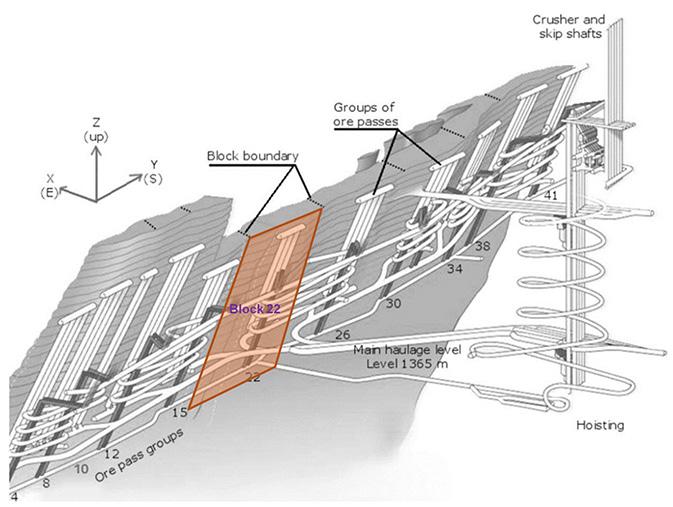
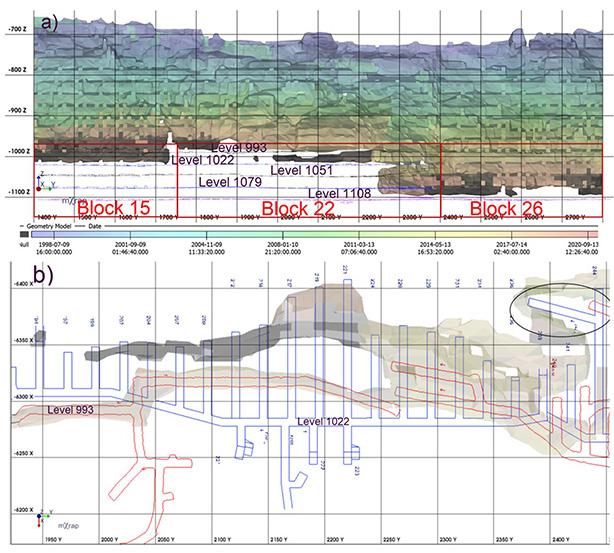
Kiruna is the largest underground iron ore mine in the world, typically producing 27 Mt/a (75 000 t/d). The orebody dips at 55o to 60o and is typically 80 m wide (0–160 m) with a strike length of approximately 4000 m. It started as an open pit mine in 1898 and went underground in 1962. The ore is extracted using sublevel caving, which is a top-down mass mining method that results in hangingwall caving and subsidence on the surface. Figure 10 illustrates the current mining layout below 1045 level. The infrastructure is already developed to 1365 level. Level numbers represent depth below the top of the former Kiirunavaara hill, which has been mined out, and the depth below the typical ground surface is approximately 230 m less than the level number. Kiruna has 11 mining blocks, defined by the orepass grouping. The seismic events and damage occurred in block 22.
The orebody shape and mining method result in stress concentrations on the horizontal mining face (abutment), extending deeper as mining continues. The rock strengths (hangingwall, orebody, and footwall) range between 180 MPa and 225 MPa and the footwall rocks tends to be brittle. Due to the high rock strength, very little stress damage and seismicity was experienced above 907 level (677 m below surface). Below 907 level, the stress concentrations on footwall drives and orepasses due to the advancing mining face began to exceed the strength of the footwall rocks, causing stress damage and strainbursts. The stress acting on the orepasses and footwall drives is partially relieved by the hangingwall caving, and ensuring an active cave is part of the stress management. Kiruna has a large state-of-the-art seismic network with more than 250 geophones (4.5 Hz and 14 Hz), which records approximately 5000 seismic events per day. The system reliably records seismic events a small as ML –1.5 (small pops and cracks) with a location accuracy of 20 m.
Kiruna block 22
Figure 11 shows the mining layout in block 22 at the time of the MW 4.2 seismic event. The orebody is narrower and more variable in block 22 and has not been mined at the same rate as the adjacent blocks. It is lagging blocks 15 and 26, which increases the stress concentration in block 22. The layout on 993 level is longitudinal, to minimize development in the narrow orebody, while on 1022 level, the more typical transverse layout was developed. The different layouts effectively increase stress concentrations and prevents connection to the cave on the level above, negating the stress relief offered by caving of the hangingwall.
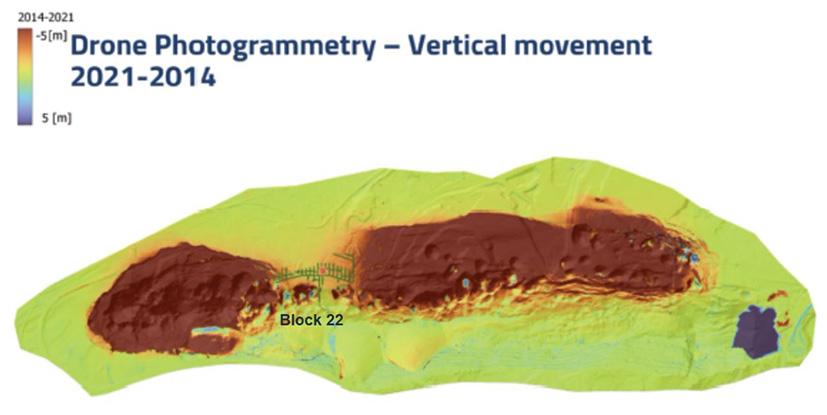
Figure 12 shows vertical movement measured on surface due to hangingwall caving and subsidence. It is apparent that the downward movement of the cave material above block 22 is negligible compared with the 5 m of downward movement in the adjacent blocks. This provides evidence that the cave has stalled above block 22 and is a direct consequence of mining practice in block 22. This phenomenon had not been observed previously.
Underground damage
Figures 13 and 14 indicate the extent of damage mapped underground after the MW 4.2 seismic event. The damage occurred over multiple levels and was most severe within or adjacent to block 22. Footwall drives were affected more than crosscuts because the stress orientation is perpendicular to the footwall drives. Damage
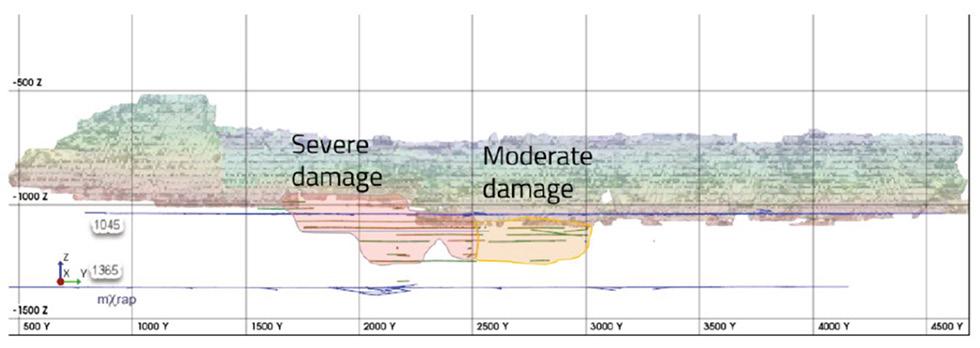
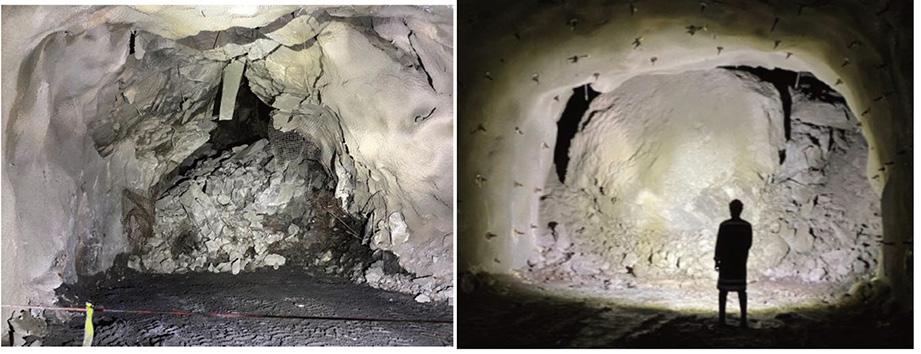
also extended from the intersections, which are larger, into the crosscuts. Figure 15 shows some of the intense damage in tunnels on 1079 level.
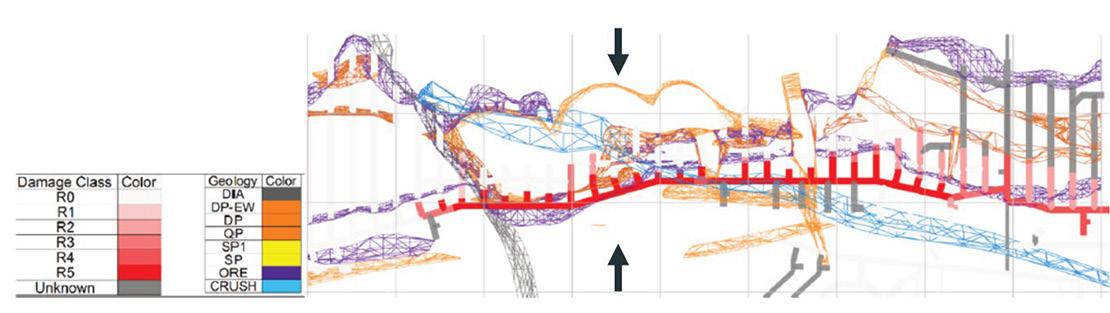
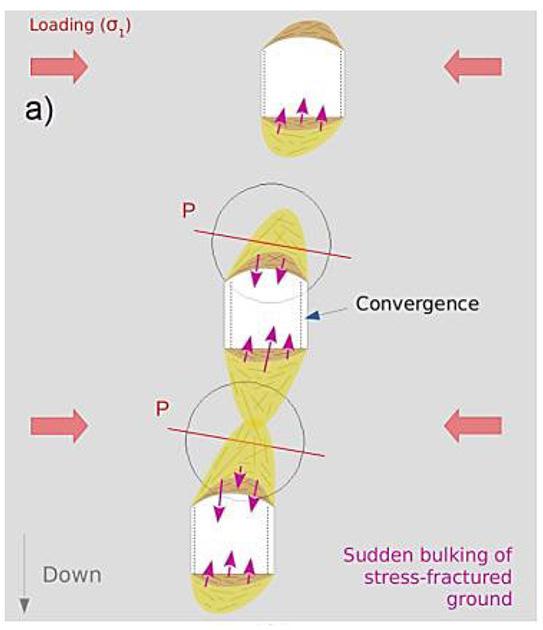
The source mechanism of the MW 4.2 seismic event could not be analysed seismically through moment tensor inversion because the waveform was too complex. The Institute of Mine Seismology analysed the source mechanisms of the aftershocks (Dineva et al., 2022; Boskovic, 2022). Figure 16 represents a model of the source mechanism of the aftershocks within block 22 (severe damage in Figure 13). The mechanism is sudden bulking of stress-fractured ground, as opposed to fault slip mechanisms, which occurred elsewhere. This highlights that the damage in the floor and roof of the tunnels occurred due to stress loading of the brittle footwall rocks. It is also likely that much of the damage occurred during the aftershocks.
The detailed and comprehensive investigations into this complex, unforeseen event, and many discussions, have yielded a commonly accepted interpretation of the cause of the event. It is postulated that the hangingwall in block 22 suddenly caved, giving rise to the MW 4.2 seismic event, which in turn resulted in a dynamic stress wave through block 22, overloading tunnels sited in a brittle rock mass.
The learnings from this event are as follows.
➤ Footwall drives and orepasses became overstressed and damaged as mining progressed, because these excavations are within the high stress zone
➤ It is essential to ensure a cave connection between sublevels and monitor hangingwall caving
➤ Selective mining in the narrower parts of the orebody will result in stress concentrations.
Due to the extensive damage in the footwall drives and crosscuts in block 22, it would be necessary to redevelop the access to the orebody. Several options for re-establishing block 22 were considered, but these involved skipping two or three levels and
effectively forming a pillar. The hope was that the pillar would be small enough to yield in a ductile manner, and caving would propagate naturally. However, there is no reliable way of ensuring that the pillar would not fail dynamically, potentially repeating the same type of event.
Three-dimensional finite difference models (FLAC3D) were constructed to analyse the different options and to determine whether the pillar would yield. However, the current numerical modelling tools are not able to reliably simulate dynamic processes and cannot answer this question conclusively.
The risk of creating another major event is too high to consider mining in block 22 at this stage.
The footwall infrastructure down to the main haulage level 1365 has already been developed. Stress damage and rockbursts can therefore be anticipated in the future in all mining blocks. Management of the risk requires multiple lines of attack:
➤ Developing and updating a litho-structural model of the orebody and footwall.
➤ Seismic monitoring and analysis, together with damage mapping, is essential to identify hazardous areas.
➤ The hazardous areas will need to be managed by installing more effective dynamic support, rehabilitation, and in some cases re-development with an improved layout.
➤ Mining will need to be carefully sequenced vertically and horizontally to avoid the formation of temporary pillars that create stress concentrations and unfavourable loading of geological structures.
➤ Cave connections between sublevels and monitoring of hangingwall caving will be essential.
➤ Seismic monitoring and exposure management (re-entry protocols) are essential to further mitigate the risk of injuries.
The challenges of managing geotechnical uncertainty in mines has been highlighted. Uncertainty and variability are inherent in geotechnical engineering.
Transparent investigations of unusual events with extreme consequences are essential and the findings should be published to enable them to be included in guidelines and future strategies.
Credible failure mechanisms should be analysed and described. The applicability and suitability of models should be determined. It is important to recognize that models do not provide definitive, reliable answers, but they can improve understanding by allowing trials and experiments to be conducted. Models should provide useful insights into the problem and help to find possible solutions.
High quality geotechnical data and geological understanding are important for making good decisions. It is important to check whether the sampling methods are appropriate and to ensure that all relevant data is collected. Recognizing what critical data may be missing is invariably more important than detailed analysis of the data that has been collected.
In the absence of important data, conservative assumptions should be applied in the initial design, taking cognisance of the potential consequences. A well-designed monitoring programme (visual and/or instrumented) can help to significantly reduce uncertainty. Designs should only be optimized when the relevant data is available.
Practical, flexible designs should be implemented where possible to enable optimization when it is feasible. The greater the confidence in the geotechnical data, analysis of failure mechanisms, and potential solutions, the more reliable the optimization.
References
Baecher, G.B. and Christian, J.T. 2003. Reliability and Statistics in Geotechnical Engineering. Wiley, Chichester, UK.
Boskovic, M. 2022. Challenges of resuming the production after a major seismic event at LKAB’s Kiirunavaara mine. Proceedings of the Tenth Conference on Rockburst and Seismicity in Mines. Society for Mining, Metallurgy & Exploration, Englewood, CO.
Christian, J. 2004. Geotechnical engineering reliability: How well do we know what we are doing? Journal of Geotechnical and Geoenvironmental Engineering, vol. 130, no. 1. pp. 985–1003.
Couto, P.M. and Malan, D.F. 2023a. A limit equilibrium model to simulate thelarge-scale pillar collapse at the Everest Platinum Mine. Rock Mechanics and Rock Engineering, vol. 56. pp. 183–197.
Couto, P.M. and Malan, D.F. 2023b. Bord-and-pillar design for the UG2 Reef containing weak alteration layers. Journal of the Southern African Institute of Mining and Metallurgy, vol. 123, no. 5. https://www.scielo.org.za/scielo. php?pid=S2225-62532023000500007&script=sci_arttext&tlng=en
Dineva, S., Dahnér, C., Malovichko, D., Lund, B., Gospodinov, D., Piana Agostinetti, N., and Rudzinski, L. 2022. Analysis of the magnitude 4.2 seismic event on 18 May 2020 in the Kiirunvaara mine, Sweden. Proceedings of the Tenth Conference on Rockburst and Seismicity in Mines. Society for Mining, Metallurgy & Exploration, Englewood, CO.
Dladla, S.D. and Ramsamy, S. 2022. Practical steps to Global Industry Standard on Tailings Management (GISTM) compliance for operational tailings storage facilities in South Africa. Journal of the Southern African Institute of Mining and Metallurgy, vol. 122, no. 6. pp. 283–290.
Esterhuyse, J.C. and Malan, D.F. 2023. Simulating pillar reinforcement using a displacement discontinuity boundary element code. Journal of the Southern African Institute of Mining and Metallurgy, vol. 123, no. 5. pp. 211–221.
Hadjigeorgiou, J. and Harrison, J.P. 2012. Uncertainty and sources of error in rock engineering. Proceedings of the 12th ISRM International Congress on Rock Mechanics, Harmonising Rock Engineering and the Environment. Qian, Q. and Zhou, X. (eds). CRC Press, Leiden. pp. 2063–2067
Hadjigeorgiou, J. 2019. Understanding, managing and communicating geomechanical mining risk. Proceedings of the First International Conference on Mining Geomechanical Risk. Wesseloo, J. (ed.). Australian Centre for Geomechanics, Perth. pp. 3–20.
Hedley, D.G.F. and Grant, F. 1972. Stope-and-pillar design for Elliot Lake Uranium Mines. Bulletin of the Canadian Institute of Mining and Metallurgy, vol. 65. pp. 37–44.
Ile, D. and Malan, D.F. 2023 A study of backfill confinement to reinforce pillars in bord-and-pillar layouts. Journal of the Southern African Institute of Mining and Metallurgy, vol. 123, no. 5. pp. 223–233.
Joughin, W.C. 2017. Dealing with uncertainty and risk in the design of deep and high stress mining excavations. Proceedings of the Eighth International Conference on Deep and High Stress Mining, Deep Mining 2017, Perth, Australia. University of Western Australia. pp.389–507.
Joughin, W.C., Wesseloo, J., Mbenza, J., Mpunzi, P., and Sewnun, D. 2020. A risk based approach to ground support design. Ground Support for Underground Mines. Potvin, Y. and& Hadjiergiou, J. (eds). Ch. 16. Australian Centre for Geomechanics, Perth.
MacRobert, C.J., Wates, J., Coetzee, A., and Howell, G. 2022. GISTM: Who are the responsible individuals? Journal of the Southern African Institute of Mining and Metallurgy, vol. 122, no. 6. pp. 299–304.
Malan, D.F. and Napier, J.A.L. 2011. The design of stable pillars in the Bushveld Complex mines: A problem solved? Journal of the Southern African Institute of Mining and Metallurgy, vol. 111, no. 12. pp. 821–836.
Mawson, M., Dahnér-Lindkvist, C.R., Andersson, U.B., Thomas, A., and Bäckström. A. 2022. The Kiruna seismic event: Important insights from the geotechnical model. Proceedings of Caving 2022. Potvin, Y. (ed.). Australian Centre for Geomechanics, Perth. pp. 1091–1100.
Muaka, J.J.M., Duma, S., Mushangwe, P., Gardner, L., Chindedza, T., Walls, J., and Joughin, W.C. 2017. Modelling hard rock jointed pillars using a distinct element and discrete fracture network approach considering the effect of a clay-filled shear structure. Deep Mining 2017: Proceedings of the Eighth International Conference on Deep and High Stress Mining. Australian Centre for Geomechanics, Perth. pp. 311–328.
Napier, J.A.L and Malan, D.F. 2007. The computational analysis of shallow depth tabular mining problems. Journal of the Southern African Institute of Mining and Metallurgy, vol. 107. pp. 725–743.
Napier, J.A.L. and Malan, D.F. 2021. A limit equilibrium model of tabular mine pillar failure. Rock Mechanics and Rock Engineering, vol. 54. pp. 71–89.
Napier, J.A.L. and Malan, D.F. 2023. Numerical simulation of large-scale pillar layouts. Journal of the Southern African Institute of Mining and Metallurgy, vol. 123, no. 5. pp. 203–210.
Spencer, D. 1999. A case study of a pillar system failure at shallow depth in a chrome mine. Proceedings of SARES99, 2nd Southern African Rock Engineering Symposium. Hagan, T.O. (ed.). South African National Institute of Rock Engineering, Johannesburg. pp. 53–59.
Stacey, T.R. 2003. Presidential Address: Rock engineering—good design or good judgment? Journal of the South African Institute of Mining and Metallurgy, vol. 103, no. 9. pp. 411–421.
Stacey, T.R., Terbrugge, P.J., and Wesseloo, J. 2006. Risk as a rock engineering design criterion. Proceedings of Challenges in Deep and High Stress Mining Australian Centre for Geomechanics, Perth. pp. 19–26.
Svartsjaern, M., Rentzelos, T., Shekhar, G., Swedberg, E., Boskovic, M., and Hebert, Y. 2022. Controlled reopening of the Kiirunavaara production block 22 after a 4.2 magnitude event. Proceedings of Caving 2022. Potvin, Y. (ed.). Australian Centre for Geomechanics, Perth. pp. 685–698.
Terbrugge, P.J., Wesseloo, J., Venter, J., and Steffen, O.K.H. 2006. A risk consequence approach to open pit slope design. Journal of the Southern African Institute of Mining and Metallurgy, vol. 106, no. 6. pp. 503–511.
Walls, J. and Mpunzi, P. 2017. Geotechnical characterization and revision of the pillar design for a hard rock pillar design. Proceedings of AfriRock 2017. International Society for Rock Mechanics. Paper no. ISRMAFRIROCK-2017-065.
Wesseloo, J. and Joughin, W.C. 2020. Probability, risk and- design. Ground Support in Underground Mines. Potvin, Y. and Hadjigeorgiou, J. (eds). Ch. 15. Australian Centre for Geomechanics, Perth. u
MISTY HILLS CONFERENCE CENTRE
MULDERSDRIFT,


The World Conference on Sampling and Blending (WCSB), to be held in South Africa, 21-23 May 2024, is the eleventh such conference to promote the Theory of Sampling (TOS). The WCSB conference provide a meeting place for professionals interested in sampling theory, practice, experience, applications, and standards. The Conference will provide understanding and insights for academics, manufacturers, engineering firms and practitioners aiming to achieve representative sampling. TOS effectively identifies the source of sampling variability and provides valuable solutions for minimising each source of sampling uncertainty.
The aim of WCSB11 is to invite and encourage the diverse international sampling community to adopt and disseminate the concepts and ideas for a standardized approach to sampling embodied in the TOS. The Conference will also offer a forum for fruitful discussions between statisticians committed to ‘Measurement of Uncertainty’ (MU) and proponents of the TOS by offering a unifying foundation for development of better and more general standards. While the Theory of Sampling had its historical origins in the mining industry, today it also applies to sampling of a broad range of bulk materials, minerals, agricultural raw materials and products, the food, feed, and pharmaceutical industries, as well as sampling for environmental applications. WCSB11 is an event of global significance that aims to improve sampling practices in all sectors of science, technology, and industry, for consultants, managers, sampling and quality control staff, researchers, engineers, and manufacturers operating in many industries, The opportunity to meet, exchange ideas, and share practical experiences will be a significant benefit for attendees.
The proceedings of the Conference will be published in electronic format with a strict adherence to an editorial and peer review policy that will allow academics to attract the publication subsidy for published academic
research. Adherence to these standards will enable the wider dissemination of the TOS in international scientific, technological, and industrial sectors. WCSBs have helped to promote the teaching of TOS at universities, with postgraduate courses in TOS being taught in some countries.
The Pierre Gy Gold Medal is awarded at each WCSB conference to individuals who have been most effective and successful around the world in disseminating and promoting TOS. This achievement will again be celebrated at WCSB11. The medallists are a unified body of champions capable of teaching, promoting, and researching aspects of sampling theory and practice, supporting the efforts of original equipment manufacturers to uphold TOS rules of sample representativeness. WCSB conferences aim to develop a unified vision for specific quality control protocols for sampling and blending activities, with participation and collaboration of industry professionals.
The theme of sustainable science, technology, and industry introduced at WCSB10 is upheld, with emphasis on the UN World Development Goals number 9 and 12, addressing sustainable industry, innovation, and infrastructure, and responsible production and consumption. Topics around societal, industrial, and environmental aspects of particulate sampling in mining, minerals processing, metals, cement, food and feed, agriculture and aquaculture, and pharmaceuticals may be addressed. An emphasis on the TOS, blending, sampling design and its role in metrology, estimation of sampling characteristics and heterogeneity studies, sampling and its effect on exploration, geostatistical studies, and grade control, sampling for feasibility studies and process control, practical applications for analysis and treatment of precious metals, and new technologies are anticipated. Sampling for environmental contamination studies and sustainability are also included. We encourage attendees and authors to contribute to sustainable industries.
Affiliation:
1Rare Earth Elements Application and Research Center, Munzur University, Tunceli, Türkiye
Correspondence to: T. Uysal
Email: turan.uysal@inonu.edu.tr
Dates:
Received: 20 Feb. 2023
Revised: 6 Sept. 2023
Accepted: 6 Sept. 2023
Published: September 2023
How to cite:
Uysal, T. 2023
Optimization of shape factor by the response surface method, and the effect on sphalerite flotation recovery.
Journal of the Southern African Institute of Mining and Metallurgy, vol. 123, no. 9. pp. 445–450
DOI ID:
http://dx.doi.org/10.17159/24119717/2645/2023
ORCID: T. Uysal
http://orcid.org/0000-0003-1643-6725
by T. Uysal1
Synopsis
Various morphological parameters that affect the flotation recovery of sphalerite were modelled and optimized using the response surface method (RSM). The effects of roughness value, shape factor, and collector concentration were investigated using the central composite full design method. The results were evaluated by analysis of variance. The optimum roughening time was found to be 25 minutes, the optimum roughness value was 2.9071 µm, and the optimum collector concentration was 0.001 M. Using these values, a flotation recovery of 98.01% was obtained. Similarly, in shape factor studies, the optimum grinding time was 15 seconds, the optimum roundness value 0.7421, and the optimum collector concentration 0.0009 M, which resulted in a flotation recovery of 94.30%. The average error between the optimization results and the experimental results was estimated to be less than 6%, and the R2 values were greater than 90%. The study shows that RSM can be effectively applied in finding the economic optimum condition for obtaining maximum flotation recovery with minimum reagent consumption.
Keywords sphalerite flotation, roughness, roundness, optimization.
Introduction
Particle morphology is the study of the surface shapes of particles. The major parameters are shape factor and roughness. Shape factor, roundness, angularity, and flatness are evaluated in two dimensions, while roughness is evaluated in three dimensions. In flotation studies, it is known that more angular particles result in higher recovery than round particles. This shows the role of the shape factor in flotation processes, and important gains can be achieved with appropriate particle morphology (Uysal and Güven, 2022). Another important parameter for particle morphology is roughness, or the topography on the solid surface (Rezai et al., 2010). Particle flotation and aggregation increase significantly with increasing roughness values (Uysal et al., 2021; Uysal, Karaagaçlioglu, and Guven, 2021). Recent studies have found that flotation recovery and particle aggregation increase significantly with increasing particle roughness and angularity (Yekeler, Ulusoy, and Hiçyilmaz, 2004; Vizcarra et al., 2011; Güven, Çelik, and Drelich, 2015; Güven and Çelik, 2016).
In the flotation of ores, the optimum distribution of flotation reagents and the optimization of the process parameters are of particular importance. Under optimum conditions it might be possible to develop a process flow sheet for economical sphalerite production (Mehrabani et al., 2010). Optimization entails the use of statistical methods and approaches in interpreting, and analysing experimental engineering data. In traditional methods the effect of each variable on the process is examined in turn, the other variables being kept constant. This approach does not allow the effects of the variables on the process performance to be evaluated concurrently. It has become necessary to develop an experimental design that will measure the response of the system in order to use resources efficiently, reduce the number of experiments, save cost and time, and speed up research and development (Khuri and Mukhopadhyay, 2010; Aygün, 2012).
The response surface method (RSM) has been developed for the planning and execution of experiments, and its use has become widespread in recent years. The RSM is constructed through model regression. The magnitude of the main effect of the variable on the process or its interaction with other variables on the value of the response variable is determined by the regression coefficient. The optimum value can be obtained by determining the effects on the responses using response surface patterns. Thus, using several experimental combinations, variable values and combinations that have not actually been tested can be estimated. The purpose of creating a ‘response surface’ is to predict a region that comprises the desired properties and the optimum point of this region in a design plane consisting of many variables that affect
the result in an experimental study. Results are statistically tested by analysis of variance (ANOVA) with 95% confidence. Thus, significance levels provide information about the reliability of the data (Turan and Altundoğan, 2011).
In industry, the type and conditions of the milling process have a significant impact on particle shape and roughness (Verrelli et al., 2014; Rezai et al., 2010; Koh et al., 2009; Feng and Aldrich, 2000). In this context, by redesigning the milling process, particles can be produced with the desired morphology; flotation recovery will increase, and flotation collector consumption will be significantly reduced. In this study, the optimization of flotation parameters of sphalerite samples was investigated by RSM using roughness value, roundness value, and potassium amyl xanthate (KAX) concentration as independent variables. The effects of these parameters on the flotation recovery were investigated with a central composite full design, and mathematical models were developed. In addition, the interacting effects of independent variables were modelled by constructing three-dimensional response surface shapes.
Materials and method
Materials
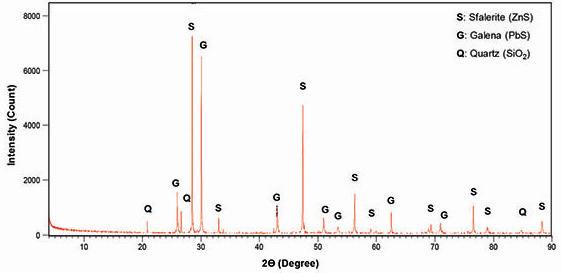
Sphalerite lumps of +25 mm size were supplied by ESAN mining company, Turkey. The crystallinity of the samples was determined by X-ray diffractometry (XRD) using a Bruker D8 Advance instrument employing CuKα radiation from a long fine-focus Cu tube operating at 40 kV and 40 mA. According to the XRD results the sample consisted of 69% sphalerite, 17% galena, and 14% silicate. The XRD spectrum of the sphalerite sample is shown in Figure 1.
Method
The sample was crushed by a series of jaw, cone, and roll crushers, then ground in a 5200 cm3 volume ceramic cylindrical ball mill with alumina balls to prevent possible contamination from grinding media. Grinding was carried out on the –2+1 mm size fraction, which had a relatively low roundness. Samples were ground for 15, 30, 60, 120, 240, 480, and 960 seconds. The product from each grinding test was subjected to sieving to separate the 74+38 µm fraction, and the roundness values of this fraction were measured. The particles in each sample were photographed using a digital camera. Roundness analysis was performed using the Image J freeware program. The roundness values were calculated using Equation [1] (Forssberg and Zhai, 1985; Ulusoy, Yekeler, and, Hiçyilmaz, 2003; Hassas et al., 2016): [1]
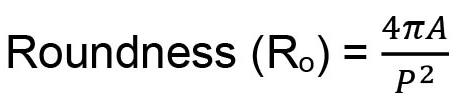
where P is the particle perimeter and A is the area.
The samples obtained at each grinding time were subjected to roughening with silicon carbide (SiC) with a size of –15 µm and a hardness of about 9.5. The SiC was then separated using a 38 µm vibrating sieve. The roughened samples were pelletized under 10 MPa load for 5 minutes and the roughness of the pressed samples was measured with a contact profilometer (Mitutoyo SV-2100 model, Japan). Care was taken to take as many measurements as possible (approx. 15 measurements) on each pellet surface) and the average value was taken as the roughness. The roundness results for different grinding times for the sphalerite sample are given in Table I, and the roughness results in Table II. The experimental flow chart is shown in Figure 2.
Microflotation
Flotation experiments were carried out in a 25 × 220 mm, 150 mL volume, 15 µm frit column cell and a microflotation cell set up with a magnetic stirrer to prevent the sample in the cell from collapsing. Chemical grade KAX supplied by ECS Chemistry was used as the collector. KAX (C5H11OCS2K) is a highly vigorous non-selective collector commonly used in the flotation of sulphide ores.
For the microflotation experiments, the desired amounts of collector and distilled water were mixed for 3 minutes. The sample was then added and the pulp was conditioned by mixing with a magnetic stirrer for 5 minutes. Tthe conditioned suspension was transferred to the microflotation cell and flotation was carried out with N2 gas supplied to the cell at 3 psi pressure and a flow rate of 50 cm3/min for 1 minute. The float and sink products were filtered on filter paper and dried in an oven, and the flotation recovery calculated.
To test repeatability, all experiments were performed at least three times. All flotation experiments were carried out at natural pH, keeping parameters such as time, mixing speed, and air flow rate constant. Microflotation experiments were carried out on samples with low, medium, and high roundness and roughness values at different KAX concentrations in order to observe the effect of particle morphology. The flotation experiments were carried out with very fine particle size (-74 + 38 µm) and the particles became spherical with the effect of comminution and tended to clump together in the pulp. It has been established that agglomeration increases with roughness and roundness (Uysal et al., 2021).
RSM is a correlation-based experimental design and statistical modelling method that reveals trial patterns that aim to reach the point where the response variable takes its maximum value on the
Table I
Variation of the roundness index with grinding time (Uysal et al., 2021)
Grinding
Table II
Variation of roughness values with roughening time (Uysal et al., 2021) Roughening time (m)
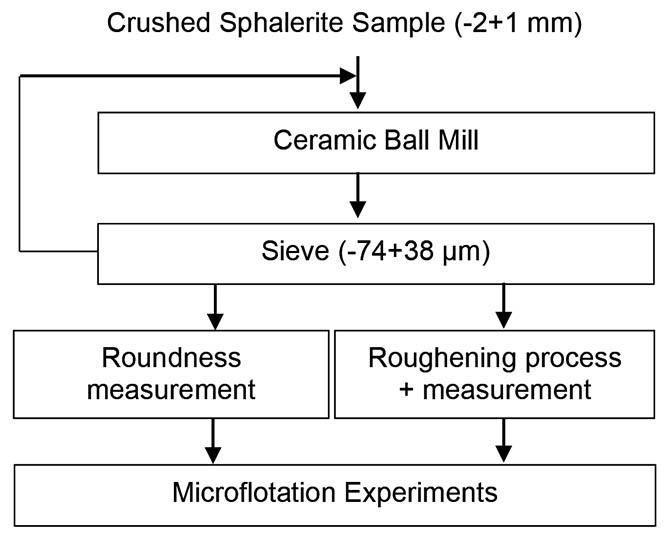
Figure 2—Experimental flow chart
response surface with the least possible number of observation values (Mead and Pike, 1975). Central composite design (CCD) is used extensively in building the second-order response surface models. It is one of the most important experimental designs used in process optimization studies (Obeng, Morrell, and Napier 2005; Aslan and Fidan, 2008). Statistical analyses were performed using Minitab 18 (Version 18.1.0) software. In this study, the central composite design method was used. Results were statistically tested with analysis of variance (ANOVA) with 95% confidence. A total of 13 experiments were performed for two factors according to the central composite full factorial design method (Box and Hunter, 1957; Obeng, Morrell, and Napier, 2005). Response values obtained from the experimental studies, coefficients of the response model, standard deviations, and size were determined by regression analysis. The quadratic polynomial in Equation [2] was used to explain the dependent variables.
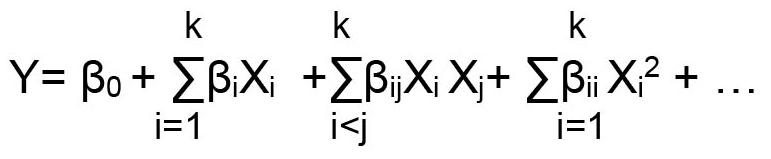
Here, Y is the function of the independent variables coded in terms of dependent variables Xi and Xj. β0 is the regression coefficient, βi is the linear coefficient, βii is the quadratic coefficients, and βij is the binary interaction coefficient. The values of the
independent variable coded in the experimental design and the values of the dependent variable obtained as a result of the experiments are given in Table III.
Results and discussion
Analysis of variance
ANOVA was applied to ascertian if there was a significant difference between the means of the factors. ANOVA results showing the effect of roughening on the flotation recovery are given in Table IV, and results showing the roundness effect in Table V.
Table III
Values of independent and dependent variables used in experiments
Factor A Roughness value (µm) 2.269-2.761-2.98-3.31 Factor B Roundness value 0.720-0.749-0.760 Factor C KAX concentration (M) 1.00E-06-5.00E-06-1.00E-055.00E-04-1.00E-03
Response Flotation recovery (%) 0-100
Table IV
Analysis of variance (ANOVA) for the roughening effect
Table V
Analysis of variance (ANOVA) for the roundness effect
The most important criteria to consider in the ANOVA table are the F-value and the P-value. For a factor to have an effect on the response, the P-value must be less than 0.05 (Box and Hunter, 1957; Obeng, Morrell, and Napier, 2005; Hirotsu, 2017). The F statistic should be used in conjunction with the P-value when deciding whether the overall results are significant. For a factor to have an effect on the response, the P-value must be less than 0.05 (Whitley and Ball, 2002; Şimsek and Uslu, 2020). P-values greater than 0.05 mean that the parameter is insignificant or has no effect on the response. Table IV shows that the roughness value and the collector concentration have a significant linear effect on the response. The collector concentration was more effective than the roughness value as indicated by the higher F-value and lower P-value. In addition, Factor A*Factor C was lower than 0.05, so both factors were found to be effective together. The expression of effect indicated here means a positive effect on the response surface. The effect value, on the other hand, is the quantitative expression of the positive or negative effect on the response surface.
In Table V, it is seen that the roundness value and the collector concentration have a significant effect on the linear response. In addition, Factor B*Factor C was 0.052, so the effect of both factors together was found to be low. The estimated quadratic polynomial model equations proposed by the software program for the flotation recovery response value are given in Equations [3] and [4]. Using these equations, the recovery can be estimated and the experimental result compared with the model estimate. Multiple coefficients of determination and standard deviation values for dependent variables are given in Table VI.
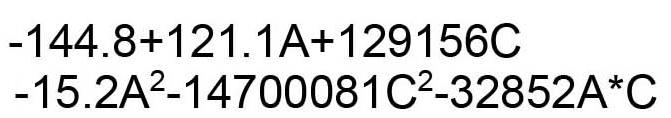


In Table VI, the multiple coefficients of determination are calculated as R2 = 89.55% for roughness, and R2 = 95.54% for roundness. The fact that these values are close to each other and to unity shows the success of the model. In addition, the R2 values and the adjusted R2 values are compatible with each other. This shows that the model fit is high. R2 values greater than 90% were obtained for the responses, and accordingly the RSM model created has the ability to accurately predict the effect on the flotation recovery responses at different roughness, roundness, and collector concentration values. The Pareto chart created by the model is given in Figure 3, and the three-dimensional graphs drawn to better understand the correlation between the factors are in Figure 4.
Factors to the left of the dashed red line in the Pareto chart have no effect on the answer, while those to the right have an effect on the answer. In other words, it was observed that the roughness value, roundness, and KAX concentration were effective. In addition, it is seen that the effect of collector concentration is greater than that of the roughness and roundness values. ANOVA analysis also supports this conclusion. It was observed that the effect value of roundness was low. Uysal et al. (2021) also concluded that the shape factor values are very close to each other, so the effect is low compared to other parameters. The lowest form factor value is 0.720, while the highest value is 0.760, a difference of only 0.040.
As seen in Figure 4, as the roughness and KAX concentration increase, the flotation recovery increases significantly. Efficiency similarly increases. It is clear that the effect of collector concentration on flotation recovery is greater than that of the roughness and roundness. Also, the roughness value is more effective than the roundness value. While the flotation recovery is 41.10% at the lowest roundness and lowest KAX concentration, it increases to 52.27% at the lowest roughness and lowest concentration value. Thus, the order in which the factors affect the flotation recovery is collector concentration > roughness > roundness. The correlation of the parameters with the flotation recovery was determined by the Minitab program, as was the Pearson correlation coefficient for linear curves. Accordingly, the closer the coefficient value is to ±1, the stronger the correlation. The correlation coefficient between roundness and flotation recovery was found to be 0.151, and the P-value 0.622. This result indicates a weak positive correlation. Similarly, the Pearson correlation coefficient between roughness and flotation recovery was found to be 0.586, and the P-value 0.035. This indicates a strong positive correlation.
The aim of the optimization is to determine the optimum roughness value, roundness, and collector concentration and to obtain the highest flotation recovery corresponding to the optimum operating conditions. All factors were optimized simultaneously. The results are shown in Table VII and the contour graph created by the model is shown in Figure 5.
Table VI
Model summary statistics
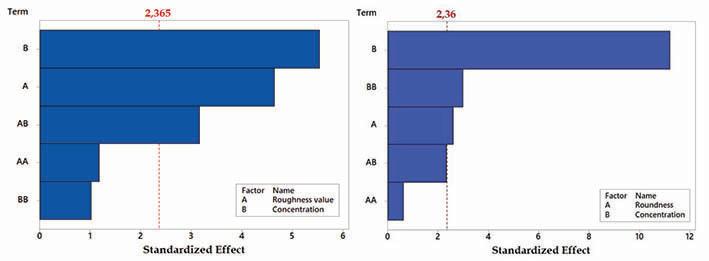
the
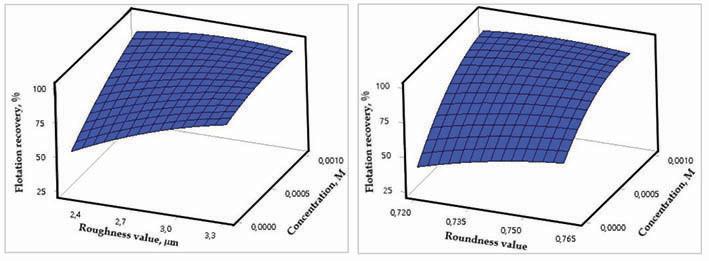
The optimum roughness value was found to be 2.9071 µm and the optimum collector concentration was 0.001 M. The response corresponding to the optimum roughness value and collector concentration is 98.01% recovery. Similarly, the optimum roundness value is 0.7421, the optimum KAX concentration is 0.0009 M, with a flotation recovery is 94.30% for these values.
The contour plots in Figure 5 confirm the optimization results. It is seen that as the roughness value increases, a high flotation recovery is obtained even at low collector concentrations. The roughness value is a very effective parameter. For example, while the efficiency is 60-70% in the 0.0001 M concentration region at a roughness value of 2.4, it increases to 80-90% at the same concentration at a roughness value of 3.2. Although the roundness value is not as effective as the roughness value, similarly, as the roundness value increases the same flotation recovery is obtained at a lower concentration value. Thus, even at low collector concentrations, higher flotation recovery can be obtained by optimizing the shape factor.
The optimum operating parameters obtained from the optimization exercise and the experimental results were compared. The results and the percentage errors are given in Tables VIII and IX. The errors were calculated with the formula in Equation [5].
Optimum operating conditions and corresponding responses

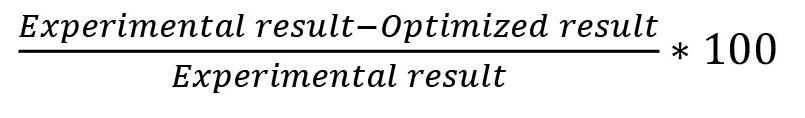
It can be said that the optimization study was successful because the mean error value was below 6% for both morphological parameters. In the literature, there are studies with a similar or higher error (Kumar et al., 2020). Obviously, the values optimized by RSM were deduced to be significant.
In order to obtain the highest flotation recovery, the optimum roughness value, roundness, and collector concentration were determined and an optimization study was carried out using RSM.
➤ The roughness value and the collector concentration have a significant effect on the flotation response. The collector concentration value is more significant than the roughness and roundness values. The weak effect of roundness may be due to the fact that the roundness values are quite close to each other. The order of effectiveness of the parameters on the flotation recovery is concentration > roughness > roundness.
➤ The correlation of the parameters with flotation recovery was determined by the Minitab program. Accordingly, while the correlation between roundness and flotation recovery is weak, there is a strong correlation between roughness and flotation recovery and collector concentration and flotation recovery.
➤ According to the roughness studies, the optimum roughening time was found to be 25 minutes, the optimum roughness value was 2.9071 µm, and the optimum collector concentration was 0.001 M. Using these values, the flotation recovery was found to be 98.01%. Similarly, in shape factor
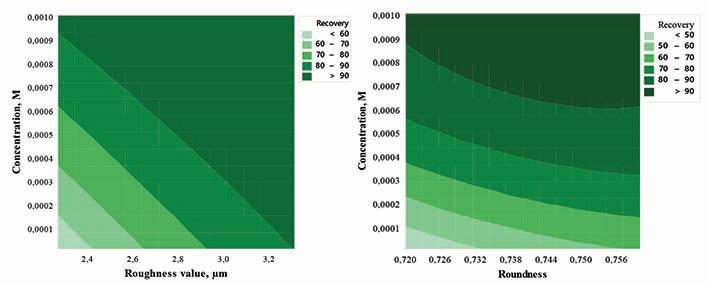
Table VIII
Verification application for roughness value to flotation recovery
Roughness
Table IX
Verification application for roundness value to flotation recovery
studies, the optimum grinding time is 15 seconds, the optimum roundness value is 0.7421, and the optimum collector concentration is 0.0009 M, for a flotation recovery of 94.30%.
➤ The optimization study was successful, as indicated by the R2 values being greater than 90% for all responses obtained as a result of the regression, and the mean error value for both morphological parameters being less than 6%. This shows that the RSM model has the ability to accurately predict the effect of different morphological particles on flotation recovery.
The authors thank Professor DrMehmet Sabri Çelik and Dr Onur Güven for their contributions. This study was supported by The Scientific and Technological Research Council of Turkey (TUBITAK) with Project Number 117M659, and we thank TUBITAK 2218 Scholarship program for financial support.
References
Aslan, N. and Fidan, R. 2008. Optimization of Pb flotation using statistical technique and quadratic programming. Separation and Purification Technology, vol. 62, no. 1. pp. 160–165.
Aygun, A. 2012. Treatment of textile industry reactive and disperse dye bath waste water by electrocoagulation process: Optimization by response surface method. PhD thesis, Institute of Science and Technology, Selcuk University, Türkiye.
Box, G.E.P. and Hunter, J.S. 1957. Multi-factor experimental design for exploring response surfaces. Annals of Mathematical Statistics, vol. 28. pp. 195–241.
Feng, D. and Aldrich, C. 2000. A comparison of the flotation of ore from the Merensky Reef after wet and dry grinding. International Journal of Mineral Processing, vol. 60, no. 2. pp. 115–129.
Forssberg, E. and Zhai, H. 1985. Shape and surface properties of particles liberated by autogenous grinding. Scandinavian Journal of Metallurgy, vol. 14. pp. 25–32.
Guven, O. and Çelik, M.S. 2016. Interplay of particle shape and surface roughness to reach maximum flotation efficiencies depending on collector concentration. Mineral Processing and Extractive Metallurgy Review, vol. 37, no. 6. pp. 412–417.
Guven, O., Çelik, M.S., and Drelich, J. 2015. Flotation of methylated roughened glass particles and analysis of particle-bubble energy barrier. Minerals Engineering, vol. 79. pp. 125–132.
Hassas, B.V., Calişkan, H., Guven, O., Karakas, F., Cinar, M., and Çelik, M.S 2016. Effect of roughness and shape factor on flotation characteristic of glass beads. Colloids and Surfaces A, vol. 492. pp. 88–99.
Hirotsu, C. 2017. Advanced Analysis of Variance. Wiley. https://doi: 10.1002/9781119303374
Khuri, A.I. and Mukhopadhyay, S. 2010. Response surface methodology. WIREs Computational Statistics. https://doi.org/10.1002/wics.73
Koh, P.T.L., Hao, F.P., Smith, L.K., Chau, T.T., and Bruckard, W.J. 2009. The effect of particle shape and hydrophobicity in flotation, International Journal of Mineral Processing, vol. 93. pp. 128–134.
Kumar, A.N., Kishore, P.S., Raju, K.B., Ashok, R., Vignesh, A.K., Jeevanantham, K., Nanthagopal, and Tamílvanan, A 2020. Decanol proportional effect prediction model as additive in palm biodiesel using ANN and RSM technique for diesel engine. Energy, vol. 213. 119072.
Mead, R. and Pike, D.J. 1975. A review of response surface methodology from biometric viewpoint. Biometrics, vol. 31, no. 4. pp. 803–851.
Mehrabani, J.V., Noaparast, M., Mousavi, S.M., Dehghan, R., and Ghorban, A. 2010. Process optimization and modelling of sphalerite flotation from a low-grade Zn-Pb ore using response surface methodology. Separation and Purification Technology, vol. 72, no. 3. pp. 242–249.
Obeng, D.P., Morrell, S., and Napier, T.J.N. 2005. Application of central composite rotatable design to modeling the effect of some operating variables on the performance of the three-product cyclone. International Journal of Mineral Processing, vol. 76. pp. 181–192.
Rezai, B., Rahimi, M., Aslani, M.R., Eslamian, A., and Dehghani, F. 2010. Relationship between surface roughness of minerals and their flotation kinetics. Proceedings of the XI International Seminar on Mineral Processing Technology. National Metallurgical Laboratory, Jamshedpur, India. pp. 232–238.
Símsek, S. and Uslu, S. 2020. Investigation of the effects of biodiesel/2-ethylhexyl nitrate (EHN) fuel blends on diesel engine performance and emissions by response surface methodology (RSM). Fuel, vol. 275. 118005.
Turan, M.D. and Altundoğan, H.S. 2011. Use of response surface methods (RSM) in hydrometallurgical research. Scientific Mining Journal, vol. 50, no. 3. pp. 11–23.
Ulusoy, U., Yekeler, M., and Hiçyilmaz, C. 2003. Determination of the shape, morphological and wettability properties of quartz and their correlations. Minerals Engineering, vol. 16. pp. 951–964.
Uysal, T. and Guven, O. 2022. The effect of shape factor on flotation and aggregation of galena ore. Journal of Engineering and Architecture Faculty of Eskişehir Osmangazi University, vol. 30, no. 3. pp. 348–356.
Uysal, T., Karaagaçlioglu, I.E., and Guven, O. 2021. Effect of particle roughness on flotation and aggregation of galena mineral. Scientific Mining Journal, vol. 60, no. 4. pp. 191–196.
Uysal, T., Guven O., Ozdemir, O., Karaagaclioglu, I.E., Tunç, B., and Çelik, M.S. 2021. Contribution of particle morphology on flotation and aggregation of sphalerite particles. Minerals Engineering, vol. 165. 106860.
Verrelli, D.I., Bruckard, W.J., Koh, P.T.L., Schwarz, M.P., and Follink, B. 2014. Particle shape effects in flotation. Part 1: Microscale experimental observations. Minerals Engineering, vol. 58. pp. 80–89.
Vizcarra, T.C., Harmer, S.L., Wightman, E.M., Johnson, N.W., and Manlapig, E.V. 2011. The influence of particle shape properties and associated surface chemistry on the flotation kinetics of chalcopyrite, Minerals Engineering, vol. 24. pp. 807–816.
Whitley, E. and Ball, J. 2002. Statistics review 3: Hypothesis testing and P values. Critical Care, vol. 6. 222.
Yekeler, M., Ulusoy, U., and Hiçyilmaz, C. 2004. Effect of particleshape and roughness of talc mineral ground by different mills on the wettability and floatability. Powder Technology, vol. 140, no. 1-2. pp. 68–78. u
Affiliation:
1Department of Geography, Environmental Management and Energy Studies, University of Johannesburg, South Africa.
Correspondence to:
K.E. Langerman
Email: klangerman@uj.ac.za
Dates:
Received: 19 Oct. 2021
Accepted: 25 Aug. 2023
Published: September 2023
How to cite:
Majola, C.M.D. and Langerman, K.E. 2023
Energy efficiency in the South African mining sector: A case study at a coal mine in Mpumalanga.
Journal of the Southern African Institute of Mining and Metallurgy, vol. 123, no. 9. pp. 451–462
DOI ID:
http://dx.doi.org/10.17159/24119717/1788/2023
ORCID: K. Langerman http://orcid.org/0000-0003-0936-2051
by C.M.D. Majola1 and K.E. Langerman1
Synopsis
Energy efficiency is a cost-effective way of both bolstering energy security and limiting the harmful effects of energy use on the environment. Mining is an inherently energy-intensive activity, and the 2008 revision of South Africa’s National Energy Efficiency Strategy (NEES) set a target of a 10% reduction in energy consumption by 2015 for the mining sector. In this study, we investigate the effectiveness of the NEES in improving energy efficiency in the South African coal mining sector by surveying energy intensity at a number of operations, and analysing energy efficiency trends and energy use by process and energy carrier at an underground coal mine in Mpumalanga. Most mines surveyed exhibit an increase in energy intensity over time. At the case study mine, the increase was primarily due to increased energy use in the beneficiation and discard reclaiming processes. Trends in energy consumption are a poor reflection of trends in energy intensity, as a decline in energy consumption is most easily achieved by reducing production. A more appropriate metric for energy efficiency at coal mines is energy intensity, defined as energy use per unit of saleable product, relative to a multi-year baseline. The evidence suggests that the NEES has been ineffective in promoting energy efficiency in South African coal mines. We propose that greater success could be achieved by monitoring and reporting on energy intensity at the process level, and by incentivizing energy efficiency gains.
Keywords energy efficiency, energy intensity, coal mining.
Introduction
The energy transition is under way, spurred on by the drive to mitigate climate change, and facilitated by technologies of the Fourth Industrial Revolution. Often the quickest and most cost-effective way to reduce fossil fuel use is through increasing energy efficiency. The South African government (Department of Energy, 2016) has embraced energy efficiency as a ‘first fuel’ (International Energy Agency, 2014), an unseen energy resource to be exploited before considering other energy sources. Coal is gradually being replaced with renewables and other lower carbon emitting sources of energy. The coal industry is expected to go into decline as demand and investment in the sector drop (Semelane et al., 2021; Winkler et al., 2021). The contribution of coal to South Africa’s primary energy supply declined from 70.7% in 2012, when local coal production peaked, to 63.1% in 2018 (Department of Energy, 2021). Coal production in South Africa has stagnated over the past ten years (BP, 2021). Nevertheless, reliance on coal is expected to continue for decades. The scenarios considered for the Integrated Resource Plan 2019 (Department of Energy, 2018) show that coal is still expected to generate between 17% and 42% of South Africa’s electricity in 2050.
In this study, we consider energy efficiency in the coal mining sector in South Africa. The Energy Efficiency Strategy for the Republic of South Africa, published in 2005 (Department of Minerals and Energy, 2005) set a target for the mining sector of a 15% reduction in final energy demand by 2015 relative to a 2000 baseline. This target was revised in the 2008 review of the National Energy Efficiency Strategy (NEES) (Department of Minerals and Energy, 2009) to a 10% reduction by 2015 relative to an adjustable baseline. The draft post-2015 NEES (Department of Energy, 2016) recommends a target of a cumulative annual energy saving of 40 PJ from energy savings interventions for the mining sector. The Second Annual Monitoring Report on South Africa’s Energy Efficiency Targets (Department of Energy, 2015) evaluates energy efficiency in terms of energy intensity, calculated as energy consumed per unit economic output (unit gross value-added), and finds that the mining sector has performed particularly badly in terms of energy efficiency: the energy intensity of the mining sector increased by around 10% between 2004 and 2012.
While the Energy Efficiency Target Monitoring Reports (Department of Energy, 2015, 2014) provide a useful overview of energy efficiency trends in South Africa, the aggregated data provides no insights into
efficiency
the South African mining sector: A case study at a coal mine in Mpumalanga
energy efficiency in the different mining sub-sectors. Moreover, the Monitoring Reports do not assess whether the NEES target for the mining sector of a 10% reduction in energy demand by 2015 was in fact achieved. Given the fact that the mining sector appears to be becoming more energy intensive over time, and that disinvestment in the coal mining sector may exacerbate this trend, energy efficiency in coal mines warrants further investigation.
This study aims to provide insights into energy efficiency trends in the coal mining sector in South Africa. Firstly, we question whether an energy efficiency target based on overall energy demand (consumption) is appropriate, considering that the easiest way to reduce demand is by lowering production, which is not beneficial to South Africa’s economy. Several alternative metrics for energy efficiency are proposed and evaluated. Secondly, the energy use breakdown by process and by energy carrier is assessed at an underground coal mine in Mpumalanga. Finally, the energy use of the case study mine is contextualized by comparing overall energy intensity of the case study mine to the energy intensity of other South African coal mining operations.
Energy is used in all stages of the recovery process at a coal mine: in extraction, transportation, and beneficiation (Jeswiet and Szekeres, 2016; Pretorius, 2016). Energy is used in the form of electricity and fossil fuels such as diesel, natural gas, and propane gas. Reducing operational costs, increasing competitiveness and profitability, and the need to ensure energy security are the main drivers for energy efficiency in coal mines (Ryan, 2014).
Various energy efficiency projects have been successfully planned and implemented in mining operations in South Africa. Between 2010 and 2015, Harmony Gold Mining achieved 256 000 MWh in electricity savings through projects such as bulk air cooler peak-load clipping to reduce power consumption during peak hours; installing energy-saving ventilation fans; enhancement of compressed air use by using it for cooling purposes; and the installation of energy-saving motor drives (Harmony Gold Mining Company Limited, 2105). Anglo American has improved the energy efficiency of the air compressors, fans, pumps, electric motors, draglines, and conveyor belts. The company has also fitted heat pumps in the employees’ change houses (bathrooms) to replace the conventional geysers. By 2015, energy consumption was reduced by 7% (Msimanga, 2015).
Lonmin, in partnership with Eskom, has invested in energy efficiency projects since 2007 valued at around R150 million (Ryan, 2014). By 2012, these projects achieved a saving of 0.8 MWh/platinum group metal (PGM) and 1.06 GWh/a. The energy efficiency investments were made in the optimization of
compressed air and ventilation systems, the generation of hot water, and renewable energy technologies. Lonmin also installed above-ground fluorescent and LED lighting that reduced energy demand by 0.33 MW and attained a R210 000 saving in 2013.
Impala Platinum Holdings Limited has implemented initiatives such as the installation of power factor equipment with the aim of achieving a 2.5% saving. The company’s new operations have been designed with high-level energy efficiency specifications and energy management in the shaft stations, the site refrigeration systems, underground lighting, air compression, as well as water reticulation systems (Ryan, 2014).
Wang et al. (2018) suggest the following categories for energy efficiency indicators for coal mining operations:
➤ Basic indicators that reflect the basic energy situation of coal mining operations and which are commonly total raw coal production (Mt) and energy consumption of raw coal mining, as used for the mining sub-sector’s target in the NEES (Department of Minerals and Energy, 2009, 2005).
➤ Composite evaluation indicators that evaluate the energy or power (electricity) intensity as a function of coal produced or revenue.
➤ Single process indicators that remove the influence of natural conditions on energy consumption in coal production by looking at the energy use of key processes like the fan, hoisting, drainage, air compressor and conveyor belt systems.
There are significant differences in energy consumption between various coal mines due to the influence of local conditions, production processes, age of the mine, and even safety requirements. The breakdown of energy use by process and energy carrier is necessary to identify the processes that are energy intensive and allow interventions to be planned (Eckelman, 2010). This study presents the energy use breakdown by process for one underground coal mine in Mpumalanga.
A single explanatory case study method is applied. Historical secondary data from an underground coal mine in Mpumalanga is used to determine energy consumption and energy intensity trends, as well as to evaluate whether the mine achieved the NEES energy demand reduction target of 10%. The energy intensity of each process is assessed, and the use of the three energy carriers used at the mine – electricity, diesel, and oil – is quantified. The energy intensity of the case study mine is also benchmarked against 15 other South African coal mines, and energy intensity trends at six coal mines are analysed to provide context.
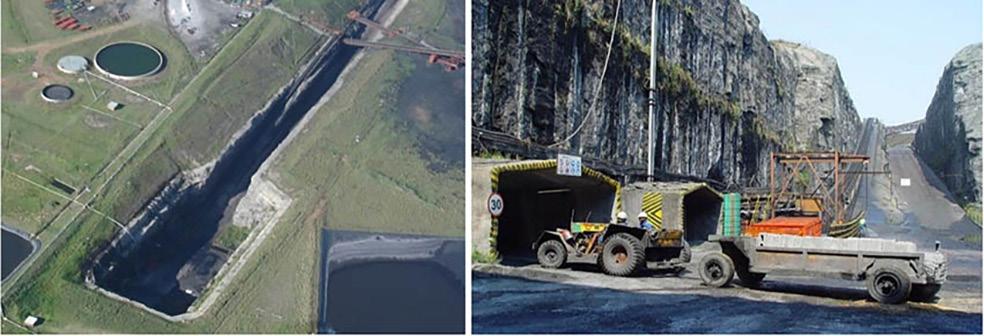
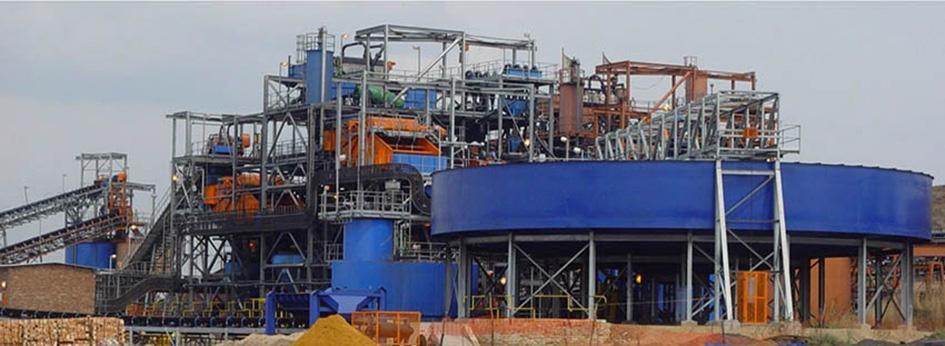
The case study mine is located within the Highveld Coalfields in the Nkangala District in Mpumalanga. The No. 2 coal seam has already been mined out and underground mining of the No. 4 lower seam commenced in 1996. Mechanized board and pillar extraction methods are used. The coal is accessed through a decline shaft system (Figure 1). Run-of-mine (ROM) coal from the underground operations is conveyed to ROM stockpiles then transported to the beneficiation plant where it is crushed and screened (Figure 2). The coal is beneficiated into two products, export coal and metallurgical coal (for local use). Waste rock is separated from the product by dense media separation at the beneficiation plant and is then conveyed to the discard bin, from where it is trucked to the discard dump.
Four dormant discard dumps from historical mining activity are being re-mined. Similar to the underground coal, the discard material extracted from the old dumps is beneficiated in two separate circuits and screened into different products which are then transported by rail for export and by truck for inland use.
The case study operation utilizes energy in the form of electricity, oil, and diesel. Electricity is directly supplied by Eskom, with the main electrical substation located adjacent to the site. There are then four substations on the mine where the electricity is stepped down to 550 V and 400 V for surface use and 11 kV for underground use. Four diesel supply tanks supply the mobile equipment. Oil is used for maintenance of machinery and is housed in five oil stores.
To provide some context on the energy intensity of the case study mine relative to other South African coal mines, a number of wellestablished local mining operations that use either underground or open cast mining methods were selected. Mines were selected based on availability of production, electricity consumption, and overall energy consumption data for at least five consecutive years. The energy intensity for each mine was calculated using production and energy consumption data retrieved from the company’s annual sustainability reports. Trends in energy intensity were analysed for 2007-2015 for the following six mines for which annual energy use and production were available: Arnot coal mine, Grootegeluk mine, Inyanda coal mine, Goedehoop colliery, Leeuwpan coal mine, Matla coal mine, and North Block complex.
To determine trends in energy use and intensity, energy use breakdowns by process and energy carrier at the case study mine, historical energy use, and production data for the period between 2005 and 2019 were obtained from the relevant departments.
Missing energy consumption data at the case study coal mine Data
Electricity consumption
Diesel consumption
Oil consumption
Year Months
2005 July, August, December
2005 January, September
2006 May, June, September
2007 January, February, March
2005 September, October
2006 April, May, June, December
2007 February
Electricity consumption was obtained from monthly invoices. Monthly diesel consumption was verified against the opening and closing readings on the diesel pumps and refilling records. Oil data was checked against the logs of the amount of oil available at the start of each month, the oil purchased, and the remaining amount at the end of the month. Coal produced from underground and beneficiation processes is measured with scales that are calibrated annually to ensure accuracy and logged daily. The storage of energy consumption data prior to 2008 was fairly poor and in several instances consumption data was not available (Table I). Missing data was substituted with the average of three months of data before the gap in the record.
Energy intensity (energy consumed (GJ) per ton of coal produced) is used as the primary metric for energy efficiency in this study. Energy consumption is the sum of energy derived from all energy carriers (electricity and liquid fuels).
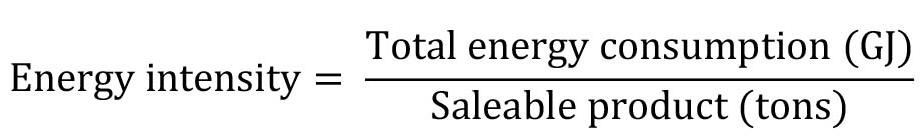
The performance of the six South African coal mines in achieving the NEES target of a 10% reduction in energy consumption was evaluated using the linear trend method adapted from the Department of Energy (2015, 2014). Changes in overall energy use and energy intensity were assessed from 2007, when most mines started reporting on energy performance. Energy efficiency trends at the case study mine were evaluated and the progress of the mine in achieving the NEES target assessed using 2005 as the baseline year, because energy consumption data for the operation was incomplete before 2005. A simple reduction in overall energy use (as per the NEES 10% energy demand reduction
target) is not a preferred method of incentivizing energy efficiency for economically productive activities like mining, as it is most easily achieved by lowering production. Several metrics for setting targets and evaluating changes in energy efficiency were tested.
i) Overall energy consumption from all energy carriers.
ii) Energy consumption as a function of production. A linear regression model was fitted to determine the relationship between energy consumption and saleable product during the baseline period of 2005-2007. Energy consumption was then calculated for 2008-2015 as a function of production using the linear relationship (the extrapolated baseline), and the 10% energy demand reduction target calculated as 10% less than the extrapolated energy consumption values. Expressing energy consumption/intensity as a function of production is the more common and preferred method used to present energy performance data (Australian Government, Department of Resources, Energy and Tourism, 2013; Castrillón-Mendoza, Rey-Hernández, Rey-Martínez, 2020; Lawrence et al., 2019; US Department of Energy, 2015).
iii) Energy intensity as a function of production. Similarly to energy intensity (calculated as per Equation [1]), as baseline dependence on production is established for 2005-2007. The extrapolated baseline is used to evaluate improvements/ deteriorations in energy intensity, and the NEES target is calculated as 10% less than the extrapolated baseline.
iv) Time series analysis. A time series analysis of monthly energy intensity from 2008-2015 (180 values) at the case study mine was conducted in order to account for the effects of seasonality and forecast future energy intensity (Adhikari and Agrawal, 2013; Strandberg, 2015). It is hypothesized that drops in production over the December/January period and year-end reporting may introduce seasonality into the energy intensity at the mine. Energy intensity was decomposed into trend, seasonal, and irregular components. The centred moving average method was used to smooth the data (Carlberg, 2015; Nadler and Kros, 2007). Various
periods, ranging between 5 months and 13 months, were tested to allow for the selection of a moving average period with the least mean square error when compared with the actual monthly energy intensity values. Seasonal and irregular factors in the mine’s energy intensity data were then calculated and the energy intensity data deseasonalized by dividing the actual monthly energy intensity by the seasonal factor. A trend line was fitted to the deseasonalized values using a single linear regression to identify the underlying long-term behaviour of the data, excluding calendar and irregular effects (Amponsah, Otoo, and Todoko, 2015). Lastly, energy intensity at the operation was forecast for 2020-2023 by superimposing the seasonal component back onto the trend.
The energy used by each process at the mine was calculated monthly from 2005 to 2019 to assess changes over time and identify energy-intensive processes. The energy intensity of each process was calculated as the total energy used by the process (GJ) divided by the coal tonnage handled by that process (run-ofmine for underground mining and coal handling, feed to plant for beneficiation, discard reclaimed, and waste product handled). Lastly, a Sankey diagram was used to display the breakdown of energy between various processes at the mine (Riehmann, Hanfler, and Froehlich, 2005; Wang et al., 2017).
Permission to conduct the study was granted by the mining operation management on condition that the company name is not revealed or used. Approval for the study was also received from the University of Johannesburg’s Faculty of Science Ethics Committee.
The average energy intensity of 16 South African coal mining operations (including the case study mine) in 2010 is first compared to provide context. Energy consumption and efficiency trends at six coal mines are then compared. Finally, energy efficiency trends and energy use by process and by carrier is assessed in detail at the underground coal mining operation in Mpumalanga.
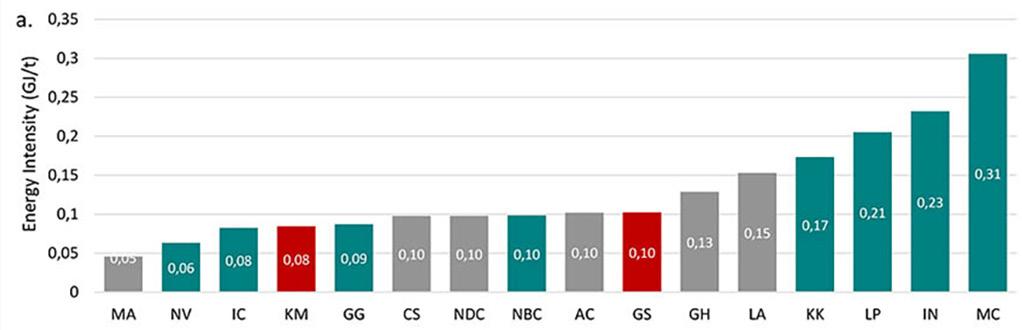
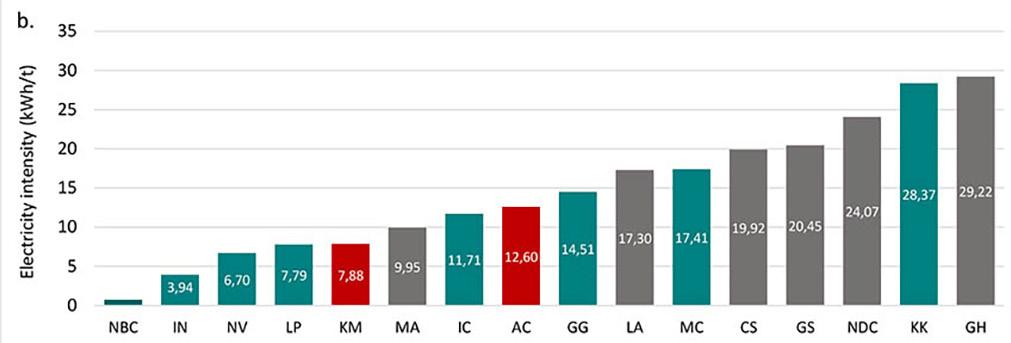
Energy intensity of South African coal mines
There is a large range of almost an order of magnitude in the energy intensity of South African coal mines (Figure 3a). Of the 16 mines considered here, the four mines with the highest energy intensity are all opencast mines. Both underground and opencast mines have achieved particularly low energy intensities. In Australia, too, opencast mines are generally more energy intensive than underground mines (Sterling, 2010). The case study mine occupies a median position in the distribution, with an energy intensity of 0.1 GJ/t. Generally, underground mines use more electricity than opencast mines (Figure 3b) since electricity is used to power the underground machinery. Opencast operations mainly use diesel to power the mobile equipment that extracts and transports the coal. The four mines using the least electricity in 2010 are all opencast coal mines. The case study mine utilized 19.92 kWh/t in 2010, making it the fifth most electricity-intensive operation of the 16 mines. Trends in overall energy consumption and energy intensity vary considerably between mines and at some mines there is no
clear trend. Two (almost three) of the six South African coal mines considered in Figure 4 achieved a 10% reduction in energy demand between 2007 and 2015, while only one (Inyanda) achieved a 10% reduction in energy intensity by 2015. The energy intensity at Inyanda was anomalously high in 2010, the first year of reporting. Thereafter, annual energy intensity was highly variable, and it is not clear that there is indeed a declining trend. Arnot achieved the energy consumption reduction target, using 32% less energy in 2015 than in 2007; however, energy intensity increased over the same period by 80%. Matla reduced energy consumption by 8% by 2015 but the energy intensity of the operation increased by 42%. Arnot and Matla achieved the energy demand reduction target due to a drop in production, and not through an improvement in energy efficiency. In general, trends in overall energy consumption are a poor reflection of trends in energy intensity. A drop in overall energy consumption may very well not reflect an improvement in energy intensity, as is seen in the case of Arnot and Matla. In the next section, trends in energy intensity at the case study mine are analysed in detail.
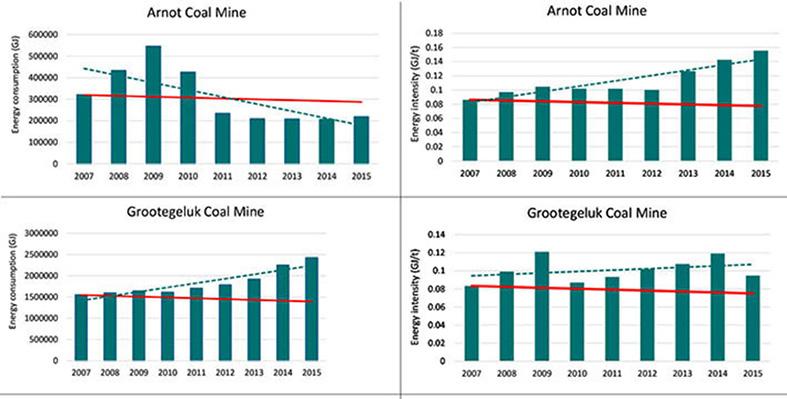
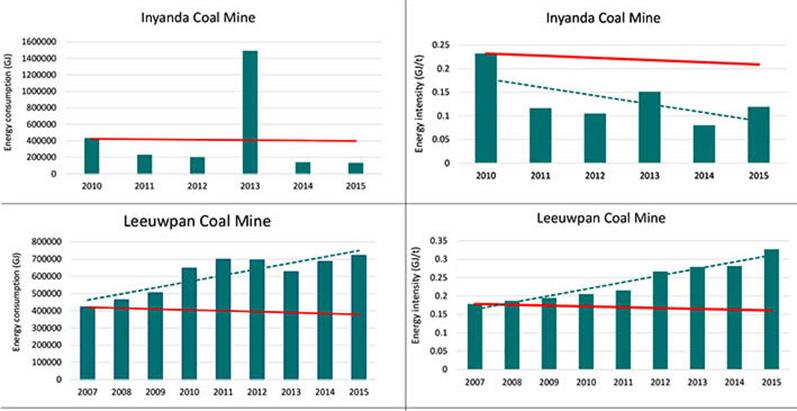
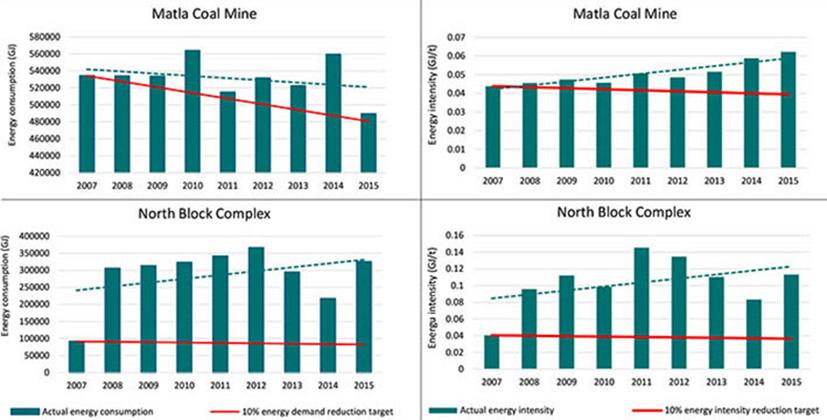
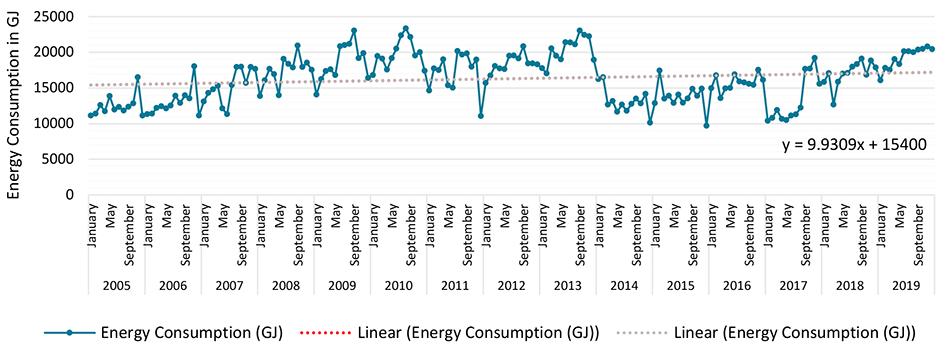
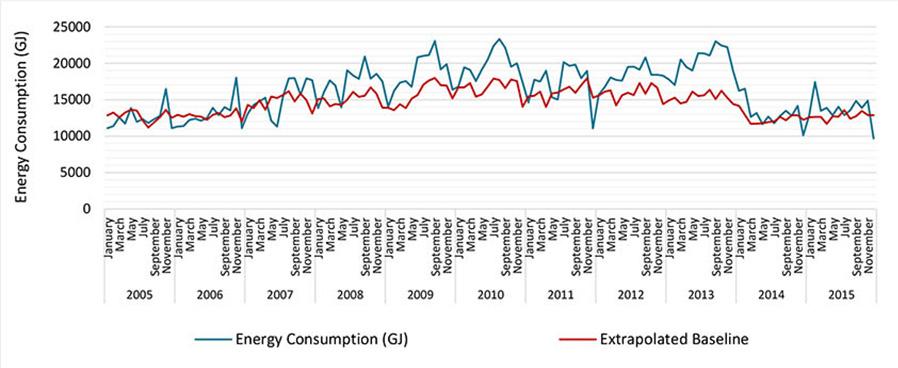
Energy intensity trends at an underground coal mine
Trends in energy intensity at the case study mine are assessed between 2005 and 2019 using four different metrics:
1. Total energy consumption
2. Total energy consumption relative to product
3. Energy intensity relative to product
4. Time series analysis of energy intensity.
Overall energy consumption
There was a gradual increasing trend in energy consumption of 9.9 GJ/month at the mining operation between 2005 and 2019 (Figure 5). The highest annual energy use at the mine was 244 253 GJ in 2013, and the lowest was 149 567 GJ in 2005. Monthly energy consumption consistently declines in December, with the lowest energy consumed in December 2015 (9 695 GJ). Energy consumption was particularly low at the end of 2011, 2014, and 2015 when some sections were put on hold due to poor mining conditions.
Considering only total energy consumption ignores the dependence of energy use on the volume of coal handled. Simple linear regression analysis of the dependence of total monthly energy consumption on final saleable product and ROM yields R² values of 0.2808 and 0.5862, respectively. The variance in monthly energy consumption is much better accounted for by ROM volumes than saleable product volumes. This is expected since underground mining uses the majority of the energy at the mining operation (Figure 10).
Energy consumption relative to a product-based baseline
The dependence of monthly energy consumption on saleable product (a readily available figure for most mines) is quantified with a linear regression for the baseline period 2005-2007:
Several years (in this case, three years) were used to define the baseline because of the fairly high monthly and annual variability in energy consumption. The difference between actual and projected energy consumption (Equation [2]) gives an indication of changes in energy consumption over time, taking the changes in production into account. The actual energy consumption of the mine exceeded the projected value by an average of 29% between 2008 and 2015, implying that the mine has become less energy efficient in its operations (Figure 6).
Energy intensity relative to a product-based baseline
Since a certain amount of the energy used at a mining operation is fixed and is independent of the amount of coal processed, it is expected that energy intensity will drop as production increases. Energy intensity is thus dependent on production too. On average, actual monthly energy intensity at the mine exceeded the projected energy intensity based on the 2005-2007 baseline by 26% between 2008 and 2015 (Figure 7). Actual energy intensity aligns better with the baseline values in 2014 and 2015 (only 9% higher), indicating some improvement in relation to baseline performance for this period. The percentage difference between actual and projected monthly energy intensity averages 35% for 2008-2013.
Energy intensity time series analysis
The monthly energy intensity for the study mine was found to be best approximated by a 12-point centred moving average. The straight-line trendline fitted to the deseasonalized monthly energy intensity values shows an increasing trend in energy intensity of 0.25 MJ/t per month (Figure 8):
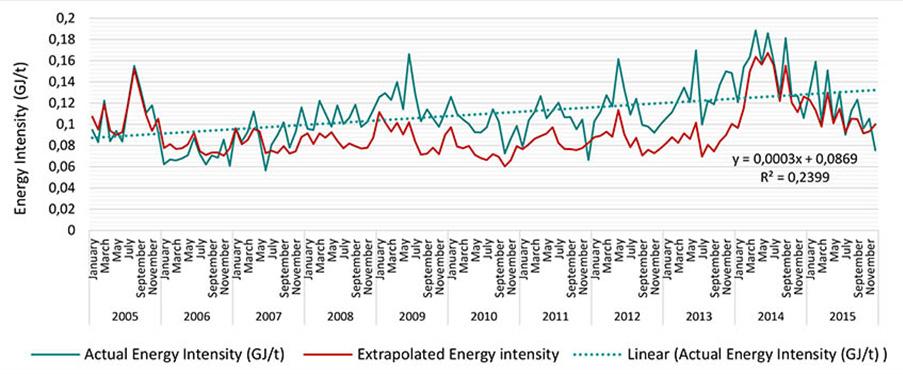
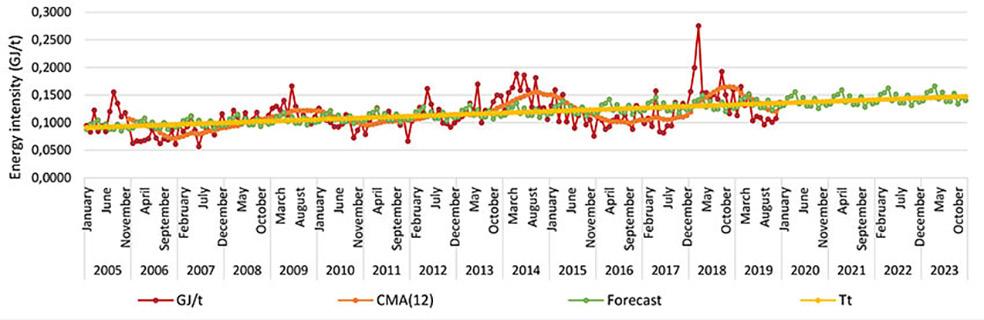
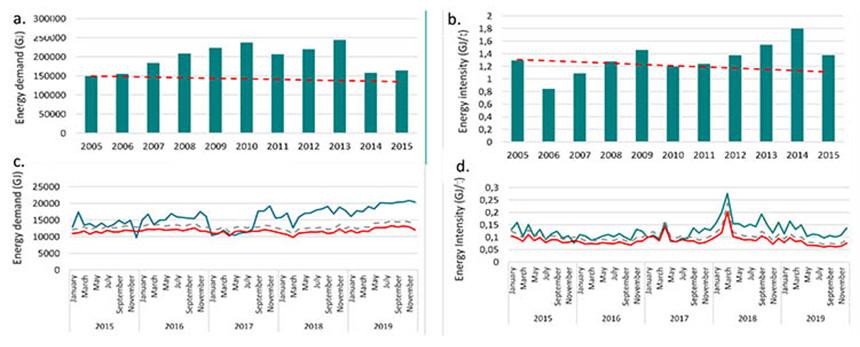
Figure 9—(a) Annual energy demand against the 10% energy demand reduction trend between 2005 and 2015 when 2005 is used as a baseline; (b) annual energy intensity against the 10% energy demand reduction trend between 2005 and 2015 when 2005 is used as a baseline; (c) monthly energy demand at the mining operation against projected monthly energy demand, calculated using the relationship between energy demand and coal produced in 2005-2007; (d) monthly energy intensity at the mining operation against the projected energy intensity (2005-2007 used as baseline) and a 10% energy intensity reduction target illustrated from 2015 to 2019 to determine whether the target is achieved after 2015. Actual energy demand/intensity is shown in teal and the 10% reduction energy demand/intensity target is shown in red
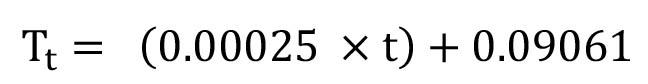
where Tt is the energy intensity in month t (where January 2005 is t = 1).
The time series analysis obviously forecasts a continuing increase in energy intensity at the mine in future, calculated as the seasonal variations superimposed on the trend component. There is not a significant seasonal variation in monthly energy intensity, with the monthly seasonal factors ranging between 0.91 in October and 1.14 in April.
While energy efficiency metrics incorporating the dependence of energy use on production are preferred, all four metrics
considered here show a decline in energy efficiency with time at the case study mine. The metrics are now used to evaluate the mine’s performance against the 10% energy efficiency improvement target between 2005 and 2015.
Achievement of the National Energy Efficiency Strategy energy efficiency target
Several metrics of a 10% improvement in energy efficiency are evaluated in this section:
1. A 10% reduction in energy consumption (referred to as demand in the NEES) by 2015 relative to 2005
2. A 10% reduction energy intensity by 2015 relative to 2005 3. and 4. 10% lower energy consumption and energy intensity projected on the basis of final product according to the linear relationship (with y-intercept) established for the baseline period between 2005 and 2007.
The mine’s annual energy demand exceeded the 10% reduction target by 22% in 2015 (Figure 9a), and annual energy intensity exceeded the target by 19% (Figure 9b). Similarly, when the 10% reduction target is set relative to the product-based 2005-2007 baseline, energy demand exceeds the target by 20% (Figure 9c), and energy intensity by 18% in 2015 (Figure 9d). The discrepancy between actual energy use/intensity and the baseline increaseed in 2018 and 2019 (Figure 9c and Figure 9d).
It has been ascertained that both the energy consumption and the energy intensity at the case study mine are increasing over time, despite the prompting of the NEES to reduce energy intensity. The reasons for the increase are now probed by assessing which processes are responsible for the increase in energy intensity and what energy source(s) are used.
Energy consumption by process
The underground mining process is the most significant energy user at the mine, followed by the beneficiation process (Figure 10). Before the start of the discard reclaiming process, 60% of the mine’s total energy use was for coal extraction underground and 29% for beneficiation (Figure 10a). The coal handling and waste product handling processes use the least energy, with a 6% and 5% contribution to the overall energy use between 2005 and 2014 respectively. The introduction of the discard reclaiming process, utilizing 7% of the overall energy at the mine, resulted in the underground process using a lower proportion of energy (54%) and
the beneficiation process still making the same contribution (29%) to overall energy consumption (Figure 10b).
Discard reclaiming displays the greatest increase in energy intensity over time, with energy intensity significantly higher in 2018 and 2019 than from 2015-2017 (Figure 11). Energy used per ton of coal washed at the beneficiation plant also increases significantly over time. Discard reclaiming and beneficiation are the main processes accounting for the increased energy intensity at the mine over time. Although the underground mining process uses the highest amount of energy and has the highest energy intensity of all the processes, the average energy intensity over the years has remained fairly consistent. Waste handling displays a decreasing trend in energy intensity between 2005 and 2019.
The underground mining process is mainly dependent on energy sourced from electricity (75% of total energy use underground, Figure 12). Electricity powers the mining machinery, ventilation systems, pumping infrastructure, and coal conveyors underground. Diesel use contributes 20% to total underground energy use, and oil used for maintenance, 5%. A simple linear regression analysis conducted on monthly energy consumed and coal mined underground between 2005 and 2019 shows that there is a relatively high fixed energy consumption per month of 4 407 GJ for the underground mining process. Each additional ton of coal extracted requires an additional 21 GJ. The R² value for the linear regression is 0.5519, meaning that 55% of the variance in energy use is explained by the amount of coal extracted.
The beneficiation plant sources 98% of its energy from electricity and the other 2% from diesel used for transportation
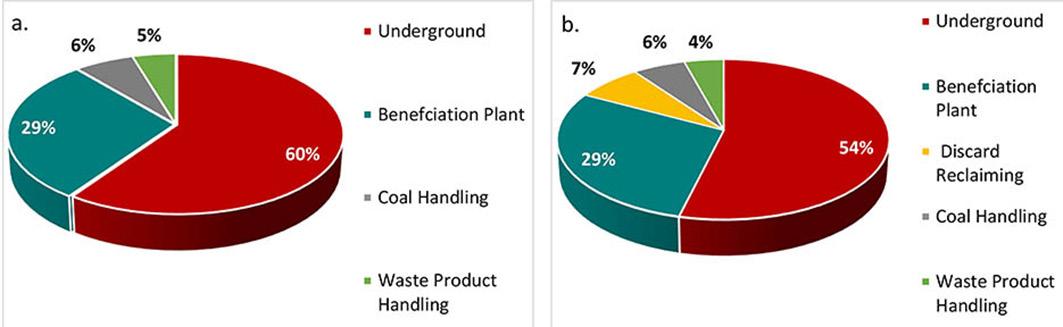
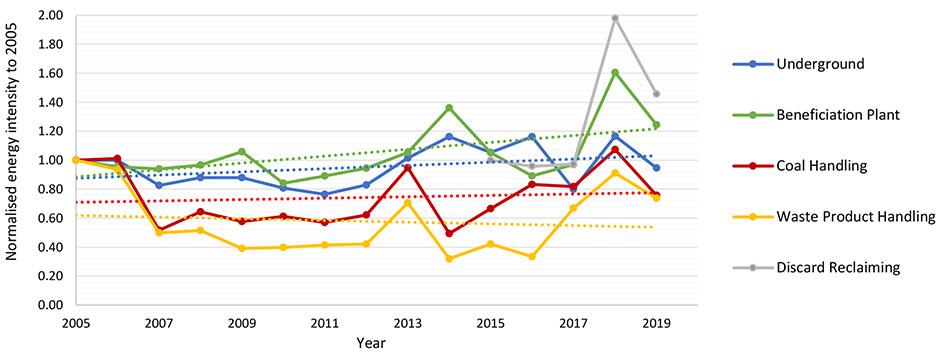
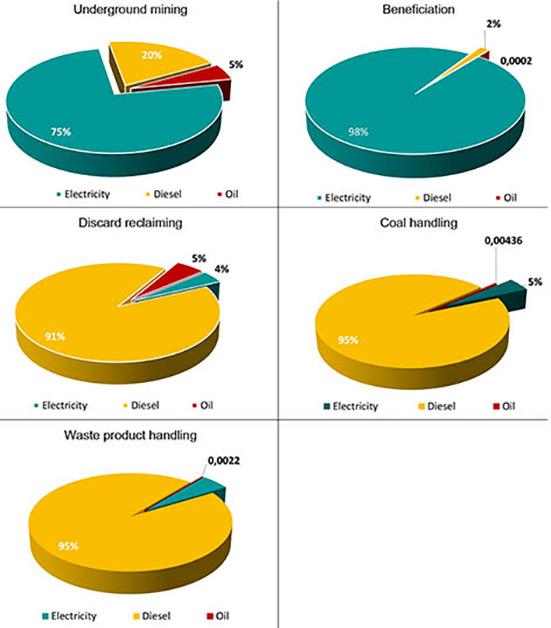
to and from the plant (Figure 12). In the reclaiming process, an excavator is used to load discard material onto tipper trucks. The trucks transport the discard to ROM stockpiles and water bowsers suppress the dust on the haul roads on which the trucks travel. The highest energy use in this process is through diesel used by all the machines involved in reclaiming (Figure 12). Energy use in the coal handling process is 95% from diesel used for machines handling the coal, 5% from electricity for lighting the work area, and 0.004% from oil for machine maintenance. In the waste product handling process, tipper trucks, powered by diesel, load the discard at the conveyor chute. The trucks transport waste coal to a discard dump for disposal. As in the discard reclaiming process, water bowsers are used for dust suppression on the roads. The significant reliance on machinery in this process leads to a high diesel dependence, totalling 95% of the overall energy use. Electricity for lighting the work area provides 5% of the total energy used, and a small amount of oil (0.002% of total energy used) is for maintenance of the machines.
To sum up, the energy flow through the different processes at the mine is visualized a using Sankey diagram (Figure 13). In 2019, after discard reclaiming had commenced, coal extracted underground totalled 3 004 740 t and 1 046 010 t were reclaimed from the old discard dumps. The underground coal and reclaimed discard were stockpiled together on ROM stockpiles for beneficiation. Of the 4 050 750 t that were stockpiled, only 2 970 120 t (73%) was processed through the plant. Of the coal processed through the beneficiation plant, 1 999 500 t (67%) was saleable product, and 970 622 t (33%) was waste.
Electricity was the most significant energy source at the mine in 2019, supplying 74% of the overall energy used, followed by diesel,
contributing 23% and oil, a low 3% (Figure 13). Ventilation fans used 43% of the electricity supplied to the underground workings and mining machinery utilized 32 182 GJ (32%). Pumping water to mining areas and for dust suppression contributed 17% to the mine’s underground electricity use, and coal conveyance contributed a low 8%. Owing to the distances involved, employees are transported in light duty vehicles (LDVs) from the surface to the mining sections, which consumes 13 033 GJ (11% of the energy used by the underground operation).
The balance of evidence suggests that the NEES has not been effective at improving energy efficiency at South African coal mines. Energy intensity increased between 2007 and 2015 at six of the seven coal mining operations considered in this study. At the case study mine, energy efficiency measured using all the metrics considered in this study was around 20% worse than the 10% improvement target in 2015. This is expected as a mining operation usually becomes more energy-intensive over time as less accessible ore is extracted and machinery ages, and no energy efficiency measures have been implemented that could reduce overall energy demand at the mine. The case study mine appears to be fairly typical of a South African mine – the mining sector overall showed a slight increase in energy intensity (defined as energy consumed per unit value added) between 2004 and 2012 (Department of Energy, 2015).
There are a number of factors contributing to the decline in energy efficiency in the mining industry after the establishment
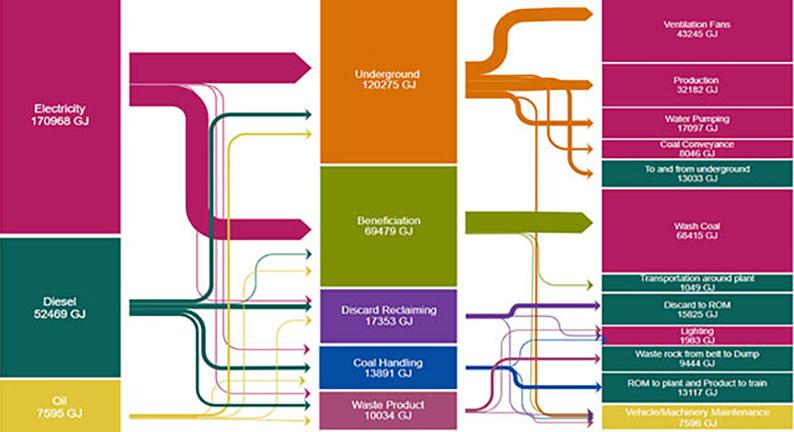
of the NEES. Firstly, the strategy lacks mandatory measures and enforcement capability (Rosenberg and Winkler, 2011). The energy efficiency targets are voluntary. There are no penalties for not partaking in the agreements or for failure in achieving them (Covary and Averesch, 2013). Secondly, there is no clear method for determiningn energy efficiency indicated in the strategy. Thirdly, energy efficiency projects are to be self-funded. There are no incentives or support from government for companies to implement initiatives. And lastly, the strategy details the intention to establish regulations for the management, measurement, and reporting of energy efficiency based on the Energy Act of 2008 (Covary and Averesch, 2013). Yet, 15 years after its establishment, no measures have been put in place to address this (Covary and Averesch, 2013; Rosenberg and Winkler, 2011; Sebitosi, 2008). In order to maximize the energy efficiency potential in South Africa, government needs to be more proactive in the measures documented in the NEES, focus on the enforcement of the strategy by establishing supportive legislation, and develop a platform similar to the Top Runner programme in Japan (Sebitosi, 2008) where organizations can partake in discussions, share best practices, and be informed about resources available to them for implementing energy efficiency measures or initiatives.
A survey of successful energy efficiency interventions around the world shows that accurate monitoring and reporting on energy intensity and energy savings is the foundation for energy efficiency improvements (Awuah-Offei, 2016; du Plessis, 2015; Imasiku and Thomas, 2020; Katta, Davis, and Kumar, 2020; Levesque, Millar, and Paraszczak, 2014; Sterling, 2010). Data is needed on subsectorial processes to allow for the identification of high energy use areas, sources of variation, and energy saving opportunities. The International Energy Association (IEA) recommends that the ISO 50001 energy management standard be implemented at large energy-intensive industries (du Plessis, 2015; Levesque, 2015). This recommendation is also included in South Africa’s draft Post-2015 National Energy Efficiency Strategy (Department of Energy, 2016). For a developing country, the measures that have been implemented in India to improve energy efficiency are impressive. The National Mission for Enhanced Energy Efficiency established the Perform, Achieve and Trade framework that is aimed at improving the cost-effectiveness of advancements in energy efficiency in energy-intensive industries by setting individual targets for industries to reduce their specific energy consumption (Bhattacharya and Cropper, 2010; PricewaterhouseCoopers, 2020; Sahoo et al., 2016). Industries that achieve set targets over three years through the implementation of best practices are issued with Energy Saving Certificates (ESCerts), and industries that fail to
meet targets are charged penalties or they can purchase ESCerts from companies that exceed targets (PricewaterhouseCoopers, 2020). The success of coal mining operations in India in improving energy efficiency may be attributed to the inclusion of incentives for the achievement of energy savings and penalties charged for failure to meet set targets. Best practices are shared within industries and implementation is almost mandatory. Similar measures could be considered for South Africa.
Energy use by mining process and energy carrier
The analysis of process energy flow and consumption at the case study mine shows that out of the five energy use processes identified, underground mining is the highest energy consumer (Figure 10) and the most energy intensive (Figure 11). This observation is supported by Bogunovic et al. (2009), who also note that coal extraction and beneficiation are the processes that use the most energy in mining operations. Electricity is the primary source of energy for underground operations at the mine (Figure 12), accounting for an average of 75% of total energy use (diesel accounts for 20%, and oil 5% .of the overall annual energy consumption). Similarly, McGinley et al. (2015) report a significant proportion of energy is provided by electricity in underground mining, and Efremenko, Belyaevsky, and Skrebneva (2017) indicate that in most underground coal mines, electricity consumption accounts for more than 50% of the overall energy use, mainly for ventilation, powering mining machinery, and conveying coal. Much more of the monthly variance in energy consumption at the mine is accounted for by ROM (R2 = 0.5865) than by the amount of final product (R2 = 0.2808). Tshisekedo (2008) and Inglesi-Lotz and Blignaut (2011) similarly found that the quantity of coal that is extracted, transported, processed, and disposed is a major factor impacting energy consumption.
As underground mining is the highest energy consumer and most energy-intensive, stringent efforts should be made to identify and implement energy efficiency measures at the case study mine. A number of studies have focused on measures to reduce energy consumption within the underground mining process. At Velenje coal mine, an underground lignite mine in Slovenia, electricity usage was reduced by 7% between 2008 and 2010 by replacing regular lamps with energy saving lights and modifying the ventilation settings underground when employees were not working (Medved et al., 2012). Du Plessis, Marx, and Nell (2014) document an annual energy saving of 10 400 MWh at a coal mining operation by modifying the ventilation and refrigeration systems. These are examples of some initiatives that the case study mine could investigate.
The beneficiation process consumes an average of 32% of the overall energy used at the study mine, with energy intensity falling just below that of the underground process. The beneficiation plant is one of the largest contributors to the increase in energy efficiency over time. The coal beneficiation process is powered almost entirely by electricity (98%) (Figure 12). According to Zhang (2016), a large number of South African coal washing plants were built at a time when there was an electricity surplus, and the overall design was based on reducing capital expenditure and operational malfunctions instead of energy efficiency. The beneficiation plant at the case study mine was constructed in 1996, when energy efficiency was not a priority. There are ways to improve the energy efficiency of beneficiation plants, regardless of when they were constructed. Some crushing machinery is more than 50% more efficient than other types (Jeswiet and Szekeres, 2016), and the installation of a variable frequency drive (VFD) on the main dryer exhaust fan motor to regulate and vary the rotational speed improves energy efficiency (Durocher and Putnam, 2013).
The reclaiming of discard commenced in 2015, consuming an average of 7% of the overall energy at the mine annually (Figure 10), of which 91% is provided by diesel (Figure 12). Discard reclaiming is the third most energy-intensive process at the mine and is becoming more energy-intensive with time. Eleven machines are used for reclaiming, with year models ranging from 2008 to 2011. The age of the trucks may be contributing to the high energy intensity of the reclaiming process. The energy efficiency of loading and hauling depends on the age and capacity of machinery used, on-site operating conditions, and operator practices (Awuah-Offei, 2016; Soofastaei et al., 2018). Dry and hard compacted roads keep the costs of fuel low and wear and tear at a minimum (Crittenden, 2016). Wet conditions increase the rolling resistance of a vehicle, increasing the amount of diesel consumed. The case study mine conducts regular dust suppression on its roads using water, which may lead to increased diesel consumption. The reduction of dust suppression on the haul roads, or perhaps using chemical dust suppressants, may be initiatives the mine could investigate.
The evidence presented in this study, although incomplete, suggests that the NEES has not resulted in an improvement in energy efficiency in South African coal mining operations. The 2008 revision of the NEES sets a target of a 10% reduction in energy consumption by the mining sector by 2015, relative to an adjustable baseline. Energy intensity on the basis of value-added for the mining sector as a whole slightly increased between 2004 and 2012 (Department of Energy, 2015). The energy intensity (on the basis of saleable product) of five out of six coal mining operations surveyed in this study increased between 2007 and 2015. Energy consumption is not a desirable metric for energy efficiency in the coal mining sector since energy consumption trends are a poor reflection of energy intensity trends and energy consumption is most easily reduced through a drop in production, which is detrimental to South Africa’s economic growth aspirations.
Using an underground coal mine in Mpumalanga as a case study, three additional metrics for energy efficiency were evaluated: energy intensity, defined on the basis of saleable product (GJ/t), changes in energy consumption, and energy intensity relative to a baseline established on the basis of saleable product over three years. The case study mine showed a decline in energy efficiency between 2005 and 2015 according to all metrics, and energy demand and intensity were around 20% higher than the 10% reduction target by 2015. This is to be expected given the ageing machinery, the fact that the more accessible coal is extracted
case study at a coal mine in
first, and that no targeted energy efficiency interventions were implemented.
The underground mining process is the highest energyconsuming process at the case study mine, and makes used of the most energy per ton of coal mined; however, no significant change in energy intensity is observed over time. Electricity provides the majority of the energy used at the mine, mainly supplying the underground and beneficiation processes. Diesel provides most of the balance, mostly used for the transportation of employees underground and the operation of mobile machines and equipment involved in the coal handling, waste product handling, and discard reclaiming. The underground ventilation fans and production machines utilize the greatest amount of electricity (and energy) at the mine after the beneficiation plant. The beneficiation and discard reclaiming processes are the main contributors to the increased energy intensity over time.
It is recommended that
➤ At least three years be used as the baseline period against which progress in energy efficiency is assessed. For individual operations, it is not advisable to assess progress relative to a single baseline year because annual variability in energy consumption/intensity is high.
➤ Energy intensity on the basis of product is a suitable metric for energy efficiency, but not overall energy consumption.
➤ Different operations cannot be compared in their entireties on the basis of energy intensity. The energy intensities of different mines vary by almost an order of magnitude because of differences in scale of the operation, extraction method, types of energy carriers used, age of mine etc. It is better to compare energy intensities of individual processes.
Acknowledgements
The case study mine provided the data. The mine personnel are thanked for helpful discussions.
Author contributions
Cebisile Majola collated and analysed the data and compiled the first draft of the manuscript. Kristy Langerman supervised the study and revised the manuscript.
References
Adhikari, R. and Agrawal, R.K. 2013. An introductory study on time series modeling and forecasting. ArXiv abs/1302.6613
Amponsah, S.K., Otoo, D., and Todoko, C.A.K. 2015. Time series analysis of water consumption in the Hohoe municipality of the Volta region, Ghana. International Journal of Advanced Multidisciplinary Research, vol. 4. p. 393. https://doi.org/10.14419/ijamr.v4i2.3629
Australian Government Department of Resources, Energy and Tourism 2013. Energy savings measurement guide: How to estimate, measure, evaluate and track energy efficiency. Version 2.0. Commonwealth of Australia, Barton ACT. Awuah-Offei, K. 2016. Energy efficiency in mining: A review with emphasis on the role of operators in loading and hauling operations. Journal of Cleaner Production, vol. 117. pp. 89–97. https://doi.org/10.1016/j.jclepro.2016.01.035
Bhattacharya, S. and Cropper, M.L. 2010. Options for energy efficiency in India and barriers to their adoption: A scoping study. SSRN Journal. https://doi. org/10.2139/ssrn.1590510
Bogunovic, D., Kecojevic, V., Lund, V., Heger, M., and Mongeon, P. 2009. Analysis of energy consumption in surface coal mining. Transactions of the Society for Mining, Metallurgy and Exploration, vol. 326. pp. 79–87.
BP. 2021. Statistical Review of World Energy 2021. London.
Carlberg, C. 2015. More predictive analytics: Microsoft Excel. Pearson Education, London.
Castrillón-Mendoza, R., Rey-Hernández, J.M., and Rey-Martínez, F.J. 2020. Industrial decarbonization by a new energy-baseline methodology. Case study. Sustainability, vol. 12, no. 5. 1960. https://doi.org/10.3390/su12051960
Covary, T. and Averesch, U. 2013. Overview and assessment of the energy efficiency and energy conservation policies and initiatives of the Republic of South Africa. ECEEE Summer Study Proceedings. pp. 591–600.
Crittenden, P. 2016. Energy management in mining: Leading practice sustainable development program for the mining industry. Department of Industry, Science and Resources, Canberra, Australia. www.industry.gov.au/sites/default/ files/2019-04/lpsdp-energy-management-in-mining-handbook-english.pdf
Department of Energy. 2021. Commodity flow and energy balance 2018. Pretoria. Department of Energy. 2018. Draft Integrated Resource Plan 2018. Pretoria. Department of Energy. 2016. Draft Post-2015 National Energy Efficiency Strategy. Pretoria.
Department of Energy. 2015. South Africa’s energy efficiency targets: Second annual monitoring report. Pretoria.
Department of Energy. 2014. South Africa’s energy efficiency targets: First annual monitoring report. Pretoria.
Department of Minerals and Energy. 2009. National Energy Efficiency Strategy of the Republic of South Africa: First review October 2008. Pretoria.
Department of Minerals and Energy. 2005. Energy Efficiency Strategy of the Republic of South Africa. Pretoria.
Du Plessis, J.J.L., Marx, W.M., and Nell, C. 2014. Efficient use of energy in the ventilation and cooling of mines. Journal of the Southern African Institute of Mining and Metallurgy, vol. 114. pp. 1033–1037.
Du Plessis, W. 2015. Energy efficiency and the law: A multidisciplinary approach. South African Journal of Science, vol. 111. pp. 1–8. https://doi.org/10.17159/ sajs.2015/20130302
Durocher, D.B. and Putnam, R. 2013. Mining industry process upgrades to reduce energy intensity while improving end product quality. Procedings of the 2013 Workshop on Power Electronics and Power Quality Applications. IEEE, New York. p. 7.
Eckelman, M.J. 2010. Facility-level energy and greenhouse gas life-cycle assessment of the global nickel industry. Resources, Conservation and Recycling, vol. 54. pp. 256–266. https://doi.org/10.1016/j.resconrec.2009.08.008
Efremenko, V., Belyaevsky, R., and Skrebneva, E. 2017. The Increase of Power Efficiency of Underground Coal Mining by the Forecasting of Electric Power Consumption. E3S Web of Conferences. Proceedings of the Second International Innovative Mining Symposium. Tyulenev, M., Zhironkin, S., Khoreshok, A., Vöth, S., Cehlár, M., and Nuray, D. (eds.) p. 02002. https://doi.org/10.1051/ e3sconf/20172102002
Exxaro Resources Limited. 2016. 2015 integrated report. Pretoria West.
Exxaro Resources Limited. 2015. 2014 integrated report. Pretoria West.
Exxaro Resources Limited. 2014. 2013 integrated report. Pretoria West.
Exxaro Resources Limited. 2013. Integrated report 2012. Pretoria West.
Exxaro Resources Limited. 2012. Integrated annual report 2011. Pretoria West.
Exxaro Resources Limited. 2011a. Integrated annual report for the year ended 31 December 2010. Open-File Report. Pretoria West. Pretoria West.
Exxaro Resources Limited. 2011b. Integrated annual report for the year ended 31 December 2010. Pretoria West.
Exxaro Resources Limited. 2010. Annual report for the year ended 31 December 2009. Pretoria West.
Exxaro Resources Limited. 2009. Annual report 2008. Pretoria West. Exxaro Resources Limited. 2008. Annual report 2007. Pretoria West. Harmony Gold Mining Company Limited. 2105. Integrated Annual Report 2015. Randfontein, South Africa.
Imasiku, K. and Thomas, V.M. 2020. The mining and technology industries as catalysts for sustainable energy development. Sustainability, vol. 12. https://doi.org/10.3390/su122410410
Inglesi-Lotz, R. and Blignaut, J.N. 2011. South Africa’s electricity consumption: A sectoral decomposition analysis. Applied Energy, vol. 88. pp. 4779–4784. https://doi.org/10.1016/j.apenergy.2011.06.018
International Energy Agency. 2014. Capturing the Multiple Benefits of Energy Efficiency: Roundtable on Industrial Productivity and Competitiveness. Paris. Jeswiet, J. and Szekeres, A. 2016. Energy consumption in mining comminution. Procedia CIRP, vol. 48. pp. 140–145. https://doi.org/10.1016/j. procir.2016.03.250
Katta, A.K., Davis, M., and Kumar, A. 2020. Development of disaggregated energy use and greenhouse gas emission footprints in Canada’s iron, gold, and potash mining sectors. Resources, Conservation and Recycling, vol. 152. 104485. https://doi.org/10.1016/j.resconrec.2019.104485
Lawrence, A., Thollander, P., Andrei, M., and Karlsson, M. 2019. Specific energy consumption/use (SEC) in energy management for improving energy efficiency in industry: Meaning, usage and differences. Energies, vol. 12. https://doi.org/10.3390/en12020247
Levesque, M. 2015. An improved energy management methodology for the mining industry. PhD thesis,_Laurentian University, Sudbury, Ontario.
study at a coal mine in
Levesque, M., Millar, D., and Paraszczak, J. 2014. Energy and mining – the home truths. Journal of Cleaner Production, vol. 84. pp. 233–255. https://doi.org/10.1016/j.jclepro.2013.12.088
McGinley, K., Geary, P., and Dodenhoff, J. 2015. Striking gold: How innovations and productivity improvements in the mining industry leverage energy efficiency technologies. Proceedings of the 2015 ACEEE Summer Study on Energy Efficiency in Industry. American Council for an Energy Efficient Economy, pp. 6-1-6-10. https://www.aceee.org/files/proceedings/2015/data/papers/6-210.pdf
Medved, M., Ristovic, I., Roser, J., and Vulic, M. 2012. An overview of two years of continuous energy optimization at the Velenje Coal Mine. Energies, vol. 5. https://doi.org/10.3390/en5062017
Mogodi, P. 2012. Analysis of energy consumption, economics and management at New Denmark Colliery. MSc thesis, University of the Witwatersrand, Johannesburg.
Msimanga, B. 2015. Exploring the impacts of renewable energy and energy efficiency policies on the mining sector. MCom thesis, Stellenbosch University, Stellenbosch.
Nadler, S. and Kros, J. 2007. Forecasting with Excel: Suggestions for managers. Spreadsheets in Education, vol. 2, no. 2. https://sie.scholasticahq.com/ article/4545-forecasting-with-excel-suggestions-for-managers
Pretorius, C.B. 2016. Development of a demand and response programme for the coal mining industry. MSc Eng thesis, Stellenbosch University, Stellenbosch. PricewaterhouseCoopers. 2020. Impact of energy efficiency measures for the year 2018-19. Bureau of Energy Efficiency Ministry of Power, Government of India, New Delhi.
Riehmann, P., Hanfler, M., and Froehlich, B. 2005. Interactive Sankey diagrams. Proceedings of the IEEE Symposium on Information Visualization, 2005. INFOVIS 2005. pp. 233–240. https://doi.org/10.1109/INFVIS.2005.1532152
Rosenberg, S.A. and Winkler, H. 2011. Policy review and analysis: Energy efficiency strategy for the Republic of South Africa. Journal of Energy in Southern Africa, vol. 22. pp. 67–79. https://doi.org/10.17159/2413-3051/2011/ v22i4a3230
Ryan, G. 2014. Energy management by platinum companies in South Africa: Exploring mitigation strategies for reducing the impact of electricity price increases. Proceedings of the 6th International Platinum Conference, ‘Platinum – Metal for the Future’. Southern African Institute of Mining and Metallurgy, Johannesburg. pp. 299–308.
Sahoo, S.K., Varma, P., Lall, K.P., and Talwar, C.K. 2016. Energy efficiency in India: Achievements, challenges and legality. Energy Policy, vol. 88. pp. 495–503. https://doi.org/10.1016/j.enpol.2015.10.049
Sebitosi, A.B. 2008. Energy efficiency, security of supply and the environment in South Africa: Moving beyond the strategy documents. Energy, vol. 33. pp. 1591–1596. https://doi.org/10.1016/j.energy.2008.08.003
Semelane, S., Nwulu, N., Kambule, N., and Tazvinga, H. 2021. Evaluating available solar photovoltaic business opportunities in coal phase-out regions –An energy transition case of Steve Tshwete local municipality in South Africa. Energy Policy, vol. 155. 112333. https://doi.org/10.1016/j.enpol.2021.112333
Soofastaei, A., Karimpour, E., Knights, P., and Kizil, M., 2018. Energy-efficient loading and hauling operations. Energy Efficiency in the Minerals Industry, Green Energy and Technology. Springer, Cham. pp. 121–146.
Sterling, D. 2010. Identifying opportunities to reduce the consumption of energy across mining and processing plants. Proceedings of the 21st World Energy Congress, Montreal. www.instrumentation.co.za/papers/C13070.pdf?a
Strandberg, R. 2015. Using time series analysis to forecast daily municipal water demand. Batchelor's thesis, Stockholm University, Stockholm. file:///C:/Users/ AntonyCowey/Downloads/2015_24_report.pdf
Tshisekedi, J.R.N. 2008. Energy consumption standards and costs in South African gold and platinum mines. MEng thesis, University of the Witwatersrand, Johannesburg.
US Department of Energy. 2015. Energy Intensity Baselining and Tracking Guidance. https://www.energy.gov/sites/prod/files/2015/02/f20/Energy%20 Intensity%20Baselining%20and%20Tracking%20Guidance.pdf
Wang, F., Wang, P., Xu, X., Dong, L., Xue, H., Fu, S., and Ji, Y. 2017. Tracing China’s energy flow and carbon dioxide flow based on Sankey diagrams. Energy, Ecology and Environment, vol. 2. pp. 317–328. https://doi.org/10.1007/s40974017-0070-y
Wang, N. 2018. Developing a more comprehensive energy efficiency index for coal production: Indicators, methods and case study. Energy, vol. 162. 944-952.
Winkler, H., Tyler, E., Keen, S., and Marquard, A. 2021. Just transition transaction in South Africa: an innovative way to finance accelerated phase out of coal and fund social justice. Journal of Sustainable Finance & Investment, vol.13, no.3. pp.1228–1251. https://doi.org/10.1080/20430795.2021.1972678
Zhang, L. 2016. On the energy and separation efficiency of dense medium cyclone coal beneficiation processes. PhD thesis, University of Pretoria, Pretoria. u
Affiliation:
1Hacettepe University, Mining Engineering Department, Ankara, Turkey.
2Selcuk University, Geological Engineering Department, Konya, Turkey.
Correspondence to:
S. Kahraman
Email: sairkahraman@yahoo.com
Dates:
Received: 22 Nov. 2020
Revised: 5 Mar. 2021
Accepted: 21 Aug. 2023
Published: September 2023
How to cite:
Kahraman, S. and Ince. I. 2023
The needle penetration index for estimating the physico-mechanical properties of pyroclastic rocks.
Journal of the Southern African Institute of Mining and Metallurgy, vol. 123, no. 9. pp. 463–470
DOI ID:
http://dx.doi.org/10.17159/24119717/1433/2023
ORCID:
S. Kahraman
http://orcid.org/0000-0001-7903-143X
I. Ince
http://orcid.org/0000-0002-6692-7584
by S. Kahraman1 and I. Ince2
Synopsis
Preparation of suitable core specimens for physico-mechanical testing s not always possible, particularly for soft and clay-bearing rocks. Although several indirect test methods have been proposed to predict the properties of rocks, specimen preparation from soft rocks for some indirect tests is still difficult. For such cases, the needle penetration test has been developed. In this paper we present a study on the predictability of the physico-mechanical properties of pyroclastic rocks from the needle penetration index (NPI). The NPI, uniaxial compressive strength (UCS), Brazilian tensile strength (BTS), density, and porosity tests were performed in the laboratory on specimens from ten different locations in Turkey. Correlations were established between the NPI values and the physico-mechanical properties. Strong correlations were observed between NPI and both UCS and BTS. General correlations were found between NPI and both density and porosity.
Keywords needle penetration index, rock properties, pyroclastic rocks.
The physico-mechanical properties of rocks are widely used by rock engineers in their designs for rock masses. However, direct measurement of these requires generally smooth-cut core samples, and the testing process is tedious and time-consuming (Cargill and Shakoor, 1990; Kahraman, Fener, and Kozman, 2012, Su and Momayez, 2017). For example, the uniaxial compressive strength (UCS), tensile strength, and elastic modulus tests are carried out on well-prepared core samples. Some simple indirect test methods such as the point load test (Broch and Franklin, 1972) and block punch index test (Ulusay and Gokceoglu, 1998) have been developed to estimate rock properties. However, specimen preparation from soft and clay-bearing rocks is still difficult for these indirect tests. In order to close this gap, the needle penetration test — a practical and non-destructive index test — was developed (JSCE-RMC, 1980). The needle penetrometer used in this study was developed by MARUTO Co. in Japan. It is a lightweight portable device with a weight of about 700 g (Figure 1). As shown in Figure 2, the needle is a hardened steel rod, 0.84 mm in diameter, terminated by a conical tip (Ulusay et al., 2014).
The needle penetration test was originally developed for easily predicting the UCS of soft rocks. No special sample preparation is necessary for the test. For this reason, in addition to laboratory testing, it can also be applied easily in the field on a rock block, tunnel face, or rock slope (Ulusay et al., 2014). The test has been used for predicting the properties of soft rocks. Although some correlations have been established between the physico-mechanical properties of soft rocks and the needle penetration index (NPI), the data points are scattered in the correlation plots. Aydan (2012) stated that the conversion factor for the UCS-NPI relationship should be evaluated for each rock group separately to improve correlations. The aim of this study is to investigate the predictability of the physico-mechanical properties of pyroclastic rocks from their NPI values.
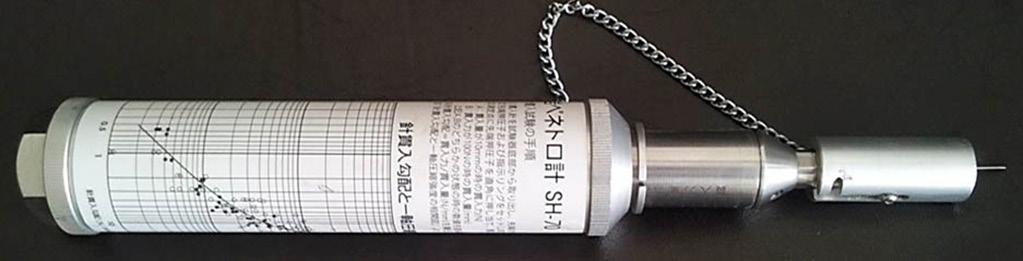
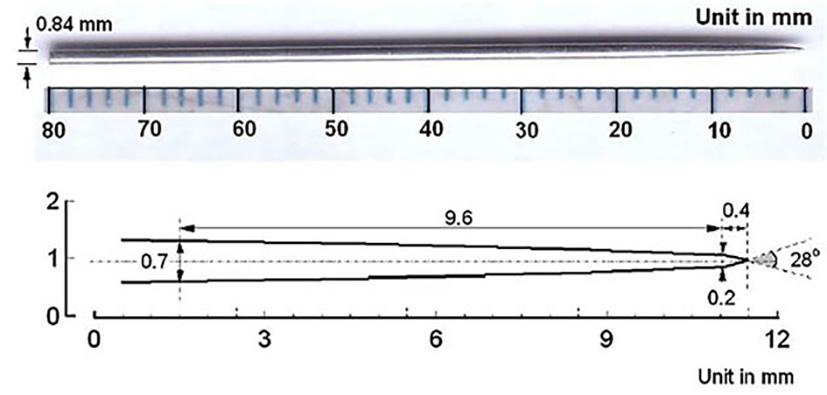
Background
Many researchers have tried to derive empirical relationships between NPI and UCS for soft rocks (Okada et al. ,1985; Takahashi, Noto, and Yokokawa, 1988; Yamaguchi et al., 1997; Uchida et al., 2004; Aydan et al. 2006; Aydan, Watanabe, and Tokashiki, 2008; Park, Obara, and Kan, 2011; Aydan, 2012; Ulusay and Erguler, 2012). Some researchers have also correlated NPI with other rock properties such as tensile strength, Young’s modulus, P- and S-wave velocities, cohesion, and friction angle (Aydan, 2012; Aydan and Ulusay, 2013; Aydan et al. 2014). Available empirical relationships are given in the following paragraphs. It should be noted that the empirical conversion factors quoted are totally dependent on the units used.
Ulusay and Erguler (2012) interpreted a large database from the literature, together with new test results, and derived the following equation:
[1]
where UCS is the uniaxial compressive strength (MPa), and NPI is the needle penetration index (N/mm).
Aydan (2012) derived the following relationships for different rock types:
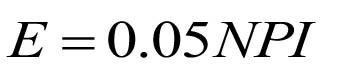

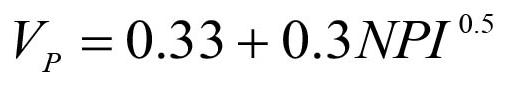
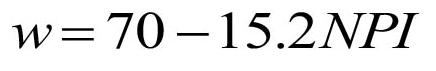

where E is the modulus of elasticity (GPa), BTS is the Brazilian tensile strength (MPa), VP is the P-wave velocity (km/s), w is the water content (%), UCS is the uniaxial compressive strength (MPa), and NPI is the needle penetration index (N/mm).
Aydan and Ulusay (2013) also developed the following relationships for Derinkuyu tuff:

Kahraman et al. (2017) investigated the predictability of coal strength from the NPI and derived the following equation:
Heidari, Mohseni, and Jalali (2017) carried out NPI experiments on sedimentary rocks, including gypsum, marl, siltstone, and sandstone, to investigate the reliability of the NPI test for the
estimation of the UCS, and developed the following empirical equation:
[10]
Rahimi et al. (2019) investigated the predictability of the UCS of gypsum rocks from the NPI. They derived the following equations: [11] [12]

The correlation coefficients for Equations [2−8] are not available. But it can be said that the correlation coefficients are generally strong. However, when the corresponding papers are examined, it is seen that data is scattered. Aydan (2012) states that conversion factors vary in wide ranges and therefore the correlations should be evaluated separately for each rock group, in order to improve the correlation coefficients.
Geology and sampling
Block samples of pyroclastic rocks were collected from ten different locations in the Kayseri and Konya regions of Turkey (Table I). The first group belonged to the eruptive products of Mount Erciyes stratovolcano (Figure 3). Mount Erciyes is located about 15 km south of Kayseri city. Eruptions associated with the formation of the wide caldera occurred in two phases. Phase I consists of four Plinian fall units (including 15 layers) and unwelded pumice flow deposits. Phase II started with two unwelded pumice flow deposits and then generated Plinian falls and the welded ignimbrite of Valibaba Tepe. Valibaba Tepe ignimbrites are commonly well-welded in the
Table I
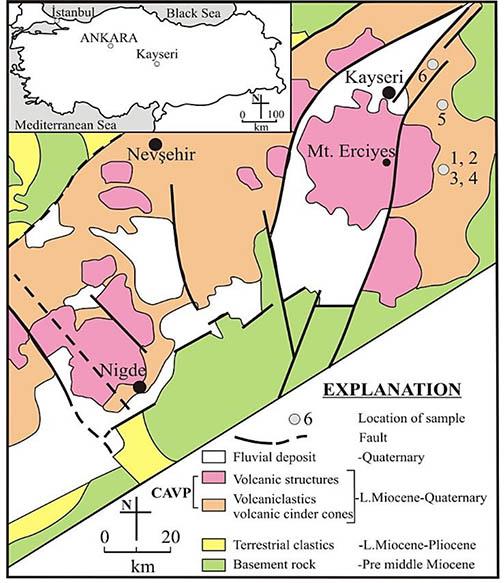
middle part, and columnar jointing is exposed near Pusatli village. From partly welded to well-welded, the density of the ignimbrite varies from 1.2 to 2.3 g/cm3. The colour changes from grey and pink (lower part) to black and red (middle part) and red and brown (upper part). The lower part is normally graded and contains grey and pink pumices, basaltic and andesitic lithics and scoria particles (Sen et al., 2003).
In the Konya volcanic region, eight groups have been defined: Sille volcanics, Kizilören ignimbrite, lava domes, nuée ardentes, Erenkaya ignimbrite, two-pyroxene andesitic lava domes, Kuzagil ignimbrite, and Sadiklar ignimbrite (Temel, Çelik, and Tunoğlu, 1998). In this study, samples were collected from the Sille, Kizilören, and Erenkaya groups (Figure 4). Sille volcanics crop out around Sille village located NNW of Konya. The Sille pyroclastics are mostly light grey, grey, and yellow. Pyroclastic deposits consist mainly of well-consolidated well-bedded fall and flow deposits. Kizilören ignimbrite crops out commonly around Kizilören village. This unit is composed of one white, yellow, and grey non-welded pyroclastic flow. The thickness of the ignimbrites is approximately 100 m. Erenkaya ignimbrite is exposed commonly between Erenkaya and Gökyurt villages. This unit is white, grey, and well-consolidated with a total thickness of about 60–100 m (Temel, Çelik, and Tunoğlu, 1995; Temel, Gündoğdu, and Gourgaud, 1998).
NX-size core specimens were taken from the block samples collected from the site and cut into the sizes required for each test (Figure 5). A total of 141 specimens were prepared for the physicomechanical tests.
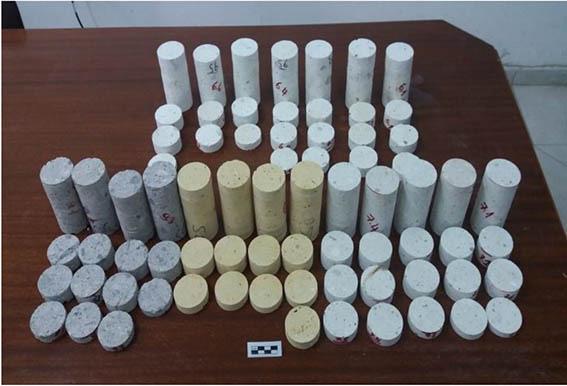
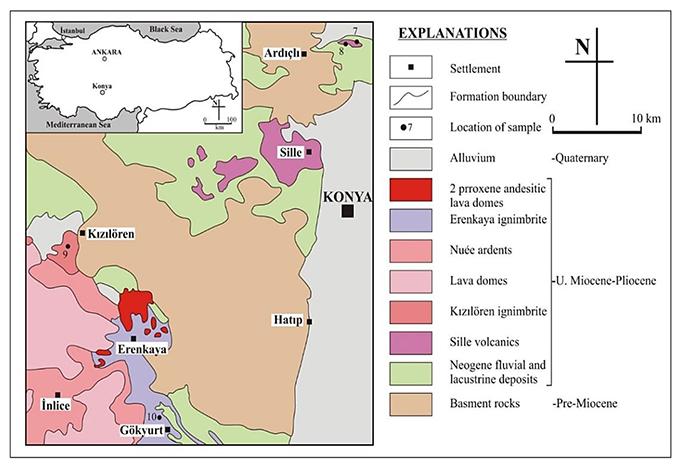
and Gourgaud, 1998)
Experimental
UCS, BTS, density, and porosity tests were carried out on the core specimens according to the ISRM (2007) suggested methods. The specimens were air-dried prior to the tests. After air drying, the water contents of the specimens were measured. The minimum, maximum, and average test results, together with the number of tested samples for each rock type, are given in Table II. The method recommended by ISRM (2015) was followed for the NPI tests. The tests were carried out at least three times on each sample prepared for the physico-mechanical tests (Figure 6). The NPI values are listed in Table II.
Results and discussion
The results of the tests were evaluated using regression analysis. The NPI values were correlated with the corresponding values of UCS, BTS, density, and porosity. A strong correlation was found between NPI and UCS (Figure 7). The correlation between NPI and BTS can also be accepted as strong (Figure 8). The relationships followed a linear function. The equations of the lines and the variation coefficients were as follows:
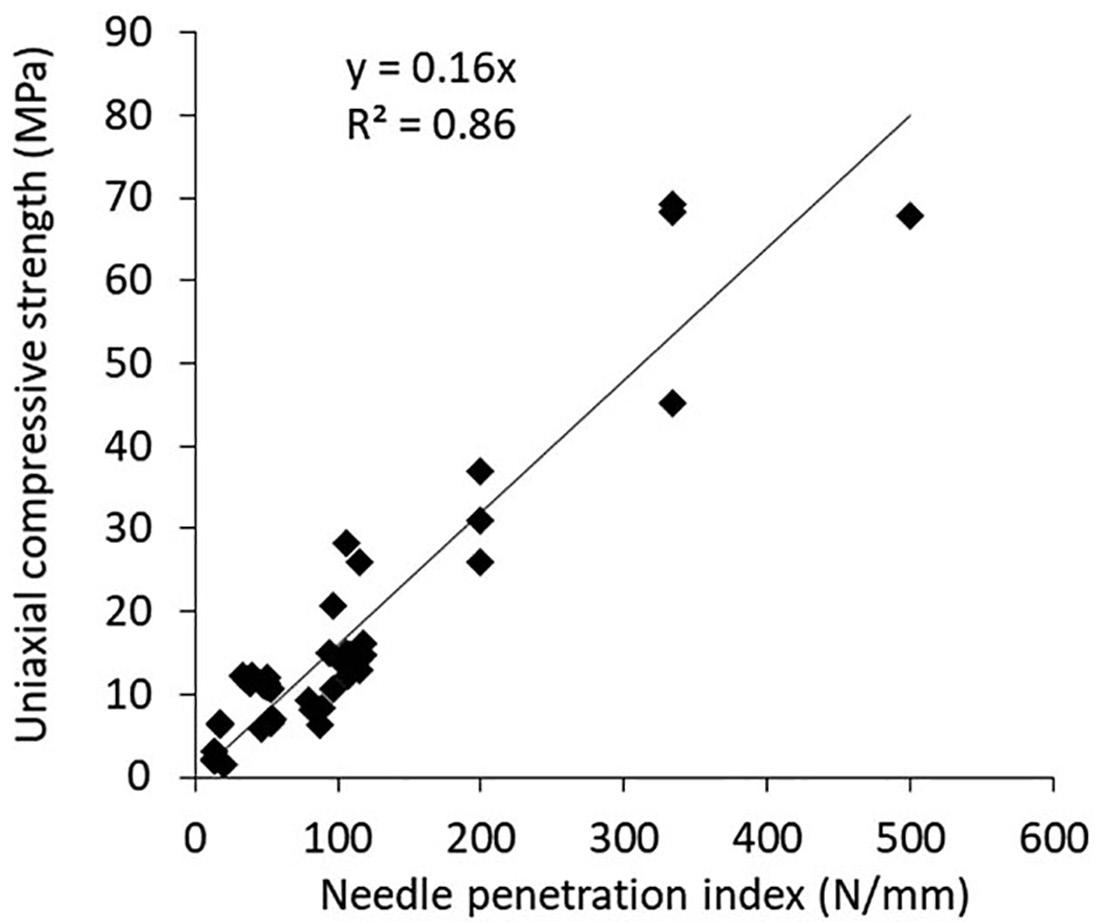
The summary of the test results
*The number of tested samples
**Average of three measurements
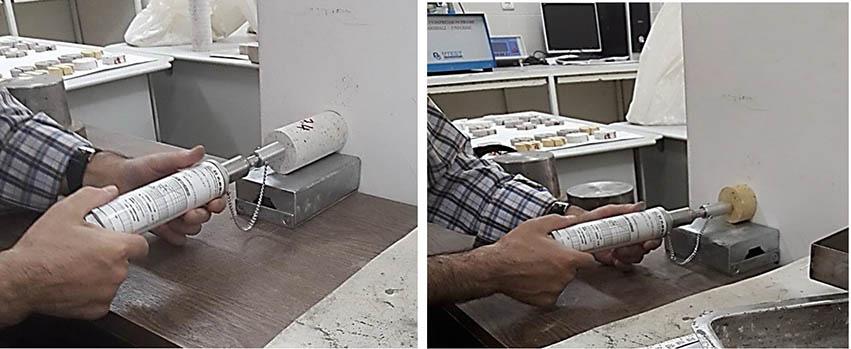
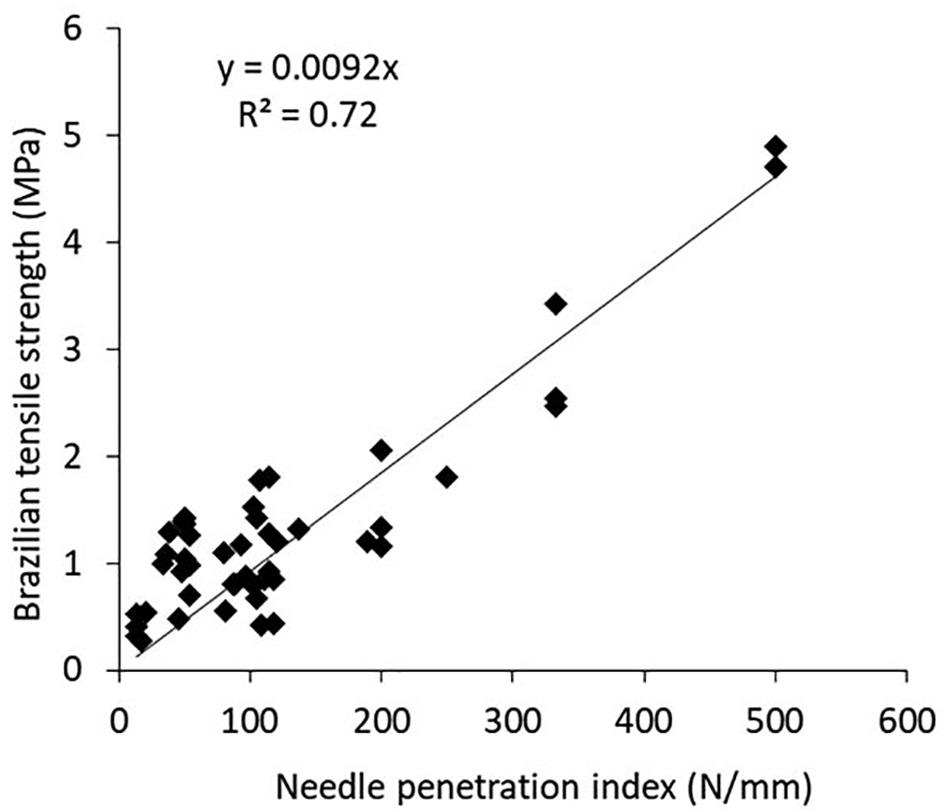
where UCS is the uniaxial compressive strength (MPa), BTS is the Brazilian tensile strength (MPa), and NPI is the needle penetration index (N/mm).
A general logarithmic relationship was found between NPI and density as indicated in Figure 9. The equations of the curve and the variation coefficient were as follows:
[15]
where ρ is the density (g/cm3), and NPI is the needle penetration index (N/mm).
Figure 10 exhibits the correlation between the NPI and porosity values. There was a general logarithmic correlation between the two parameters. The equations of the curve and the variation coefficient were as follows:
[16]
where n is the porosity (%), and NPI the needle penetration index (N/mm).
In Figures 7 to 10,there is a strong clustering of data-points for NPI < 150. If the examination is restricted to data points with NPI < 150, then the correlations are weak except in Figure 7. This point should be considered when using the correlations.
Since there are no available correlations between NPI and density or porosity in the literature, no comparison could be made for Equations [15] and [16]). However, the UCS-NPI and BTSNPI relationships developed in this study may be compared to those wsuggested in the literature. Aydan (2012) stated that the conversion factor for the UCS-NPI relationship ranges between 0.06 and 0.7, and most data-points were clustered around the empirical function with a coefficient of 0.2. In this study, the conversion factor was 0.16 as shown in Equation [13], reasonably close to 0.2. Aydan (2012) also reported that the conversion factor for the BTS-NPI relationship ranges between 0.006 and 0.07, and most data-points were clustered around the empirical function with a coefficient of 0.02. In this study, the conversion factor was found to be 0.009 as shown in Equation [14], which falls in the range defined by Aydan (2012).
In order to make a visual comparison, Equations [1], [6], and [13] were plotted graphically in Figure 11. All equations showed a similar trend, but there were some differences among them. The function derived in this study was very close to that derived by Aydan (2012). The differences are probably due to the fact
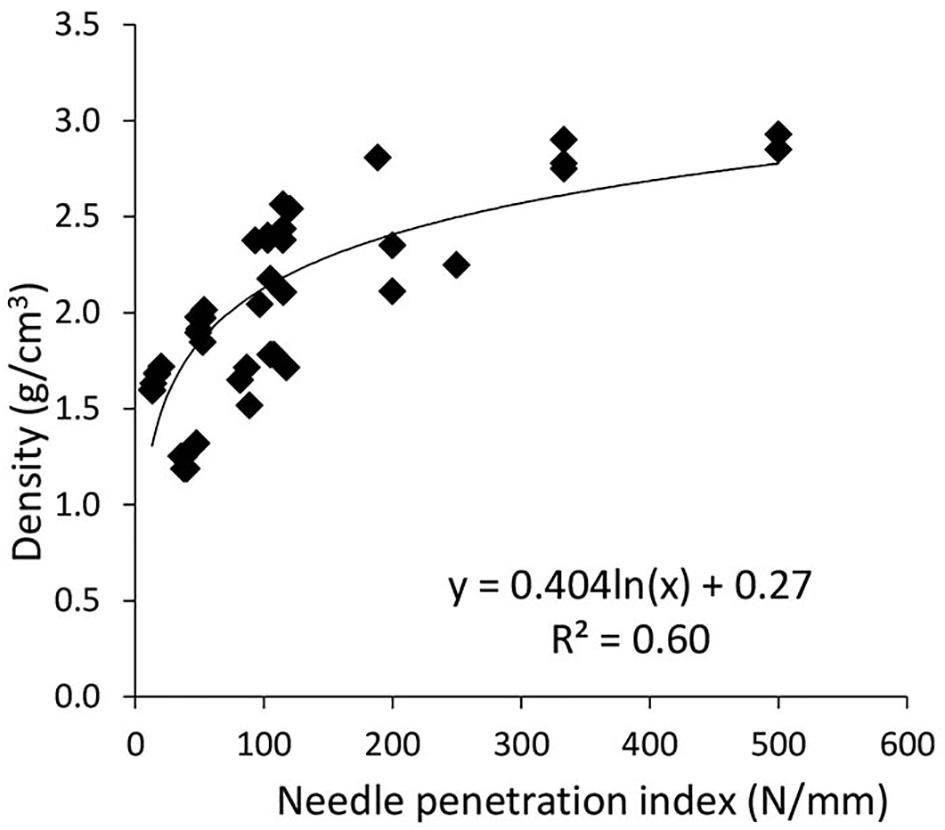
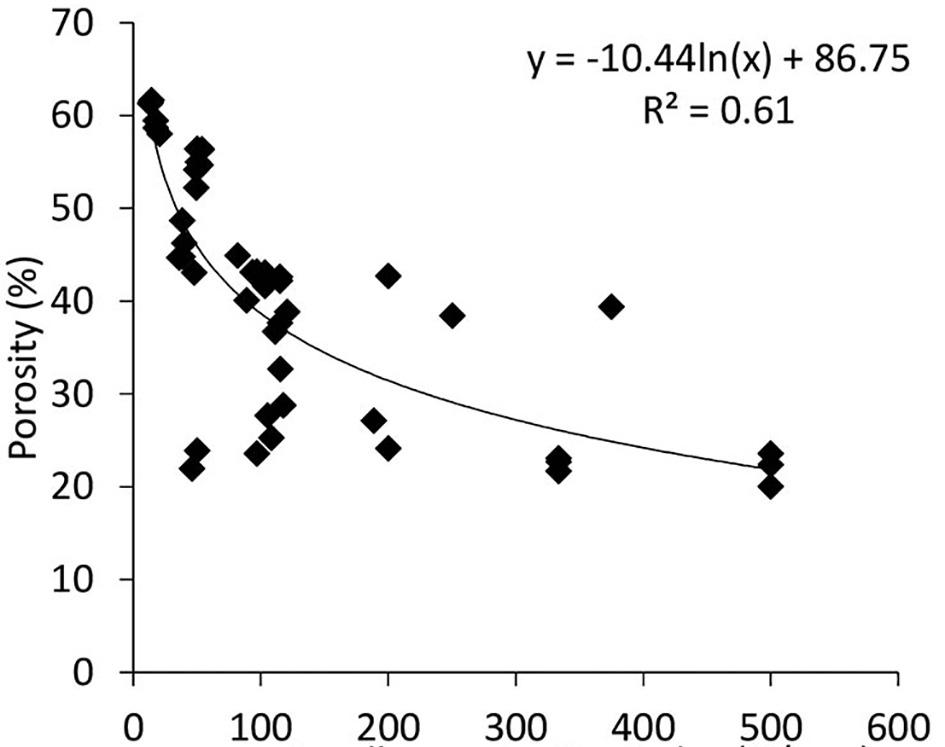
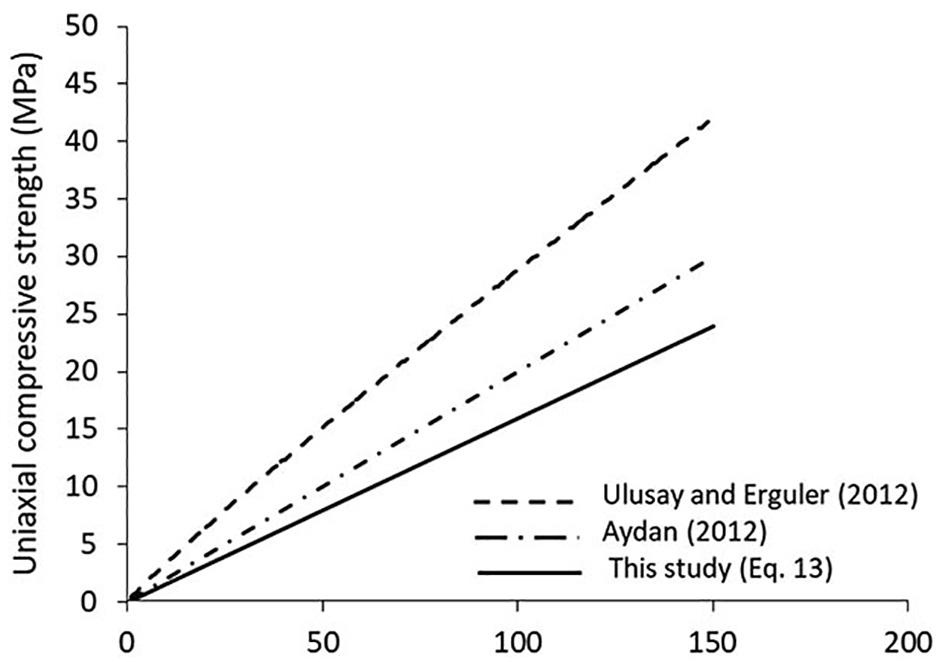
11—Comparison between Equation [13] and results from the literature
that the rock types were different in each study. Aydan (2012) explained that the conversion factor for the UCS-NPI relationship should be evaluated specifically for each rock group to improve correlations. Because the data of this study pertains to one rock group (pyroclastic rocks) the data was not generally scattered in the plots. Scattering of data-points for NPI < 150 is probably due to the fact that the rock types were different, although their origins were the same.
The comparison between Equation [13] and Equation [14] is also shown in Figure 12. The relationship found in this study is somewhat different from that derived by Aydan (2012).
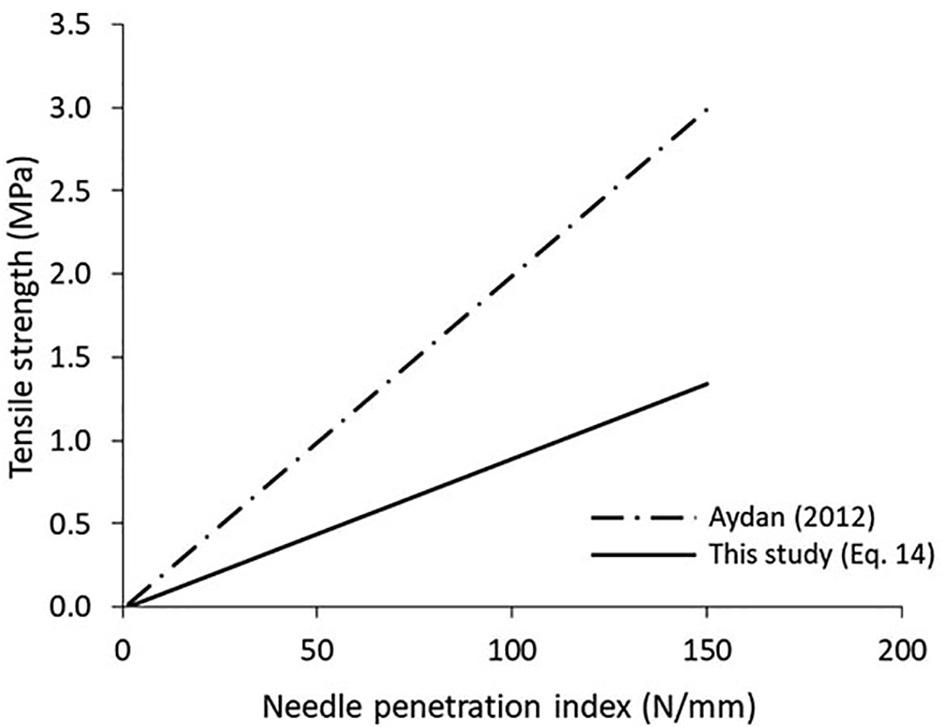
Equations [13-16] have general or strong variation coefficients. However, a strong variation coefficient does not always indicate a valid model. Some statistical tests such as the t-test and F–test may be used for validation of the derived equations. In the t-test, both variables are assumed to be normally distributed, and the observations are chosen randomly. The histogram analysis showed that the data did not have a normal distribution, as shown in Figures 13 and 14. Therefore, the t-test was not carried out.
Analysis of variance may be used for checking the significance of regressions. The confidence level was chosen as 95% for this test. In the F–test, if the calculated F-value is greater than the tabulated F-value, the null hypothesis is rejected, suggesting there is a real relationship between the dependent and independent variables. As shown in Table III, the calculated F-values were greater than the tabulated F-values. For this reason, it may be stated that the derived equations are valid according to the F-test.
Pyroclastic rocks from ten different locations were tested to study the predictability of rock properties from the NPI. The study found that:
➤ NPI correlates strongly with UCS and BTS
➤ NPI correlates moderately with density and porosity
➤ The derived relationships conform to the relationships developed previously.
As a concluding remark, the NPI may be used to discriminate between properties of rocks showing high values of NPI, but the relationships do not reliably predict the properties of rocks for NPI < 150. The derived estimation equations will be useful for rock engineering practitioners.
Aydan, O. 2012. The inference of physico-mechanical properties of soft rocks and the evaluation of the effect of water content and weathering on their mechanical properties from needle penetration tests. American Rock Mechanics Association Symposium, Chicago. Paper no. ARMA12- 639 [on CD].
Aydan, O., Sato. A., and Yagi, M. 2014. The inference of geo-mechanical properties of soft rocks and their degradation from needle penetration tests. Rock Mechanics and Rock Engineering, vol. 47. pp. 1867–1890. https://doi. org/10.1007/s00603-013-0477-5
Aydan, O., Seiki, T., Ito, T., Ulusay, R., and Yuzer, E. 2006. A comparative study on engineering properties of tuffs from Cappadocia of Turkey and Oya of Japan. Proceedings of the Symposium on Modern Applications of Engineering Geology. Turkish National Group of Engineering Geology, Denizli-Turkey. pp. 425–433.
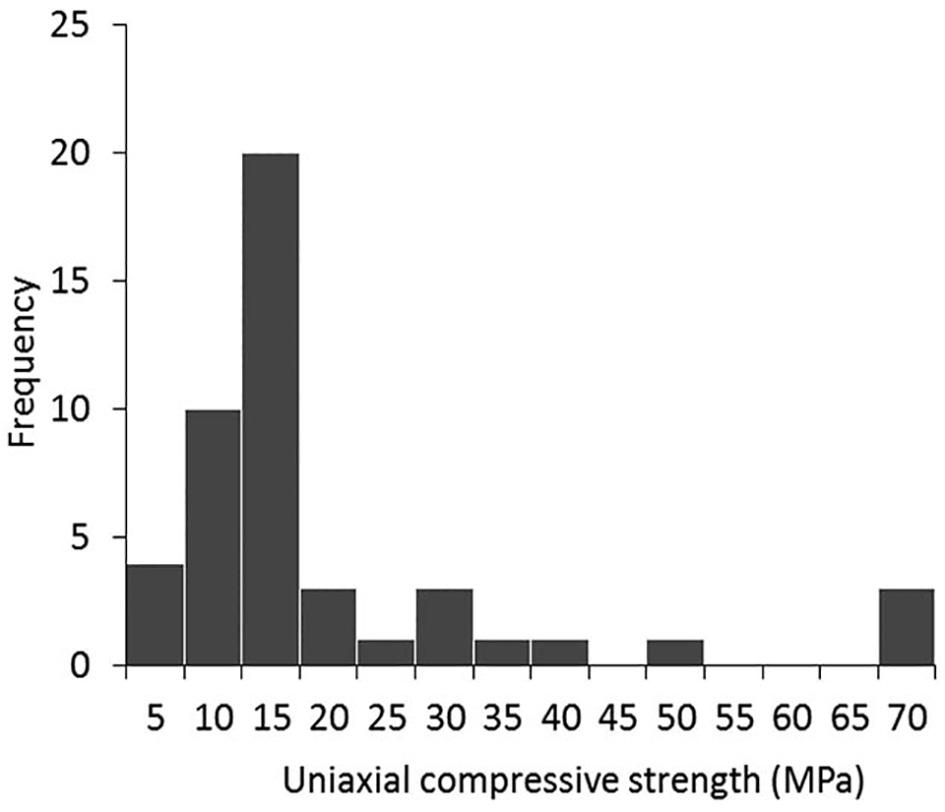
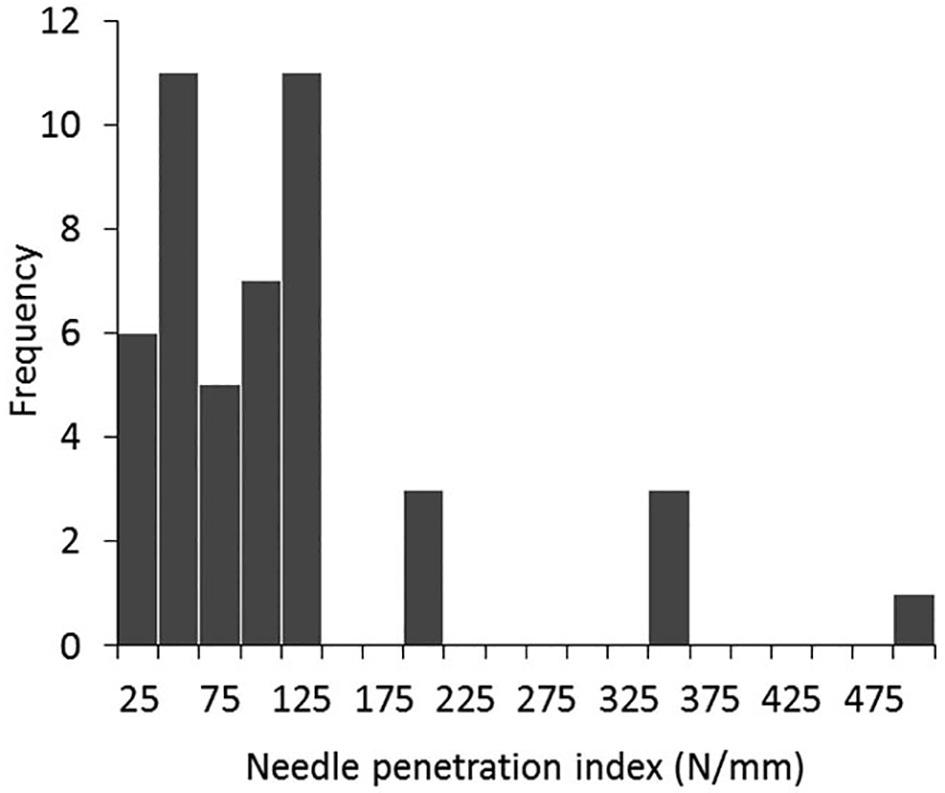
Table III F-test results
Aydan, O. and Ulusay, R. 2013. Geomechanical evaluation of Derinkuyu antique underground city and its implications in geoengineering. Rock Mechanics and Rock Engineering, vol. 46. pp. 731–754. https://doi.org/10.1007/s00603-0120301-7
Aydan, O., Watanabe. S., and Tokashiki, N. 2008. The inference of mechanical properties of rocks from penetration tests. Proceedings of the 5th Asian Rock Mechanics Symposium (ARMS5), Tehran, Iran. vol. 1. International Society for Rock Mechanics and Rock Engineering. pp. 213–220.
Broch, E. and Franklin, J.A. 1972. Point-load strength test. International Journal of Rock Mechanics and Mining Sciences, vol. 9, no. 6. pp. 669–697. https://doi. org/10.1016/0148-9062(72)90030-7
Cargill, J.S. and Shakoor, A. 1990. Evaluation of empirical methods for measuring the uniaxial compressive strength. International Journal of Rock Mechanics and Mining Sciences, vol. 27. pp. 495–503. https://doi. org/10.1016/0148-9062(90)91001-N
Heidari, M., Mohseni, H., and Jalali, S.H. 2017. Reliability assessment of needle penetration index for estimating compressive strength of some sedimentary rocks from the Qom Formation, Central Iran. Geopersia, vol. 7, no. 1. pp. 103–116. https://doi.org/10.22059/geope.2017. 215343. 648271
ISRM. 2007. The complete ISRM suggested methods for rock characterization, testing and monitoring: 1974-2006. Suggested methods prepared by the Commission on Testing Methods, International Society for Rock Mechanics. Ulusay, R. and Hudson, J.A. (eds), Compilation Arranged by the ISRM Turkish National Group, Ankara, Turkey.
ISRM. 2015. The ISRM suggested methods for rock characterization, testing and monitoring: 2007–2014. Springer, Cham, Switzerland. https://doi.org/10.1007/978-3-319-007713-0
JSCE-RMC. 1980. A suggested method for investigation and testing of soft rocks. Japan Society of Civil Engineers, Rock Mechanics Committee, The 4th Subcommittee, Tokyo [in Japanese].
Kahraman, S., Aloglu, A.S., Aydın B., and Saygın, E. 2017. The needle penetration test for predicting coal strength. Journal of the Southern African Institute of Mining and Metallurgy, vol. 117. pp. 587–591. http://dx.doi.org/ 10.17159/2411-9717/2017/v117n6a9
Kahraman, S., Fener, M., and Kozman, E. 2012. Predicting the compressive and tensile strength of rocks from indentation hardness index. Journal of the Southern African Institute of Mining and Metallurgy, vol. 112. pp. 331–339. https://www.saimm.co.za/Journal/v112n05p331.pdf
Okada, S., Izumiya, Y., Iizuka, Y., and Horiuchi, S. 1985 The estimation of soft rock strength around a tunnel by needle penetration test. Journal of the Japanese Society of Soil Mechanics and Foundation Engineering, vol. 33, no. 2. pp. 35–38. https://jglobal.jst.go.jp/en/detail?JGLOBAL_ID= 200902065506608500 [in Japanese].
Park, Y., Obara, Y., and Kan, S.S. 2011. Estimation of uniaxial compressive strength of weak rocks using needle penetrometer. Proceedings of the 12th ISRM International Congress on Rock Mechanics, Beijing. International Society for Rock Mechanics and Rock Engineering. pp. 795–798.
Rahimi, M.R., Mohammadi, S.D., Heidari, M., and Jalali, S.H. 2019. Evaluation of the needle penetration test to estimate the uniaxial compressive strength of gypsum rocks. Arabian Journal of Geosciences, vol. 13, no. 14. https://doi. org/10.1007/s12517-019-4989-5
Sen, E., Kürkcüoglu, B., Aydar, E., Gourgaud, A., and Vincent, P.M. 2003. Volcanological evolution of Mount Erciyes stratovolcano and origin of the Valibaba Tepe ignimbrite (Central Anatolia, Turkey). Journal of Volcanology and Geothermal Research, vol. 125. pp. 225–246. https://doi.org/10.1016/S03770273(03)00110-0
Su, O. and Momayez, M. 2017. Indirect estimation of electrical resistivity by
abrasion and physico-mechanical properties of rocks. Journal of Applied Geophysics, vol. 143. pp. 23–30. https://doi.org/10.1016/j.jappgeo.2017.05.006
Takahashi, K., Noto, K., and Yokokawa, I. 1988. Strength characteristics of Kobe formation in Akashi Strata (No. 1). Proceedings of the 10th Japan National Conference on Geotechnical Engineering. Japanese Geotechnical Society. pp. 1231–1232 [in Japanese].
Temel, A., Çelik, M., and Tunoğlu, C. 1995. Konya batı-güneybatısında yer alan Neojen yaşlı volkanosedimanter basenindeki kil oluşumları. Proceedings of the VII Ulusal Kil Sempozyumu, Kil’ 95. Sener, M., Öner, F., and Koşun, E. (eds), Bildiriler kitabı, Ankara. pp. 32–45 [in Turkish with English abstract].
Temel, A., Gündoğdu, M.N., and Gourgaud, A. 1998. Petrological and geochemical characteristics of Cenozoic high-K calc-alkaline volcanism in Konya, Central Anatolia, Turkey, Journal of Volcanology and Geothermal Research, vol. 85. pp. 327–354. https://doi.org/10.1016/S0377-0273(98)00062-6
Toprak, V., Keller, J., and Schumacher, R. 1994. Volcano-tectonic features of the Cappadocian volcanic province. International Volcanological CongressExcursion Guide. Middle East Technical University, Ankara.
Uchida, N., Etoh, Y., Ono, H., and Miura, N. 2004. Strength evaluation of deep mixing soil–cement by needle penetration test. Journal of the Japanese Society of Soil Mechanics and Foundation Engineering, vol. 52, no. 7. pp. 23–25 [in Japanese]. https://jglobal.jst.go.jp/en/detail?JGLOBAL_ ID=200902252009754068.
Ulusay, R., Aydan, O., Erguler, Z.A., Ngan-Tillard, D.J.M., Seiki, T., Verwaal, W., Sasaki, Y., and Sato, A. 2014. ISRM suggested method for the needle penetration test. Rock Mechanics and Rock Engineering, vol. 47. pp. 1073–1085. https://doi.org/10.1007/s00603-013-0534-0
Ulusay, R. and Erguler, Z.A. 2012. Needle penetration test: evaluation of its performance and possible uses in predicting strength of weak and soft rocks. Engineering Geology, vol. 149-150. pp. 47–56. https://doi.org/10.1016/j. enggeo.2012.08.007
Ulusay, R. and Gokceoglu, C. 1998. An experimental study on the size effect in block punch index test and its general usefulness. International Journal of Rock Mechanics and Mining Sciences, vol. 35, no. 4–5. pp. 628–629. https://doi. org/10.1016/S0148-9062(98)00024-2
Yamaguchi, Y., Ogawa, N., Kawasaki, M., and Nakamura, A. 1997. Evaluation of seepage failure response potential of dam foundation with simplified tests. Journal of the Japanese Society of Engineering Geology, vol. 38, no. 3. pp. 130–144. u
The
The Southern African Institute of Mining and Metallurgy in collaboration with the SAIMM Western Cape Branch is hosting the
1-3 SEPTEMBER 2024
HAZENDAL WINE ESTATE, STELLENBOSCH, WESTERN CAPE, SOUTH AFRICA
The world’s dependency on metals has become more evident with the growing demand for metals required to drive advancements in the technological and digital landscape and, the energy transition for a carbon neutral future. This growing demand however, implies that the metal extraction industry will need to play a significant role in providing the world with vast quantities of metals crucial in the building of the necessary infrastructure.
Furthermore, energy and water are two critical inputs in the hydrometallurgical process flowsheets and their increasing shortage suggests the need for the development of processes that take such challenges into consideration. A circular hydrometallurgy approach focusing on innovative research and developments around energy and resource efficient processes based on closing materials and resources loops can therefore, play an important role if the metal extraction sector is to meet the current and future global metal demands. In addition, advancements in the field of artificial intelligence can also allow for the use of innovative tools such as machine learning to better understand, predict and optimise hydrometallurgical processes in a smarter and sustainable manner.
The SAIMM Hydrometallurgy conference, 2024, will bring together internationally and locally recognized scientists and engineers from mining and metal producing companies, project design and implementation entities, equipment and reagent suppliers, research and academic institutions to discuss and share innovative technologies that can assist the global world in meeting the current and future metal demands.
Camielah Jardine, Head of Conferencing
FOR FURTHER INFORMATION, CONTACT: E-mail: camielah@saimm.co.za Tel: +27 11 530 0238 Web: www.saimm.co.za
Affiliation:
1School of Materials and Mineral Resources Engineering, Universiti Sains Malaysia, 14300 Nibong Tebal, Penang, Malaysia.
Correspondence to:
K.E.H.K. Ishak
Email: kuesyrahani@usm.my
Dates:
Received: 25 Mar. 2023
Revised: 2 May 2023
Accepted: 30 Aug. 2023
Published: September 2023
How to cite:
Zan. S.R. and Ishak, K.E.H.K. 2023
A study of different grinding aids for lowenergy cement clinker production.
Journal of the Southern African Institute of Mining and Metallurgy, vol. 123, no. 9. pp. 471–478
DOI ID:
http://dx.doi.org/10.17159/24119717/2702/2023
by S.R.M. Zan1 and K.E.H.K. Ishak1
Synopsis
Cement production requires significant energy, and entails high costs and CO2 emissions. This is because the clinker requires very fine grinding. Grinding aids can improve production and fineness and decrease energy consumption by reducing the agglomeration of particles and protecting the balls and liners in the mill. In this study we compare the effects of three different grinding aids on clinker grinding using a ball mill. A commercial grinding additive, triethanolamine (TEA), and two industrial grinding aids (GAA079 and GAA088) were compared by ball milling tests, with additions of 0.05, 0.25, 0.50 and 1.00 wt%. The industrial grinding aids were characterized using gas chromatography-mass spectrometry (GC-MS). Particle size and morphological analyses were performed using SEM and XRD. The best results were obtained with 0.25% GAA088, which has a higher active component of diethanolamine isopropanolamine (DEIPA) than TEA. The unique combination of TEA and DEIPA in GAA088 enhances grinding efficiency and significantly improves the particle size distribution compared to TEA alone.. The grinding aids produced smooth rounded particles, which have a smaller specific surface area, enhancing the quality of the cement. XRD showed no significant structural distortion with or without grinding aids, and it was also found that the grinding aids helped decrease ball coating during grinding. The use of grinding aids can significantly improve clinker production and fineness while decreasing energy consumption, which can help reduce the costs and CO2 emissions associated with cement production.
Keywords
Ball mill, fine grinding, clinker, cement, grinding aids, grinding additives.
Introduction
Cement is a widely used construction material that is manufactured by a complex process involving extracting raw materials, preparing them, and heating a mixture of limestone, clay, and other materials at high temperatures in a kiln. Cement is classified into various types based on its composition, properties, and intended use. The advantages of cement include its strength, durability, and versatility. Today, the cement industry produces approximately 1.6 billion tons (Gt) per year and emits large quantities of carbon dioxide (CO2) into the atmosphere. The grinding process in cement production consumes over 2% of all the electricity generated globally (Favier et al., 2018). Clinker grinding accounts for approximately one-third of the energy necessary to manufacture 1 t of cement, and grinding the raw materials and coal , as well as clinker, consumes 60−70% of the total electrical energy required in a cement plant. The grinding process involves reducing the size of the clinker particles to increase their surface area, enabling the hydration reaction to occur quickly when water is added.
Efficient grinding is important as it can significantly reduce the energy consumption and carbon emissions associated with cement production (Ku Ishak, and Saiyid Hashim, 2014). Many studies have been reported on mill design in order to optimize the grinding process (Genç and Benzer, 2016; Dong and Li, 2018; Lameck, Kirigin, and Maphosa, 2019; Musenwa et al., 2019; Ebadnejad et al., 2021; Hussain, 2021). For example, Lameck, Kirigin, and Maphosa (2019) investigated the optimization of ball mill performance by minimizing scats generation, increasing product fineness, and studying the possibility of increasing throughput. They established the optimum lifter profile, top ball size, and energy required to achieve the target grind. The authors recommended changes to the lifter profile in the primary and secondary mills to achieve the required charge behaviour without adversely affecting liner life. However, changing the mill design to optimize the particle size may require additional equipment, materials, and labour, which could increase the operational costs of the mill.
The other studies also investigated the mill parameters such as mill speed, milling duration, feed size, grinding media type and fill in order to increase the particles fineness (Guzzo, Marinho de Barros, and de Arruda Tino, 2019; Afuza et al., 2020; Blanc et al., 2020; Ku Ishak et al., 2022). However, most
studies found that reducing the particle size increased particle agglomeration during dry grinding, which adversely negatively affects the downstream separation process. The grinding of Portland clinker also causes the formation of microcracks in the crystal structure (Novosyolov et al., 2020), which results in the breaking of ionic bonds in the crystals and an increase in the surface energy of the grains. This causes cement granules to develop positive and negative charges on their surfaces, leading to undesirable agglomeration. In addition, the cement particles can seal the armour plating, agglomerate, coat the grinding media, and form tiny plates that absorb impact. The action of the grinding media within a rotating mill not only crushes the clinker particles, but also strongly compresses them, resulting in the development of electrostatic surface charges of opposite polarity that also enhance agglomeration.
Consequently, agglomeration of the cement particles lowers the grinding efficiency. This phenomenon is manifest as an increase in energy usage while maintaining a constant Blaine value. In cement manufacturing, a small improvement in clinker grinding efficiency may lead to considerable savings in plant operational costs, as well as reduced greenhouse gas emissions. To facilitate particle comminution during grinding , grinding additives or aids are used.
Grinding aids were introduced in cement manufacturing in 1930 (Adewuyi, Ahmed, and Ahmed, 2020). Grinding aids were added in small amounts in the range of 0.01–0.10% by weight of cement according to the PN-EN 197-1 standard (Toprak and Benzer, 2019). The literature shows that even a small addition of these agents can increase the efficiency of mills by 15–25% by reducing agglomeration (Kapeluszna and Kotwica, 2022). The grinding aids operate by interaction with the surface of anhydrous cementitious phases; they form layers that prevent grains from ‘sticking’ to each other. The mechanism of action is based on the reduction of the material’s resistance to fragmentation and prevention of agglomeration. In addition, during comminution, the mechanical stresses act discontinuously, and during the inactive period, microcracks may be sealed. The additives are adsorbed inside these microcracks, which hinders their resealing and prevents agglomeration of the grains. However, it must be noted that the reduction in grinding costs should be greater than the price of grinding aids.
Previous studies on the use of grinding aids at the laboratory scale have investigated various types of grinding aid, grinding aid concentrations, and mill types, and provided an overview of the impact of different substances on the grinding results. Numerous organic and inorganic substances, as well as mixtures thereof, are used as grinding aids in Portland cement production. In terms of their chemical composition, they can be divided into amines and amine salts, polyalcohols, lignosulfonates, fatty acids, and fatty acid salts (Kapeluszna and Kotwica, 2022). Surfactant-type grinding aids such as propylene glycol, triethanolamine, triethanolamine acetate, and polyglycol phenol ether are also commercially available (Prziwara and Kwade, 2020). Studies have also been conducted on the impact of grinding aids on the setting time and hydration rate of cement (Hashem, Hekal, and El Wahab, 2019; Zunino and Scrivener, 2021; Ding et al., 2022). The results of these studies have shown that certain types of grinding aids can have a significant impact on the setting time and hydration rate of cement, leading to improved workability and a reduced risk of cracking. By improving the particle size distribution and surface area of the cement, grinding aids can enhance the reactivity of the cement and accelerate the hydration process, shortening the setting time
(Assaad and Issa, 2014; Hashem, Hekal, and El Wahab, 2019; Kapeluszna and Chrabąszcz, 2023; Wang, Tian, and Mao, 2023).
Grinding aids can also affect the rheology of cement (Assaad, 2015), making it more fluid and easier to work with, reducing the risk of cracking. Some of these studies also include the effect of grinding aids in integrated processes such as ball milling and classification. The effects of different grinding aids on the transportation rate of the material inside the cement ball mill and their impact on the overall grinding circuit were studied by Toprak, Altun, and Benzer (2018), Toprak and Benzer (2019), and Toprak et al., (2020). The authors aimed to provide a better understanding of the mechanism of action of grinding aids in grinding circuits and improve their use in industrial applications. However, there is a lack of comprehensive studies to determine the optimal conditions for using different grinding aids, including the dosage and timing of their addition. The basic mechanisms of action are understood, but the selection of grinding aids is still largely based on trial and error because of the complexity of the various factors influencing the process. The impact of grinding aids on the particle and bulk behaviour of different materials has been well documented (Hashim and Hussin, 2018; Prziwara, Breitung-Faes, and Kwade, 2018; Toprak, Altun, and Benzer, 2018; Çallı and Pehlivan, 2019; Toprak and Benzer, 2019; Zunino and Scrivener, 2021), but selection of time-efficient grinding aids remains a challenge.
Despite the availability of over 100 scientific papers on the topic and the widespread use of grinding aids in industry, there is still only a limited understanding of these substances, especially when different types of grinding aids are mixed. The objective of the present study is to investigate the advantages of using two industrial grinding aids, GAA079 and GAA088, which are mixtures of diethanolamine isopropanolamine (DEIPA) and triethanolamine (TEA) at different percentages, in comparison to the commercial grinding aid TEA. The significance of this study lies in its investigation of the possible advantages of employing various forms of grinding aids during cement manufacturing. The use of grinding aids can lead to a considerable enhancement in production output and particle fineness, together with reduction in energy consumption. This, in turn, can contribute to lowering the costs and carbon dioxide emissions linked to cement production.
Clinker samples with a specific gravity of 3.15 were obtained from a cement manufacturer in Malaysia. The grinding aids used included triethanolamine (TEA) and two industrial grinding aids used in one of the cement industries in Malaysia, namely GAA079 and GAA088. Ball milling was performed using a laboratory-scale ball mill with a standard ball charge of approximately 20 kg.
A feed particle size less than 3.35 mm was required for the ball milling tests. The clinker sample was crushed using a cone crusher to 100% passing 3.35 mm, then sieved and split using aJ ones riffle splitter. The samples were placed in a bucket and weighed to estimate the number of splits required. The sample was then fed into the hopper of the splitter and sub-samples collected in a bucket placed underneath. This procedure was repeated until the desired sample mass was obtained.
The amount of grinding aids used was calculated using Equation [1].
Table I
The masses of TEA, GAA079, and GAA088 required are listed in Table I.
Ball milling
To obtain a representative sample, a portion of the feed was separated using rifling until enough material was collected to fill a 1000 ml measuring cylinder, resulting in approximately 700 ml of sample weighing approximately 1 kg. The clinker sample was fed into the ball mill, which was operated at 70 r/min. After grinding, the samples were removed from the mill and particle size analysis was performed.
Industrial grinding aids
The industrial grinding aids were characterized using gas chromatography-mass spectrometry (GC-MS). The constituents of the mixtures were separated using an HP-5 MS column, 30 m in length and with an internal diameter of 250 × 10-6 m. The column was operated at 323 K for 5 minutes, then the temperature was raised to 473 K at a rate of 10 K/min, and finally to 553 K at 20 K/ min. Helium was used as the carrier gas at a total flow rate of 9.7 ml/min in pulsed split (1:10) mode. The injector and detector temperatures were 523 K and 423 K, respectively. Two primary chemicals were detected in the chromatograms of both grinding aids: TEA and diethanolamine (DEIPA). The main component of GAA079 was found to be TEA, DEIPA was the most abundant component in GAA088. Table II summarizes the active components of the industrial grinding aids.
The chemical composition of the clinker is listed in Table III. The major component was CaO, accounting for approximately 62.17% of the total mass, with lesser amounts of Al2O3, SiO2, SO3, K2O, TiO2, MnO, Fe2O3, and PbO.
The feed sample was characterized by XRD analysis and the results were analysed using PANalytical X’Pert HighScore Plus software. The XRD spectrum showed that the cement clinker consisted of alite (tricalcium silicate) and belite (dicalcium silicate) as the dominant compounds, together with calcium aluminate, ferrite, the unreacted calcium oxide remaining after calcination of the clinker (free lime), and periclase, as shown in Figure 1. Alite,
Amount of grinding aids required in the ball mill
Table II
Active components of industrial grinding aids (%) Active component
Table III
Chemical oxide composition of industrial clinkers
belite, calcium aluminate, and ferrite in the clinker composition are important for the strength and durability of the final cement product, as these compounds provide the required chemical and physical properties for the cement to set and harden properly. Free lime and periclase are also important because they can affect the cement's setting time and properties.
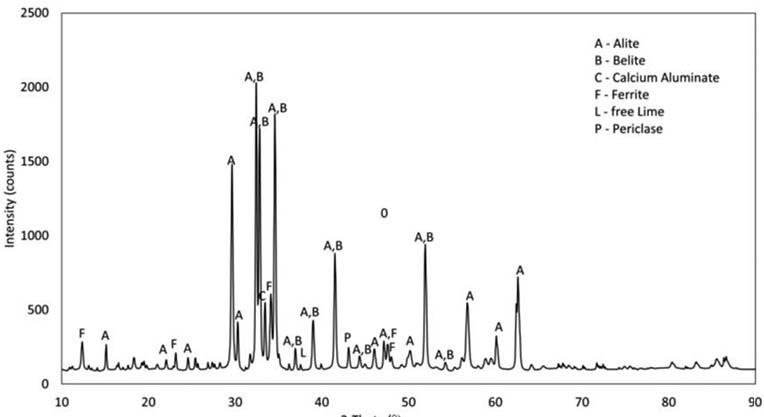
Results and discussion
Particle size distribution
Figure 2 and Table IV show the effect of grinding aid type and concentration on particle size distribution. As shown in Figure 2a, the addition of 0.05% GAA079 resulted in the finest particle size (d50 = 42 µm) compared with 0.05% TEA and GAA088 (d50 = 48 µm and 47 µm respectively). However, the effect was insignificant since a similar size was obtained without grinding additive. This is probably because the concentration of grinding aid was too low to have a measurable impact on the grinding process. With 0.25% addition of both industrial grinding aids (GA088 and GA079) the cumulative distribution curve moves toward the finest region (d50 = 38 µm) compared to that without GA and TEA (d50 = 42 µm and 46 µm). The product particle size with 0.25% GAA079 is nearly identical to that obtained with 0.25% GAA088. The same cut size was observed for both grinding aids (d50 =38 µm). Adding 0.25% TEA was less effective (d50 = 46 µm). The cumulative distribution curve of the product produced with 0.25% addition of both industrial grinding aids GA088 and GA079 moves towards the finest region due to the unique combination of active components (TEA and DEIPA), which allow them to act synergistically. DEIPA provides increased efficiency through its high basicity, which reduces the electrostatic attraction between particles, leading to finer grinding and an improved production rate. In contrast, TEA has lower basicity and acts as a dispersant, helping to keep the particles separate. When used together, DEIPA and TEA complement each other, improving the grinding efficiency and product stability.
As seen in Figure 2c and Table IV, the cumulative distribution curves with 0.25% to 0.50% TEA and GAA079 move toward the
Table IV
Effect of grinding aid concentration on cut size (d50)
coarsest size region (d50 = 46 µm to 57 µm for TEA -and d50 = 38 µm to µm for GAA079), whereas increasing the concentration of GAA088 to 0.5% did not show a significant effect, although the product was still finer than that produced without grinding additive. An increase in the dose of the grinding aids led to agglomeration due to changes in the surface properties of the ground particles. Adding a large amount of grinding aid can alter the surface charge and hydration state of the particles, resulting in an increase in the interparticle attraction and the formation of agglomerates. Additionally, DEIPA contains an amine functional group (–NH2) and TEA contains an ethyl amine functional group (–CH2CH2NH2). The adsorption of these polar functional groups increases the hydrophilicity of the particles and thus increases interparticle attraction. Increasing the grinding aid concentration to 1.0% produced similar results. Agglomeration reduced the surface area available for grinding, making it more difficult to achieve further particle size reduction.
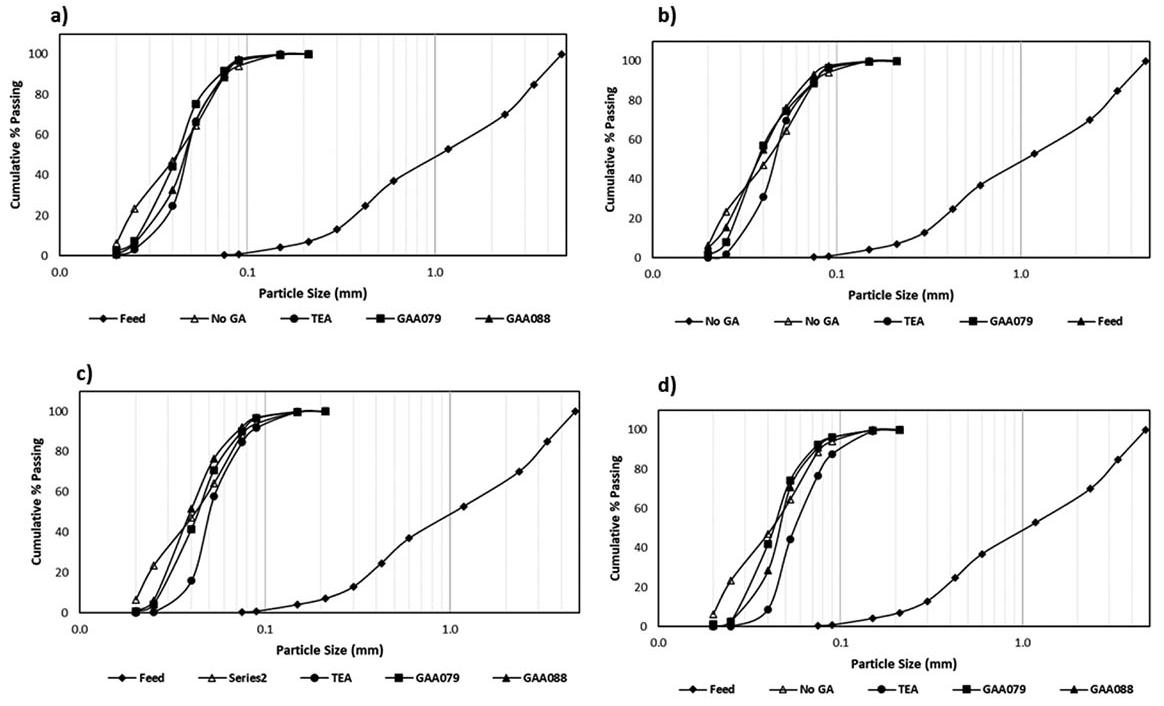
Photomicrographs of the feed and cement ground without grinding aids are shown in Figure 3. The feed clinker (Figure 3a) has varying particle sizes. In Figure 3b, it can be seen that grinding without additives results in angular and irregular shapes, with a particle size below 500 μm. This is typical of feed materials that have not been treated with grinding aids, as the grinding process can result in high energy consumption and low grinding efficiency, producing particles with less uniform size and shape, which can lead to poor flow properties and a reduced packing density, and affect the efficiency of downstream processing.
Figure 4 shows images of the particles after grinding with 0.25% additions of TEA, GAA079, and GAA088. The grains of cement clinker produced with GAA079 and GAA088 have smooth edges,
which results in a reduced specific surface area, while cement clinker ground using TEA has angular, rhomboid, flaky, and irregular grains. Smooth particles are desirable since they enhance the reactivity of the cement product, particularly during hydration. This results in accelerated early strength development and faster setting times, thereby improving workability and reducing the overall construction time. Additionally, smooth-edged cement particles exhibit favourable rheological properties, imparting increased fluidity to the cement during placement. The improved workability ensures better consolidation around reinforcement and formwork while minimizing the risk of segregation. Figures 5a and 5b show photomicrographs of particles ground with 0.5% and 1% GAA088 additions. It can be seen that agglomeration occurs, resulting in coarser particles with smoother edges compared
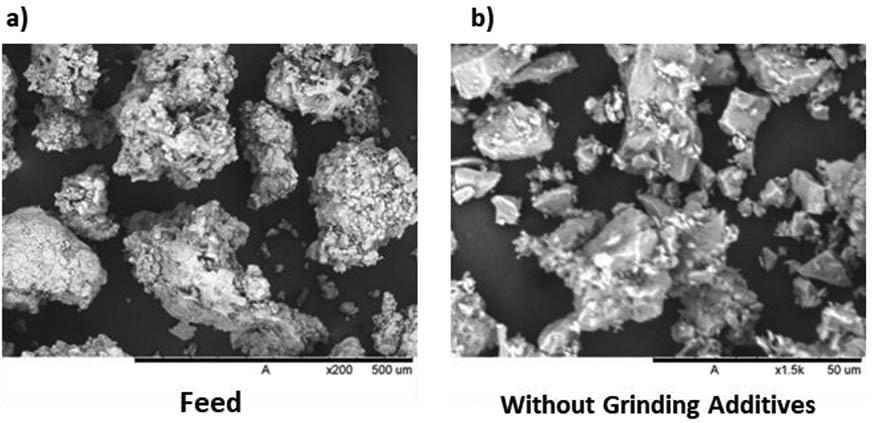
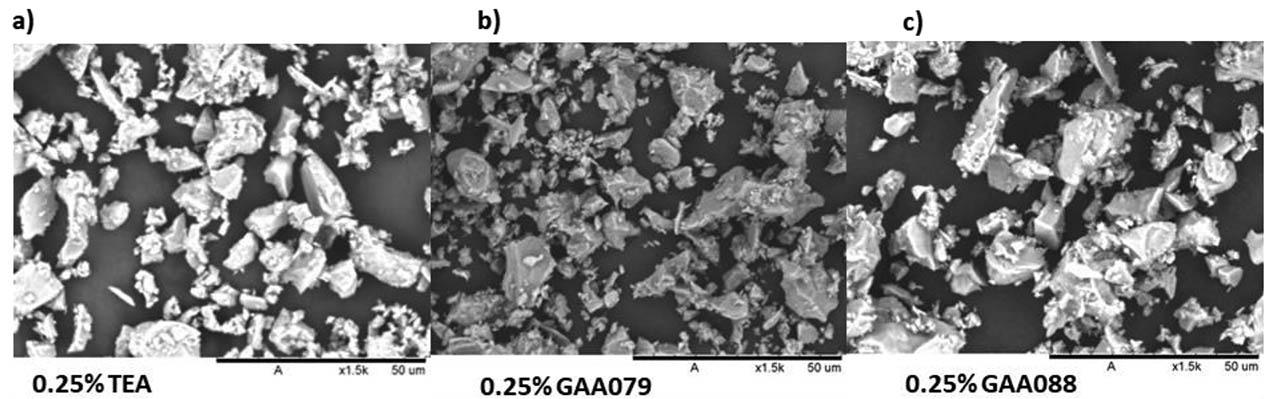
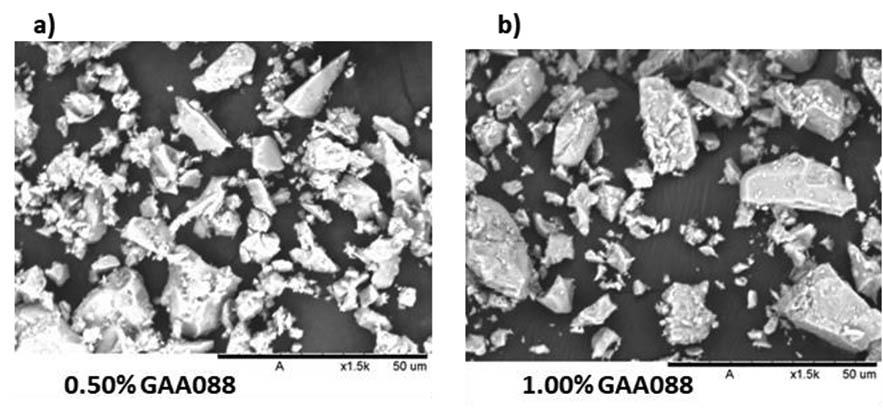
to without grinding aids. At a high concentration the grinding aid molecules adsorb onto the particle surfaces and change the surface charge, reducing the repulsive forces between particles and increasing attractive forces. This can result in reduced fragmentation of particles during grinding and an increase in the formation of larger, more spherical particles with smooth edges.
A comparison of the XRD spectra of the cement clinker samples before and after grinding with different doses and types of grinding aids enabled the changes in the crystal structure of C3S to be identified. The XRD results were then compared to the crystal structure of the d clinker samples produced without grinding aids to determine the effect of the grinding aids on the crystal structure. According to the analyses (Figure 6), the addition of grinding aids did not significantly alter the crystal structure of the cement
clinker particles, and the crystalline phases present before and after grinding with grinding aids were unchanged. This suggests that the grinding aids have little effect on the microstructure of the particles and that the grinding process does not significantly affect the crystal structure.
Figure 7a shows images of the ball coatings after grinding with and without grinding aids. It can be observed that the addition of grinding aids decreased ball coating. Adsorbed grinding aids, in neutralizing the electrical charges on the particle surfaces and preventing the closure of cracks in the clinker, aid agglomeration of particles and reduce coating of the mill surface and steel balls with cement particles. This results in improved energy efficiency and a smoother and finer-grained product. Similar findings were observed using glycol-based grinding aids in cement grinding (Kobya, Kaya, and Mardani-Aghabaglou, 2022).
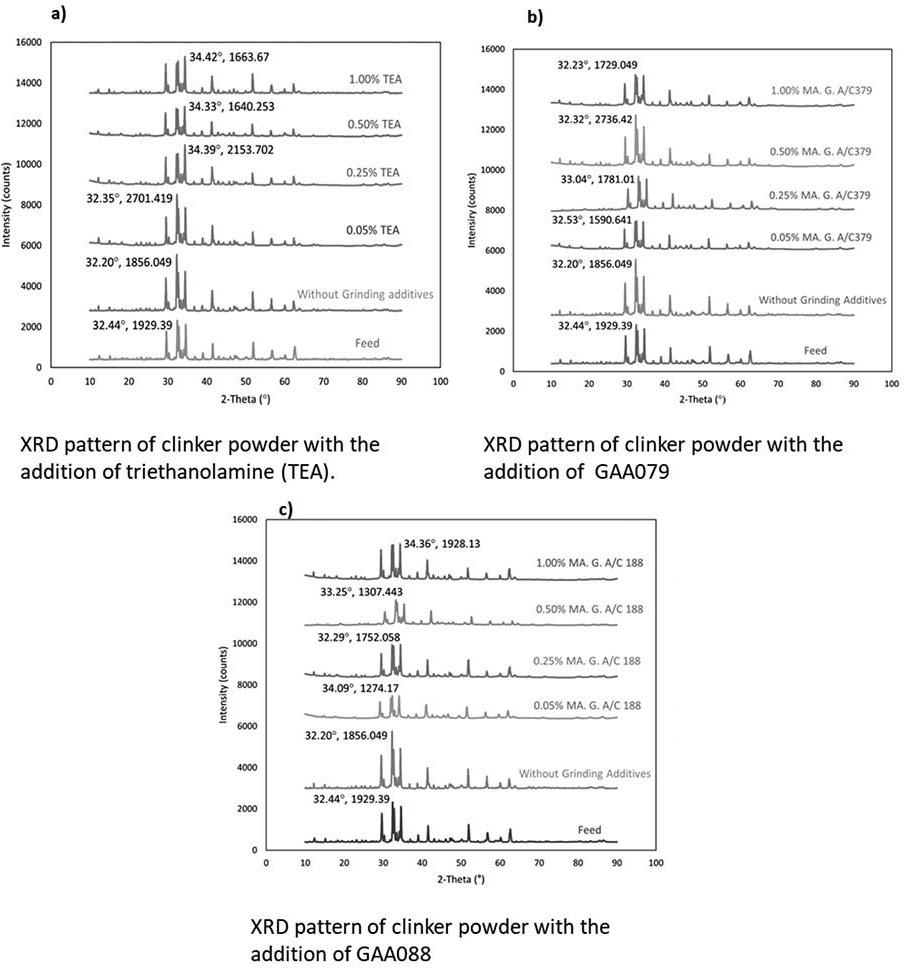
The use of grinding aids in cement manufacturing is an effective way to improve production and fineness as well as reduce energy consumption and costs. This study compared the effects of three different types of grinding aids on clinker grinding in a ball mill. The industrial grinding aids contained different active components than the commercial additive TEA. Particle size and morphological analyses showed that the grinding aids produced different grain shapes in the cement powder but induced no significant structural distortion. Using grinding aids also helps decrease coating of the balls and mill lining during grinding. The study found that the optimal concentration of grinding aid was 0.25% GAA088, which has a higher percentage of the active component DEIPA than TEA. The mixture of TEA and DEIPA improved the particle size distribution compared to when using TEA alone.
The potential benefits of using different grinding aids in cement production include improved production and product fineness, decreased energy consumption, and reduced costs and CO2 emissions. This is particularly significant given the importance of sustainability in the cement industry. The results of this study provide valuable insights into how the industry can improve its processes and become more sustainable, and demonstrate the importance of further exploring the use of grinding aids in cement production. By utilizing these findings, the industry can work towards reducing its energy consumption, costs, and environmental impact while continuing to meet the increasing demand for cement.
Acknowledgment
The authors would like to thank the School of Materials and Mineral Resources Engineering and USM short-term grant 304/ PBAHAN/6318854 for supporting this research.
Statements and declarations
Ethical approval:
Not applicable
Consent to participate:
All participants provided written informed consent before they participated in the study.
Consent to publish:
Consent was obtained from all participants to publish their data and information.
Authors contributions:
All authors contributed to the conception and design of the study.
Siti Rohaidah Md Zan developed the research methodology and performed the experiments, while Ku Esyra Hani Ku Ishak provided technical support and assisted with sample analysis.
All authors discussed and interpreted the results of the experiments.
Siti Rohaidah Md Zan drafted the initial manuscript, while Ku Esyra Hani Ku Ishak provided critical feedback and revisions.
Funding:
This work was supported by Universiti Sains Malaysia grant 304/ PBAHAN/6318854.
Competing interests:
The authors have no relevant financial or non-financial interests to disclose.
Availability of data and materials:
The data and materials generated during this study are available in the manuscript.
References
Adewuyi, S.O., Ahmed, H.A.M., and Ahmed, H.M.A. 2020. Methods of ore pretreatment for comminution energy reduction. Minerals, vol. 10, no. 5. https://doi: 10.3390/min10050423
Afuza, A.A., Hadzley, A.B., Norfauzi, T., Umar, A.A-., Faiz, M., Naim, F., and Kunlapat, T. 2020. Analysis of particles size distribution on the agglomeration and shrinkage of alumina-zirconia compacts. International Journal of Nanoelectronics and Materials, vol.13. pp. 277–284.
Assaad, J.J. 2015. ‘Assessment of rheology variations of cement pastes containing clinker grinding AIDS compliant with ASTM C465, Advances in Civil Engineering Materials, vol. 4, no. 1. https://doi: 10.1520/ACEM20140038
Assaad, J.J. and Issa, C.A. 2014. Effect of clinker grinding aids on flow of cementbased materials. Cement and Concrete Research, vol. 63. https://doi: 10.1016/j.cemconres.2014.04.006
Blanc, N., Mayer-Laigle, C., Frank, X., Radjai, F., and Delenne, J-Y. 2020. Evolution of grinding energy and particle size during dry ball-milling of silica sand. Powder Technology, vol. 376. pp. 661–667. https://doi: 10.1016/j. powtec.2020.08.048
Çallı, M. and Pehlivan, E. 2019. Effects of adding boron compounds to glycol based grinding aids on cement compressive strengths performance. Open Journal of Civil Engineering, vol. 9, no. 1. https://doi: 10.4236/ojce.2019.91003
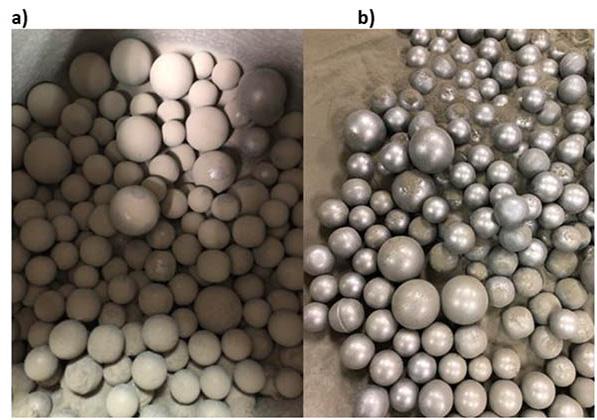
Ding, X et al 2022. Influence of grinding aids on the performance of Portland cement. Shenyang Jianzhu Daxue Xuebao (Ziran Kexue Ban)/Journal of Shenyang Jianzhu University (Natural Science). https://doi: 10.11717/j.issn:20951922.2022.01.16
Dong, Y. and Li, Q. 2018. Stress analysis and optimization design & research of the large ball mill cylinder. Chemical Engineering Transactions, vol. 66. https://doi: 10.3303/CET1866119
Ebadnejad, A., Dehghani, H., Hadizadeh, M., Ghorbani, K., and Sanaie, M. 2021. Optimisation of the size distribution of ball mill product by modelling grinding variables using DX8 software. Mineral Processing and Extractive Metallurgy: Transactions of the Institute of Mining and Metallurgy, vol. 30, no. 1. https://doi: 10.1080/25726641.2018.1518655
Favier, A., de Wolf, C., Scrivener, K., and Habert, G. 2018. A sustainable future for the European Cement and Concrete Industry Technology assessment for full decarbonisation of the industry by 2050. ETH Zurich. https://doi. org/10.3929/ethz-b-000301843
Genç, O. and Benzer, A.H. 2016. Effect of High Pressure Grinding Rolls (HPGR) pre-grinding and ball mill intermediate diaphragm grate design on grinding capacity of an industrial scale two-compartment cement ball mill classification circuit’, Minerals Engineering, vol. 92. pp. 47–56. https://doi: 10.1016/j. mineng.2016.02.009
Guzzo, P.L., Marinho de Barros, F.B., and de Arruda Tino, A.A. 2019. Effect of prolonged dry grinding on size distribution, crystal structure and thermal decomposition of ultrafine particles of dolostone. Powder Technology, vol. 142. pp. 141–148. https://doi: 10.1016/j.powtec.2018.09.064
Hashem, F.S., Hekal, E.E., and El Wahab, M.A. 2019. The influence of Triethanol amine and ethylene glycol on the grindability, setting and hydration characteristics of Portland cement. International Journal of Petrochemical Science & Engineering, vol. 4, no, 3. https://doi: 10.15406/ipcse.2019.04.00107
Hashim, S.F.S. and Hussin, H. 2018. Effect of grinding aids in cement grinding. Journal of Physics: Conference Series, vol. 182. https://doi: 10.1088/17426596/1082/1/012091
Hussain, Z. 2021. Comparative study on improving the ball mill process parameters influencing on the synthesis of ultrafine silica sand: A Taguchi coupled optimization technique. International Journal of Precision Engineering and Manufacturing, vol. 22. pp.679–688. https://doi: 10.1007/s12541-021-00492-3
Kapeluszna, E. and Chrabąszcz, K. 2023. Mutual compatibility of superplasticizers (PC, SNF), grinding aids (TEA, glycol) and C3A in Portland cement systems – Hydration, rheology, physical properties and air void characteristics.’ Construction and Building Materials, vol. 373. https://doi: 10.1016/j.conbuildmat.2023.130877
Kapeluszna, E. and Kotwica, Ł. (022. The effect of various grinding aids on the properties of cement and its compatibility with acrylate-based superplasticizer. Materials, vol. 15, no. 2. doi: 10.3390/ma15020614Kobya, V., Kaya, Y., and Mardani-Aghabaglou, A. 2022. Effect of amine and glycol-based grinding aids utilization rate on grinding efficiency and rheological properties of
cementitious systems. Journal of Building Engineering, vol. 47. https://doi: 10.1016/j.jobe.2021.103917
Ku Ishak, K.E.H., Sayid Hashim, S.F.S., Mohd Azazli, K.A.M., Palaniandy, S., and Hussin, H. 2022. Effect of quartz in clay on grindability of raw mixes for cement production. Journal of Physical Science, vol. 33, no. 2. pp. 45–59. https://doi: 10.21315/jps2022.33.2.3
Ku Ishak, K.E.H. and Saiyid Hashim, S.F. 2014. Modelling and simulation of air classification in cement manufacturing. Advanced Materials Research, vol. 858. https://doi: 10.4028/www.scientific.net/AMR.858.272
Lameck, N.S., Kirigin, J., and Maphosa, J. 2019. Milling circuit optimization study for Kroondal no. 1 platinum concentrator. Journal of the Southern African Institute of Mining and Metallurgy, vol. 119. https://doi: 10.17159/24119717/18/028/2019.
Musenwa, L., Khumalo, T., Kgaphola, M., Masemola, S., and van Wyk, G. 2019. The new Cullinan AG milling circuit – A narrative of progress. Journal of the Southern African Institute of Mining and Metallurgy, vol. 119, no. 2. https://www.scielo.org.za/scielo.php?script=sci_ arttext&pid=S2225-62532019000200005
Novosyolov, A.G., Ershova, Y.I., Novoselova, I.N., and Klassen, V.K. 2020. Study of the carbonate component raw material mixture effect on the clinker grindability. Materials Science Forum, vol. 974. https://doi: 10.4028/www. scientific.net/MSF.974.261
Prziwara, P., Breitung-Faes, S., and Kwade, A. 2018. Impact of grinding aids on dry grinding performance, bulk properties and surface energy’, Advanced Powder Technology, vol. 29, no. 2. https://doi: 10.1016/j.apt.2017.11.029
Prziwara, P. and Kwade, A. 2020. Grinding aids for dry fine grinding processes –Part I: Mechanism of action and lab-scale grinding’. Powder Technology, vol. 375. pp. 146-160. https://doi: 10.1016/j.powtec.2020.07.038
Toprak, N.A., Benzer, A.H., Karahan, C.E., and Zencirci, E.S. 2020. Effects of grinding aid dosage on circuit performance and cement fineness. Construction and Building Materials, vol. 265. https://doi: 10.1016/j. conbuildmat.2020.120707
Toprak, N.A., Altun, O., and Benzer, A.H. 2018, The effects of grinding aids on modelling of air classification of cement. Construction and Building Materials, vol. 160. pp. 564–573. https://doi: 10.1016/j.conbuildmat.2017.11.088
Toprak, N.A. and Benzer, A.H. 2019. Effects of grinding aids on model parameters of a cement ball mill and an air classifier. Powder Technology, vol. 344. pp. 706–718. https://doi: 10.1016/j.powtec.2018.12.039
Wang, Z., Tian, P. and Mao, Y. 2023. Effects of grinding aids on the grinding kinetics and surface morphological characterization of quartz. Advanced Powder Technology, vol. 34, no. 10. p. 104142. https://doi: 10.1016/j. apt.2023.104142
Zunino, F. and Scrivener, K. 2021. Assessing the effect of alkanolamine grinding aids in limestone calcined clay cements hydration. Construction and Building Materials, vol. 266, part B. https://doi: 10.1016/j.conbuildmat.2020.121293 u
11-13 October 2023 — 11TH International Ground Freezing Symposium 2023
London, United Kingdom
E-mail: events@iom3.org
Website: https://www.iom3.org/events-awards/11thinternational-symposium-on-ground-freezing.html
24-26 October 2023 — Next Generation Tailings –Opportunity or Risk?
Emperors Palace Conference Centre, Kempton Park, Johannesburg, South Africa
Contact: Camielah Jardine
Tel: 011 538-0237
E-mail: camielah@saimm.co.za
Website: http://www.saimm.co.za
31 October-2 November 2023 — International Mining and Resources Conference (IMARC) 2023
Sydney, Australia
Website: https://imarcglobal.com/
7 November 2023 — 19TH Annual Student Colloquium
Mintek, Randburg
Contact: Gugu Charlie
Tel: 011 538-0238
E-mail: gugu@saimm.co.za
Website: http://www.saimm.co.za
7-9 November 2023 — Hydroprocess 2023 14TH International Conference on Process Hydrometallurgy
Sheraton Hotel, Santiago, Chile
Website: https://gecamin.com/hydroprocess/index
14-16 November 2023 — Slope Stability in Mining Conference 2023
The Western Perth, Western Australia
Website: https://acg.uwa.edu.au/class/ssim2023/
15 November 2023 — Decarbonisation of the Minerals Industry-Challenges and opportunities Colloquium 2023
Carbon Tax: South Africa and the context of the global mining industry
54 on Bath, Rosebank, Johannesburg, South Africa
Contact: Camielah Jardine
Tel: 011 538-0237
E-mail: camielah@saimm.co.za
Website: http://www.saimm.co.za
15-16 November 2023 — MESA Year End International Summit
Johannesburg, South Africa
Contact: Gugu Charlie
Website: https://www.mesa-africa.org/year-end-internationalsummit-successful-manufacturing-the-next-step/
16-17 November 2023 — 6TH Young Professionals Conference 2023
Hatch Africa, Greenstone, South Africa
Contact: Gugu Charlie
Tel: 011 538-0238
E-mail: gugu@saimm.co.za
Website: http://www.saimm.co.za
21-23 November 2023 — Critical Minerals Conference 2023
Perth, Austraia
Website: https://www.ausimm.com/conferences-and-events/ critical-minerals/
28 November 2023 — MineSafe Online Conference 2023
Contact: Camielah Jardine
Tel: 011 538-0237
E-mail: camielah@saimm.co.za
Website: http://www.saimm.co.za
12-14 March 2024 — Southern African Pyrometallurgy 2024 International Conference
Pyrometallurgical modelling- now and into the future
Misty Hills Conference Centre, Johannesburg, South Africa
Contact: Camielah Jardine
Tel: 011 538-0237
E-mail: camielah@saimm.co.za
Website: http://www.saimm.co.za
19-25 April 2024 — World Tunnel Congress 2024 Shenzhen, China
Website: https://www.wtc2024.cn/
21-23 May 2024 — The 11TH World Conference of Sampling and Blending 2024 Hybrid Conference
Misty Hills Conference Centre, Johannesburg, South Africa
Contact: Camielah Jardine
Tel: 011 538-0237
E-mail: camielah@saimm.co.za
Website: http://www.saimm.co.za
27-31 May 2024 — Nickel-Cobalt-Copper Lithium-Battery Technology-REE 2024 Conference and Exhibition
Perth, Australia
Website: https://www.altamet.com.au/conferences/alta-2024/ 11-13 June 2024 — 15TH International Conference on Industrial Applications of Computational Fluid Dynamics Trondhedim, Norway
E-mail: Jan.E.Olsen@sintef.no Website: https://www.sintef.no/projectweb/cfd2024/ 18-20 June 2024 — Southern African Rare Earths 2ND International Conference 2024 Swakopmund Hotel and Entertainment Centre, Swakopmund, Namibia
Contact: Camielah Jardine
Tel: 011 538-0237
E-mail: camielah@saimm.co.za
Website: http://www.saimm.co.za
3-5 July 2024 — 5TH School on Manganese Ferroalloy Production
Decarbonization of the Manganese Ferroalloy Industry
Boardwalk ICC, Gqeberha, Eastern Cape, South Africa
Contact: Gugu Charlie Tel: 011 538-0238
E-mail: gugu@saimm.co.za
Website: http://www.saimm.co.za
1-3 September 2024 — Hydrometallurgy Conference 2024 Hydrometallurgy for the Future
Hazendal Wine Estate, Stellenbosch, Western Cape, South Africa
Contact: Camielah Jardine
Tel: 011 538-0237
E-mail: camielah@saimm.co.za
Website: http://www.saimm.co.za
The following organizations have been admitted to the Institute as Company Affiliates
3M South Africa (Pty) Limited
acQuire Technology Solutions
AECOM SA (Pty) Ltd
AEL Mining Services Limited
African Pegmatite (Pty) Ltd
Air Liquide (Pty) Ltd
Alexander Proudfoot Africa (Pty) Ltd
Allied Furnace Consultants
AMEC Foster Wheeler
AMIRA International Africa (Pty) Ltd
ANDRITZ Delkor (Pty) Ltd
Anglo Operations Proprietary Limited
Anglogold Ashanti Ltd
Anton Paar Southern Africa (Pty) Ltd
Arcus Gibb (Pty) Ltd
ASPASA
Aurecon South Africa (Pty) Ltd
Aveng Engineering
Aveng Mining Shafts and Underground
Axiom Chemlab Supplies (Pty) Ltd
Axis House Pty Ltd
Bafokeng Rasimone Platinum Mine
Barloworld Equipment -Mining
BASF Holdings SA (Pty) Ltd
BCL Limited
Becker Mining (Pty) Ltd
BedRock Mining Support Pty Ltd
BHP Billiton Energy Coal SA Ltd
Blue Cube Systems (Pty) Ltd
Bluhm Burton Engineering Pty Ltd
Bond Equipment (Pty) Ltd
Bouygues Travaux Publics
Caledonia Mining South Africa Plc
Castle Lead Works
CDM Group
CGG Services SA
Coalmin Process Technologies CC
Concor Opencast Mining
Concor Technicrete
Council for Geoscience Library
CRONIMET Mining Processing
SA Pty Ltd
CSIR Natural Resources and the Environment
Data Mine SA
DDP Specialty Products South Africa (Pty) Ltd
Digby Wells and Associates
DRA Mineral Projects (Pty) Ltd
DTP Mining - Bouygues
Construction
Duraset
EHL Consulting Engineers (Pty) Ltd
Elbroc Mining Products (Pty) Ltd
eThekwini Municipality
Ex Mente Technologies (Pty) Ltd
Expectra 2004 (Pty) Ltd
Exxaro Coal (Pty) Ltd
Exxaro Resources Limited
Filtaquip (Pty) Ltd
FLSmidth Minerals (Pty) Ltd
Fluor Daniel SA (Pty) Ltd
Franki Africa (Pty) Ltd-JHB
Fraser Alexander (Pty) Ltd
G H H Mining Machines (Pty) Ltd
Geobrugg Southern Africa (Pty) Ltd
Glencore
Gravitas Minerals (Pty) Ltd
Hall Core Drilling (Pty) Ltd
Hatch (Pty) Ltd
Herrenknecht AG
HPE Hydro Power Equipment (Pty) Ltd
Huawei Technologies Africa (Pty) Ltd
Immersive Technologies
IMS Engineering (Pty) Ltd
Ingwenya Mineral Processing (Pty) Ltd
Ivanhoe Mines SA
Kudumane Manganese
Resources
Leica Geosystems (Pty) Ltd
Loesche South Africa (Pty) Ltd
Longyear South Africa (Pty) Ltd
Lull Storm Trading (Pty) Ltd
Maccaferri SA (Pty) Ltd
Magnetech (Pty) Ltd
Magotteaux (Pty) Ltd
Malvern Panalytical (Pty) Ltd
Maptek (Pty) Ltd
Maxam Dantex (Pty) Ltd
MBE Minerals SA Pty Ltd
MCC Contracts (Pty) Ltd
MD Mineral Technologies
SA (Pty) Ltd
MDM Technical Africa (Pty) Ltd
Metalock Engineering RSA (Pty) Ltd
Metorex Limited
Metso Minerals (South Africa) Pty Ltd
Micromine Africa (Pty) Ltd
MineARC South Africa (Pty) Ltd
Minerals Council of South Africa
Minerals Operations Executive (Pty) Ltd
MineRP Holding (Pty) Ltd
Mining Projections Concepts
Mintek
MIP Process Technologies (Pty) Limited
MLB Investment CC
Modular Mining Systems Africa (Pty) Ltd
MSA Group (Pty) Ltd
Multotec (Pty) Ltd
Murray and Roberts Cementation
Nalco Africa (Pty) Ltd
Namakwa Sands(Pty) Ltd
Ncamiso Trading (Pty) Ltd
Northam Platinum Ltd - Zondereinde
Opermin Operational Excellence
OPTRON (Pty) Ltd
Paterson & Cooke Consulting Engineers (Pty) Ltd
Perkinelmer
Polysius A Division of Thyssenkrupp
Industrial Sol
Precious Metals Refiners
Rams Mining Technologies
Rand Refinery Limited
Redpath Mining (South Africa) (Pty) Ltd
Rocbolt Technologies
Rosond (Pty) Ltd
Royal Bafokeng Platinum
Roytec Global (Pty) Ltd
RungePincockMinarco Limited
Rustenburg Platinum Mines Limited
Salene Mining (Pty) Ltd
Sandvik Mining and Construction
Delmas (Pty) Ltd
Sandvik Mining and Construction
RSA(Pty) Ltd
SANIRE
Schauenburg (Pty) Ltd
Sebilo Resources (Pty) Ltd
SENET (Pty) Ltd
Senmin International (Pty) Ltd
SISA Inspection (Pty) Ltd
Smec South Africa
Sound Mining Solution (Pty) Ltd
SRK Consulting SA (Pty) Ltd
Time Mining and Processing (Pty) Ltd
Timrite Pty Ltd
Tomra (Pty) Ltd
Trace Element Analysis Laboratory
Traka Africa (Pty) Ltd
Trans-Caledon Tunnel Authority
Administarator
Ukwazi Mining Solutions (Pty) Ltd
Umgeni Water
Webber Wentzel
Weir Minerals Africa
Welding Alloys South Africa
Worley

THEME: DECARBONIZATION OF THE MANGANESE FERROALLOY INDUSTRY
3-4 JULY 2024 - CONFERENCE 5 JULY 2024 - TECHNICAL VISIT
Venue: Boardwalk ICC, Gqeberha, Eastern Cape, South Africa

The energy-intensive industry of manganese (Mn) ferroalloy production is one of the largest producers of direct carbon emissions. The demand for ferromanganese alloy, an additive of steel, follows the demand for steel and continues to increase. This means Mn ore and the production of Mn ferroalloys form an integral part in a future energy sector based on renewable energy technologies. Major structural features of wind turbines, solar panels, and energy storage devices are all made of steel components.
The current industrial practices and state-of-the-art in Mn ferroalloy production are heavily dependent on the use of fossil-based carbon. The 5th SAIMM school on Mn ferroalloy production thus aims to bring together industry and research in order to support smelters and foster collaborations between researchers towards adopting the transition of decarbonizing the ferroalloy industry. The conversation around the topic will shed light on some of the fundamentals and industrial integration of the various decarbonization strategies.

• To create a platform to discuss the environmental impact of carbon emissions from the production of Mn ferroalloys.
• To provide the opportunity for industrialists and researchers to exchange views on the decarbonization of the Mn ferroalloy industry.
• To further enhance collaborations between parties.

• Local and international delegates from the Mn ferroalloy industry or those who support them.
• Existing and potential future industry role players.
• Engineering companies.
• Research/academic institutions.
• Companies providing funding for new Mn projects.

• Commercial production processes and overview of Mn production in South Africa and Europe, including potential new projects.
• Process fundamentals on thermodynamics, slag fundamentals, and reaction kinetics based on various decarbonization strategies.
• CO2 reduction programs in the industry, CO2 capture and energy recovery, Bio-carbon, H2 and, solar energy.
Contact:
Gugu Charlie, Conference co-ordinator | E-mail: gugu@saimm.co.za
Tel: +27 11 538-0238 | Web: www.saimm.co.za

Through GIW® Slurry Pumps, KSB is an innovative partner that provides you with the best and longest wearing slurry solutions. We are your partner over the entire lifecycle of your GIW® slurry pump.
KSB Pumps South Africa is a globally recognized pu mp solutions provider that manufactures globally recognized products locally to the highest quality standards both internationally and locally.
We not only manufacture and service your slurry pumps, we offer total slurry solutions to your industry.
One team - one goal.
KSB Pumps and Valves (Pty) Ltd
Tel: +27-11-876-5600
www.ksb.com/en-za
Level 1 B-BBEE Supplier