

NEP 2020 aligned Digital coding platform included
AI and ML


What is Artificial Intelligence (AI)?
What is Machine Learning (ML)?
How does ML work?
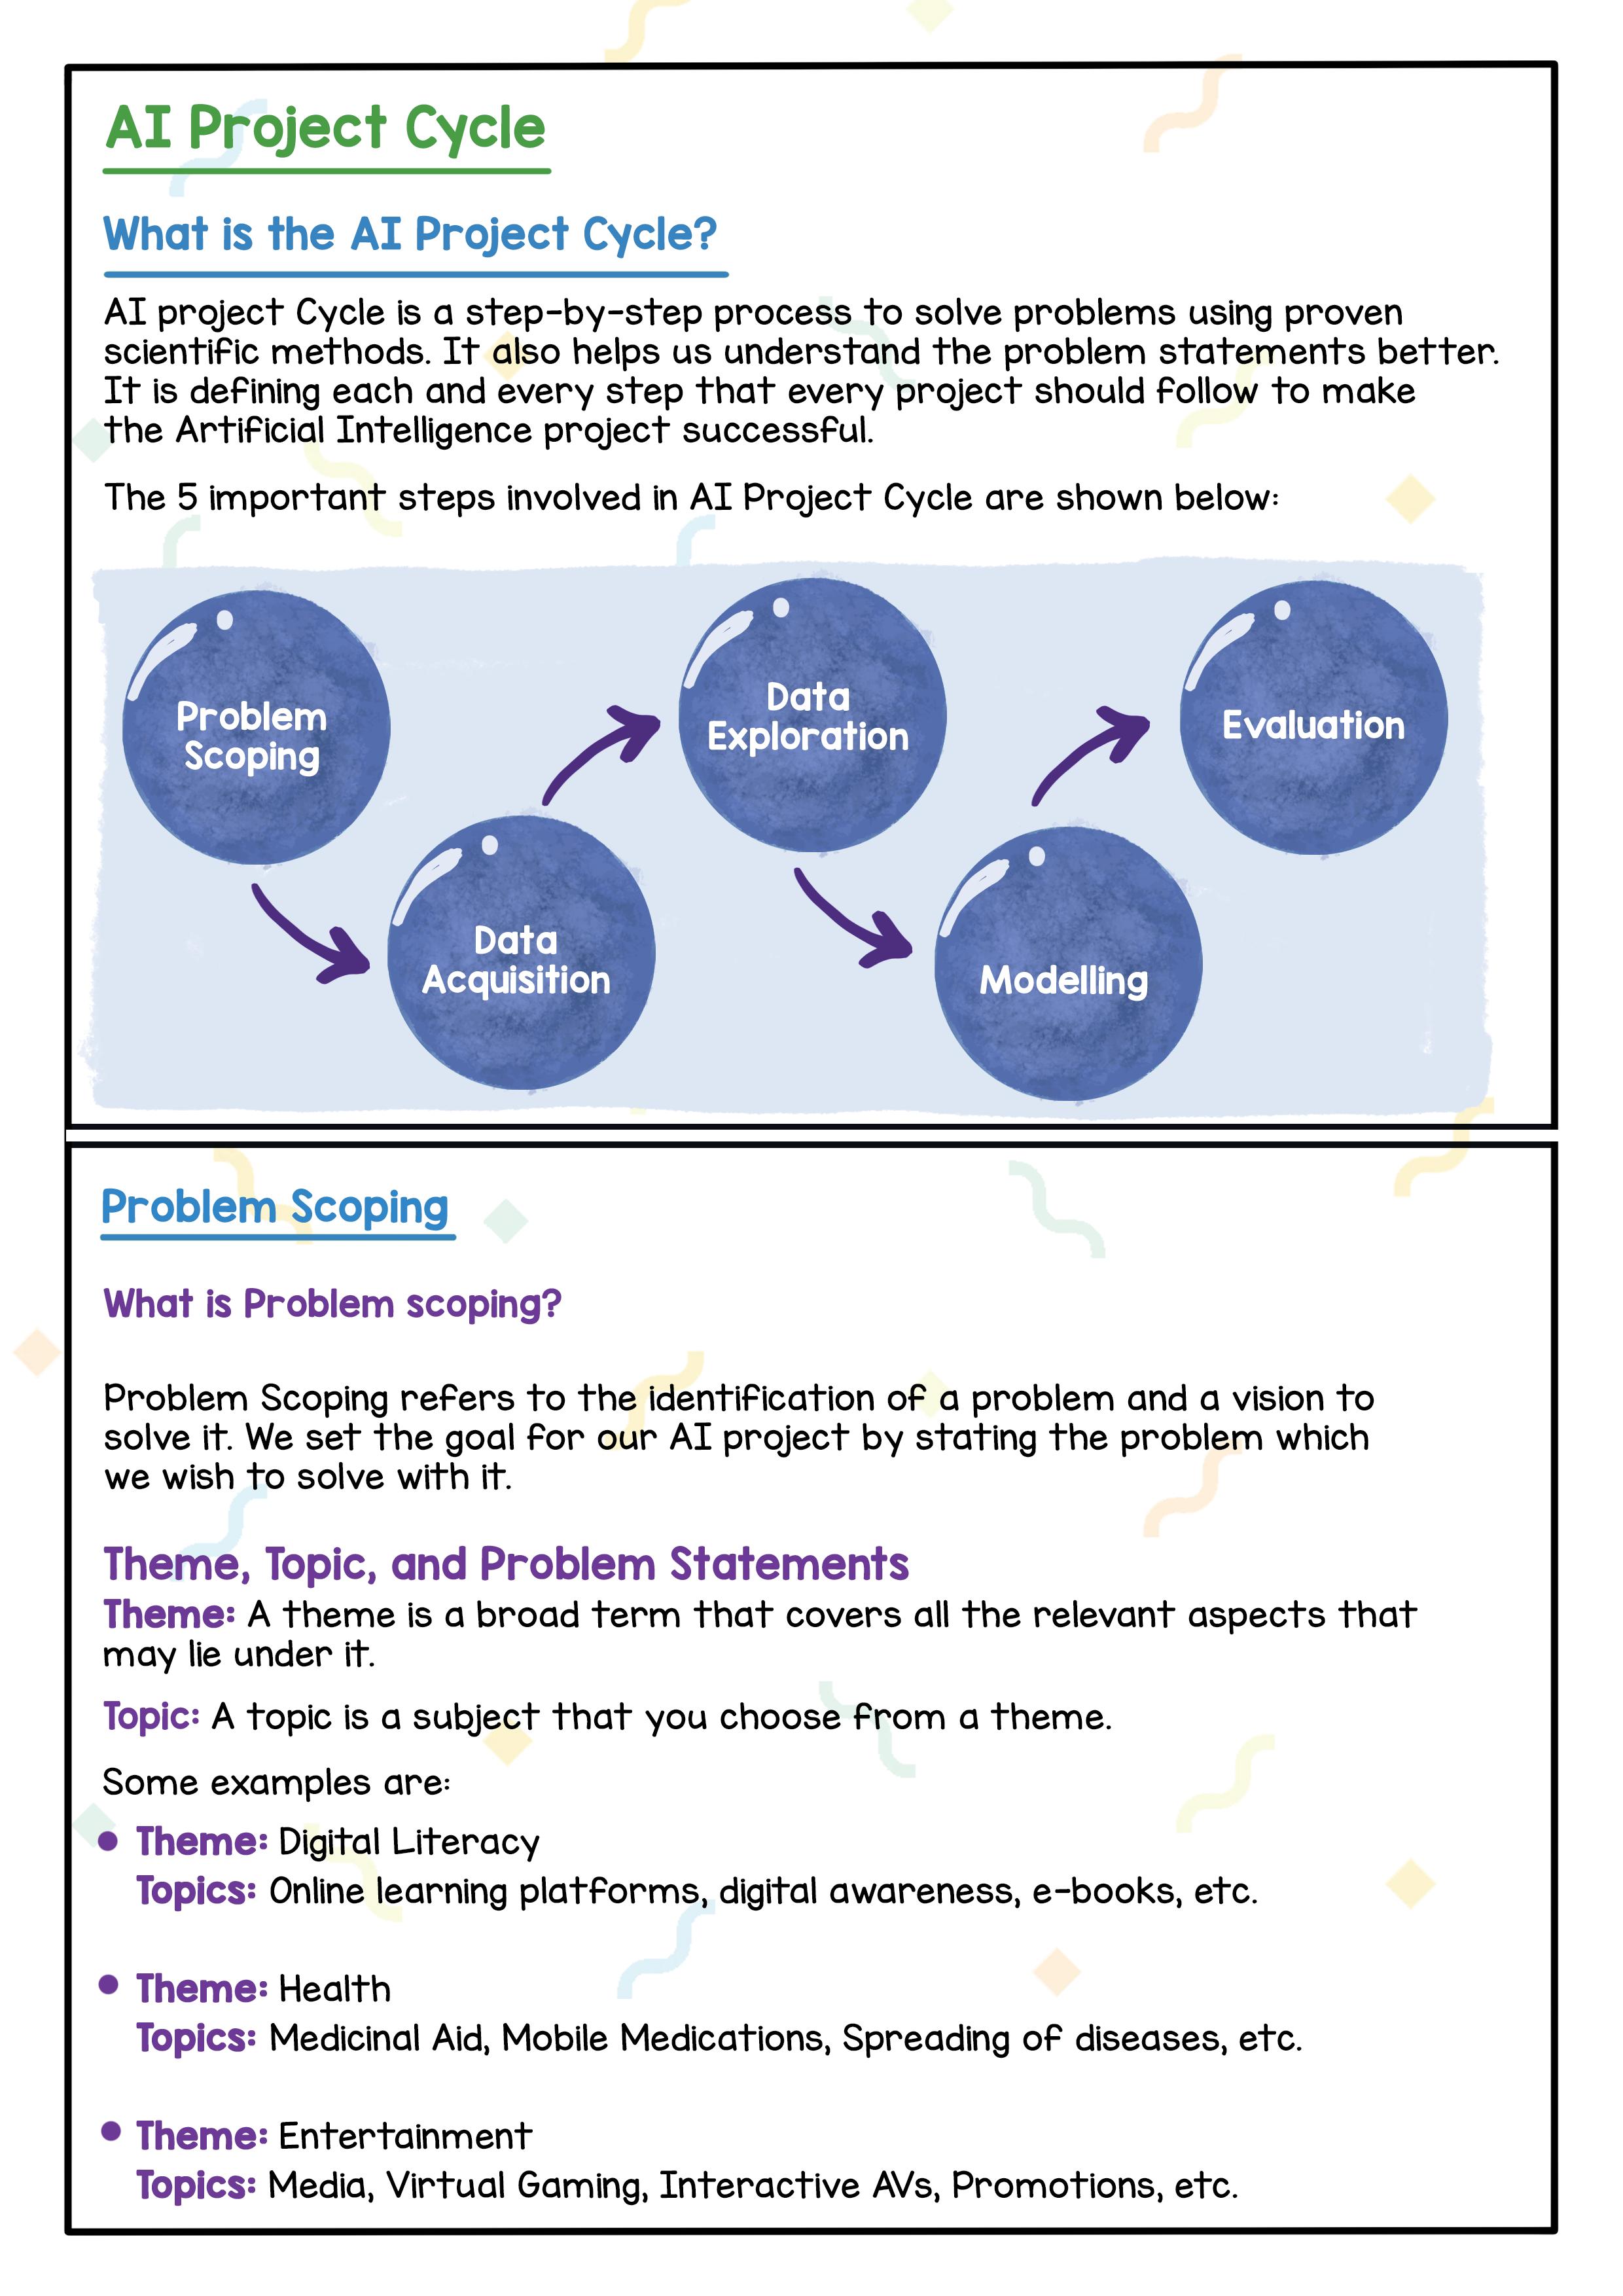
What is the AI Project Cycle?
Acquisition and Processing Best Practices for Data Acquisition
Benefits of Crowdsourcing
What is Data Processing?
Data Preparation and Processing
Benefits of Data Processing
Data Exploration and Visualisation
Descriptive Statistical Analysis
Creating a Pivot Table
Modelling
Introduction to Neural Networks
Neural Network vs Human Nervous System
Neural Network vs Other Traditional Algorithms
AI Model Evaluation
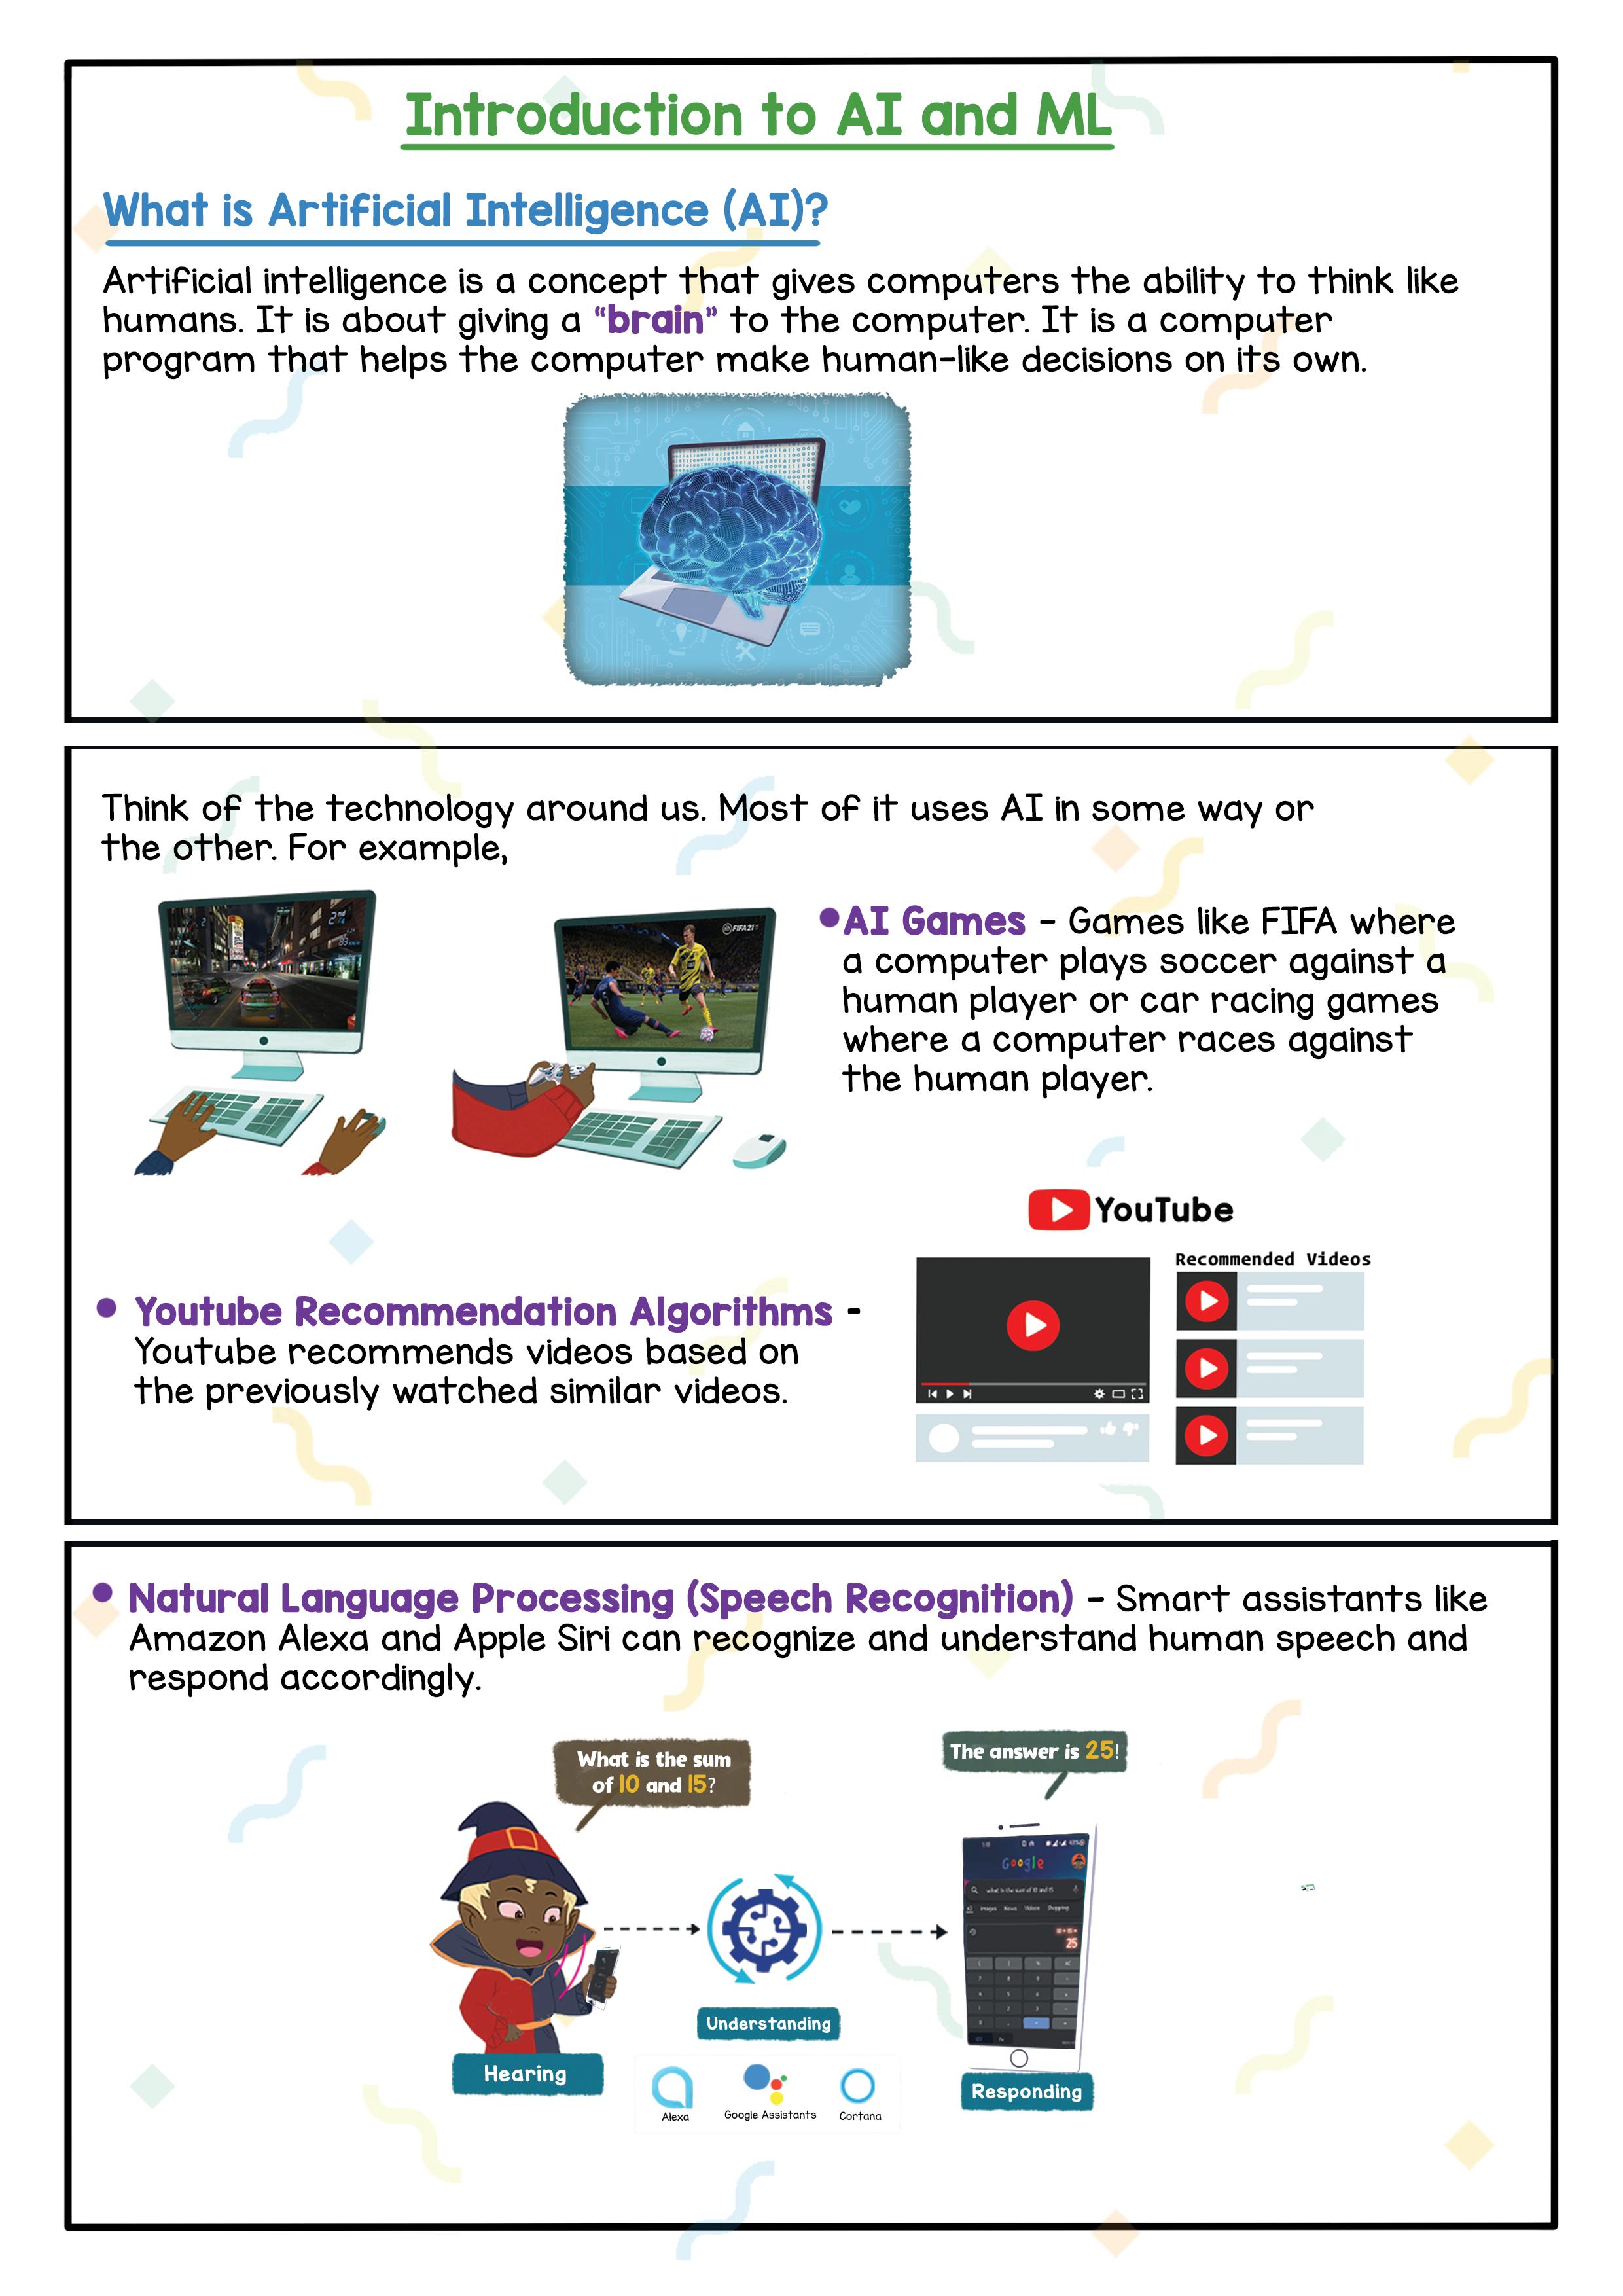
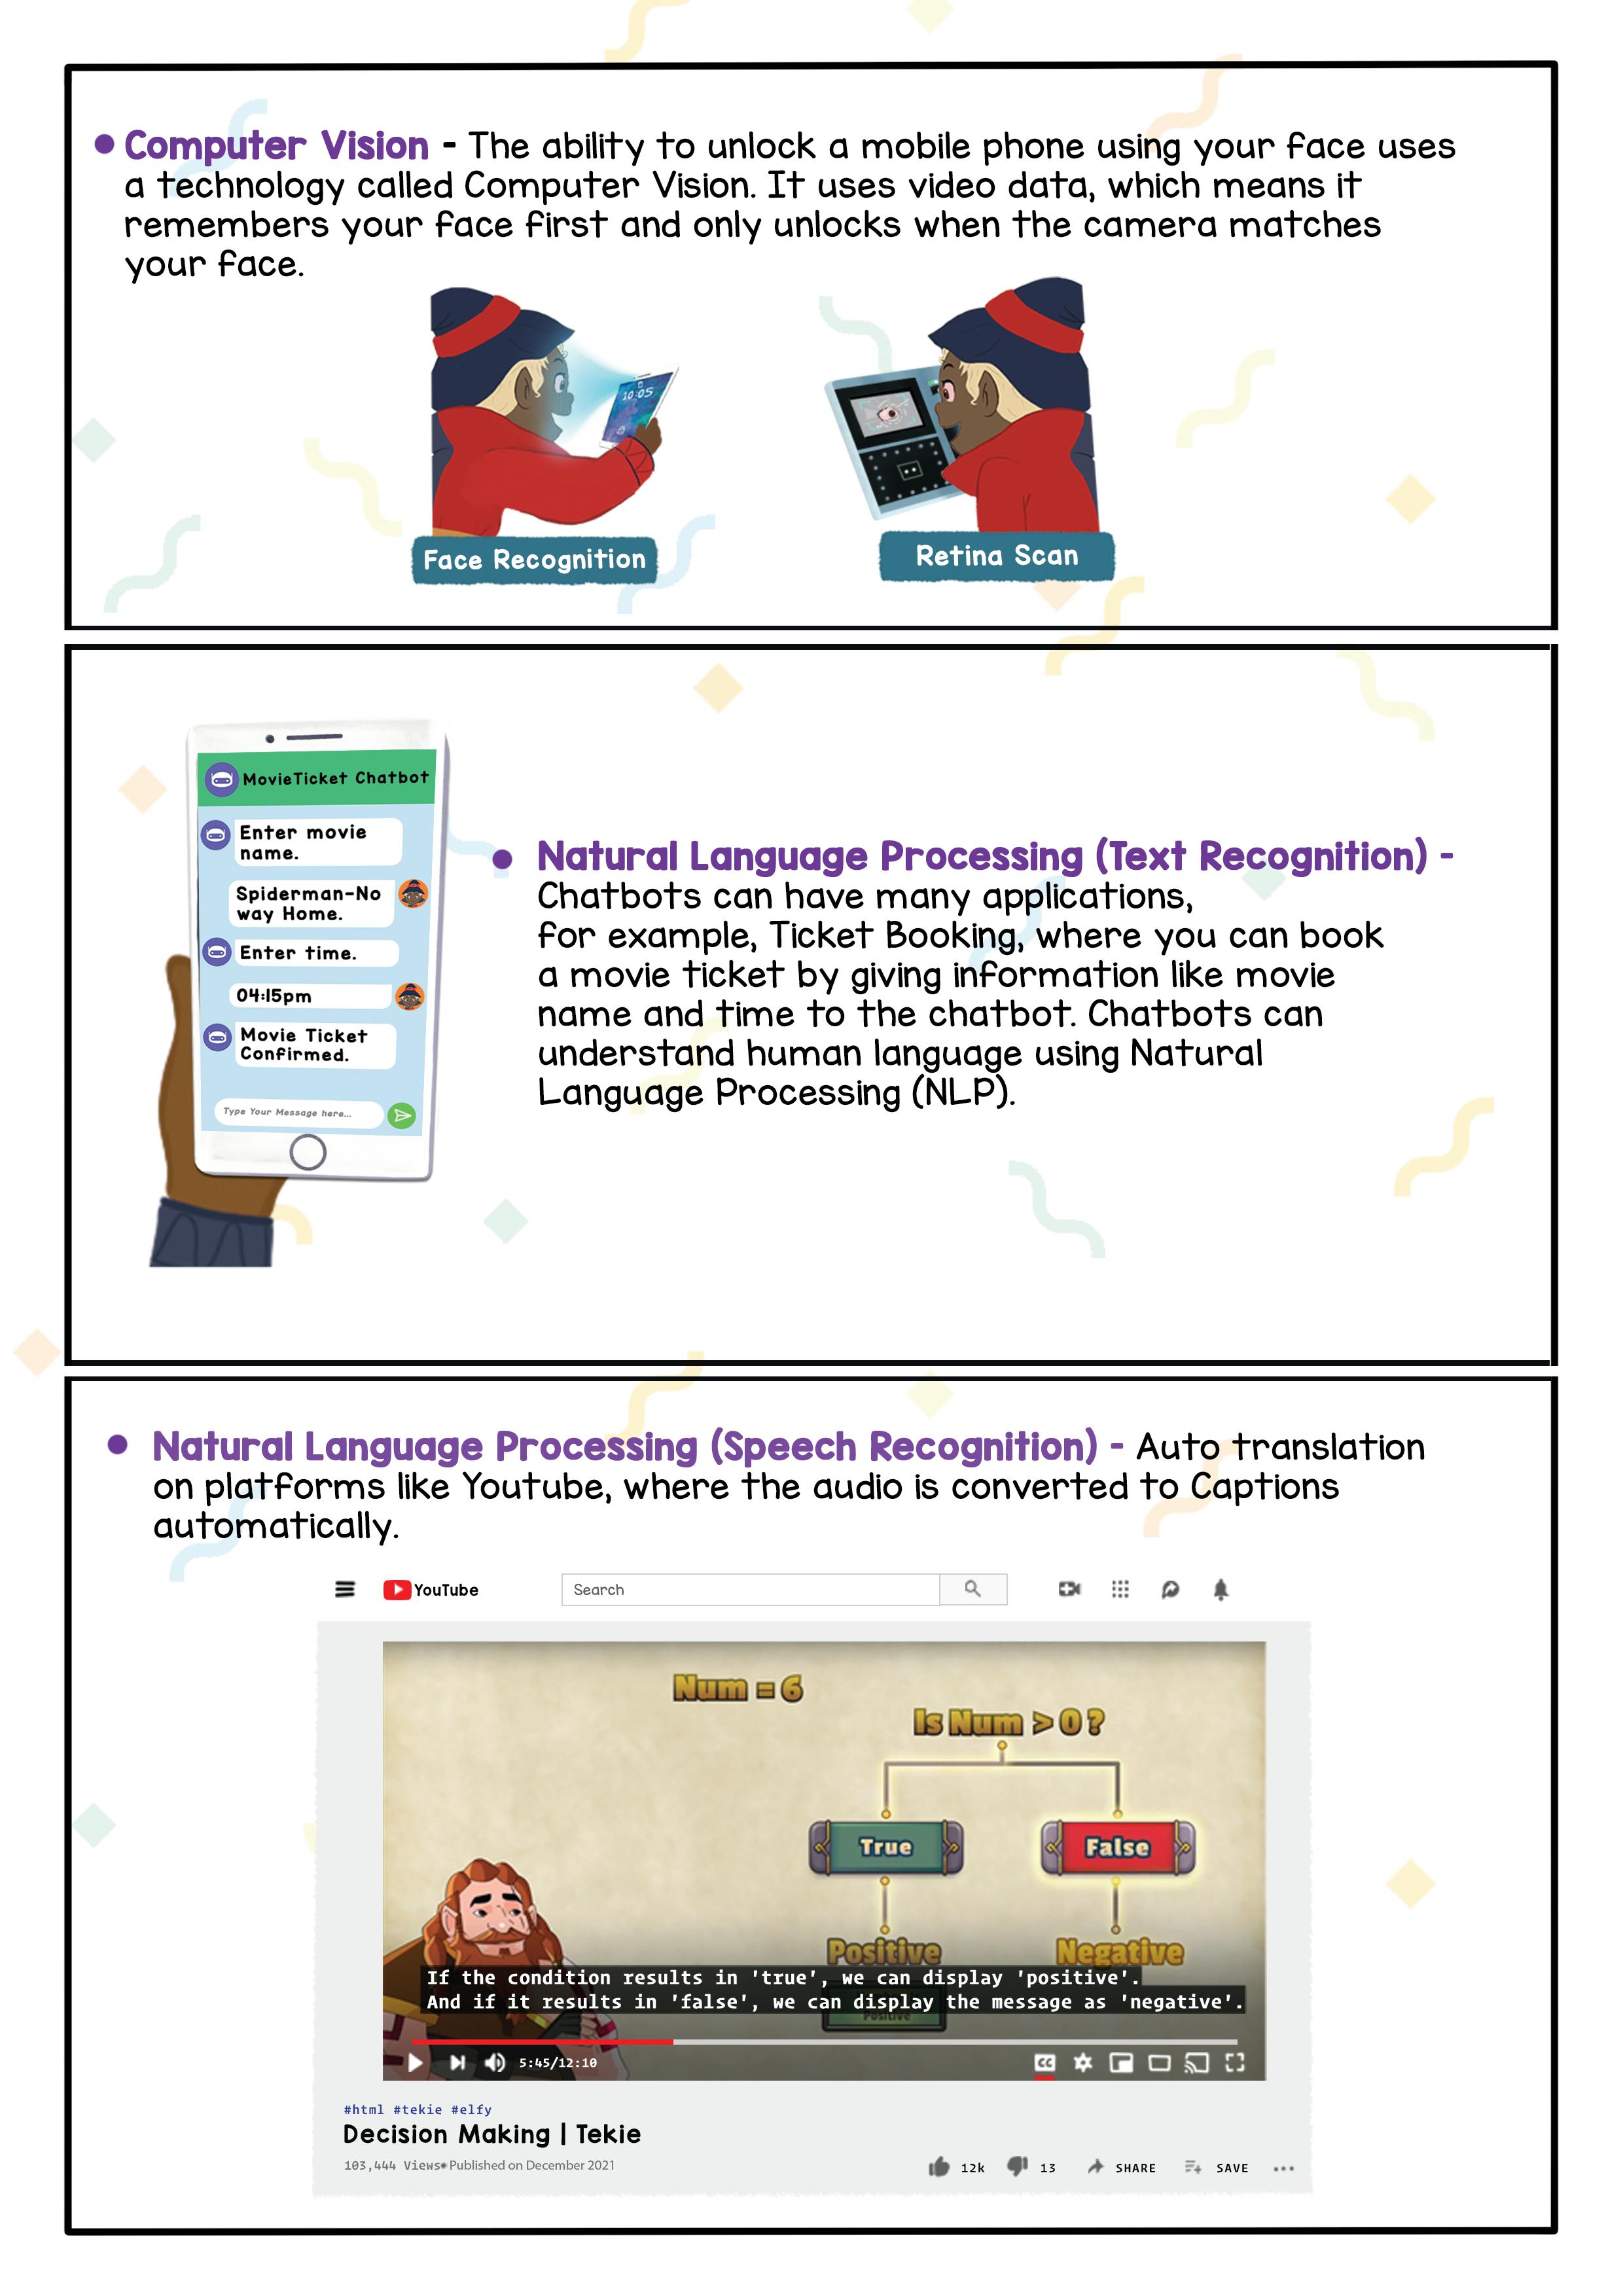
– Chatbots can have many applications, such as ticket booking where you can book a movie ticket by giving information like the movie name and time to the chatbot. Chatbots can understand human language using Natural Language Processing (NLP).
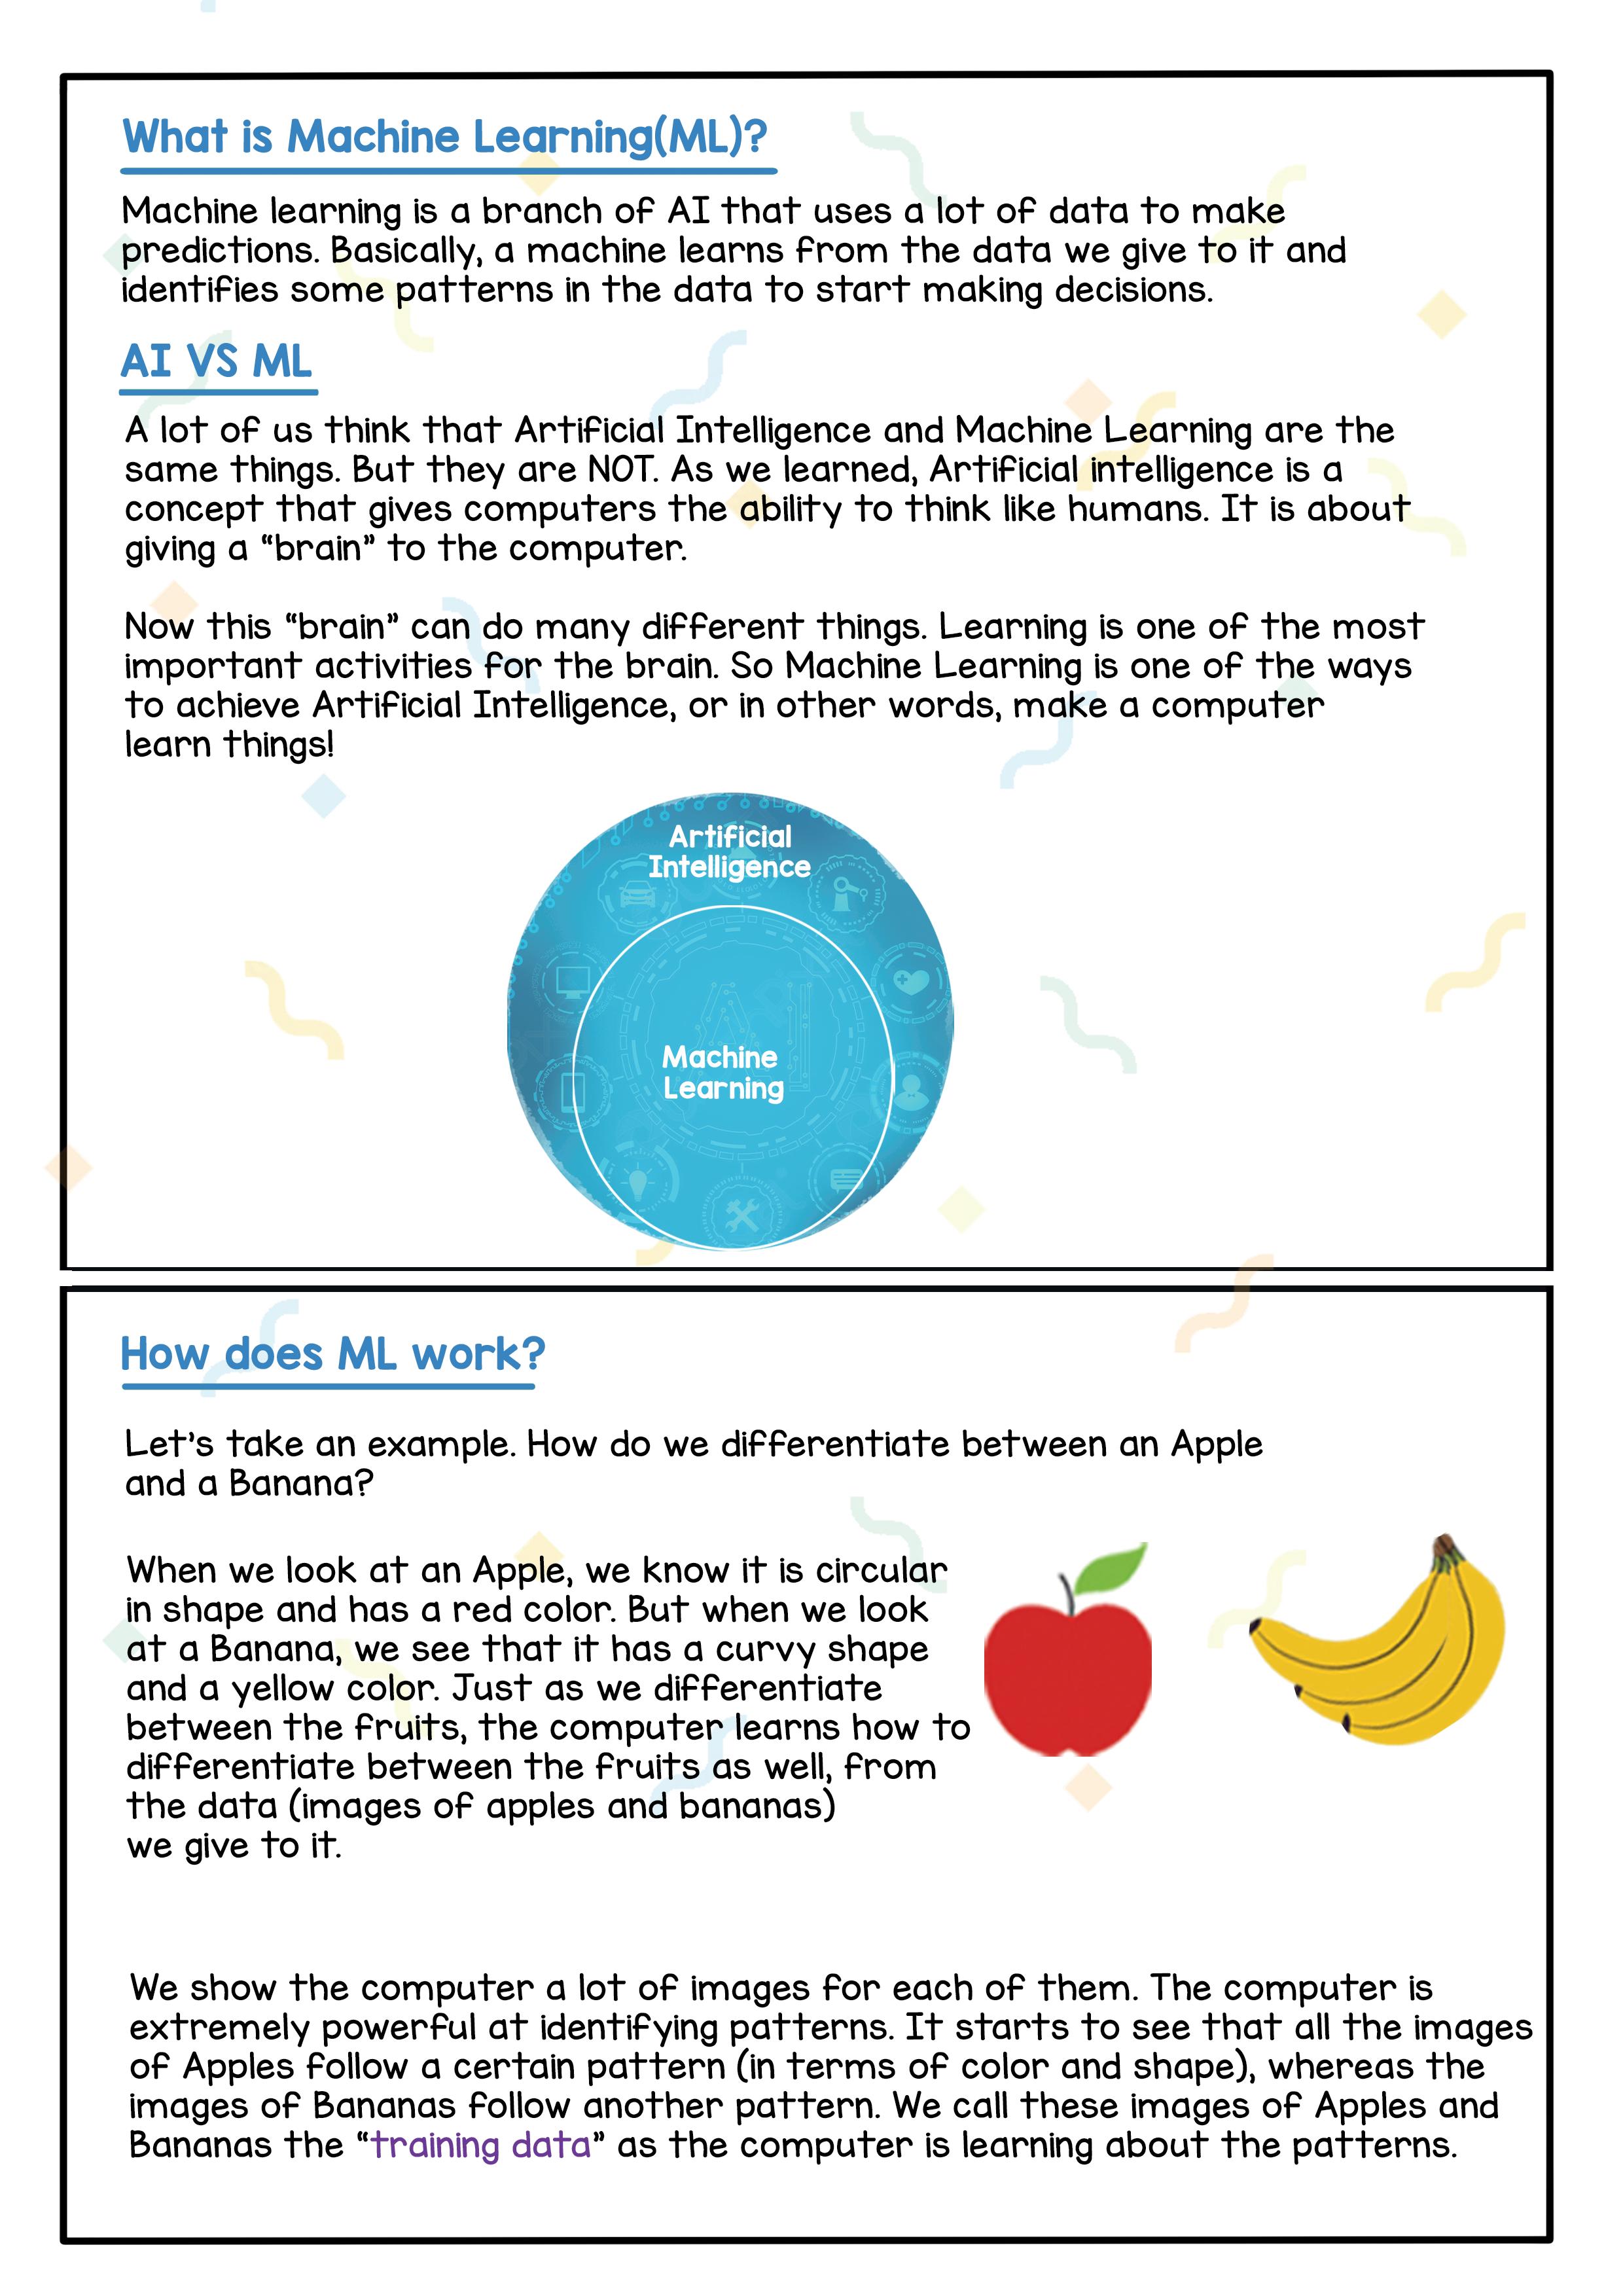
Machine Learning is a branch of AI that uses a lot of data to make predictions. Basically, a machine learns from the data we give to it and identifies some patterns in the data to start making decisions.
A lot of us think that Artificial Intelligence and Machine Learning are the same thing. But they are NOT. As we learned, Artificial Intelligence is a concept that gives computers the ability to think like humans. It is about giving the computer a “brain”.
This “brain” can do many different things. Learning is one of the most important activities for the brain. Machine Learning is one of the ways to achieve Artificial of Intelligence, or in other words, make a computer learn things.
Let’s take an example. How do we differentiate between an Apple and a Banana?
When we look at an Apple, we know it is circular in shape and has a red colour. But when we look at a Banana, we see that it has a curvy shape and a yellow colour. Just as we differentiate between the two types of fruit, the computer learns how to differentiate between the fruit as well, from the data (images of apples and bananas) we give it.
We show the computer a lot of images for each of them. The computer is
Once the computer learns, we use “test data”, which is any new image of an apple or a banana, and give it to a computer, and the computer can identify it based on its learning.
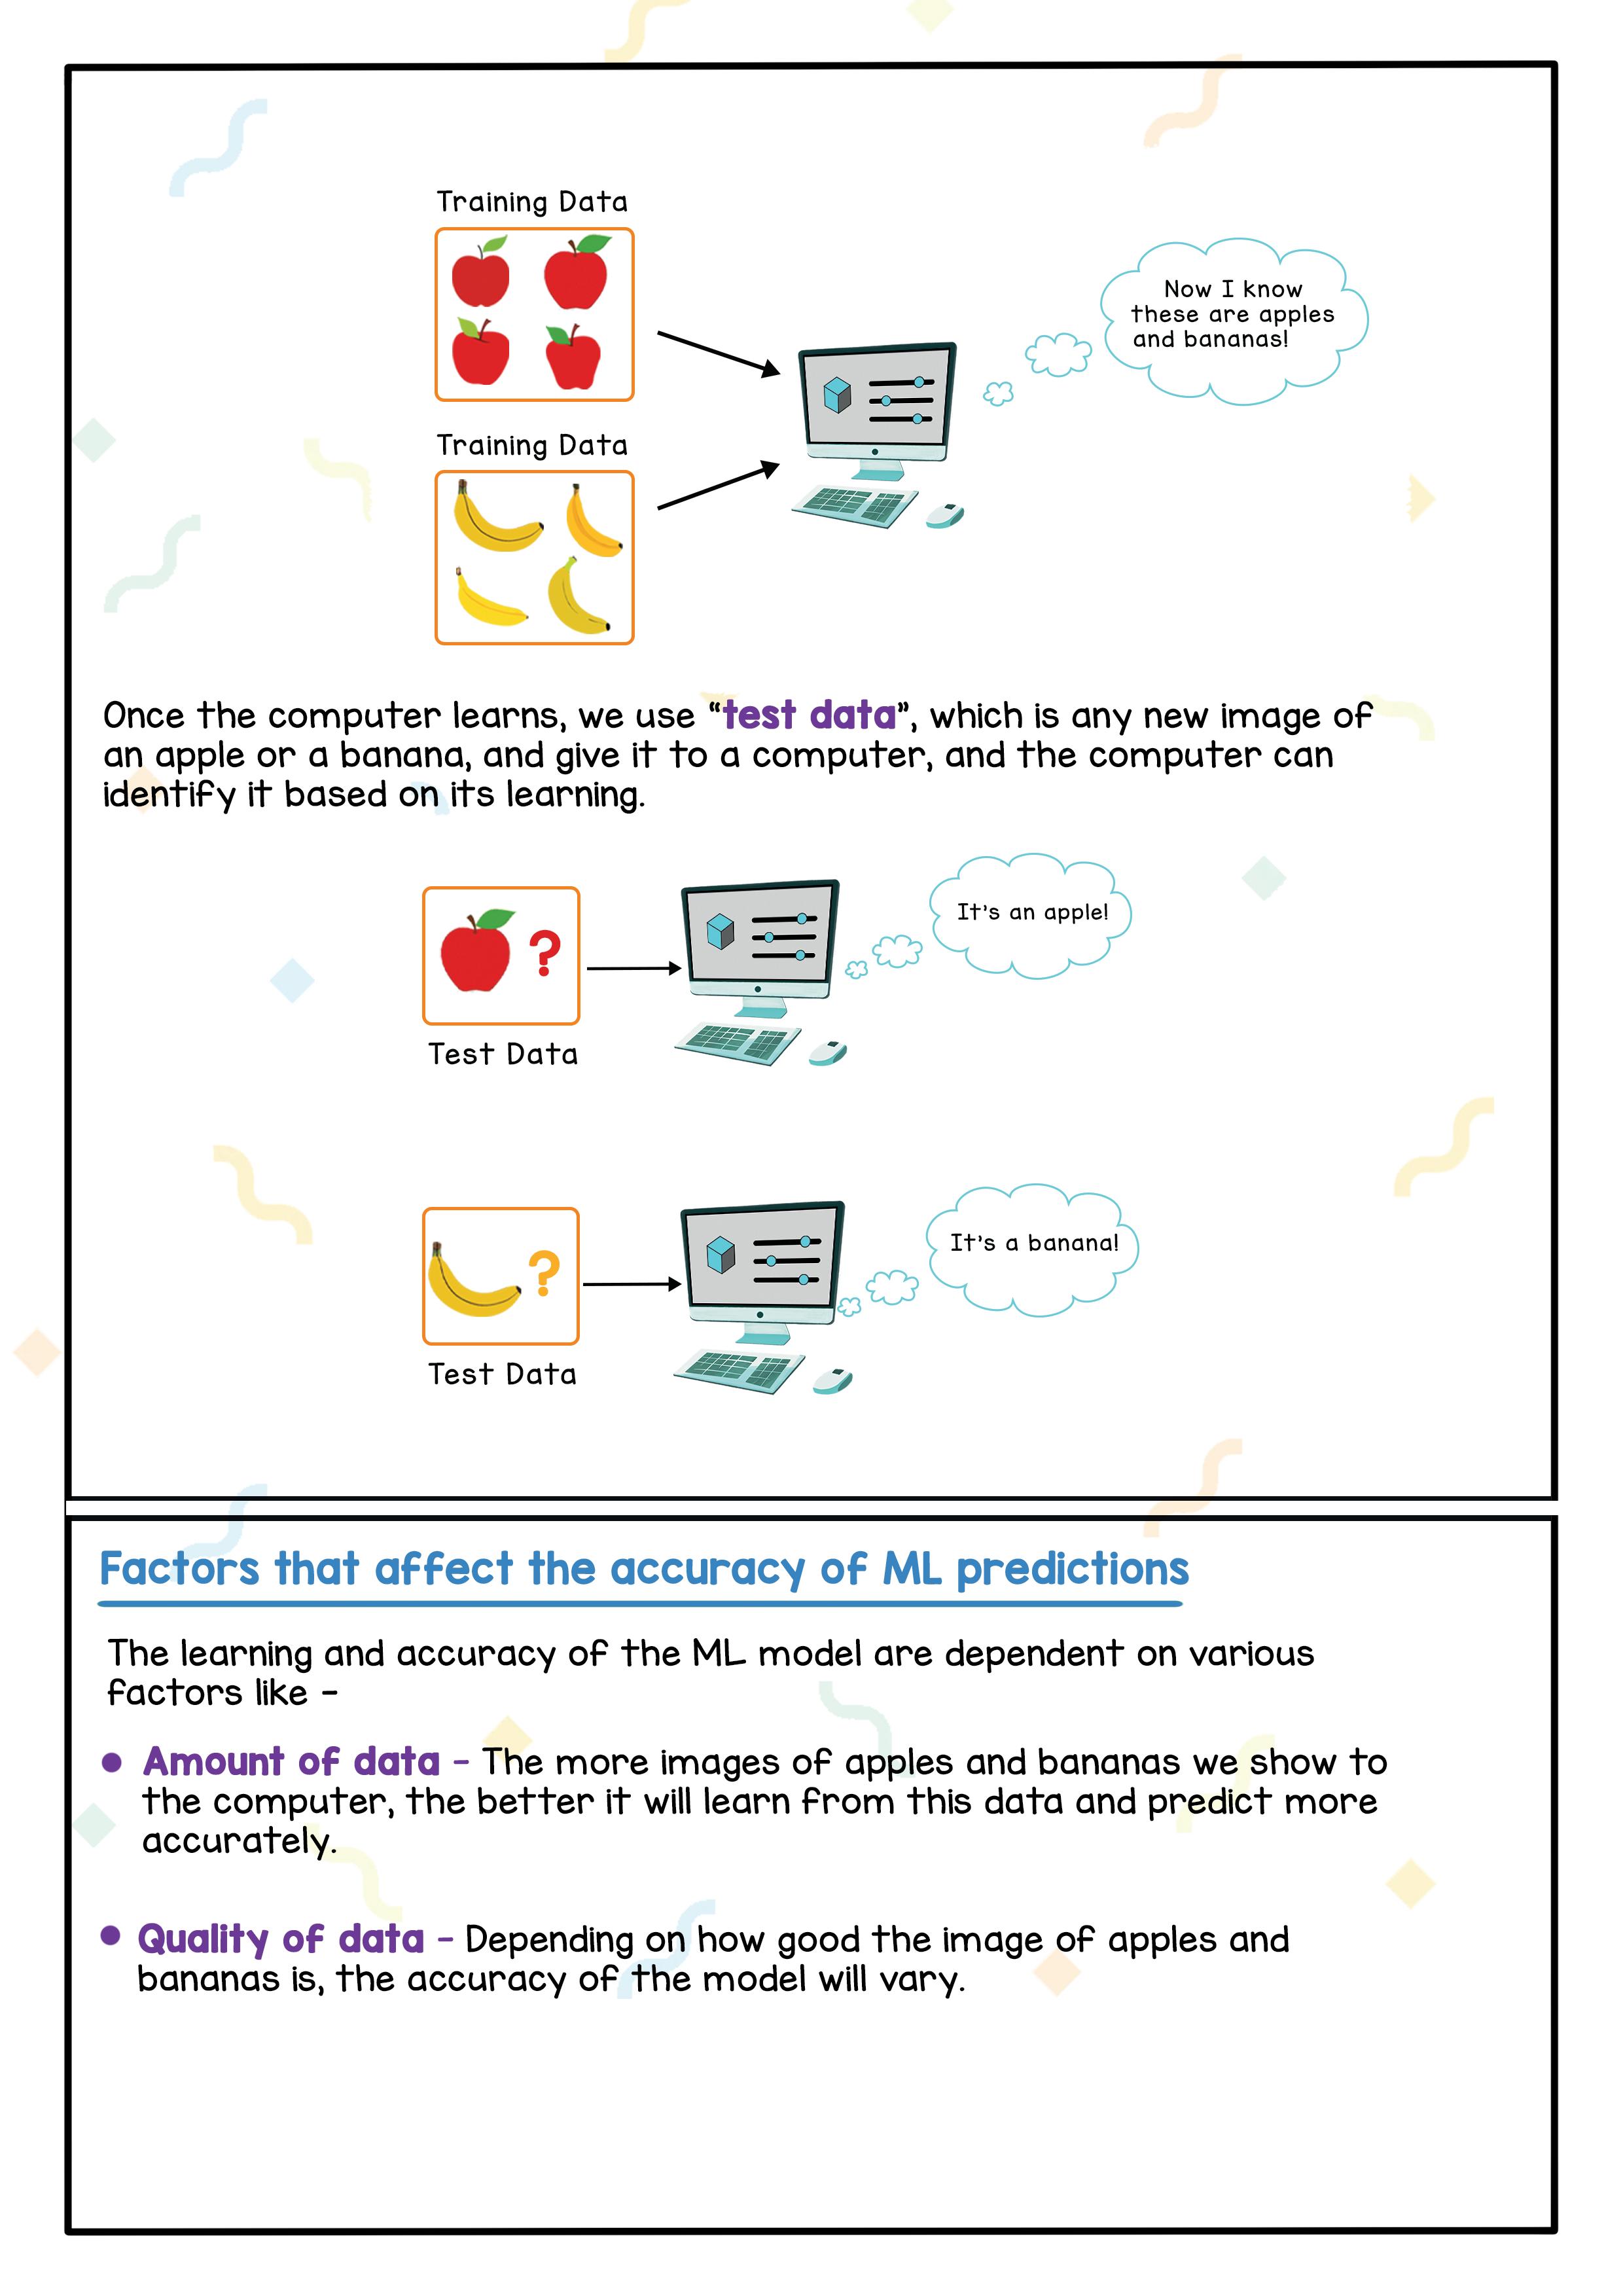
The learning and accuracy of the ML model are dependent on various factors like -
● Amount of Data - The more images of apples and bananas we show to the computer, the better it will learn from this data and predict more accurately.
● Quality of Data - Depending on how good the images of apples and bananas are, the accuracy of the model will vary.
Problem Scoping refers to the identification of a problem and a vision to solve it. We set the goal for our AI project by stating the problem which we wish to solve.
Theme: A theme is a broad term that covers all the relevant aspects that may lie under it.
Topic: A topic is a subject that you choose from a theme.
Some examples are:
● Theme: Digital Literacy
Topics: Online Learning Platforms, Digital Awareness, E-books, etc.
● Theme: Health
Topics: Medicinal Aid, Mobile Medications, Spreading of Diseases, etc.
● Theme: Entertainment
Topics: Media, Virtual Gaming, Interactive AVs, Promotions, etc.
Problem Statements: Problem statements refer to making lists of the problems which come under our topic that we find in our daily-life scenarios. We can go online and research the problem statements around our chosen topic.
For example:
● Topic: Online Learning Platforms
● List of problems:
■ Internet Connection strength
■ Online Insecurity
■ Lack of face-to-face communication
■ Insufficient Computer and Technical knowledge
■ Distraction Issues, etc.
● Topic: Health
● List of problems:
■ High cost of treatments
■ Nursing and Physician shortages
■ Low quality of care
■ Personalised medicines, etc.
Thus, the process of defining our problem statements starts with identifying the theme on a very broad level, then choosing a relevant topic, and then listing multiple problem statements within it.
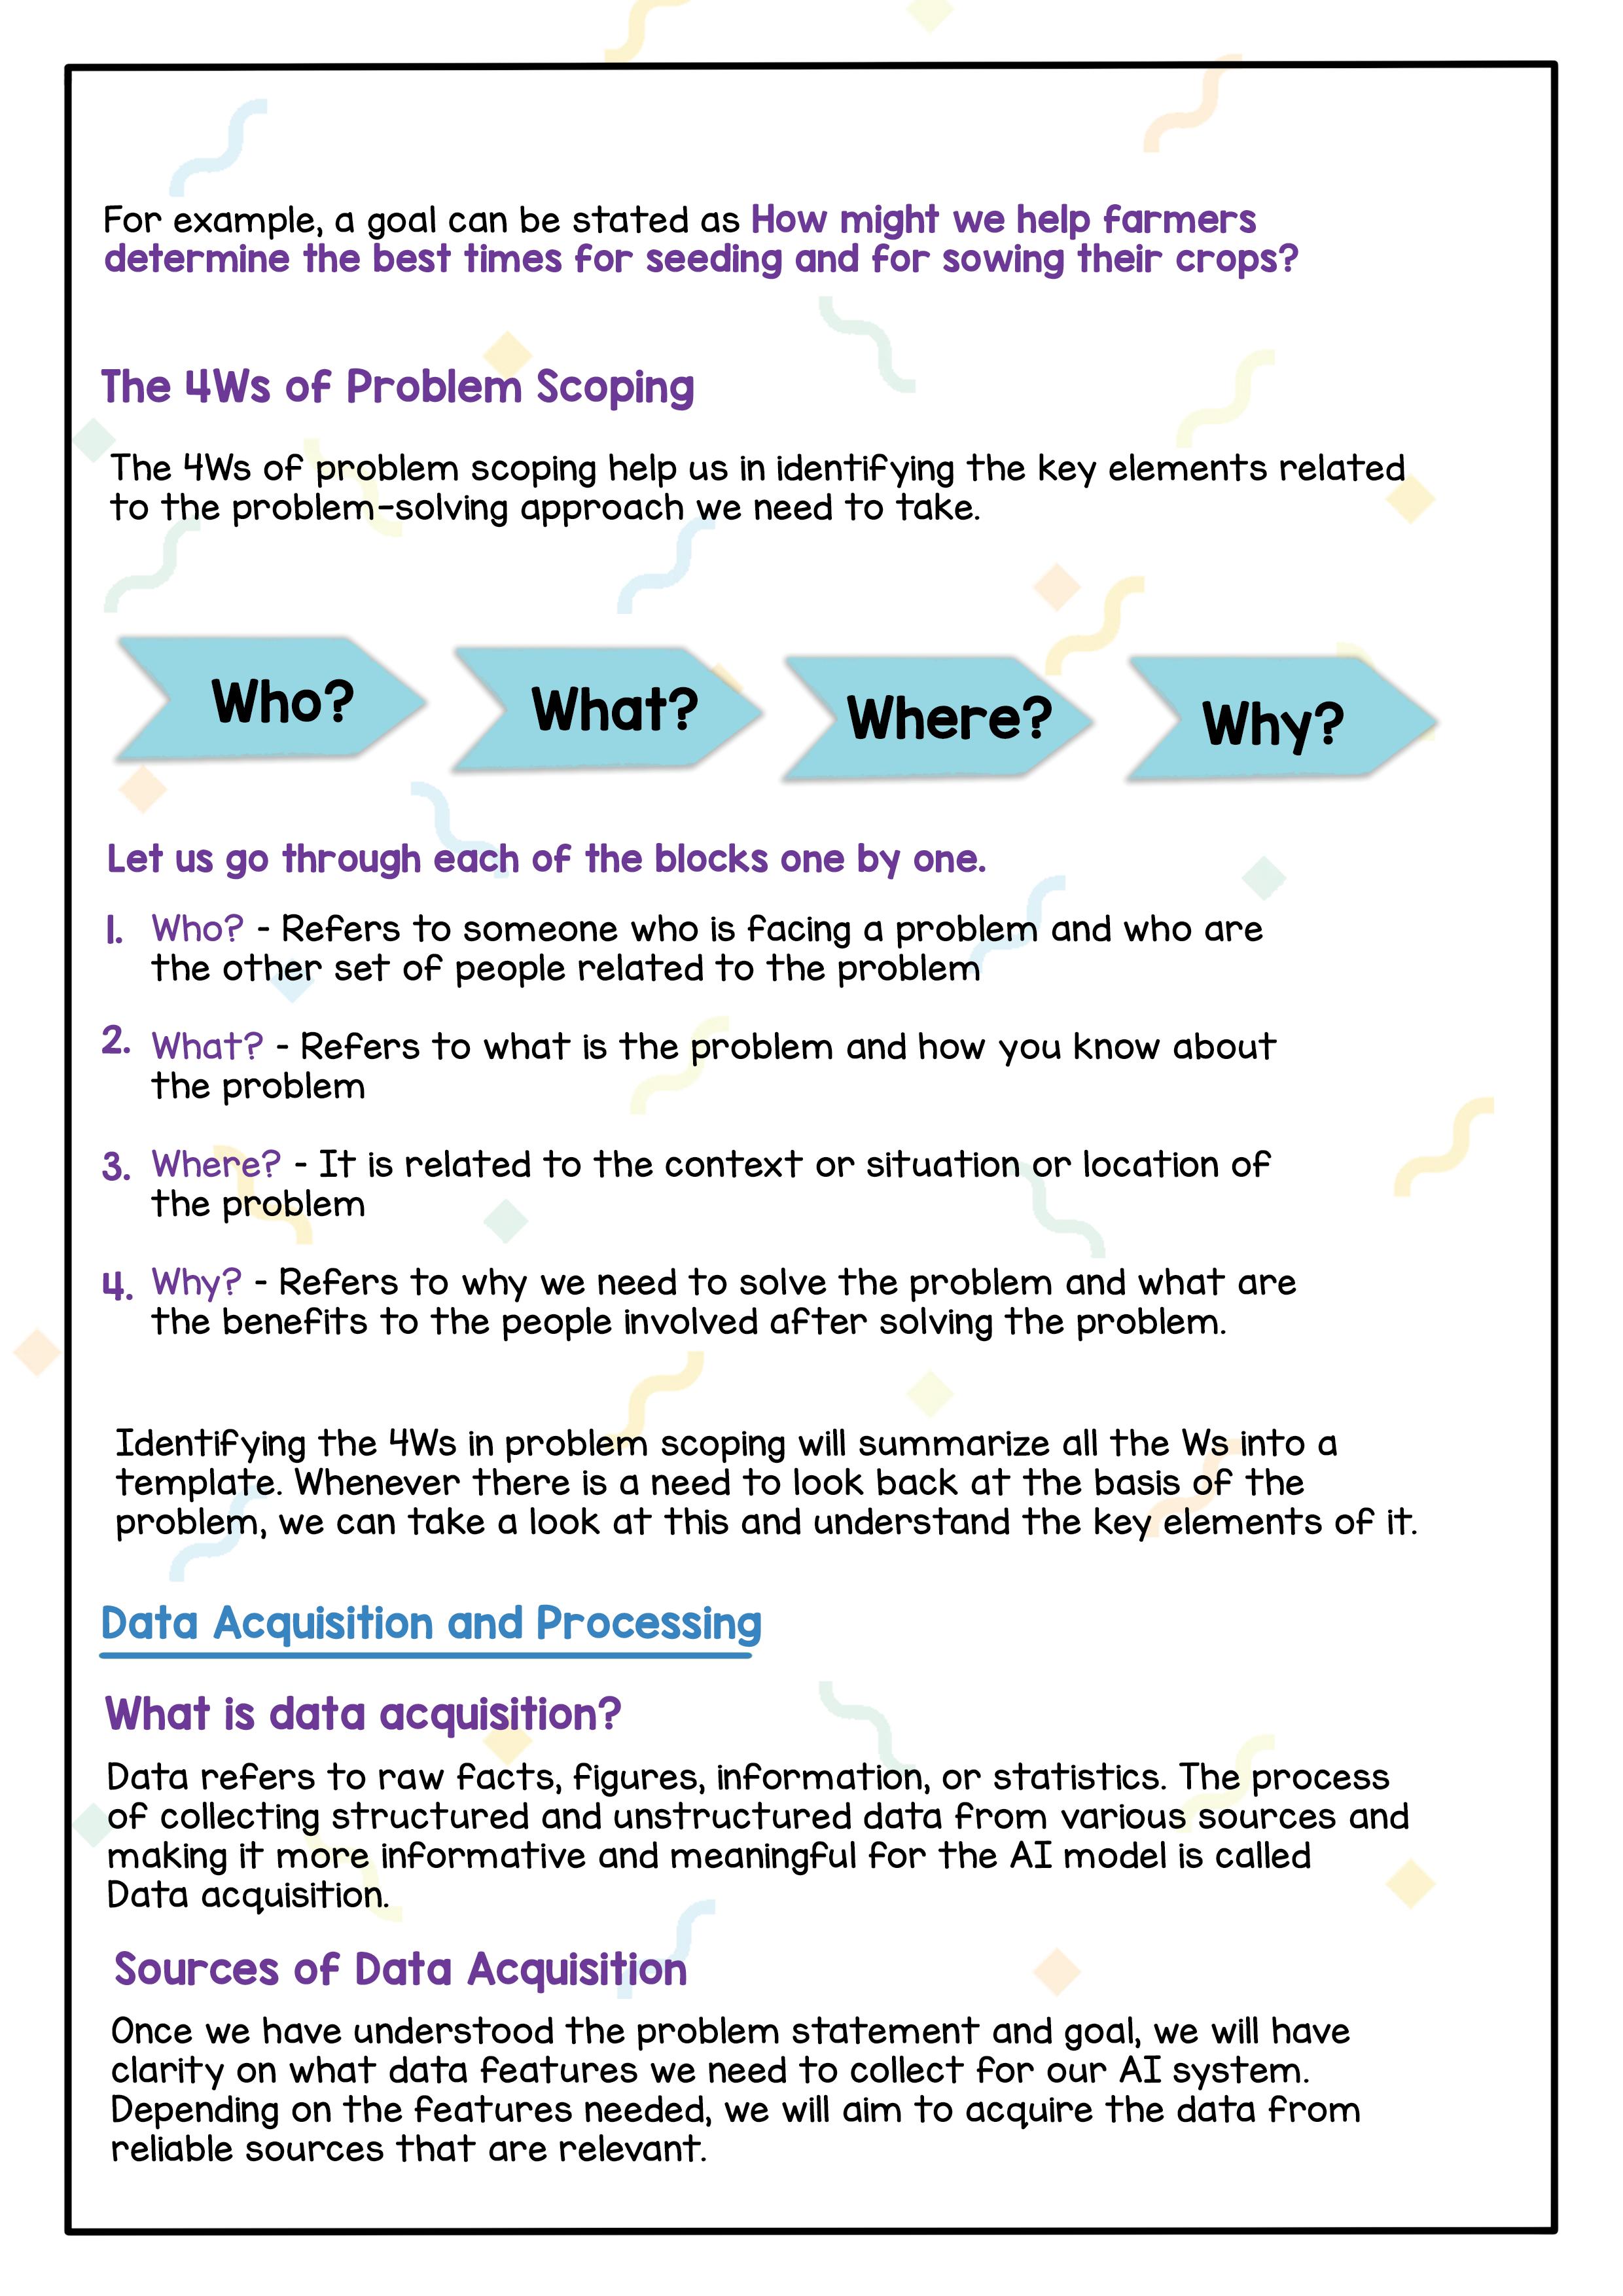
Let us go through each of the blocks one by one.
1. Who? - Refers to someone who is facing a problem and to the other people related to the problem.
2. What? - Refers to what the problem is and how you know about it.
3. Where? - Refers to the context, situation or location of the problem.
4. Why? - Refers to why we need to solve the problem and what benefits involved people will receive after solving the problem.
Identifying the 4Ws in problem scoping will summarise all the Ws into a template. Whenever there is a need to look back at the basis of the problem, we can take a look at this and understand the key elements of it.

What is Data Acquisition?
Data refers to raw facts, figures, information, or statistics. The process of collecting structured and unstructured data from various sources and making it more informative and meaningful for the AI model is called Data Acquisition.
● Surveys: Surveys are used to collect data from the target audience and gather insights into their preferences, opinions, choices, and feedback. Once the data is collected, we can generate reports and discover hidden insights through various analysis methods.
● Web Scraping: Web Scraping is an automatic method to obtain large amounts of data from websites. Most of this data is unstructured data which is then converted into structured data in a spreadsheet or a database so that it can be used in various applications.
● Sensors: Sensors are devices that take live information and turn it into digital data, which can then be fed into a computer to analyse the data and turn it into information.
● Cameras: Devices such as surveillance cameras help capture a large number of video and photographic data points. Around the world, authorities are using data collected to improve the management of parking spaces, police resources, traffic patterns, and so forth.
● API (Application Program Interface): APIs allow users to obtain structured data from websites quickly, by requesting it directly from the database of a particular website. Many large websites, like Google, Twitter, Facebook, Stack Overflow, etc. have APIs that allow you to access their data in a structured format.
Sometimes, we use the internet and try to acquire data for our projects from random websites. Such data might not be authentic as its accuracy cannot be proved. Due to this, it becomes necessary to do the following:
1. Find a reliable source of data from where some authentic information can be taken.
2. The data which we collect should be open-source and not someone’s property.
3. Extracting private data can be an offense.
4. One of the most reliable and authentic sources of information is the open-source websites hosted by the government.
5. Government portals have general information collected in a suitable format which can be downloaded and used wisely.
The process of Data Acquisition involves searching for the datasets that can be used for data analysis and to train the Machine Learning models. It isn’t a simple process as the amount and quality of the data impact on the performance of the AI model.
There are various approaches for acquiring data, 4 out of which are mentioned below:
The first approach to acquiring data is Data Discovery. It involves searching for new datasets available on the web and incorporating data lakes.
The next approach for Data Acquisition is Data Augmentation. To augment means to make something greater by adding to it, so in the context of Data Acquisition, we are essentially enriching the existing data by adding more external data.
In this approach, the data is generated when we do not have enough external data. The data is generated manually or automatically. Crowdsourcing is the standard technique for manual construction of the data. Automatic techniques are available as well to generate synthetic datasets.
Crowdsourcing is the standard technique where a large number of people across the internet are assigned tasks to collect the required data to form a dataset.
Crowdsourced labour can be paid or voluntary depending on the project. Yet, in the Artificial Intelligence world, Crowdsourced labour is mostly a paid service. Crowdsourcing often includes a wide variety of tasks such as text translation and surveys, the importance of crowdsourcing for AI is increasing.
The AI lifecycle contains tedious processes such as data preparation, model building, and testing; hence more people choose the crowdsourcing approach to reduce the cost and time required to build the AI system.
Diversity: We have already learned that the amount and quality of the data have a good impact on AI. Crowdsourcing enables us to gather data and information from individuals coming from different backgrounds, regions, races, and ethnicities. This allows us to have more generalised data that covers a larger set of a population. This helps us to reduce the bias in the AI systems that we create.
Faster Project Rollout: With crowdsourcing platforms, we can increase the workforce to a larger number within a short span of time. With this, the speed of data collection and eventually the AI project cycle increases and we can launch the AI products faster.
Cost-efficient and Quality Work: People involved in Crowdsourcing are paid based on the work done and not on a contract with fixed terms. This helps us save money while encouraging the crowd to provide quality work.
As the data is extracted from various sources, we need to combine it to be used. The data acquired is typically in raw format and not suitable for immediate consumption and analysis. Thus data processing plays a major role in AI Project Cycle. Data Processing means taking the raw form of data and converting it into a more readable format (graphs, documents, etc.), giving it the form and context necessary to be interpreted easily by computers and humans.
Once the desired data is acquired we will take it through certain steps to make it ready and usable. The specifics of the data preparation process vary according to the project requirements and type of data, but the framework remains largely the same as given below.
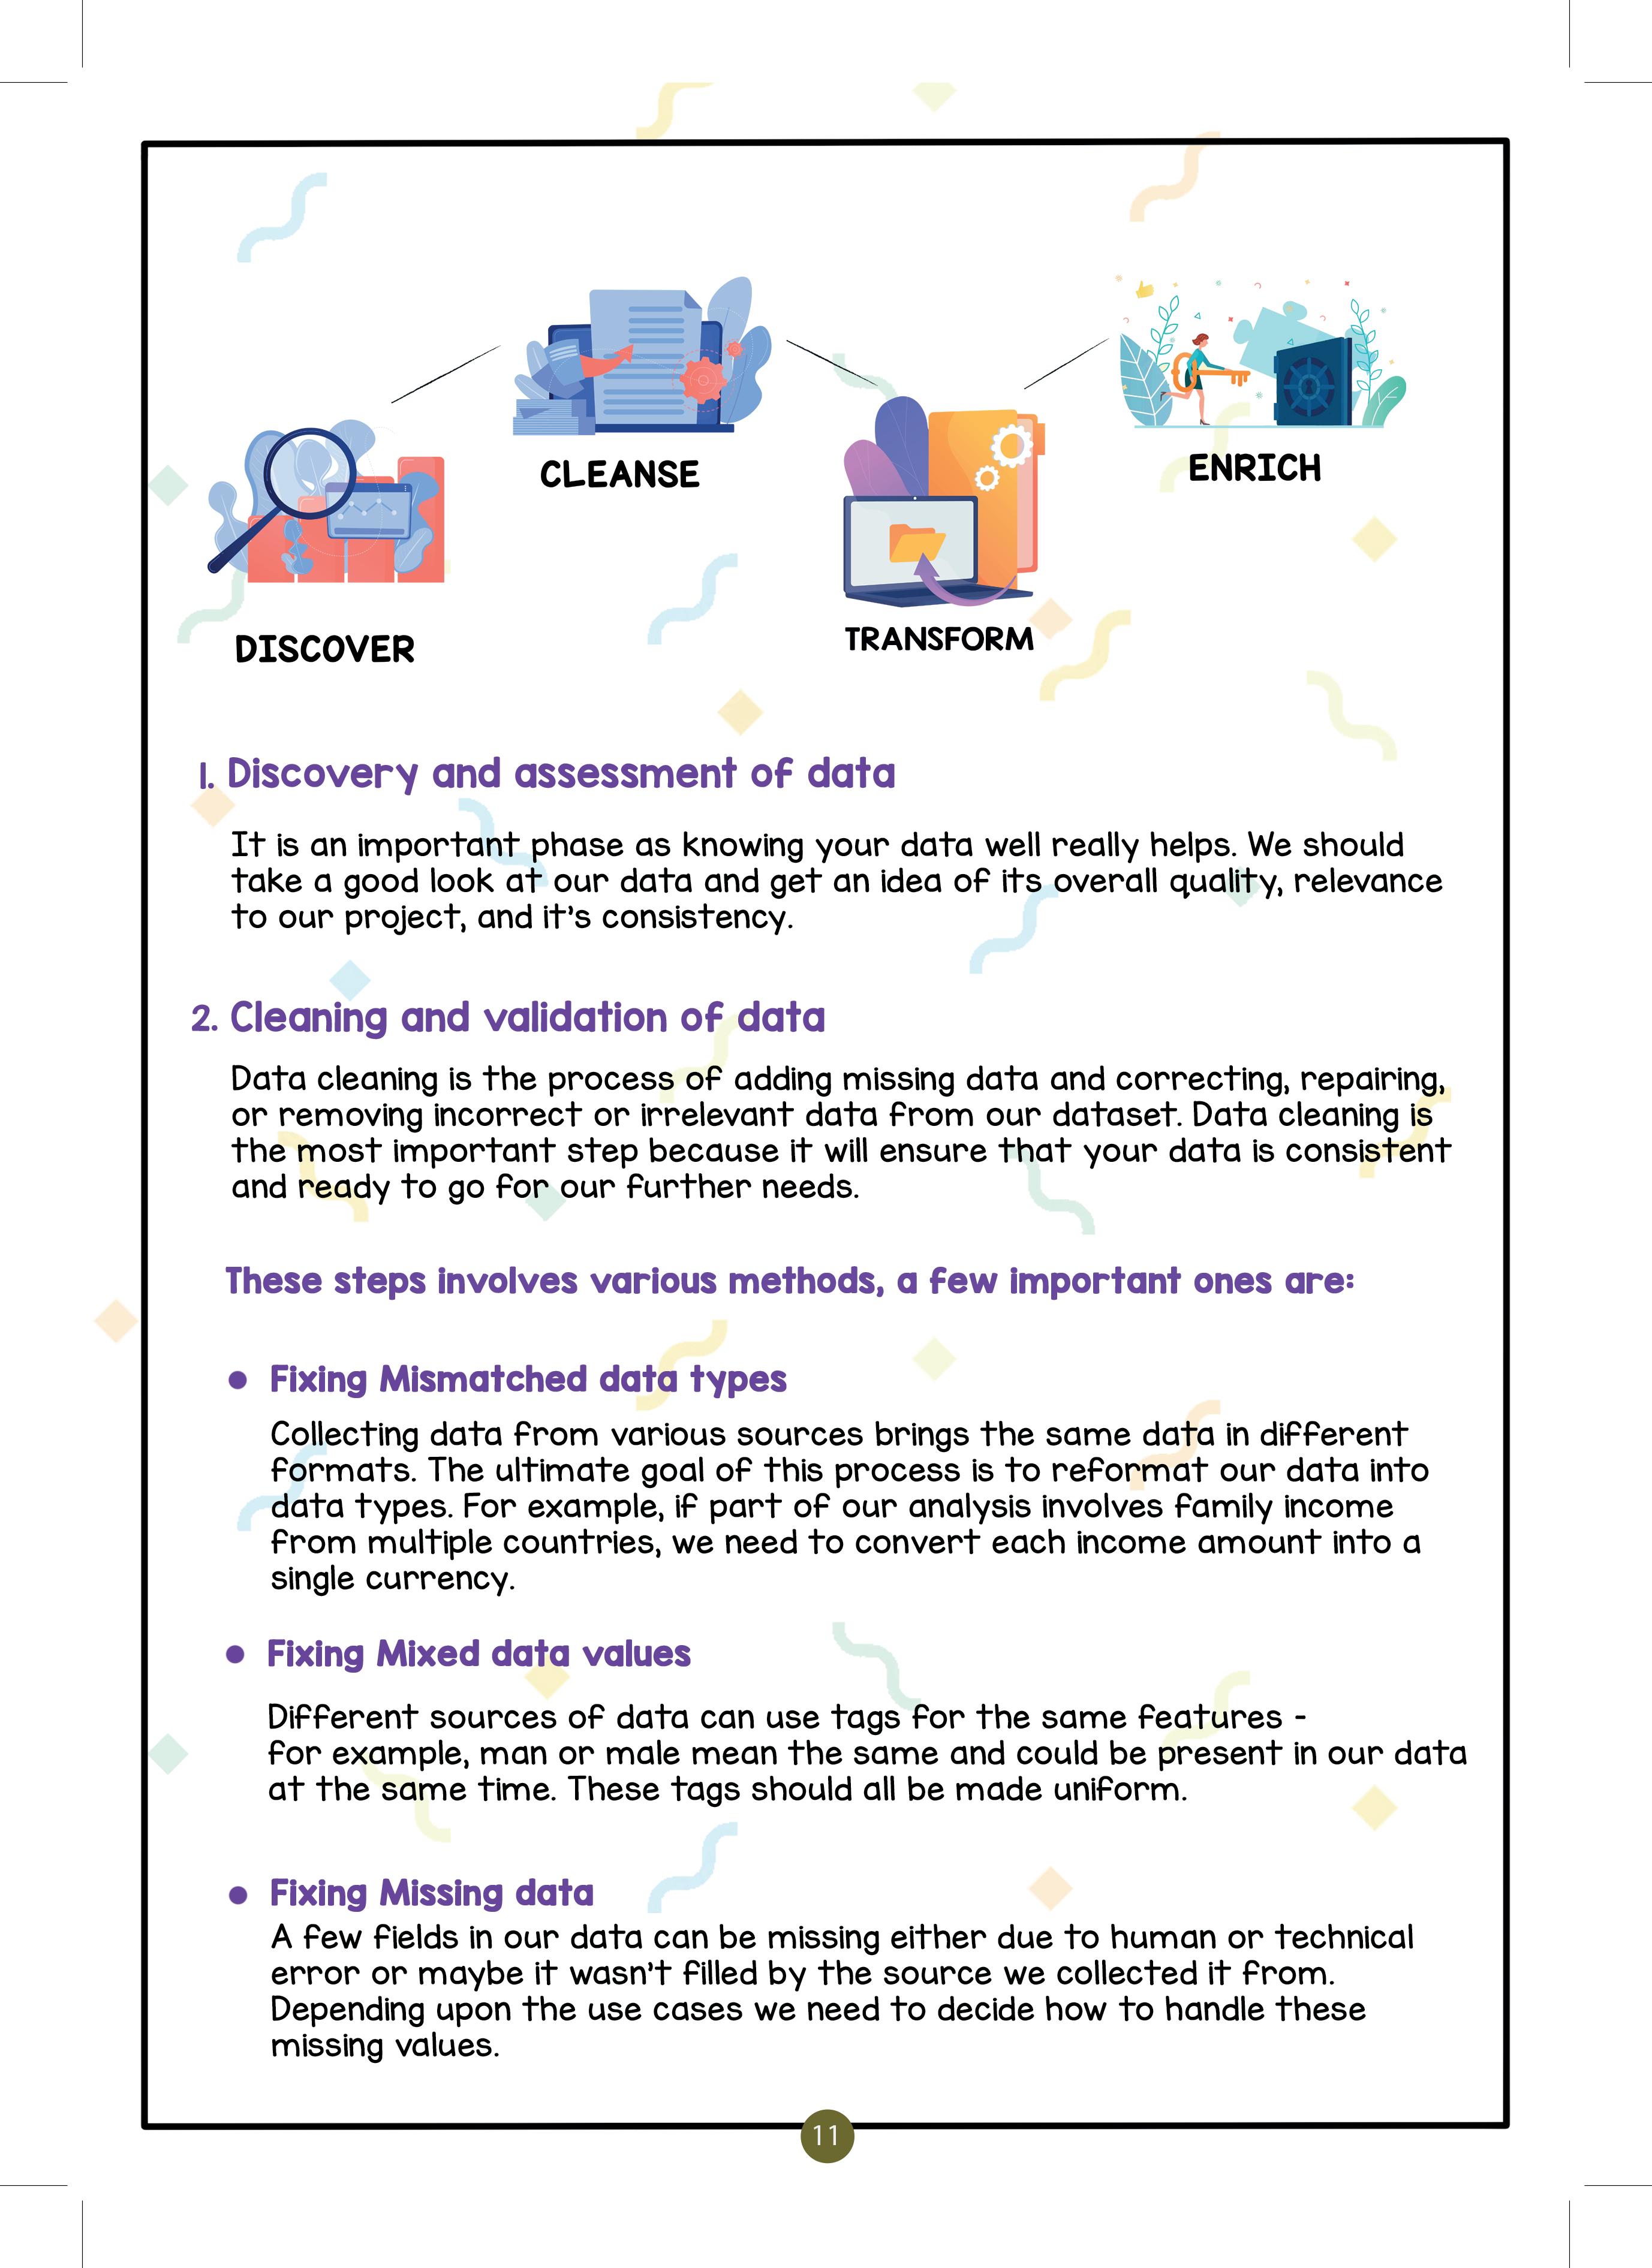
It is an important phase as knowing your data well really helps. We should take a good look at our data and get an idea of its overall quality, relevance to our project, and consistency.
Data Cleaning is the process of adding missing data and correcting, repairing, or removing incorrect or irrelevant data from our dataset. Data Cleaning is the most important step because it will ensure that our data is consistent and ready to go for our further needs.
The steps to clean and validate data involve various methods. Some of the important methods are:
● Fixing Mismatched Data Types
Collecting data from various sources brings the same data in different formats. The ultimate goal of this process is to reformat our data into data types. For example, if part of our analysis involves family income from multiple countries, we need to convert each income amount into a single currency.
Different sources of data can use tags for the same featuresfor example, man or male mean the same and could be present in our data at the same time. These tags should all be made uniform.
A few fields in our data can be missing either due to human or technical error or maybe it wasn’t filled in by the source we collected it from. Depending upon the usecases we need to decide how to handle these missing values.
Data transformation means converting the data into a unified, readable and usable format for a well-defined outcome or to make the data more easily understood by a wider audience.
Data Enriching means adding value to the data. It can also mean creating new fields or columns from existing ones by doing some processing on them. This process further enhances and optimises data sets as needed.
● Fix errors quickly - Data preparation helps catch errors before processing. After data has been removed from its original source, these errors become more difficult to understand and correct.
● Produce top-quality data - Cleaning and reformatting datasets ensures that all data used in the analysis will be of high quality.
● Make better business decisions - Higher quality data that can be processed and analysed more quickly and efficiently leads to more timely, efficient, and high-quality business decisions.
Data Exploration is the process of arranging the gathered data uniformly for a better understanding. Data can be arranged in the form of a table, plotting a chart or making a database. If anyone wants to make some sense out of the acquired data, they have to work on some patterns. Thus, to analyse the data, we need to visualise it in some user-friendly format so that we can:
● Quickly get a sense of the trends, relationships and patterns contained within the data.
● Define strategy for which model to use at a later stage.
● Communicate the insights to others effectively.
Descriptive Statistics summarise and organise the characteristics of a dataset such as the average of one feature (e.g. age), or the relation between two
2. Median: Median is the point that divides the entire data into two equal halves. One-half of the data is less than the median, and the other half is greater than the same.
Median is calculated by first arranging the data in either ascending or descending order.
● If the number of observations is odd, the median is given by the middle observation in the sorted form.
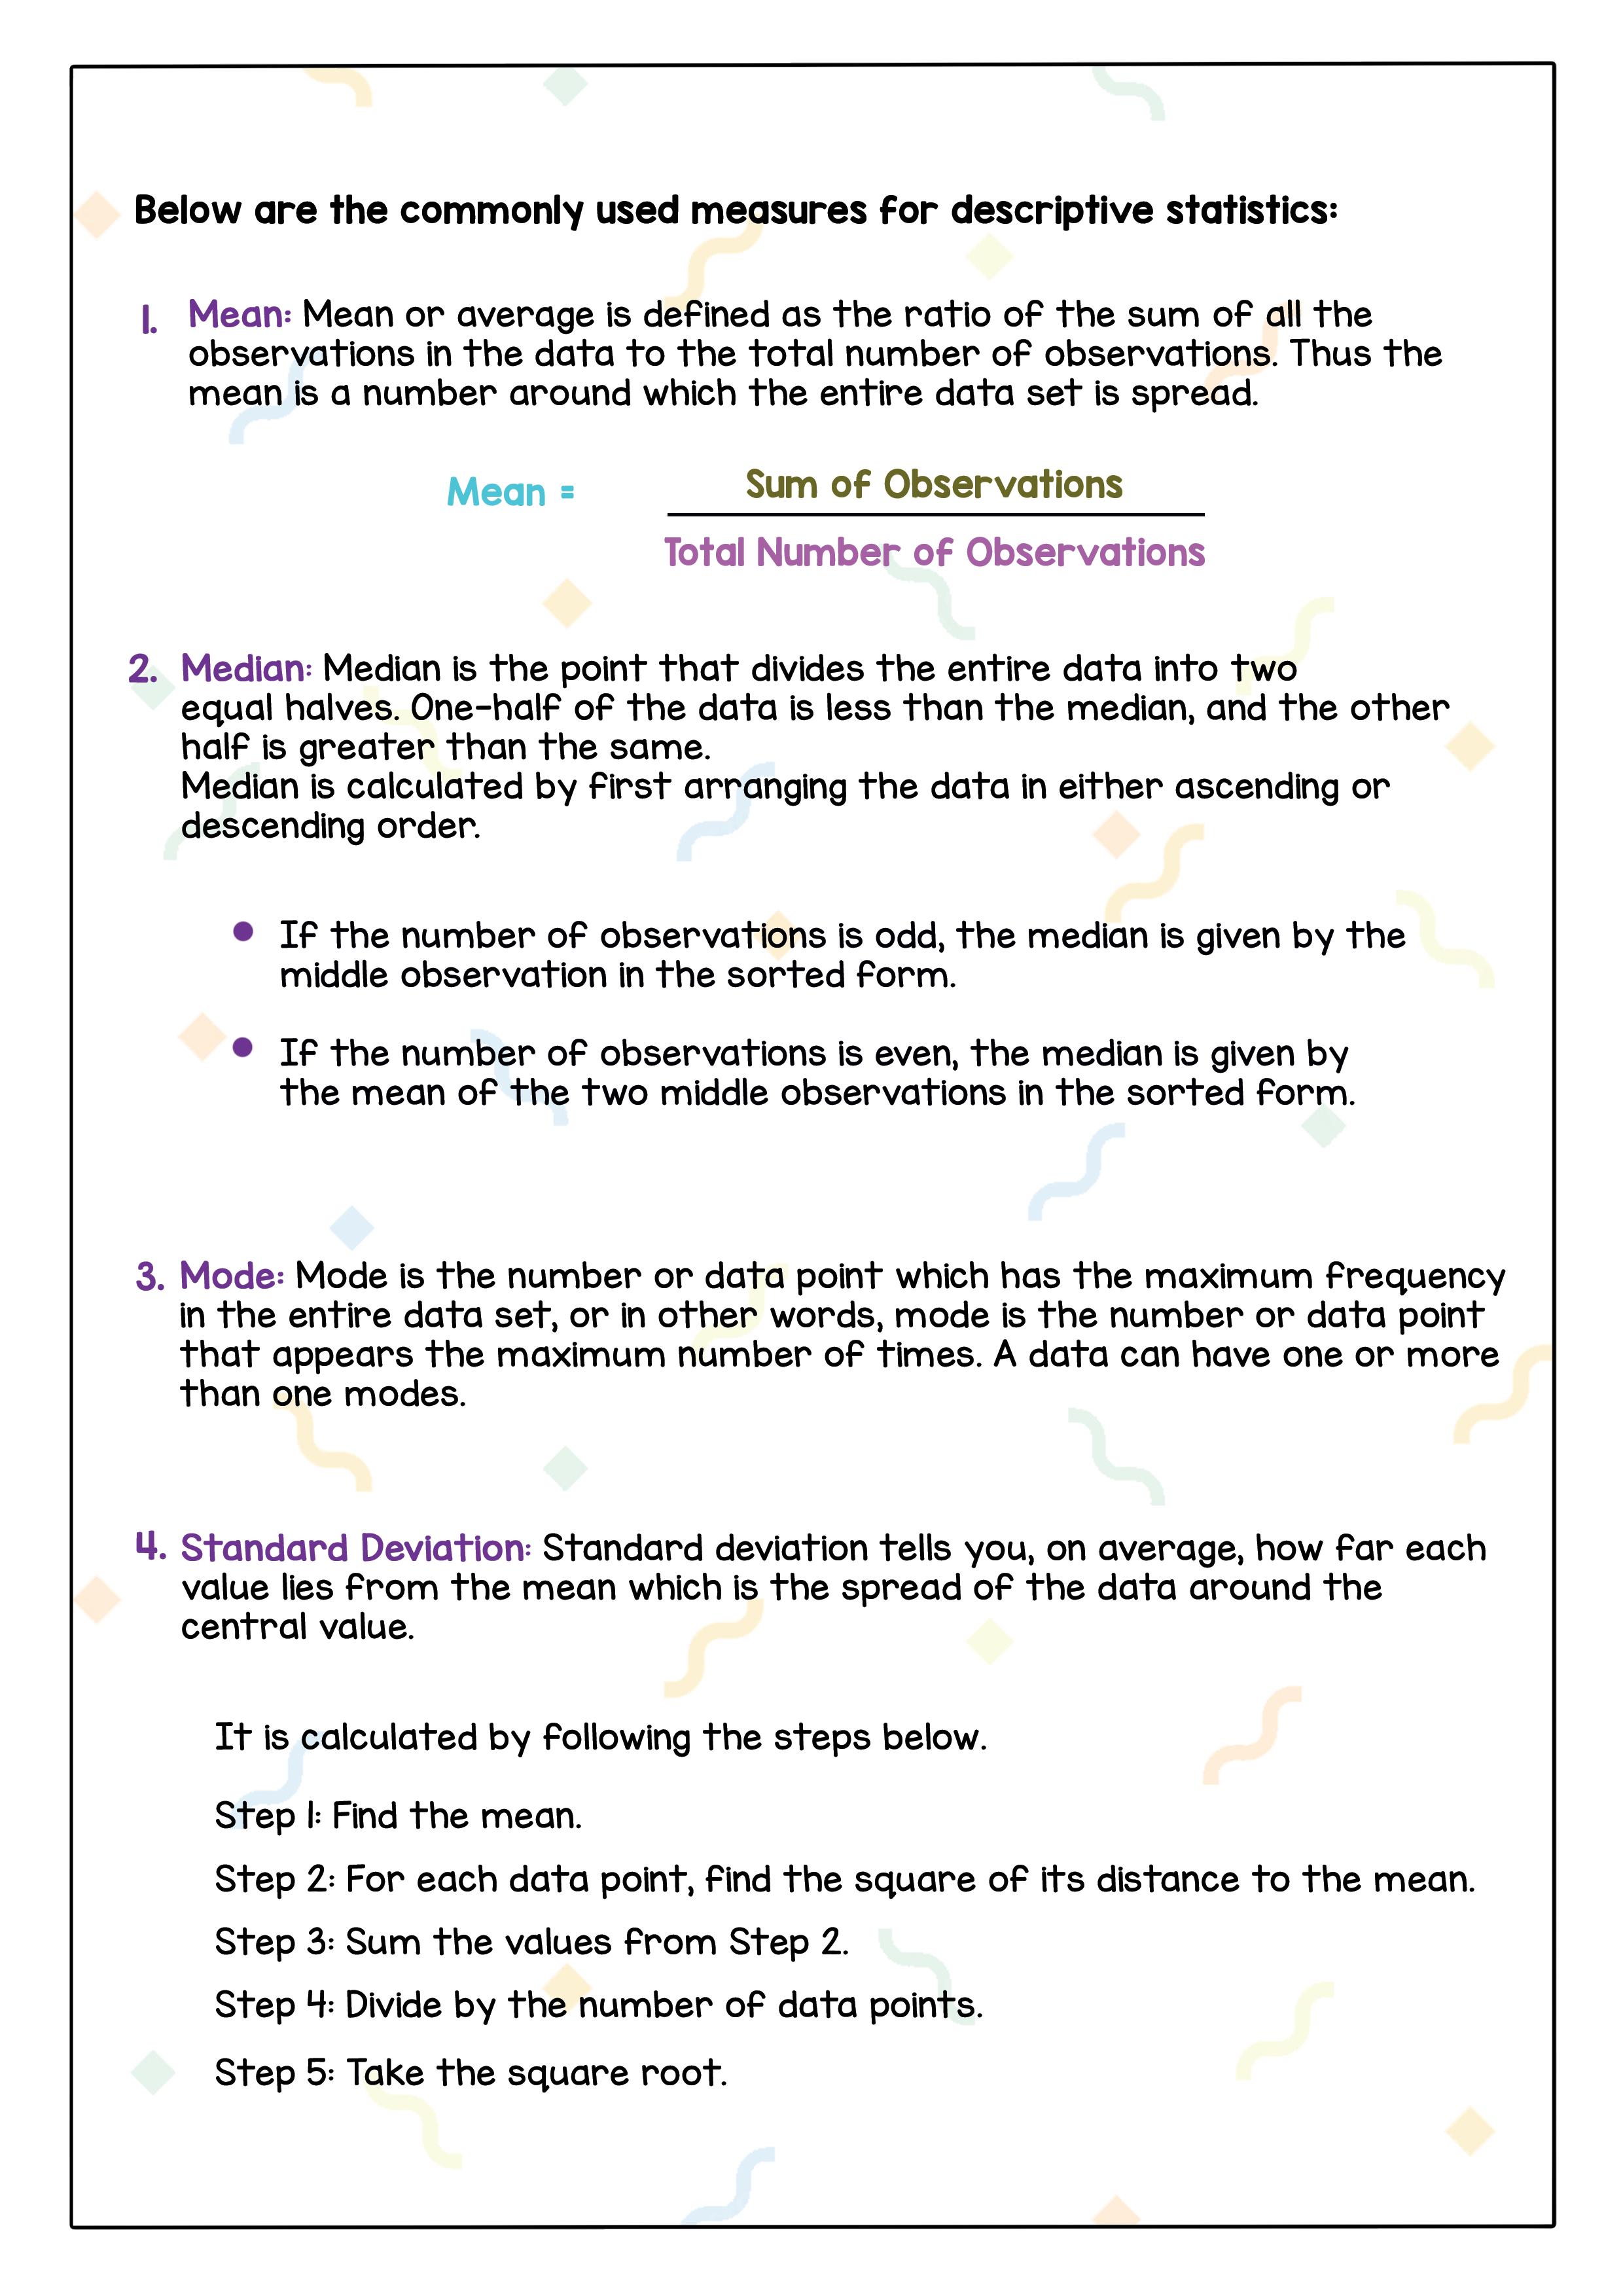
● If the number of observations is even, the median is given by the mean of the two middle observations in the sorted form.
3. Mode: Mode is the number or data point which has the maximum frequency in the entire data set, or in other words, mode is the number or data point that appears the maximum number of times. A data can have one or more than one mode.
4. Standard Deviation: Standard Deviation tells you, on average, how far each value lies from the mean which is the spread of the data around the central value.
It is calculated by following the steps below:
1. Find the mean.
2. For each data point, find the square of its distance from the mean.
3. Sum the values from Step 2.
4. Divide by the number of data points.
5. Take the square root.
Data visualisation is the graphical representation of information and data. By
4. Verify the data cell range selected.
5. Pick whether you want the pivot table on the same sheet or on a new sheet.
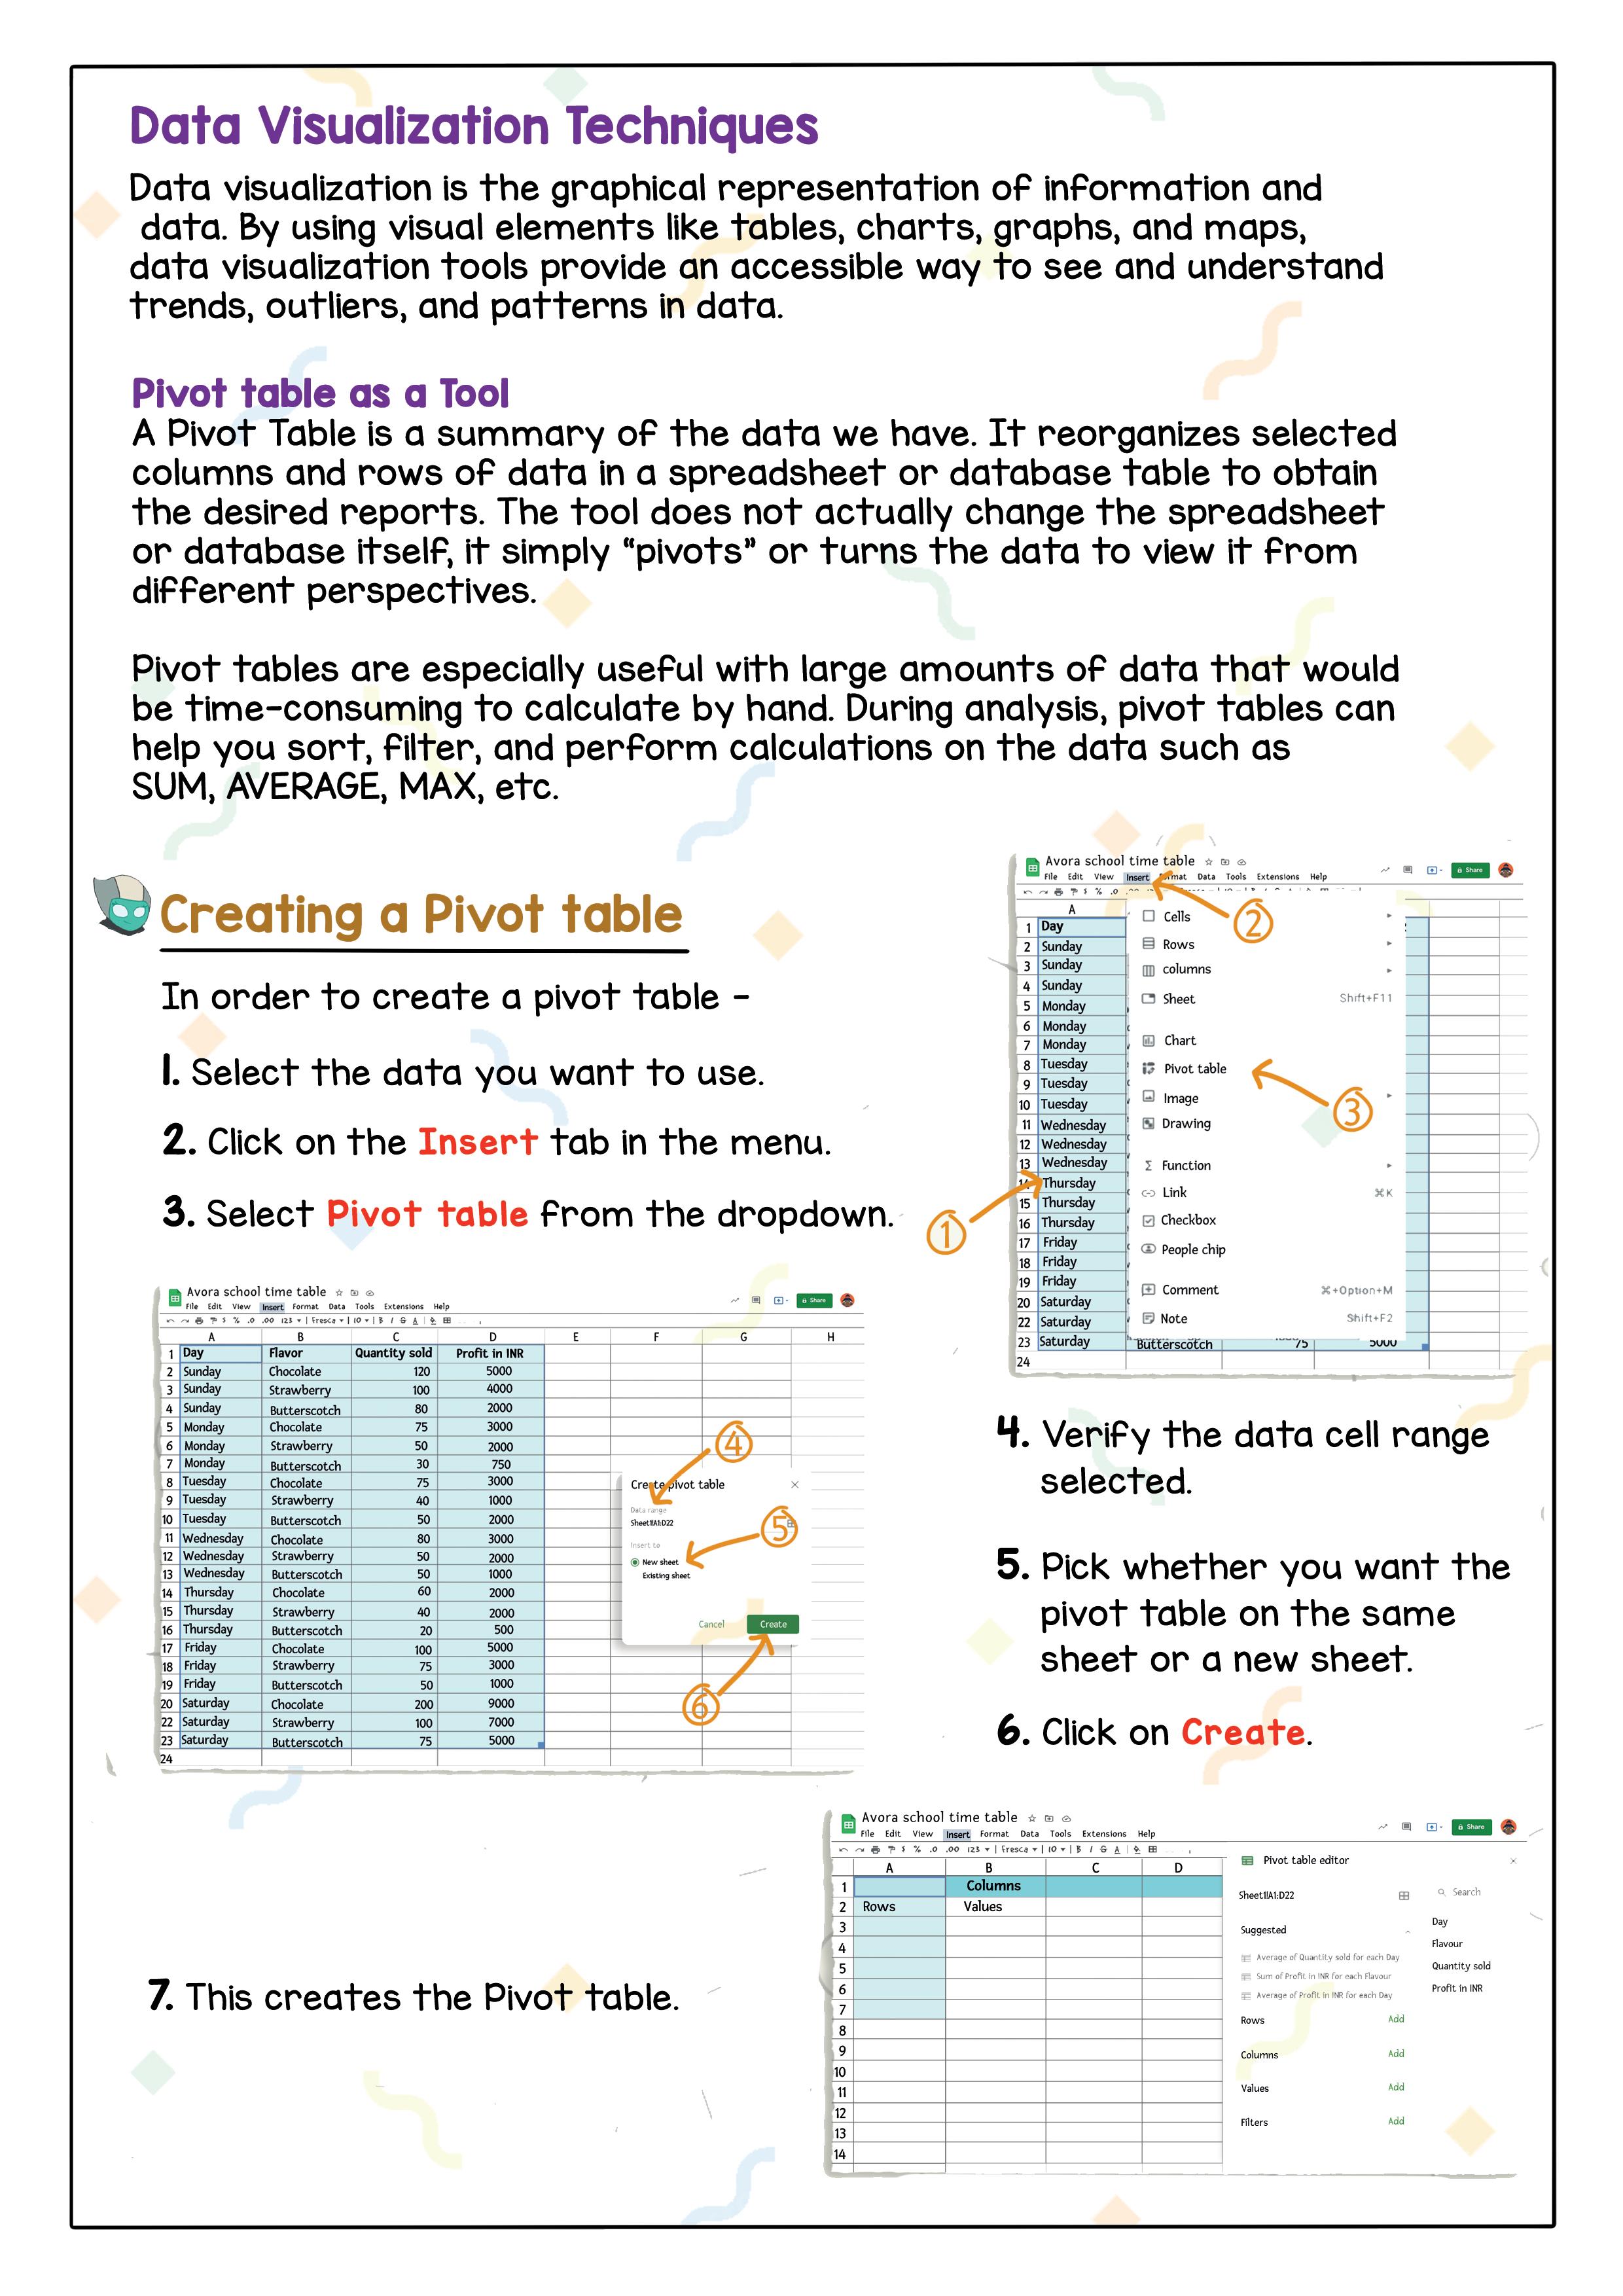
6. Click on Create.
There are four main components we need to know about in a pivot table:
1. Columns: When a field is chosen for the column area, only those unique values of the field are listed across the top as columns.
2. Rows: When a field is chosen for the row area, it populates as the first column.
3. Values: Each value is kept in a pivot table cell and displays the summarised information. The most common values are sum, average, minimum and maximum.
4. Filters: Filters apply a calculation or restriction to the entire table.
A Pivot table helps users answer business questions with minimal effort. Common Pivot table uses include:
● To calculate sums or averages in business situations. For example, counting sales by department or region.
● To show totals as a percentage of a whole. For example, comparing sales for a specific product to total sales.
● To generate a list of unique values. For example, showing which states or countries have ordered a product.
● To create a 2 x 2 table summary of a complex report. To identify the maximum and minimum values of a dataset.
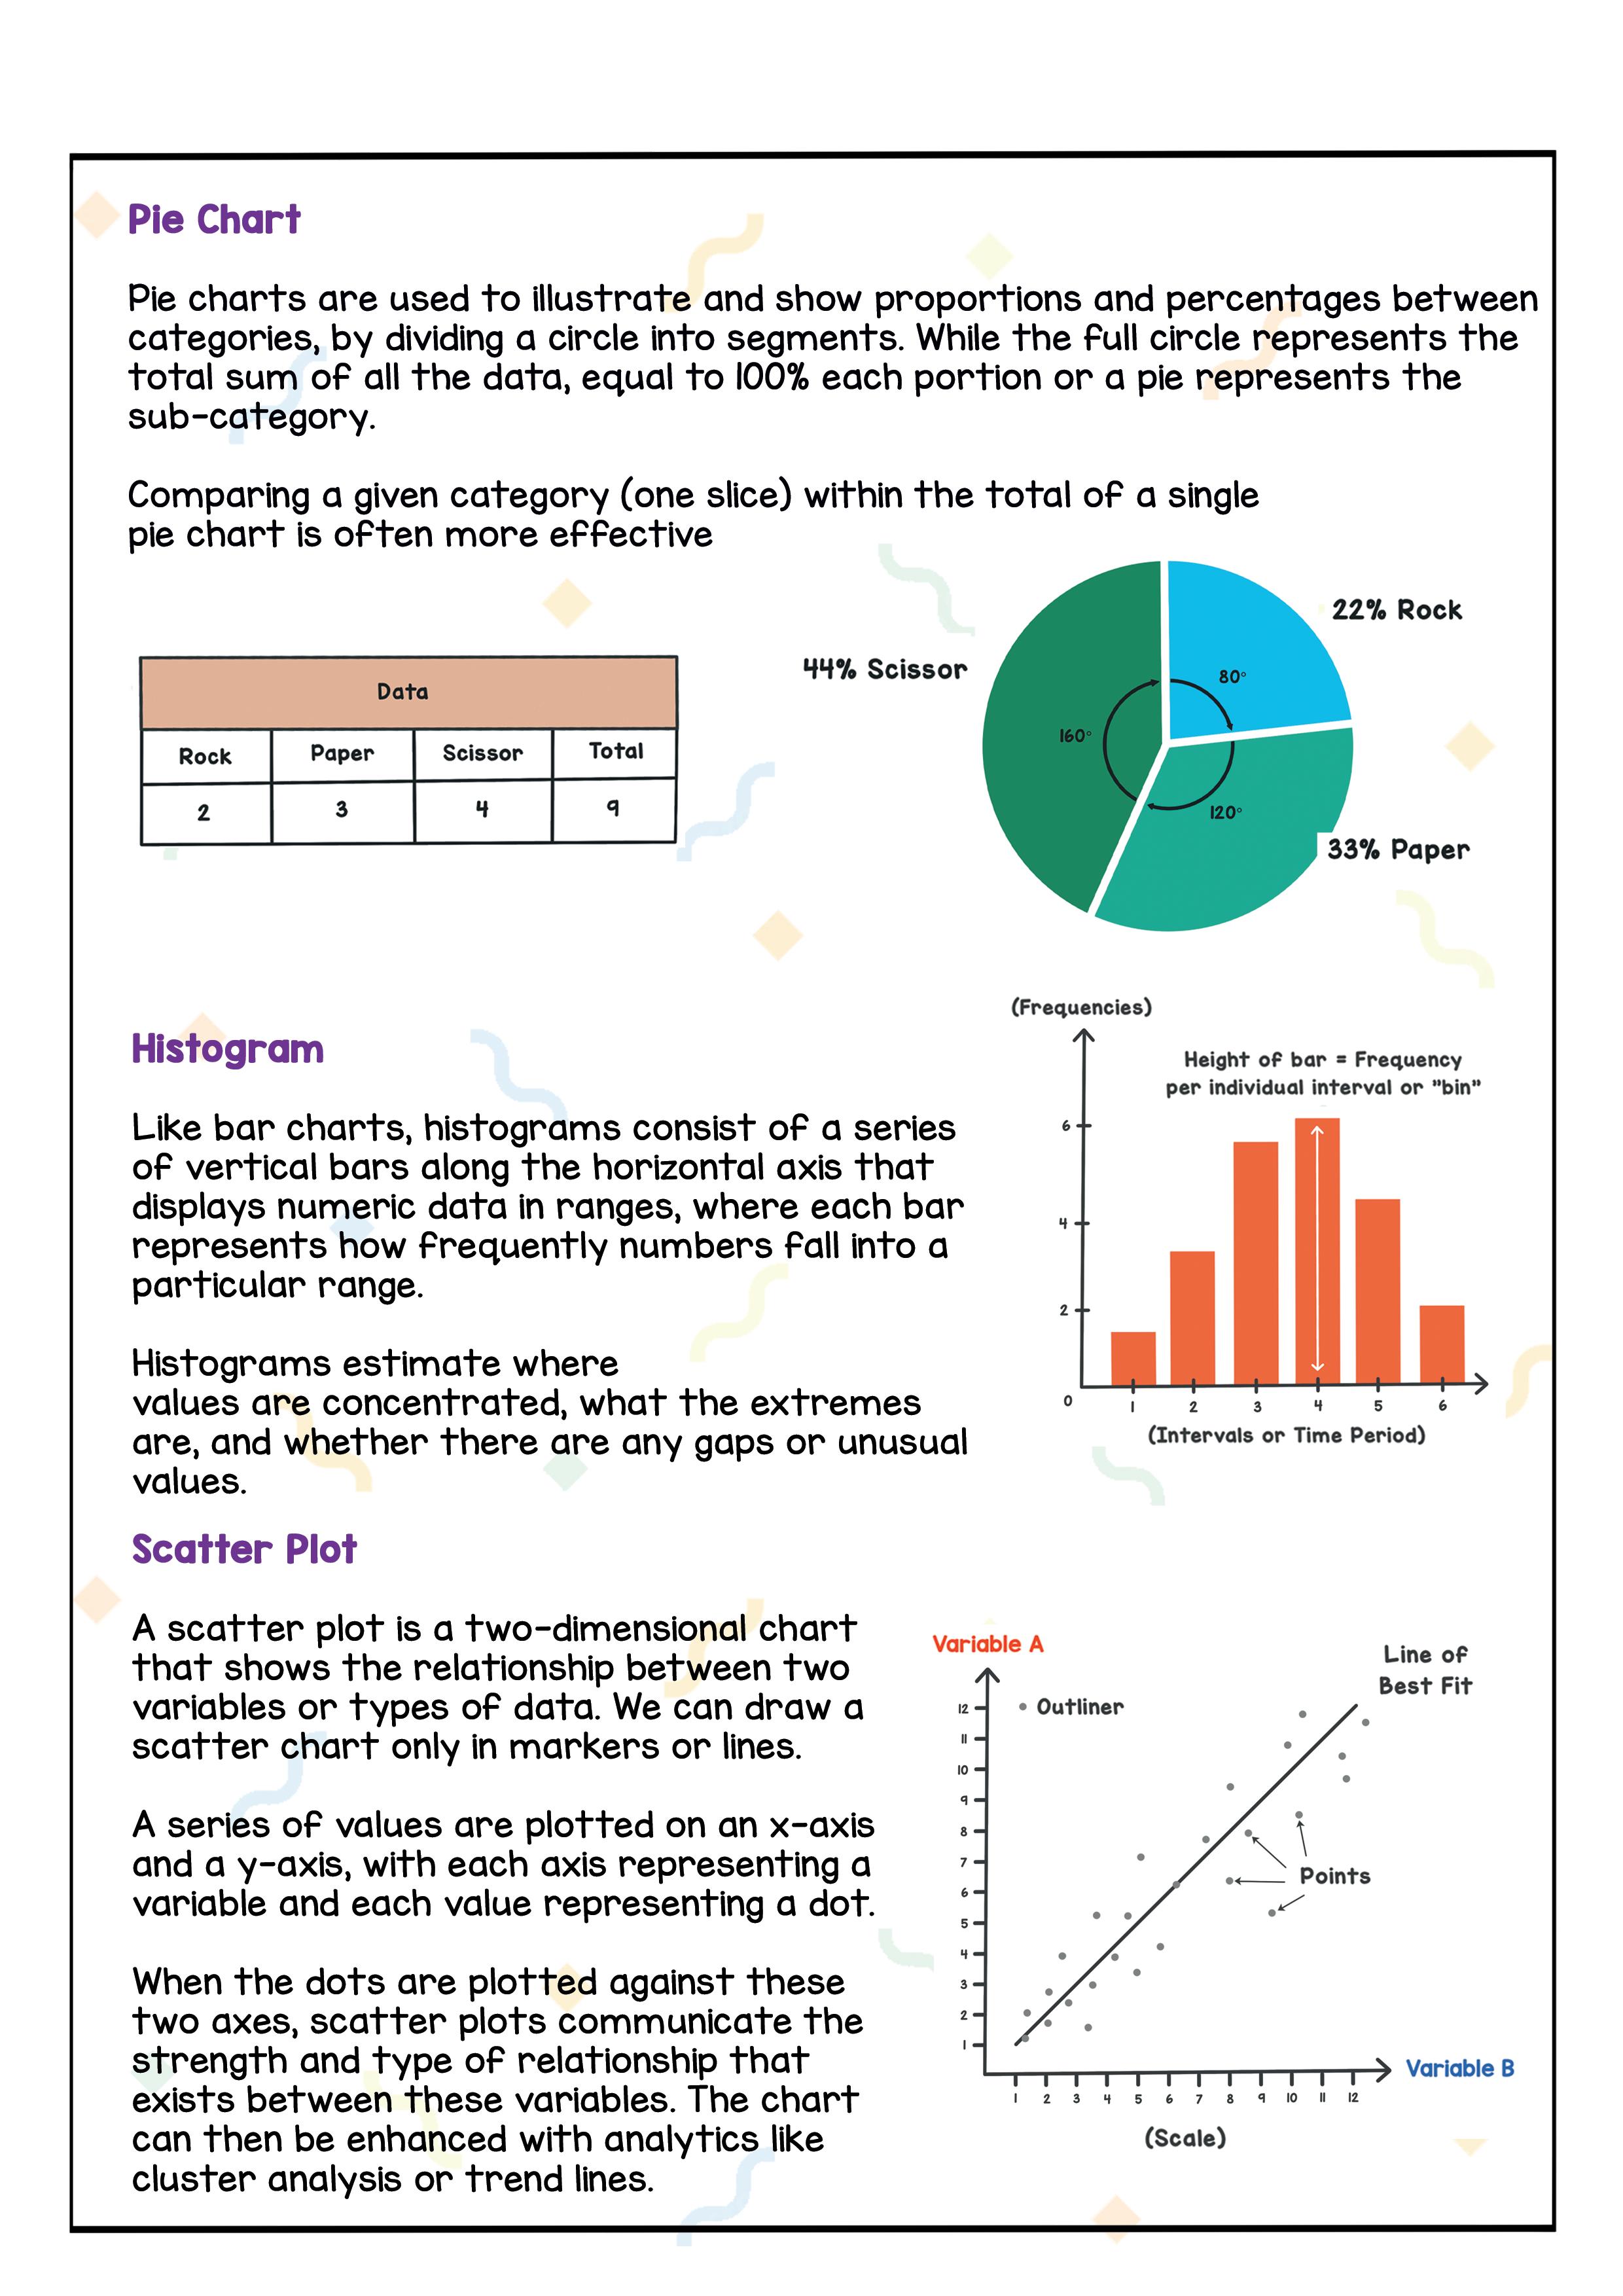
To visualise data, we can use various types of visual representations such as graphs, charts, diagrams etc. These methods will help us present data in effective and interesting ways. Common types of data visualisation are:
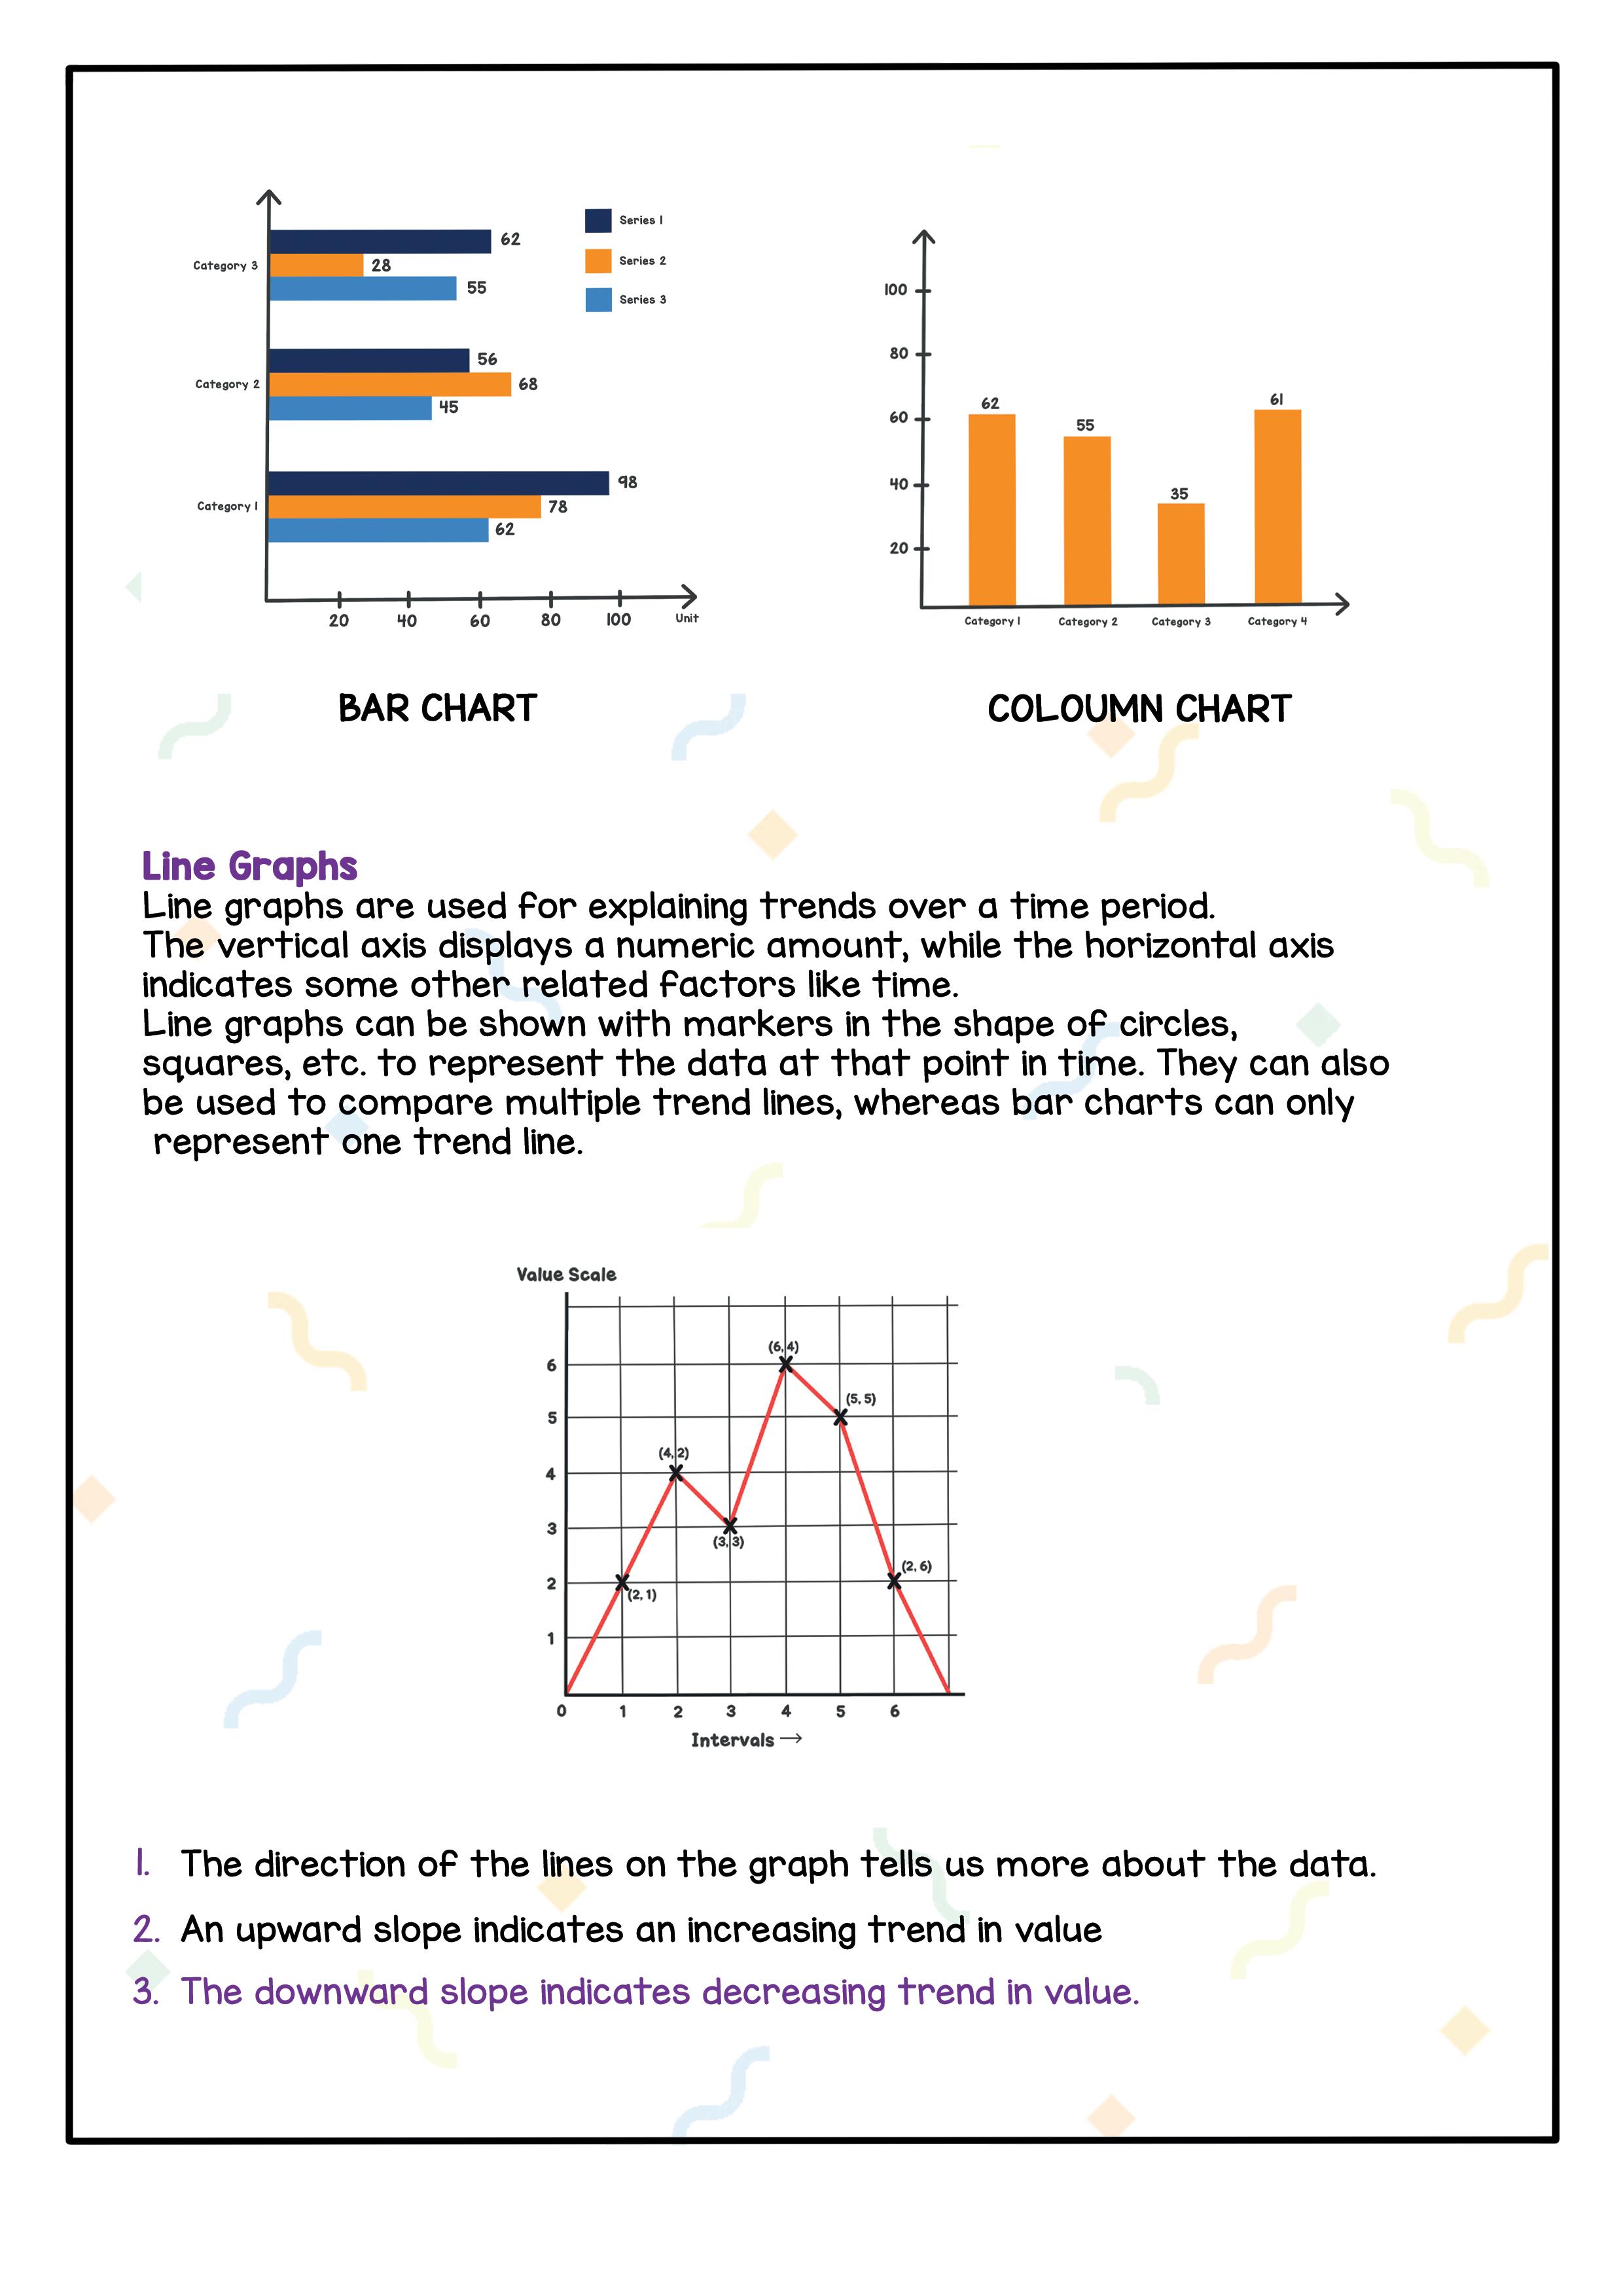
Bar and Column charts are one of the most common data visualisation. We can use them to quickly compare data across categories, highlight differences,
Line graphs are used for explaining trends over a period of time. The vertical axis displays a numeric amount, while the horizontal axis indicates some other related factors like time.
Line graphs can be shown with markers in the shape of circles, squares, etc. to represent the data at that point in time. They can also be used to compare multiple trend lines, whereas bar charts can only represent one trend line.
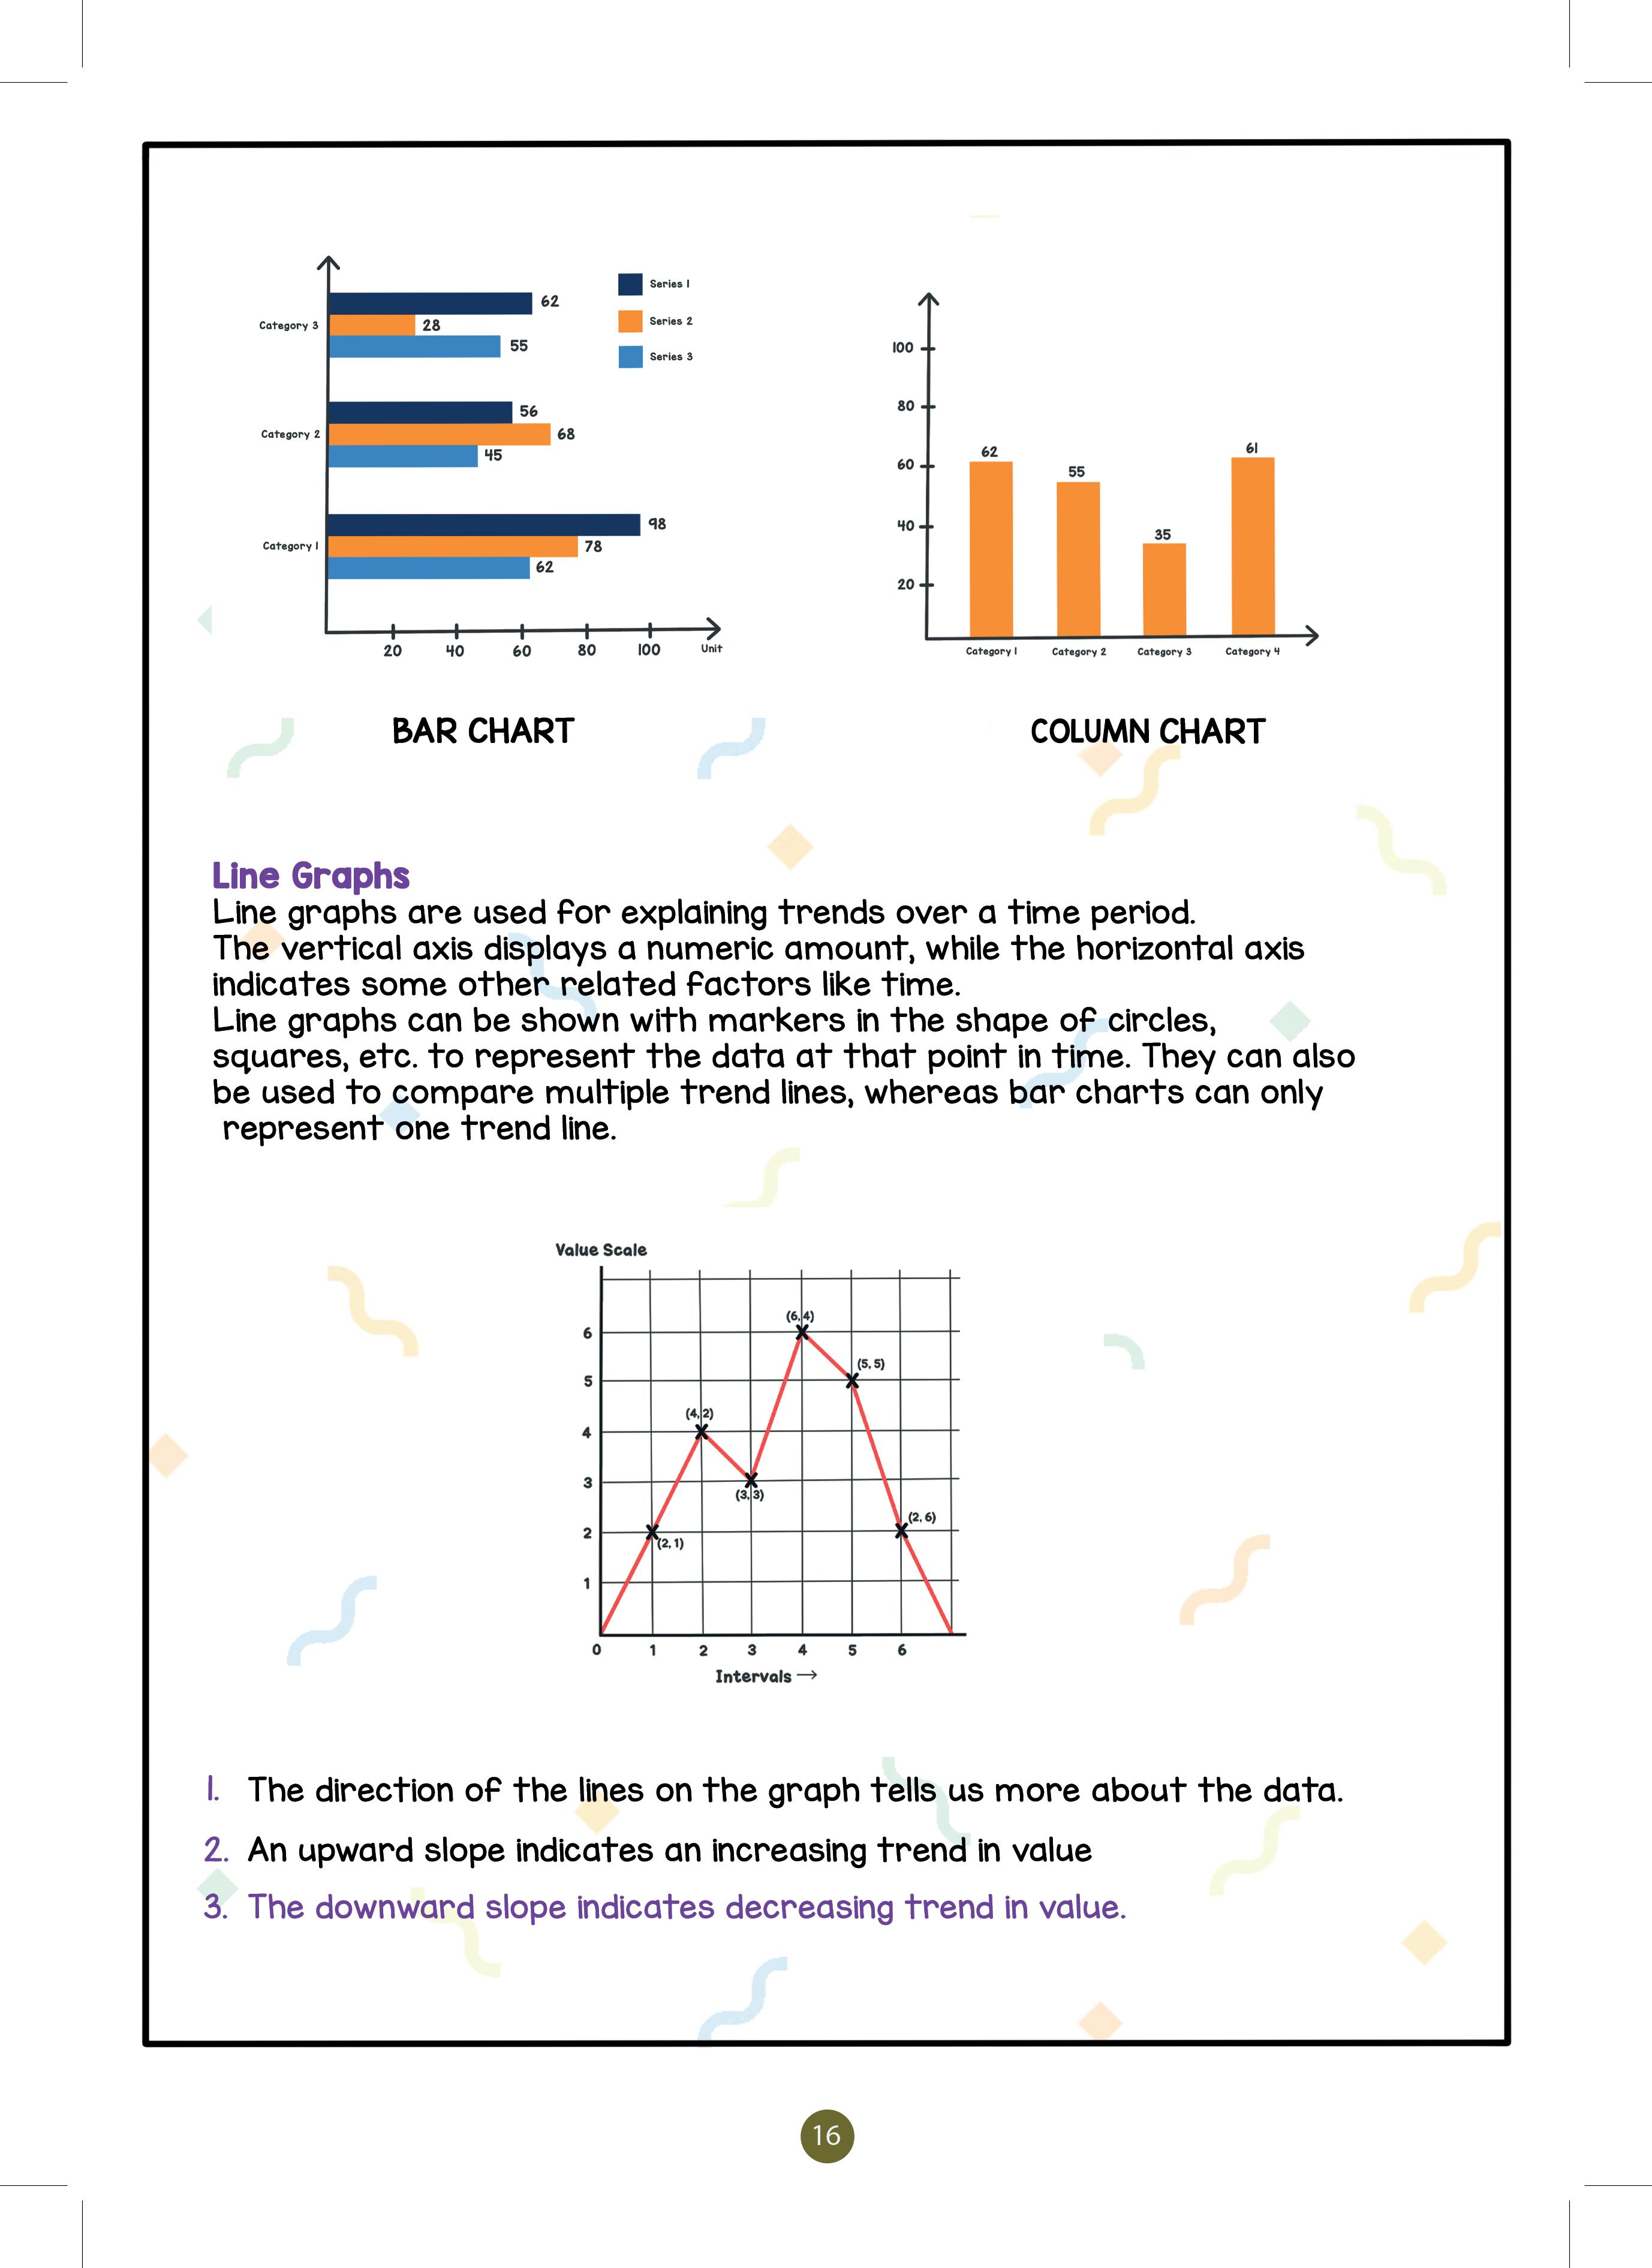
1. The direction of the lines on the graph tells us more about the data.
2. An upward slope indicates an increasing trend in value.
● Humans can process visual data much better than numerical data.
● Through Data Visualisation, we can easily define and describe the data and then perform data cleansing.
● Data Exploration allows us to understand and visually identify anomalies and relationships that could go undetected otherwise.
● Data Exploration can assist us in reducing our huge tasks of fact collection to a reasonable size so that we can concentrate our efforts on studying the most relevant data.
AI Modelling refers to developing algorithms or programs, also called models which can be trained to get intelligent outputs and solve our problem statement.
In normal programming, we define the rules and give certain input, and based on those rules we get the expected output. So, rule-based AI
modelling is where the relationship or patterns in data are defined by us in the program. The computer follows the rules or instructions and performs its task accordingly.
It is AI modelling where the relationship or patterns in data are not defined by the developer. In this approach, random data is fed to the machine and it is left on the machine to figure out patterns and trends. Generally, this approach is followed when the data is unlabelled and too random for a human to make sense of it. These are also termed Machine Learning models.
We have already learned what Machine learning models are and how they work with the help of Training and Testing Datasets. Now we are going to explore the different ways in which we can make the computer learn based on its various applications.
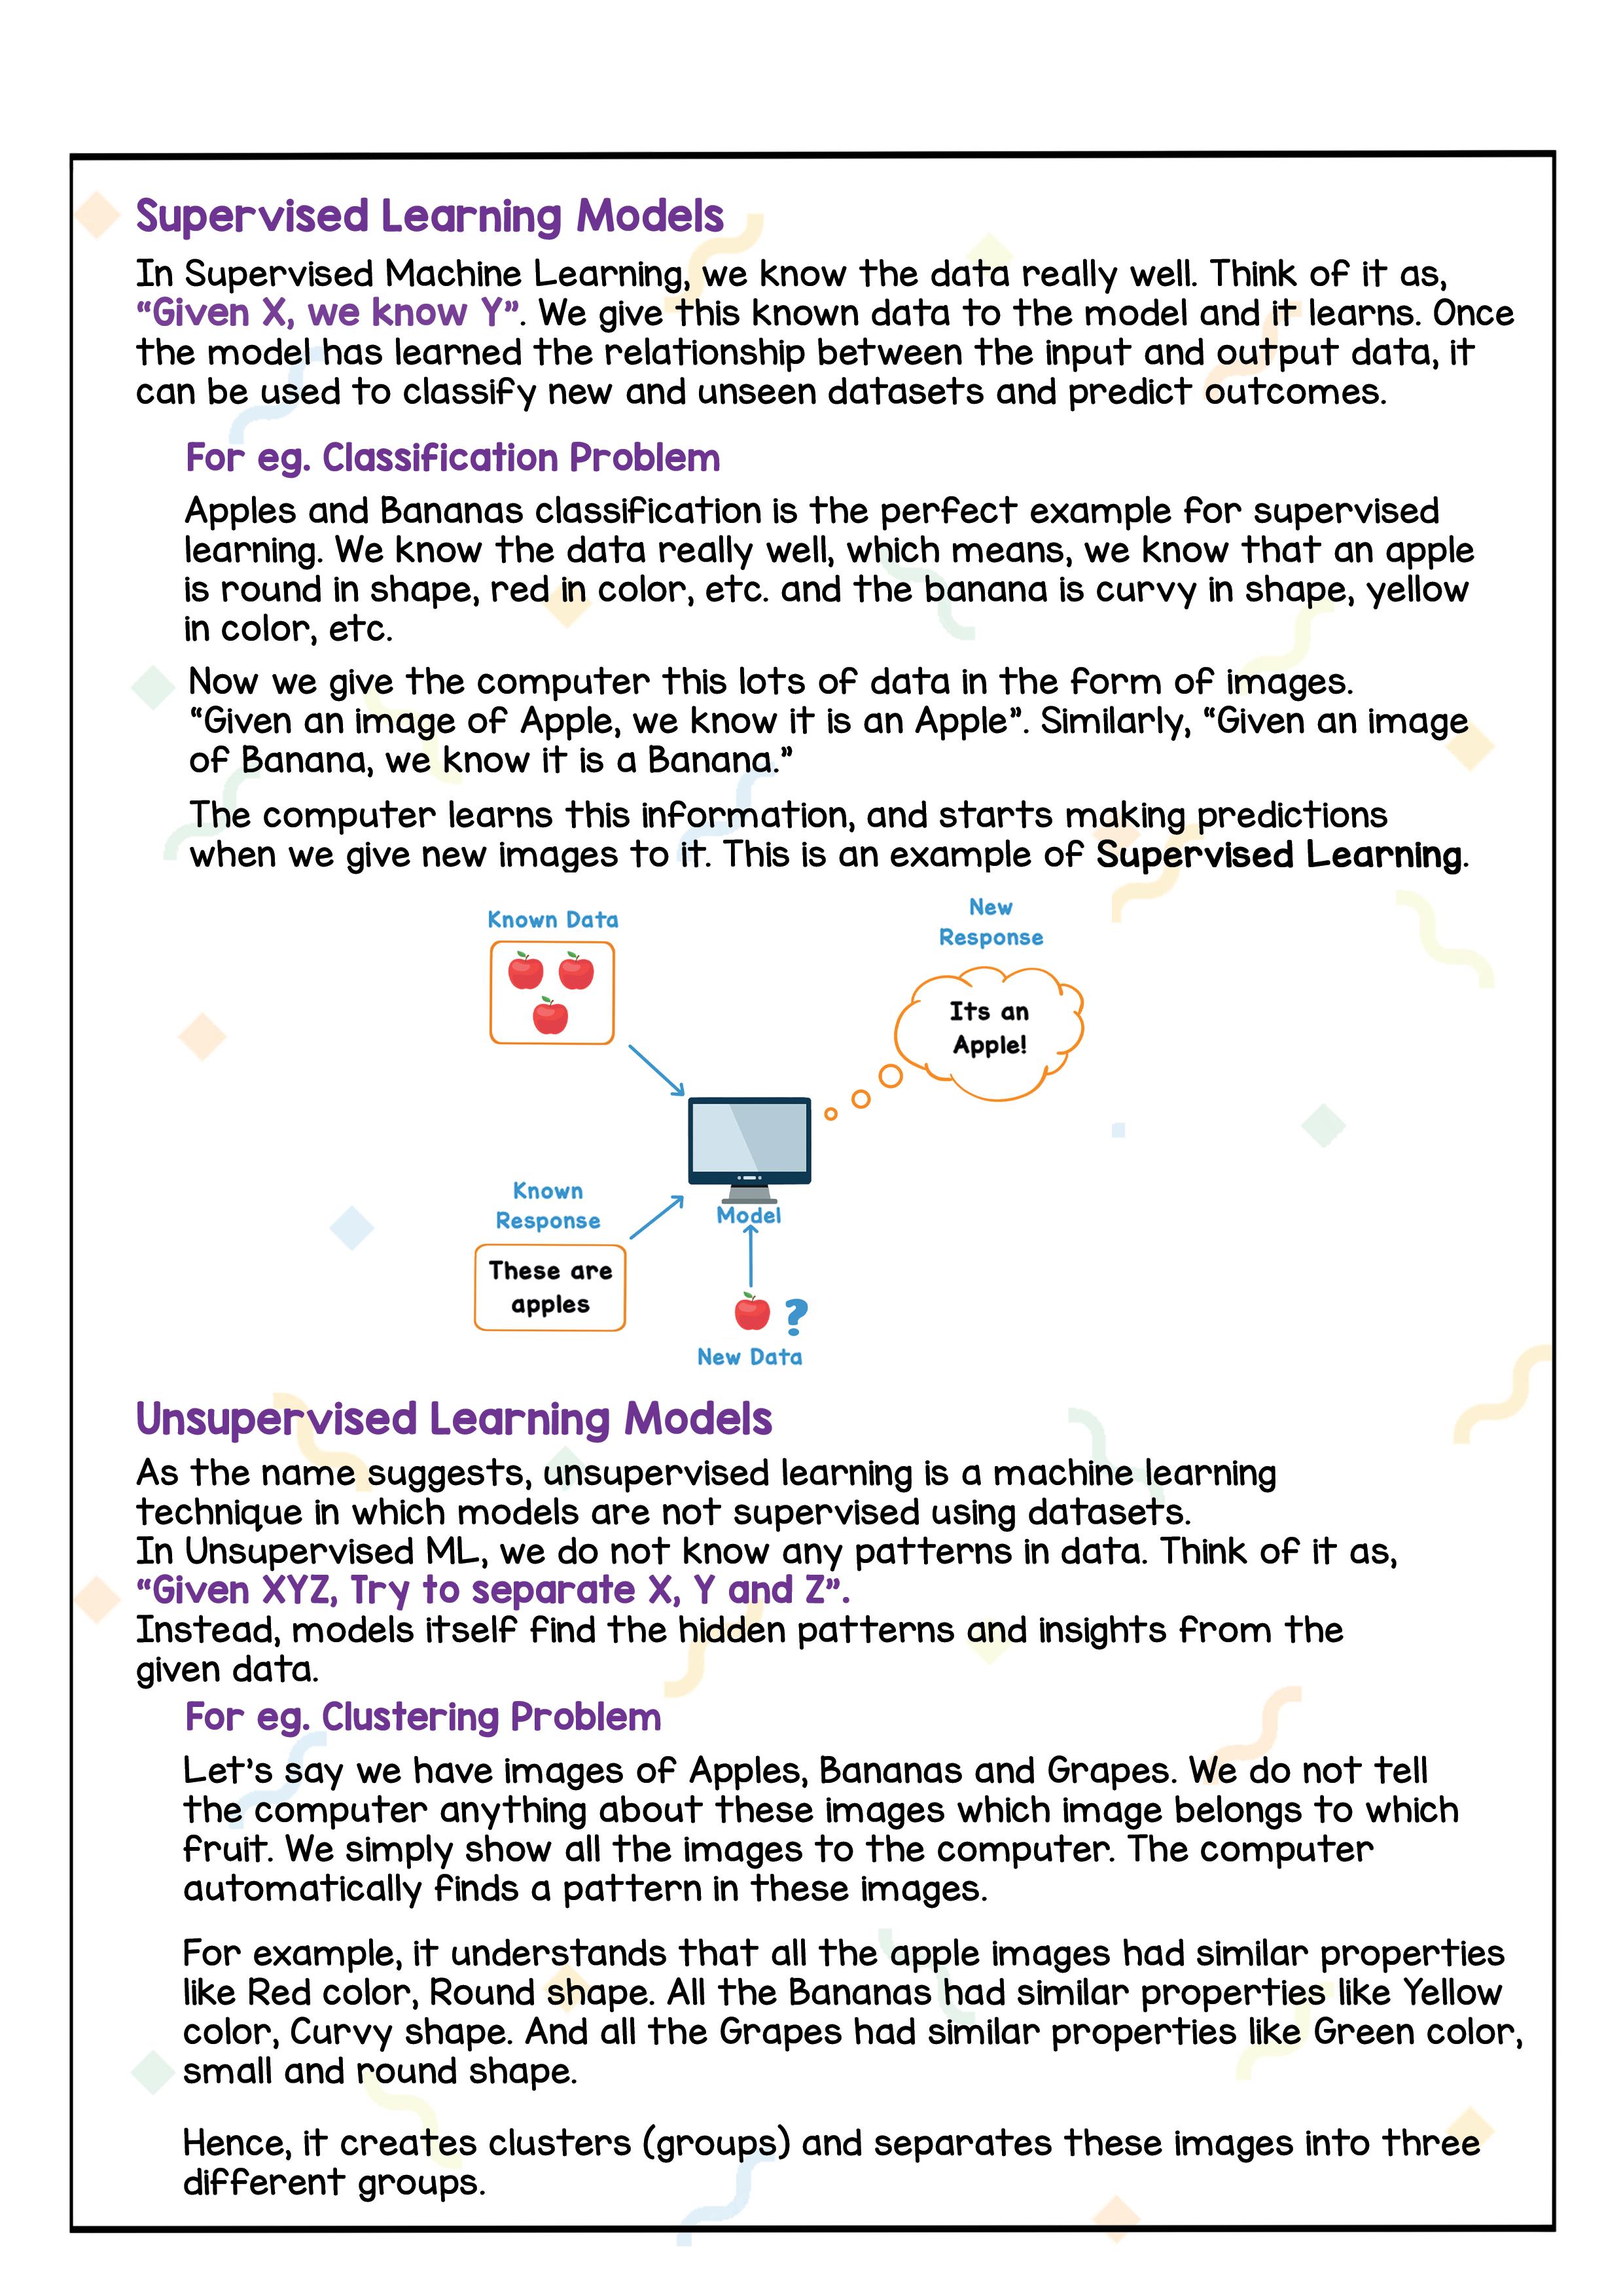
In Supervised Machine Learning, we know the data really well. Think of it as, “Given X, we know Y”. We give this known data to the model and it learns. Once the model has learned the relationship between the input and output data, it can be used to classify new and unseen datasets and predict outcomes.
Apples and Bananas classification is the perfect example for supervised learning. We know the data really well, which means, we know that an apple is round in shape, red in colour, etc. and the banana is curvy in shape, yellow in colour, etc.
Now we give the computer lots of data in the form of images. “Given an image of Apple, we know it is an Apple”. Similarly, “Given an image of Banana, we know it is a Banana.”
The computer learns this information, and starts making predictions when we give new images to it. This is an example of Supervised Learning.
As the name suggests, unsupervised learning is a machine learning technique in which models are not supervised using datasets.
In Unsupervised ML, we do not know any patterns in data. Think of it as “Given XYZ, Try to separate X, Y and Z”.
Instead, models itself find the hidden patterns and insights from the given data.
Let’s say we have images of Apples, Bananas and Grapes. We do not tell the computer anything about these images, which image belongs to which fruit. We simply show all the images to the computer. The computer automatically finds a pattern in these images.
For example, it understands that all the apple images had similar properties like Red colour, Round shape. All the Bananas had similar properties like Yellow colour, Curvy shape. And all the Grapes had similar properties like Green colour, small and round shape. Hence, it creates clusters (groups) and separates these images into three different groups.
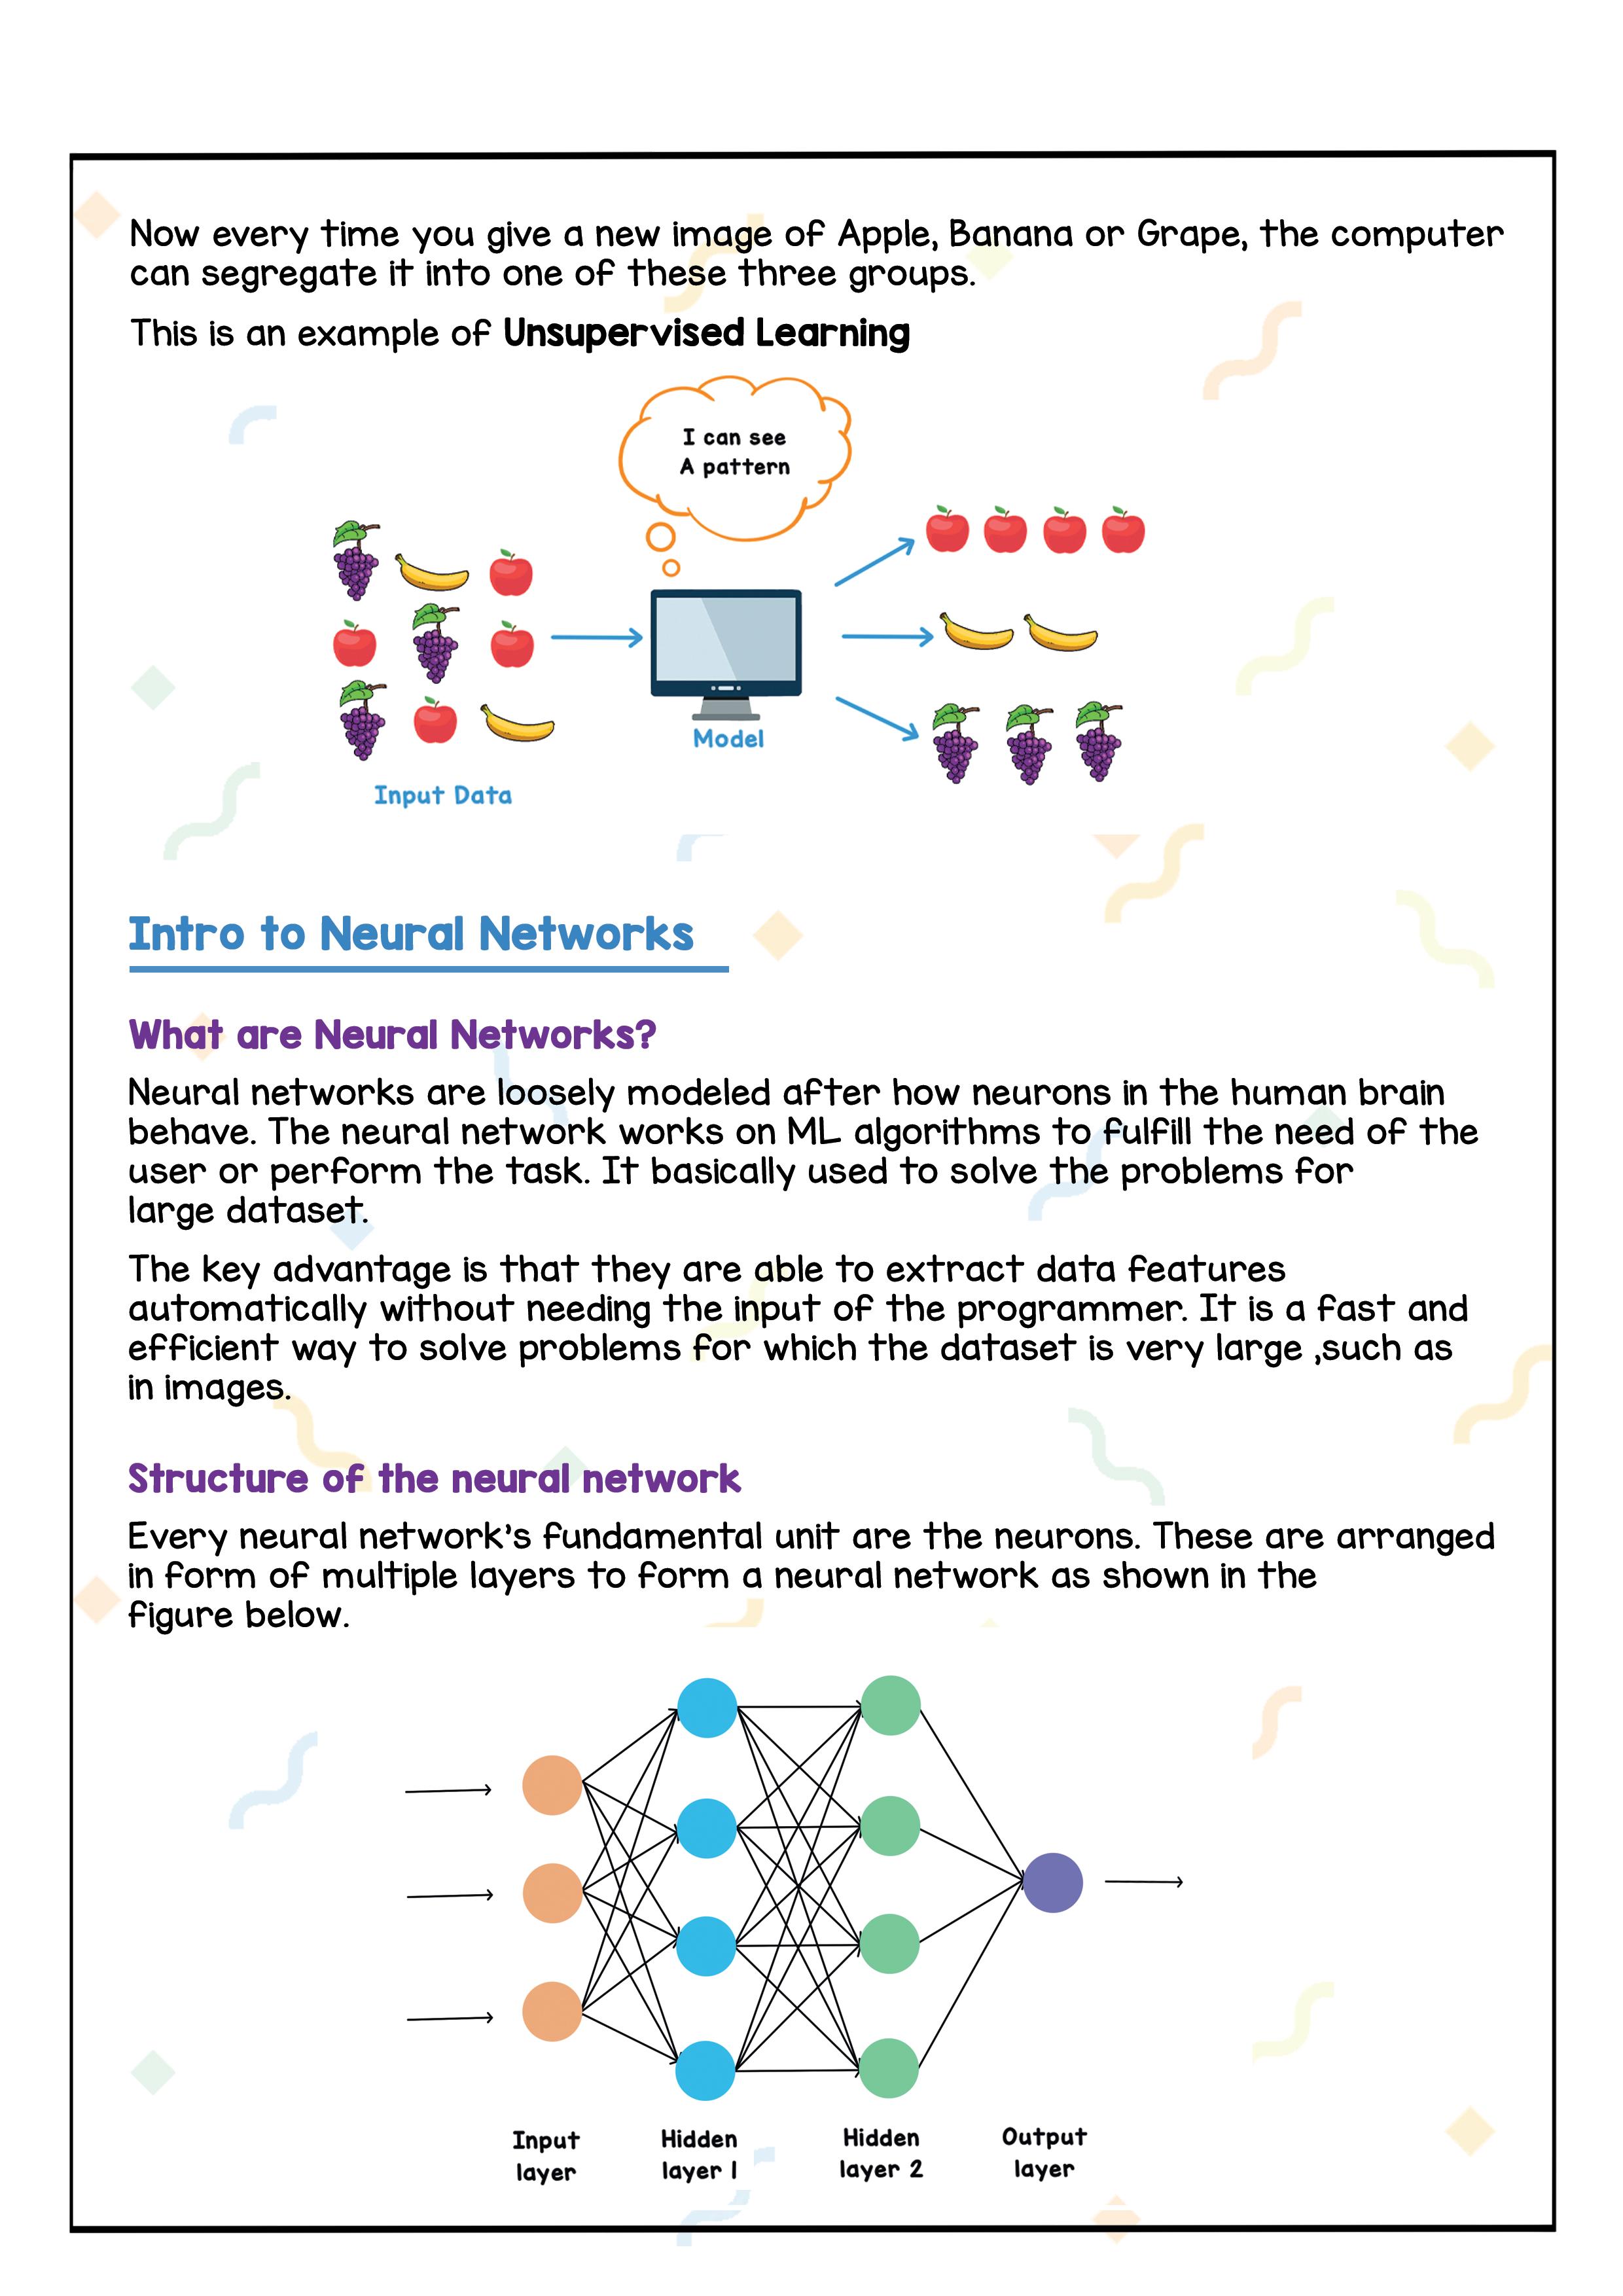
Now every time you give a new image of Apple, Banana or Grape, the computer can Perhaps ‘separate’? it into one of these three groups.
This is an example of Unsupervised Learning.
The above image is of a Human Neuron.
1. The axon from a neuron sends an impulse to another neuron.
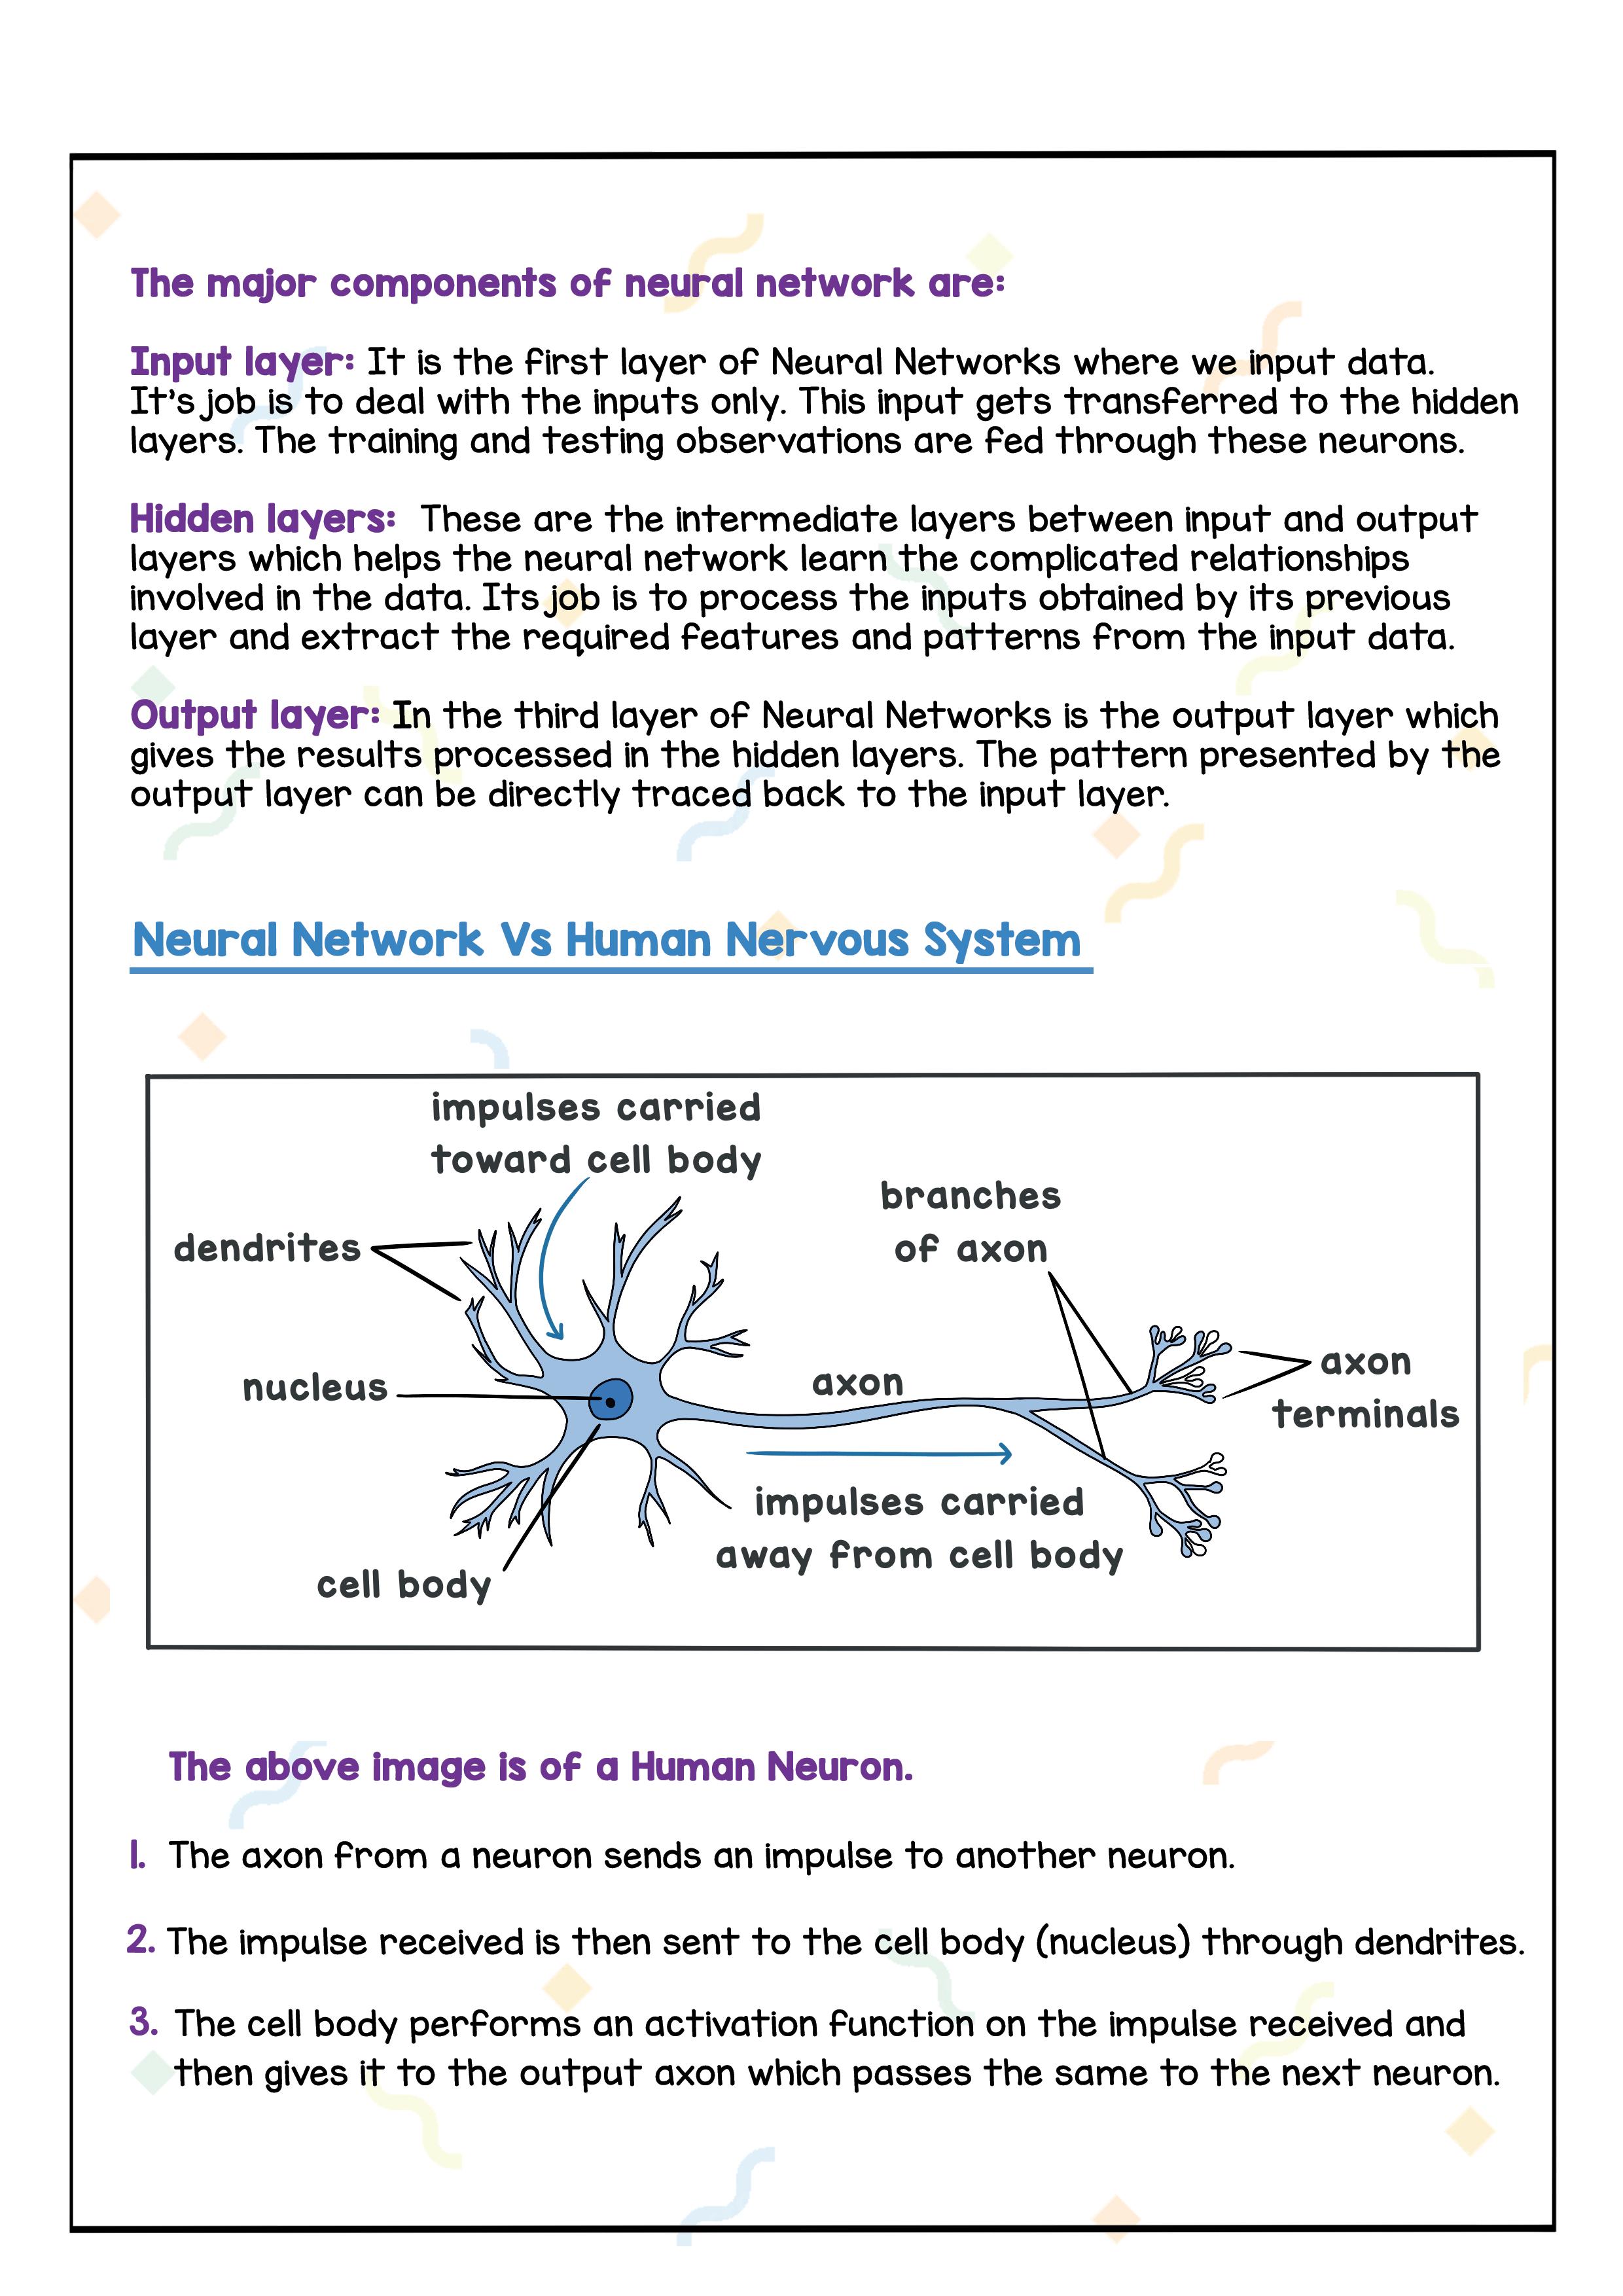
2. The impulse received is then sent to the cell body (nucleus) through dendrites.
3. The cell body performs an activation function on the impulse received and then gives it to the output axon which passes the same to the next neuron.
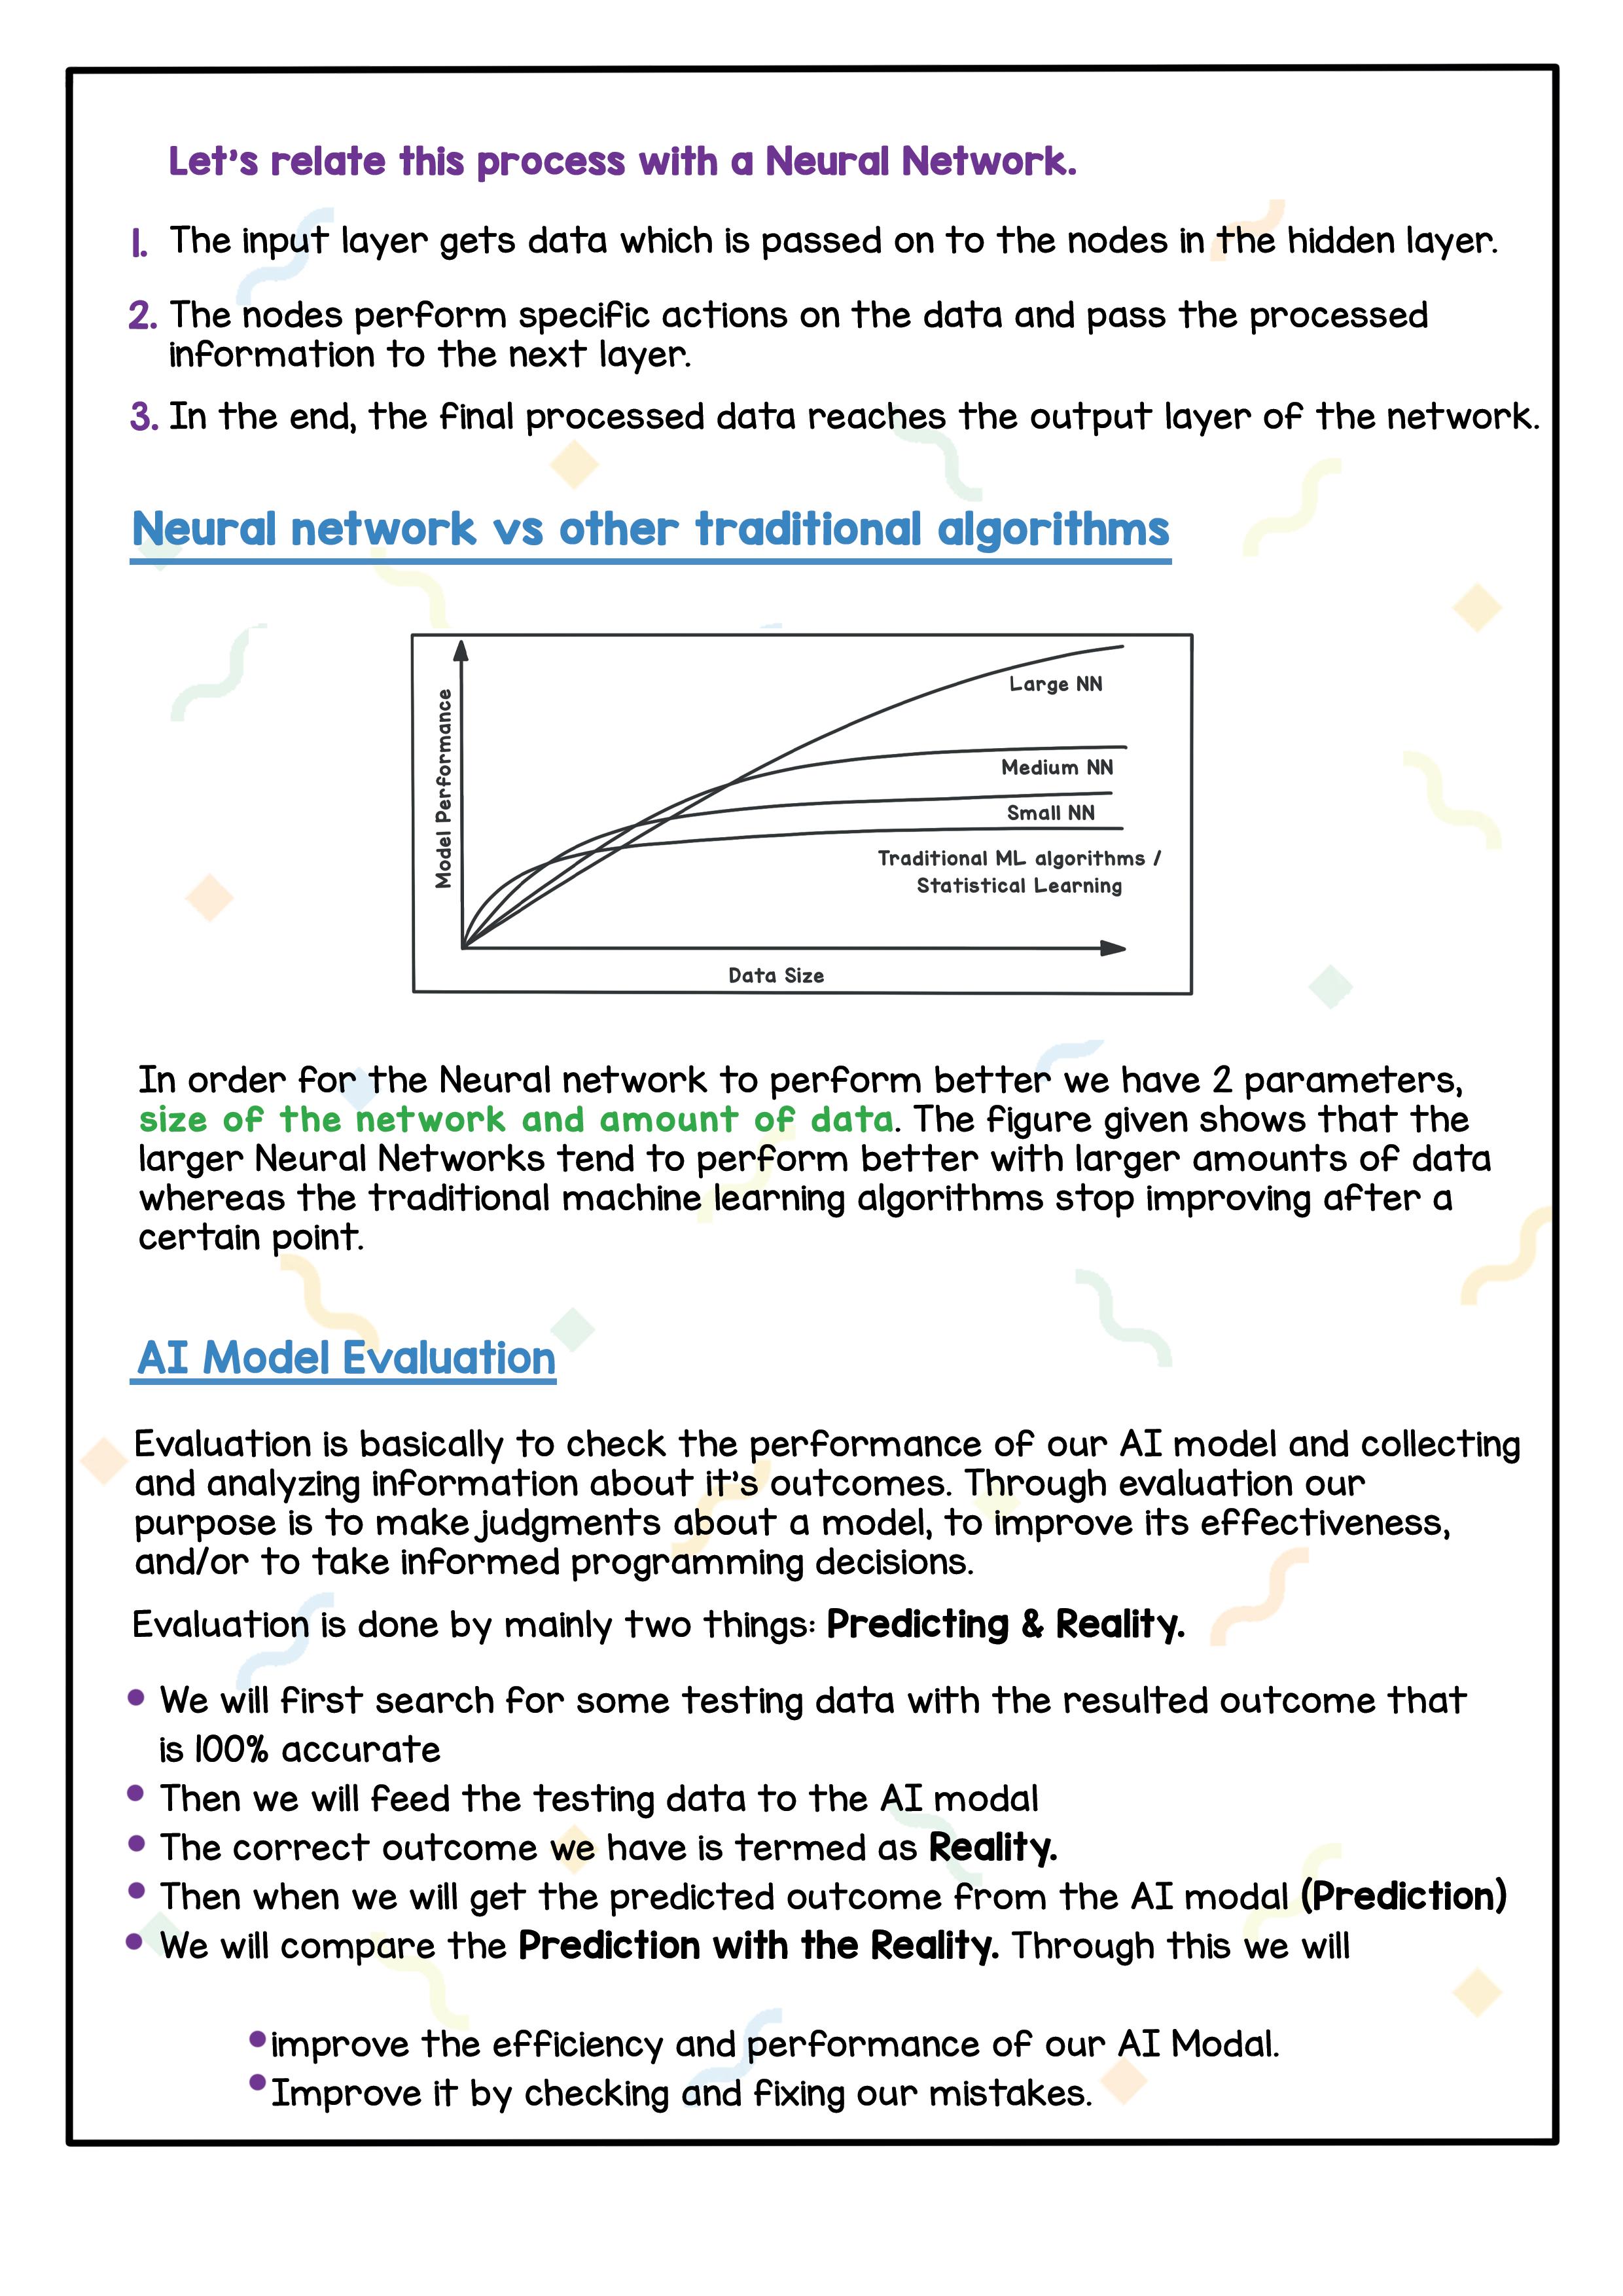
In order for the Neural network to perform better we have 2 parameters, size of the network and amount of data. The figure shows that the larger Neural Networks tend to perform better with larger amounts of data whereas the traditional machine-learning algorithms stop improving after a certain point.
Evaluation is basically to check the performance of our AI model and collecting and analysing information about its outcomes. Through evaluation our purpose is to make judgments about a model, to improve its effectiveness, and/or to take informed programming decisions.
Evaluation is done by mainly two things: Predicting and Reality
● We will first search for some testing data with the resulting outcome that is 100% accurate.
● Then we will feed the testing data to the AI model.
● The correct outcome we have is termed Reality.
● Then when we get the predicted outcome from the AI modal (Prediction).
● We will compare the Prediction with the Reality. Through this, we will:
■ improve the efficiency and performance of our AI model.
■ Improve it by checking and fixing our mistakes.
This book represents a 21st-century approach to learning about Artificial Intelligence, and develop problem-solving skills. To prepare students for the digital age, the curriculum is interwoven with well-thought-out concept graduation with real-life examples.
• Illustrative approach: Concepts in coding and computer science are delivered through pictorial representations and learner-friendly approaches.


• Learning through real-life examples: Age-appropriate examples that enable learners to relate to the concept and learn about the unknown from the known.
• Extensive practice: Multiple practice scenarios to reinforce learning.
Uolo partners with K12 schools to bring technology-based learning programs. We believe pedagogy and technology must come together to deliver scalable learning experiences that generate measurable outcomes. Uolo is trusted by over 8,000 schools with more than 3 million learners across India, South East Asia, and the Middle East.