PhD Thesis by Yu-Hsuan Juan

Page 30

Chapter 2

16

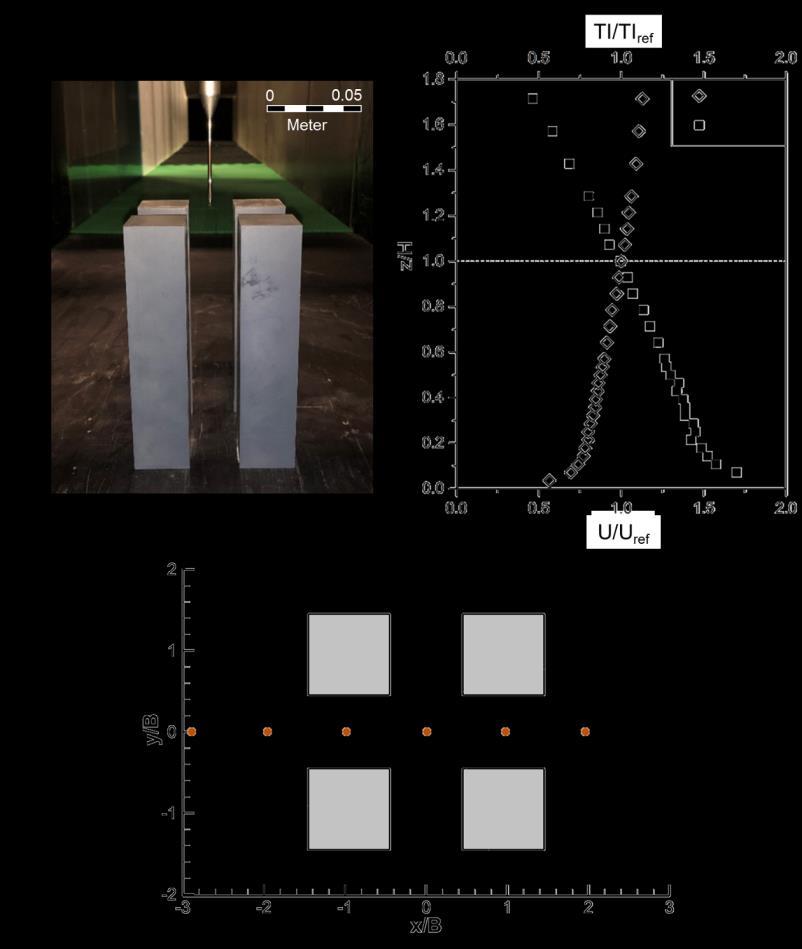
dimensionless mean streamwise velocity (U/Uref) and turbulence intensity (TI/TIref) measured in the wind tunnel, where Uref (= 13.4 m/s) and TIref (= 8%) are the values at z = 0.14 m. Note that the incident flow profiles are defined as those measured in the empty tunnel at the position where the buildings would be located [83]. The building Reynolds number based on H and Uref is 123,724 while the Reynolds number based on the passage width between the buildings (w = 0.028 m) and Uref is 24,745. These values are well above the threshold of 11,000 for Reynolds number independent results [84]. The measurements are made for an approach-flow wind direction of 0°. The mean streamwise velocity (U) and turbulence intensity (TI) are sampled along six vertical lines in the vertical centerplane (y/B = 0) at x/B = -2.9, -1.94, -0.97, 0, 0.97 and 1.94 (Fig. 2.1c).

Figure 2.1. (a) Photograph of reduced-scale 2×2 array of high-rise buildings in wind-tunnel test section; (b) Incident vertical profiles of dimensionless mean streamwise velocity (U/Uref) and turbulence intensity (TI/TIref) measured in wind tunnel; (c) Locations of six vertical sampling lines in the centerplane (y/B = 0).

2.2.2

CFD validation: computational domain and grid

The CFD simulations are performed at wind tunnel scale. The computational domain is based on the WT test section and is shown in Fig. 2.2a. The downstream domain length is 15H, according to best practice guidelines for CFD simulations of wind flow in urban areas [85, 86]. The upstream


Turn static files into dynamic content formats.

Create a flipbook

Articles inside

References

29min
pages 151-164

Biography

1min
pages 165-166

4.5 Discussion

3min
pages 105-106

4.4.2 Impact of building corner shape

8min
pages 97-103

5.1 Introduction

13min
pages 112-116

5 Urban wind energy potential for a realistic high-rise urban area

1min
page 111

4.4.1 Impact of urban density

9min
pages 91-96

4.3.3 Computational settings

1min
page 89

4.3.2 Computational domain and grid

2min
page 88

4.2.1 Turbulence model sensitivity analysis

1min
page 85

4.2 CFD validation study

2min
pages 83-84

4 Urban wind energy potential: Impacts of urban density and layout

1min
page 79

3.5.5 Impact of wind direction

1min
page 76

4.1 Introduction

8min
pages 80-82

3.5.4 Impact of wind turbine type and orientation

3min
pages 73-75

3.5.3 Impact of corner radius

2min
pages 71-72

3 Urban wind energy potential: Impacts of building corner modifications

1min
page 53

3.5.2 Impact of chamfer length

2min
page 70

3.4.3 Grid-sensitivity analysis

1min
pages 62-63

2.7 Conclusions

3min
page 52

3.2.2 CFD validation: computational settings and results

3min
pages 58-59

3.3 Test cases

1min
page 60

2.6 Limitations of the study

1min
page 51

Discussion ...................................................................................................................................... 131

1min
page 20

buildings (d

12min
pages 42-50

Summary and Conclusions.......................................................................................................... 133

1min
page 21

Summary

2min
page 15

1.4 Thesis outline

3min
pages 23-24

2.2.2 CFD validation: computational domain and grid

1min
page 30

2.2.3 CFD validation: other computational settings

2min
pages 31-32

2 Urban wind energy potential: Impact of building arrangement and height

1min
page 25
Issuu converts static files into: digital portfolios, online yearbooks, online catalogs, digital photo albums and more. Sign up and create your flipbook.