38
Chapter 2
(1)
The analysis is focused on an isolated array of buildings and the impact of surrounding buildings in urban settings is not considered in the present study. Future investigations should focus on the assessment of wind energy potential in generic and real urban configurations. A full calculation of the wind power density should consider the statistics of the annual speed and wind direction distribution and the fact that the turbines will only operate within a certain range of wind speeds, between the so-called cut-in and cut-off wind speed. The varied wind conditions should be taken into account to facilitate the selection of the most appropriate small wind turbines for the utilization of urban wind power. Furthermore, the impact of the turbulence intensity, which influences the lifetime of the turbines is not considered in the present analysis and is recommended for future study. In this study, the simulations are performed for buildings with smooth and simple facades. Earlier studies have shown that façade geometrical details such as building balconies can significantly influence the near-building airflow patterns [104-107]. Future work will take into account the impact of façade geometrical details on the available wind energy potential around buildings.
(2)
(3)
2.7
Conclusions
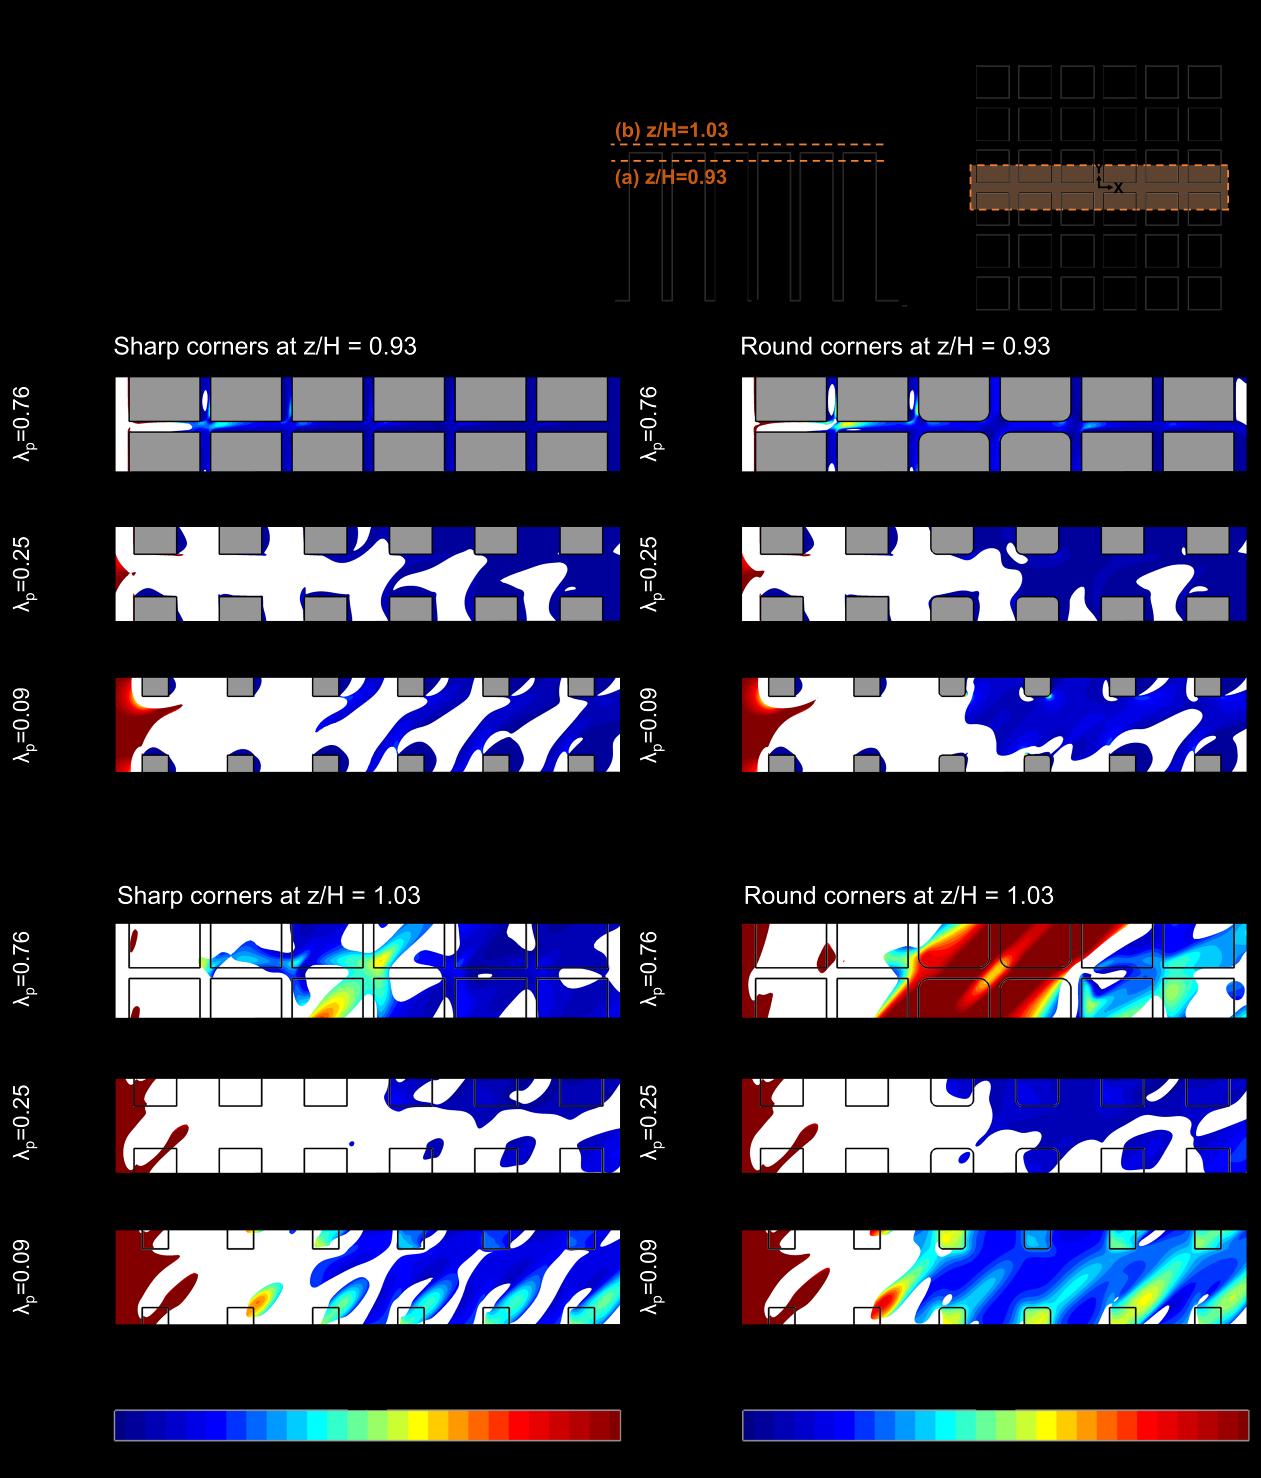
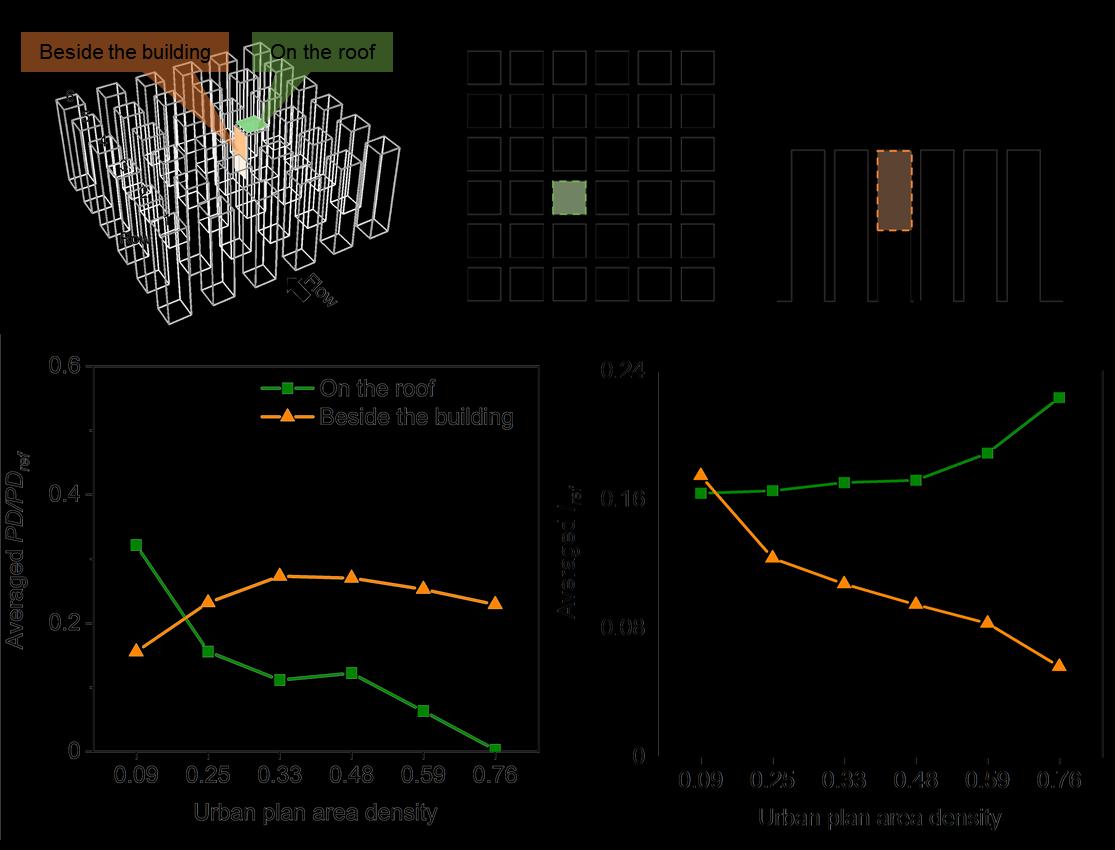
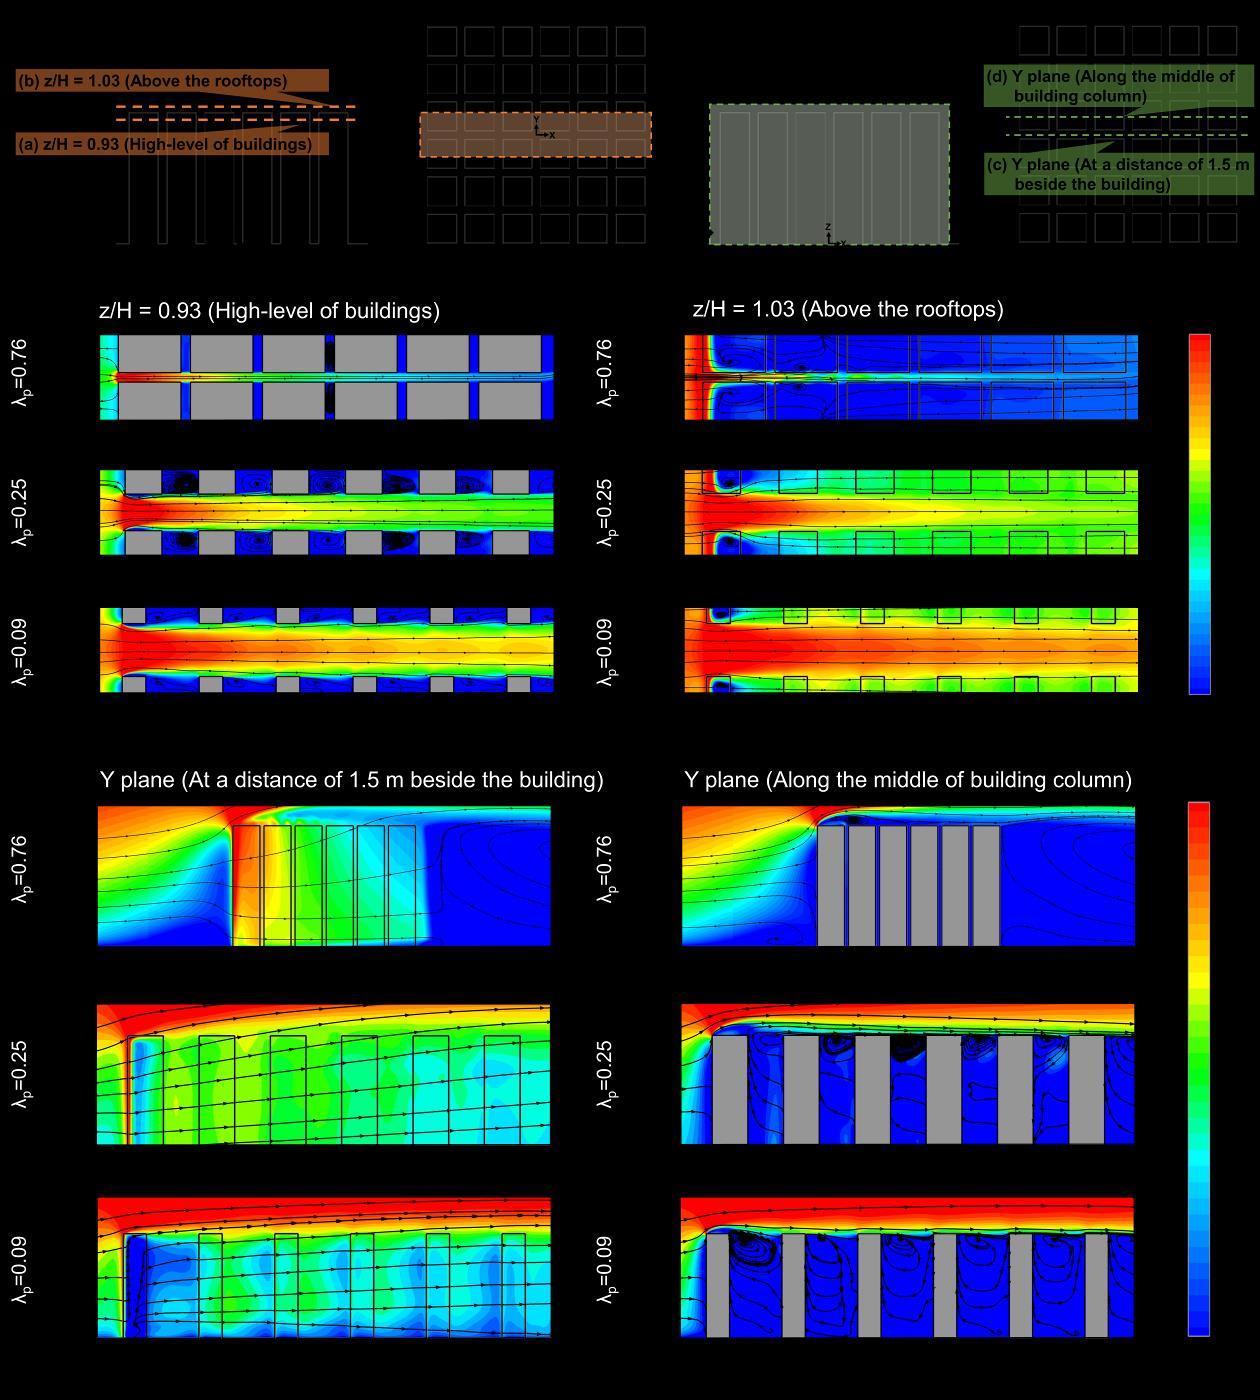
High-fidelity CFD simulations are performed to investigate the effect of the building arrangement and height for a 2×2 array of high-rise buildings in close proximity. The following parameters are studied: (i) the passage width between the two upstream buildings (w), (ii) the streamwise distance between the upstream and the downstream buildings (d), (iii) the height difference between the upstream and the downstream buildings (ΔH) and (iv) the type/orientation of the wind turbine for wind energy harvesting. The analysis focuses on the wind speed and the wind power density along the upstream and the downstream building passages as well as on the building roofs.
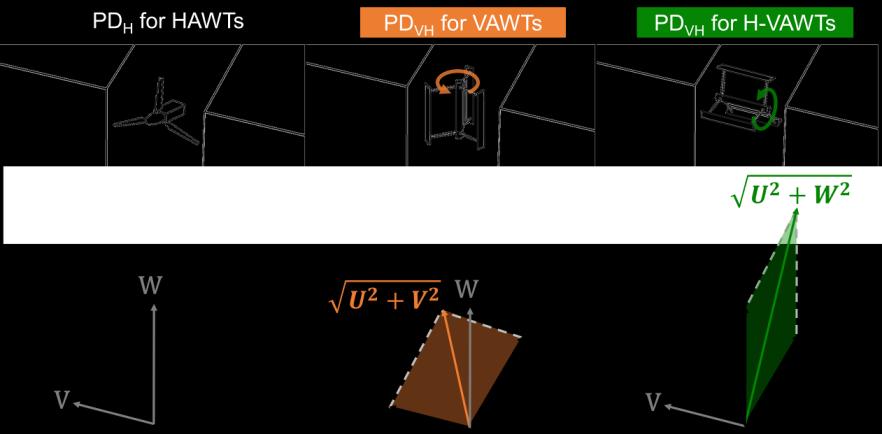
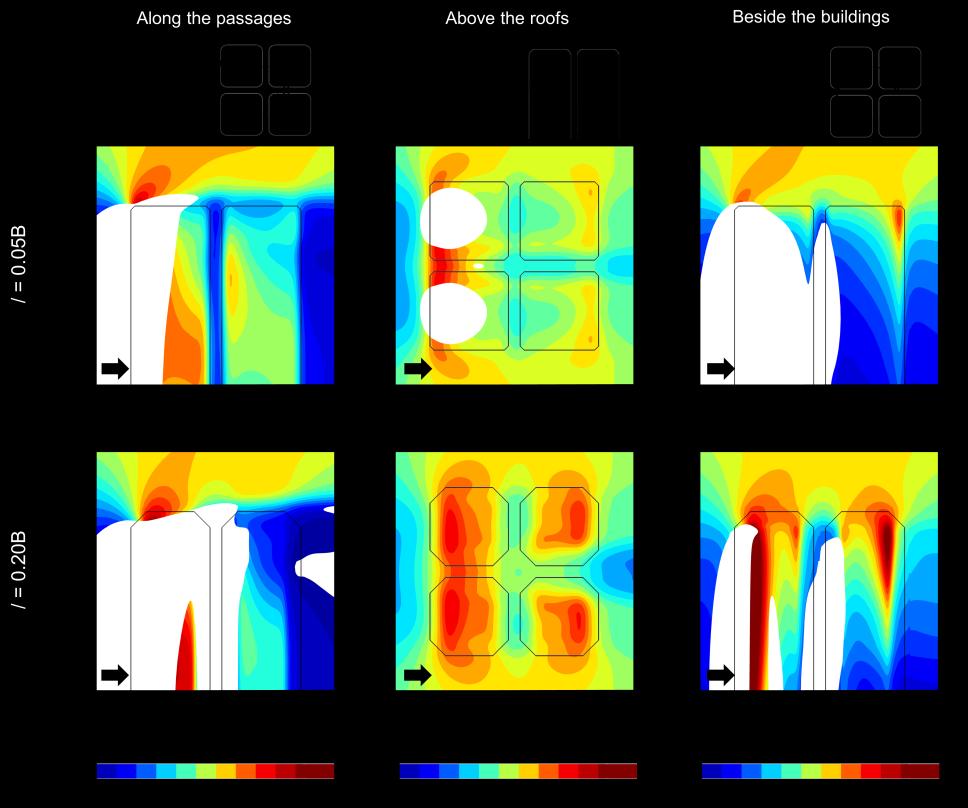
The main conclusions are summarized below: A wider passage width of the upstream passage (higher w) leads to a decrease in the wind speed in this passage. A maximum reduction in PD/PDref of 60% is observed in the upstream passage at z/H = 0.97 when w increases from 0.15B to 0.75B. Conversely, increasing w from 0.15B to 0.75B, results in a notable increase of 207% in PD/PDref in the downstream passage at z/H = 0.97. The longest d of 0.6B achieves an increase in the maximum power density up to 65% compared with that for d = 0.15B in the upstream passage at z/H = 0.97. Increasing d only leads to minor reductions in PD with the differences less than 11% in the downstream passage at z/H = 0.97. For ΔH ≥ 0, the flow in the upstream passage at z/Hu = 0.97 and over the upstream rooftop is highly accelerated to PD/PDref of 2.0. The reference case with equal building height, ΔH = 0, presents the highest wind power density of 2.0 in the upstream passage. For ΔH < 0, the flow in the downstream passage at z/Hd = 0.97 and over the downstream rooftop is accelerated to PD/PDref of 1.7. The case with ΔH = -0.2H provides the maximum PD/PDref of 1.8, that is nearly 364% higher than the reference case (ΔH = 0). The power densities calculated for a horizontally-mounted VAWT are higher than those of a HAWT and a typical VAWT by approximately 11% – 37% at z/Hd = 0.97 for the normal wind direction of 0°. This proposes significant contribution of the vertical velocity component, concluding that the horizontally-mounted VAWT is the best option for wind energy harvesting in the passage between the buildings as well as along the rooftop.