Chapter 3
48
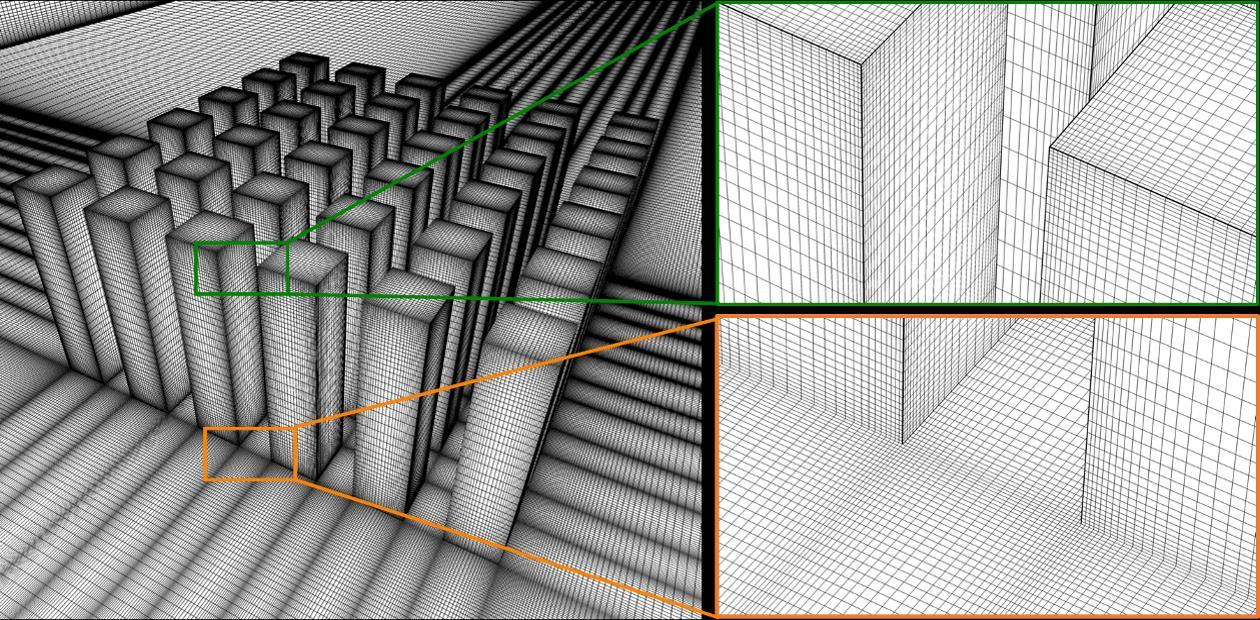
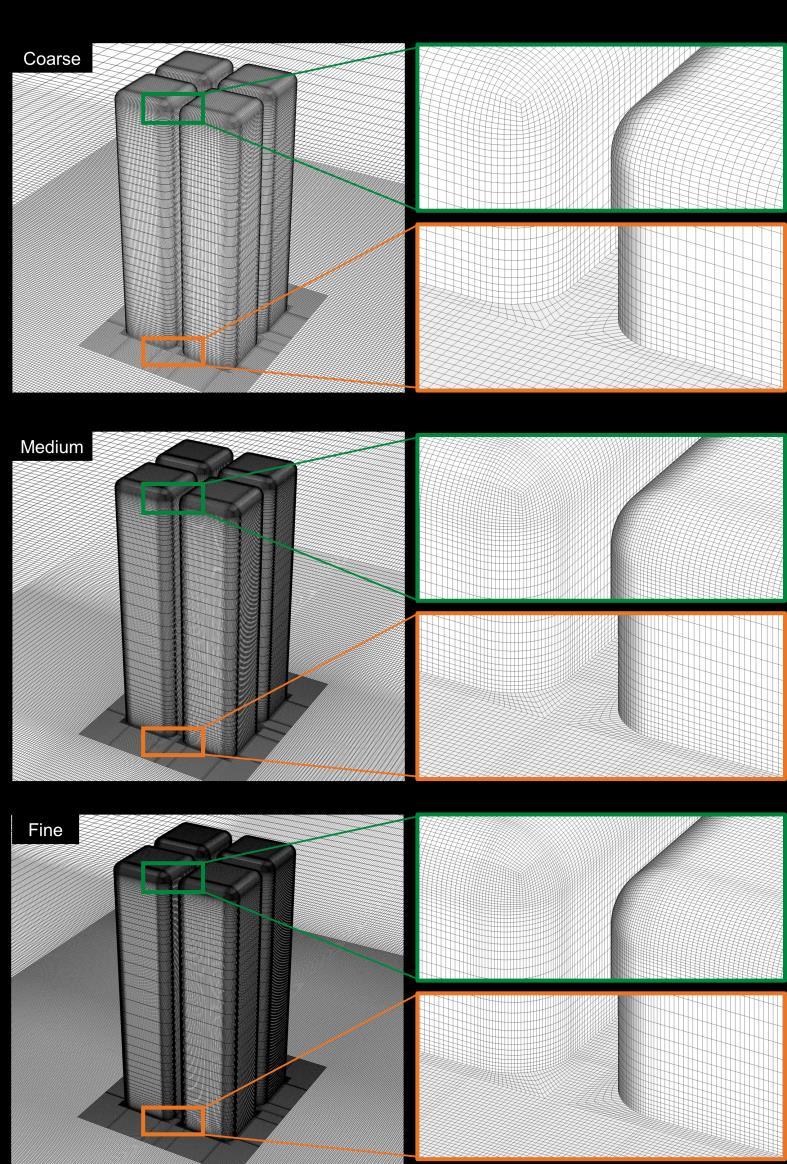
Figure 3.5. (a) Coarse (11.3 million cells), (b) medium (18.0 million cells), and (c) fine grids (47.8 million cells) for Case R3. Enlarged views show the grid near the ground and roof.
3.4.3
Grid-sensitivity analysis
A grid-sensitivity analysis is performed using three uniformly refined grids with a refinement factor of √2. The analysis is performed for case R3 (r = 0.15B). The rounded corner shape is selected. The three grids are shown in Fig. 3.5. The number of cells for the coarse, medium and fine grids is 11,277,645, 18,023,086 and 47,785,776, respectively. Fig. 3.6 compares U/Uref and TI/TIref along the vertical centerline (y/B = 0) at z/H = 0.93 (just below the roof) for the three grids. The results indicate that the average deviation of U/Uref and TI/TIref between the coarse and