PhD Thesis by Yu-Hsuan Juan

Page 89

Urban wind energy potential: Impacts of urban density and layout

75

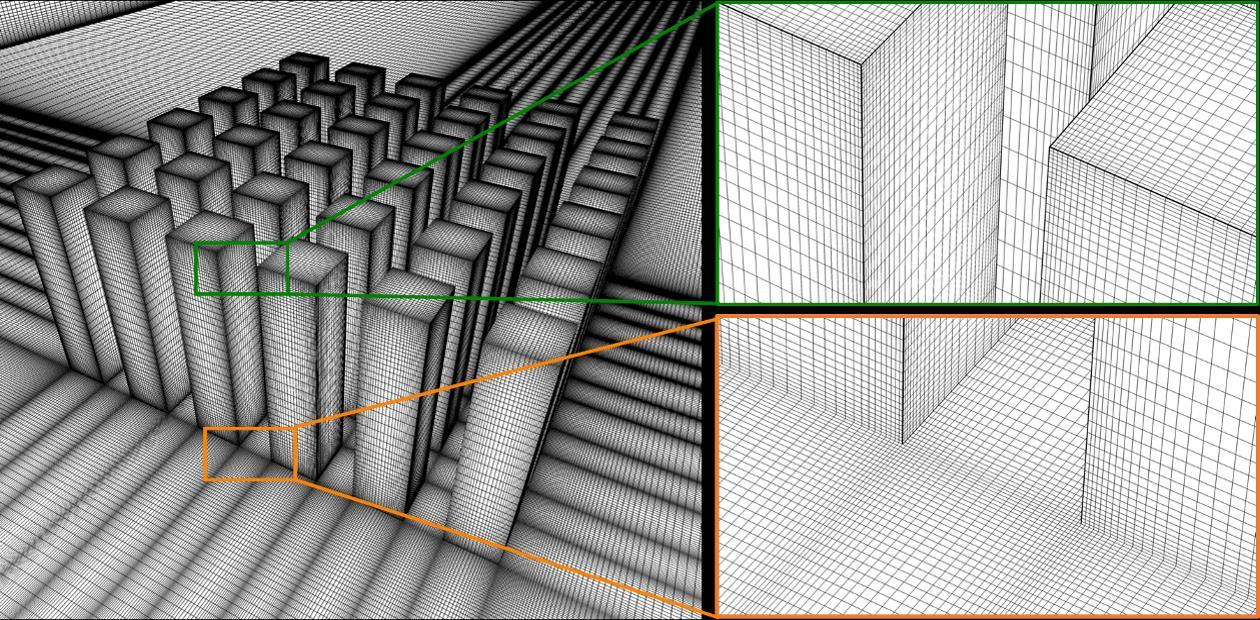
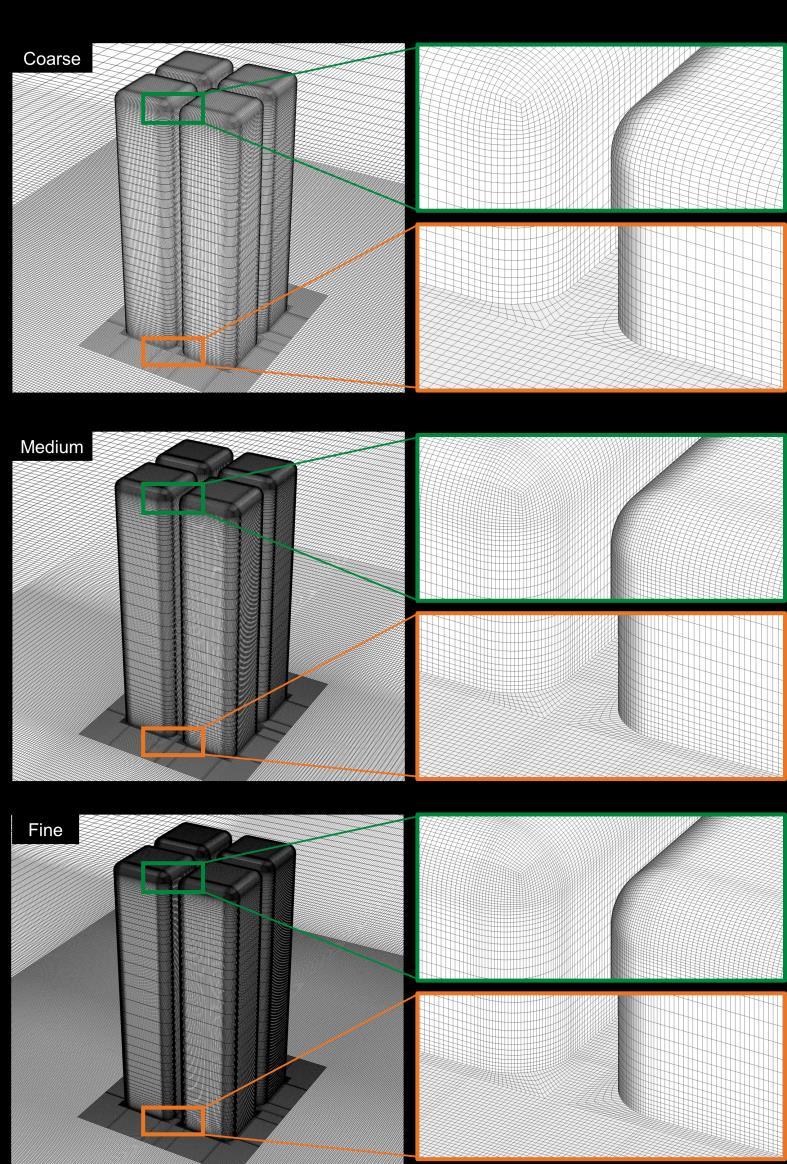
grid numbers for all cases vary approximately 18-26 million, consisting of the hexahedral and prismatic cells only.

Figure 4.6. Computational mesh of Case A4 for the base grids, with magnification of grids near roof and ground.

4.3.3

Computational settings

The neutral atmospheric boundary layer inflow profiles of mean wind velocity U, turbulent kinetic energy k, and turbulence dissipation rate ε are prescribed at the inlet [126]. 𝑈(𝑧) =

∗ 𝑢𝐴𝐵𝐿

𝜅

𝑙𝑛 (

𝑧+𝑧0 𝑧0

∗ 2 𝑘(𝑧) = 3.3𝑢𝐴𝐵𝐿 ∗ 𝑢𝐴𝐵𝐿 =

𝜅𝑈ℎ 𝑙𝑛(

ℎ+𝑧0 ) 𝑧0

)

(4.1) (4.2) (4.3)

here z is the height coordinate, u*ABL is ABL friction velocity, and κ is the von Karman constant (of 0.42). In Eq (4.1), the aerodynamic roughness length (z0) is 1 m for treating the surroundings of studied high-rise buildings in a densely built-up area by the updated Davenport-Wieringa roughness classification [100] (see Section Classification comparison and an update in Ref. 59). In Eq (4.3), the friction velocity (Uh) is 5m/s at the height of 10 m, while the reference wind speed (Uref) of 9.4 m/s at the reference height of 90 m. The standard wall functions with roughness modifications are employed on the ambient ground with the associated roughness height ks of 0.15 and roughness constant Cs of 8, respectively. All CFD simulations are performed by the 3D steady RANS equations with the RSM model. No-slip boundary conditions and the standard wall functions are implemented to the building surfaces. The zero-gauge static pressure is set at the outlet surface of the computational domain, while the symmetric conditions are imposed on the top and lateral surfaces. All the normalized residual errors of flow variables converge to 10−6 with the mass balance check under 1% to attain the steady wind field environments.


Turn static files into dynamic content formats.

Create a flipbook

Articles inside

References

29min
pages 151-164

Biography

1min
pages 165-166

4.5 Discussion

3min
pages 105-106

4.4.2 Impact of building corner shape

8min
pages 97-103

5.1 Introduction

13min
pages 112-116

5 Urban wind energy potential for a realistic high-rise urban area

1min
page 111

4.4.1 Impact of urban density

9min
pages 91-96

4.3.3 Computational settings

1min
page 89

4.3.2 Computational domain and grid

2min
page 88

4.2.1 Turbulence model sensitivity analysis

1min
page 85

4.2 CFD validation study

2min
pages 83-84

4 Urban wind energy potential: Impacts of urban density and layout

1min
page 79

3.5.5 Impact of wind direction

1min
page 76

4.1 Introduction

8min
pages 80-82

3.5.4 Impact of wind turbine type and orientation

3min
pages 73-75

3.5.3 Impact of corner radius

2min
pages 71-72

3 Urban wind energy potential: Impacts of building corner modifications

1min
page 53

3.5.2 Impact of chamfer length

2min
page 70

3.4.3 Grid-sensitivity analysis

1min
pages 62-63

2.7 Conclusions

3min
page 52

3.2.2 CFD validation: computational settings and results

3min
pages 58-59

3.3 Test cases

1min
page 60

2.6 Limitations of the study

1min
page 51

Discussion ...................................................................................................................................... 131

1min
page 20

buildings (d

12min
pages 42-50

Summary and Conclusions.......................................................................................................... 133

1min
page 21

Summary

2min
page 15

1.4 Thesis outline

3min
pages 23-24

2.2.2 CFD validation: computational domain and grid

1min
page 30

2.2.3 CFD validation: other computational settings

2min
pages 31-32

2 Urban wind energy potential: Impact of building arrangement and height

1min
page 25
Issuu converts static files into: digital portfolios, online yearbooks, online catalogs, digital photo albums and more. Sign up and create your flipbook.