Urban wind energy potential: Impacts of urban density and layout 1
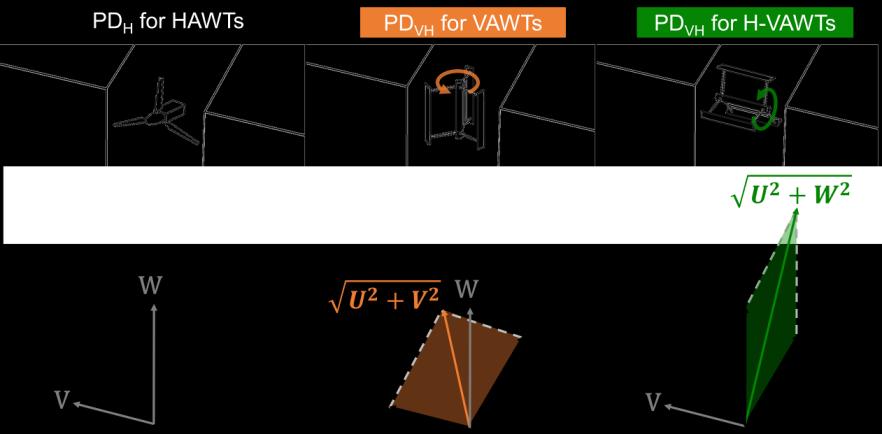
PD = 2 𝜌𝑉 3
77 (4.4)
Here V is the velocity magnitude, whereas is the air density. PD is normalized by the reference incident power density, specifically, PDref = 508.7 W/m2 at the building height. Another important factor is turbulence intensity, which is of great interest as the threshold to prevent equipment damages during turbine operations. The limit of reference turbulence intensity (Iref) is prescribed as the classes of wind turbines derived from the International Electrotechnical Commission (IEC) Standard 61400-1 [128] (see Section 4.6.2 Wind turbine classes of the IEC). This is also the representative value of hub-height turbulence intensity at a mean wind speed of 15 m/s averaged over a time of 10 min for a function of turbine class, expressed as below: Iref =
TI 0.75+
5.6
(4.5)
V
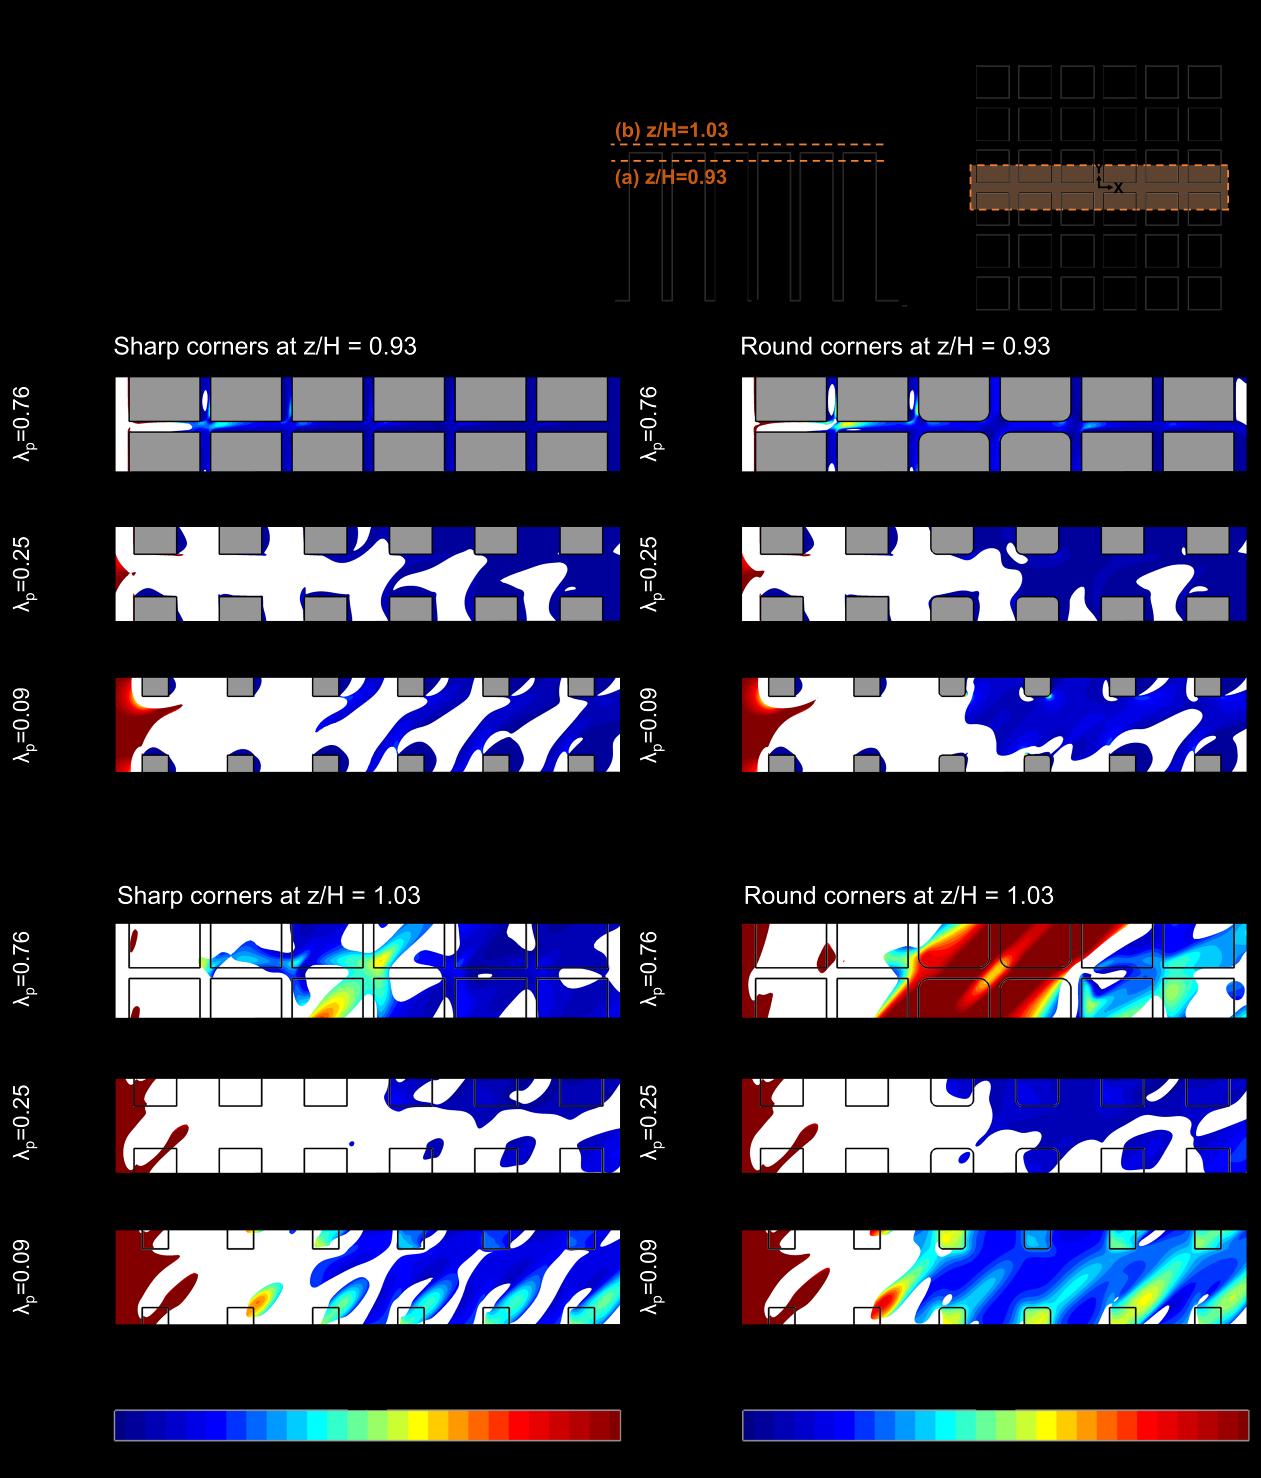
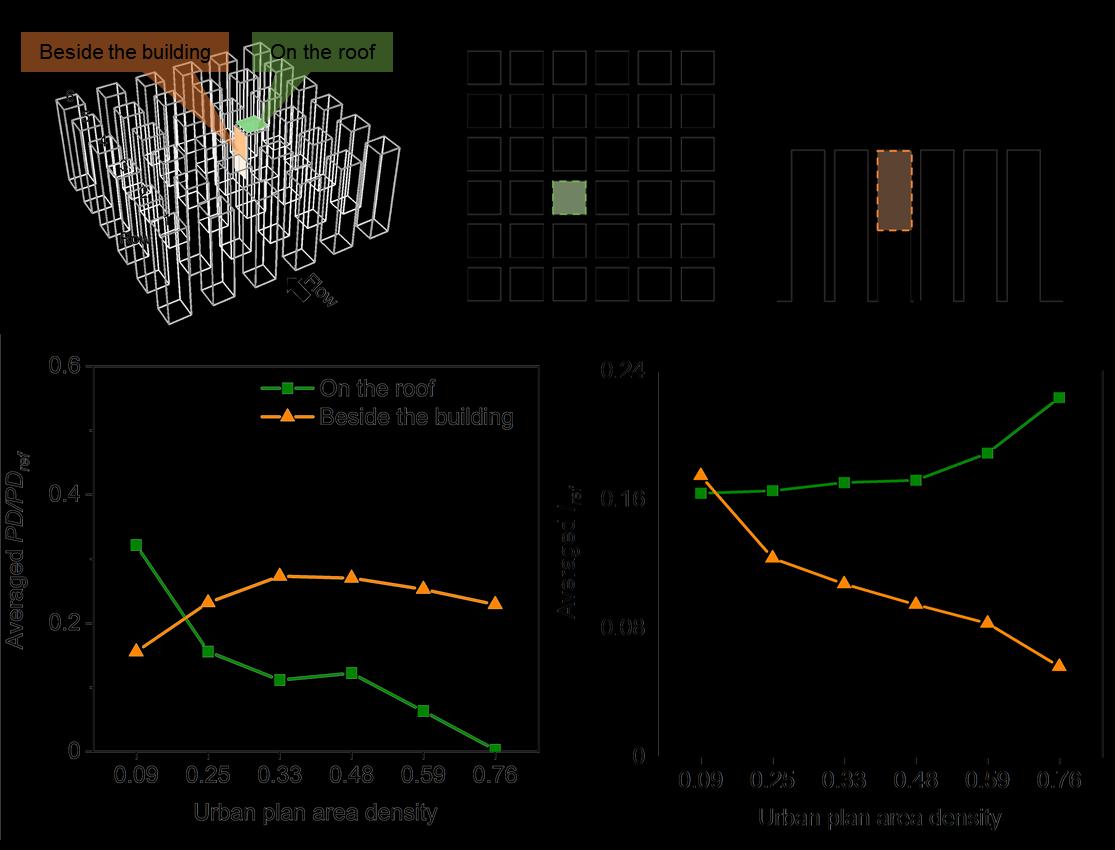
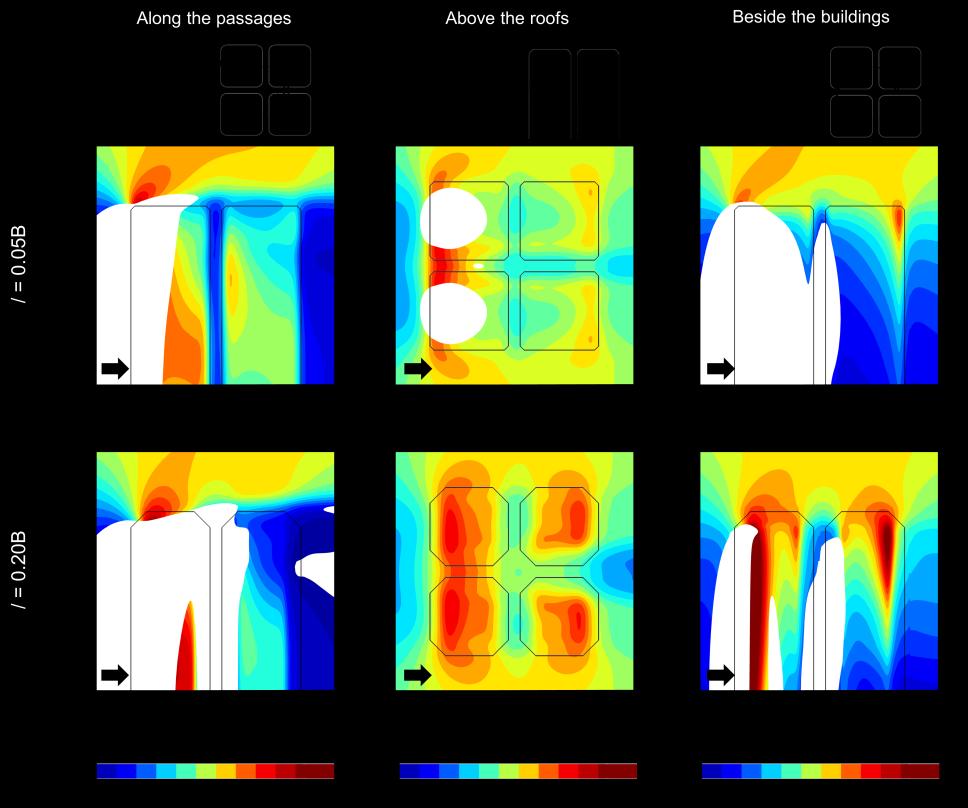
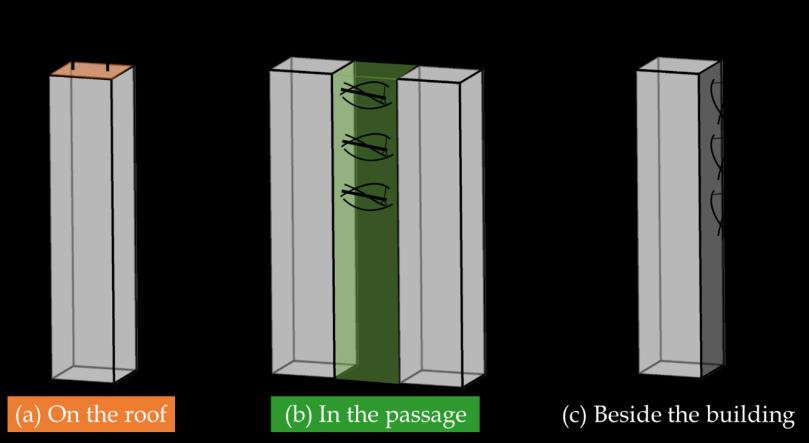
The values of Iref of 0.16, 0.14, and 0.12 are categorized into Class A, B, and C of small wind turbine classification based on the IEC standards. This study adopts Iref of 0.16 for Class A wind turbine as the threshold of the acceptable turbulence level for turbine installation [128]. To investigate the effects of the high-rise building array layout on wind energy harvesting, the general possible areas of deploying wind turbines are: (i) mounted on the rooftop, (ii) placed between two adjacent buildings, (iii) located beside the sidewall of buildings. The presence of high-rise building array within the free stream causes two outcomes. One is the high power densities from accelerated airflow speeds and other is the appropriate reference wind turbulence intensity in the vicinity of high-rise buildings. 4.4.1
Impact of urban density
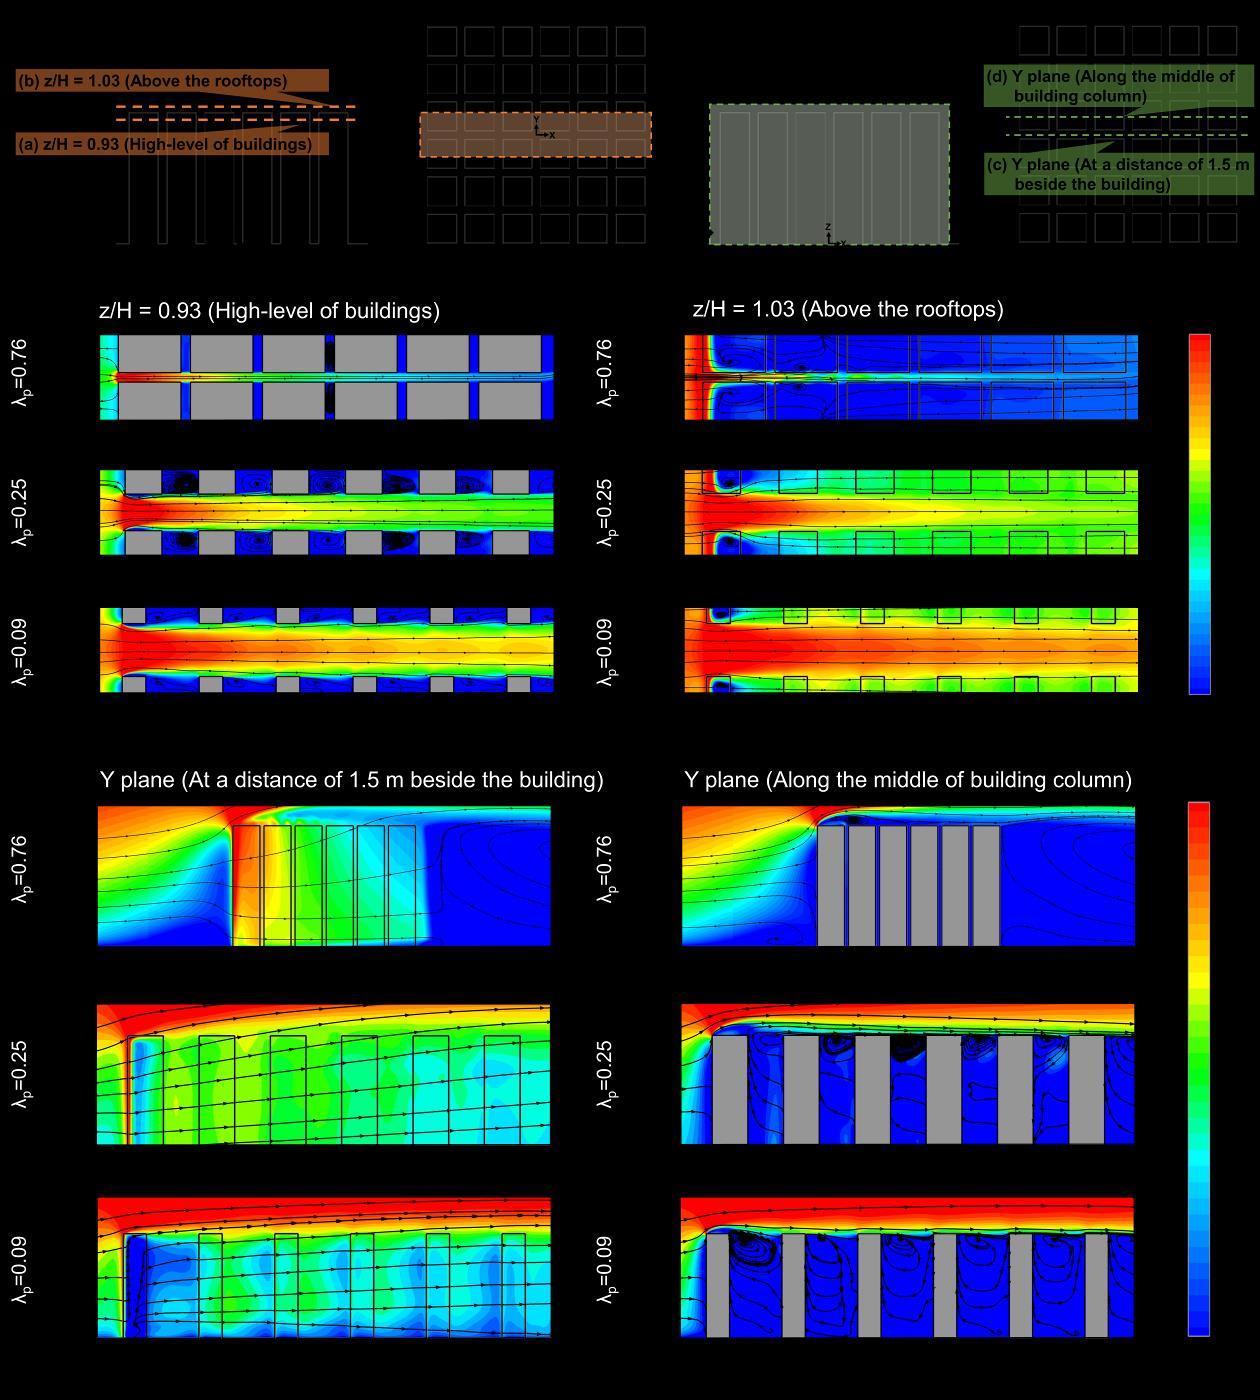
Figure 4.8 illustrates the predicted contour plots of dimensionless velocity magnitude V/Vref (with superimposed streamlines) over the horizontal x-y planes (a) the high-level buildings and (b) above the roofs as well as the vertical x-z planes (c) beside the building sidewalls and (d) along the middle of building column above the roofs for the urban layouts of λp= 0.76, 0.25, 0.09 and the normal wind direction of 0°. Those specific planes are used to characterize the wind flow field around the building array, with special attention to those installable areas limited to (i) beside the sidewall of buildings and (ii) above the roofs for turbine installation. The specified heights of horizontal x-y planes for the high-level buildings and above the roofs are z/H=0.93 and 1.03, respectively. The vertical x-z planes are selected at a distance of 1.5 m beside the sidewalls and along the middle 3-column of buildings above the roofs. For the sake of brevity, only the wind characteristics for the layouts of compact urban (λp = 0.76), medium urban (λp = 0.25), and sparse urban (λp = 0.09) are presented in Figs. 4.8 - 4.10. The following observations can be made: −
−
For the regions along the middle of the street canyon of building array in Fig. 4.8a, the airflows with declining λp from 0.76 to 0.09 smoothly permeate through broader street widths into the building array with elevated wind velocities of V/Vref > 0.9 (marked in redcolor areas) along the passage, caused by the channeling effect between parallel buildings. For the regions above the roof in Fig. 4.8b and 4.8d, essentially, the approaching wind stagnates and diverges upwardly at the rooftops of first row buildings, and then travels toward the downstream with the decelerating airflows. For the compact urban layout at λp = 0.76, it can be visualized that the shear wind over the roof tends to radiate from the windward corner with the largest expansion angle near the roof. The associated recirculation region above the roof is relatively large, with low velocities along the roofs of downstream buildings. In contrast, for the sparse urban layout (λp = 0.09), the recirculation region above the roof is smaller due to the expansion of the high-speed shear wind around