TECHNICAL DISSERTATION
CARBON ANALYSIS
Aaron Torres, 16042010
Dissertation: 7CTA1141-0905-2021
Assignment 4: Technical Dissertation
Tutor: Ian Owen

0.455 KgCO2/Kg 0.263 KgCO2/Kg 4.26 KgCO2/Kg
CARBON ANALYSIS CONTENTS

Title Page Content Page Introduction Embodied Carbon Offsetting Carbon Emissions Foundation Double Sole Plate Ground Floor Panels Ground Floor Walls Loft Floor and Joists 1 2 3 4 5 6 7 8 9 10 Loft Floor Walls Roof Timber Cladding Windows Total Embodied Carbon Heating and Cooling EPS vs PU Insulation Carbon Analysis Findings Carbon Calculations References 11 12 13 14 15 16 17 18-21 22 23
This technical dissertation explores the embodied carbon (EC) aspect of the thesis project. It will investigate the EC of the entire tiny home, breaking it down into its various pieces. This will then be used to calculate the total embodied carbon (TEC) for all the tiny homes. Doing an EC analysis will inform the project on how much carbon is incorporated to which the project can work to offset that amount of carbon.

The dissertation is split into 3 sections. The first section is the context explaining what embodied carbon is and the different ways to offset it. The second is the EC calculations of the tiny home, breaking down the analysis into the different layers of the tiny home. The third section is exploring the findings of the calculation with the conclusion and ways to offset the findings.
The EC analysis uses the carbon emissions of each material from The Inventory of Carbon and Energy (ICE) database. One of the limitations can be that the data is from 2019 while the other is that the tiny home is constructed mainly from Structurally Insulated Panels (SIPs) which the ICE database does not include. Therefore the calculations have split the SIPs into its different materials which could affect the actual embodied carbon of the tiny homes.

Aims
The technical dissertation aims to understand how much carbon the tiny homes embody and explore the ways to offset the amount of embodied carbon.

Objectives
To achieve the aims, the objectives include:
1. Conduct the carbon calculations on the tiny homes.
2. Analyse the results from the calculations
3. Explore the ways to offset the embodied carbon.
Question
How much carbon is embodied in the tiny home construction and how can the project offset or reduce it?
INTRODUCTION AIMS, OBJECTIVES AND QUESTION
ICE Database
Polyurethane Insulation (SIP Block Spline) 4.26 0.18 33 5.94 25.3044 Timber, C16 Softwood (Window Frame) 0.263 0.05 390 19.5 5.1285 Total Embodied Carbon 865.886
CARBON ANALYSIS EMBODIED CARBON
“Buildings are currently responsible for 39% of global energy related carbon emissions: 28% from operational emissions, from energy needed to heat, cool and power them, and the remaining 11% from materials and construction [also known as embodied carbon]...” - World Green Building Council.

Embodied carbon refers to the carbon emissions released during the extraction, manufacturing, transportation, construction and end-of-life phases of buildings; it accounts for around 11 per cent of all global carbon emissions. Embodied carbon may refer to the embodied carbon of a whole building or the embodied carbon of a single building material. It considers how many greenhouse gases (GHGs) are released throughout the supply chain and includes the extraction of materials from the ground, transport, refining, processing & assembly, in use and end of life. The embodied carbon does not include the operational carbon.
Finding out the embodied carbon allows people to be able to understand how much carbon the project really emits, rather than just the operational carbon emissions. From knowing how much embodied carbon the project emits, then can you start to reach net zero carbon buildings.
This analysis aims to understand the total embodied carbon of the tiny homes which will help to highlight how much embodied carbon the project produces. By understanding the amount of embodied carbon there is, the project can then figure out different methods to offset the embodied carbon.
 Diagram from Carboncure
Diagram from RIBA’s Embodied and whole life carbon assessment for architects
Diagram from Carboncure
Diagram from RIBA’s Embodied and whole life carbon assessment for architects
CARBON ANALYSIS REDUCING AND OFFSETTING CARBON EMISSIONS
There are various ways to offset and reduce the carbon emissions produced by a building. One is to focus on reducing the operational carbon such as using renewable technology within the domestic household or in creating the building. Another is to use low carbon and sustainably sourced materials. The main way of reducing carbon emissions is by repurposing or reusing existing buildings and materials.

For this project, the main way of reducing carbon emissions is the use of structurally insulated panels (SIPs). SIPs main benefits are their airtightness and insulation, with the main aspect of reducing carbon through reducing the energy consumption for heating and cooling.
Timber has a lower embodied energy than all other mainstream construction materials. Curing, cutting and sourcing timber and using it in construction requires only basic tools and very little energy compared to materials such as brick, metal or plastic which must be heated to extract the raw materials therefore by mainly using timber-based materials like SIPs and OSB will reduce the carbon emissions.
Another way to reduce carbon emissions is by using low-carbon concrete mixes. In this case, the foundation calculations specified 3 different concretes, one standard cement with no mix, concrete with fly ash mix and concrete with blast-furnace slag mix. By using the concrete with either fly ash or blast-furnace slag, it reduces the embodied carbon for the foundation drastically.
SIPs can drastically reduce the waste generated during construction by using advanced optimization software and automated fabrication technology to ensure the most efficient use of material. From the OSB production process to the use of the insulation, all materials used for the SIP are recycled or can be recycled. Offsite manufacturing results in less waste on-site, reduced build time and better quality.
Timber has a lower embodied energy
Low carbon concrete
Reduce waste
CARBON ANALYSIS FOUNDATION EMBODIED CARBON

The foundation uses 20/25 MPa concrete for the foundation walls and 25/30 MPa concrete for the foundation footing which brings the carbon emissions to 2228.35 Kg of CO2. To reduce the embodied carbon (EC) of the foundation, it can use concrete that has either a percentage of blast-furnace slag or fly ash mixed into the concrete.
By using Concrete mixed with 70% blast-furnace slag, it reduces the material emissions from 0.112 and 0.119 to 0.053 and 0.056 which brings the EC to 1052.595 KgCO2/Kg. However GGBS concrete takes longer to set than traditional concrete.
By using Concrete mixed with 40% Fly Ash, it reduces the material emissions from 0.112 and 0.119 to 0.088 and 0.093 which brings the EC to 1747.82 Kg of CO2.
There are different thresholds on the upper limits of the replacement materials of blast-furnace slag and fly ash. The thresholds are linked to the strength class of the concrete. Fly ash has lower embodied energy and carbon but is limited to a 40% threshold, blast-furnace slag has a higher embodied carbon than fly ash but is able to replace up to 70-80% of the concrete which brings the overall embodied carbon lower.
Despite the advantage of GGBS, fly ash is encouraged to be used as the replacement material as fly ash is abundant in supply and large quantities are land filled each year.
Therefore to make the foundation as low carbon as possible while still considering sourcing the replacement materials of the concrete, choosing concrete mixed with fly ash is more suitable considering the material is more abundant and available. The EC of the foundation would be 1747.82 Kg of CO2.
The chart below shows the calculations of each concrete type.
The data calculations only include material sourcing to the end of the factory processes and not the transportation but the average delivery distance of ready mix concrete is 8.3km by road
The Foundation calculations exclude the EC of the Rebar of Reinforced Concrete
Emissions Calculations Material Material Emissions (KgCO2/Kg) 20/25 MPa Concrete (Foundation Walls) 0.112 25/30 Mpa Concrete (Foundation Footing) 0.119 RC 20/25 Mpa 40% Fly Ash Concrete (Foundation Walls) 0.088 RC 25/30 Mpa Fly 40% Ash Concrete (Foundation Footing) 0.093 RC 20/25 Mpa 70% Blast Furnace Slag Concrete (Foundation Walls) 0.053 RC 25/30 Mpa 70% Blast Furnace Slag Concrete (Foundation Walls) 0.056
Carbon Emissions Calculations
CARBON ANALYSIS DOUBLE SOLE PLATES EMBODIED CARBON
The treated sole plates embodied carbon uses C16 timber for its calculations. The calculations split the sole and bottom plates into 2 categories and then added the total of each category to get the total embodied carbon

The sole plates have a embodied carbon of 42.08 KgC02/Kg.
The bottom plates have an embodied carbon of 19.725 KgCO2/Kg.
Total embodied carbon is 61.8 Kg of CO2.
The chart below shows the calculations of each plates.
Carbon Emissions Calculations
The data calculations only include material sourcing to the end of the factory processes and not the transportation.
Emissions Calculations Material Material Emissions (KgCO2/Kg) Planning App. Volume (m3) Density (kg/m3) Mass (Kg) Project Emissions (kg) = Mass x material emissions Timber, C16 Soft Wood (Sole Plates) 0.263 0.32 500 160 42.08 Timber, C16 Softwood (Bottom Plates) 0.263 0.15 500 75 19.725 Total Embodied Carbon 61.805
CARBON ANALYSIS GROUND FLOOR PANELS EMBODIED CARBON
The calculations uses OSB, C16 Timber and Polyurethane Insulation for its calculations. The calculations split the ground floor SIPs into 5 seperate categories and then added the total of each category to get the total embodied carbon
The OSB of the SIPs have an embodied carbon of 90.27 KgCO2/Kg.
The Insulation of the SIPs have an embodied carbon of 302.25 KgCO2/Kg.

The SIP Block Splines have an embodied carbon of 18.43 KgCO2/Kg.
The top, bottom and end plates have an embodied carbon of 17.44 KgCO2/Kg.
Total embodied carbon is 428.38 Kg of C02.
In terms of timber floor construction, it would be similar to the SIP floor structure however joists would be needed to hold the floorboards and insulation. There would also be timber studs in between the insulation creating more chances of thermal bridging. Therefore a traditional timber floor structure would result in a higher embodied carbon since more parts would be needed and be less effective than a SIP floor, it would not reduce thermal bridging or be as airtight as a SIP floor would be.
If the ground floor was made from concrete with the concrete base, insulation and screed, it would already has a higher embodied carbon than the SIP flooring at 1960.04 KgC02/Kg exlcuding any other necessary parts.
Therefore using the SIP as the floor is more effective in reducing the EC of the tiny house.
Carbon Emissions Calculations
The data calculations only include material sourcing to the end of the factory processes and not the transportation.
Emissions Calculations Material Material Emissions (KgCO2/Kg) Planning App. Volume (m3) Density (kg/m3) Mass (Kg) Project Emissions (kg) = Mass x material emissions Ground Floor SIP Panels OSB (SIP Exterior) 0.455 0.31 640 198.4 90.272 Polyurethane Insulation (SIP Insulation) 4.26 2.15 33 70.95 302.247 Timber, C16 Softwood (SIP Top, Bottom and End Blocks) 0.263 0.17 390 66.3 17.4369 OSB (SIP Block Spline) 0.455 0.015 640 9.6 4.368 Polyurethane Insulation (SIP Block Insulation) 4.26 0.1 33 3.3 14.058 Total Embodied Carbon 428.3819 Emissions Calculations Material Material Emissions (KgCO2/Kg) Planning App. Volume (m3) Density (kg/m3) Mass (Kg) Project Emissions (kg) = Mass x material emissions 20/25 MPa Concrete (Concrete Slab) 0.112 1.42 2243.4 3185.628 356.790336 Polyurethane Insulation (Insulation) 4.26 0.35 33 11.55 49.203 CEM I, Ordinary Porland Cement (Screed) 0.912 0.71 2400 1704 1554.048 Total Embodied Carbon 1960.041336
0.00 500.00 1,000.00 1,500.00 2,000.00 2,500.00 SIP Ground Floor Concrete Ground Floor Chart Title 0.00 500.00 1,000.00 1,500.00 2,000.00 2,500.00 SIP Ground Floor Concrete Ground Floor Chart Title 0.00 500.00 1,000.00 1,500.00 2,000.00 2,500.00 SIP Ground Floor Concrete Ground Floor Chart Title
The chart below shows the calculations of the SIP floor compared to a concrete floor.
CARBON ANALYSIS
GROUND FLOOR WALLS EMBODIED CARBON
The calculations uses OSB, C16 and C24 Timber and Polyurethane Insulation for its calculations. The calculations split the ground floor SIP walls into 7 seperate categories and then added the total of each category to get the total embodied carbon
The OSB of the SIPs have an embodied carbon of 253.344 KgCO2/Kg.
The Insulation of the SIPs have an embodied carbon of 760.5378 KgCO2/Kg.
The SIP Block Splines have an embodied carbon of 46.6926 KgCO2/Kg.
The Top, Bottom and End plates have an embodied carbon of 42.0537 KgCO2/Kg.
The Door Frames have an embodied carbon of 11.046 KgCO2/Kg.
The Window Frames have an embodied Carbon of 12.3084 KgCO2/Kg.
Total embodied carbon is 1125.9825 Kg of C02.
Compared to a traditional timber frame construction, the SIP wall uses less embodied carbon, from sourcing to processing and transportation, the SIP system uses fewer variety of materials and less timber, with 11mm thick OSB covering the most surface area. The SIP walls contain only 3 materials to manufacture and can be manufacatured and transported from one location reducing the need of various sourcing locations.
The OSB uses 35% less timber used compared to traditional building methods.

Timber uses 20% of the energy needed for concrete to make a product with equal strength.
The SIPs have a U-value of 0.13 which is a Passivhaus standard.
Carbon Emissions Calculations
The data calculations only include material sourcing to the end of the factory processes and not the transportation.
Emissions Calculations Material Material Emissions (KgCO2/Kg) Planning App. Volume (m3) Density (kg/m3) Mass (Kg) Project Emissions (kg) = Mass x material emissions Ground Floor SIP Walls OSB (SIP Exterior) 0.455 0.87 640 556.8 253.344 Polyurethane Insulation (SIP Insulation) 4.26 5.41 33 178.53 760.5378 ber, C16 Softwood (SIP Top, Bottom and End Blo 0.263 0.41 390 159.9 42.0537 OSB (SIP Block Spline) 0.455 0.03 640 19.2 8.736 Polyurethane Insulation (SIP Block Insulation) 4.26 0.27 33 8.91 37.9566 Timber, C24 Softwood (Door Frame) 0.263 0.1 420 42 11.046 Timber, C16 Softwood (Window Frame) 0.263 0.12 390 46.8 12.3084 Total Embodied Carbon 1125.9825
The chart below shows the calculations of the ground floor sip walls.
CARBON ANALYSIS
LOFT FLOOR AND JOISTS EMBODIED CARBON
The calculations uses OSB, C24 Timber and Hot-Dip Galvanized Steel for its calculations. The calculations split the loft floor and joists into 3 seperate categories and then added the total of each category to get the total embodied carbon.
The OSB floor have an embodied carbon of 52.416 KgCO2/Kg.
The Timber Joists have an embodied carbon of 52.7436 KgCO2/Kg.
The Joist Hangers have an embodied carbon of 46.2231 KgCO2/Kg.
Total embodied carbon is 1125.9825 Kg of C02.
By keeping the joists exposed and not covered, it reduces the need for more OSB needed to cover the joists therefore reducing the EC by 35.014 KgC02/Kg.

The chart below shows the calculations of the OSB floor, joist and extra OSB to cover joists.
Carbon Emissions Calculations
The data calculations only include material sourcing to the end of the factory processes and not the transportation.
Its important to note that the actual joist would be an open web joist however a timber joist was used for the calculations.
Emissions Calculations Material Material Emissions (KgCO2/Kg) Planning App. Volume (m3) Density (kg/m3) Mass (Kg) Project Emissions (kg) = Mass x material emissions Loft Floor OSB (Loft Floor) 0.455 0.18 640 115.2 52.416 Timber, C24 Softwood (Floor Joists) 0.483 0.26 420 109.2 52.7436 Steel, Hot-dip galvanized (Joist Hanger) 2.76 0.0021 7975 16.7475 46.2231 Total Embodied Carbon 151.3827 Emissions Calculations Material Material Emissions (KgCO2/Kg) Planning App. Volume (m3) Density (kg/m3) Mass (Kg) Project Emissions (kg) = Mass x material emissions Extra OSB to cover Joists 0.455 0.12024 640 76.9536 35.013888
CARBON ANALYSIS
LOFT FLOOR WALLS EMBODIED CARBON
The calculations uses OSB, C16 Timber and Polyurethane Insulation for its calculations. The calculations split the loft floor SIP walls into 6 seperate categories and then added the total of each category to get the total embodied carbon

The OSB of the SIPs have an embodied carbon of 334.88 KgCO2/Kg.
The Insulation of the SIPs have an embodied carbon of 472.3488 KgCO2/Kg.
The SIP Block Splines have an embodied carbon of 28.2243 KgCO2/Kg.
The top, bottom and end plates have an embodied carbon of 19.4883 KgCO2/Kg.
The Window Frames have an embodied Carbon of 5.1285 KgCO2/Kg.
Total embodied carbon is 865.886 Kg of C02.
Carbon Emissions Calculations
The data calculations only include material sourcing to the end of the factory processes and not the transportation.
Emissions Calculations Material Material Emissions (KgCO2/Kg) Planning App. Volume (m3) Density (kg/m3) Mass (Kg) Project Emissions (kg) = Mass x material emissions Loft Floor SIP Walls OSB (SIP Exterior) 0.455 1.15 640 736 334.88 Polyurethane Insulation (SIP Insulation) 4.26 3.36 33 110.88 472.3488 Timber, C16 Softwood (SIP Top, Bottom and End Blocks) 0.263 0.19 390 74.1 19.4883 OSB (SIP Block Spline) 0.455 0.03 640 19.2 8.736 Polyurethane Insulation (SIP Block Spline) 4.26 0.18 33 5.94 25.3044 Timber, C16 Softwood (Window Frame) 0.263 0.05 390 19.5 5.1285 Total Embodied Carbon 865.886
The chart below shows the calculations of the loft floor walls.
CARBON ANALYSIS ROOF EMBODIED CARBON
The calculations uses OSB, C16 and C24 Timber, Polyurethane Insulation and Zinc for its calculations. The calculations split the roof into 7 seperate categories and then added the total of each category to get the total embodied carbon
The OSB of the SIPs have an embodied carbon of 334.88 KgCO2/Kg.
The Insulation of the SIPs have an embodied carbon of 472.3488 KgCO2/Kg.
The SIP Block Splines have an embodied carbon of 28.2243 KgCO2/Kg.
The Top, Bottom and End plates have an embodied carbon of 19.4883 KgCO2/Kg.
The Roof Rafters have an embodied carbon of 47.4978 KgCO2/Kg.
The Zinc Sheets have an embodied carbon of 0.6084 KgCO2/Kg.
Total embodied carbon is 789.1782 Kg of C02.
A traditional pitched roof can have up to 8 different parts from the tiles, tile battens, counter battens, insulation, service void, rafters and plasterboard. Compared to a traditional pitched roof the SIP roof is able to provide the same and even better structural and thermal qualities within one product which reduces the carbon emissions from sourcing different materials. The tiny home roof system only needs the rafters, Roof SIPs and Zinc roofing system.


Traditional pitched roof (FirstInArchitecture)
The chart below shows the calculations of the roof buildup.
Carbon Emissions Calculations
The data calculations only include material sourcing to the end of the factory processes and not the transportation.
Emissions Calculations Material Material Emissions (KgCO2/Kg) Planning App. Volume (m3) Density (kg/m3) Mass (Kg) Project Emissions (kg) = Mass x material emissions Roof OSB (SIP Exterior) 0.455 0.48 640 307.2 139.776 Polyurethane Insulation (SIP Insulation) 4.26 3.84 33 126.72 539.8272 Timber, C16 Softwood (SIP Top, Bottom and End Blocks) 0.263 0.24 390 93.6 24.6168 OSB (SIP Block Spline) 0.455 0.03 640 19.2 8.736 Polyurethane Insulation (SIP Block Spline) 4.26 0.2 33 6.6 28.116 Timber, C24 Softwood (Roof Rafters) 0.263 0.43 420 180.6 47.4978 Zinc (Roof) 3.9 0.02 7.8 0.156 0.6084 Total Embodied Carbon 789.1782
CARBON ANALYSIS
TIMBER CLADDING EMBODIED CARBON
The calculations use C16 Timber and is split into 2 categories.

The Cladding Battens have an embodied carbon of 44.1051 KgCO2/Kg.
The Cladding have an embodied carbon of 127.1868 KgCO2/Kg.
Total embodied carbon is 171.2919 Kg of C02.
The chart below shows the calculations of the timber cladding.
Carbon Emissions Calculations
The data calculations only include material sourcing to the end of the factory processes and not the transportation.
Emissions Calculations Material Material Emissions (KgCO2/Kg) Planning App. Volume (m3) Density (kg/m3) Mass (Kg) Project Emissions (kg) = Mass x material emissions Timber Cladding Timber, C16 Softwood (Cladding Battens) 0.263 0.43 390 167.7 44.1051 Timber, C16 Softwood (Cladding) 0.263 1.24 390 483.6 127.1868 Total Embodied Carbon 171.2919
CARBON ANALYSIS WINDOW EMBODIED CARBON
Double Glazed Glass is used for the calculations. The calculations only include the glass and does not take into account the window frame materials.
The glass have an embodied carbon of 126.1131 KgCO2/Kg. Total embodied carbon is 126.1131 Kg of C02. While the embodied carbon is 126.11 Kg of CO2, the placement of the window can be used together with the orientation to take advantage of the prevailing wind direction and passively cool the house reducing the carbon emissions used for cooling the home.
Carbon Emissions Calculations
The data calculations only include material sourcing to the end of the factory processes and not the transportation.

Emissions Calculations Material Material Emissions (KgCO2/Kg) Planning App. Volume (m3) Density (kg/m3) Mass (Kg) Project Emissions (kg) = Mass x material emissions Windows Glass, Double Glazing (Windows) 1.63 0.03 2579 77.37 126.1131
The chart below shows the calculations of the timber cladding.
CARBON ANALYSIS FINDINGS

TOTAL EMBODIED CARBON
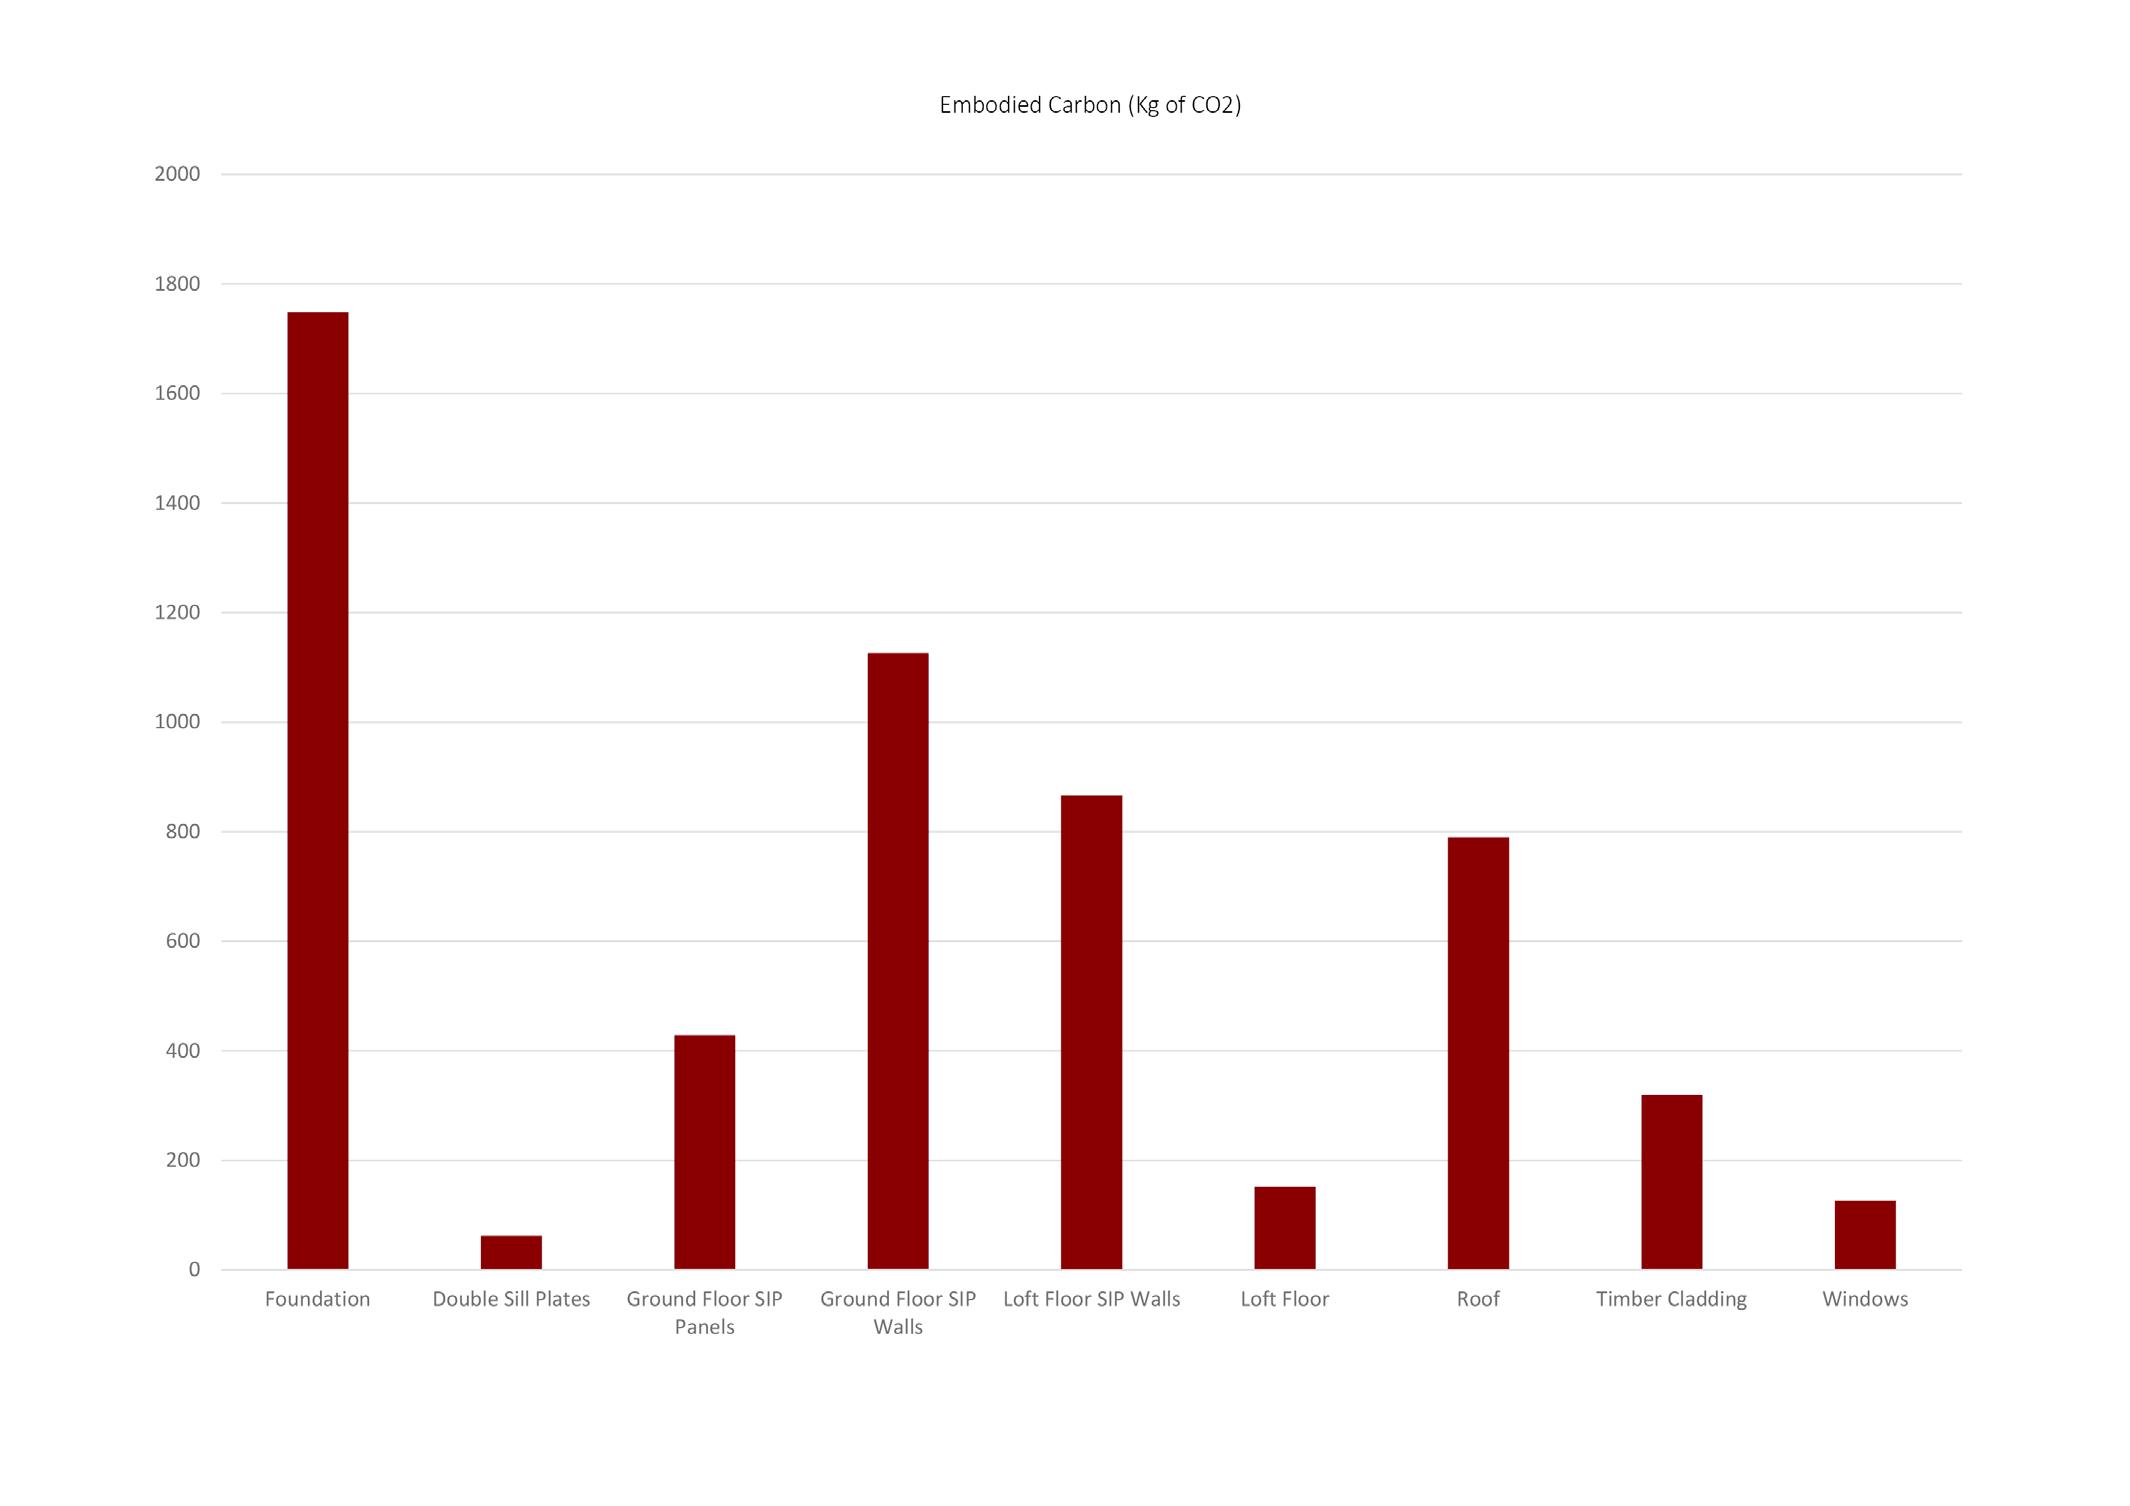
The tiny home is mainly composed of structurally insulated panels (SIPs) with it accounting for the walls, ground floor and roof. The total EC based on the EC calculations from The Inventory of Carbon and Energy (ICE) excluding transport is 5948.374 Kg of CO2. The site holds 25 tiny homes meaning the EC for all the tiny homes would be 148,709.35 Kg of CO2.
Using concrete mixed with fly ash will reduce the total embodied carbon (TEC) of one tiny home to 5467.841Kg of CO2, reducing the EC by 480.89 Kg. With a total of 25 tiny homes, it would be a total of 136,696.03 Kg of CO2. Comparing the two, using a lower carbon concrete for the foundation will reduce the TEC for 25 tiny homes by 12,013.32 Kg of CO2.
The carbon emissions to transport the materials, based on a standard semi-trailer truck is 249Kg of CO2 per lorry. One transport truck is able to hold materials for 3 tiny homes excluding the concrete for the foundation.
Therefore to transport the 25 tiny homes needed for the site would take 9 trucks to transport the necessary amount of materials for all the tiny homes which would be 2241Kg of CO2 one way and 4482 Kg of C02 two ways.
The total embodied carbon for 25 tiny homes including the transportation emissions for both ways is 141,178.03 Kg of CO2 or 141.178 tonnes of CO2. In the UK, the average masonry house takes between 50 and 80 tonnes of CO2 to build, therefore the TEC of all tiny homes including transportation is equal to building 2-3 average masonry homes in the UK.
CO2 Transmission Emission Calculation
Mileage x Tonnes = Tonne-Miles
70m x 22 = 1540 tonne-miles
Weight-based Truck Emission x Tonne-Miles
161.8 x 1540 = 249,172g of CO2 or 249kg of CO2
The charts highlight the embodied carbon for one tiny home excluding transport.
CARBON ANALYSIS FINDINGS
HEATING AND COOLING
Heating and cooling account for 50% of energy use in the average home, making insulation the natural starting point to profoundly impact a structure’s energy performance. SIPs provide high-performance continuous insulation that maintains its stated R-value for the lifetime of the structure.
Rather than offsetting the carbon emissions and energy usage directly through domestic technology, the SIPs focus on reducing the heating and cooling needs of the building through its airtightness, reduced thermal bridging and insulation.
The external walls and roof panels contain SIP block splines to connect the panels with minimal timber only on the top, bottom and endplates. The block splines lower the chances of thermal bridging and heat loss by being an insulated block rather than a timber stud.

Shading and cooling can be reduced by 10% during the summer through the trees on the site. The shade from the trees is able to reduce the cooling costs typically used during summer.
Based on the Insulation for Environmental Sustainability A Guide by XCO2, Buildings are responsible for 50% of EU energy use. The diagram highlights that insulation is the greatest potential in saving C02 emissions compared to other building measures. Using the SIPs significantly improves the thermal insulation of the building compared to traditional timber frame construction. The SIPs have a U-value of 0.13 which is within the Passivhaus standards.
 Diagram from Insulation for Sustainability: A Guide, XCO2 Conisbee – 2002
SIP Block Spline highlighted
Diagram from Insulation for Sustainability: A Guide, XCO2 Conisbee – 2002
SIP Block Spline highlighted
CARBON ANALYSIS FINDINGS


INSULATION: EPS VS PU


Insulation is key in reducing the operational carbon emissions of the building. By insulating the homes and buildings properly with an appropriate thickness, it reduces the need to use air conditioning and heating devices. In this case, choosing the right insulation is also key taking into consideration the embodied carbon of the insulation and its performance qualities.
Although the EC of using EPS insulation is lower than Polyurethane (PU) insulation, PU insulation has a higher R-Value and better chemical, fire and moisture resistance compared to EPS insulation making it a more efficient option than EPS insulation. PU can also be used to glue the insulation and OSB boards together while EPS insulation has to use poly-based adhesive which would increase the EC of the EPS SIPs.
Most SIPs today use two types of insulation - polyurethane (PU) or expanded polystyrene (EPS). Depending on the SIP manufacturers and experts there are different arguments on the benefits of each insulation. While PU insulation provides better insulation qualities than EPS, EPS insulation has the lowest energy consumption of the entire plastic life cycle and is more affordable. Therefore it’s a matter of balancing affordability, efficiency and sustainability aspects.
In the case of this project, the manufacturer and distribution centre of the SIPs are located in one location reducing the transport emissions. The chosen SIP manufacturer also uses PU insulation as their core, therefore the calculations use PU insulation for the core of the SIP walls, floor and roof.
In terms of insulation, the energy saved over the building lifetime due to the insulation outweighs the embodied carbon of the insulation.
Emissions Calculations Material Material Emissions (KgCO2/Kg) Planning App. Volume (m3) Density (kg/m3) Mass (Kg) Project Emissions (kg) = Mass x material emissions Ground Floor SIP Panels OSB (SIP Exterior) 0.455 0.31 640 198.4 90.272 Expanded Polystyrene Insulation (SIP Insulation) 3.29 2.15 33 70.95 233.4255 Timber, C16 Softwood (SIP Top, Bottom and End Blocks) 0.263 0.17 390 66.3 17.4369 OSB (SIP Block Spline) 0.455 0.015 640 9.6 4.368 Expanded Polystyren (SIP Block Insulation) 3.29 0.1 33 3.3 10.857 Total Embodied Carbon 356.3594 Emissions Calculations Material Material Emissions (KgCO2/Kg) Planning App. Volume (m3) Density (kg/m3) Mass (Kg) Project Emissions (kg) = Mass x material emissions Ground Floor SIP Panels OSB (SIP Exterior) 0.455 0.31 640 198.4 90.272 Polyurethane Insulation (SIP Insulation) 4.26 2.15 33 70.95 302.247 Timber, C16 Softwood (SIP Top, Bottom and End Blocks) 0.263 0.17 390 66.3 17.4369 OSB (SIP Block Spline) 0.455 0.015 640 9.6 4.368 Polyurethane Insulation (SIP Block Insulation) 4.26 0.1 33 3.3 14.058 Total Embodied Carbon 428.3819
EPS
Insulation Polyurethane Insulation
Diagram from Insulation for Sustainability: A Guide, XCO2 Conisbee – 2002
Chart comparing EPS and PU Insulation
CARBON ANALYSIS FINDINGS OFFSETTING THE EMBODIED CARBON
SUSTAINABLY SOURCED TIMBER AND CARBON STORAGE
In terms of offsetting the embodied carbon, one way is the carbon storage of timber. The OSB and softwoods used in the tiny homes can store carbon which reduces the carbon emissions of the project.
Based on the ICE Database, carbon storage can only be claimed if the timber is sustainably sourced. As the project aims to be as environmentally friendly as possible, sustainably sourced materials will be used. Therefore the carbon calculations have also been done including the carbon storage.
The total embodied carbon excluding the carbon storage of the timber is 5467.841 Kg of CO2. With the carbon storage, it is 3996.437 Kg of CO2 reducing the embodied carbon by 14071.404 Kg of CO2 per tiny home. With a total of 25 tiny homes, the total embodied carbon (TEC) including carbon storage is 99,910.925Kg of CO2 compared to 136,696.03 Kg of C02. Therefore the carbon storage aspect of timber reduces the TEC of all the tiny homes by 36,785.11 Kg of CO2 or 36.785 metric tonnes.
Graph comparing the TEC of the total tiny homes with and without carbon storage Carbon calculations of a single tiny home with and without carbon storage
Timber parts highlighted
Chart Title
Total Embodied Carbon with storage is 5467.841 - 1471.404 Kg of C02.
Emissions Calculations Including Carbon Storage Material Material Emissions (KgCO2/Kg) Planning App. Volume (m3)Density (kg/m3) Mass (Kg) Project Emissions (kg) Mass material emissions Foundation RC 20/25 Mpa 40% Fly Ash Concrete (Foundation Walls) 0.088 2243.4 13460.4 1184.5152 RC 25/30 Mpa Fly 40% Ash Concrete (Foundation Footing) 0.093 2.2 2753.2 6057.04 563.30472 Double Sill Plates Timber, C16 Softwood (Sole Plates) -1.55 0.32 500 160 -248 Timber, C16 Softwood (Bottom Plates) -1.55 0.15 500 75 -116.25 Ground Floor SIP Panels OSB (SIP Exterior) -1.5 0.31 640 198.4 -297.6 Polyurethane Insulation (SIP Insulation) 4.26 2.15 33 70.95 302.247 Timber, C16 Softwood (SIP Top, Bottom and End Blocks) -1.55 0.17 390 66.3 -102.765 OSB (SIP Block Spline) -1.5 0.015 640 9.6 -14.4 Polyurethane Insulation (SIP Block Insulation) 4.26 0.1 33 3.3 14.058 Ground Floor SIP Walls OSB (SIP Exterior) -1.5 0.87 640 556.8 -835.2 Polyurethane Insulation (SIP Insulation) 4.26 5.41 33 178.53 760.5378 Timber, C16 Softwood (SIP Top, Bottom and End Blocks) -1.55 0.41 390 159.9 -247.845 OSB (SIP Block Spline) -1.5 0.03 640 19.2 -28.8 Polyurethane Insulation (SIP Block Insulation) 4.26 0.27 33 8.91 37.9566 Timber, C24 Softwood (Door Frame) -1.55 0.1 420 42 -65.1 Timber, C16 Softwood (Window Frame) -1.55 0.12 390 46.8 -72.54 Loft Floor SIP Walls OSB (SIP Exterior) -1.5 1.15 640 736 -1104 Polyurethane Insulation (SIP Insulation) 4.26 3.36 33 110.88 472.3488 Timber, C16 Softwood (SIP Top, Bottom and End Blocks) -1.55 0.19 390 74.1 -114.855 OSB (SIP Block Spline) -1.5 0.03 640 19.2 -28.8 Polyurethane Insulation (SIP Block Spline) 4.26 0.18 33 5.94 25.3044 Timber, C16 Softwood (Window Frame) -1.55 0.05 390 19.5 -30.225 Loft Floor OSB (Loft Floor) -1.5 0.18 640 115.2 -172.8 Timber, C24 Softwood (Floor Joists) -1.55 0.26 420 109.2 -169.26 Steel, Hot-dip galvanized (Joist Hanger) 2.76 0.0021 7975 16.7475 46.2231 Roof OSB (SIP Exterior) -1.5 0.48 640 307.2 -460.8 Polyurethane Insulation (SIP Insulation) 4.26 3.84 33 126.72 539.8272 Timber, C16 Softwood (SIP Top, Bottom and End Blocks) -1.55 0.24 390 93.6 -145.08 OSB (SIP Block Spline) -1.5 0.03 640 19.2 -28.8 Polyurethane Insulation (SIP Block Spline) 4.26 0.2 33 6.6 28.116 Timber, C24 Softwood (Roof Rafters) -1.55 0.43 420 180.6 -279.93 Zinc (Roof) 3.9 0.02 7.8 0.156 0.6084 Timber Cladding Timber, C16 Softwood (Cladding Battens) -1.55 0.43 390 167.7 -259.935 Timber, C16 Softwood (Cladding) -1.55 1.24 390 483.6 -749.58 Windows Glass, Double Glazing (Windows) 1.63 0.03 2579 77.37 126.1131 Total Embodied Carbon -1471.40468 Emissions Calculations Material Material Emissions (KgCO2/Kg) Planning App. Volume (m3)Density (kg/m3) Mass (Kg) Project Emissions (kg) Mass material emissions Foundation RC 20/25 Mpa 40% Fly Ash Concrete (Foundation Walls) 0.088 6 2243.4 13460.4 1184.5152 RC 25/30 Mpa Fly 40% Ash Concrete (Foundation Footing) 0.093 2.2 2753.2 6057.04 563.30472 Double Sill Plates Timber, C16 Softwood (Sole Plates) 0.263 0.32 500 160 42.08 Timber, C16 Softwood (Bottom Plates) 0.263 0.15 500 75 19.725 Ground Floor SIP Panels OSB (SIP Exterior) 0.455 0.31 640 198.4 90.272 Polyurethane Insulation (SIP Insulation) 4.26 2.15 33 70.95 302.247 Timber, C16 Softwood (SIP Top, Bottom and End Blocks) 0.263 0.17 390 66.3 17.4369 OSB (SIP Block Spline) 0.455 0.015 640 9.6 4.368 Polyurethane Insulation (SIP Block Insulation) 4.26 0.1 33 3.3 14.058 Ground Floor SIP Walls OSB (SIP Exterior) 0.455 0.87 640 556.8 253.344 Polyurethane Insulation (SIP Insulation) 4.26 5.41 33 178.53 760.5378 Timber, C16 Softwood (SIP Top, Bottom and End Blocks) 0.263 0.41 390 159.9 42.0537 OSB (SIP Block Spline) 0.455 0.03 640 19.2 8.736 Polyurethane Insulation (SIP Block Insulation) 4.26 0.27 33 8.91 37.9566 Timber, C24 Softwood (Door Frame) 0.263 0.1 420 42 11.046 Timber, C16 Softwood (Window Frame) 0.263 0.12 390 46.8 12.3084 Loft Floor SIP Walls OSB (SIP Exterior) 0.455 1.15 640 736 334.88 Polyurethane Insulation (SIP Insulation) 4.26 3.36 33 110.88 472.3488 Timber, C16 Softwood (SIP Top, Bottom and End Blocks) 0.263 0.19 390 74.1 19.4883 OSB (SIP Block Spline) 0.455 0.03 640 19.2 8.736 Polyurethane Insulation (SIP Block Spline) 4.26 0.18 33 5.94 25.3044 Timber, C16 Softwood (Window Frame) 0.263 0.05 390 19.5 5.1285 Loft Floor OSB (Loft Floor) 0.455 0.18 640 115.2 52.416 Timber, C24 Softwood (Floor Joists) 0.483 0.26 420 109.2 52.7436 Steel, Hot-dip galvanized (Joist Hanger) 2.76 0.0021 7975 16.7475 46.2231 Roof OSB (SIP Exterior) 0.455 0.48 640 307.2 139.776 Polyurethane Insulation (SIP Insulation) 4.26 3.84 33 126.72 539.8272 Timber, C16 Softwood (SIP Top, Bottom and End Blocks) 0.263 0.24 390 93.6 24.6168 OSB (SIP Block Spline) 0.455 0.03 640 19.2 8.736 Polyurethane Insulation (SIP Block Spline) 4.26 0.2 33 6.6 28.116 Timber, C24 Softwood (Roof Rafters) 0.263 0.43 420 180.6 47.4978 Zinc (Roof) 3.9 0.02 7.8 0.156 0.6084 Timber Cladding Timber, C16 Softwood (Cladding Battens) 0.263 0.43 390 167.7 44.1051 Timber, C16 Softwood (Cladding) 0.263 1.24 390 483.6 127.1868 Windows Glass, Double Glazing (Windows) 1.63 0.03 2579 77.37 126.1131 Total Embodied Carbon 5467.84122
0.00 20,000.00 40,000.00 60,000.00 80,000.00 100,000.00 120,000.00 140,000.00 160,000.00 Total Embodied Carbon of 25 Tiny Homes, exluding Carbon Storage Total Embodied Carbon of 25 Tiny Homes including Carbon Storage
CARBON ANALYSIS FINDINGS OFFSETTING THE EMBODIED CARBON
TREES AND VEGETATION
Trees are a large part of the site with many trees spread throughout the site. They are also key in absorbing surrounding carbon emissions and offsetting the carbon emissions. Trees are good at holding onto carbon for long periods, even after the tree stops growing. Roughly 50% of the dry mass of a tree is carbon, much of which is stored in the wood fibres.
There are around 40 trees on the site with some having several trunks. There are 25 large main trees with the rest being medium and smaller-sized trees. The average carbon storage of a tree in the UK is 21 Kg of CO2 per year. In terms of the site with 40 trees, approximately 840 Kg of carbon is stored per year. Based on how much the trees alone absorb carbon with an average of 21kg of CO2 per year it would take 118 years to offset the total embodied carbon of the tiny homes.


Shading and cooling can be reduced by 10% during the summer through the trees on the site. The shade from the trees is able to reduce the cooling costs typically used during summer.
 Chestnut tree
Hazel Trees Large London Plane Trees Lime Trees English Oak Trees Elm Trees
Chestnut, English Oak trees and London Plane trees are the large trees which are the ones more likely to absorb more CO2 than the rest.
Chestnut tree
Hazel Trees Large London Plane Trees Lime Trees English Oak Trees Elm Trees
Chestnut, English Oak trees and London Plane trees are the large trees which are the ones more likely to absorb more CO2 than the rest.
STRUCTURALLY INSULATED PANELS CARBON ANALYSIS FINDINGS OFFSETTING THE EMBODIED CARBON
For this project, the main way of reducing and offsetting the carbon emissions is the use of structurally insulated panels (SIPs). SIPs main benefits are their airtightness and insulation, with the main aspect of reducing carbon emissons through reducing the energy consumption for heating and cooling.
The SIPs provide various benefits in offsetting the embodied carbon through:
1. The OSB uses 35% less timber used compared to traditional building methods. Timber uses 20% of the energy needed for concrete to make a product with equal strength.
2. The SIPs have a U-value of 0.13 which is a Passivhaus standard.
3. Building is nearly entirely made of SIPs, reducing sourcing different materials.
4. SIPs improve the airtightness and reduce cold bridging therefore the amount of energy used to heat and cool a room can be cut by up to 50%.
5. SIPs reduce heat loss and improve energy efficiency.
6. Specialist design and cutting systems ensure that minimal waste, any excess materials can be recycled or re-purposed.
SIPs can drastically reduce the waste generated during construction by using advanced optimization software and automated fabrication technology to ensure the most efficient use of material. From the OSB production process to the use of the insulation, all materials used for the SIP are recycled or can be recycled. Offsite manufacturing results in less waste on-site, reduced build time and better quality. Comparing a SIP building to a traditional timber frame building or brick and masonry buildng, the SIP building provides various benefits over the two. One being a lower embodied carbon, another is the efficency of consruction labour and cost.
Another crucial aspect is that the tiny homes can be build reusing previous SIPs meaning the reused or recycled SIPs have a lower carbon footprint as the carbon used to make them has already been spent.
ALTERNATIVE SOLUTIONS CARBON ANALYSIS FINDINGS
Different materials can be used to provide a lower embodied carbon for the tiny homes such as straw, hemp, rammed earth or bamboo. Each one comes with its pros and cons and has been considered however while it can provide a lower carbon impact in terms of the construction materials for the project, it would not be as appropriate and fitting to the context and location of the site as structurally insulated panels (SIPS) are.
Sourcing these materials can be an issue, SIPs are a more local and available material than procuring straw, hemp or bamboo as a construction material in the UK. Building the tiny homes out of rammed earth would dramatically increase the labour costs of the tiny homes as it would need specialists for it. It is more widely created as a self build project. Climate wise, it is not as appropriate due to a colder climate, it would require more insulation than typically needed such as a foam wall with stucco on the outside. Rammed earth would increase reduce the affordability and increase the construction costs and time.
Straw construction is not a common construction material therefore finding a construction specialist will be more difficult and more expensive. Like any natural material like rammed earth and bamboo, it is relatively newer, especially in the UK than in the US, therefore, is more currently done as a self-build unit and not as a commercial or larger-scale residential project.


Therefore the use of SIPs as the main material over materials like straw, hemp, rammed earth or bamboo is more appropriate in providing a design that could blend in more with the site area with their characteristics and materials. The local area has an emphasis on the historical features of their buildings with the design proposal taking influence from them, aiming not to be too visually contrasting in terms of materials or shape.
 Rammed Earth Straw Bale
Hempcrete Bamboo
Rammed Earth Straw Bale
Hempcrete Bamboo
CARBON ANALYSIS FINDINGS
There have been several methods to reduce the embodied carbon of the tiny homes, from using sustainably sourced timber and Structurally Insulated Panels to low carbon concrete and using the natural carbon-capturing properties of the site trees. The main aspect of reducing and offsetting the carbon would be the SIPs, low carbon concrete and timber materials of the tiny homes. While the trees provide carbon storage and carbon sequestering properties, it is difficult to calculate exactly how much carbon they can absorb due to not knowing the age of the trees, hence why the average of 21kg of CO2 was used for the calculations.
However, the main way of reducing carbon for the tiny homes is by reducing their operational carbon rather than the embodied carbon. The operational carbon is drastically reduced due to its small footprint, building materials and appliances. The SIPs with their airtightness and thick insulation reduce the heating and cooling costs of the home with the large windows reducing the need for lighting during the daytime. The design of the tiny home focused more on reducing the operational carbon than the embodied but can still be considered to have a low embodied carbon for the project.
The total embodied carbon of all the entire homes can be said to have a low embodied carbon with the overall final TEC of the 25 tiny homes including the transport is 104,392.914 Kg of CO2, which is equivalent to 1-2 typical UK masonry homes.
Overall the design proposition follows a simple and minimalist design to provide a more efficient and sustainable construction process and result using structurally insulated panels. Each design element from the building form, construction, and materials to the interior ensures a low carbon impact whilst still considering the user in the design. The carbon analysis also support that the tiny homes do provide a lower embodied carbon by comparing the TEC of 25 tiny homes to 2 traditional masonry homes.
CONCLUSION
0 20000 40000 60000 80000 100000 120000 Total
Embodied Carbon for 1 Tiny Home
Total Embodied Carbon for 25 Tiny Homes
Total Embodied Carbon for 25 Tiny Home and Transport
Embodied Carbon for 1 Typical UK 2 Bedroom House
Chart Title Comparison Graph
CARBON ANALYSIS CARBON CALCULATIONS
The carbon calculations specify the embodied carbon for a single tiny home. It only includes cradle to gate embodied carbon. For specific calculations relating to a different parts of the tiny home, refer to the corresponding pages.
For the total embodied carbon of all the tiny homes including transport refer to pg.18.
The carbon calculations only includes sourcing to final processing and excludes transport carbon emissions.
Emissions Calculations Material Material Emissions (KgCO2/Kg) Planning App. Volume (m3)Density (kg/m3) Mass (Kg) Project Emissions (kg) = Mass x material emissions Foundation RC 20/25 Mpa 40% Fly Ash Concrete (Foundation Walls) 0.088 6 2243.4 13460.4 1184.5152 RC 25/30 Mpa Fly 40% Ash Concrete (Foundation Footing) 0.093 2.2 2753.2 6057.04 563.30472 Double Sill Plates Timber, C16 Softwood (Sole Plates) 0.263 0.32 500 160 42.08 Timber, C16 Softwood (Bottom Plates) 0.263 0.15 500 75 19.725 Ground Floor SIP Panels OSB (SIP Exterior) 0.455 0.31 640 198.4 90.272 Polyurethane Insulation (SIP Insulation) 4.26 2.15 33 70.95 302.247 Timber, C16 Softwood (SIP Top, Bottom and End Blocks) 0.263 0.17 390 66.3 17.4369 OSB (SIP Block Spline) 0.455 0.015 640 9.6 4.368 Polyurethane Insulation (SIP Block Insulation) 4.26 0.1 33 3.3 14.058 Ground Floor SIP Walls OSB (SIP Exterior) 0.455 0.87 640 556.8 253.344 Polyurethane Insulation (SIP Insulation) 4.26 5.41 33 178.53 760.5378 Timber, C16 Softwood (SIP Top, Bottom and End Blocks) 0.263 0.41 390 159.9 42.0537 OSB (SIP Block Spline) 0.455 0.03 640 19.2 8.736 Polyurethane Insulation (SIP Block Insulation) 4.26 0.27 33 8.91 37.9566 Timber, C24 Softwood (Door Frame) 0.263 0.1 420 42 11.046 Timber, C16 Softwood (Window Frame) 0.263 0.12 390 46.8 12.3084 Loft Floor SIP Walls OSB (SIP Exterior) 0.455 1.15 640 736 334.88 Polyurethane Insulation (SIP Insulation) 4.26 3.36 33 110.88 472.3488 Timber, C16 Softwood (SIP Top, Bottom and End Blocks) 0.263 0.19 390 74.1 19.4883 OSB (SIP Block Spline) 0.455 0.03 640 19.2 8.736 Polyurethane Insulation (SIP Block Spline) 4.26 0.18 33 5.94 25.3044 Timber, C16 Softwood (Window Frame) 0.263 0.05 390 19.5 5.1285 Loft Floor OSB (Loft Floor) 0.455 0.18 640 115.2 52.416 Timber, C24 Softwood (Floor Joists) 0.483 0.26 420 109.2 52.7436 Steel, Hot-dip galvanized (Joist Hanger) 2.76 0.0021 7975 16.7475 46.2231 Roof OSB (SIP Exterior) 0.455 0.48 640 307.2 139.776 Polyurethane Insulation (SIP Insulation) 4.26 3.84 33 126.72 539.8272 Timber, C16 Softwood (SIP Top, Bottom and End Blocks) 0.263 0.24 390 93.6 24.6168 OSB (SIP Block Spline) 0.455 0.03 640 19.2 8.736 Polyurethane Insulation (SIP Block Spline) 4.26 0.2 33 6.6 28.116 Timber, C24 Softwood (Roof Rafters) 0.263 0.43 420 180.6 47.4978 Zinc (Roof) 3.9 0.02 7.8 0.156 0.6084 Timber Cladding Timber, C16 Softwood (Cladding Battens) 0.263 0.43 390 167.7 44.1051 Timber, C16 Softwood (Cladding) 0.263 1.24 390 483.6 127.1868 Windows Glass, Double Glazing (Windows) 1.63 0.03 2579 77.37 126.1131 Total Embodied CarbonCarbon Storage 5467.84122 -1471.40468 Total Embodied Carbon with Carbon Storage 3996.437 Kg of CO2
CARBON ANALYSIS REFERENCES
Carbon Cure (2020). Embodied Carbon in Construction Calculator (EC3). [online] CarbonCure Technologies Inc. Available at: https://www.carboncure.com/concrete-corner/embodied-carbon-in-construction-calculator-ec3/ [Accessed 30 Apr. 2022].
Greenmax Recycling (2016). The Advantages And Disadvantages Of Polystyrene Foam Insulation Board. [online] http://www.styrofoamdensifier.org/. Available at: http://www.styrofoamdensifier.org/the-advantages-and-disadvantages-of-polystyrene-foam-insulation-board/ [Accessed 29 Apr. 2022].
Greenspec (2019). EPS vs Polyurethane Insulation | Cost, R-Value, Moisture. [online] Insulspan. Available at: https://www.insulspan.com/advantages/eps-insulation-vs-pur/ [Accessed 30 Apr. 2022].
ICC (2020). Embodied Carbon. [online] ICC. Available at: https://www.iccsafe.org/advocacy/embodied-carbon/ [Accessed 29 Apr. 2022].
Johnson, D. (2020). Embodied carbon: What is it, how is it measured, and how should we reduce it? Mesh Energy explains. [online] mesh-energy.com. Available at: https://www.mesh-energy.com/insights/embodied-carbon-what-is-it-how-is-itmeasured-and-how-should-we-reduce-it-mesh-energy-explains [Accessed 29 Apr. 2022].
Krupa, M., Harper, J., Bill, K., Ntu, R., Chris, Ntu, B., Buildinginsight, F. and Uhlman, B. (2008). Residential Insulation Systems. [online] www.sips.org. Available at: https://www.sips.org/documents/basf-ecoefficiency.pdf [Accessed 29 Apr. 2022].
Larry Strain (2017). 10 steps to reducing embodied carbon. [online] Aia.org. Available at: https://www.aia.org/articles/70446-ten-steps-to-reducing-embodied-carbon [Accessed 29 Apr. 2022].
Melton, P. (2018). The Urgency of Embodied Carbon and What You Can Do about It. [online] BuildingGreen. Available at: https://www.buildinggreen.com/feature/urgency-embodied-carbon-and-what-you-can-do-about-it [Accessed 30 Apr. 2022].
Potton News (2021). Sustainability Benefits of Timber Frame and SIPs. [online] Potton.co.uk. Available at: https://www.potton.co.uk/news/sustainability-benefits-of-timber-frame-and-sips [Accessed 29 Apr. 2022].
SIP Supply (2012). Polyurethane Vs. EPS Panels - SIP Supply. [online] SIP Supply Blog. Available at: https://sipsupply.com/sip-blog/polyurethane-v-eps-panels-r-control_sips-html/ [Accessed 29 Apr. 2022].
Structural Timber Association (2014). 6. SIPS Technical Bulletin. [online] sips.uk.com. Available at: https://www.sips.uk.com/contentfiles/downloads/Download-37.pdf [Accessed 29 Apr. 2022].
Structurally Insulated Panels Association (2022). The Passive Possibilities with SIPs. [online] www.sips.org. Available at: https://www.sips.org/blog/the-passive-possibilities-with-sips#:~:text=Heating%20and%20cooling%20accounts%20for%20 50%25%20of%20energy [Accessed 29 Apr. 2022].
Thermocore (2016a). EPS vs Polyurethane SIPs | Structural Insulated Panels | Thermocore. [online] www.thermocore.com. Available at: https://www.thermocore.com/polyurethane-vs-eps#:~:text=Most%20structural%20insulated%20panels%20%28SIPs%29%20on%20the%20market [Accessed 29 Apr. 2022].
Thermocore (2016b). SIPs | Structural Insulated Panels | Construction | Thermocore. [online] Thermocore.com. Available at: https://www.thermocore.com/ [Accessed 29 Apr. 2022].
Wood For Good (2020). Both embodied and operational carbon are key to building net zero homes. [online] woodforgood.com. Available at: https://woodforgood.com/news-and-views/2020/09/29/embodied-carbon-and-operational-carbon-working-together/ [Accessed 30 Apr. 2022].
World Green Building Council (2019). Embodied carbon call to action report. [online] World Green Building Council. Available at: https://www.worldgbc.org/embodied-carbon [Accessed 30 Apr. 2022].
XCO2 (2016). Insulation for Environmental Sustainability A Guide A study by XCO2 for BING. [online] Available at: https://www.glosfordsips.co.uk/wp-content/uploads/2016/03/Insulation-for-Sustainability-2nd-Issue.pdf [Accessed 31 Apr. 2021].
PU Europe (n.d.). Sustainability and polyurethane insulation Today’s solution for tomorrow’s needs. [online] www.sips.uk.com. PU Europe. Available at: https://www.sips.uk.com/contentfiles/downloads/Download-36.pdf [Accessed 31 Apr. 2022].
Berners-Lee, M. (2010). What’s the carbon footprint of ... a house. [online] the Guardian. Available at: https://www.theguardian.com/environment/green-living-blog/2010/oct/14/carbon-footprint-house [Accessed 30 May 2022].
Construction UK Magazine. (2020). Embodied Carbon used in housing. [online] Available at: https://constructionmaguk.co.uk/embodied-carbon-used-in-housing/ [Accessed 30 May 2022].

