International Journal of the Italian Association for Metallurgy
n. 06 giugno 2024
Organo ufficiale dell’Associazione Italiana di Metallurgia. Rivista fondata nel 1909
Vecchiato Officine Meccaniche Srl is a family owned company founded in 1977 as a precision machining workshop. Over the past 30 years, the company has established itself in the design, construction, supply and commissioning of forging plants, in particular hydraulic presses and mobile and rail bound manipulators. The current equipment portfolio also includes straightening machines, cable reels, charging machines and equipment revamping. In particular, the hydraulics (with a patented solution since 2015 to reduce electrical consumption on the forging presses) and controls used on our machines are designed and manufactured entirely by our company, in collaboration with the most qualified manufacturers of hydraulic components.
Vecchiato is able to supply the entire forging plant under a single point of responsibility and with a high level of process optimisation based on its home-made automation software. Thanks to the expertise of its staff, Vecchiato also offers a very efficient spare parts and after sales service.
All the various stages of production, from design to manufacturing to installation and service, are carried out by specialised personnel, making the company very flexible and quick to respond to customer needs.
Vecchiato Officine Meccaniche Srl Headquarter and workshop:
Recent progress in advanced plasma-assisted thermochemical treatments of steels
S. M. Jafarpour, A. Dalke, H. Biermann ................................................................................................................. pag.08
Strategic approaches to enhance quenching and partitioning applicability: optimizing mechanical properties and microstructure of commercial low-silicon 20MnB5 steel
M. Belfi, T. Carrara, S. Barella, A. Gruttadauria, P. Cetto . pag.16
Studyofmicroparticlesincorporationincoatingsontitaniumproducedbyplasma electrolytic oxidation (PEO) / Studio dell’incorporazione di microparticelle in rivestimentisutitanioprodottimedianteossidazioneelettroliticaalplasma(PEO) F.Ceriani,L.Casanova,M.V.Diamanti,M.Ormellese,M.Pedeferri...............................................................................pag.66
Le Aziende di AIM / AIM’s Companies
Face your fears. How to use furnace smart data in your shop.
Comitato scientifico/Editorialpanel: Marco Actis Grande, Silvia Barella, Paola Bassani, Christian Bernhard, Massimiliano Bestetti, Wolfgang Bleck, Franco Bonollo, Irene Calliari, Mariano Enrique Castrodeza, Emanuela Cerri, Vlatislav Deev, Andrea Di Schino, Donato Firrao, Bernd Kleimt, Carlo Mapelli, Denis Jean Mithieux, Roberto Montanari, Marco Ormellese, Mariapia Pedeferri, Massimo Pellizzari, Barbara Previtali, Evgeny S. Prusov, Dario Ripamonti, Dieter Senk
Segreteria di redazione/Editorialsecretary: Marta Verderi
Comitato di redazione/Editorialcommittee: Federica Bassani, Gianangelo Camona, Mario Cusolito, Carlo Mapelli, Federico Mazzolari, Marta Verderi, Silvano Panza
Direzione e redazione/Editorialandexecutiveoffice: AIM - Via F. Turati 8 - 20121 Milano tel. 02 76 02 11 32 - fax 02 76 02 05 51 met@aimnet.it - www.aimnet.it
Reg. Trib. Milano n. 499 del 18/9/1948. Sped. in abb. Post. - D.L.353/2003 (conv. L. 27/02/2004 n. 46) art. 1, comma 1, DCB UD
Immagine in copertina: Prof. Massimo Pellizzari
Gestione editoriale e pubblicità Publisher and marketing office: siderweb spa sb Via Don Milani, 5 - 25020 Flero (BS) tel. 030 25 400 06 - fax 030 25 400 41 commerciale@siderweb.com - www.siderweb.com
La riproduzione degli articoli e delle illustrazioni è permessa solo citando la fonte e previa autorizzazione della Direzione della rivista. Reproduction in whole or in part of articles and images is permitted only upon receipt of required permission and provided that the source is cited.
siderweb spa sb è iscritta al Roc con il num. 26116
“"Il momento storico, rappresentato dal processo di consolidamento del veicolo elettrico nella cultura del paese, si porta dietro una certa resistenza psicologica a cambiare stile di vita."
“The historical moment, representedbythe process of consolidation of the electric vehicle in thecountry'sculture, bringswithitacertain psychologicalresistanceto changinglifestyle.”
TRATTAMENTI TERMICI E MECCANICI; OBIETTIVI DI SOSTENIBILITÀ AMBIENTALE E DELLE PRESTAZIONI MECCANICHE
Il mondo Automotive sta vivendo un momento storico, rappresentato dal processo di consolidamento del veicolo elettrico nella cultura del paese.
Rimane tuttavia una certa resistenza psicologica a cambiare stile di vita ed adattarsi alle nuove tecnologie, a cominciare dal ricaricare l’auto durante la notte, invece che fare il pieno in 5 minuti dal distributore.
Le previsioni dicono che entro il 2032 il 50% dei modelli venduti al mondo sfrutterà la corrente elettrica come carburante e che nel 2027 le auto alimentate a batteria costeranno meno di quelle da combustibili fossili. Detto ciò, i trattamenti termici e meccanici sugli acciai, hanno già iniziato questo percorso di sostenibilità ambientale, a partire dall’impiego di forni elettrici (evitando quindi i generatori endogas), a parete fredda e senza fiamme libere.
Il principale focus riguarda il target di riduzione dei con-
HEAT AND MECHANICAL TREATMENTS; ENVIRONMENTAL SUSTAINABILITY AND MECHANICAL PERFORMANCE OBJECTIVES
The Automotive world is experiencing a historic moment, represented by the process of consolidation of the electric vehicle in the culture of the country. However, there remains a certain psychological resistance to changing lifestyle and adapting to new technologies,startingwithrechargingthecarovernight, ratherthanfillingupin5minutesfromthepetrolstation. Predictions say that by 2032, 50% of the models sold in the world will use electricity as fuel and that in 2027 battery-powered cars will cost less than those powered by fossil fuels.
Having said that, the thermal and mechanical treatments on steel have already begun this path of environmental sustainability, starting from the use of electric ovens (avoiding endogas generators), with cold walls and without open flames.
Ing. Enrico Morgano SILCO Srl Rivalta TO
sumi e delle emissioni di CO2 nel processo produttivo dei singoli componenti; ciò parte dalla materia prima utilizzando forni elettrici, evitando così l’emissione nell’atmosfera di elevate quantità di CO2 indotte da altoforni e convertitori.
Dal punto di vista delle prestazioni meccaniche, non vanno assolutamente trascurati quelli che sono i requisiti tecnici legati alle diverse sollecitazioni indotte dalla trazione elettrica e l’aspetto della rumorosità in esercizio.
Gli obiettivi sono quelli della resistenza meccanica massiva e superficiale del componente, abbinata ad una riduzione del peso dei singoli componenti del sistema. In questo senso, sono numerose le attività di innovazione che si basano, oltre che sui trattamenti di cementazione in bassa pressione e tempra in gas (azoto o elio), anche sui processi di pallinatura controllata e di superfiniture superficiali.
Le due conferenze MCHTSE 2024 e TPMS-5, appena concluse nella splendida cornice di Lecce, dove hanno visto una grande partecipazione di realtà nazionali e soprattutto internazionali, hanno fotografato lo stato dell’arte e l’evoluzione innovativa dei temi riportati sopra, sia da un punto di vista sperimentale che di simulazione.
All’interno di questo numero i lettori avranno la possibilità di leggere alcune di queste memorie presentate.
The main focus concerns the target of reducing consumption and CO2 emissions in the production process of the individual components; this starts from the raw material using electric furnaces, thus avoiding the emission into the atmosphere of high quantities of CO2 induced by blast furnaces and converters.
From the point of view of mechanical performance, the technical requirements linked to the different stresses induced by electric traction and the noise aspect in operation should absolutely not be overlooked.
The objectives are those of the massive and superficial mechanical resistance of the component, combined with a reduction in the weight of the individual components of the system.
In this sense, there are numerous innovation activities that are based not only on low pressure carburizing and gas quenching (nitrogen or helium) treatments, but also on controlled shot peening and surface superfinishing processes.
The two conferences MCHTSE 2024 and TPMS-5, which have just ended in the splendid venue of Lecce, where they saw a great participation of national and above all international entities, photographed the state of the art and the innovative evolution of the themes reported above, both from a experimental and simulation point of view.
Within this issue readers will have the opportunity to read some of these presented papers.
9th European Coke and Ironmaking Congress
Bardolino . Italy . 16-18 October 2024
AIM is glad to announce the 9th European Coke and Ironmaking Congress (ECIC) to be held in Bardolino, Italy, on 16-18 October 2024.
2024
SCOPE AND TOPICS
Cokemaking
Production of Biocoal/biochar
. Industry 4.0 in ironmaking
Sintering, pelletising, briquette production
. Direct reduction and Smelting reduction
9th ECIC European Coke and Ironmaking Congress
ECIC 2024 will focus on the newest technologies in coke making, sintering, pelletizing, pyrolizing the biomasses and ironmaking (blast furnaces, direct reduction and carbon-based smelting processes).
The 2025 goal of carbon neutrality and the related intensive efforts of the steel industry will significantly affect the technologies for iron ore reduction. In this perspective, the shortage of iron ores matching the requirement for direct reduction by gas and for melting in electric arc furnace makes important proposal of new technologies and devices that can ensure the carbon neutrality even for the coal based routes.
Bardolino . Italy
16 - 18 October 2024
This Congress will focus on technologies that can achieve such a goal improving the efficiency of the existing process, applying the devices that avoid a net emission of green house gases and to point out new routes based on exploitation of biomasses whose net emission is intrinsically neutral.
The 9th ECIC will address both fundamental research work and evaluation and plant operational results and plant construction. The Congress will bring together a wide range of experts, coming from plant operation, plant suppliers, universities and research institutes, who share expertise in:
Blast furnace ironmaking
Blast Furnace muds
. CCS/CCUS (Carbon Capture, Use and Storage)
Impact of Carbon Border Adjustment Mechanism (CBAM)
. H2 and Syngas exploitation
The event will provide a forum for best practise and state-of-the-art technology, new developments, new ideas and research results.
BACKGROUND
The Coke and Ironmaking events started separately as the European Ironmaking Congress (EIC) in 1986 in Aachen, Germany, and in 1991 in Glasgow, Scotland, and as the International Cokemaking Congress (ICMC) in 1987 in Essen, Germany, and in 1992 in London, England.
The merger of these two events took place in 1996 as the European Coke and Ironmaking Congress (ECIC) in Gent, Belgium.
1st EIC - Aachen, 1986
1st ICMC - Essen, 1987
2nd EIC - Glasgow ,1991
2nd ICMC - London, 1992
3rd ECIC - Gent, 1996
ORGANIZING SECRETARIAT
4th ECIC - Paris, 2000
5th ECIC - Stockholm, 2005
6th ECIC - Düsseldorf, 2011
7th ECIC - Linz, 2016
8th ECIC - Bremen, 2022
Via Filippo Turati 8 - 20121 Milano MI - Italy
tel. +39 02 76021132
aim@aimnet.it . www.aimnet.it
2024
Recent progress in advanced plasma-assistedtreatmentsthermochemical of steels
S. M. Jafarpour A. Dalke, H. Biermann
In plasma-assisted thermochemical treatments of steels, reliable and precise control of the generated treatmentrelevant gas species and consequently the resulting material response, requires decoupling of the components heating from the species generation. This paper features recent developments in modified reactor configurations for both hot and cold wall technologies as well as in the real-time monitoring of discharge compositions using a compact laserbased absorption sensor during plasma nitrocarburizing. A combination of a plasma-activated carbon electrode inside a hot wall reactor with a compact LAS sensor for in-line evaluation of discharge composition, allows achieving a full control of the species generation and the resulting material response.
As a representative of stainless steel, AISI 316L is widely used in chemical facilities, food industries, medical equipment, stents, etc. Such diverse applications are attributed mainly to the outstanding corrosion resistance resulting from the passive film formed on the steel surface [1,2]. However, modification of the surface properties of AISI 316L is required to improve the surface hardness, tribological properties, fatigue resistance, and resistance to the localized corrosion in specific environments. These properties can be significantly improved by thermochemical surface treatment, in which nitrogen (N) and/or carbon (C) diffuse into the austenitic crystal lattice at elevated temperatures [3]. Thus, improved surface properties can be achieved by enriching the near-surface region by interstitial N and/or C atoms to develop an apparently homogeneous solid solution in the austenite crystal lattice, the so-called expanded austenite or S-phase [4–6]. As a result of expanded austenite formation, the surface hardness, mechanical properties as well as wear resistance of AISI 316L significantly increase without compromising its high general corrosion resistance [5,7,8]. It is worth to mention that in order to perform an effective thermochemical diffusion treatment of AISI 316L, an activation of the surface is required to remove
S. M. Jafarpour, A. Dalke, H. Biermann
Institute of Materials Engineering, Technische Universität Bergakademie Freiberg, Germany - Center for Efficient High Temperature Processes and Materials Conversion (ZeHS), Technische Universität Bergakademie Freiberg, Germany saeed.jafarpour@iwt.tu-freiberg.de
the passive oxide film prior and/or during the treatment [9,10]. In addition, during thermochemical diffusion treatment of AISI 316L at relatively high temperature and/ or long duration, the kinetics of chromium nitrides and/or carbides precipitations are accelerated and consequently, chromium nitride and/or carbide may precipitate [11,12]. As long as the precipitation of chromium nitrides and/ or carbides is a diffusion-controlled process, it can be suppressed by a sufficiently low temperature and/or short duration, according to the temperature-time (Tt) threshold curve of the treated steel, thus, the good corrosion resistance is maintained [13,14].
Different plasma-assisted thermochemical treatments such as plasma nitriding (PN) [15], plasma carburizing (PC) [14], and plasma nitrocarburizing (PNC) [16] were realized by introducing feed gas compositions of H2:N2, H2:CH4 or H2:N2:CH4, into the plasma-enhanced treatment atmosphere, respectively. In addition, depending on the way of the reactor heating, treatments can be performed either in a cold wall reactor or in a hot wall reactor [17]. Generally, plasma-assisted treatment in a conventional cold-wall reactor unavoidably causes issues such as overheating in components with different area/volume ratio, arcing, edge effect, hollow cathode effect and high energy consumption due to the high plasma power required to heat the components to the desired treatment temperature [18]. In addition, only a minor fraction of the applied plasma power (about 10-20%) is required to activate the chemical reactions and generate reactive gas species, while most of the plasma energy (about 80-90%) is dissipated in the form of heat to increase the temperature and adjust the required treatment temperature [17,19]. Therefore, during plasma-assisted treatments in conventional cold-wall reactors, the electrical plasma parameters for heating and for generating reactive gas species are directly coupled and cannot be controlled separately resulting in a weak control of the generated treatment-relevant species and consequently a limited response of the treated material. This issue is less significant for treatments in a conventional hot-wall reactor where the heating of the components to the target temperature is performed mainly by the heating elements at the wall. However, even in this case, it is still not possible
to fully decouple the heating and species generation in order to get a precise control of the material response [17]. Besides, in both reactor types, during plasma-assisted thermochemical diffusion treatments, in particular PNC, different treatment-relevant reactive species such as HCN, NH3, CH4 can be produced where the HCN is considered as a most crucial product due to its dual application [20]. On the one hand, HCN can de-passivate the AISI 316L surface by gas-surface reactions, and on the other hand, it can act as a source for providing diffusible N and C atoms [21,22]. Thus, it is crucial important to have knowledge about the resulting discharge composition inside the treatment zone with respect to the generated reactive species during each type of treatment (PN, PC and PNC) as well as their corresponding concentrations. This can be done by utilizing plasma diagnostic techniques, in which laser-based absorption spectroscopy (LAS) shows great potentials for in-situ monitoring of the resulting discharge compositions and evaluation of absolute concentrations of generated species with high spectral resolution [23].
In order to overcome the aforementioned issue occurring during plasma-assisted treatment in a conventional cold wall, i.e. heating and species generation are coupled together, modification with respect to the reactor configuration is required. Georges patented the use of an active screen (AS) technology for plasma nitriding (ASPN) in 1999 [24,25]. He showed that by utilizing a plasma-activated metal mesh screen, i.e. active screen (AS) initially made of steel (steel-AS), in a conventional cold wall reactor, the high plasma power is relocated from the workload table to the steel-AS which can significantly reduce the negative issues in connection with the high plasma power at the treated samples [25]. Several years later in 2017, further modification in reactor configuration was made in the authors’ laboratory by utilizing an AS made of carbon fiber-reinforced carbon (CFC) instead of a steel-AS for PNC inside an industrial-scale conventional cold wall reactor (Fig. 1a) [26]. PNC treatment utilizing an AS made of CFC (CFC-AS) in a cold wall reactor eliminates the issues of high plasma power at the treated steels similar to the treatment with steel-AS, but also additionally produces the required carbon-containing species, i.e. HCN, by the chemical sputtering of CFC-AS with N2-H2
plasma [27,28]. However, during treatment with CFC-AS, a weak plasma power can be applied at the samples, i.e. PBias, which enables surface cleaning and activation as well
as acting as a new treatment parameter to control and adjust the resulting material response [29].
Fig.1 - Schematic drawings of (a) the material treatment setup in a cold wall reactor using a CFC-AS and the workload table, and (b) laboratory scale LAS setup in a cold wall reactor consisting of laser sources (LAS), detector, monitoring panel and model probe. The grey dashes indicate the active treatment zone which (a) surrounds the treated steels and (b) surrounds the model probe.
Reliable and precise control of the generated treatmentrelevant species and consequently the resulting material response requires (i) modified reactor configuration aiming to decouple the crucial treatment parameters, and (ii) monitoring discharge compositions to get real-time information regarding the type and the concentration of generated treatment-relevant species. Therefore, this study addresses the recent developments and progress in plasma-assisted treatments with respect to the aforementioned aspects in both hot wall and cold wall reactors aiming reliable control of the generated species and the resulting material response under industrial conditions.
EXPERIMENTAL DETAILS
Commercial steel grade of AISI 316L (chemical composition in wt.%: C0.03, Cr16.9, Ni10.3, Mo2.19, Mn1.72, Si0.28 and Fe balance) was used in this work. Discshaped samples of 20 mm diameter and 5 mm thickness
were machined from a cylindrical bar. All samples were mechanically ground with SiC paper down to 800 grade, cleaned with ethanol in an ultrasonic bath and dried in hot air prior to the treatments. A first set of PNC treatments was carried out in an industrial-scale cold wall reactor with a CFC-AS (effective surface area of 4.5 m2) similar to the reactor configuration which was used in our previous publications [30]. The effect of different plasma powers applied at the treated samples, i.e. bias plasma power; PBias, of 0, 0.6 and 1.25 kW corresponding to the AS plasma power; PAS, of 6.6, 5.4 and 4.6 kW, respectively, were investigated during PNC of AISI 316L samples treated with the treatment parameters of N2:H2= 1:1, p= 3 mbar, Φ= 80 slh, T= 460 °C and t= 5 h (Fig. 1a). In addition, laboratory scale LAS was applied in separate experiments but under comparable conditions to the material treatments. Here, the major part of the LAS diagnostic path was aligned through the active treatment zone inside the reactor during ASPNC (Fig. 1b). Spectroscopic lines of HCN
and NH3 were recorded and their concentrations were evaluated [23,31]. A second set of PNC treatments were carried out using an industrial scale hot wall reactor with a plasma-activated carbon electrode inside the reactor. First, the effect of different voltages applied at the carbon electrode; UCarbon electrode, (effective surface area of 0.3 m2) ranging from 410 V to 480 V on the concentration of HCN produced was investigated using the treatment parameters N2:H2= 1:1, p= 2.5 mbar, Φ= 100 slh, PBias= 1.5 kW and T= 440 °C. At the same time, a compact LAS sensor was integrated at the reactor (Fig. 3) in such a way that the measured transmission spectra can be evaluated during the treatment by comparing data with the HITRAN database allowing quick and precise measurements of the discharge composition (Fig. 4a) [32]. Finally, an exemplary results of a PNC treatment of AISI 316L was conducted using a selected voltage of 420 V at the carbon electrode for the duration of 2 hours under the described treatment conditions. The author’s aim is to highlight the potential advantages of each modified reactor configuration for hot and cold wall technologies. Exemplary results are shown for each of these technology variants using plasma nitrocarburized AISI 316L. For metallographic analysis, cross-sections were mechanically polished and chemically etched (Beraha II etchant) to light optically assess the thickness of the expanded austenite layers. Concentration-depth profiles of N and C were measured by glow discharge optical emission spectroscopy (GDOES). Surface hardness measurement was performed by Vickers hardness indentation applying a load of 0.4903 N (HV0.05), cf. Fig. 2 and 4.
RESULTS
Cold wall reactor with an active screen made of solid carbon
Fig. 2a-f shows the results of the ASPNC AISI 316L samples treated under three different settings for the PBias of 0, 0.6 and 1.25 kW while the result of LAS measurements is presented in Fig. 2g. The LAS results reveal that with increasing PBias, there was a slight increase in NH3 concentration and a slight decrease in HCN concentration. In case of HCN, its variation can be explained due to the lower plasma power at the CFC-AS (PAS= 4.6 kW) in case of treatment with PBias= 1.25 kW and consequently lower
HCN production as compared to the treatment with PBias= 0 kW (PAS= 6.6 kW). However, the overall molecular concentration of HCN was high enough, around 1.9 x 1015 cm-3, for all three bias conditions investigated to effectively activate the surface of AISI 316L and provide the surface with sufficient diffusible N and C atoms. Thus, roughly similar values for the total thicknesses of the generated expanded austenite layers of around 17 µm were achieved for the three investigated cases (Fig. 2a-c and e). In addition, by utilizing different settings of PBias, it is possible to adjust the thicknesses of N- and C-expanded austenite (γN and γC) layers (Fig. 2a-c and e) as well as the content of dissolved N and C atoms in the austenite crystal lattice (Fig. 2d). As a result, different values for the surface hardness of the PNC AISI 316L were achieved depending on the applied bias conditions (Fig. 2f). It is worth to mention here that although PNC treatment with CFC-AS in a cold wall reactor enables tuning the material response by bias plasma power management as it was shown here, there is still a lack of reliable control of the concentration of the generated treatment-relevant species. In fact, during ASPNC treatments with CFC-AS, species concentrations, in particular HCN, is a function of the AS plasma power which is regulated according to the desired treatment temperature. Due to this dependency, the concentrations of the species cannot be independently controlled, leading to high species concentrations and consequently to oversaturation of the treatment environment.
Fig.2 - Cross-sectional light optical microscopy images (a-c), the resulting concentration-depth profiles (in wt.%) of N and C (d), the expanded austenite layers thicknesses, i.e. γN, γC and γT (e) and the resulting surface hardness measured by HV0.05 at the surfaces (f) of PNC AISI 316L samples treated with CFC-AS using three different bias plasma powers of 0 kW (a), 0.6 kW (b) and 1.25 kW (c) applied at the treated samples as well as the resulting concentration of treatment-relevant species measured by laboratory scale LAS (g) under the treatment conditions of T= 460 °C, p= 3 mbar and t= 5 hours using CFC-AS (some of the images are adopted/replotted from Ref. [29]).
Hot wall reactor with a plasma-activated carbon electrode
Recent technological developments in plasma-assisted treatment in a hot wall reactor enable unique possibilities of reliable adjustment in the concentration of the treatment-relevant species inside the active treatment zone, and consequently tuning the properties of the treated steels. Here, by introducing a plasma-activated carbon electrode made of graphite, as a solid carbon precursor, inside a conventional hot wall reactor, a modification in configuration of hot wall reactor was done where the carbon electrode can be independently activated by a DC power supply (Fig. 3e). As a result, during PNC treatment in such a reactor configuration, the generation of carbon-containing reactive gas species, in particular HCN, can be adjusted and optimized independently, based on the design and the surface area of the graphite electrode as well as the applied voltage. At the same time, a recently developed compact LAS sensor can be coupled to the
reactor for real-time monitoring of the discharge compositions and in-line evaluation of the generated species concentration (Fig. 3b-d). Combining this reactor configuration with a compact LAS sensor (Fig. 3a) enables a full control of the concentration of the generated species as well as the resulting material response.
Fig. 4a shows the variation of the HCN concentration, measured by the compact LAS sensor, as a function of the applied voltage at the carbon electrode during PNC treatments while the other treatment paraments kept constant. Fig. 4a reveals that by performing PNC treatment in a hot wall reactor using a plasma-activated carbon electrode, a reliable adjustment/control of the HCN concentration is enabled upon the variation of the voltage applied at the carbon electrode. In addition, it was revealed that the concentration of the generated HCN in this case, i.e. PNC treatment with plasma-activated graphite electrodes in a hot wall reactor, was one order of magnitude lower (Fig.
4a), compared to the HCN concentration achieved during PNC treatments with CFC-AS in the cold wall reactor (Fig. 2g). Although the treatment conditions T and t were slightly different during PNC using the modified reactor configurations of cold and hot wall technologies in this work, a major reason for the significantly reduced HCN concentration in case of treatment in the modified hot wall reactor can be correlated to the smaller surface area
of the applied solid carbon source and the resulting lower plasma power (about an order of magnitude) as compared to the one in the modified cold wall reactor. In addition, even by PNC treatment at such a moderate concentration of HCN, it was shown that the generated expanded austenite layer achieved a total thickness of around 8 µ m (440 °C, 2 h) reflecting a relatively high growth kinetics (Fig. 4b and c).
Fig.3 - Photographs and schematic of an industrial-scale hot wall reactor coupled with a compact LAS sensor (a, b and e), where the in-situ generated species during treatment can be monitored and identified (c) while the corresponding absolute concentrations can be evaluated in-line (d).
Fig.4 - Variation of HCN concentration measured by compact LAS sensor as a function of applied voltage UCarbon electrode at the carbon electrode during PNC treatments in a hot wall reactor (a). Cross-sectional light optical microscopy images (b) as well as the resulting concentration-depth profiles (in wt.%) of N and C (c) of PNC AISI 316L sample treated under the treatment conditions of T= 440 °C, p= 2.5 mbar, t= 2 hours, and UCarbon electrode= 420 V. In subfigure (a), the values inside the graph represent the resulting plasma power of the carbon electrode.
CONCLUSIONS
The combined use of a plasma-activated carbon electrode in a hot wall reactor with a compact LAS sensor allows a control of the species generation. This also enables the control of material properties, which will be investigated in more detail in future studies. The decoupling of the component heating from the species generation in a
REFERENCES
hot wall reactor is promising for achieving more reliable treatment control and process optimization. In addition, it enables better understanding of the basic principles of plasma-assisted thermochemical treatments of different steels.
[1] Lo KH, Shek CH, Lai J. Recent developments in stainless steels. Materials Science and Engineering: R: Reports 2009;65(4):39–104.
[2] Olsson C-O, Landolt D. Passive films on stainless steels—chemistry, structure and growth. Electrochimica Acta 2003;48(9):1093–104.
[3] Eric J. Mittemeijer, Marcel A.J. Somers (eds.). Thermochemical Surface Engineering of Steels. Oxford: Woodhead Publishing; 2015
[4] Borgioli F. From Austenitic Stainless Steel to Expanded Austenite-S Phase: Formation, Characteristics and Properties of an Elusive Metastable Phase. Metals 2020;10(2):187.
[6] Czerwiec T, He H, Marcos G, Thiriet T, Weber S, Michel H. Fundamental and Innovations in Plasma Assisted Diffusion of Nitrogen and Carbon in Austenitic Stainless Steels and Related Alloys. Plasma Process. Polym. 2009;6(6-7):401–9.
[7] Sun Y. Production of nitrogen and carbon S phases in austenitic stainless steels by hybrid plasma surface alloying. Surface Engineering 2010;26(1-2):114–22.
[8] Borgioli F. The “Expanded” Phases in the Low-Temperature Treated Stainless Steels: A Review. Metals 2022;12(2):331.
[9] Baranowska J. Importance of surface activation for nitrided layer formation on austenitic stainless steel. Surface Engineering 2010;26(4):293–8.
[10] Hsieh M-C, Ge Y, Kahn H, Michal GM, Ernst F, Heuer AH. Volatility Diagrams for the Cr-O and Cr-Cl Systems: Application to Removal of Cr2O3-Rich Passive Films on Stainless Steel. Metall and Materi Trans B 2012;43(5):1187–201.
[11] Manova D, Lotnyk A, Mändl S, Neumann H, Rauschenbach B. CrN precipitation and elemental segregation during the decay of expanded austenite. Mater. Res. Express 2016;3(6):66502.
[12] Sun Y, Bell T, Kolosvary Z, Flis J. The response of austenitic stainless steels to low-temperature plasma nitriding. Heat Treatment of Metals 1999;26:9–16.
[13] Sun Y, Haruman E. Low Temperature Plasma Surface Alloying of Austenitic Stainless Steels. SSP 2006;118:85–90.
[14] Sun Y. Kinetics of low temperature plasma carburizing of austenitic stainless steels. Journal of Materials Processing Technology 2005;168(2):189–94.
[15] Las Heras E de, Ybarra G, Lamas D, Cabo A, Dalibon EL, Brühl SP. Plasma nitriding of 316L stainless steel in two different N2-H2 atmospheres - Influence on microstructure and corrosion resistance. Surface and Coatings Technology 2017;313:47–54.
[16] Cheng Z, Li CX, Dong H, Bell T. Low temperature plasma nitrocarburising of AISI 316 austenitic stainless steel. Surface and Coatings Technology 2005;191(2):195–200.
[17] Maniee A, Mahboubi F, Soleimani R. The study of tribological and corrosion behavior of plasma nitrided 34CrNiMo6 steel under hot and cold wall conditions. Materials & Design 2014;60:599–604.
[18] Olzon-Dionysio M, Campos M, Kapp M, Souza S de, Souza SD de. Influences of plasma nitriding edge effect on properties of 316L stainless steel. Surface and Coatings Technology 2010;204(21-22):3623–8.
[20] Hamann S, Burlacov I, Spies H-J, Biermann H, Röpcke J. Spectroscopic investigations of plasma nitriding processes: A comparative study using steel and carbon as active screen materials. Journal of Applied Physics 2017;121(15):153301.
[21] Christiansen TL, Hummelshøj TS, Somers MAJ. A method of activating an article of passive ferrous or non-ferrous metal prior to carburizing, nitriding and/or nitrocarburizing. European Patent Office (EP 2278038 A1); 2011.
[22] Hoshino K, Miyashita M, Kawamura T, Totsuka T, Eiraku H, Yashiro K, Kurosawa T. Method for Activating Surface of Metal Member.: European Patent Office (EP 1707646 B1); 2009.
[23] A V Pipa, A Puth, J Böcker, S M Jafarpour, A Dalke, H Biermann et al. Laser absorption spectroscopy for plasma-assisted thermochemical treatment. Part I.: Applicability of the Beer–Lambert law and interpretation of spectroscopic data. Plasma Sources Sci. Technol. 2023;32(8):85011.
[24] Li CX, Georges J, Li XY. Active screen plasma nitriding of austenitic stainless steel. Surface Engineering 2002;18(6):453–7.
[25] Georges J. Nitriding process and nitriding furnace therefor, US Patent (US 5,989,363); 1999.
[26] Burlacov I, Hamann S, Spies H-J, Dalke A, Röpcke J, Biermann H. A Novel Approach of Plasma Nitrocarburizing Using a Solid Carbon Active Screen – a Proof of Concept. HTM Journal of Heat Treatment and Materials 2017;72(5):254–9.
[27] Jacob W, Hopf C, Schlüter M. Chemical sputtering of carbon by nitrogen ions. Appl. Phys. Lett. 2005;86(20):204103.
[28] Schlüter M, Hopf C, Jacob W. Chemical sputtering of carbon by combined exposure to nitrogen ions and atomic hydrogen. New Journal of Physics 2008;10(5):53037.
[29] Jafarpour SM, Pipa AV, Puth A, Dalke A, Röpcke J, van Helden J-PH et al. Effects of Plasma-Chemical Composition on AISI 316L Surface Modification by Active Screen Nitrocarburizing Using Gaseous and Solid Carbon Precursors. Metals 2021;11(9):1411.
[30] Dalke A, Burlacov I, Hamann S, Puth A, Böcker J, Spies H-J et al. Solid carbon active screen plasma nitrocarburizing of AISI 316L stainless steel: Influence of N2-H2 gas composition on structure and properties of expanded austenite. Surface and Coatings Technology 2019;357:1060–8.
[31] Puth A, Kusýn L, Pipa AV, Burlacov I, Dalke A, Hamann S et al. Spectroscopic study of plasma nitrocarburizing processes with an industrial-scale carbon active screen. Plasma Sources Sci. Technol. 2020;29(3):35001.
[32] Gordon IE, Rothman LS, Hargreaves RJ, Hashemi R, Karlovets EV, Skinner FM et al. The HITRAN2020 molecular spectroscopic database. Journal of Quantitative Spectroscopy and Radiative Transfer 2022;277:107949.
TORNA ALL'INDICE >
Strategic approaches to enhance quenching and partitioning applicability: optimizing mechanical properties and microstructure of commercial low-silicon 20MnB5 steel
M. Belfi, T. Carrara, S. Barella, A. Gruttadauria, P. Cetto
Quenching and partitioning (QP) is a heat treatment designed to induce a multiphase microstructure composed of martensite and retained austenite. This treatment introduces high tensile properties in the material, coupled with enhanced ductility compared to traditional treatments. This enhancement arises from the strain-induced transformation of retained austenite into martensite when subjected to loads. Austenite stabilization at room temperature is achieved through carbon diffusion from martensite to austenite during partitioning. Therefore, the chemical composition of the alloy is typically tailored to promote this phenomenon. Silicon is added to suppress carbide precipitation, while manganese is added to enhance austenite stability. However, in this study, we focus on commercial low-silicon 20MnB5 steel. This grade is a low-alloyed steel commonly used in the heat-treated condition and is potentially influenced by the properties introduced through QP treatment. Multiple quenching and partitioning treatments are designed and executed to investigate the applicability of QP on 20MnB5 steel. Intercritical treatment strategies are employed to enhance the hardenability of the selected alloy, aiming to prevent bainite transformation and increase the effectiveness of quenching and partitioning, increasing the free carbon at disposal for partitioning. XRD analyses are conducted to identify retained austenite in the final specimen, quantify its amount, and observe its morphology and location. Optical microscopy (OM) and scanning electron microscopy (SEM) are used to characterize the introduced multiphase microstructure. Tensile tests are performed to assess the mechanical properties introduced by the treatment. In conclusion, the study demonstrates the applicability of intercritical quenching and partitioning (QP) treatments on 20MnB5 steel. However, in the observed conditions, the stabilization of a fraction of retained austenite is not correlated to the greatest increase in UE, leading to the conclusion that the control of the surrounding microstructure is the primary factor that influences the final properties of the material.
KEYWORDS:
INTRODUCTION
In 2003, Speer et al. introduced Quenching and Partitioning (QP), a heat treatment method aimed at achieving a microstructure consisting of martensite and retained austenite (RA) [1]. The presence of this soft phase within the microstructure not only increases ductility and especially uniform elongation (UE), but also confers high mechanical properties; when subjected to a load, it undergoes a strain-induced transformation into martensite (known also as TRIP effect), resulting in high ultimate tensile strength (UTS), and higher work hardening at higher strains [2][3]. QP steels are part of
Belfi, T. Carrara, S. Barella, A. Gruttadauria, P.
M.
Cetto
Politecnico di Milano, via la Masa 32, 20156 Milano, Italy
the 3rd generation AHSS, and they are renowned for their exceptional blend of strength, toughness, and formability [4]. The outcome is indeed a steel possessing high strength, favorable ductility, and enhanced formability, rendering it suitable for automotive applications such as body panels and structural components. The chemical composition of QP steels is usually tailored in order to maximize the effectiveness of the treatment. A silicon amount (>1 %wt.) is usually added in order to delay carbide formation increasing the amount of free carbon available for partitioning, while manganese is added to increase hardenability and help austenite stabilization [5] [6].
However, little work has been done on commercial steel grades, while most of the research has focused on laboratory composition. 20MnB5 is a commercial low-carbon boron steel used in applications where good strength is required, such as gears and axles. The application of QP is investigated because of the set of
properties that is introduced by the treatment. In addition to the design and the application of the treatment, a new challenge is faced, as the low amount of alloying elements reduces the hardenability of the material: the cooling rate given by salt baths indeed is not enough to avoid phase transformation during quenching, leading to an uncontrolled microstructure. The generation of bainite during cooling can reduce the amount of free carbon at disposal for partitioning, reducing the effectiveness of the treatment. As a consequence, a different strategy based on the introduction of multiphase microstructures through intercritical treatments is implemented [7]. Microstructure and tensile properties introduced are characterized, with special focus on the differences in the work hardening of the material.
MATERIALS AND METHODS
The composition of the studied 20MnB5 steel, measured with a Bruker Q4 Tasman quantometer is reported.
Tab.1 - 20MnB5 chemical composition.
Critical temperatures A1 (696 °C), A3 (810 °C) were computed through Thermocalc 2022b. Quenching and partitioning treatments have been performed using muffle ovens and salt baths, after a normalization at 850 °C. The process parameters for the heat treatments are reported in Table 2 and Table 3 for the intercritical case and the continuous cooling case respectively.
Tab.2 - Intercritical quenching and partitioning treatments.
Quenching temperatures were optimized applying the constrained carbon equilibrium (CCE) to the carbonenriched austenite, and corrected following the 85%-
15% rule proposed by Santofimia et al. [8] to decrease the amount of fresh martensite formed during the second quenching phase.
Fig.1 - QP treatments. a) Intercritical treatment, b) Continuous cooling partitioning + tempering.
XRD analyses were performed through a Rigaku SmartLab SE using a D/Tex Ultra 250 1D as a detector. X-ray worked at 40kV and 40 mA, with a Cu Kβ source. Scan range went from 35° to 120° with step size of 0,02° and a scan speed of 1°/min. Rietveld analysis was performed on the integrated software Smartlab Studio II. A Carl Zeiss EVO 50 equipped with FEG was used for SEM analyses. Samples were etched with Nital 2%. Tensile tests were conducted on cylindrical samples, following the standard ASTM E8-M, with a MTS100 machine, with 2 mm/min crosshead speed and initial gauge length of 50 mm. One sample per each condition was tested.
RESULTS
The intercritical approach is employed to control the microstructural evolution during cooling in order to avoid
bainitic transformation and to achieve partitioning of carbon in retained austenite. Different QP treatments are designed starting from temperatures between the critical points A1 and A3. In this zone (γ+α), both α ferrite and γ austenite are stable, and due to low carbon solubility in ferrite, austenite is enriched in carbon, displacing CCT curves for longer times and increasing the amount of free carbon at disposal for partitioning. However, the amount of initial austenite should be high enough to ensure the stabilization of a sufficient amount of retained austenite at room temperature. Consequently, three different intermediate temperatures between A1 and A3 are selected to explore different starting fractions of austenite and ferrite (fγ and fα respectively) with different carbon contents (presented in Table 4).
Tab.4 - Austenite and ferrite theoretical fractions and carbon concentrations in the intercritical region.
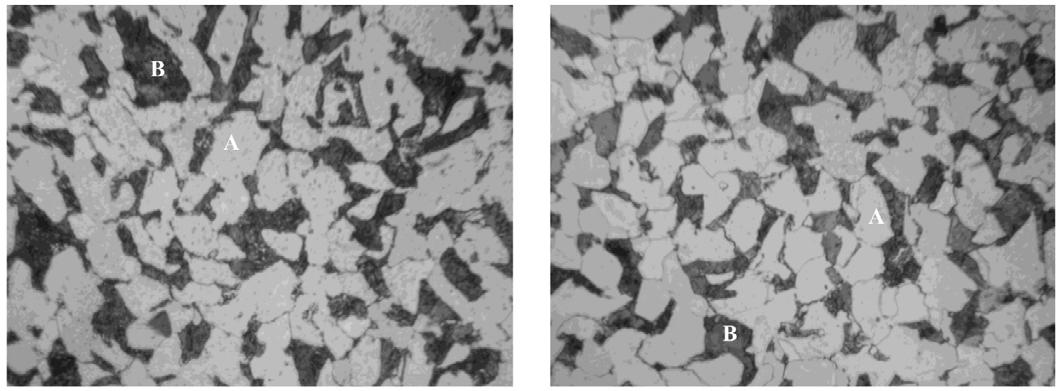
SEM and OM images show that a multi-phase microstructure was introduced in the different samples. A fraction of ferrite is present in the different samples. Sample 790 shows an increased amount of bainite with respect to the other cases. This is consistent with the initial lower carbon concentration in austenite, which has led to more intense phase transformation during the cooling phase.
Fig.2 - SEM an OM images for the intercritical samples: a) 770, b) 780, c) 790.
Specimen RA %
-
9
3
Fig.3 - X-Ray diffraction spectra for intercritical samples.
X-ray diffraction shows the presence of RA in the 780 and 790 sample, while no RA is detected in sample 770. Tensile
properties are presented in Figure 4 and Table 5.
Tab.5 - Tensile properties for the intercritical treatment. The asterisk refers to samples broken outside the gauge length.
- Tensile properties and hardening coefficient evolution for the intercritical samples
Although the samples show similar tensile properties, the hardening coefficients show different behavior. Initial hardening coefficient is lower in sample 790, which features the lowest amount of martensite. The presence of ferrite keeps a high n for higher strains. The presence of retained austenite (sample 780-790) enhances for higher strains. Sample 780 especially, shows the most intense TRIP effect and a two stage hardening [2][3]. However, this sample is not featuring the highest UE, leading to the conclusion that, in multiphase conditions, RA presence is not always the key leading factor for improving ductility. As an example, sample 790, which has lower amount of RA shows improved UE as well as YS.
A continuous cooling approach (shown in Figure 1b) was used to exploit auto-tempering during cooling between
Ms and Mf to stabilize an austenite fraction. The salt bath was placed at a temperature just below Mf to slow the last stages of cooling, in an area where, given the low amount of austenite not yet transformed, carbon diffusion could stabilize a fraction of it. As the holding time is very low, following the final quenching step, a 10 minutes tempering stage at the optimal partitioning temperature (from CCE) is applied to enhance ductility of martensite. The microstructures obtained through continuous cooling strategy are shown in Figure 5. Sample 770-CC, 780CC and 790-CC show respectively a ferritic-martensitic, ferritic-bainitic-martensitic and bainitic-martensitic microstructure. Coherently with the designed treatment, the higher the amount of ferrite, the higher the carbon content in austenite and thus its hardenability.
- SEM pictures for samples: a) 770-CC, b) 780-CC, c) 790-CC.
Fig.4
Fig.5
Tab.6 - X-Ray diffraction results.
The amount of RA introduced in this case is lower than the one observed in the intercritical treatment, as the amount of time for partitioning during continuous cooling is lower than the for intercritical treatments.
The tensile properties of the continuous cooling strategy
samples are shown in Table 7. Yield strength decreases with increasing amount of soft ferrite in the microstructure, coherently with the rule of mixtures. Good combination of tensile properties and elongation is observed in all the different cases.
Tab.7 - Tensile properties for continuous cooling samples.
Hardening coefficients are correlated with the microstructural features of the material. Due to its increased hardening coefficient, the presence of ferrite increases the overall hardening coefficient of the material for higher strains. Samples 780-CC and 790-CC, feature
a two stage hardening, linked to the occurrence of strain induced transformation. 770-CC case, containing ferrite and tempered martensite, shows the greatest hardenability.
Fig.6 - Tensile tests and hardening behavior of CC samples.
DISCUSSION
The effectiveness of QP depends largely on its ability to control the diffusion of carbon within the austenite, preventing competitive phenomena that trap it. Silicon for example is added to slow the precipitation of carbides [5]. The formation of bainite (α + Fe3C) should consequently also be avoided as far as possible. However, the chemical composition of 20MnB5 does not allow a martensitic microstructure to be obtained during quenching in the salt bath. The development of intercritical treatments attempts to address these issues through the creation of a multiphase, controlled microstructure that promotes treatment efficacy. Partial austenitization in the γ + α range leads to increased carbon concentration in the austenite, retarding the transformations during cooling. The initial fraction of the two phases should be chosen carefully: too high a percentage of ferrite can lead to an insufficient final amount of martensite, from which carbon diffusion can start, leading to a modest amount of retained austenite. This corresponds to case 770. A too high amount of low-carbon austenite instead is not able to avoid transformations during cooling (case 790).
The tensile properties introduced by these treatments are found to be high, and a fraction of retained austenite has been introduced in 780 and 790 samples, showing the effectiveness of this approach. The differences in work hardening coefficients show that different microstructural conditions were obtained. 790 case shows the lowest starting hardening coefficient, because of its lower martensitic and higher bainitic fraction [9][10]. The presence of RA increases n for higher strains in 780 and 790 case, while the hardenability of 770 case is given by the presence of ferrite [2][3]. Unsuspiciously, 780 case (with highest RA), is not the one with the highest UE, while the best case turns out to be 790, where a lower fraction of retained austenite is obtained, but overall a better uniform elongation as well as YS is obtained.
CC treatments show excellent mechanical properties but lower UEs. Yield strength varies with the amount of ferrite present in the microstructure, and a fraction of retained austenite is observed in the 780-CC and 790-CC cases. it is interesting to observe that in the 770-CC case (without RA), the work hardening coefficient is high even at high strains due to the presence of ferrite, and that it is also
higher than the 780-CC and 790-CC cases that show the occurrence of TRIP effect.
Both the intercritical and the continuous cooling approach result effective in ensuring the stabilization of RA through quenching and partitioning in 20MnB5 steel. However, these results lead to the conclusion that in the obtained complex multiphase microstructures, stabilization of a fraction of retained austenite is not the primary way to enhance the strength and ductility of the material. The features of the multiphase matrix (phases and quantities) turn out to be the crucial point for controlling the final material properties.
CONCLUSIONS
Two strategies, namely intercritical treatment and continuous cooling and tempering, were employed to enhance the applicability of quenching and partitioning on low carbon-low silicon 20MnB5 steel. The outcome of the work is presented hereby:
- Intercritical QP treatments introduce multiphase microstructures composed of ferrite, martensite, bainite and retained austenite. High tensile properties (800-900 MPa of UTS) and ductility (18-20%) are obtained.
- Samples 780 and 790 show a fraction of retained austenite stabilized at room temperature. 770 sample, featured by the highest amount of ferrite, shows a dual phase microstructure with no RA.
- Continuously cooled samples show lower amount of retained austenite and higher tensile properties (UTS >1000 MPa) with respect to the previous. Yield strength decreases with ferrite fraction. 790-CC case shows the highest tensile properties.
- A higher uniform elongation is not directly correlated to the occurrence of TRIP effect. Sample 770-CC, composed of a dual phase ferritic-martensitic microstructure, shows the highest hardening coefficient as well as uniform elongation.
The overall behavior of the created microstructures is due to the combination of the effects of the phases within them. As observed in the specimens, the stabilization of a fraction of retained austenite is secondary to the balance of mechanical properties and ductility provided by the other phases present: the TRIP effect does not necessarily
provide the greatest increase in UE unless accompanied by control of the entire microstructure.
REFERENCES
[1] J. Speer, D. K. Matlock, B. C. De Cooman, and J. G. Schroth, “Carbon partitioning into austenite after martensite transformation,” Acta Mater., vol. 51, no. 9, pp. 2611–2622, 2003, doi: 10.1016/S1359-6454(03)00059-4.
[2] K. O. Findley, J. Hidalgo, R. M. Huizenga, and M. J. Santofimia, “Controlling the work hardening of martensite to increase the strength/ ductility balance in quenched and partitioned steels,” Mater. Des., vol. 117, pp. 248–256, 2017, doi: 10.1016/j.matdes.2016.12.065.
[3] Z. H. Cai, H. Ding, R. D. K. Misra, and Z. Y. Ying, “Austenite stability and deformation behavior in a cold-rolled transformation-induced plasticity steel with medium manganese content,” Acta Mater., vol. 84, pp. 229–236, 2015, doi: 10.1016/j.actamat.2014.10.052.
[4] M. Soleimani, A. Kalhor, and H. Mirzadeh, “Transformation-induced plasticity (TRIP) in advanced steels: A review,” Mater. Sci. Eng. A, vol. 795, no. July, 2020, doi: 10.1016/j.msea.2020.140023.
[5] I. Miettunen, S. Ghosh, M. C. Somani, S. Pallaspuro, and J. Kömi, “Competitive mechanisms occurring during quenching and partitioning of three silicon variants of 0.4 wt.% carbon steels,” J. Mater. Res. Technol., vol. 11, pp. 1045–1060, 2021, doi: 10.1016/j. jmrt.2021.01.085.
[6] B. Kim, J. Sietsma, and M. J. Santofimia, “The role of silicon in carbon partitioning processes in martensite/austenite microstructures,” Mater. Des., vol. 127, no. April, pp. 336–345, 2017, doi: 10.1016/j.matdes.2017.04.080.
[7] S. Barella, M. Belfi, A. Gruttadauria, C. Liu, and Y. Peng, “Metallurgical and Mechanical Investigation on Single-Step Quenching and Partitioning Thermal Treatments on Commercial Low Alloyed 30MnV6 Steel,” Metall. Mater. Trans. A Phys. Metall. Mater. Sci., pp. 12–14, 2023, doi: 10.1007/s11661-023-07262-y.
[8] C. Celada-Casero, C. Kwakernaak, J. Sietsma, and M. J. Santofimia, “The influence of the austenite grain size on the microstructural development during quenching and partitioning processing of a low-carbon steel,” Mater. Des., vol. 178, 2019, doi: 10.1016/j. matdes.2019.107847.
[9] H. Ashrafi, M. Shamanian, R. Emadi, and N. Saeidi, “Correlation of Tensile Properties and Strain Hardening Behavior with Martensite Volume Fraction in Dual-Phase Steels,” Trans. Indian Inst. Met., vol. 70, no. 6, pp. 1575–1584, 2017, doi: 10.1007/s12666-016-0955-z.
[10] M. M. Karimi and S. Kheirandish, “Comparison of work hardening behaviour of ferritic-bainitic and ferritic-martensitic dual phase steels,” Steel Res. Int., vol. 80, no. 2, pp. 160–164, 2009, doi: 10.2374/SRI08SP082.
TORNA ALL'INDICE >
Innovative coating for Electroplated Hard Chromium replacement in severe environments
L. Fabiocchi, N. Lecis, K. Mounir
The aim of this paper is the study and the characterization of new solutions for the replacement of Electroplated Hard Chromium (EHC) coatings in severe environments. Starting from the failure analysis of hard chromium at high temperature and subjected to severe wear conditions, the phenomena and mechanisms leading to coating failure were investigated and understood. From this preliminary analysis the coating main properties were identified and innovative solutions were considered and studied to check their suitability for the application.
Finally, the characterization of the proposed solution was compared to the properties and the failure mechanism of similar type of coatings used in the same environmental conditions. The innovative solutions considered in this paper are electroplated double layer nickel chromium and ceramic coatings obtained by thermal spraying with different techniques, specifically a tungsten carbide in cobalt or cobalt chromium matrix by High Velocity Oxygen Fuel (HVOF) and High Velocity Air Fuel techniques (HVAF).
KEYWORDS: FAILURE ANALYSIS, ELECTRODEPOSITED HARD CHROMIUM, THERMAL SPRAY CERAMIC COATING, HIGH VELOCITY OXYGEN FUEL (HVOF), HIGH VELOCITY AIR FUEL (HVAF), WEAR RESISTANCE
INTRODUCTION
Electroplated Hard Chromium (EHC) is usually employed in applications under severe operating condition. Its mechanical and chemical features allow its use in high temperature environments subjected to wear and exposed to corrosive agents.
EHC requires the use of hexavalent Cr [1] [2] [3], however, the increased awareness of its toxicity, compelled the imposition of rules for the wastewater treatments and for the workers exposure [4]. Additionally, it has to be considered also the increasing demand of recycling solutions, which required the increment of the component life and successively an easier and eco-friendly disposal. Considering the complex and severe environments, to replace EHC, the innovative solutions considered in this work are an electroplated double layer nickel chromium and different thermal sprayed ceramic coatings, specifically tungsten carbide in cobalt or cobalt chromium matrix. Two different thermal sprayed techniques are also taken into account: High Velocity Oxygen Fuel (HVOF) and High Velocity Air Fuel techniques (HVAF).
Starting from the failure analysis of existing hard chromium coatings, the failure conditions and the mechanism of failure were individuated. Based on this analysis, a proper experimental procedure was designed to identify the main as-deposited coating properties, thus being a reference for the selected innovative ones. The properties and failure mechanisms of these alternative solutions, tested at the same conditions, were studied and compared to the EHC.
The experimental procedure adopted was defined considering the main physical and chemical severe conditions that the coating has to face (mechanical stresses, friction, temperature gradients and chemical corrosion) in the majority of its applications. In particular: coating mechanical properties such as hardness and adhesion are used to investigate resistance to mechanical stresses; wear test at 200 °C is used to verify the wear
resistance and friction coefficient at temperature different from the ambient one. Finally, a zinc corrosion test is performed to verify the shielding ability of coatings, required to avoid penetration of detrimental elements that could react with the substrate material, leading to the component failure [5].
EXPERIMENTAL PROCEDURE
Material and visual inspection
Different samples were studied; some were preliminary tested at high temperature (around 200 °C) and subjected to mechanical loads and sliding friction, together with the presence of detrimental elements (Zn and S) [5].
Summary of the samples and main information are reported in the following table (Tab.1).
Tab.1 - Sample name and composition specifics.
Cr140FC Pure copper Hard chromium 140 Yes, finished the cycles.
Cr90N Pure copper Hard chromium 90 No
NiCr90N Pure copper Double layer nickel - chromium
Cr: 90 Ni: 130 No
WC-23CoN Copper silver alloy HVOF WC-23Co <200 differently from specification No
WC-11Co5CrNgrad Pure copper HVAF WC-11Co5Cr
WC-10Co5CrNgrad Pure copper HVAF WC-10Co5Cr
Top: 40 Middle: 110 Bottom: 150 No, with gradient thickness
Top: 115 Bottom:160 No, gradient thickness, damaged during transportation
WC-23CoU Copper silver alloy HVOF WC-23Co 155 Yes, compromised coating integrity. Presence of surface and transversal cracks
WC-25CoD Copper with fine dispersion of chromium particles HVOF WC-25Co 150 Yes, coating delamination and substrate cracking
WC-Co-HVAFused Pure copper HVAF WC16Cox 75 Yes, coating delamination and substrate cracking
In the case of tested samples, especially those already preliminary damaged, more accurate sample selection is required: samples from both visibly defected and nondefected regions are chosen to understand the failure mechanisms and characterize the properties of the coating during operations.
Detailed about the parameters used for the production of the samples are not available due to confidentiality reasons.
Characterization
Optical microscopy and SEM
Visual characterization was carried out with Light Optical Microscopy (LOM) (“Nikon eclipse LV150NL”) and Scanning Electron Microscopy (SEM) (“Zeiss evo 50”). Visual characterization was performed to measure the coatings thickness and to characterize the coating morphology.
It was possible to estimate the grain dimensions in the copper substrate with the line method by image analysis on micrographs of etched samples with an acid solution prepared as 10 g FeCl³, 50 ml HCl, 10 ml HNO3 and 100 ml H2O.
Chemical composition analysis was also performed with the Energy Dispersive X-ray (EDX) spectroscopy to aid the identification of the ceramic coating phases and the contaminations from the liquid metal contact.
Hardness (ISO 6507)
Vickers micro-hardness measurements were conducted with different parameters for each region of the samples. The load employed for the copper substrate was 100 gf, while for the coating cross section a load of 300 gf was used, due to the presence of very thin coatings.
Adhesion: transversal scratch test (ISO 2819 - EN 1071 for electroplated coatings and ISO 27307 for ceramic coatings)
Transversal scratch test evaluates the adhesion of the coating by measuring its critical load (i.e. the load that causes cracks to form starting from the interface substratecoating). If cracks develop inside the coating, the cohesive strength is smaller than adhesive strength. The transversal scratch test machine used is the "CSM
instruments Micro-combi tester" and the testing conditions for all samples were at constant load, at speed of 1.2 mm/min, a scratch length of 2 mm, and a Rockwell diamond-type indenter with a radius of 200 µ m. Statistical evaluation was performed, when possible, using a 66% probability, indicating the presence of cracks in 2 out of 3 tests at the same load.
Wear test
Wear testing was conducted to measure the friction coefficient and to qualitatively evaluate the behaviour of coatings at 200 °C. The linear test was performed with the "Rtec instruments Multifunction Tribometer MFT 5000" with an alumina ball of 6 mm as pin. Test duration was set at 12 minutes with a frequency of 15 Hz and a track length of 6.835 mm, resulting in a linear velocity of approximately 0.21 m/s.
Molten zinc test
It is widely reported that zinc and sulphur diffusion in copper substrate through damaged coating leads to the formation of fragile intermetallic alloys that causes the deterioration of the entire coating. Samples with dimensions (HxWxD) 1.5x1.5x0.5 cm were prepared and immersed in molten zinc. After 4 hours they were extracted and prepared for a visual and chemical analysis.
RESULTS AND DISCUSSION
Electroplated hard chromium coating failure analysis
The sample Cr90N shows the typical structure of EHC coatings [4] [6] as well as the sample Cr140FC, even though visibly damaged due to the service conditions at which it was subjected before being analysed.
As can be seen in Fig.1, the coating surface of Cr140FC have the typical cracks of the EHC, moreover scratches and abraded zones are also visible. Transversal cracks along the entire coating thickness are visible in the cross section of the sample, while these are reduced in Cr90N. The average values of the mechanical test results are reported in the Tab.2.
Since metallic elements not belonging to the nominal composition of the materials were individuated inside the transversal cracks of Cr140FC (see Fig.2), a zinc test was
performed on both samples. In both samples delamination was observed after immersion in the molten metal, as can be observed in Fig.3.
Fig.1 - Surface and cross section of EHC coatings: Cr140FC on the left and Cr90N on the right.
Tab.2 - Mechanical test results: hardness and adhesion.
Fig.2 - Coating defect of sample Cr140FC (left) and EDX analysis of the infiltrated elements.
Fig.3 - SEM images and scheme of the infiltration mechanism of Zn for the EHC coating.
Cr90N has a lower thickness compared to Cr140FC, however the coating and substrate hardness are higher: the latter is due to the presence of silver in the substrate, which improves the mechanical properties of the alloy with respect to pure copper. Besides, the critical load of Cr90N is much lower than Cr140FC. This can be explained by the initial conditions: coating Cr140FC was exposed to high temperature and to compression stresses for a long period, which could have enhanced the chemical bond between coating and substrate.
From the results of the analysis on Cr140FC it was clear that infiltration of zinc and sulphur, with the subsequent formation of intermetallics with the copper substrate, was the principal cause of the coating failure together with the mechanical stresses leading to transversal cracks formation. These connect the substrate to the external part of the coating, thus hindering the shielding ability of the material.
The zinc test confirmed the coating failure mechanism: fragile copper-based intermetallics containing mostly sulphur and zinc formed due to the molten metal penetration through the hard chromium microcracks and, they weakened the interface, finally leading to coating delamination owing to the pressure generated
by the volume of liquid itself. In the case of Cr140FC, the effect of compressive and shear stresses on the surface during wear tests allowed a partial microcracks closure, thus delaying the infiltration of the molten metal and the consequent chemical attack mechanism.
Characterization of innovative solution coating for EHC replacement
For the NiCr90N coating, micrographs in Fig.4 display the difference between the electrodeposited chromium and the electrodeposited nickel layers: the former features pores and microcracks, the latter is compact.
All thermal spray coatings showed thickness and composition inhomogeneities: the former is more evident for the HVOF WC-23CoN and for the samples with lower thickness, while the latter is present in all samples since it is an intrinsic characteristic of the deposition process. In particular, cobalt and chromium rich islands were detected.
Fig.4 - NiCr90N double layer coating, from top to bottom: Cr layer, Ni layer and Cu substrate (left). WC10Co5CrNgrad coating microstructure inhomogeneities, indicated by the red circle for Fe particles, blue for Co-rich and green for Cr-rich pools.
The difference in the compositions is reflected in the hardness values: even though WC-23CoN has a similar thickness to WC-11Co5CrNgrad middle and bottom sections and WC-10Co5CrNgrad bottom part, its hardness is slightly lower due to the reduced carbide fraction (Fig.5).Considering the three sections of WC11Co5CrNgrad, it can be noticed an increasing thickness accompanied by a coherent trend in the coating and in the substrate hardness. Substrate of thicker thermal spray coatings are, in fact, subjected to high temperature and
compressive stresses for a prolonged time, inducing recrystallization and plastic deformation at the surface, which is reflected on the average grain size at the interface coating-substrate (Fig.6). NiCr90N, WC-23CoN and WC11Co5CrNgrad top have lower coating hardnesses, but they are still comparable to EHC.
It should also be noted that HVOF could be detrimental to the hardness of the coating, owing to the stronger decarburization effect on the WC fraction with respect to the HVAF process [7] [8].
- Coating cross section hardness comparison using a load of 300 gf.
Fig.6 - Substrate hardness comparison using a load of 100 gf and corresponding average grain size for the sample WC-11Co5CrNgrad.
Fig.5
Thermal sprayed coating showed a greater adhesion than EHC even though the bond between coating and substrate is physical and not chemical as in electrodeposition. The greater the thickness of the thermal sprayed coating the higher is the adhesion strength; indeed, thinner coating showed a very low adhesion, although it was still comparable to Cr90N and NiCr90N samples (Tab.3). All samples showed a lower dynamic friction coefficient
with respect to Cr90N, apart from WC-23CoN which showed a comparable value for the test at 5 N and a lower value at 7 N. Despite this, the material removal rate of all thermal spray coatings was almost negligible, the profilometry of the tracks were almost comparable to the surface roughness while for the electroplated coating a relevant depth was detected.
All thermal spray coatings showed an excellent resistance to zinc corrosion with the exception of the thinner sample of WC-11Co5CrNgrad, while NiCr90N revealed a peculiar behaviour. In this case, the chromium layer
was completely delaminated, however the nickel layer succeeded in protecting the copper substrate, consequently no detrimental intermetallic phase was formed below the coating.
Thermal sprayed coating failure analysis
Since thermal sprayed coatings showed good characteristics with respect to the experimental campaign conducted, they were also studied in the combined severe environmental conditions to which the Cr140FC coating was initially subjected.
This last experimental campaign on the proposed thermal spray coating, was focused on the failure phenomena occurring, once the coating is subjected to the combination of stresses due to temperature, load and chemical interaction. Since in the previous analysis was evidenced that
thickness and thermal spray technology were the main influencing parameters, preliminary characterization on the coatings was not performed. The aim was to see the failure that could occur in the coatings, by considering the worse condition: low thickness for the HVAF coating and HVOF technology, instead of HVAF.
WC-Co-HVAFused was studied only by optical and chemical analysis. The proposed failure mechanism was attributed firstly to the insufficient coating thickness, that led to the deformation of the ductile substrate, as can be seen in Fig.8. After reaching critical deformation, brittle
Tab.3 - Adhesion and wear performances of the innovative solution coatings.
Fig.7 - NiCr90N EDX line analysis (left). WC-11Co5CrNgrad middle EDX line analysis.
cracking of the ceramic coating initiates at the surface. Consequently, stressed copper was then “extruded” and attacked by detrimental elements, mainly sulphur and traces of zinc.
Successively, crack opening and penetration of metals
under the coating in the weak spots occurred, leading to coating delamination caused by weak interphases and mechanical forces at the surface, as well as cohesion failure and erosion.
Differently from the WC-Co-HVAFused, WC-25CoD and WC-23CoU had a different mechanism of failure owing to their higher thickness.
These two samples do not show localized defects but extended erosion, coating surface cracks and depletion in the most stressed region. The depletion zone is higher in the WC-23CoU sample with respect to the WC-25CoD. The samples have different substrates: WC-25CoD features copper with chromium and zirconia particles, which is reflected in the higher hardness (110 HV instead of 94 HV), as opposed to WC-23CoU that comprises pure copper. This difference may be the cause of the earlier failure.
For both samples the adhesion strength is higher than 30 N.
Due to surface cracks, slag elements were able to penetrate through the coating and react with the substrate. Both samples showed presence of cracks also in the substrate, in particular WC-25CoD shows deeper average cracks (~3.1 mm instead of ~0.5 mm) owing to its prolonged usage time (triple than WC-23CoU).
In all cases zinc contamination of the crack edges is present.
CONCLUSION
The analysis of hard chromium coatings (Cr140D and WC23CoN) identified chemical corrosion as the main failure
cause, owing to reaction with zinc and sulphur penetrating the coatings through microcracks. Delamination and substrate damage resulted from the formation of intermetallic alloys at the interface. Different innovative coatings exhibited varying levels of protection.
Double layer coating represents a valid alternative to the single layer, since the substrate is protected by the zinc layer, however frequent repairs would be needed and the hexavalent chromium problem would not be solved. Ceramic coatings represent a promising alternative. The study emphasized the importance of thickness and composition, highlighting challenges such as thermal sensitivity and fragility during sample preparation. Besides also the characteristics of the substrate influences failures. Failures in WC-25CoD and WC-23CoU coatings were attributed to friction-induced depressions in the most stressed region, while WC-Co-HVAFused low thickness led to localized substrate deformation.
Adjusting the thickness and toughness of thermal sprayed cermet coatings is essential for their use in severe wear and temperature environments. Further research is needed to optimize the coating composition and to limit the costs for high thickness.
AKNOLEGMENTS
Thanks to college Sina Sedaghatnezhad for the analysis of samples WC-23CoN and WC-23CoU.
[4] M. Horvat and B. Bocca, “Prioritised substance group: Cadmium (Cd) and Hexavalent Chromium (Cr VI).”[Online].Available: http:// ec.europa.eu/DocsRoom/documents/10010/attachments/1/translations
[5] S. Barella, A. Gruttadauria, C. Mapelli, and D. Mombelli, “Investigation of failure and damages on a continuous casting copper mould,” Eng Fail Anal, vol. 36, pp. 432–438, Jan. 2014, doi: 10.1016/j.engfailanal.2013.11.004.
[6] J. Pina, A. Dias, M. François, and J. L. Lebrun, “Residual stresses and crystallographic texture in hard-chromium electroplated coatings,” Surf Coat Technol, vol. 96, no. 2–3, pp. 148–162, Nov. 1997, doi: 10.1016/S0257-8972(97)00075-3.
[7] G. Bolelli et al., “Tribology of HVOF- and HVAF-sprayed WC-10Co4Cr hardmetal coatings: A comparative assessment,” Surf Coat Technol, vol. 265, pp. 125–144, Mar. 2015, doi: 10.1016/j.surfcoat.2015.01.048.
[8] Q. Wang, S. Zhang, Y. Cheng, J. Xiang, X. Zhao, and G. Yang, “Wear and corrosion performance of WC-10Co4Cr coatings deposited by different HVOF and HVAF spraying processes,” Surf Coat Technol, vol. 218, no. 1, pp. 127–136, 2013, doi: 10.1016/j. surfcoat.2012.12.041.
[9] Sanz Alejandro, “Tribological behaviour of coatings for continuous casting of steel,” Surf Coat Technol, pp. 55–64, 2001.
[10] Š. Houdková, F. Zahálka, M. Kašparová, and L. M. Berger, “Comparative study of thermally sprayed coatings under different types of wear conditions for hard chromium replacement,” Tribol Lett, vol. 43, no. 2, pp. 139–154, Aug. 2011, doi: 10.1007/s11249-011-9791-9.
[11] S. Wang, C. Ma, and F. C. Walsh, “Alternative tribological coatings to electrodeposited hard chromium: a critical review,” Transactions of the Institute of Metal Finishing, vol. 98, no. 4. Taylor and Francis Ltd., pp. 173–185, Jul. 03, 2020. doi: 10.1080/00202967.2020.1776962.
[13] K. O. Legg and B. Sartwell, “Alternatives to Functional Hexavalent Chromium Coatings: HVOF Thermal Spray.”
[14] Y. Liu et al., “A comparative study on wear and corrosion behaviour of HVOF- and HVAF-sprayed WC–10Co–4Cr coatings,” Surface Engineering, vol. 33, no. 1, pp. 63–71, Jan. 2017, doi: 10.1080/02670844.2016.1218194.
[15] M. Liao, W. Xu, X. Liu, B. Jia, C. Sun, and H. Li, “Tribological behavior and self-repairing performance of chromium oxide films over multiple thermal cycles from 25 °C to 1000 °C,” Tribol Int, vol. 165, Jan. 2022, doi: 10.1016/j.triboint.2021.107279.
[16] S. Singh, C. C. Berndt, R. K. Singh Raman, H. Singh, and A. S. M. Ang, “Applications and Developments of Thermal Spray Coatings for the Iron and Steel Industry,” Materials, vol. 16, no. 2. MDPI, Jan. 01, 2023. doi: 10.3390/ma16020516.
TORNA ALL'INDICE >
Heterogeneous intragranular nucleation of ferrite in high strength low alloy steels
V. Colla, R. Valentini, M. De Sanctis, R.A. Ishak Nakhla, M. Castagnini
In the production of High Strength Low Alloy (HSLA) steels with low carbon content markedly high yield strength (>600 MPa) can be achieved thanks to the possibility of finely control the microstructure resulting from appropriate thermomechanical cycles, as small additions (<0.1%) of strong carbide/nitride formers (Nb, Ti, V) is used to attain higher mechanical properties. In the final controlled rolling stage, the precipitation of carbides/nitrides arrests the recrystallisation of the deformed austenite, therefore, multiplies the preferential ferrite nucleation sites during successive cooling. However, this process is limited to small sheet thickness due to the limited rolling capacity of the industrial rolling mills. This work aims at evaluating the grain refining possibility in long heavy profiles taking advantage of a different strengthening mechanism defined as precipitation hardening. This mechanism introduced new preferential ferrite nucleation sites inside the austenite grains initiating at the vanadium carbide/nitride precipitates at high temperature (intragranular ferrite nucleation). Samples of an industrial commercial carbon steel with different vanadium content were casted in two different profiles at two different rolling finish temperature. The profiles were metallographically characterized to determine the volumetric fraction of ferrite and perlite microconstituents, and the mean grain size, and the perlite inter-lamellar distance was measured. The preferential intragranular ferrite nucleation sites were analysed through Transmission Electron Microscopy. A model derived from literature and based on semiempirical equations was adopted to estimate the mechanical properties as a function of the microstructure and to explain the effect of V on such final properties.
KEYWORDS:
INTRODUCTION
High Strength Low Alloy (HSLA) steels combine high strength, low ductile-brittle transition temperature and excellent weldability, and are suitable for a wide range of applications. These properties are achieved by combining small additions of some alloying elements (Ti, Nb, V) and careful control of the time-strain-temperature sequence during controlled rolling.
Thermomechanical Control Process (TMCP) is a very powerful technique for increasing strength, toughness and weldability of HSLA steels through austenite conditioning to produce an as fine as possible ferrite by controlling temperature and deformation conditions during hot rolling. The method was initially adopted for thick sheet steels and perfectioned to achieve excellent mechanical properties. The adaptation of TMCP to steel profiles was implemented by upscaling results from Yonei et al. [1] However, the main issue with TMCP for thick profiles arises from local differences in thickness. In
V. Colla
Scuola Superiore Sant’Anna, TeCIP Institute, Pisa, Italy valentina.colla@santannapisa.it
R. Valentini, M. De Sanctis, R.A. Ishak Nakhla, M. Castagnini
Università di Pisa, Department of Civil and Industrial Engineering, Italy
renzo.valentini@unipi.it, massimo.desanctis@unipi.it, r anda.ishak@unipi.it
HIGH STRENGTH LOW-ALLOY STEELS, NUCLEATION, MODELLING
the case of "H" shaped profiles, the maximum thickness ratio between flanges and web can rise up to 3, which generates a large difference in conditions such as the rolling temperature or the reduction ratio between web, flanges and fillet during hot rolling. For high product thickness, other well-known issues arise, e.g. excessive rolling load, too long residence times, low finishing temperatures and cooling rates. To overcome these problems, grain refinement by nucleation of intragranular ferrite on precipitates can be applied. Grain refining is the most useful steels strengthening mechanism, holding the unique capability to increases both strength and toughness [2].
Several literature works suggest that VN or VC particles precipitated into the austenitic grains during or after hot rolling can help intragranular ferrite nucleation [3,4] provided that the rolling and subsequent cooling are suitably controlled. Therefore, TCMP plays a fundamental role in the achievement of a fine intragranular microstructure of ferrite or acicular ferrite in V microalloyed steels, being this strongly dependent on size and
number of nucleated particles as well as on the hot rolling temperature cooling rate.
The present work investigates how the mechanism of precipitation hardening can be applied in the production of long heavy profiles through TCMP by adopting a model based on semi-empirical equations to assess the benefits of V addition in terms of final mechanical properties based on the obtained microstructure.
MATERIAL AND METHODS
Samples of 3 industrial commercial carbon steels with different V content (0% V, 0.03% V, 0.07 V) were casted in 2 different profiles, H-profile (IPN 100) and U-profile (UPN 180), at two different rolling finish temperature. Table 1 shows the metallurgy of the 3 considered grades, while Table 2 shows the mechanical characterization of the considered products in terms of Ultimate Tensile Strength (UTS), Yield Strength (YS), percentage elongation (El%) and resilience measured at different temperature values using a V-shaped specimen (KV).
Tab.1 - Metallurgy of the considered steel grades.
Tab.2 - Mechanical characterization of the considered products.
To characterize the thermal history of the considered products, temperatures at the exit of the different stages of roughing and finishing mills were recorded through pyrometers and are schematically represented in Figure 1 together with the profile deformation per pass (ε).
Samples of the obtained profiles underwent metallographic characterization through Optical Microscopy (OM) and Transmission Electron Microscopy (TEM) to determine the volumetric fraction of ferrite and perlite microconstituents, and the mean grain size as well
as to measure the pearlite inter-lamellar distance. The preferential intragranular ferrite nucleation sites were also analyzed through TEM. Raw cubic specimens were
taken as depicted in Figure 2 and underwent standard metallographic preparation.
(a) (b)
RESULTS OF THE EXPERIMENTAL CHARACTERIZATION
The main difference between the thermomechanical cycles of IPN100 and UPN 180 lies in the temperature field in the γ field at the finishing mill. For both profiles, significant plastic deformations in the low-temperature range are carried out in last four rolling cages: but for IPN 100 temperature at significantly lower. Table 2 shows that for steel grades Ga and Gb IPN 100 shows higher YS values compared to UPN 180, and for Ga also UTS is higher. Focusing of UPN 180 only, V addition increases both UTS and YS, but decreases ductility (El%). Finishing
temperature and of V content also affect resilience at low temperature and brittle-ductile transition temperature (BDTT): for Ga BDTT<-60 °C, for Gb -60 °C<BDTT<-40 °C, for G c BDTT~0 °C.
Although for IPN 100 the high-V grade was not tested, it is worth noting that for the medium-V grade no significant resilience decrease is observed with respect to grade Ga . The results of the microstructural analysis carried out via OM and TEM are summarized in Table 3.
Fig.1 - Overview of thermomechanical cycle for (a) IPN 100; (b) UPN 180 steel grade A.
(a) (b)
Fig.2 - Raw specimen position for (a) IPN100; (b) UPN 180 steel grade A.
Tab.3 - Mechanical characterization of the considered products.
Such as shown in Figure 3, the microstructure consists in all cases of a mixture of polygonal ferrite (A) and pearlite colonies (B), but a finer grain size is obtained via reduction of the temperature of the final rolling stages and via V addition (see Table 3).
The refinement of ferritic grain is primarily due to an increase in ferrite nucleation sites during laminate cooling and passage through the inter-critical field. In the finishing stages, plastic deformations are imposed at relatively low temperatures, at which the dynamic and static recrystallization of the austenitic structure is slower. During phase transformation at the cooling stage, ferritic grains tend to form on the heavily defective regions of grain
boundaries. The cumulated plastic deformation within the austenitic grains allows to significantly increase the ferrite preferential nucleation sites, by introducing dislocations and deformation bands in the austenitic grains. It is also well known that V reduces the austenite recrystallization rate, as a result of both a slowing down of the grain boundaries motion due by inducing micro-deformations in the crystalline structure of the solid solution (the socalled solute drag), and a pinning force on the grain boundaries due to possible precipitation of V (C,N), which is highly favoured if plastic deformations are imposed at sufficiently low temperatures (the so-called strain-induced precipitation).
Fig.3 - Optical micrography (1000x) for: a) IPN 100 Ga; b) IPN 100 Gb; c) UPN180
DISCUSSION AND CONCLUSION
Literature results show that the maximum temperature at which recrystallization is stopped by carbide/ carbonitride precipitation decreases as the ε increases [5]. Considering the high deformation rates imposed in the rolling mill, it can be assumed that recrystallization stops at T~900 °C in the considered V-alloyed steels. Therefore, only for IPN 100 the temperature at the finishing stages strongly favour the precipitation of V (C,N), while for UPN 180 this effect appears significantly reduced. This explains the finer ferritic grain (see Table 3) obtained IPN 100 with a medium-V grade Gb, which is also finer than those
obtained with the high-V grade Gc used for UPN 180. However, the relevant but not exceptional refinement of the ferritic grain does not fully justify the drastic strength increases obtained via V addition and the drop in resilience observed in the high-V grade for UPN 180.
In order to explain the obtained experimental results, considering the obtained structure is mixture of polygonal ferrite and pearlite colonies, literature models were used to compute UTS and YS based on the steel metallurgy and to the ferrite and pearlite grain size for C-Mn steels that do not contain V. In particular, the following two sets of empirical equations were used [6,7]:
4 compares experimental values of UTS and YS and their estimates obtained through Eq.s (1)-(4).
- Experimental vs. estimated values of UTS and YS.
As expected, especially Eq.s (3) and (4) provide acceptable results for Ga, as this steel grade does not contain V, while the discrepancies are relevant for Gb and very significant for G c for both profiles. The presence of micro-alloying elements, even if in very low percentages, certainly does not involve significant contributions in terms of hardening by solid solution, but it can lead to significant contributions in case of precipitation of carbides/carbonitrides coherent with the ferritic matrix, and this is the reason why V is used in some HSLA steels to increase YS of the final product [8]. The precipitation of these particles in the ferritic phase can provide and increase of about 80-100 MPa to YS thanks
to the very small size of the precipitates (1-2 nm), to their volumetric fraction, and to their coherence with the ferritic matrix. However, it is well known that precipitation of coherent phases in ferrite heavily decreases ductility and resilience [8]. This explains the drastic increase in mechanical properties observed for UPN 180 in high-V steel grade (Gc) accompanied by a strong decrease in ductility at low temperatures. UPN 180 underwent the finishing rolling stages at relatively high temperatures (T~900 °C) that are very close to the maximum temperature of recrystallization stop. Therefore, plastic deformation contributed only to a limited extent to the precipitation of
Table
Tab.4
V nitrides/carbonitrides. In other words, it is likely that for the high-V steel grade Gc rolled at the high temperature, the inter-critical field was crossed while austenite was significantly supersaturated with V. The solubility drop of V nitrides/carbonitrides in the austenite-ferrite transition and the pre-existing supersaturation of austenite has therefore led to a high precipitation potential of fine and coherent particles in ferrite. The result is, therefore, a significant increase in strength coupled to a decrease in ductility and toughness. This result is confirmed by micro-harness Vickers HV0.02 measurements carried out on single ferritic grains and shown in Table 5. A remarkable harness increase is observed in the ferritic grain for V-alloyed steel grades, with the highest value observed for G c and UPN 180.
TEM analysis aimed at further highlighting the capability of
particles of V (C,N) formed inside the previous austenitic grain to work as intergranular nucleation sites for ferrite.
TEM analyses were conducted as follows:
1) a ferritic grain was selected and oriented in correspondence with a main crystallographic pole.
2) Particles showing a strong image contrast that, thus, could present an orientation aligned with the ferritic matrix were selected.
3) The sample was tilted so as to align the beam with a second main crystallographic direction of the matrix, checking whether the particle under examination was also aligned with this second direction. Limited to the examined particles, no crystallographic relationships were found between these small particles and the ferritic grain.
Tab.5 - Micro-harness Vickers HV0.02 measurements carried out on single ferritic grains.
Hardness (HV0.02)
239-221-246
239-227-216 205-227-195 210-221-205 216-221-200
216-221-210
246-216-253 227-239-246 210-227-207 216-200-216
The electron diffraction analysis was also extended to the nitrides possibly formed on the surfaces of the steel inclusions, considering the strong propensity for ferrite nucleation on V nitride/carbonitride particles. Such as shown in Figure 4.a, on the surfaces of the metal oxides distributed within the structure crystallization nuclei are
formed first of titanium nitride particles and on these of V nitride/carbonitride particles; the latter capable of significantly favouring the nucleation speed of the ferrite during the crossing of the intercritical field and therefore of refining the final crystalline grain.
Fig.4 - a) Mechanism of generation of ferrite from an active oxide; b) IPN 100 Gb; c) UPN180 Ga .
REFERENCES
[1] T. Yonei, S. Suzuki, M. Oda, Y. Hida, K. Sugita e S. Mizoguchi, Development of Controlled Rolling Process for Low Temperature Wide-Flange Beams. Nippon Steel Tech.l Report, 1980, 16, 120-141.
[2] T. Kimura, Effect of Thermo-mechanical Control Process and Intragranular Ferrite Formation on Ferrite Grain Refinement of HSLA steels. CAMP-ISIJ, 1996, 9,1136.
[3] A. Ohmori, K. Oi, F. Kawabata and K. Amano, Effect of VN Precipitates on Grain Boundary and Intragranular Ferrite in a high N and V Bearing Steel. ISIJ International, 1998, 84, 797-803.
[4] F. Ishikawa, T. Takahashi and T. Ochi, Intragranular Ferrite Nucleation in Medium Carbon Vanadium Steels. Met.Trans., 1994, 25A, 929-936.
[5] S.F. Medina and A. Quisque, Influence of Strain Rate on Ricrystallisation-precipitation Interaction in V,Nb and V-Ti microalloyed steels. Mat.Sc.Tech., 2000, 16, 635-642.
[6] EC Directorat General of R&I Gutiérrez, I., Parker, S., Wadsworth, J., Property models for mixed microstructures: final report, Publications Office, 2003 ISBN: 92-894-6255-8,
[7] D.V. Doane e J.S. Kirkaldy, Hardenability concepts with applications to steel. AIME, 1978, 183.
[8] Annual Book ASTM, Properties and Selection: Irons, Steels & High-Performance Alloys. HSLA steels, 1995, 1.
[9] H. Satoh, S. Yoshida, Thermo-Mechanical Control Process for H-shapes and Its Characteristics. Technical Development Bureau Nippon Steel Corporation, 1990, 926.
Ni-based superalloys operating under challenging conditions require high mechanical strength at elevated temperatures where heat treatment processes are crucial for those materials including solutionizing and aging. The yield strength of these alloys arises concurrently from different strengthening mechanisms and the main strengthening mechanism for an alloy can change depending on the composition and processing methods. Starting from solidification, the optimum solutionizing temperature for Waspaloy is determined and isothermal aging parameters were set with ICME methods where results were compared with physical experiments. By using the modeling results, yield strength estimation was conducted from room temperature to operational temperatures and validated with thermomechanical experiments. Orowan and coherency strengthening were each found to have a great impact on yield strength, showing the importance of heat treatment processes on Waspaloy. The methods described and the model developed can be used for refining composition and microstructure to have the desired strength.
KEYWORDS:
INTRODUCTION
Ni-based superalloys are designed and developed to operate under high temperatures, high mechanical loads, and corrosive environments, in regard to the Brayton cycle where higher efficiency systems such as turbine engines are required (1). To provide these challenging properties, these materials are designed by including many alloying elements for phase transformations that contribute to corrosion resistance and material strength at elevated temperatures arising from solid solution hardening and grain boundary strengthening of ɣ -matrix, precipitation hardening, and coherency strengthening due to ɣ ' particles. Heat treatment processes adequately designed have a great impact on overall strength with respect to the amount and distribution of L12 ɣ ' particles. Since there are many different mechanisms contributing to overall strength, establishing a physically based model becomes more crucial in alloy design fields due to the difficulty of investigating the contribution of each strengthening mechanism in experiments by isolating the mechanism
which is also affected by chemical composition and phase fractions.
The coherency and solid solution strengthening contribution on overall yield strength is found to be a subject open for discussion in some studies (2-11); however, according to the authors’ knowledge, coherent and semi- coherent particles’ interaction with ɣ -matrix and strain fields occurring due to substitutional and interstitial alloying atoms create obstacles for dislocation movement and increases the material strength. Therefore, the combined effects of grain boundary, coherency, and solid solution strengthening should be considered to predict the yield strength of the material. Although computational alloy design studies with related software give a prediction on yield strength, the results obtained in such simulations have shown overprediction where optimization of the heat treatment parameters to obtain desired properties is crucial for the design of such materials.
In this study, isothermal aging of Waspaloy is applied to model the effect of each strengthening mechanism calculated by using the thermodynamic and precipitation modeling outputs. For the validation of modeling studies, physical experiments were performed both at room temperature and around operational conditions. The model is expected to be used in alloy design in the future for the optimization of material performance with the related composition and microstructure.
METHOD
Chemical, Microstructural, and Thermomechanical Experiments
To investigate the microstructural variations during heat treatment and predict the yield strength accordingly, the composition of the as-received Waspaloy was analyzed with optical emission spectroscopy (OES) from 5 different locations on diameter.
Tab.1 - Chemical composition of the as-received Waspaloy (without P and S).
Since the ingot studied was procured in hot forged condition, the microstructure of the as-received ingot was also analyzed from the same 5 locations with optical microscopy (OM) for the determination of mean grain size in accordance with ASTM E-112 and secondary electron microscopy (SEM) together with energy dispersive spectrometry (EDS) for microstructural analysis including ɣ ', carbide size and amount determination that will affect the desired time for solutionizing. The samples were cut with electrical discharge machining (EDM) and embedded in conductive bakelite. Grinding with SiC abrasive papers and polishing with diamond suspensions were applied for surface preparation. All samples were etched with 2 gr CuSO4 + 40 ml HCl + 40 ml Ethanol (95%) etchant (12). Heat treatment applications at 1080°C for 1-hour for solutionizing followed by water quenching and aging at 850°C for 18-hours followed by water quenching were conducted with THERMNEVO – Nevola Curing Furnace on 12 mm diameter rods prepared with EDM. After solutionizing and aging, high-resolution transmission electron microscopy (HRTEM) was used for the ɣ ' fraction
and size determination. The samples cut in 0.35 mm thickness were used for the extraction of 3mm diameter discs by using a disc punch and further prepared with grinding and twin-jet electrolytic polishing with 10 vol. % perchloric acid at 20.5V at -5°C.
Aged samples were subjected to CNC machining for tensile test preparation with SMR311 geometry. Gleeble 3800 system was used for tensile testing at room temperature, 580°C, 650°C, and 720° with 10-3 strain rate.
Solidification Modeling
The PANDATTM software with the PanNi2023_all database and chemical composition given in Table 1 were used to predict the equilibrium and Scheil solidification phase compositions and phase fractions in regard to the CALPHAD method. The thermodynamic equilibrium of a given system with multiphase equilibria at constant pressure is determined with respect to the summation of molar Gibbs energies of the stable phases, leading to minimum Gibbs energy.
In the given formula above, n φ stands for the number of moles and G φ m is for the molar Gibbs energy of phase φ (13).
In the Scheil method, it is assumed that the diffusion in the liquid takes place at an infinite rate and there is no diffusion in the solid phases where equilibrium is held at the liquid-solid interface. (14-16). The solute profile can be found as: (2)
where CS is the concentration of solute in the solid, at a fractional distance along the bar, fS, C0 is the initial concentration of the liquid, and k is the partition coefficient.
Precipitation Modeling
The CALPHAD method is developed to perform thermodynamic calculations and determine the phase diagrams accordingly. As this method is improved in time, applying kinetic calculations has also become possible by using the related databases formed either experimentally or together with ab-initio calculations. The PANDATTM software with the PanNi2023_all database and chemical composition given in Table 1 were also used in this part of
Tab.2 - Input parameters for precipitation modeling of Waspaloy by using PANDATTM .
themodelingstudyandthekineticdatabaseforWaspaloy is constructed by using the property model calculation results conducted by PANDATTM. The input data for the precipitation modeling studies are given in Table 2, below. The molar volume, interfacial energy, dislocation density and atomic spacing values are obtained from the property model calculation results of PANDATTM. Grain size is determined by using the as-received ingot as mentioned in MicrostructuralExperimentsPart; the aspect ratio and contact angle for the precipitates were used as thedefaultvalueswhichisapplicabletoalmostalltheNibased superalloys. By using these parameters, aging modelingisperformedat850°Cfor18-hoursbyusingthe KWNmodel. (3)
Langer-Schwarz-Kampmann-Wagner approach also known as KWN (Kampmann-Wagner Numerical model) is used which is a mean-field model assuming that the nucleation takes place homogeneously through the matrix and the precipitates form in spherical shape (1722).
The nucleation rate [3] and growth rate [4] with the KWN model are constructed with the formula:
Where Js is stationary nucleation rate, �� is incubation time, N0 is number of potential nucleation sites per unit volume, ��∗ is the rate of solute atoms in matrix joining the nucleus, ���� is the concentration of the solute in the precipitate, ��(��) is the concentration of the solute in the matrix and ���� is the concentration of the solute in the interface boundary.
Yield Strength Modeling
The overall yield strength is obtained by summing Orowan strengthening due to dislocation looping around the precipitates (�� ������), coherency strengthening arising from lattice misfit between matrix and precipitates (�� ����h), solid solution strengthening of ɣ matrix (�� ����), grain size/ boundary strengthening (����ℎ) and lattice strength of pure nickel (��0).
The linear summation method is applied by taking n=1 has been found to show a better fit with experimental data.
Precipitation Hardening
Precipitation hardening mechanisms such as particle cutting and bowing were explained with the implementation of the role of dislocations (23-25).
In the case where the applied stress is smaller for the
penetration of dislocations to precipitates - usually, the incoherent precipitates with larger precipitate sizes are seen in the microstructure -, Orowan bowing is seen in the microstructure where the dislocations with lower stress bow between the particles (26,27). An extended equation for the calculation of Orowan dislocation looping strengthening is also introduced as (28-30):
where �� is matrix shear modulus, �� is the Poisson’s ratio of the matrix, �� is the volume fraction of precipitates, �� is the mean radius of precipitates, λ is mean interparticle spacing and b is burgers vector.
Coherency Strengthening
Due to the cutting of particles or with the looping of dislocations around the precipitates, Ni-based superalloys are mostly hardened with the precipitation of ɣ ' phase. Although those mechanisms rely on the antiphase
boundary hardening occurring from the coherency of ɣ', some studies are conducted to investigate the effect of the coherency strains arising from the lattice misfit on the overall yield strength of the material. Strengthening due to lattice misfit arises from the stress fields around the interface at which the precipitate is coherent with the matrix. Those stress fields restrict the dislocation gliding, and the contribution of this misfit is explained by Brown and also by (23,24,30):
where χ is material constant changing from 2 to 3, ε is the misfit strain parameter, ���� is shear modulus of precipitates and ���� is the Poisson’s ratio of the precipitates, δ is the difference between lattice parameters of precipitate ���� and matrix ��.
Solid solution strengthening
Strengthening due to solid solution occurs when the solute element with higher strength dissolves in the solvent metal and either replaces the host atom or places between the host atoms, causing localized lattice
distortions. These distortions interact with the dislocations and strengthen the material either by dislocation locking due to size mismatch, modulus mismatch, and stackingfault interaction, or dislocation friction (31-35)
The solid solution strengthening formula varies for the ordered and disordered phases (36-38). Since both ɣ-matrix and ɣ' precipitates have ordered structures, below formula introduced by Fleischer can be used for the prediction of strength contribution via solid solution (39):
Where is a constant set for each element and depends on the atomic size and modulus, is the atomic percent of the element in the ɣ-matrix.
Grain boundary strengthening
Grain boundary strengthening is often explained by
Where k y is the Hall-Petch constant that varies depending on the alloy and D is the grain size.
RESULTS AND DISCUSSION
In order to define the solutionizing and aging temperature for Waspaloy, solidification under equilibrium and nonequilibrium conditions is analyzed. As the as-received specimen’s chemical composition is compared with the patent, it is observed that the amounts of all the alloying elements were within the limits.
With the obtained chemical composition from OES, equilibrium cooling solidification is conducted between 500 to 1750°C as given in Table 3-a and it is observed that the Waspaloy for the given composition is expected to fully solidify with a low amount of TiC and ɣ-matrix at 1312°C where the obtained results are similar with the literature, and the cause of this difference arises from chemical composition and software database, mainly (41).
blocking the dislocation motion by absorbing its energy or dividing the dislocations into pieces due to the misorientation between consecutive grains in polycrystalline materials. The grain size effect on yield strength is described by the Hall-Petch equation (40): (12)
Some carbide transformations such as Cr23C6, Cr7C3, and Mo3B2 boride formation were also expected to form during the solidification. Trace amounts of Mo3B2 that formed after the material is fully solidified are expected to positively affect the creep/tension rupture strength due to controlling grain coarsening during heat treatment and slowing down the grain boundary sliding mechanism.
Differently from the equilibrium cooling conditions, non-equilibrium solidification is expected to complete at 1142°C which is about 170°C lower than the equilibrium cooling as given in Table 3-b. Due to the liquid enrichment, solidification does not end when the solid composition is equal to the initial composition. Also, the solidification does not complete homogeneously since the segregation of some elements occurs during a high solidification rate.
The Scheil-Gulliver approach by assuming an infinitely high cooling rate for the given specimen has shown that
the ɣ-matrix is the former phase, which is expected to form, followed by the TiC carbides. ɣ' particles are seen beginning at 1180°C and the phase transformations are followed by Eta phase which is a metastable intermetallic that is lost as the solidification is completed. TiB2 borides are also expected to form as close to the end of solidification.
- Solidification modeling results completed with PANDATTM.
SEM analysis completed on 5 specimens and on 5 different locations in each specimen has shown that the material had undergone heat treatment since ɣ' precipitates are seen in the microstructure as can be observed in Figure 1. On the other hand, SEM and EDS analysis has shown that the as-received material contains TiC and MoC carbides through the material on grain boundaries varying between 0.05 to 1.5 μm size with almost spherical morphology. ɣ' precipitates were seen in two different morphologies: cuboidal and spherical.
Fig. 1 - Matrix SEM image with SE detector taken under 5000X magnification with ɣ and ɣ'.
Spherical phase particles’ diameter varies between 20 to 90 nm, whereas cuboidal ɣ' precipitates are found in the microstructure between 30 to 200 nm. Hardness measurements from those five specimens with 5 points in each have a result of 454.6 ±6.5 HV, which corresponds to about 1360 MPa tensile strength at room temperature. This measurement has also shown that the as-received part has undergone an aging process after wrought condition compared to the commercial-aged Waspaloy specimens seen in the literature (42-44).
Tab.3
The equilibrium and non-equilibrium solidus temperatures are considered as the lower and upper end states for solidification. This approach is widely used for the estimation of solidification structures and, accordingly, for the design of the homogenization process. The solutionizing temperature is set as 1080°C and the related modeling studies have shown that the material contains only ɣ-matrix with 99.67 volume fraction and TiC particles with 0.33 volume fraction is expected at that temperature. TEM images have shown that total solutionizing of ɣ'
particles occurred, dislocation pileups were observed on thegrainboundary,andpartialdislocationswerefoundin theɣ-matrixasgiveninFigure2.
As the modeling that is done with respect to KWN nucleation and growth has shown a volume fraction of 22 % of ɣ' particles are expected in the material (Table 4-a), TEM analysis has shown that the ɣ' precipitates are found inthemicrostructurewithabout80.9areapercent.
Fig.2-TEMimageoftheas-solutionizedsample
Tab.4 - Isothermal aging modeling outputs (a-c) and TEM image of the specimen that aging is applied physically.
(a) Change of ɣ' volume fraction throughout the aging of Waspaloy.
(b) Change of ɣ' particle size throughout the aging of Waspaloy.
(c) Distribution of ɣ' particles with varying sizes.
(d)
TEM image of ɣ' particles after isothermal aging at 850°C for 18-hours.
Although the fraction of ɣ' precipitates did not reflect the real heat treatment process as understood from the TEM images, the size of the ɣ ' particles was predicted almost the same as the aging process continues. Both the simulation and TEM analysis gave similar results for ɣ' precipitate radius of 24.8 nm and 25.2 nm, respectively as shown in Table 4. However, although the simulation setup is prepared for homogeneous nucleation and growth, from the TEM images the nucleation characteristic is seen as semi-homogeneous in the microstructure. Lastly, although the model expected a wider LSW distribution for the radius of the particles with varying sizes, TEM analysis has shown a narrower size distribution mainly focusing on 18 to 30 nm ɣ' particles.
With respect to the equations described before, yield strength estimation at different temperatures is completed by using the outcomes obtained in modeling studies conducted with PANDATTM. In order to complete the yield strength predictions at elevated temperatures more accurately, some terms such as lattice strength of pure Nickel, Poisson’s ratio, shear modulus, Burger’s vector, lattice parameters of ɣ-matrix and ɣ' particles, interparticle spacing and �� �� parameters were calculated by using JMatPro software from room temperature to elevated temperatures and used in the yield strength modeling as a function of temperature. The model parameters used for the determination of the effect of strengthening mechanisms and overall yield strength are given in Table 5, below.
Tab.5 - Model parameters for strengthening mechanisms.
As the critical radius is stated as 10*b by Kelly et al. (45), thecriticalradiusforthis procedureisobtainedas 2.5 nm whereas the ɣ' particles after 18 hours aging at 850°C are expected to have a 25 nm mean radius. Thus, dislocations moving along the matrix favor Orowan loopingsincetheparticleradiusisgreaterthanthecritical radius.
Solid solution strengthening calculations are completed by using the solidification model results under equilibrium cooling with the elements Cr, Co, Mo, Fe, and Al to the Nickel matrix and by using the solid solution hardening coefficients found in the literature (26).
The least effective mechanism among the others is found to be grain-size hardening. In the literature, it is observed
Additionally, although the ɣ' particles are expected to show coherent and homogeneous nucleation on the ɣ- matrix, the growth of these precipitates changes the interface characteristic from coherent to semi-coherent and incoherent (46). Therefore, coherency strengthening is also calculated and found as much effective as precipitation hardening mechanism to the yield strength of Waspaloy with the applied heat treatment.
that the grain size of Waspaloy changes from 30 to 90μm (47-49). Variation of the grain size affects the hardening due to the increasing/decreasing length of grain boundaries interacting with dislocations. However, the grain size range of Waspaloy indicated above is calculated to cause a very little difference in strength as between 24 to 42 MPa where the as-received ingot with an average grain size of 35 μm is expected to have 38.6 MPa strength from grain size hardening.
Lastly, the lattice strength of nickel is calculated as a function of temperature. Due to the Shockley partials in the material, the lattice strength of nickel decreases as the temperature increases.
By considering the fraction of these precipitates in the microstructure, it can be said that the matrix strength arises from the solid solution strengthening, grain size hardening, and matrix lattice strength whereas the second phase provides strength due to the formation of dislocation looping. Lastly, the alloy strength also increases from the interaction between the matrix
and precipitates as in coherency strengthening. The contributions of all strengthening mechanisms calculated by using the outputs of modeling studies are given in Figure 3.
For the experiments applied with 0.001 strain rate, it has been seen that the room temperature properties of the material are superior to the ones at elevated temperatures in terms of both in yield and ultimate tensile strength. After that, the property of this alloy shows better deformation kinetics and strength at 650°C than 580°C and 720°C. This also explains the design criteria of this alloy where it operates in the turbines generally around 650°C. The modeling and experimental results have shown a good agreement varying from 7 to 55 MPa from room temperature to operating temperatures. These differences are expected to occur due to the carbides and borides formed during solidification and the heterogeneities in the microstructure where in the model the microstructure is assumed to be homogeneous.
CONCLUSION
The effect of heat treatment on yield strength for polycrystalline Waspaloy was investigated and the corresponding modeling studies have shown that heat treatment applications with the parameters set by considering the related thermodynamic modeling results constitute around 60 % of the overall yield strength. The
yield strength of Waspaloy from room temperature to operational conditions also shows that the matrix strength is mainly composed of solid solution hardening, grain boundary strengthening, and lattice strength of nickel. Linear summation of the contributions of each of these strengthening mechanisms gave a correlation with less than 8% variation with the experimental data where the
Fig. 3 - Yield strength results from modeling studies and experiments.
microstructural modeling results have also shown a good agreement with experimental analysis results. The given model can be used for the determination of compositional and microstructural changes ’effect on yield strength. However, more polycrystalline alloys with ɣ' precipitates should be investigated to create a generic approach that can be applied to a larger group of Ni-based superalloys.
ACKNOWLEDGEMENT
We thank CompuTherm-PANDATTM for providing the related licences for this study. We also thank Lukasiewicz Research Network – Institute for Ferrous Metallurgy for supporting the thermomechanical tests conducted with Gleeble system and Fatih Kalıp Makine San. for the specimen preparation for Gleeble tests.
[6] E.J.Lee,A.J.Ardell,Superpositionofprecipitation-hardeningmechanisms,in:P.Haasen,V.Gerold,G.Kostorz(Eds.),Strength o ofMetalsandAlloys,vol.1,PergamomPress1979,pp.633–638.
[8] V.A. Phillips, Hardening mechanisms in a precipitation hardenable nickel-12.71 at.% aluminium alloy, Philos. Mag. 16 (139) (1967) 103–117.
[9] L.K. Singhal, J.W. Martin, The mechanism of tensile yield in an age-hardened steel containing γ′ (ordered Ni3Ti) precipitates, Acta Metall.16(7)(1968)947–953.
[10] E.I. Galindo-Nava, L.D. Connor, C.M.F. Rae, On the prediction of the yield stress of unimodal and multimodal γ′ nickel-base superalloys,ActaMater.98(2015)377–390.
[13] U. R. Kattner, “The Calphad Method and Its Role in Material and Process Development”, Tecnologia em Metalurgia Materiais e Mineracão,vol.13,no.1,pp.3–15,2016.
[14] Rahimian, M., Milenkovic, S. & Sabirov, I. Microstructure and hardness evolution in MARM247 Ni-based superalloy processed by controlledcoolinganddoubleheattreatment.J.AlloysCompd.550,339–344(2013).
[17] Z. Sheng, M. Bonvalet Rolland, T. Zhou, J. Odqvist, and P. Hedström, “Langer–Schwartz–Kampmann– Wagner precipitation simulations:assessmentofmodelsandmaterialsdesignapplicationforCuprecipitationinPHstainlesssteels”,JournalofMaterials Science,vol.56,no.3,pp.2650–2671,Jan.2021.
[18] C. Sommitsch, E. Kozeschnik, G. Wasle, and B. Buchmayr, “A Precipitation Model for Multi-Component Multi-Phase Systems in Nickel-BaseSuperalloys”,2000.
[19] Y. H. Wen, B. Wang, J. P. Simmons, and Y. Wang, “A phase-field model for heat treatment applications in Ni-based alloys”, Acta Materiala,vol.54,no.8,pp.2087–2099,May2006.
[20] K.Zhang,F.Yu,M.Zhu,J.Dan,X.Wang,J.Zhang,B.Dai,“EnhancedlowtemperatureNOreductionperformanceviaMnOx-Fe2O3/ v vermiculitemonolithichoneycombcatalysts”,Catalysts,vol.8,no.3,Mar.2018.
[27] R. W. Kozar, A. Suzuki, W. W. Milligan, J. J. Schirra, M. F. Savage, and T. M. Pollock, “Strengthening mechanisms in polycrystalline multimodalnickel-basesuperalloys”,MetallurgicalandMaterialsTransactionsA:PhysicalMetallurgyandMaterialsScience,vol.40, no.7,pp.1588–1603,2009.
[36] Y. Mishima, S. Ochiai, N. Hamao, M. Yodogawa, and T. Suzuki, “Solid Solution Hardening of Nickel-Role of Transition Metal and B-subgroupSolutes”,1986.
[42] M. A. Neri, A. Martinez -Villafañe, C. Carreño, A. D. Gonzalez Escarcega, O. Cobarrubias-Alvarado, “Metallurgical Characterization of Waspaloy Presenting Variations in Chemical Composition, Grain Size and Hardness”, The Minerals, Metals & Materials Society, 2012.
[48] J. Moravec, “Determination of the grain growth kinetics as a base parameter for numerical simulation demand”, MM Science Journal,vol.2015,pp.649–653,Oct.2015.
[49] M.A.Neri,A.Martinez-Villafañe,C.Carreño,A.D.GonzalezEscarcega,O.Cobarrubias-Alvarado,“MetallurgicalCharacterization of Waspaloy Presenting Variations in Chemical Composition, Grain Size and Hardness”, The Minerals, Metals & Materials Society, 2012.
TORNA ALL'INDICE >
Kinetics of strain aging in grade 1.4003 ferritic stainless steel
T. Manninen, P. Peura
Static strain aging of grade 1.4003 ferritic stainless steel was investigated. The test material was pre-strained to 5% elongation under uniaxial tension and subsequently aged at temperatures between 200°C and 300°C. The aging time was varied between one hour and one week. The kinetics of strain aging were evaluated based on increments in the yield strength produced by the heat treatments. The aging heat treatment caused the reappearance of a clearly defined yield point in all cases. The obtained strength increments were between 30 and 60 MPa. The apparent activation energy of the process was 128 kJ/mol. The obtained activation energy agrees with the literature values for interstitial diffusion in high-chromium Fe-Cr alloys determined with internal friction measurements.
KEYWORDS: FERRITIC STAINLESS STEEL, EN 1.4003, KINETICS, STATIC STRAIN AGING
INTRODUCTION
Bake-hardening steels are commonly used to manufacture automotive exterior body parts such as roofs, hoods, and door outer panels, i.e., parts that are painted after forming into shape. These steels are designed to achieve a significant increase in yield strength during the lowtemperature heat treatment performed to cure the paint. The gain in yield strength produced by the paint baking can range from 30 MPa to 50 MPa. The increased final strength provides improved dent resistance for the car body. Bake-hardening utilizes the phenomenon of strain aging. Strain aging is common in metals having a bodycentered cubic structure. The kinetics of the process are controlled by the long-range diffusion of interstitials to the stress field surrounding dislocations. Therefore, the required aging time and temperature depend on the diffusivity of interstitials in the metal. [1]
The grade 1.4003 is unstabilized 12% chromium ferritic stainless steel designed for structural applications. In contrast to many other ferritic stainless steel grades, 1.4003 has the weldability and toughness properties required of structural applications at sub-zero conditions. Grade 1.4003 is often used as cold-formed tubes and profiles to construct lightweight bus body frames. An increased in-service dent and impact resistance would be advantageous in this application. Since the classical theory of strain aging was developed in the 1940s by Cottrell and Bilby [2], numerous studies
Timo Manninen
Outokumpu Research and Development, Tornio, Finland
Pasi Peura
Tampere University, Tampere, Finland
have been made on static strain aging of low-carbon steel. In contrast, the research on static strain aging in ferritic stainless steels is limited. Buono et al. [3] studied the kinetics of strain aging in unstabilized 16% Cr grade 1.4016 in solution annealed state. The specimens were pre-strained in uniaxial tension to a uniform elongation of 5% and heat treated at temperatures between 80°C and 200°C; the aging time varied between 10 minutes and 2 hours. A significant bake-hardening effect was observed. The activation energy of aging was determined to be 127 kJ/mol. This value is significantly higher than the activation energy of about 80 kJ/mol for ultralow carbon bake hardening steels. The value 80 kJ/mol corresponds to the activation energy of diffusion of interstitial C and N atoms in pure α-iron. Kaçar et al. [4] studied the bake-hardening of grade 1.4016 both in as-received and solution-annealed condition. The test materials were pre-strained 5 % in uniaxial tension and aged between 100°C and 400°C for 30 minutes. A significant increase in the yield and tensile strength was obtained. The strength of the solutionannealed test material was higher than that of the asreceived test material at all aging temperatures. Palosaari et al. [5] investigated bake hardening of 18% Cr stabilized grades 1.4509 and 1.4521 in as-received condition. They showed that stabilized ferritic stainless steel grades are also susceptible to strain aging despite having abundant stabilizing elements to entrap interstitials. The maximum increment of yield strength caused by the bake-hardening was approximately 50 MPa. The activation energies were 151 kJ/mol and 146 kJ/mol. The activation energies were again considerably higher than those reported for lowcarbon bake-hardening steels. The bake hardening of low chromium ferritic stainless grade 1.4003 was recently studied by Fu et al. [6,7]. Fu determined the bake-hardening index values for this grade in as-received condition. The test material was pre-strained to 2%, 6%, or 10% tensile elongation and subsequently aged at 170°C or 210°C for 20 minutes. The increment in the yield strength produced by the aging heat treatment ranged from 15 MPa to 33 MPa. The results showed that static strain aging can increase the yield strength of low chromium unstabilized ferritic stainless steel 1.4003. The study concentrated mainly on paint baking times. The full extent of the hardening response was most likely not achieved due to low aging temperature and short aging
time. Furthermore, the results obtained in this study do not provide any information regarding the kinetics of the aging process.
The existing literature data does not provide any information on the kinetics of static strain aging of commercial grade 1.4003 ferritic stainless steel in the as-received state. Therefore, this research aimed to characterize the kinetics of strain aging of this steel grade in the as-received condition. Knowledge of the kinetics of the aging process is needed to determine the full extent of the hardening response and optimize the possible heat treatments for improving the material performance.
MATERIAL
The test material was commercial grade EN 1.4003 ferritic stainless steel with a thickness of 4mm and a surface finish of 2E. The chemical composition of the test material is given in Table 1. The microstructure of the test material was characterized with optical microscopy and electron backscatter diffraction (EBSD). The EBSD measurements were made using a Leo 1450VP scanning electron microscope equipped with an HKL NordlysF detector and HKL Fast Acquisition software. The step size was 0.1 μm. The microstructure was characterized as fine-grained ferrite with large chromium carbides. No retained austenite or martensite was observed. The grain size number of ferrite, measured according to ASTM E112, was G = 11.8. This value corresponds to the average grain diameter of 6 μm.
The mechanical properties of the test material measured in the transverse direction are summarized in Table 2. The test material was produced ten years ago. Still, the Rp0.2 and Rm values measured in the present study were within ±3 MPa of the values in the material certificate issued ten years ago. Therefore, our tensile test results confirm that ferritic stainless steel does not age at room temperature, as discussed by Alvarez de Sotomayor et al. [8].
- The chemical composition of the test material (wt-%).
Chemical composition
Tensile test results
METHODS
The testing procedure consisted of four distinct stages. First, standard tensile testing specimens were machined from the test material parallel to the transverse direction. Then, each specimen was prestrained to a 5.0% permanent elongation using a tensile testing machine; the loading rate was 0.00025 1/s. The prestrained specimens were aged at 200°C, 250°C, or 300°C in a laboratory furnace; the soaking time varied between 30 minutes and one week. The heat treatment was followed by air cooling to ambient temperature. During the heat treatments and subsequent cooling, the temperature of each specimen was measured with a K-type thermocouple. The effective soaking time ts was computed based on the temperature T during heating, soaking, and cooling as follows:
Tab.2 - The mechanical properties of the test material measured according to EN ISO 6892-1 method A223. (1)
where T is the specimen temperature, Ts is the soaking temperature, and tend is the time needed for the specimen to cool back to room temperature after the heat treatment. The effective soaking time was approximately 30 minutes longer than the nominal one. The tensile properties of aged specimens were measured
according to EN ISO 6892-1 method A223. The tensile properties of aged specimens were compared with those of un-aged, prestrained specimens. The strain aging response was quantified by the changes in the stress-strain response defined in Fig. 1.
Fig. 1 - Definition of entities ΔY, Ae, ΔU, and Δe used as measures for the strain aging response. The green line shows the response of the prestrained specimen, and the red line shows the response of the prestrained and aged specimen.
Tab.1
RESULTS
The aging heat treatment restored the pronounced yield point at all aging temperatures; the prestrained, unaged specimens showed continuous yielding. As shown in Figs. 2 and 3, the yield strength ΔY and yield point elongation A e increased with aging temperature and time. It may also be seen that the increment in the yield stress did not
increase after 48.5 hours of aging at T = 300°C. Therefore, it was concluded the aging process was very close to completion in the two most prolonged heat treatments. Hence, the saturation value for the increment in the yield stress produced by the aging process was estimated as 57 MPa.
Fig. 2 - The increment of yield strength, ΔY, caused by isothermal aging.
Fig. 3 - The yield point elongation, Ae, increases with increasing aging temperature and time.
Following Buono et al. [3], the aging kinetics was modeled with the Johnson–Mehl–Avrami–Kolmogorov (JMAK) equation
where W is the aged volume fraction, and t is the aging time. Assuming that the increase in the yield strength is caused by the strain aging, the volume fraction of aged material can be estimated with
(2)
(3)
where ∆Y max =57 MPa is the saturation value for ΔY. Aging is a thermally activated process. Consequently, the rate coefficient k can be modeled with the Arrhenius equation
Fig. 4 shows the entity ln ln(1/(1-W)) as a function of ln t. Since the measurements obtained at three different temperatures form straight lines with the same slope, the aging kinetics follows Eq. (2). The slope of the lines provides the value n = 0.29 for the time exponent.
Fig. 4 - The measurement data form three straight lines with the same slope when plotted in transformed coordinates. The parameter t0 equals one second.
The pre-exponential factor k0 and the activation energy Q were determined using multilinear regression analysis based on Eqs. 4 and 5. The values of the model parameters are summarized in Tab. 3. Figs. 5 and 6 show that an
excellent correspondence was obtained between the measured values and model prediction. The standard error of the model was S = 1.8 MPa.
- The determined model parameters.
(4)
(5)
Tab.3
Fig. 5 - Measured and predicted increment in the yield strength.
Fig. 6 - Correspondence between measure and predicted increment in the yield strength.
DISCUSSION
Table 4 shows a comparison of kinetic parameters obtained in the present work and published values for ferritic steel grades. The values Harper [9] has reported for pure α-iron are also shown for reference. It may be seen that the activation energy obtained in the present work is in good agreement with those reported elsewhere for ferritic stainless steel grades. Golovin et al. [10] determined the activation energy for diffusion of carbon in high-chromium ferritic steels using internal friction experiments. The test materials contained 8 to 35 weight percentages chromium. The obtained activation energy values increased with increasing chromium content and ranged from 119 kJ/mol to 141 kJ/mol for the 8% and 35% chromium alloys. A parabolic fit to the activation energy values given by Golovin et al. suggests that the activation
energy for the diffusion of carbon in Fe-Cr alloys containing 11.5% and 16.5% chromium would be Q = 122 kJ/mol and Q = 129 kJ/mol, respectively. These values are in excellent agreement with activation energies determined in the present work for 11.5% Cr and that determined by Buono et al. [3] for 16.5% Cr ferritic stainless steels. The activation energies in Table 4 are significantly higher for ferritic stainless steel grades than for α-iron. Golovin et al. [10] argued that chromium atoms produce nonequivalent interstitial positions, thereby increasing the activation energy. This hypothesis was recently questioned by Herschberg et al. [11], who modeled the internal friction and tracer diffusion experiments in ideal Fe-Cr-C alloys using atomistic methods. They used density functional theory (DFT) to calculate the bond energy and energy of migration for carbon atoms. The
calculated values were used to simulate internal friction and tracer diffusion experiments in Fe-Cr-C alloys with 0% and 100% chromium. Their results did not agree with the experimental study of Golovin et al.; the increase in the activation energy for the diffusion of carbon was significantly smaller than that observed by Golovin et al. Therefore, Herschberg et al. suggested that the notable increase in the activation energy observed in the earlier study was produced by the interaction of carbon with defects such as dislocations and vacancies. An alternative explanation might be proposed based on the work of Čermák and Král [12]. They studied the diffusion in carbon-supersaturated ferrite. The test materials included pure α-iron and Fe-Cr binary alloy with 15% chromium. In both cases, the diffusion of carbon could be described with the Arrhenius equation. Carbon diffusion was independent of chromium’s presence in the matrix; the activation energy for the diffusion of carbon was 158 kJ/mol in both model materials. It was concluded that the carbon atoms diffuse in ordered structures rather than individual atoms in the supersaturated matrix. This conclusion is supported by Kabir et al. [13], who studied the diffusion in the Fe-C system using density functional theory. They concluded that complexes containing one vacancy and two carbon atoms are abundant in carbon-rich ferrite. These complexes are immobile. The calculated binding energy of this vacancy cluster was 1.46 eV, i.e., 0.73 eV/atom (70 kJ/mol). The activation energy associated with the transference of carbon atoms from the cluster to the locations around dislocations should be equal to the sum of the binding energy of the cluster molecule and the activation energy for the diffusion of carbon atoms, i.e., 154 kJ/mol. This value agrees with the activation energy obtained by Čermák and Král [12] for supersaturated ferrite.
The activation energy for aging in different ferritic stainless steel grades is, without exception, significantly higher than the values reported for α -iron. The presence of chromium atoms does not considerably increase the activation energy of carbon diffusion in ferrite [11,12], whereas the carbon diffusion is slowed down in the carbon-supersaturated ferrite [12]. Therefore, the most likely reason for the higher activation energy in ferritic stainless steels is that the ferrite is supersaturated with carbon at aging temperatures. In pure α-iron, ferrite
is in equilibrium with cementite (Fe3C), whereas in ferritic stainless steel, the equilibrium carbide is Cr23C6 Cementite precipitation is expected to be considerably faster than chromium carbide since the former does not require diffusion of substitutional Cr atoms. The activation energy for bulk diffusion of chromium in ferrite is high, 250 kJ/mol [14]. Therefore, the precipitation of cementite will be faster than that of the chromium carbide when the steel strip is cooled after final annealing in a continuous annealing line. It is also possible that the chromium alloying reduces the solubility of carbon in ferrite. In this case, a considerably smaller concentration of carbon atoms will produce a supersaturated ferrite.
In the original theory for static strain aging in low-carbon steels by Cottrell and Bilby [2], the time exponent equals n = 2/3. As discussed by Lement and Cohen [15], this particular value is related to the assumption that the depletion of carbon atoms occurs in a cylindrical volume surrounding randomly situated dislocation lines. By assuming that the dislocations are arranged in cell walls, as they usually are in ferritic stainless steels and other metals with high stacking-fault energy, the geometry of carbon flow is changed from two-dimensional to onedimensional and the time exponent is reduced to n = 1/3. The time exponent obtained in the present study, n = 0.29, is close to Lement and Cohen’s theoretical value. The obtained strength increments of 30-60 MPa are comparable to those of bake-hardenable low-carbon steels used in the automotive industry [1]. The increment in the yield strength was, however, relatively modest compared to the relatively high yield strength of the cold-worked material. Furthermore, a long soaking time at a relatively high temperature was needed to achieve the highest improvements in the mechanical properties. Therefore, it seems likely that the processing costs may be high compared to the strength increment produced.
Tab.4 - Comparison of activation energy and time exponent values.
SUMMARY AND CONCLUSIONS
Our results show that low chromium ferritic stainless steel grade 1.4003 is susceptible to strain aging. The aging heat treatment restored the pronounced yield point at all aging temperatures. Furthermore, the yield strength and yield point extension increased with increasing aging temperature and time. The apparent activation energy of the process was 128 kJ/mol. While this value is considerably higher than the typical value of about 80 kJ/ mol for α-iron and for bake hardenable low-carbon steels, it agrees with the literature value for interstitial diffusion
REFERENCES
in high-chromium Fe-Cr alloys determined with internal friction measurements. The strength increments are comparable to bake-hardenable low-carbon steels used in the automotive industry. The increments were, however, relatively modest compared to the relatively high yield strength of the cold-worked material. Furthermore, a long soaking time at a relatively high temperature was needed to achieve the highest improvements in the mechanical properties. Therefore, the processing costs may be too high compared to the modest strength increment produced.
[1] Baker L, Daniel S, Parker J. Metallurgy and processing of ultralow carbon bake hardening steels. Materials Science and Technology. 2002;18:355–368.
[2] Cottrell AH, Bilby BA. Dislocation theory of yielding and strain ageing of iron. Proceedings of the Physical Society Section A. 1949;62:49.
[3] Buono V, Gonzalez B, Andrade M. Strain aging of AISI 430 ferritic stainless steel. Scripta materialia. 1997;38:185–190.
[4] Kaçar R, Gündüz S. Increasing the strength of AISI 430 ferritic stainless steel by static strain ageing. Kovove Mater. 2009;47:185–191.
[5] Palosaari M, Manninen T. Bake-hardening of stabilized ferritic stainless steels. Special Edition of Steel Research International for Metal Forming 2012, Wiley-VCH Verlag GmbH. 2012;951–954. Available from https://onlinelibrary.wiley.com/page/journal/1869344x/ homepage/metal-forming-2012.html
[6] Fu Z. A Study of Static Strain Aging of Selected Ferritic Steels. Master’s thesis. Tampere University of Technology; 2017.
[7] Fu Z, Järvinen H, Manninen T, Peura P. Bake Hardening Behavior of 1.4003 Ferritic Stainless Steel. Ohutlevy. 2017;28–33.
[8] Alvarez de Sotomayor A, Herrera E. Permanent elimination of the yield-point phenomenon in AISI 430 stainless steel by skin-pass rolling. Journal of materials science. 1994;29:5833–5838.
[9] Harper S. Precipitation of carbon and nitrogen in cold-worked alpha-iron. Physical review. 1951;83:709.
[10] Golovin IS, Sarrak VI, Suvorova SO. Influence of carbon and nitrogen on solid solution decay. Metallurgical transactions A. 1992;23:2567–2579.
[11] Herschberg R, Fu C-C, Nastar M, et al. Atomistic modelling of the diffusion of C in FeCr alloys. Acta Materialia. 2019;165:638–653.
[12] Čermák J, Král L. Extremely slow carbon diffusion in carbon-supersaturated surface of ferrite. Kovove Mater. 2014;52:125–133.
[13] Kabir M, Lau TT, Lin X, et al. Effects of vacancy-solute clusters on diffusivity in metastable Fe-C alloys. Physical Review B. 2010;82:134112.
L’articolo presenta l’applicazione e l’affinamento delle linee guida ExxonMobil in un primo caso pratico per la valutazione della resistenza alla corrosione di nuovo materiale forgiato impiegato per la fabbricazione di tubo speciale anticollasso, detto buckle arrestor, usato in ambito sottomarino, per profondità fino a 3.000m, in ambienti difficili. Questa nuova metodologia di valutazione dei risultati delle prove di tensocorrosione in presenza di H2S presenta una serie di operazioni facilmente ripetibili e consente di valutare, mediante indagini metallografiche e analisi decisionali, la presenza di eventuali danneggiamenti da corrosione del tipo “sulphide stress crack” e “critical stress groove”, catalogati in letteratura come non accettabili.
PAROLE CHIAVE: PROVA DI TENSOCORROSIONE DA SOLFURI, PIT, CRICCA, RESISTENZA ALLA CORROSIONE
INTRODUZIONE
Gli acciai delle condotte utilizzate nel trasporto di olio e gas sono soggetti a varie condizioni ambientali sempre più impegnative: in particolare possono operare in ambienti corrosivi severi - il cosiddetto “sour service” dovuto ad alte concentrazioni di acido solfidrico H 2S nei fluidi trasportati - in combinazione con sollecitazioni meccaniche. Per questo motivo si rendono necessari opportuni design degli acciai, supportati da valutazioni del loro comportamento in laboratorio, con prove specifiche, come per esempio la prova di tensocorrosione da solfuri Sulphide Stress Cracking (SSC) nota con il nome di Four Point Bend Test (FPBT), fatta in accordo agli Standard NACE. Il punto chiave è la valutazione dei risultati: molto spesso non è sufficientemente chiara ed è soggetta a diverse interpretazioni, soprattutto quando il requisito da soddisfare è “no cracks”, come richiesto dalla normativa ISO 15156-2 2020 [1]. Distinguere un pit allungato da una cricca rimane oggetto di dibattito nell’industria Oil&Gas [2], non esistendo linee guida formali negli standard internazionali per differenziare un pit allungato da una cric-
F.Cena,G.Cumino
CenaInterpipes,Brescia
A.Ghielmetti,L.Torri,P.Policarpo, S.Franci
Eni,SanDonatoMilanese
ca. Solo lo standard internazionale EFC16 indica come misura massima accettabile di una cricca 0.1mm senza fornire alcuna indicazione interpretativa circa la distinzione morfologica tra cricca e pit allungato [3,4]. Recentemente un criterio di valutazione è stato sviluppato nei laboratori ExxonMobil basato su indagini metallografiche dettagliate e poi sintetizzato in un diagramma di flusso di base [5].
FABBRICAZIONE DEL TUBO FORGIATO DI ALTO SPESSORE
I buckle arrestor sono tubi in acciaio al carbonio bonificato che vengono inseriti nella condotta ad intervalli regolari, ma che presentano diametri esterni e spessori decisamente più elevati rispetto alla condotta. Vengono richiesti in esecuzione forgiata quando il diametro esterno e lo spessore sono molto elevati e/o non standard [6], per esempio per dimensioni rispettivamente superiori ai 30” e 70mm.
Per gli ambienti più severi questi componenti, assieme all’intera condotta, devono contemporaneamente soddisfare: 1) requisiti elevati di tenacità a basse temperature, 2) resistenza alla corrosione, 3) facile saldabilità. Poter garantire per questi tubi forgiati le medesime prestazioni dei tubi di linea (tipicamente laminati a caldo o saldati longitudinalmente) è tutt’altro che banale tenuto conto che, oltre alle dimensioni finali superiori a quelle della condotta, è necessario prevedere sulle superfici interne ed esterne opportuno sovrametallo per il trattamento di qualità. Per lo studio è stato utilizzato un tubo forgiato speciale in acciaio al carbonio bonificato in grado ASTM A694-16 F60 [7] equivalente a ISO 3183:2019 X60QS/QO [8] - API 5L (46th Ed) X60QS/QO PSL2 [9], con dimensioni come ripreso in fig.1. È stato scelto un buckle arrestor con spessore molto elevato per testare il materiale nelle condizioni più impegnative e critiche.
Fig. 1 - Tubo anti-collasso / Buckle Arrestor.
Per l’acciaio di partenza è stata studiata una analisi specifica avente basso carbonio, legata con Mn, Cr, Mo e Ni e con basso Critical Metal Parameter (Pcm) ≤0.22 per garantire una buona saldabilità. L’acciaio è stato fabbricato con rottame altamente selezionato: fusione in forno elettrico, trattamento in siviera per raggiungere la composizione chimica desiderata e trattamento sottovuoto per ottenere elevata pulizia da inclusioni dell’acciaio stesso. Sono seguiti il colaggio in lingotto e la fucinatura. Successivamente il forgiato è sottoposto ad un riscaldo a 920°C seguito da tempra in acqua e successivo rinvenimento per ottenere il grado specificato. Sono state poi eseguite molteplici prove di laboratorio atte a caratterizzare il materiale e validarne la qualità; infine, il forgiato è stato lavorato di macchina alle dimensioni finite e sottoposto ai controlli non distruttivi, visivi e dimensionali finali.
CARATTERIZZAZIONE METALLURGICA E CORROSIONISTICA DEL FORGIATO
Il tubo forgiato è stato sottoposto ad approfondita caratterizzazione metallurgica e corrosionistica; le prove più specialistiche sono state eseguite presso un laboratorio accreditato. Le prove di trazione longitudinale e trasversale (Tab. 1) hanno dato valori pienamente conformi al grado di acciaio, nell’intorno del valore medio dei risultati ammessi. Le durezze (Tab.2) hanno valori compresi nel range 181÷196 HV10, ampiamente sotto i 200 HV10 e totalmente conformi al richiesto (≤230 HV10). Le resilienze (Tab.3) sono state eseguite a temperatura ambiente sino a -70°C e mostrano ottimi valori di energia (superiori a 300J) e area duttile al 100% sino a -30°C: risultato notevole considerando l’elevato spessore in gioco. La Fracture Appearance Transition Temperature (F.A.T.T.) si attesta attorno ai -70°C.
Tab.1 - Trazione / Tensile
TRAZIONE @20°C
Direz. Rt 0,5% (MPa) Rm (MPa) A (%) Rt 0,5% /Rm 415÷516 520÷760 ≥ 18,5 ≤ 0,9 T 454 547 30 0,83 L 465 560 30 0,83
Tab.2 - Durezze / Hardness
DUREZZA ≤ 230 HV10
Posizione 1 2 3
1,5mm da sup. est.
1,5mm da sup. int.
Per valutare la capacità di resistenza alla propagazione della frattura sono state eseguite altre prove specifiche, quali Crack Tip Opening Dispacement (CTOD), Stress Intensity Factor (KIC) e in ambiente corrosivo KI in SSC (KISSC):
Tab.3 - Resilienze / Impact
RESILIENZE
• CTOD a -10°C mostrano valori molto buoni: 2,346mm e 2,290mm (Tab.4);
Tab.4 - CTOD / CTOD
CTOD
@-10°C; L; CTOD ≥ 0,40mm
CTOD#1: 2,346mm;
CTOD#2: 2,290mm
Tab.5 - KIC / KIC
KIC
@RTinair;L;
KQ#1:71.57MPa*m1/2;
KQ#2:64.97MPa*m1/2
Da ultimo si sono effettuate le prove di corrosione Hydrogen Induced Cracking (HIC) e SSC.
Per la prova HIC i valori Crack Length Ratio (CLR), Crack Sensitivity Ratio (CSR) e Crack Thickness Ratio (CTR) sono tutti sempre uguali a zero, cricche e blister non sono presenti. Questo a testimonianza della pulizia da inclusioni
Tab.7 - HIC / HIC
• KIC a temperatura ambiente hanno dato risultati molto elevati: 71,57 e 64,97 MPa*m1/2 (Tab.5);
• significativi i valori elevati di KISSC (Tab.6) che non hanno mostrato alcuna propagazione delle cricche.
dell’acciaio, estremamente elevata. Per la prova SSC il criterio base di valutazione dei campioni dopo test è: assenza di cricche da SSC con analisi a 100x [1,4]. In Fig.2 sono riportate le fotografie di tre campioni a 100x con le morfologie tipiche delle corrosioni. HIC
NACE TM0284-2011 Pressione 1 bar H2S; Soluz. A NACE TM0177 [7]; 96 ore.
Sezione CLR (%) CSR (%) CTR (%) ≤13 ≤1,5 ≤3
Media A1;A2;A3 0,0 0,0 0,0
Media B1;B2;B3 0,0 0,0 0,0
Media C1;C2;C3 0,0 0,0 0,0
Tab.8 - SSC / SSC
SSC (FPBT)
Prelievo Metà spessore; T
Parametri Prova
Pressione 1 bar H2S. Soluzione A NACE TM0177 [10]. Carico 90% A.Y.S. 720 ore. Campioni secondo ASTM G39-99 fig. 1c.
Esame x100; campioni tagliati longitudinalmente in 2 sezioni (5 e 10mm).
Criterio di accettazione NESSUNA CRICCA (ISO 15156-2)
Fig. 2 - Esami metallografici su campioni SSC / Micrografic tests on SSC specimens.
Analizzando nel dettaglio i danneggiamenti da corrosione sono apparse forme ed indicazioni che, a fronte del criterio di accettabilità “nessuna cricca”, sono risultate di difficile interpretazione. Quanto precede ha richiesto: 1) la definizione di cricca e 2) la stesura di linee guida (recommended practices) che rendessero la valutazione dei campioni di SSC la più oggettiva e sistematica possibile.
CRITERIO PER LA VALUTAZIONE DELLA CORROSIONE SSC
Il paper C2020-14845 “Micrographic Acceptance Criteria for SSC Testing” presentato alla NACE International 2020 è stato il riferimento iniziale per questo lavoro. Basandosi su studi metallografici specifici fatti su tubi saldati in grado X65 API 5L, gli autori hanno individuato una serie di tipologie di danneggiamento da corrosione con criteri passa/non passa e altri test da eseguire, il tutto sintetizzato in un diagramma di flusso di base. La tipologia dei danneggiamenti è svariata. Sono accettabili i “corrosion pit” (“equiaxed corrosion pit” e “deep corrosion pit”) e gli “stress assisted corrosion (SAC) pit”, mentre “cracklet” e “stress groove” sono accettabili fintanto che soddisfano specifici rapporti dimensionali e sono supportati da ulteriori analisi (riesecuzione esame metallografico dopo rilucidatura dei campioni SSC, esecuzione micro-durezze in corrispondenza del danneggiamento da corrosione analizzato, esecuzione SSC test (FPBT) con carichi inferiori); in difetto vengono rispettivamente classificati come non accettabili “sulphide stress crack” e “critical stress groove”. La metodologia ExxonMobil, applicata solo a tubi saldati longitudinalmente in X65M (con Pcm 0.13÷0.15 e durezze 200÷235 HV10), di dimensioni non note, ma presumibilmente con spessori contenuti, è stata estesa e utilizzata per la valutazione dei risultati di SSC test del tubo forgiato in oggetto realizzato in acciaio al carbonio ASTM
A694-16 F60 con spessore 75.8mm, Pcm ≤0.22; durezze 181÷196 HV10.
L’applicazione pratica è stata l’occasione per introdurre qualche integrazione alla metodologia proposta in [5], inglobando nel nuovo diagramma di flusso Eni/Cena Interpipes tutte le indicazioni per procedere sistematicamente con la metodologia di analisi delle tipologie di danneggiamento. In aggiunta, nei report metallografici sono registrati i dati completi dell’analisi effettuata, a supporto per verifiche a posteriori.
Difatti:
• sono stati definiti e inseriti gli ingrandimenti a cui eseguire l’analisi metallografica: 100x per i casi accettabili di “equiaxed corrosion pit”, “deep corrosion pit” e “SAC pit”; 200x÷500x per i casi dubbi passa/non passa di “cracklet” e “stress groove”.
• sono state inserite nel diagramma di flusso le immagini ExxonMobil relative alle varie tipologie di danneggiamento da corrosione, unitamente alle due formule “B/(A+B)” e “D/W” (le quote A, B rappresentano rispettivamente le profondità del danneggiamento da corrosione primario e secondario, le quote D e W la l’ampiezza e la profondità del danneggiamento da corrosione nel suo complesso) che possono portare ai due casi passa/non passa; • è stata aggiunta l’indicazione che i fallimenti “sulphide stress crack” e “critical stress groove” sono tali solo se la profondità di “pit+crack” è superiore a 100 µ m, di modo da avere anche un parametro dimensionale passa/non passa;
• sono state aggiunte e dettagliate le prove eventualmente necessarie per convalidare, nei casi dubbi passa/non passa seguito applicazione delle due formule sopracitate, l’effettiva capacità del materiale di resistere alla corrosione: KISSC, CTOD, SSC a 3 mesi, HV0,1 in prossimità dei danneggiamenti da corrosione, test SSC a 1 mese con condizioni di carico e ambiente più realistici all’effettiva applicazione
– fit for purpose test (es. Actual Yield Strength (A.Y.S.) 80% in luogo del 90%, nelle condizioni del sito).
Anche il report metallografico di riferimento è stato modificato come segue. Quando richiesto:
• le quote A, B, D e W sono rilevate e quotate, opportunamente documentate con fotografie e con ingrandimenti degli elementi da caratterizzare fino a 400x;
• i risultati vengono completati dalle prove di misura della profondità del danneggiamento da corrosione; dai risultati di CTOD, KISSC, e dai valori di HV0,1 in pros-
simità dell’indicazione di corrosione.
La figura 3 rappresenta l’andamento tipico di “equiaxed corrosion pit” (la larghezza è superiore alla profondità del pit) e “deep corrosion pit” (il pit è più profondo, ma rimane una generale uniformità della dimensione della larghezza, la morfologia del danneggiamento da corrosione è arrotondata, non appuntita). L’analisi pertanto termina positivamente, senza necessità di ulteriori approfondimenti.
Fig. 3 - Pit da corrosione equiassici e profondi / Equiaxed corrosion pits and deep corrosion pits.
In figura 4 il danneggiamento da corrosione è una combinazione di deep pit (caratterizazzione primaria - il pit è più profondo, ma la morfologia è arrotondata) e SAC pit (caratterizazzione secondaria – il pit presenta un andamento
con angolatura caratteristica e non la direzione tipica della cricca), entrambi ritenuti accettabili. L’analisi pertanto termina positivamente, senza necessità di ulteriori approfondimenti.
Fig. 4 -Pit da corrosione profondi e da stress / Deep pit and SAC.
In figura 5 il danneggiamento da corrosione è una combinazione di deep pit (caratterizzazione primaria) e cracklet (caratterizzazione secondaria). È pertanto necessario misurare i valori di A e B rispettivamente pari a 41 µ m e 36 µ m e visionare l’immagine a ingrandimenti superiori fino a
400x. La formula ExxonMobil B/(A+B)=47%>25% rende potenzialmente critica la casistica in questione. Tuttavia le successive valutazioni riferite alla la profondità complessiva di deep pit + cracklet =77 µ m ≤100 µ m, al valore medio 195 HV0,1 delle quattro micro-durezze in prossimità della
figura analizzata, ai valori di KISSC (>58MPa*m1/2) e CTOD (>2.2 mm a -10°C), ed ai risultati dei tests SSC a 3 mesi che confermano rispettivamente l’assenza di propagazio-
ne e l’elevata tenacità del materiale, consentono di valutare positivamente, la capacità del forgiato di resistere alla SSC.
5
In figura 6 il danneggiamento da corrosione è una combinazione di deep pit (caratterizzazione primaria) e cracklet (caratterizzazione secondaria). È pertanto necessario misurare i valori di A e B rispettivamente pari a 52 µ m e 13 µ m e visionare l’immagine a ingrandimenti superiori fino a 400x. L’applicazione della formula ExxonMobil B/(A+B) =20 ≤25% non è critica e consente di procedere, dopo rilievo delle quote D e W, con la successiva formula D/ W=1.7≤4, anch’essa non critica. Non è pertanto necessario misurare la profondità di deep pit + cracklet (valore
comunque disponibile dalle quote A e B rilevate e pari a 65 µ m ≤ 100 µ m) né eseguire micro-durezze HV0,1. I valori del materiale forgiato di durezza HV10 (basse ed omogenee, sempre inferiori a 200 HV10) unitamente ai valori di KISSC (>58Mpa*m1/2) e CTOD (>2.2 mm a -10°C), ed ai risultati dei tests SSC a 3 mesi che confermano rispettivamente l’assenza di propagazione e l’elevata tenacità del materiale, consentono di valutare positivamente la capacità del forgiato di resistere alla SSC.
Fig. 6 - Pit profondi e cracklet / Deep pit and cracklet.
CONCLUSIONI
I risultati di SSC sono analizzati ed interpretati secondo l’ultimo diagramma di flusso più ampio e completo di Eni/ Cena Interpipes basato sulla metodologia illustrata in [5].
Gli esami metallografici addizionali con ingrandimento fino a 400x, la rilevazione delle quote A, B, D, W con le relative formule B/(A+B) e D/W, le micro-durezze HV0,1 basse ed omogenee, la misura della profondità dei dan-
Fig.
- Pit profondi e cracket / Deep pit and cracklet.
neggiamenti della corrosione sempre inferiori a 100 µ m per i casi potenziali di “sulphide stress cracking” e “critical stress groove” confermano l’accettabilità dei risultati della prova SSC.
A completamento la microstruttura fine ed omogenea, le durezze basse ed omogenee (181÷196 HV10), i valori di
CTOD e KISSC alti, i risultati dei test SSC a 3 mesi, sono tutti
BIBLIOGRAFIA
elementi a conferma della buona resistenza alla corrosione del materiale.
Viste le proprietà di questo nuovo materiale, l’onerosa attività di claddatura (riporto interno di saldatura) in Inconel 625 della superficie interna del buckle arrestor può non essere applicata.
[5] T. ANDERSON, D. FAIRCHILD et al. by ExxonMobil, Micrographic Acceptance Criteria for SSC Testing, Houston (Texas), NACE International2020,paperC2020-14845.
[7] ASTM A694/A694M 2016 Edition Standard Specification for Carbon and Alloy Steel Forgings for Pipe Flanges, Fittings, Valves, and PartsforHighPressureTransmissionService(2022).
[10] NACE Standard TM0177-2016-SG, Laboratory Testing of Metals for Resistance to Sulfide Stress Cracking and Stress Corrosion CrackinginH2SEnvironments(2016).
New criteria for the evaluation of the SSC corrosion test results: an example of practical application on an heavy wall forged pipe
The paper describes the application and the fine-tuning of the ExxonMobil recommended practices on a first practical case of resistance to corrosion evaluation of a new forged material used to manufacture buckle arrestors for subsea application, harsh environments, and depth up to 3.000m. Such a new assessment methodology of SSC corrosion test results is a system of operations easy to repeat and allows to detect – by means of micrographic examinations and following decision analysis – the presence of possible “sulphide stress crack” and “critical stress groove” corrosionbased damage features that literature classifies as not acceptable.
KEYWORDS: SULPHIDE STRESS CRACKING TEST, FOUR POINT BEND TES, PIT, CRACK, RESISTANCE TO CORROSION.
Study of microparticles incorporation in coatings on titanium produced by plasma electrolytic oxidation (PEO)
F. Ceriani, L. Casanova, M.V. Diamanti, M. Ormellese, M. Pedeferri
This research is focused on the analysis of the influence of rutile (TiO2) and anatase (TiO2) microparticles (d < 5 µm) on the morphology, structure, and anticorrosive properties of PEO coatings on titanium produced in alkaline based solution containing sodium hydroxide and sodium metasilicates or nanoclay particles (hydrophilic bentonite, H2Al2O6Si, d < 25 µm).
PEO coatings are characterized by scanning electron microscope (SEM), energy dispersive spectroscopy (EDS) and X-ray diffraction (XRD). In addition, the samples are electrochemically investigated by electrochemical impedance spectroscopy analysis.
The tests carried out have shown that the incorporation of TiO2 microparticles in the coating leads to the formation of thick oxide layers characterized by a fine porosity. These coatings provide good corrosion protection when samples are exposed to an aggressive sulfuric acid solution.
Plasma electrolytic oxidation (PEO) is an electrochemical surface treatment designed to produce a thick and hard oxide layer on the surface of the treated metal, typically titanium, aluminum or magnesium. The metal component is immersed in a suitable electrolytic solution and is connected to a voltage source applied between the metal (the anode) and a counter electrode. The high voltages can allow to overcome the breakdown potential of the oxide with consequent generation of plasma. [1]
The ceramic coating thus obtained is characterized by the presence of pores, produced by the discharges and by the aggressive environment to which the component is exposed during the PEO process. These defects could cause a reduction in the corrosion resistance of the treated component, favoring the transport of aggressive ions through the oxide. [2] To solve this problem, a viable option is represented by the addition of solid particles to the electrolytic solution used for the PEO treatment to favor the formation of a less porous structure thanks to the filling effect of the pores by the particles embedded within the forming oxide. [2], [3] Among the various types of particles that can be used, those of metal
F. Ceriani, L. Casanova, M.V. Diamanti, M. Ormellese, M. Pedeferri
Dept. of Chemistry, Materials and Chemical Engineering “G. Natta”, Politecnico di Milano, Via Mancinelli 7, 20131 Milano, Italy
oxides are particularly effective for improving corrosion resistance, such as, for example, titanium dioxide (TiO2) particles which, in addition to enhance the anti-corrosion performance of PEO oxides, increase their hardness and wear resistance. [4] The aim of this study is to verify the effect of the incorporation of TiO2 microparticles on the corrosion resistance of PEO coatings for applications in the chemical field.
MATERIALS AND METHODS
The PEO process is performed using a commercial potentiostat, connecting the sample to be anodized to the positive pole. A cylindrical activated titanium mesh is used as a counter electrode. The applied signal consists of a 60% anodic and 40% cathodic waveform, with a cathodic
peak equal to 7% of the anodic one, supplied at a frequency of 1000 Hz. The applied potential increases linearly from 0 V to 90 V via a ramp of 320 s. The treatment is performed on 10 x 10 x 1.2 mm3 samples of Ti grade 2 obtained by metal shearing, polished with silicon carbide paper (120600 mesh) and rinsed with distilled water. The electrolyte used consists of an aqueous solution of 1 M NaOH to which microparticles (≤ 5 µm) of rutile or anatase are added. From this base solution, four different electrolytes are obtained by adding sodium metasilicates (Na2SiO3) and nanoclay (hydrophilic bentonite, H2Al2O6Si, ≤ 25 µm). Both additives contain Si which favors the formation of a more stable and compact oxide. [5] The compositions of the solutions are shown in Table 1.
Tab.1 - Compositions of the used electrolytic solutions (R = rutile, A = anatase, S = silicates, C = nanoclay)
R_S
5 g∙L-1 R + 4 g∙L-1 Na2SiO3
A_S 5 g∙L-1 A + 4 g∙L-1 Na2SiO3
1 M NaOH
R_C 5 g∙L-1 R + 15 g∙L-1 nanoclay
A_C 5 g∙L-1 A+ 15 g∙L-1 nanoclay
Ti_Na -
The PEO process is carried out in a 1 L beaker containing 500 mL of solution kept under agitation using a magnetic stirrer at a speed of 600 rpm to promote homogeneous dispersion of the particles.
The characterization of PEO coatings occurs via scanning electron microscopy (SEM) for which a microscope equipped with an energy dispersive spectroscopy (EDS) spectrometer is used. The crystalline structure of the oxides is evaluated by X-ray diffraction performed using a goniometer with Cu Kα1 radiation (1.54058 Å). Finally, electrochemical impedance spectroscopy (EIS) analyses are carried out in 10% v/v sulfuric acid solution maintained at 60 °C. This solution aims to reproduce the aggressive conditions that can be encountered in some chemical treatments of metals, for example during pickling operations. The EIS tests are carried out with a potentiostat/galvanostat using a standard three-electrode cell with a volume of 250 ml, in which the reference electrode is a saturated silver/silver
chloride (SSC) electrode and the counter electrode is a platinum electrode. The measurements are carried out in a frequency window 105÷10-2 Hz, applying a sinusoidal signal of 10 mVrms and analyzing 10 points per decade of frequency.
RESULTS AND DISCUSSION
SEM Analyses
The SEM images of the surfaces of the four samples (Fig. 1 a), show the presence of rounded protuberances often surmounted by pores. The formation of these structures is due to the effect of the pressure exerted on the molten oxide by the gases (oxygen, hydrogen, steam) trapped inside the coating during the growth phase. When cooling and solidification of the oxide begin, the gas is sometimes evacuated, generating pores. [6], [7]
Fig. 1 - a) SEM images of the surfaces of PEO samples; b) SEM images of the cross-sections of PEO samples.
The analysis of the sections of the coatings using SEM (Fig. 1 b) allows to estimate the thickness of the oxides. By working with rutile particles, coatings with thicknesses of approximately 52 µm (R_S) and 35 µm (R_C) are reached, in the presence of silicates and nanoclay respectively. As regards the samples treated with anatase, thicknesses of approximately 49 µm (A_S) using silicates and 30 µm (A_C) in the presence of nanoclay are obtained. It could be noted that the greater thicknesses are achieved by working with metasilicates in addition to the microparticles: this phenomenon is the result of a double effect, i.e. the stabilization effect of the SiO3 2- ions, which reduces the dissolution of the oxide in solution favoring its growth, and their polymerization. [5]
Another important observation concerns the structure of the oxides, it is observed that while the coatings produced in electrolytes containing rutile have a fine and uniform porosity, the oxides obtained by working with anatase
microparticles are characterized by larger pores. These large defects may compromise the corrosion protection effect as they allow the penetration of the aggressive solution through the oxide. Coatings produced in the presence of rutile particles are instead characterized by the presence of cracks at the interface between the substrate and the oxide itself; this defect could potentially compromise the adhesion of the coating to the substrate. The EDS analyses (not reported) allow to verify the presence of Ti, O, Na and Si in all the samples. Furthermore, in the coatings produced using nanoclay, the presence of Al is also detected. These results permit to confirm the effective participation of the additives of the electrolytic solution in the plasma events typical of PEO anodization and their incorporation into the produced oxides.
XRD Analyses
Fig. 2 - XRD graph of the A_C sample.
The XRD analyses of the samples (A_C diffractogram is shown in Fig. 2 for exemplary purposes) confirmed the presence of rutile in all coatings. The most intense signal
in the diffractogram always corresponds to this crystalline structure, even in samples treated with anatase, suggesting a partial transformation of anatase into rutile favored by
the high temperatures reached during plasma events. [8] The anatase peaks, instead, are observed only for the oxides produced in the presence of these microparticles. All specimens show peaks related to metallic titanium, whose intensity decreases according to the thickness of the coating. This hypothesis seems to be confirmed by considering the oxide thicknesses evaluated through the analysis of the SEM images of the sample cross-sections. The oxides produced using nanoclay are characterized by the lowest thicknesses and the most intense Ti signals. Another feature common to all diffractograms is the broad peak produced at 30÷35° which reveals the presence of SiO2 in the amorphous phase. [9] This data provides further confirmation of the incorporation of silicon-based
additives within the coatings. Finally, peaks associated with sodium titanates, Na2Ti6O13, produced by the reaction between titanium dioxide and sodium hydroxide are detected in the samples treated with nanoclay. [10]
EIS Analyses
The results of the electrochemical impedance tests are shown in Fig. 3, where the Nyquist curves representing the first and sixth cycles of a series of measurements conducted over 1 hour and 30 minutes are depicted. The EIS measurements are carried out after 30 minutes of monitoring of the free corrosion potential. During the entire duration of the test the samples remained immersed in the sulfuric acid solution.
Fig. 3 - Nyquist diagrams of PEO samples.
Fig. 4 - Nyquist diagram a) of Ti grade 2, and b) of Ti treated without MPs after 30 minutes of immersion.
Comparing the results of the impedance tests obtained for the PEO specimens with those of the untreated Ti grade 2 (Fig. 4. a), it is observed that the behavior of the samples changes significantly. The Nyquist diagram of bare Ti presents a double semicircle typical of a corrosive process and a polarization resistance, Rp (defined as the intersection of the arcs that interpolate the Nyquist graphs with the axis of the real impedance Z') typical of an active electrode (about 70 Ω cm2). [11] The specimens coated with PEO oxides, instead, show only one capacitive semicircle and R p values that are four and five orders of magnitude higher for the samples treated with nanoclays and metasilicates, respectively, compared to Ti grade 2. These values demonstrate the corrosion protection ability of PEO coatings.
Looking in more detail at the graphs relating to PEO coatings (Fig. 3) it is immediately possible to notice an important difference between the oxides produced using the two different types of Si-containing additives. First of all, the impedance curves of the samples treated with nanoclay are semicircles with reduced diameter, an indication of a low polarization resistance which for the R_C and A_C samples is lower than 15000 Ω ∙cm2. Such values are lower than the R p of the Ti treated under the same conditions described in the Materials and Methods section, but in the absence of particles (Fig. 4. b, R p of approximately 120000 Ω ∙cm2). Concerning the samples prepared with solutions containing silicates, instead, arcs with larger diameters and Rp in the order of 150000 Ω ∙cm2 are observed (an order of magnitude higher than the values indicated for R_C and A_C and higher than the Rp value of the sample Ti_Na). This difference between the Rp values can be partly justified by the difference in thickness between the two types of coatings. As previously observed, the R_S and A_S oxides have a thickness approximately 20 µm greater than the corresponding coatings produced with nanoclay; this improves the barrier effect of the coatings by making the penetration of aggressive ions slower and consequently increasing the values of Rp. Furthermore, by studying the temporal evolution of the impedance values it can be noted that in the case of R_C and A_C the diameters of the semicircles, and therefore the Rp values, decrease. On the contrary, the impedance values of R_S and A_S increase during the immersion period in the acid solution. This trend may be associated with the formation
of corrosion products that fill the pores of the coating, improving its corrosion protection effect.
Finally, it is noted that the impedance values achieved by A_S and A_C are slightly higher than those obtained by their respective rutile-containing counterparts. This phenomenon is probably due to the lower crystallinity of the samples produced through the incorporation of anatase particles, which therefore provide greater resistance to the passage of electrons generating higher impedances. However, it has been widely demonstrated that rutile guarantees better behavior against acid corrosion in long-term tests. [12]
By observing the trend of the imaginary impedance, it is possible to evaluate the kinetics of the ongoing relaxation phenomena. The diagrams obtained (not shown) present a single time constant at low frequencies therefore attributable to a corrosion reaction controlled by the diffusion of aggressive species through the coating. [13]
CONCLUSIONS
This paper describes the effects of adding microparticles to electrolytic solutions used for PEO treatments on titanium.
It is observed that in general, the incorporation of TiO 2 microparticles in coatings allows to generate thick oxides, in particular when the particles are combined with metasilicates, and with Rp values at least four orders of magnitude greater than uncoated Ti grade 2. By working with rutile and metasilicate microparticles it is possible to produce oxides with a fine and uniform porosity offering a particularly favorable structure in terms of protecting the metal substrate from corrosion since the penetration of aggressive species through the ceramic layer is made more difficult. As regards the oxides obtained in the presence of anatase and metasilicates, although they are characterized by larger pores, they still provide high polarization resistance values, thus guaranteeing excellent resistance to charge flow and good protective behavior. When nanoclay particles are added to the electrolytic solution, thin oxides with high porosity are obtained. Consequently, the coatings are characterized by reduced polarization resistance values and provide lower corrosion protection than oxides produced in the absence of microparticles.
BIBLIOGRAPHY
[1] S. Sikdar, P. V. Menezes, R. Maccione, T. Jacob, and P. L. Menezes, “Plasma electrolytic oxidation (PEO) process—processing, properties, and applications,” Nanomaterials, vol. 11, no. 6, 2021, doi: 10.3390/nano11061375.
[2] X. Lu, C. Blawert, M. L. Zheludkevich, and K. U. Kainer, “Insights into plasma electrolytic oxidation treatment with particle addition,” Corros. Sci., vol. 101, pp. 201–207, 2015, doi: 10.1016/j.corsci.2015.09.016.
[3] A. Fattah-alhosseini, M. Molaei, and K. Babaei, “The effects of nano- and micro-particles on properties of plasma electrolytic oxidation (PEO) coatings applied on titanium substrates: A review,” Surfaces and Interfaces, vol. 21, no. December 2019, p. 100659, 2020, doi: 10.1016/j.surfin.2020.100659.
[4] X. Lu et al., “Plasma electrolytic oxidation coatings with particle additions – A review,” Surf. Coatings Technol., vol. 307, pp. 1165–1182, 2016, doi: 10.1016/j.surfcoat.2016.08.055.
[5] S. Moon and Y. Jeong, “Generation mechanism of microdischarges during plasma electrolytic oxidation of Al in aqueous solutions,” Corros. Sci., vol. 51, no. 7, pp. 1506–1512, 2009, doi: 10.1016/j.corsci.2008.10.039.
[6] X. Zhang et al., “X-ray Computed Tomographic Investigation of the Porosity and Morphology of Plasma Electrolytic Oxidation Coatings,” ACS Appl. Mater. Interfaces, vol. 8, no. 13, pp. 8801–8810, 2016, doi: 10.1021/acsami.6b00274.
[7] E. Matykina, A. Berkani, P. Skeldon, and G. E. Thompson, “Real-time imaging of coating growth during plasma electrolytic oxidation of titanium,” Electrochim. Acta, vol. 53, no. 4, pp. 1987–1994, 2007, doi: 10.1016/j.electacta.2007.08.074.
[8] D. A. H. Hanaor and C. C. Sorrell, “Review of the anatase to rutile phase transformation,” J. Mater. Sci., vol. 46, no. 4, pp. 855–874, 2011, doi: 10.1007/s10853-010-5113-0.
[9] S. Aliasghari, P. Skeleton, and G. E. Thompson, “Plasma electrolytic oxidation of titanium in a phosphate/silicate electrolyte and tribological performance of the coatings,” Appl. Surf. Sci., vol. 316, no. 1, pp. 463–476, 2014, doi: 10.1016/j.apsusc.2014.08.037.
[10] X. Chen and S. S. Mao, “Titanium dioxide nanomaterials: Synthesis, properties, modifications and applications,” Chem. Rev., vol. 107, no. 7, pp. 2891–2959, 2007, doi: 10.1021/cr0500535.
[11] L. Casanova, M. La Padula, M. P. Pedeferri, M. V. Diamanti, and M. Ormellese, “An insight into the evolution of corrosion resistant coatings on titanium during bipolar plasma electrolytic oxidation in sulfuric acid,” Electrochim. Acta, vol. 379, p. 138190, 2021, doi: 10.1016/j.electacta.2021.138190.
[12] L. Casanova, M. Arosio, M. T. Hashemi, M. Pedeferri, G. A. Botton, and M. Ormellese, “Influence of stoichiometry on the corrosion response of titanium oxide coatings produced by plasma electrolytic oxidation,” Corros. Sci., vol. 203, no. January, p. 110361, 2022, doi: 10.1016/j.corsci.2022.110361.
[13] L. Casanova, F. Ceriani, M. Pedeferri, and M. Ormellese, “Addition of Organic Acids during PEO of Titanium in Alkaline Solution,” Coatings, vol. 12, no. 2, 2022, doi: 10.3390/coatings12020143.
Studio dell’incorporazione di microparticelle in rivestimenti su titanio prodotti mediante ossidazione elettrolitica al plasma (PEO)
F. Ceriani, L. Casanova, M.V. Diamanti, M. Ormellese, M. Pedeferri
Questa ricerca è focalizzata sull'analisi dell'influenza di microparticelle (d < 5 µm) di rutilo (TiO2) e di anatasio (TiO2) sulla morfologia, la struttura e le proprietà anticorrosive dei rivestimenti PEO su titanio prodotti in soluzione alcalina a base di soda e metasilicati di sodio o particelle di nanoargilla (bentonite idrofilica, H2Al2O6Si, d < 25 µm).
I rivestimenti PEO sono stati analizzati tramite analisi al microscopio elettronico a scansione (SEM), spettroscopia a dispersione di energia (EDS) e diffrazione ai raggi-X (XRD). Inoltre, i campioni sono stati caratterizzati elettrochimicamente mediante analisi di spettroscopia di impedenza elettrochimica.
Le prove effettuate hanno mostrato che l’incorporazione di microparticelle di TiO2 nei rivestimenti porta alla formazione di strati di ossido spessi e caratterizzati da una porosità fine. Questi rivestimenti forniscono una buona resistenza a corrosione quando i campioni vengono esposti ad una soluzione aggressiva di acido solforico.
PAROLE CHIAVE: CORROSIONE, TITANIO, PEO, EIS, MICROPARTICELLE
INTRODUZIONE
L'ossidazione elettrolitica al plasma (PEO) è un trattamento superficiale elettrochimico atto a produrre uno strato di ossido spesso e duro sulla superficie del metallo trattato, tipicamente titanio, alluminio o magnesio. Il componente metallico è immerso in una opportuna soluzione elettrolitica ed è collegato ad una sorgente di tensione applicata tra il metallo (l’anodo) e un contro-elettrodo. Le elevate tensioni possono consentire il superamento del potenziale di breakdown dell’ossido con conseguente generazione di plasma. [1] Il rivestimento ceramico così ottenuto è caratterizzato dalla presenza di pori, prodotti dalle scariche e dall’aggressività dell’ambiente a cui è esposto il componente durante il processo PEO. Tali difetti potrebbero causare una riduzione della resistenza a corrosione del componente trattato, favorendo il trasporto di ioni aggressivi attraverso l’ossido. [2] Per risolvere questo problema, una strada percorribile è rappresentata dall’aggiunta di particelle solide alla soluzione elettrolitica usata per il trattamento PEO, così da favorire la formazione di una struttura meno porosa, grazie all’effetto di riempimento dei pori
F. Ceriani, L. Casanova, M.V. Diamanti, M. Ormellese, M. Pedeferri
Dipartimento di Chimica, Materiali e Ingegneria Chimica “Giulio Natta”, Politecnico di Milano, Italia
ad opera delle particelle incorporate all’interno dell’ossido in formazione. [2], [3] Tra i vari tipi di particelle che si possono utilizzare risultano particolarmente efficaci per il miglioramento della resistenza a corrosione quelle di ossidi metallici, come, ad esempio, le particelle di biossido di titanio (TiO2) che, oltre a migliorare le prestazioni anticorrosive degli ossidi PEO, ne aumentano la durezza e la resistenza ad usura. [4] Lo scopo di questo studio è di verificare l’effetto dell’incorporazione di microparticelle di TiO2 sulla resistenza a corrosione dei rivestimenti PEO per applicazioni in campo chimico.
MATERIALI E METODI
Il processo PEO viene eseguito utilizzando un potenziostato commerciale, collegando al polo positivo il campione da anodizzare. Come controelettrodo si utilizza una rete cilindrica in titanio attivato. Il segnale applicato
consiste in una forma d’onda 60% anodica, 40% catodica, con picco catodico pari al 7% di quello anodico, ed una frequenza di 1000 Hz. Il potenziale applicato aumenta linearmente da 0 V a 90 V mediante una rampa di 320 s. Il trattamento è eseguito su campioni 10 x 10 x 1,2 mm3 di Ti grado 2 ottenuti per tranciatura metallica, lucidati con carta al carburo di silicio (120-600 mesh) e risciacquati con acqua distillata. L’elettrolita usato consiste in una soluzione acquosa di NaOH 1 M a cui vengono aggiunte le microparticelle (≤ 5 µm) di rutilo e di anatasio. Da questa soluzione base si ricavano quattro elettroliti differenti mediante l’aggiunta di metasilicati di sodio (Na2SiO3) e nanoargilla (bentonite idrofila, H2Al2O6Si, ≤ 25 µm). Entrambi gli additivi contengono Si che favorisce la formazione di un ossido più stabile e compatto. [5] Le composizioni delle soluzioni sono riportate in Tabella 1.
Tab.1 - Composizioni delle soluzioni elettrolitiche utilizzate (R = rutilo, A = anatasio , S = silicati, C = nanoargilla).
ETICHETTE
R_S
SOLUZIONE BASE
ADDITIVI
5 g∙L-1 R + 4 g∙L-1 Na2SiO3
A_S 5 g∙L-1 A + 4 g∙L-1 Na2SiO3
R_C 5 g∙L-1 R + 15 g∙L-1 nanoargilla
A_C
1 M NaOH
5 g∙L-1 A+ 15 g∙L-1 nanoargilla
Ti_Na -
Il processo PEO è stato condotto in un becher da 1 L contenente 500 ml di soluzione mantenuta in agitazione con un'ancora magnetica ad una velocità di 600 rpm per favorire una dispersione omogenea delle particelle.
La caratterizzazione dei rivestimenti PEO avviene tramite microscopia elettronica a scansione (SEM) per cui si è usato un microscopio dotato di spettrometro per spettroscopia a dispersione di energia (EDS). La struttura cristallina degli ossidi è valutata mediante diffrazione a raggi-X eseguita tramite un goniometro con radiazione Cu Kα1 (1.54058 Å). Infine, sono state svolte analisi di spettroscopia di impedenza elettrochimica (EIS) in soluzione di acido solforico 10 % v/v mantenuta a 60 °C. Tale soluzione mira a riprodurre le condizioni aggressive che si possono incontrare in alcuni trattamenti chimici dei metalli, ad esempio durante operazioni di decapaggio. Le prove EIS sono svolte con un potenziostato/galvanostato utilizzando una cella standard a tre elettrodi di volume 250 ml, in
cui l’elettrodo di riferimento è un argento/cloruro d'argento saturo ( AAC) ed il controelettrodo è un elettrodo al platino. Le misure sono effettuate in una finestra di frequenza 105÷10-2 Hz, applicando un segnale sinusoidale di 10 mV rms e analizzando 10 punti per decade di frequenza.
RISULTATI E DISCUSSIONE
Analisi SEM
Le immagini SEM delle superfici dei quattro campioni (Fig. 1 a), mostrano la presenza di protuberanze arrotondate spesso sormontate da pori. La produzione di tali strutture è dovuta all’effetto della pressione esercitata sull’ossido ancora fuso dai gas (ossigeno, idrogeno, vapore) intrappolati all’interno del rivestimento in fase di crescita. Quando il raffreddamento e quindi la solidificazione dell’ossido hanno inizio il gas a volte viene evacuato generando i pori. [6], [7]
1 - a) Immagini SEM delle superfici dei campioni PEO; b) Immagini SEM delle sezioni dei campioni PEO.
L’analisi delle sezioni dei rivestimenti tramite SEM (Fig. 1 b) permette di stimare lo spessore degli ossidi. Lavorando con particelle di rutilo si ottengono rivestimenti con spessori di circa 52 µm (R_S) e 35 µm (R_C), in presenza rispettivamente di silicati e nanoargilla. Per quanto riguarda i provini trattati con anatasio si ottengono spessori di circa 49 µm (A_S) in presenza di silicati e 30 µ m (A_C) in presenza di nanoargilla. Si può notare che gli spessori maggiori si ottengono lavorando con i metasilicati in aggiunta alle microparticelle: questo fenomeno è il risultato di un duplice effetto, ovvero del processo di stabilizzazione degli ioni SiO3 2- che riducono la dissoluzione dell’ossido in soluzione favorendone la crescita e della polimerizzazione degli stessi. [5] Un’altra importante osservazione riguarda la struttura degli ossidi, si nota infatti che, mentre i rivestimenti prodotti in elettroliti contenenti rutilo presentano una porosità fine ed uniforme, gli ossidi ottenuti lavorando con microparticelle di anatasio sono caratterizzati da pori di
dimensioni maggiori. Questi difetti di grandi dimensioni possono compromettere l’effetto di protezione dalla corrosione poiché permettono la penetrazione di soluzioni aggressive attraverso l’ossido. I rivestimenti prodotti in presenza di particelle di rutilo sono invece caratterizzati dalla presenza di crepe all’interfaccia tra il substrato e l’ossido stesso; questo difetto potrebbe potenzialmente compromettere l’adesione del rivestimento al substrato.
Le analisi EDS (non riportate in questa memoria) hanno permesso di verificare la presenza di Ti, O, Na e Si in tutti i campioni analizzati; inoltre, nei campioni prodotti in presenza della nanoargilla, è stata rilevata anche la presenza di Al. Questi risultati permettono di confermare l’effettiva partecipazione degli additivi della soluzione elettrolitica agli eventi di plasma tipici dell’anodizzazione PEO e la loro incorporazione negli ossidi prodotti.
Analisi XRD
2 - Grafico XRD del campione A_C.
Le analisi XRD dei campioni (di cui in Fig. 2 si riporta il difrattogramma relativo ad A_C a scopo esemplificativo) hanno confermato la presenza di rutilo in tutti i rivesti-
menti. A questa struttura cristallina corrisponde sempre il segnale più intenso del difrattogramma, anche nei campioni trattati con anatasio suggerendo una parziale trasfor-
Fig.
Fig.
mazione dell’anatasio in rutilo favorita dalle temperature elevate che si raggiungono durante gli eventi di plasma. [8] I picchi di anatasio, invece, si osservano solo per gli ossidi prodotti in presenza di tali microparticelle. Tutti i provini mostrano picchi relativi al titanio metallico, la cui intensità diminuisce in relazione allo spessore dello strato del rivestimento. Tale ipotesi sembra trovare conferma considerando gli spessori degli ossidi valutati tramite l’analisi delle immagini SEM delle sezioni dei campioni. Gli ossidi prodotti in presenza di nanoargilla sono caratterizzati dagli spessori più bassi e dai segnali di Ti più intensi. Un altro tratto comune a tutti i difrattogrammi è l'ampio picco prodotto a 30÷35° che rivela la presenza di SiO2 in fase amorfa. [9] Questo dato fornisce una conferma ul-
teriore dell’incorporazione degli additivi a base di silicio all’interno dei rivestimenti. Infine, nei campioni trattati con nanoargilla sono stati rilevati dei picchi associati ai titanati di sodio, Na2Ti6O13, prodotti dalla reazione tra biossido di titanio e soda. [10]
Analisi EIS
I risultati delle prove di impedenza elettrochimica sono riportati nei grafici Nyquist in Fig. 3, in cui sono rappresentati il primo e sesto ciclo di una serie di misurazioni condotte dopo 30 minuti di monitoraggio del potenziale di libera corrosione nell’arco di 1 ora e 30 minuti durante cui i campioni sono rimasti immersi nella soluzione di acido solforico.
Fig. 3 - Diagrammi di Nyquist dei campioni PEO.
Fig. 4 - Diagramma di Nyquist a) del Ti grado 2 e b) del Ti trattato in assenza di MPs dopo 30 minuti di immersione.
Confrontando i risultati delle prove di impedenza ottenuti per i provini PEO con quelli del Ti grado 2 non trattato (Fig. 4. a), si nota come il comportamento dei campioni cambi significativamente. Infatti, il diagramma di Nyquist del Ti nudo presenta un doppio semicerchio tipico di un processo corrosivo ed una resistenza a polarizzazione, Rp (definita come l'intersezione degli archi che intersecano i grafici di Nyquist con l'asse dell’impedenza reale Z') tipica di un elettrodo attivo (circa 70 Ω cm2). [11] I provini rivestiti con ossidi PEO, invece, mostrano un solo semicerchio capacitivo e dei valori di Rp rispettivamente di quattro e cinque ordini di grandezza più elevati per i campioni trattati con nanoragilla e metasilicati rispetto al Ti grado 2. Questi valori testimoniano le capacità di protezione dalla corrosione dei rivestimenti PEO.
Osservando più nel dettaglio i grafici relativi ai rivestimenti PEO (Fig. 3) è subito possibile notare una differenza importante tra gli ossidi prodotti utilizzando i due diversi tipi di additivi contenenti Si.
Innanzitutto, le curve di impedenza dei campioni trattati con nanoargilla sono dei semicerchi con diametro ridotto, indice di una bassa resistenza di polarizzazione che per i campioni R_C ed A_C risulta inferiore a 15000 Ω cm2 e quindi minore del valore di R p del Ti trattato nelle stesse condizioni descritte nella sezione Materiali e metodi, ma in assenza di particelle (Fig. 4. b, Rp di circa 120000 Ω cm2).
Per quanto riguarda i campioni preparati con soluzioni contenenti silicati invece si osservano degli archi con diametri maggiori e Rp nell’ordine dei 150000 Ω cm2 (un ordine di grandezza superiore rispetto ai valori indicati per R_C ed A_C e maggiore al valore di Rp del campione Ti_ Na). Questa differenza tra i valori di Rp può essere in parte giustificata dalla differenza di spessore tra le due tipologie di rivestimenti. Come osservato in precedenza, infatti, gli ossidi R_S ed A_S presentano uno spessore di circa 20 µm maggiore dei corrispettivi rivestimenti prodotti con nanoargilla, questo migliora l’effetto barriera dei rivestimenti rendendo più lenta la penetrazione di ioni aggressivi e facendo aumentare di conseguenza i valori di Rp. Inoltre, studiando l’evoluzione temporale dei valori di impedenza si può notare che nel caso di R_C ed A_C i diametri dei semicerchi, e quindi i valori di Rp, diminuiscono. Al contrario i valori di impedenza di R_S ed A_S aumentano durante il periodo di immersione nella soluzione di acido. Questo andamento può essere legato alla formazione di prodotti
di corrosione che riempiono i pori del rivestimento migliorandone l’effetto di protezione dalla corrosione.
Infine, si nota che i valori di impedenza raggiunti da A_S ed A_C sono leggermente più alti rispetto a quelli ottenuti dalle rispettive controparti contenenti rutilo. Questo fenomeno è probabilmente dovuto alla minor cristallinità dei campioni prodotti con l’incorporazione di particelle di anatasio, che fornisce quindi una resistenza maggiore al passaggio di elettroni generando impedenze più alte anche se è stato ampiamente dimostrato come il rutilo garantisca un miglior comportamento a corrosione acida in prove di lunga durata. [12]
Dall’osservazione dell’andamento dell’impedenza immaginaria è possibile valutare la cinetica dei fenomeni di rilassamento in corso. I diagrammi ottenuti (non mostrati) presentano un’unica costante di tempo a basse frequenze quindi riconducibile ad una reazione di corrosione controllata dalla diffusione di specie aggressive attraverso il rivestimento. [13]
CONCLUSIONI
Questa memoria descrive gli effetti dell’aggiunta di microparticelle alle soluzioni elettrolitiche utilizzate per i trattamenti PEO su titanio.
Si osserva che in generale l’incorporazione di microparticelle di TiO2 nei rivestimenti permette di generare ossidi spessi, in particolare quando le particelle vengono combinate con i metasilicati, e con valori di R p di almeno quattro ordini di grandezza maggiori rispetto al Ti grado 2 non rivestito.
Lavorando con microparticelle di rutilo e metasilicati è possibile ottenere ossidi con una porosità fine ed uniforme in grado di offrire una struttura particolarmente favorevole in termini di protezione del substrato metallico dalla corrosione poiché la penetrazione di specie aggressive attraverso lo strato ceramico risulta più difficoltosa. Per quanto riguarda gli ossidi ottenuti in presenza di anatasio e metasilicati, sebbene essi siano caratterizzati da pori di maggiori dimensioni, forniscono comunque valori di resistenza alla polarizzazione elevati garantendo quindi un’ottima resistenza al passaggio di carica ed un buon comportamento protettivo. Quando si aggiungono particelle di nanoargilla alla soluzione elettrolitica si ottengono invece ossidi sottili e con porosità elevata. Queste caratteristiche fanno sì che i rivestimenti siano contraddi-
stinti da valori di resistenza di polarizzazione ridotti e forniscano una protezione a corrosione inferiore rispetto agli ossidi prodotti in assenza di microparticelle.
BIBLIOGRAPHY
[1] S. Sikdar, P. V. Menezes, R. Maccione, T. Jacob, and P. L. Menezes, “Plasma electrolytic oxidation (PEO) process—processing, properties, and applications,” Nanomaterials, vol. 11, no. 6, 2021, doi: 10.3390/nano11061375.
[2] X. Lu, C. Blawert, M. L. Zheludkevich, and K. U. Kainer, “Insights into plasma electrolytic oxidation treatment with particle addition,” Corros. Sci., vol. 101, pp. 201–207, 2015, doi: 10.1016/j.corsci.2015.09.016.
[3] A. Fattah-alhosseini, M. Molaei, and K. Babaei, “The effects of nano- and micro-particles on properties of plasma electrolytic oxidation (PEO) coatings applied on titanium substrates: A review,” Surfaces and Interfaces, vol. 21, no. December 2019, p. 100659, 2020, doi: 10.1016/j.surfin.2020.100659.
[4] X. Lu et al., “Plasma electrolytic oxidation coatings with particle additions – A review,” Surf. Coatings Technol., vol. 307, pp. 1165–1182, 2016, doi: 10.1016/j.surfcoat.2016.08.055.
[5] S. Moon and Y. Jeong, “Generation mechanism of microdischarges during plasma electrolytic oxidation of Al in aqueous solutions,” Corros. Sci., vol. 51, no. 7, pp. 1506–1512, 2009, doi: 10.1016/j.corsci.2008.10.039.
[6] X. Zhang et al., “X-ray Computed Tomographic Investigation of the Porosity and Morphology of Plasma Electrolytic Oxidation Coatings,” ACS Appl. Mater. Interfaces, vol. 8, no. 13, pp. 8801–8810, 2016, doi: 10.1021/acsami.6b00274.
[7] E. Matykina, A. Berkani, P. Skeldon, and G. E. Thompson, “Real-time imaging of coating growth during plasma electrolytic oxidation of titanium,” Electrochim. Acta, vol. 53, no. 4, pp. 1987–1994, 2007, doi: 10.1016/j.electacta.2007.08.074.
[8] D. A. H. Hanaor and C. C. Sorrell, “Review of the anatase to rutile phase transformation,” J. Mater. Sci., vol. 46, no. 4, pp. 855–874, 2011, doi: 10.1007/s10853-010-5113-0.
[9] S. Aliasghari, P. Skeleton, and G. E. Thompson, “Plasma electrolytic oxidation of titanium in a phosphate/silicate electrolyte and tribological performance of the coatings,” Appl. Surf. Sci., vol. 316, no. 1, pp. 463–476, 2014, doi: 10.1016/j.apsusc.2014.08.037.
[10] X. Chen and S. S. Mao, “Titanium dioxide nanomaterials: Synthesis, properties, modifications and applications,” Chem. Rev., vol. 107, no. 7, pp. 2891–2959, 2007, doi: 10.1021/cr0500535.
[11] L. Casanova, M. La Padula, M. P. Pedeferri, M. V. Diamanti, and M. Ormellese, “An insight into the evolution of corrosion resistant coatings on titanium during bipolar plasma electrolytic oxidation in sulfuric acid,” Electrochim. Acta, vol. 379, p. 138190, 2021, doi: 10.1016/j.electacta.2021.138190.
[12] L. Casanova, M. Arosio, M. T. Hashemi, M. Pedeferri, G. A. Botton, and M. Ormellese, “Influence of stoichiometry on the corrosion response of titanium oxide coatings produced by plasma electrolytic oxidation,” Corros. Sci., vol. 203, no. January, p. 110361, 2022, doi: 10.1016/j.corsci.2022.110361.
[13] L. Casanova, F. Ceriani, M. Pedeferri, and M. Ormellese, “Addition of Organic Acids during PEO of Titanium in Alkaline Solution,” Coatings, vol. 12, no. 2, 2022, doi: 10.3390/coatings12020143.
TORNA ALL'INDICE >
LE AZIENDE DI AIM
Face your fears. How to use furnace smart data in your shop
Paolo Buzzi - Gefran, Inc., North Andover, MA, USA
GEFRAN is an Italian multinational company, specialized in designing and manufacturing of sensors, systems and components for the automation and control of industrial processes. Gefran stands out for its expertise, flexibility and quality of processes in the production of tools and integrated systems for specific applications in various industrial fields. It has a consolidated know-how in the industry of heat treatment, metal, plastics and mobile hydraulic. The added value of Gefran product range lies in technology, innovation and versatility: power regulators and controllers, sensors and automation platforms help to boost the efficiency of production processes, also in terms of energy consumption.
The company now has more than 650 employees and consolidated partnerships with research centres and national and international universities. Gefran operates in the major markets through 8 production branches (in Italy, Switzerland, United States, Brazil
and China), 13 commercial subsidiaries (included Germany, France, UK, Belgium, India and Singapore) and more than 80 international distributors for global sales support.
Gefran is listed on the Milan Stock Exchange in the FTSE Italia STAR segment.
Heat Treatment in the Era of Industry
4.0
With smart automation and everincreasing connectivity, heat treaters feel pressured to make quick and substantial changes to how they do things. However, integrating Industry 4.0 concepts should be manageable. Small, fundamental shifts in thinking and application will improve communication across your enterprise and make it easier to be productive and profitable.
You need to begin the transition somewhere, so getting connected and using data for operations and maintenance decisions is a great
place to start. Learn from real-world case studies and smart furnace implementations that use PID controllers, power controllers, and sensors to collect, process, and analyze data, thus improving decisionmaking and information sharing across the organization and various departments. It will help you remain competitive in the heat treatment industry and create competitive advantages.
Industry 4.0
The manufacturing industry has been buzzing about the fourth industrial revolution for some time now. That’s because Industry 4.0 continues to create competitive advantages for the manufacturing industry. These technologies have redefined production around the globe and have led to greater operational understanding, increased product value, and sustainable revenue generation for many manufacturers.
Fig. 1 - Industry 4.0 technology is available now for heat treaters.
This technology is available now for heat-treating metal (Fig. 1), but many heat treaters do not fully use these technologies.
Why is that?
Industrial Revolutions
For a quick review, industrial revolutions are periods of a global transition from the human economy toward more efficient and stable processes of production:
• Mechanical production was at the heart of the first industrial revolu-
LE AZIENDE DI AIM
tion, and in the 1700s, the steam engine powered machinery and automated some jobs.
• By the mid-1800s, the second industrial revolution ushered in the “Mass Production” era. Urbanization and the advent of electricity gave birth to assembly lines and shop lighting.
• The third industrial revolution began in the middle of the 1900s with the introduction of the “Digital Age.” This involved computers, and production was automated using electronics, programmable
logic controllers, information technology systems, and robotics.
• The fourth industrial revolution began in the 2000s with the “Smart Factory” and pushed for fully automated industrial production. This includes the Industrial Internet of Things (IIoT), Big Data analysis, intelligent systems, computer-based algorithms, machine learning, and autonomous decision-making.
With Industry 4.0 (Fig. 2), these intelligent systems typically combine sensor networks with embedded computing to monitor and control the physical environment. Feedback loops connect the software to the hardware, so the system can measure, process data, and control well-defined tasks. Data acquisition and rapid analysis are key to Industry 4.0, and with ever-increasing computing powers,
unlimited data storage, and Ethernet connectivity, industrial processes are getting closer to becoming fully integrated.
4.0 is Evolutionary.
Saying industrial “revolution” is a bit of a misnomer. All four periods, including Industry 4.0, are characteristically more evolutionary than revolutionary. In fact, an ongoing evolution of industrial
production systems has happened over the last 250 years, with the first two periods of change occurring over 100-year spans. The pace of change is accelerating rapidly now and in the last 20 years, Industry 4.0 has significantly rescripted business, the workforce, and routes to market. These rapid changes are clearly seen in the consumer market (fig. 3). For example, look at personal
Fig. 2 - Major milestones in production technology.
entertainment over my lifetime. A medium like radio was just sound. Listeners could only enjoy their favorite shows at certain times and from certain rooms in their homes. The listener was also limited to the
LE AZIENDE DI AIM
tastes and schedule of the broadcaster. Then, with televisions, viewers now had pictures to pair with the sound, but views were still limited by the show time schedule, their location, and broadcaster preferences. Today,
people are entertained by digital technologies. We can watch and listen to anything we want, at any time, in any place, and in a highly personalized manner.
In contrast, consumer adoption of entertainment media was seamless compared to the transitions happening in the industrial sector. In industry, it is experienced with greater resistance and difficulty. Some of the resistance is due to the record speed of these changes and our ability to react and pivot quickly.
Activating Change
It’s true; change is difficult.
This is not new information to any of us because we all know people do not like change generally, and they will fight it. Like all preceding industrial periods, if companies do not adapt and adopt Industry 4.0 technologies, there will be painful consequences. There
could be irrecoverable damage to the company’s livelihood and longevity.
When these risks are known, what’s holding heat treaters back from implementation? Industry 4.0 can come across to too many people as a confusing mixture of lofty concepts and flashy technologies that complicate, rather than illuminate, opportunities for their company. That said, the reality is that many of these technologies can mean significant financial gains, increased efficiency, and improved quality control. Plus, these logical applications can provide real-world competitive advantages.
Manufacturers are already cautious with investments, and with this technology,
they might think it would be difficult to understand. The key for all decisionmakers is to balance quick wins with long-term strategic investments. There are many easy wins available today for heat treaters.
Moving forward
“What we have is already working. I don’t have time for this,” are comments I’ve heard from heat treaters. This is a costly response, and the alarm bells should be sounding. Here are some points to motivate you to act:
• Surrounding yourself with the right people is important. You need to consult both external and internal specialists and experts. It is critical to know what is available in the marketplace and have
Fig. 3 - How entertainment has evolved. [1]
professionals in your company who can implement, optimize, and manage technology usage. From an employment point of view, hire people with expertise.
• When approaching implementation, define your short- and longterm goals. Then write out a plan and a roadmap. There is no one-size-fits-all approach to industry 4.0 technologies and your goals will be specific to your company. Keep in mind that not everything needs to be done at once.
• The payoff of doing this work is real. Heat treaters are responsible for managing many variables, but they need consistency. Even with tight deadlines, material and process changes, and high-quality requirements, your furnaces can operate in ideal conditions and
LE AZIENDE DI AIM
with minimal downtime.
How it works
Industry 4.0 technologies enable furnaces to monitor and manage operating conditions easily and automatically. There are preventative maintenance features, so threats to batch quality can be mitigated and avoided before something goes wrong. A system can generate a warning for the operator so the heating element is replaced before a failure happens, and this technology can even generate a purchase order automatically for the replacement part.
Small continuous improvements will compound and can bring significant operational savings. If increasing production efficiency is a longterm strategic goal, you can begin
by focusing on reducing unplanned downtime as your short-term goal. By choosing technology with predictive maintenance controls and activating the technology in your shop, you would reduce (and maybe eliminate) unplanned downtime.
If we have a roadmap with the goal of increasing production efficiency, then limiting or avoiding any production downtime by implementing a management system is helpful from a predictive maintenance perspective. For simplicity's sake, we assume that to develop a project involving aspects related to connectivity and transferring of useful data to a Big Data management system, you can anticipate possible plant operation problems and avoid downtime (fig. 4).
4 - Relevant themes for Industry 4.0.
Interconnectivity
A major benefit associated with connectivity is the ability to gain valuable information about your furnace in real-time. The status of the
furnace is monitored with sensors, controllers, and actuators that ensure everything is running as it should. They connect through a series of communication networks that enable a fast and secure exchange of process data, thus limiting the need for operator intervention.
Fig.
LE AZIENDE DI AIM
Success also comes from an organizational mindset (fig. 5). Many companies have purchased this technology already but are not using it. Understanding the current state of your communication network must happen before utilization can be successful.
Managing Big Data
Important information, such as functional data, should be transferred to computational systems for storage, processing, and analysis. The advantage of having this information is the time and cost savings. Processing information used to take days, but now it can be done in seconds.
Big data means having high-volume, high-velocity, and high-variety information available to use as a powerful resource. It is not enough to have enormous amounts of data, though; you must have company architectures in place and tools for managing and processing the data for it to be useful to you.
Predictive Maintenance
In the case of heat treaters, the goal of predictive maintenance is to prevent equipment failure and avoid unplanned downtime, but more generally, a predictive system uses stored information to predict future outcomes. It is interconnectivity and Big Data that makes predictive
maintenance possible. A company can save a substantial amount of time and money by connecting IIoT-enabled business assets, which process data in milliseconds and utilizes advanced analytics to automate maintenance protocols.
A considerable amount of data can be collected at different points of production, and for heat treaters, there are vast amounts of data related to temperature, position, pressure, force, vibration, and more. When utilized
Fig. 5 - Connect to your communication network.
Fig. 6 - Functional data is transferred to computational systems for storage, processing, and analysis.
Fig. 7 - A predictive system uses stored information to predict future maintenance needs.
as Big Data, this information provides a realistic view of how your furnace operates and performs. Any anomaly outside of normal functioning will be identified before something goes wrong.
In the Real World
In heat treatment, it becomes dangerous when power cables overheat. This can occur when the
LE AZIENDE DI AIM
cables are not properly installed. Loose cables can still transfer hundreds of amperes, which can spark and overheat terminal blocks. Cable sheaths can melt and cause fires in the electrical panel. Predictive maintenance will identify these issues before something catastrophic happens.
A small electrical problem, like a loose cable, can lead to production losses,
8
equipment damage, and injury. Infrared cameras are often used to check cable temperatures, but only periodically. This activity is preventative, but it is not foolproof.
Checks are sometimes carried out when the system is not fully operational, so the problem can be hidden. That’s why ongoing, continuous monitoring is so important (fig. 8).
Continuous monitoring of terminal block temperature is a solution that brings significant advantages. The power controller can use this information to manage a hightemperature alarm threshold. Monitoring is autonomous and will shut off the power supply when a threshold is exceeded. Damage to the electrical panel is avoided, and the furnace is returned to safe temperature levels. However, normal production is disrupted and can impact the batch.
Fig. 9 - The high-temperature alarm turned the power off before the damage became catastrophic.
Fig.
- Fire in the cabinet. [2]
LE AZIENDE DI AIM
More can be done for this in this situation from an Industry 4.0 perspective. The terminal temperature value can be continuously communicated (connectivity) to an acquisition system that gathers, processes, and analyzes system conditions in real time (Big Data). This is timely information for maintenance, and it is predictive, meaning you have critical information before something goes wrong (predictive maintenance). Production shutdowns are avoided completely, and batches are consistent and run their full cycle, without interruption.
Fig. 10 - Monitoring the temperature trend identifies issues before they happen so predictive maintenance can occur.
Ongoing trend analysis of terminal temperatures will automatically identify anomalies in power cable temperatures, and maintenance can be done before a problem. By connecting the power controller to the control system, transmitting temperature values, and automating the analysis, the danger is eliminated. This kind
REFERENCES
of programming is very precise, and it helps heat treaters avoid painful production headaches.
Conclusion
Industry 4.0 is here to stay and to remain competitive, heat treaters must take steps toward adopting this technology, especially the predictive maintenance
capabilities. Small, incremental actions can have big impacts. Start by planning, setting goals, hiring the right people, and evaluating your existing technology so you have a baseline understanding of where your company stands today so you can implement predictive maintenance.
[1] “Television Invention Timeline.” (n.d.). Television: A Cultural Revolution. [Photograph]. http://television-aculturalrevolution. weebly.com/history.html
[2] Istockphoto. (June 8, 2021). “The main switch burns fire in the control box. Electrical short circuit.” [Photograph]..https://www. istockphoto.com/it/foto/linterruttore-principale-brucia-il-fuoco-nella-scatola-di-controllo-cortocircuito-gm1322236203408258414?clarity=false
TORNA
Eventi AIM / AIM events
CONVEGNI
ESOMAT 2024 - 12th European Symposium on Martensitic Transformations – Lecco, 26-30 agosto 2024
40° CONVEGNO NAZIONALE AIM – Napoli, 11-13 settembre 2024
ECIC 2024 - 9TH EUROPEAN COKE AND IRONMAKING CONGRESS – Bardolino, 16-18 ottobre 2024
International Meeting on CIRCULAR METALLURGY - Raw Materials, By-products & Recycling – Bergamo, 2829 novembre 2024
CORSI E GIORNATE DI STUDIO
Corso METALLURGIA PER NON METALLURGISTI – Milano, 15-16-22-23-29-30 ottobre 2024
Giornata di Studio METALLI A CONTATTO CON L’ACQUA POTABILE – Milano, 24 ottobre 2024
Giornata di Studio DIGITALIZZAZIONE IN FONDERIA – Bergamo c/o Kilometro Rosso, 5 novembre 2024
Giornata di Studio MICROSCOPIA ELETTRONICA APPLICATA ALLA FAILURE ANALYSIS – Campogalliano MO c/o TEC Eurolab, 7 novembre 2024
Corso PROVE NON DISTRUTTIVE – Milano, 21-22 novembre 2024
Giornata di Studio RAGGI X – Milano, 3 dicembre 2024
Giornata di Studio NUOVI SVILUPPI ADDITIVE MANUFACTURING PER BIOMEDICALE – Milano c/o PoliMi, 5 dicembre 2024
FaReTra (Fair Remote Training) - FORMAZIONE E AGGIORNAMENTO A DISTANZA
Modalità Asincrona (registrazioni)
Webinar NORMATIVA NEL CAMPO DEI TRATTAMENTI TERMICI
Giornata di Studio STATO DI SERVIZIO DEGLI IMPIANTI, CON PARTICOLARE ATTENZIONE ALLA METALLURGIA E AGLI ESAMI UTILIZZATI
Giornata di Studio LA NORMATIVA: GLI ACCIAI E I TRATTAMENTI TERMICI NELL'INDUSTRIA AUTOMOTIVE
Corso PROVE NON DISTRUTTIVE
Giornata di Studio TRATTAMENTI SUPERFICIALI DELL’ALLUMINIO A SCOPO DECORATIVO E PROTETTIVO
Corso Modulare METALLOGRAFIA – I MODULO, II MODULO “METALLI NON FERROSI”
Corso modulare FONDERIA PER NON FONDITORI
Corso DIFETTOLOGIA NEI GETTI PRESSOCOLATI: METALLIZZAZIONI
Corso ADDITIVE METALLURGY
Corso METALLURGIA PER NON METALLURGISTI
Giornata di Studio PRESSOCOLATA DELLE LEGHE DI ZINCO
Giornata di Studio LA SFIDA DELLA NEUTRALITÀ CARBONICA
Corso modulare TRATTAMENTI TERMICI
Corso modulare I REFRATTARI SIDERURGICI E LE LORO APPLICAZIONI
Corso GLI ACCIAI INOSSIDABILI 11ª edizione
Corso FAILURE ANALYSIS 11a edizione
L’elenco completo delle iniziative è disponibile sul sito: www.aimnet.it
www.aimnet.it
Comitati tecnici / Study groups
CT METALLI E TECNOLOGIE APPLICATIVE (MTA)
(riunione 10 aprile 2024)
Manifestazioni in corso di organizzazione
• GdS “Metalli a contatto con l’acqua potabile”. Il Presidente Loconsolo segnala che la lista dei materiali ammessi è stata pubblicata. Uno dei temi più critici è quello del Pb negli ottoni. Essendo la quantità ammessa nell’acqua piuttosto bassa, 5g/l, l’unico modo di riciclare il materiale prodotto finora sarà quello di diluirlo molto con leghe aventi concentrazioni di Pb estremamente basse o con possibili alternative al Pb che non penalizzino troppo la lavorabilità. La difficoltà è ancora maggiore, poiché la data limite per il passaggio alle nuove composizioni chimiche, è stata fortemente anticipata, dal 31/12/2036 al 01/01/2027. La GdS in preparazione è quindi ancora più attuale e importante. Loconsolo presenta una prima bozza di scaletta. La GdS dovrebbe tenersi il 25 Giugno 2024.
Iniziative future
• GdS sul mercato dei metalli: i coordinatori Debernardi, Oreglia e Varalda stanno raccogliendo una documentazione sufficiente per definire il programma di una GdS da proporre verso la fine dell’anno.
• GdS su “Sostenibilità ambientale nel campo delle costruzioni civili”: vista l’attenzione posta alla giornata riguardante i metalli a contatto con l’acqua potabile, Loconsolo riprenderà a lavorare alla GdS sulla sostenibilità ambientale nelle costruzioni civili appena la prima sarà definita. La GdS è comunque a buon punto come segnalato nel verbale precedente.
CT
PRESSOCOLATA
(P) (riunione del 07 maggio 2024)
Notizie dal Comitato
• Luca Milani lascia il Comitato perchè dimissionario da Vesuvius; al suo posto rientra Andrea Battaiotto. Il CT approva.
• Sara Ferri di Ghial e Mattia Cominelli di FONDITAL (che lavora come supporto simulazioni e produzione) confermano l’interesse a far parte del CT P. Il CT approva il loro ingresso.
Consuntivo di attività svolte
• Corso “Igiene delle leghe dentali” in compartecipazione con il CT Metalli Leggeri – coordinatori Muneratti e Timelli. La manifestazione si è svolta in data 17/18 aprile 2024 presso TMB con 50 partecipanti. Sono stati raccolti 26 questionari con ottimi riscontri. Si sottolinea l’ottima organizzazione da parte di TMB della sala e della visita agli impianti così come la scelta del ristorante e la visita guidata al Tempio La Rotonda.
Manifestazioni in corso di organizzazione
• GdS “L’ecosostenibilità e le emissioni di CO2” in compartecipazione con il CT Metalli Leggeri – possibile data novembre 2024. Il coordinatore Timelli elenca gli interventi e i possibili relatori. I temi saranno legati a fonderia, estrusione e additive. Si discuterà dei vari tipi di certificazione utilizzati in questo momento.
Iniziative future
• Master “Progettazione Stampi” (coordinatori Timelli, Citterio, Garlet e Martina): si pensa che non sia il momento di organizzare questa manifestazione che si rimanda ad un periodo più opportuno.
• GdS “Foundry 5.0” (coordinatori Parona – Tronci – Pialorsi – Valente – Furlati – Cecchetto). Effettuata una call preliminare verrà ora definita una scaletta. Si discute di possibili argomenti e relatori e si attende l’esito di queste verifiche.
Normativa / Standards
Norme pubblicate e progetti in inchiesta (aggiornamento al 31 maggio 2024)
Norme UNSIDER pubblicate da UNI nel mese di maggio 2024
UNI EN 17878-2:2024
Tubazioni per teleriscaldamento - Sistemi di tubazioni flessibili preisolate per esercizio a temperatura ridotta - Parte 2 : Requisiti e metodi di prova per tubazioni bloccate con tubo di servizio in materiale plastico.
UNI EN ISO 13702:2024
Industrie del petrolio e del gas naturale - Controllo e mitigazione di incendi ed esplosioni sulle installazioni di produzione a mare - Requisiti e linee guida.
UNI EN 17878-3:2024
Tubazioni per teleriscaldamento - Sistemi di tubazioni flessibili preisolate per esercizio a temperatura ridotta - Parte 3 : Requisiti e metodi di prova per tubazioni non bloccate con tubo di servizio in materiale plastico.
UNI EN 17878-1:2024
Tubazioni per teleriscaldamento - Sistemi di tubazioni flessibili preisolate per esercizio a temperatura ridotta - Parte 1 : Classificazioni, requisiti generali e metodi di prova.
UNI EN ISO 204:2024
Materiali metallici - Prova di scorrimento uniassiale in tensione - Metodo di prova
Norme UNSIDER ritirate con sostituzione da UNI nel mese di maggio 2024
UNI EN ISO 13702:2015
Industrie del petrolio e del gas naturale - Controllo e mitigazione di incendi ed esplosioni sulle installazioni di produzione a mare - Requisiti e linee guida.
UNI EN ISO 204:2018
Materiali metallici - Prova di scorrimento uniassiale in tensione - Metodo di prova.
Norme UNSIDER pubblicate da CEN e ISO nel mese di maggio 2024
EN ISO 16961:2024
Oil and gas industries including lower carbon energy - Internal coating and lining of steel storage tanks (ISO 16961:2024).
EN ISO 21068-1:2024
Chemical analysis of raw materials and refractory products containing silicon-carbide, silicon-nitride, silicon-oxynitride and sialon - Part 1: General information, terminology and sample preparation (ISO 21068-1:2024).
ISO 21068-1:2024
Chemical analysis of raw materials and refractory products containing silicon-carbide, silicon-nitride, silicon-oxynitride and sialon — Part 1: General information, terminology and sample preparation.
ISO 16961:2024
Oil and gas industries including lower carbon energy — Internal coating and lining of steel storage tanks.
ISO 13680:2024
Oil and gas industries including lower carbon energy — Corrosion-resistant alloy seamless products for use as casing, tubing, coupling stock and accessory material — Technical delivery conditions.
ISO 11772:2024
Hot-rolled longitudinally profiled steel plate.
ISO/TS 9516-2:2024
Iron ores — Determination of various elements by X-ray fluorescence spectrometry — Part 2: Single element calibration procedure.
ISO 3845:2024
Oil and gas industries including lower carbon energy — Full ring ovalization test method for the evaluation of the cracking resistance of steel line pipe in sour service.
Progetti UNSIDER messi allo studio dal CEN (Stage 10.99) – giugno 2024
prEN 10342 rev
Magnetic materials - Classification of surface insulations of electrical steel sheet, strip and laminations.
Progetti UNSIDER in inchiesta prEN e ISO/DIS – giugno 2024
prEN – progetti di norma europei
prEN ISO 19901-5
Petroleum and natural gas industries - Specific requirements for offshore structures - Part 3: Topsides structure (ISO/DIS 19901-3:2022).
ISO/DIS – progetti di norma internazionali
ISO/DIS 13503-8
Oil and gas industries including lower carbon energy — Completion fluids and materials — Part 8: Measurement of properties of coated proppants used in hydraulic fracturing.
ISO/DIS 10059-1
Dense shaped refractory products — Determination of cold compressive strength — Part 1: Referee test without packing.
ISO/DIS 5014
Dense and insulating shaped refractory products — Determination of modulus of rupture at ambient temperature.
Progetti UNSIDER al voto FprEN e ISO/FDIS – giugno 2024
ISO/FDIS – progetti di norma internazionali
ISO/FDIS 10427-1
Oil and gas industries including lower carbon energy — Equipment for well cementing — Part 1: Casing bow-spring centralizers.
ISO/FDIS 7039
Metallic materials — Tensile testing — Method for evaluating the susceptibility of materials to the effects of high-pressure gas within hollow test pieces.
ISO/FDIS 6934-5
Steel for the prestressing of concrete — Part 5: Hot-rolled steel bars with or without subsequent processing.
ISO/DTS 6892-5
Metallic materials — Tensile testing — Part 5: Specification for testing miniaturised test pieces.
ISO/FDIS 4941
Steel and iron — Determination of molybdenum content — Thiocyanate spectrophotometric method.
VERONA, ITALY
6-9 OCTOBER
Palaexpo
IRONMAKING
STEELMAKING
ROLLING OF FLAT AND LONG PRODUCTS, FORGING
STEEL MATERIALS AND THEIR APPLICATION, ADDITIVE MANUFACTURING, SURFACE TECHNOLOGIES