Prolonged Phases, Promising Prospects


2023 Commentary
Q2
Confidence has renewed in the market. Previous uncertain variables such as the Federal Reserve’s rate hiking trajectory, inflation outlook, and the economy have become more defined. Tailwinds have propelled risky assets, driving equity markets to another quarterly surge and back into a bull market.
Despite these positive signs, investors are not completely free from potential challenges. There can still be surprises from economic data and Federal Reserve actions. The future remains unpredictable, and adverse market conditions can swiftly catch unprepared investors off guard.
Our RiskFirst ® approach has proven its mettle, enabling us to deftly navigate some of the drawdowns experienced last year, while actively participating in this year’s rally despite the highinterest rate conditions. We are dedicated to our continued research for opportunities going forward in this new environment.
Almost There, But Not Quite Yet
Throughout the second quarter of 2023, risk assets persistently rallied, driving equities closer to their all-time highs. The S&P 500 Index exhibited remarkable strength, surging 8% during the quarter, effectively re-entering a bull market, capping a remarkable run of over 20% since its lows in October. The techheavy Nasdaq Composite outperformed expectations, boasting its best first-half rally since 1983, with an astonishing return of over 30% year-to-date.
Despite the impressive rally of the Nasdaq this year, it continues to underperform both the S&P 500 Index and the traditional 60% stock, 40% bond (60/40) portfolio since the onset of the bear market in 2022. The reason behind this phenomenon lies in the math of loss. The Nasdaq experienced a more significant drawdown in 2022 compared to the 60/40 portfolio, leading to a divergence in overall returns. Investors should take careful note of this phenomenon and recognize the importance of limiting drawdowns in their investment strategies.

An Attempt at Recovery
to a
Source: Bloomberg, Redwood. Data as of 6/23/2023. Date Range from 1/1/2022 – 6/22/2023.
bayntree.com Bayntree Wealth Advisors | 3
Nasdaq Composite Index S&P 500 Index 60/40 Buy and Hold
Due
larger drawdown, the Nasdaq still lags behind the S&P 500 and 60/40.
Hidden Figures
A large portion of the equity rally has been led by only a handful of mega-cap tech stocks, which is quite intriguing given the backdrop of rising interest rates. Normally, such rate increases are considered unfavorable for these longduration assets. This recent market phenomenon certainly raises questions about the sustainability of the rally.
While mega-cap tech stocks flourished, a significant portion of the market, represented by the remaining 493 stocks, failed to see the same success. Some of these companies have even struggled to outperform their international counterparts. This divergence in performance highlights the challenges still faced by many smaller companies in the current environment.
Investors often are concerned when valuations are stretched beyond what their underlying fundamentals may justify, and this rally is no exception. The concentration in the S&P 500 Index has reached alarming levels to where just five stocks account for approximately 25% of the entire index’s value. This marks the highest level since 2020 and surpasses the concentration during the Tech Bubble which was at 18%. The combination of stretched valuations and top heaviness adds an extra layer of risk to the current rally. As these few stocks have propelled the market upwards, any reversal could lead to a downturn, crashing the market as fast as it rallied.

The “Big 7” Becomes Bigger
bayntree.com Bayntree Wealth Advisors | 4
7/14/2023.
1/1/2023 – 7/14/2023. Year-to-Date Performance(%) Only 7 stocks account for more than half of the S&P 500’s return.
Source: Bloomberg, Redwood. Data as of
Date Range from
Prices Cooling
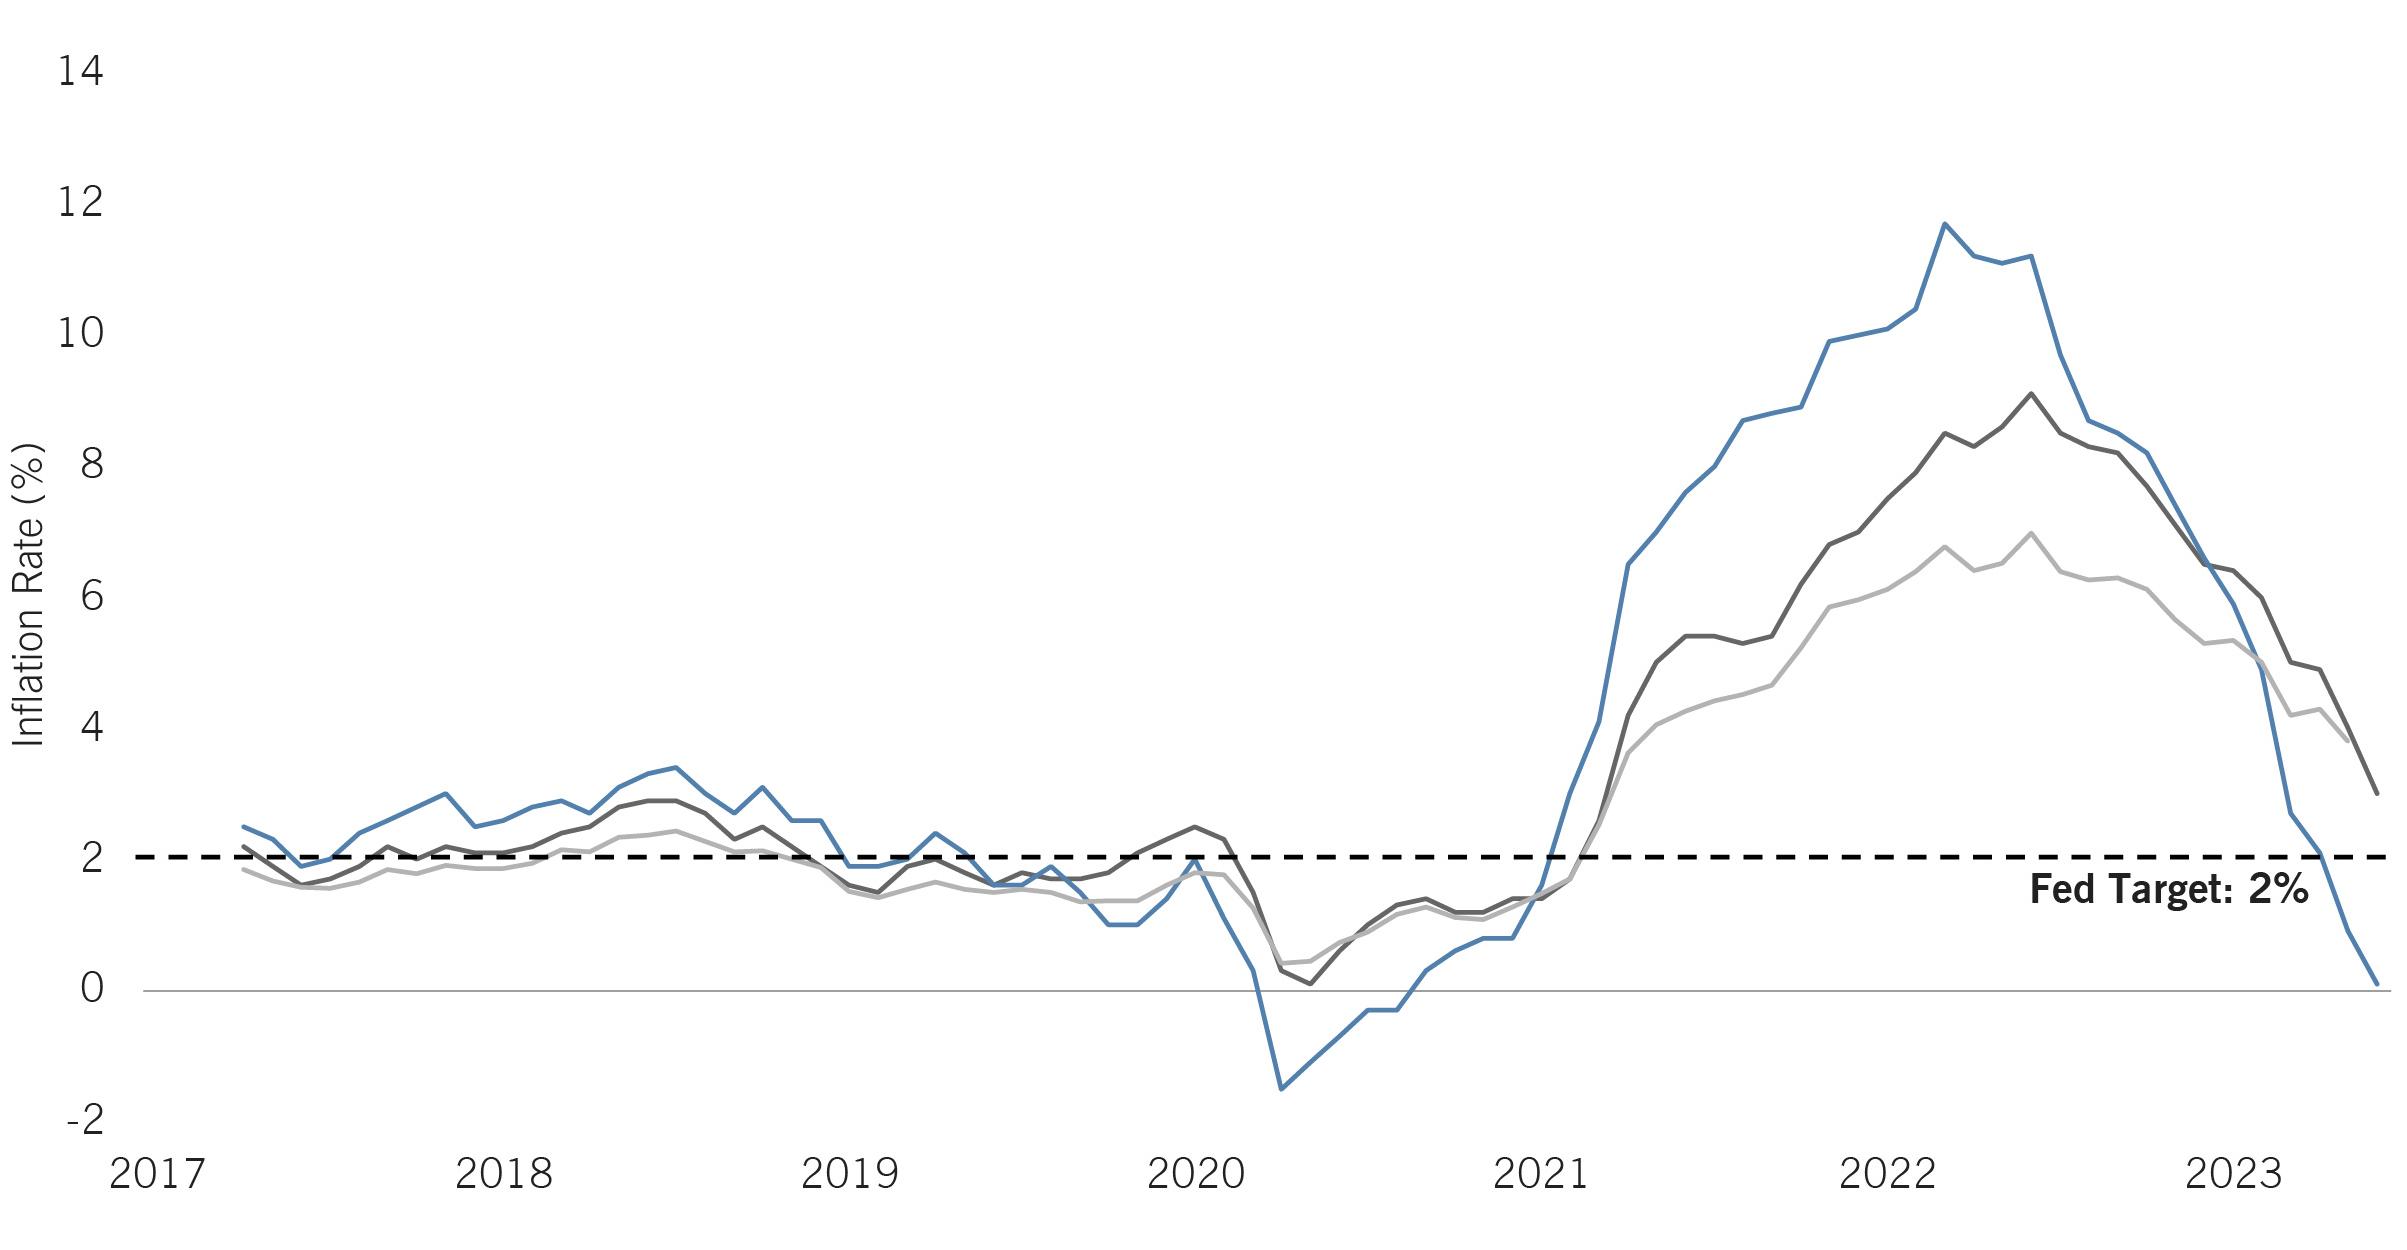
With that said, the current market rally is not completely unjustified. Positive market sentiment is fueled by the widespread belief that inflation has peaked and is steadily moving towards the Federal Reserve’s target of 2%. The Consumer Price Index, a widely followed gauge for inflation, has shown inflation falling to just 3% year-over-year, its lowest level since March 2021. This achievement is widely regarded as a significant victory for the Federal Reserve. Recall, the Fed’s aggressive policy aimed at tackling inflation was a large catalyst in causing the turmoil in the first place.
Moreover, the prospect of the Federal Reserve achieving its desired inflation target without triggering a recession is becoming more plausible, often referred to as a “soft landing.” This belief carries substance, given that this year has witnessed one of the strongest labor markets since the 1960s, with the unemployment rate resting at a remarkable 3.6%. The growing credibility of this scenario further fuels market optimism, providing additional tailwinds for the ongoing rally.
Inflation Heads Toward Fed’s Target
bayntree.com Bayntree Wealth Advisors | 5
Source: Bloomberg, Redwood. Data as of 7/26/2023. Date Range from 4/30/2017 – 6/30/2023. Inflation has dramatically cooled down but is still not below the Fed’s 2% target. Producer Price Index (PPI) Consumer Price Index (CPI) Personal Consumption Expenditures (PCE)
Pause =/= Cut
Market sentiment suggests that at some point, the Federal Reserve will conclude its rate-hiking cycle and subsequently cut rates. Such a move is usually performed to loosen financial conditions and provide an economic boost, especially if the economy is in a recession. However, the likelihood and time frame for this scenario remain uncertain.
One of the primary concerns is the possibility of the Fed cutting rates too soon, leading to a resurgence of inflation, like what occurred during the Volcker era when premature rate cuts resulted in inflationary spikes. As a result, in the last two hiking cycles, the Federal Reserve adopted a different approach, keeping rates unchanged for extended periods (15 months in 2008 and 7 months in 2019).
Despite the market’s optimism regarding the Federal Reserve’s ability to engineer a soft landing, the board members are maintaining a cautious stance and refraining from prematurely declaring victory. After all, the longer the Fed maintains elevated rates and financial conditions are tight, the greater the risk of being pushed into a recession. Market participants are closely monitoring the Fed’s actions and communications to gauge the future direction of monetary policy.

The Rate Wait
bayntree.com Bayntree Wealth Advisors | 6
1/1/1971 –
Fed Funds Target Rate Rate Pause Period The Fed has historically waited several months after a rake hike cycle before reversing rates.
Source: Bloomberg, Redwood. Data as of 7/26/2023. Date Range from
7/26/2023.
Are Recessions Inevitable?
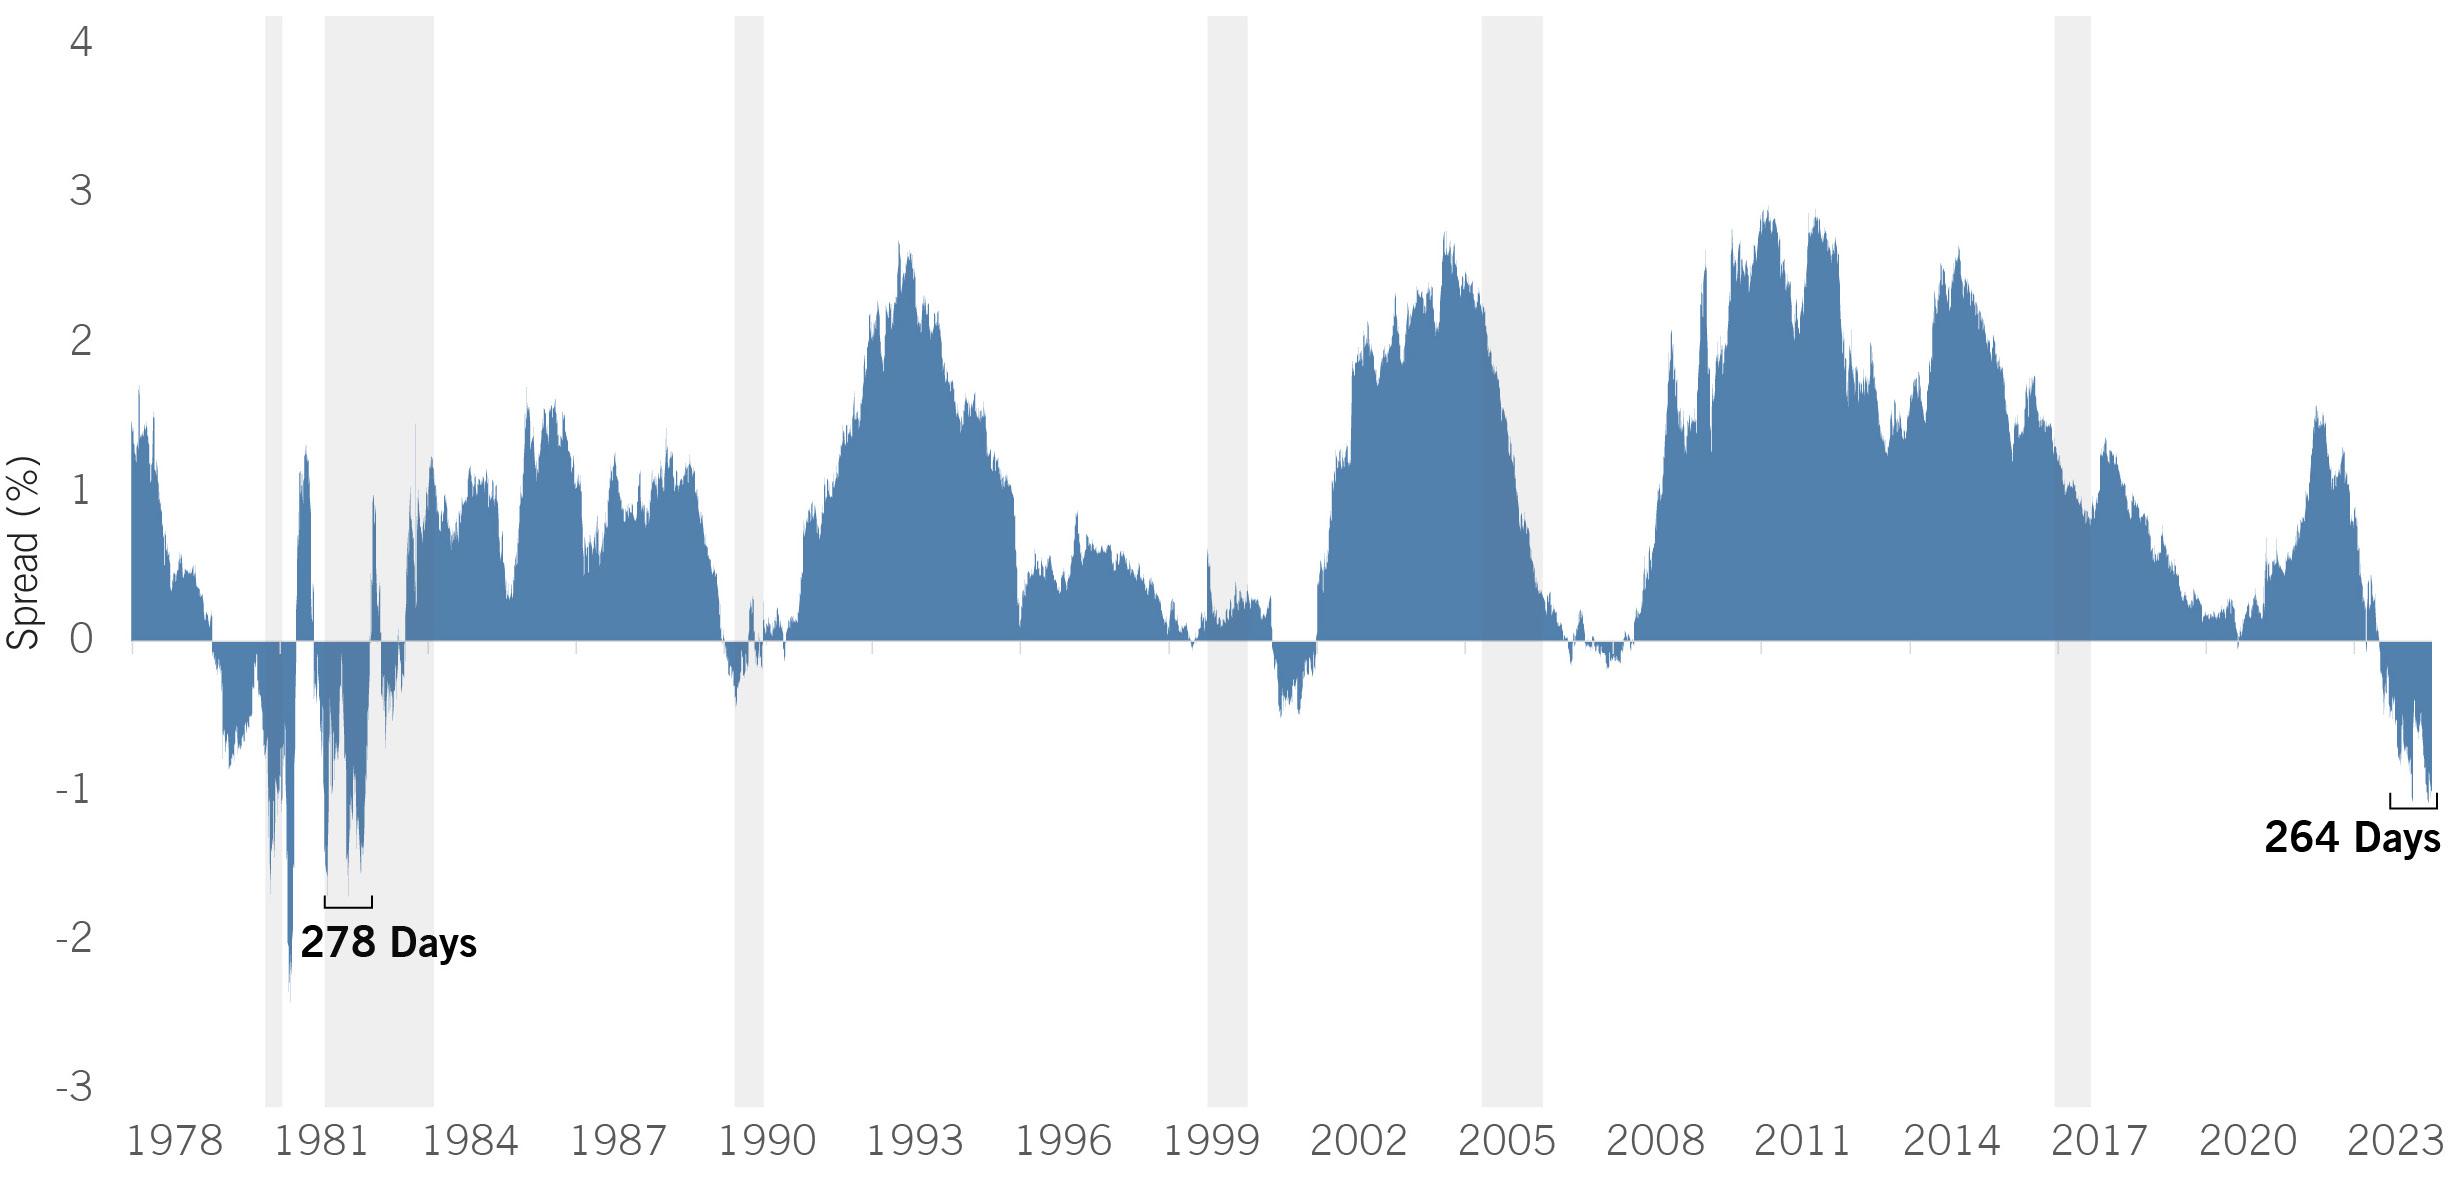
The utilization of treasury yield curves as a gauge of the economy’s health has been a long-standing practice. This is given their tendency to slope upward in a normal, healthy economy, with treasuries yielding more as maturities extend. In contrast, inversions, which occur when shortermaturity treasuries yield more than longer-dated ones, have historically been a reliable signal of an impending economic recession. One commonly followed spread by investors is the difference between the yields of 2-Year and 10-Year Treasuries. As of 7/26/2023, this spread has been inverted for an unprecedented 264 trade days, representing the most pronounced and prolonged inversion since 1980.
Even with the persistently inverted yield curve, the expected recession has yet to materialize. While historical patterns can offer valuable insights, they are not definitive predictions of the future. The current market behavior does not align with the expectation of a recession, as the S&P 500 Index has remarkably returned 21% since the yield curve inverted over a year ago, marking a resurgence into a bull market. It’s crucial to recognize that market dynamics can deviate from historical norms, and cautious interpretation is needed while navigating through this unique economic landscape.
An Extended Inversion
A U.S. 2/10 yield inversion commonly precedes a recession. The current inversion is the longest since the 1980s.
Source: Bloomberg, Redwood. Data as of 7/26/2023. Date Range from 6/1/1976
bayntree.com Bayntree Wealth Advisors | 7
U.S. 2-Year/10-Year Spread U.S. Recession
– 7/26/2023.
1084 Days & Counting
In the realm of fixed-income investments, the Bloomberg U.S. Aggregate Bond Index (AGG) continues to grapple with the lingering effects of the 2022 drawdown. As of July 26, 2023, the drawdown has persisted for a staggering 1084 days, leaving investors still approximately 15% away from breaking even.
While equities have managed to return to a bull market since bottoming out, the road to recovery for public investment-grade bonds remains slow and painful, with the AGG generating a meager 2% return in the first half of the year. Compounding the challenge, the AGG faces
potential pain from any additional interest rate hikes. This stems from the fact that the index still holds a considerable number of older securities acquired during the previous rate regime, which come with lower coupons. Consequently, these lower coupon bonds might struggle to offer enough support to offset an increase in yields, as highlighted by the AGG’s current yield of 4.75% compared to the 5.1% yield seen in cash/money markets. On a positive front, the aftermath of 2022 has left bond prices at appealing levels. This creates an opportunity for investors as bonds possess the potential for upside appreciation, a benefit that cash investments may not offer.

Still A Ways To Go
bayntree.com Bayntree Wealth Advisors | 8
Source: Bloomberg, Redwood. Data as of 7/26/2023. Date Range from 6/28/2018 – 7/26/2023. Bloomberg U.S. Aggregate Bond Index Bloomberg U.S. Aggregate Bond Yield
Making the Efficient Frontier More Efficient
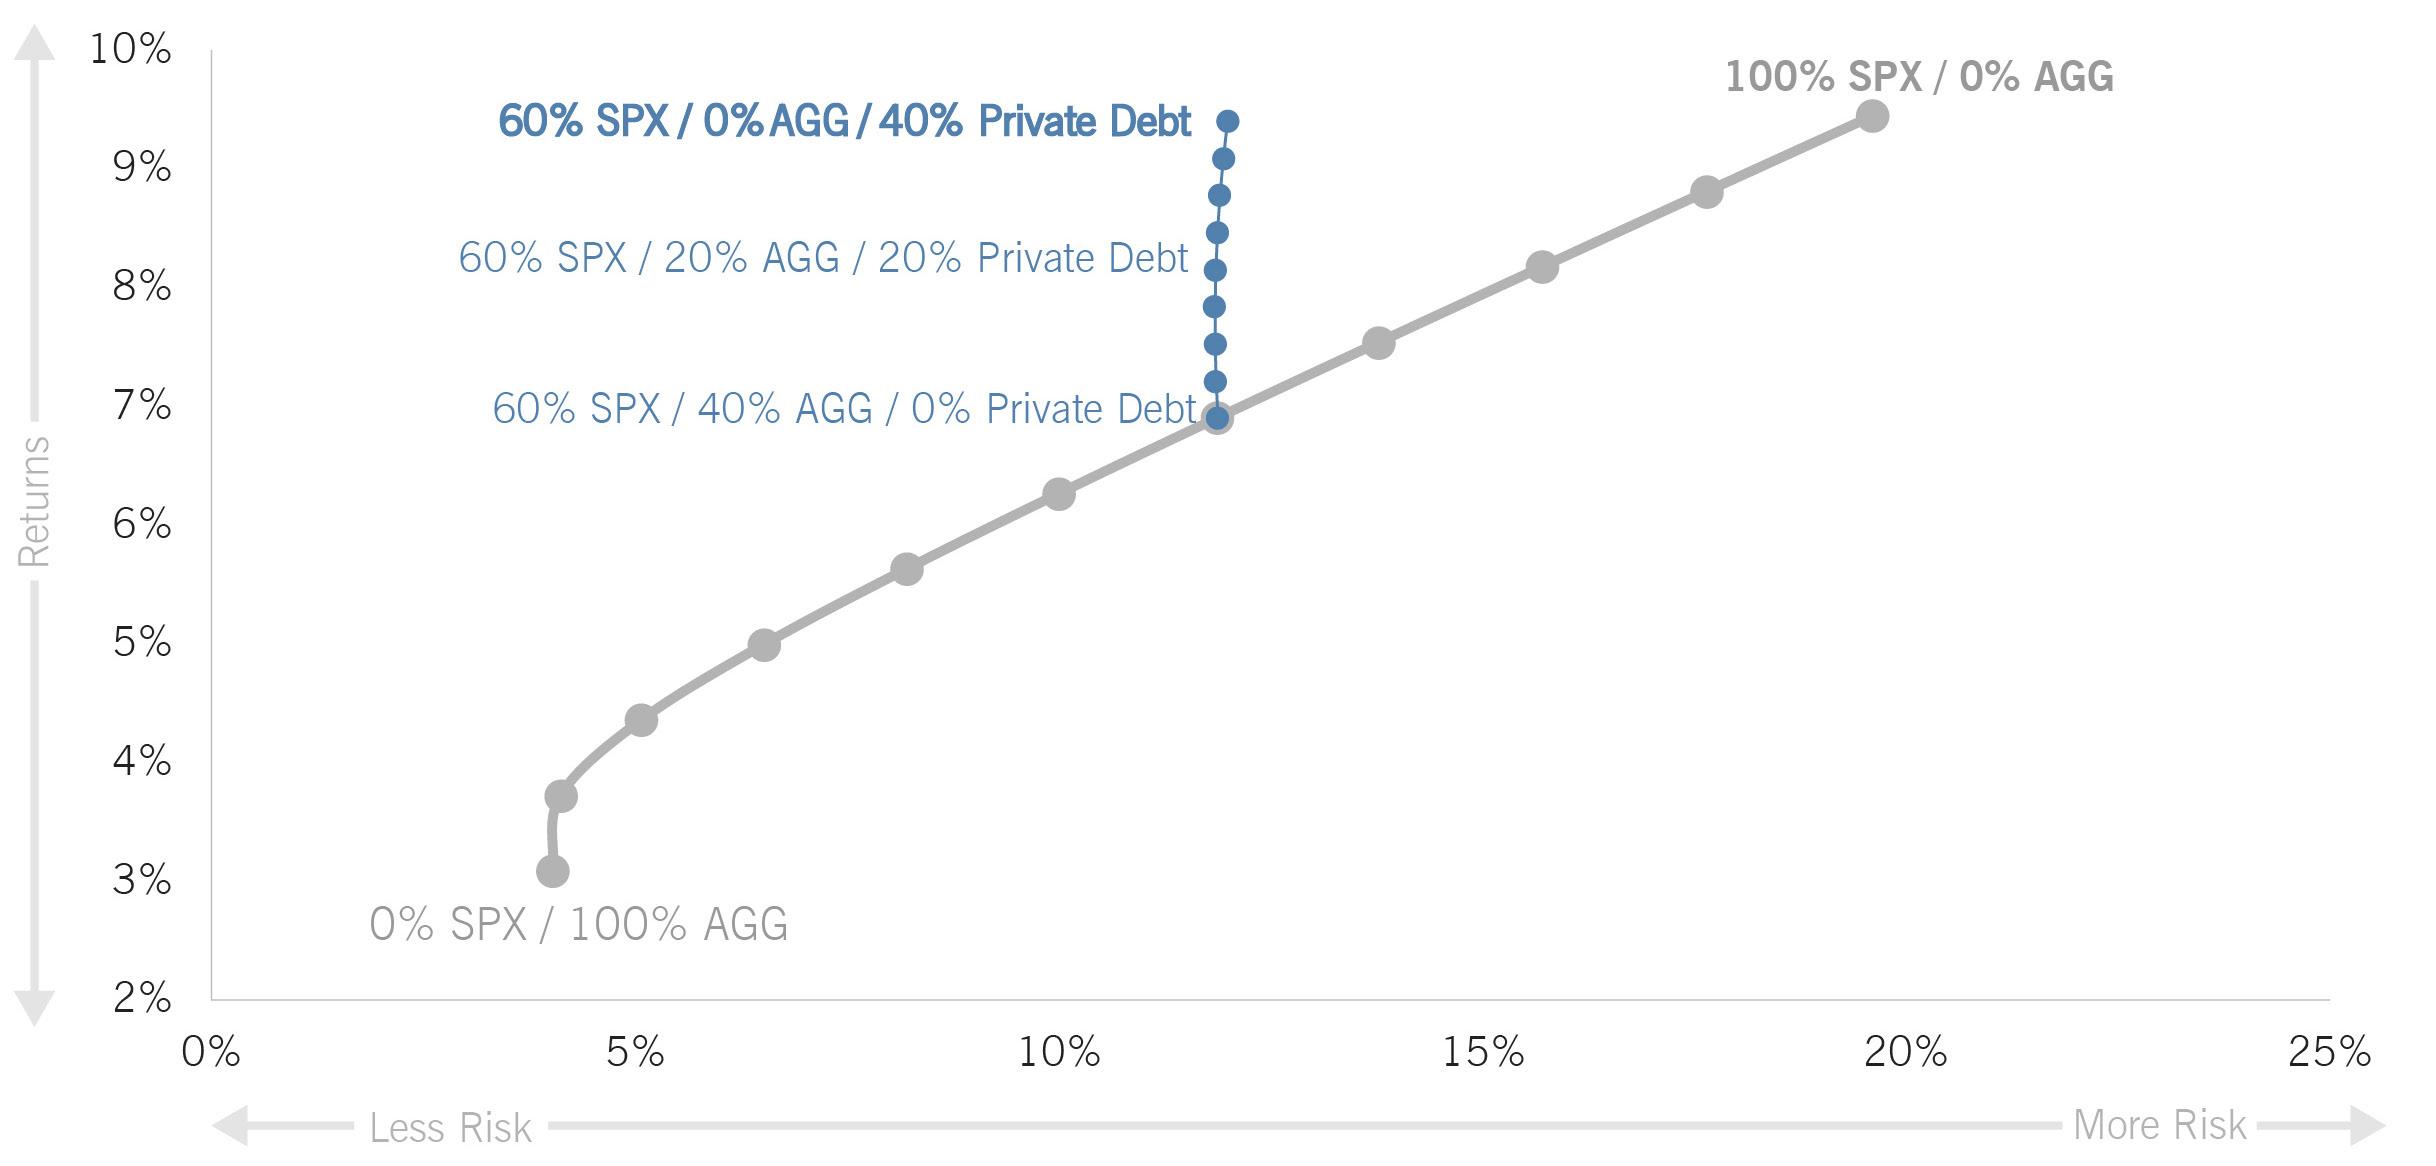
The traditional 60% stock, 40% bond (60/40) portfolio, which has remained largely unchanged for more or less the past 50 years, is overdue for an enhancement. Flaws in the “efficient frontier” have emerged, making the 60/40 portfolio no longer the most optimal portfolio per unit of risk. The original study advocating for the 60/40 portfolio used treasuries as the fixed-income portion of the portfolio, and many investors use investment-grade bonds. Both have seen extended drawdowns in 2022. Additionally, as seen in the recent crisis, the correlation between stocks and bonds can change over time.
By introducing additional asset classes, such as private debt, into the asset allocation portfolio, it becomes feasible to create a portfolio that is more “optimal” from a riskreward framework. This supplementation allows for a more diversified and balanced investment approach, potentially yielding better results in today’s financial landscape.
Adding Private Debt into the Old “60/40”
bayntree.com Bayntree Wealth Advisors | 9
Source: Bloomberg, Redwood. “Private debt” is represented by the Cliffwater Direct Lending Index (CDLI). Data as of 7/26/2023. Date Range from 9/30/2004 – 3/31/2023.
Adding private debt to a traditional portfolio of publicly traded securities can enhance efficiency.
Liquid Public Bonds vs. Less Liquid Private Debt

With our RiskFirst ® approach, we prioritize drawdown risk and management. This means we view all investment options through the lens of potential capital loss.
In the market downturns of 2008 and 2020, investment-grade bonds displayed resilience by absorbing much of the selling pressure in broader markets. Their limited drawdown and widespread accessibility made them a favored choice in riskmanaged asset allocations. However, in 2022, they faltered as a volatility damper due to heightened duration risk and increased correlation with stocks, resulting in simultaneous declines. This change in behavior caused portfolios like the 60/40 to experience a significant 23% decline, with the AGG dropping 16% during this period. Instead of mitigating volatility as expected, investors were hurt by bonds exacerbating the damage.
Despite their solid creditworthiness and absence of defaults, the aggressive sell-off of publicly traded investment-grade bonds highlights the inherent risk of liquidity as a doubleedged sword. While liquidity enables easy conversion into cash, it also means everyone has the same ability to sell rapidly during market downturns, leading to significant downward pressure on otherwise fundamentally sound assets. In contrast, private debt, as a non-traded security, offers stability during bear markets due to limited liquidity and reduced vulnerability to mass selling pressures. Including private debt in a well-structured portfolio can provide resilience and more effective risk management, navigating market fluctuations with greater stability and long-term potential.
Less Liquid, Less Volatility Maximum Drawdowns
Sources:
Bayntree Wealth Advisors | 10
bayntree.com
Bloomberg, Redwood. Data as of 6/30/2023. Past performance is not indicative of future results. Volatility is measured by standard deviation. “Private lending” is represented by the Cliffwater Direct Lending index (CDLI). “Leveraged loans is represented by the S&P/LSTA leveraged loan index. “High-yield bonds” is represented by the Bloomberg U.S. high yield index. “Investment grade bonds” is represented by the Bloomberg U.S. aggregate bond index. “Private lending*” for the period from Jan 1, 2021 to June 2, 2023 are represented by the Carlyle tactical private credit fund, which was chosen due to 1) limited data available for the CDLI and 2) only publicly traded fund for private credit. For information purposes only. An investor can not invest directly in an index. For investment professionals only. Not for retail public distribution. There is no guarantee that any objective can be met.
Why Do We Focus on Risk?
Performance reports often boast impressive one-year, three-year, or five-year returns, but these time periods can be deceiving. While short-term gains may seem remarkable, zooming out reveals the potential for a completely different narrative. We call this phenomenon terminal point bias. It’s essential to remember the timeless adage: past performance cannot predict future outcomes.

Additionally, the performance itself is only one-half of the equation. A great performance can come with great risks,
and many investors, especially those near retirement, cannot afford such risks. Investors should not only focus on the typical measure of risk, i.e., volatility, but also incorporate drawdown into their investment decisions. Drawdowns help investors determine the greatest loss they are willing to tolerate and work in conjunction with the math of loss to give investors an idea of how long it may take for their portfolios to recover. As investors may recall, taking distributions amid a drawdown further inhibits the recovery of a portfolio.
“Lost Decades” since 1928
bayntree.com Bayntree Wealth Advisors | 11
Source: Bloomberg, Redwood. Data as of 5/25/2023. Date Range from 1929-2023.
S&P 500 Index
Portfolio Recap
In the second quarter of 2023, we saw continued elevated portfolio activity in response to market movements. Our investment portfolios combine strategic long-only beta with active risk-managed strategies. These active risk-managed strategies can allocate predominately to cash or cash alternatives in a “defensive” position. They utilize a quantitative research process designed to respond to markets with potentially heightened risk.


The ensemble of multiple diversified strategies helps moderate risk in the overall portfolio toward their drawdown objectives while still attempting to participate in most market appreciation.
While we entered the quarter with a higher defensive position, market stability in response to lower inflation and unsurprising Federal Reserve rate hikes led us to end the quarter fully invested.
We believe a higher interest rate environment can provide some extra benefits to actively risk-managed strategies. While in defensive positions, allocating to cash & cash alternatives such as short-term treasuries pay a higher yield. For example, U.S. 3-Month Treasury Bills have a rate close to 5.25% as of 7/26/23.
Dynamic Shifts in DRB
bayntree.com Bayntree Wealth Advisors | 12
Tactical Risk-Off Long IG Fixed-Income Long HY Fixed-Income Long Equity
Mulholland 300 Mulholland 300 Mulholland 300 Mulholland 300
Source: Bloomberg, Redwood. Data as of 6/21/2023. Please see additional disclosures at the end of this commentary for more information.
Investing can seem complicated. But the goal is rather simple: getting the most capital appreciation per risk. Our focus on minimizing drawdown risk is for this purpose and the math is straightforward. The greater the loss, the greater the returns are needed to break even and appreciate. For example, as the table, “Math of Loss” shows, the tech heavy NASDAQ Composite Index with a 33.53% short-term performance. Although impressive, it still lags other investments that have taken a much smaller drawdown.

Math of Loss
Source: Bloomberg, Redwood.
*Hypothetical simulation of growth based on index. For illustration purposes only. No actual account was traded. An investor cannot invest directly in any of the above indices. Past index performance is not a guarantee of future results.”
bayntree.com Bayntree Wealth Advisors | 13
Conclusion
Our focus will always be on creating solutions centered around drawdown and mitigating downside risk. Introducing private debt into our engineered asset allocation portfolios can potentially enhance return, and, more importantly, limit drawdown risk.

With its benefits, why haven’t more investors adopted private debt into their investment portfolios? A major reason is that historically, private debt was very difficult to access – investors needed to be accredited, and most private debt funds were partnerships that required paper subscriptions. This made it more difficult to add private debt into portfolios in the same way as a mutual fund or ETF.
With innovations, private debt can now be accessed by all investors as a single ticker like a mutual fund. The tradeoff, however, is partial liquidity. Private debt closed-end interval funds, for example, have quarterly liquidity. Yet the benefits may outweigh the cons. A small inclusion in a 60/40 can help drive additional return while dampening volatility, even with the sacrifice of some limited liquidity in the portfolio.
Adapting to new markets is a never-ending process of constant growth and improvement. It requires the rejection of complacency, a willingness to embrace the unknown, the desire to challenge assumptions, and the ability to let go of the familiar.
Finding Alpha In Private Debt
*Both
Source:
bayntree.com Bayntree Wealth Advisors | 14
portfolios assume $1 Million starting value, with $60k annual distribution taken monthly and adjusted for inflation (3%). Rebalances back to target weights are done quarterly. The partially liquid portfolio assumes a 20% position in an illiquid asset that can only be traded quarterly and thus the monthly distributions are taken from the liquid portion of the portfolio.
7/26/2023.
Range from 1/1/2011 – 3/31/2023. 60% S&P 500 /40% Bloomberg U.S. Aggregate Bond Portfolio (Fully Liquid Portfolio) 60% S&P 500/ 20% Bloomberg U.S. Aggregate / 20% Private Debt (Partially Liquid Portfolio)
Bloomberg, Redwood. “Private debt” is represented by the Cliffwater Direct Lending Index (CDLI). Data as
of
Date
General Disclosures
The market commentary is for informational purposes only and should not be deemed as a solicitation to invest or increase investments in Bayntree Wealth Advisors (‘Bayntree’) products or affiliated products. The information contained herein is not intended to provide any investment advice or provide the basis for any investment decisions. Please consult a qualified professional before making decisions about your financial situation. Information and commentary provided by Bayntree are opinions and should not be construed as facts. There can be no guarantee that any of the described objectives can be achieved. Past performance is not a guarantee of future results. Information provided herein from third parties is obtained from sources believed to be reliable, but no reservation or warranty is made as to its accuracy or completeness.
Diversification of asset class or investment style does not guarantee against loss or outperformance. Different types of investments involve varying degrees of risk and there can be no assurance that any specific investment will be profitable. Any individual securities shown are not a recommendation to buy or sell. Any funds shown will have different investment objectives and strategies and are for illustration purposes only and is not a statement of equal comparisons. The price of any investment may rise or fall due to changes in the broad markets or changes in a company’s financial condition and may do so unpredictably. Bayntree does not make representations that any strategy will or is likely to achieve returns similar to those shown in this presentation. Please speak to an advisor before investing any strategy shown within. Indices are shown for informational purposes only; it is important to note that Bayntree’s strategies differ from the indices displayed and should not be used as a benchmark for comparison to account performance. While the indices chosen to represent broad market performance of each asset class, there are report limitations as to available indices and blends, which index can be selected, and how they are presented. Portfolios are sub-advised by Mulholland Wealth Advisors, LLC, (“Mulholland”) an unaffiliated investment advisor registered with the SEC. Such registration does not imply a certain level of skill or training and no inference to the contrary should be made. Please refer to Mulholland’s Form ADV Part 2A (“Brochure”) for more information. RiskFirst® is a registered trademark of Redwood Investment Management, LLC. (“Redwood”), which is an affiliate of Mulholland. Dynamic Risk Budgeted (DRB) and Engineered Risk Budgeted (ERB) portfolios are proprietary to Redwood.
Definitions and Indices
Federal Reserve (Fed) is the central bank of the United States that raises or lowers interest rates. Inflation is a decrease in the purchasing power of money, reflected in a general increase in the prices of goods and services in an economy. Drawdown is a measure of peak to trough loss in a given period; a maximum drawdown is a measure of the maximum peak to trough percentage loss in a given period. S&P 500 Index is a stock market index based on the market capitalization of 500 leading companies publicly traded in the U.S. Stock market, as determined by Standard & Poor’s. 60/40 refers to 60% S&P 500 and 40% Bloomberg U.S. Aggregate Index. Bloomberg U.S. Aggregate Bond Index consists of investment-grade U.S. Government bonds, investment grade corporate bonds, mortgage pass-through securities, and asset-backed securities. It is often considered representative of the U.S. investment-grade fixed rate bond market. Nasdaq Composite is a market capitalization weighted index comprised of approximately 3,000 common equities listed on the NASDAQ stock exchange. Mega-Cap Companies are those with market values well above the rest of the market, with valuations of over $200 billion. Tech Bubble, also known as the dotcom or internet bubble, was a rapid rise in U.S. technology stock equity valuations fueled by investments in internet-based companies during the bull market in the late 1990s. During the dotcom bubble, the value of equity markets grew exponentially, with the technology-dominated Nasdaq index rising from under 1,000 to more than 5,000 between the years 1995 and 2000. In 2001 and through 2002 the bubble burst, with equities entering a bear m. “Big 7” refers to large mega cap companies consisting of Apple, Tesla, NVIDA, Microsoft, Alphabet, Meta, and Amazon. The MSCI ACWI Index is a free float-adjusted market capitalization weighted index that is designed to measure the equity market performance of developed and emerging markets. The Citi World Gov’t Bond Index is a total-return index including sovereign bonds from developed and emerging markets. The Consumer Price Index (CPI) is used to measure the change in prices that consumers pay for goods and services over time. This data is aggregated by the U.S. Bureau of Labor Statistics. The Producer Price Index (PPI) is a family of indexes that measures the average change over time in selling prices received by domestic producers of goods and services. PPIs measure price change from the perspective of the seller. This contrasts with other measures, such as the Consumer Price Index (CPI), that measure price change from the purchaser’s perspective. Sellers’ and purchasers’ prices may differ due to government subsidies, sales and excise taxes, and distribution costs. Personal Consumption Expenditures (PCE) includes a measure of consumer spending on goods and services among households in the U.S. The PCE is used as a mechanism to gauge how much earned income of households is being spent on current consumption for various goods and services. U.S. 10-Year Real Yield is the difference between the U.S. 10-Year Treasury yield and the U.S. 10-Year breakeven rate, which is used as an estimate of the true yield of a bond after adjusting for inflation. Investment-Grade Bond is a bond with a credit rating of BBB- or higher by Standard & Poor’s or Baa3 or higher by Moody’s. It is judged by the rating agency as likely enough to meet payment obligations that banks are allowed to invest in it. 2008 Great Financial Crisis was a severe worldwide economic crisis that occurred in the early 21st century and is widely regarded as the most serious financial crisis since the Great Depression. The Morningstar LSTA US Leveraged Loan Index is a market-value weighted index designed to measure the performance of the US leveraged loan market. The Bloomberg US Corporate High Yield Bond Index measures the USD-denominated, high yield, fixed-rate corporate bond market. Securities are classified as high yield if the middle rating of Moody’s, Fitch and S&P is Ba1/BB+/BB+ or below. The Cliffwater Direct Lending Index seeks to measure the unlevered, gross of fee performance of US middle market corporate loans, as represented by the asset-weighted performance of the underlying assets of Business Development Companies that satisfy certain eligibility criteria. The CDLI Total Return Index includes three components: Income Return, Realized Gain/Loss, and Unrealized Gain/Loss. Private debt refers to loans that are usually provided by non-bank investors to borrowers. Private debt is an alternative form of financing that companies can use to raise capital for various purposes such as funding growth, expanding working capital, or financing real estate development. Tactical Risk-Off is allocation to cash or cash equivalents. Long IG Fixed-Income refers to risk position on investment graded fixed-income bonds. Long HY Fixed-Income refers to risk position on high-yield fixed-income bonds. Long Equity refers to risk position on equities. An investor cannot invest directly in an index. Unless otherwise noted, index returns reflect the reinvestment of income dividends and capital gains, if any, but do not reflect fees, brokerage commissions or other expenses of investing. Investors cannot make direct investments into any index.
Bayntree Wealth Advisors, LLC (‘Bayntree’) is an SEC Registered Investment Advisor. Such registration does not imply a certain level of skill or training and no inference to the contrary should be made. Bayntree’s advisory fees and risks are fully detailed in its Form ADV Part 2A (Brochure”), which is available upon request. This material may not be published, broadcast, rewritten or redistributed in whole or part without express written permission. Bayntree and Redwood are not affiliated.
Contact Us Bayntree Wealth Advisors 7001 N. Scottsdale Rd., #2055, Scottsdale, AZ 85253 480.494.2750 | bayntree.com

