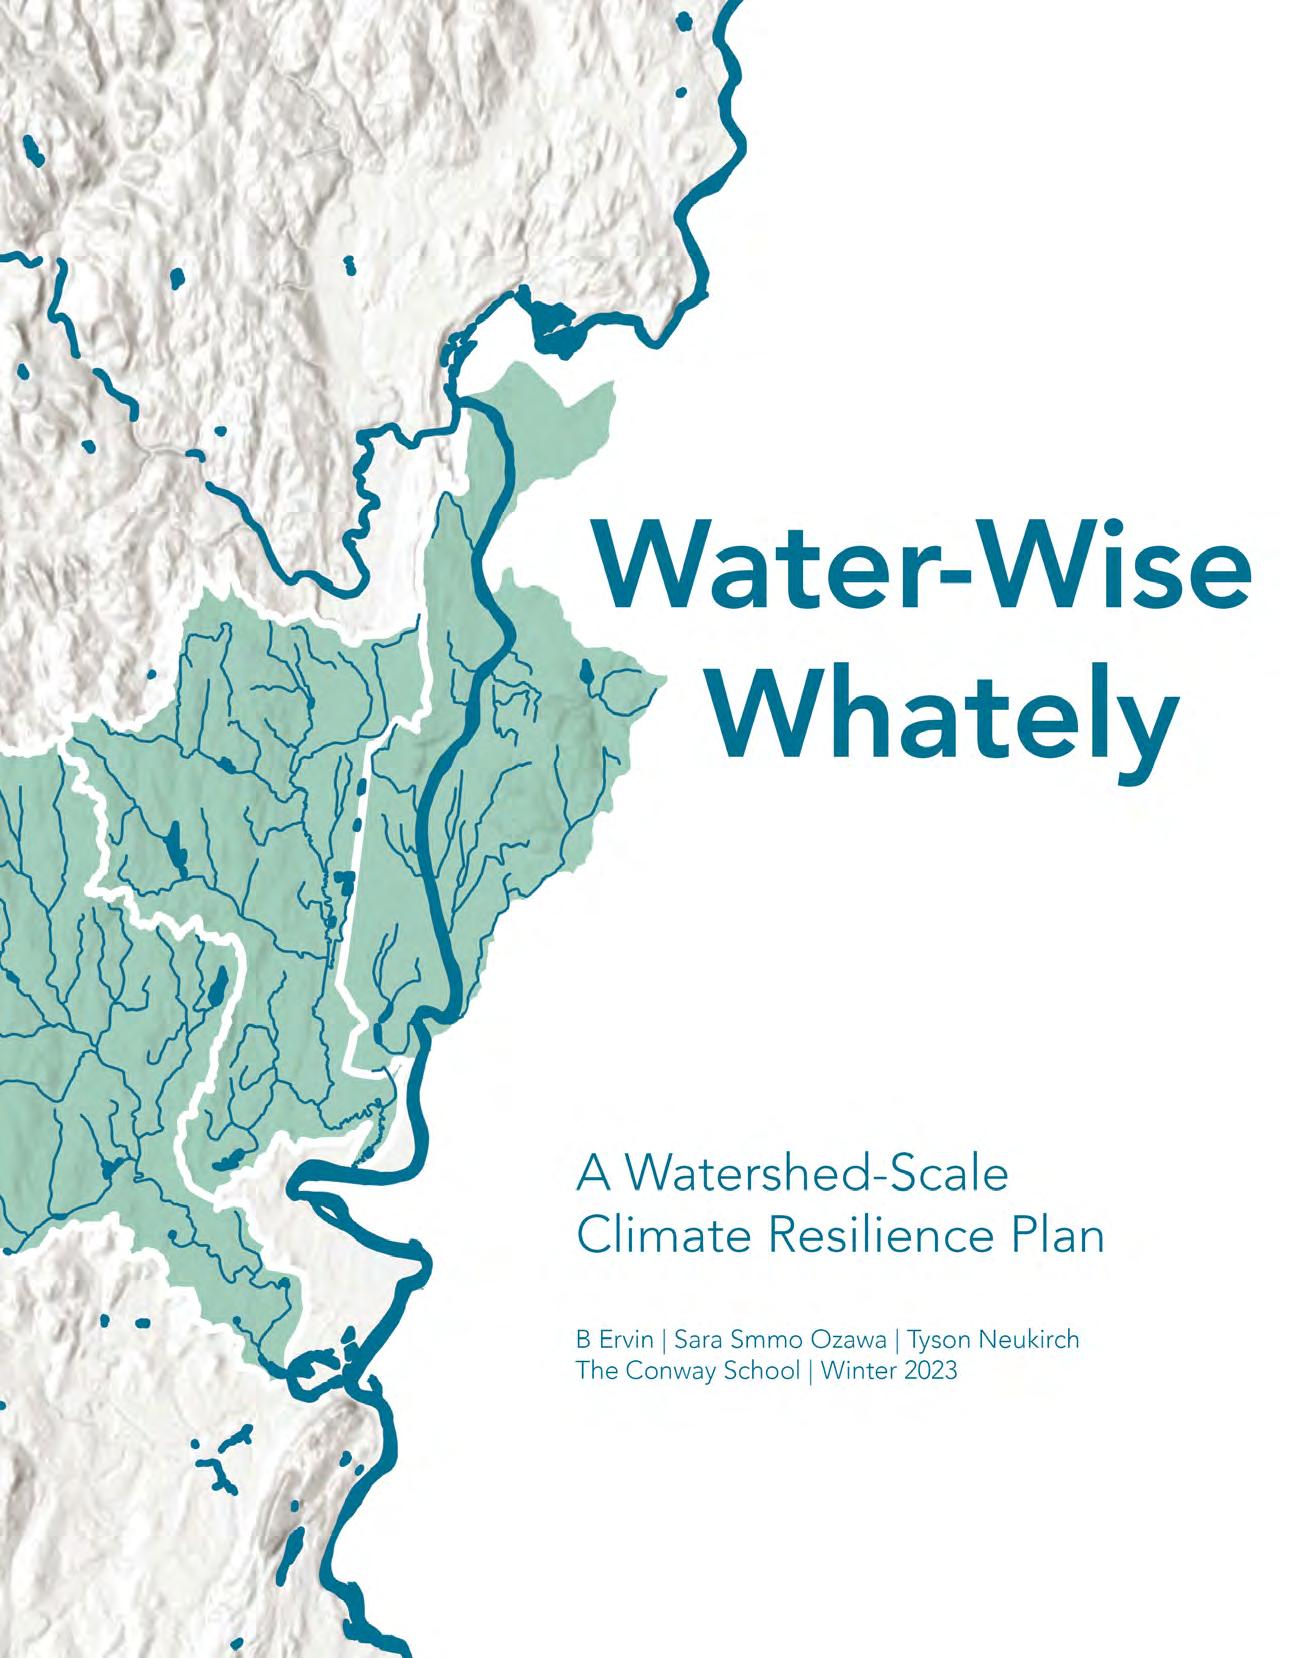
A Watershed-Scale Climate Resilience Plan
Prepared for the Whately Climate Resilience Planning Committee B Ervin | Sara Smmo Ozawa | Tyson Neukirch The Conway School Winter 2023 Water-Wise Whately
Acknowledgements
We are grateful to the members of the Whately Climate Resilience Planning Committee who shared their energy, local and professional insight, and time with us: Joyce Fortune-Palmer, Julie Wagonner, and Becky Jones. Thank you for collaborating with us on this endeavour, facilitating local connections, and supporting our learning process. We were also fortunate to have many insightful conversations with local community members and appreciate all of those people who took the time to share their expertise and perspectives with us. Thank you, community members of Whately!
The faculty at the Conway School provided invaluable support, guidance, instruction, generative questions, and opportunities for growth through reflection. Thank you, Ken Byrne, Kate Cholakis, Bas Gutwein, Kim Erslev, Anne Capra, and CJ Lammers for sharing your passion, curiosity, feedback and experience with us; we are lucky to be learning from you!
Funding for this project was provided by the Greenfield Savings Bank.

2 | Title | Section

Preface | Table of Contents | 3 TABLE OF CONTENTS EXECUTIVE SUMMARY INTRODUCTION 6 Indigenous Land 9 Project Introduction 10 Climate Change 12 Defining Resilience WATERSHED FRAMEWORK 16 Watersheds 101 18 Analysis Framework ECOLOGICAL CONDITIONS 22 Landscape Character 24 Physical Characteristics 30 Habitat & Wildlife 36 Land Cover & Land Use 48 Impaired Waters WATER USE 52 Drinking Water | Northampton & Deerfield 54 Whately’s Drinking Water 56 Whately’s Public W RECOMMENDATIONS 60 One | Conservation & W 82 Two | Ecosystem Management and Restoration 104 Three | Working at the Watershed Scale BIBLIOGRAPHY APPENDICES 124 A: Related Recommendations from Previous Plans 138 B: Map Data Sources & Processes 5 6 14 20 50 58 120 124
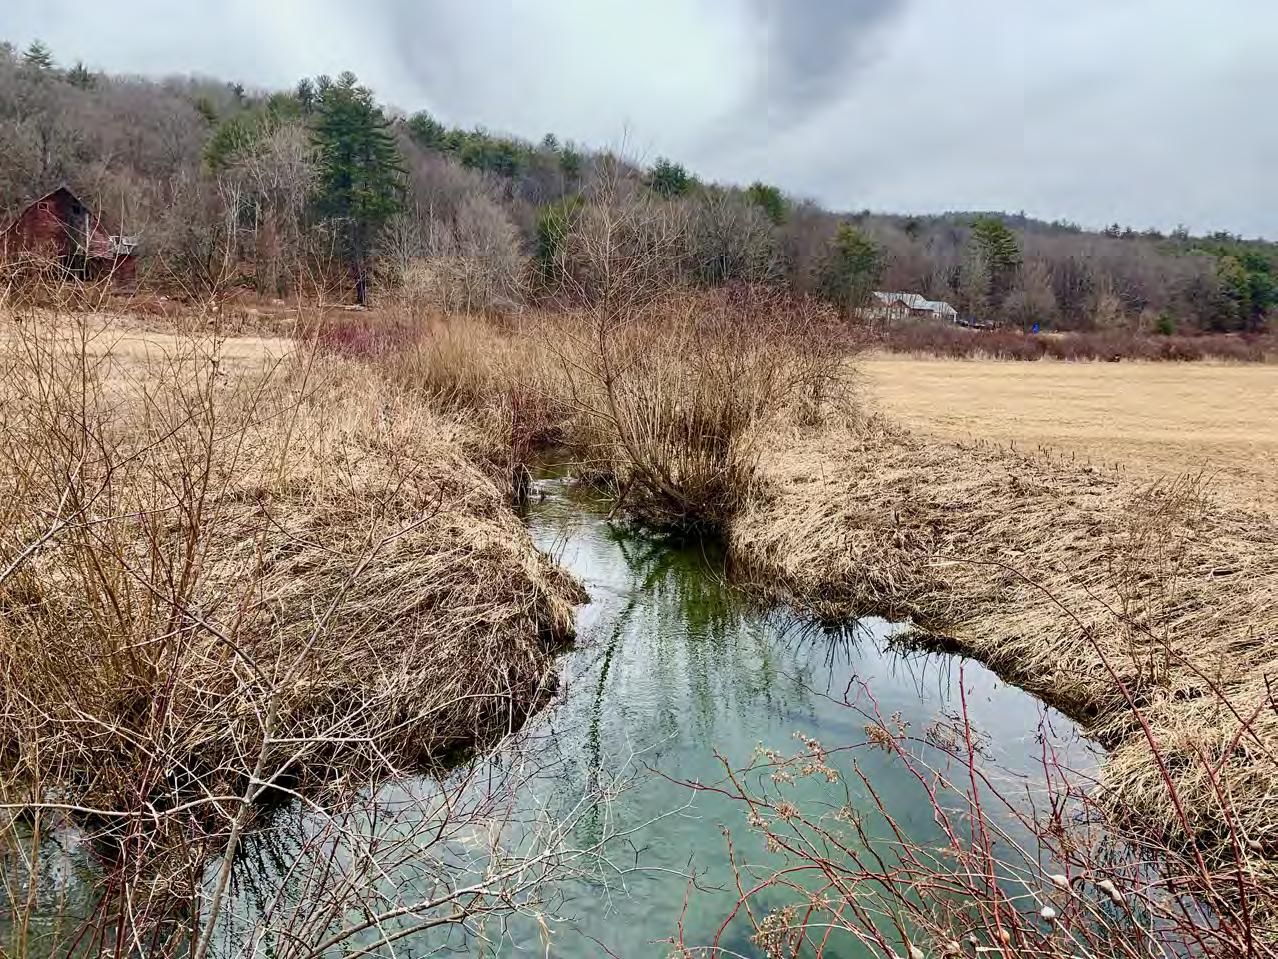
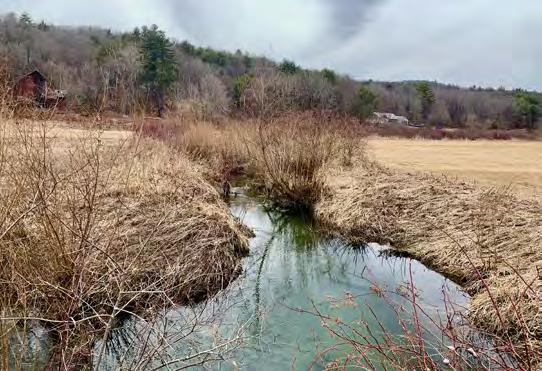
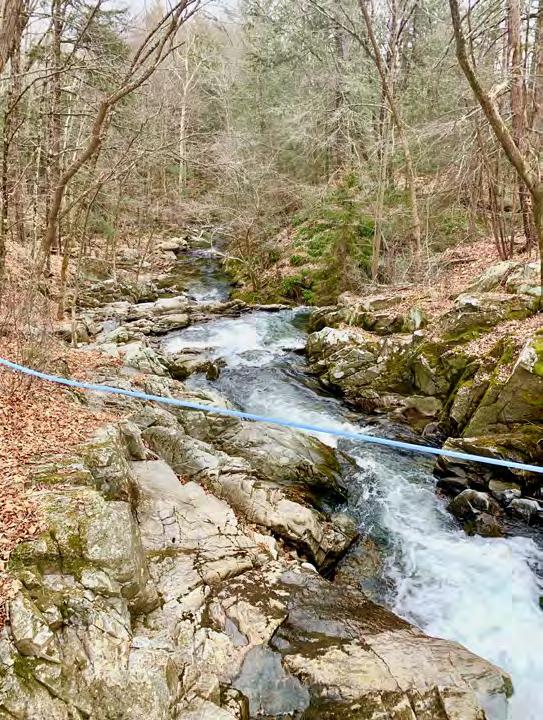
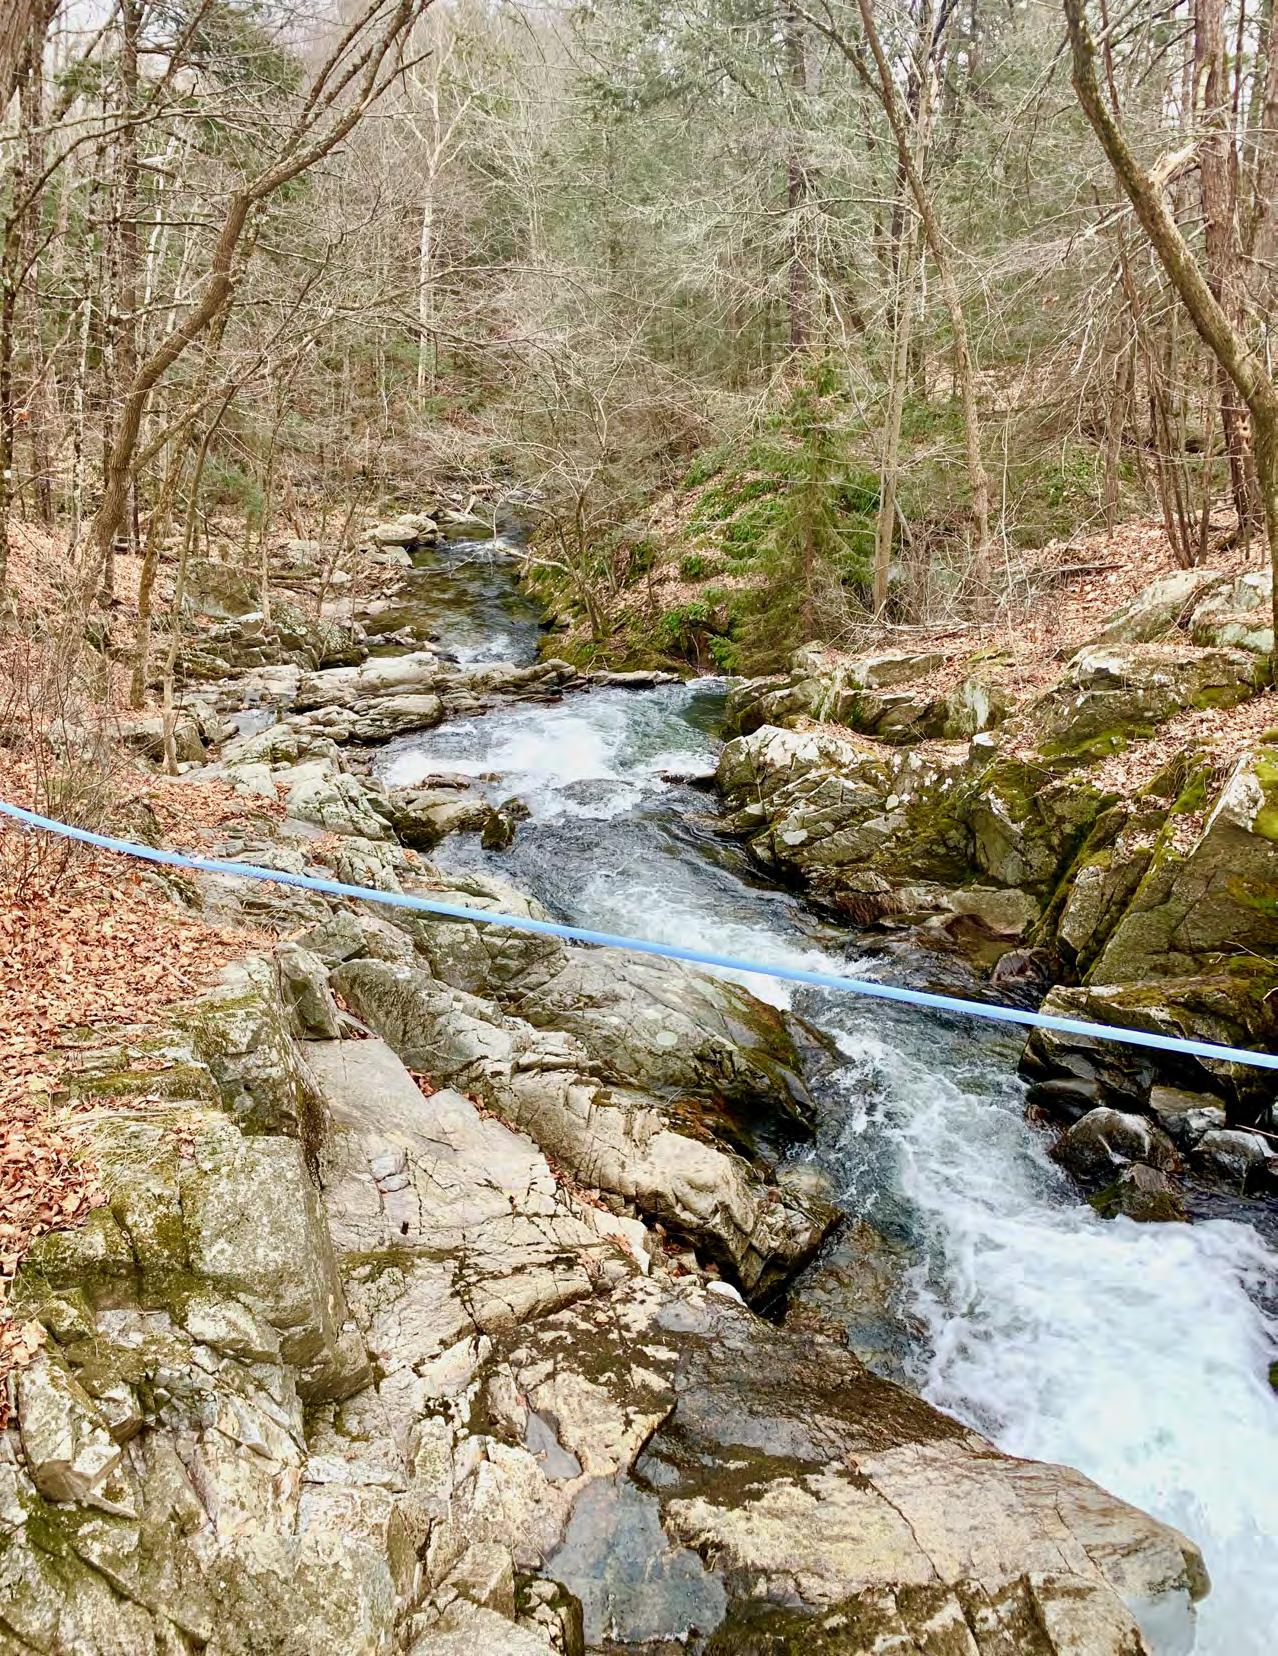 The West Brook flows under a maple sugar line in West Whately.
Executive Summary
The streams and rivers that flow through Whately and the reservoirs and aquifers in town not only make Whately a beautiful place to live; they also support the operation of farms and businesses in town and provide critical resources for human and nonhuman residents alike. Whately’s waterways provide beautiful views and places to swim, irrigate farms and supply drinking water, and are home to rare and endangered species.
At the same time that water in town is a strength and a precious resource, it is also vulnerable to forces like the changing climate and human development. The main climate impacts to Whately and the Connecticut River Valley identified by Massachusetts Executive Office of Energy and Environmental Affairs “include temperature extremes, changes in precipitation patterns, and consequent changes in the patterns of river flows, particularly in the Connecticut River and its network of tributaries” (Regional Climate Change Summaries).
Human development impacts water quality and interrupts the natural hydrologic cycle, too; impervious surfaces like roads and roofs block water from infiltrating where it falls, and concentrate, warm, and pollute runoff. Development and impervious surfaces also fragment the ecosystems that otherwise clean and regulate the flow of water across the landscape.
The vulnerability of Whately’s water systems makes Whately’s inhabitants vulnerable, too. Massachusetts was in a drought for much of the summer of 2022. In Whately, farmers spent more money than usual working to irrigate fields, and lost crops to thirsty birds who turned to peaches and berries in lieu of their usual drinking sources. Public water supplies had to be limited and a handful of private wells ran low or dry. Weeks later, when heavy rains came to the valley, rivers in West Whately flowed quick and high, eroding river banks and washing sediment from sloping dirt roads into streams. Across town, water pooled and stagnated in the flat, poorly drained soils in the agricultural fields of East Whately. Droughts and floods disrupt both daily life and economic stability in town.
The more vulnerable the water systems in Whately are, the more vulnerable the people in Whately are to the waterrelated impacts of climate change. The more conventional development happens in and around Whately, the more vulnerable water systems are likely to become. These factors can amplify one another in a negative feedback loop. They can also, however, be harnessed to support one another in a positive feedback loop, where as water in Whately becomes more resilient in the face of climate change, so do its people.
This climate resilience plan focuses on water out of a recognition that water is not only a key asset, but also a potential hazard for the town of Whately. Climate resilience is the ability of communities and systems to absorb the stresses caused by climate change while maintaining critical functions; further, climate resilient communities can adapt, reorganize, and evolve in ways that leave them better prepared for the future impacts of climate change. Water resilience applies this broader definition of resilience to the combination of aquatic ecological systems, community governance structures, and engineered water infrastructure necessary for a community to thrive.
This plan offers three main recommendations for building a water resilient Whately. The first recommendation is to pair land conservation with water-wise development. Land conservation is a key tool in protecting water system health because natural ecosystems like forests and wetlands provide services like cleaning water and mitigating flooding and drought. Factors like the statewide housing shortage and climate migration make it seem possible that Whately will face some amount of development pressure in the coming decades. Pairing conservation with waterwise development is a strategic way to accommodate this potential growth.
The second recommendation is to manage and restore landscapes across scales for water resilience. In many cases, simply conserving land is not enough; actively managing and restoring lands like riparian buffers, agricultural fields, forests, and stream crossings is necessary in order for them to function to the best of their ability. Enacting management and restoration at multiple scales maximizes the ability for diverse actors in town, from private landowners to municipal staff, to participate in building water resilience.
The third recommendation is to analyze and manage the health of Whately’s waters at the watershed scale. Since water flows across landscapes with a disregard for municipal boundaries, much protection of water quality and water system health happens at the watershed scale rather than at the town or city scale. Analyzing, and protecting, water health within a watershed allows for more accurate identification of issues, promotes a holistic and interdisciplinary approach, and can facilitate intertown collaborations that make efficient use of limited time and funding.
This plan aims to lay a foundation for current and future residents of Whately and Whately’s watershed to support, and be supported by, the glittering waters that wind their way through the landscape for generations to come.
Preface | Executive Summary | 5
Whately is on Indigenous Land
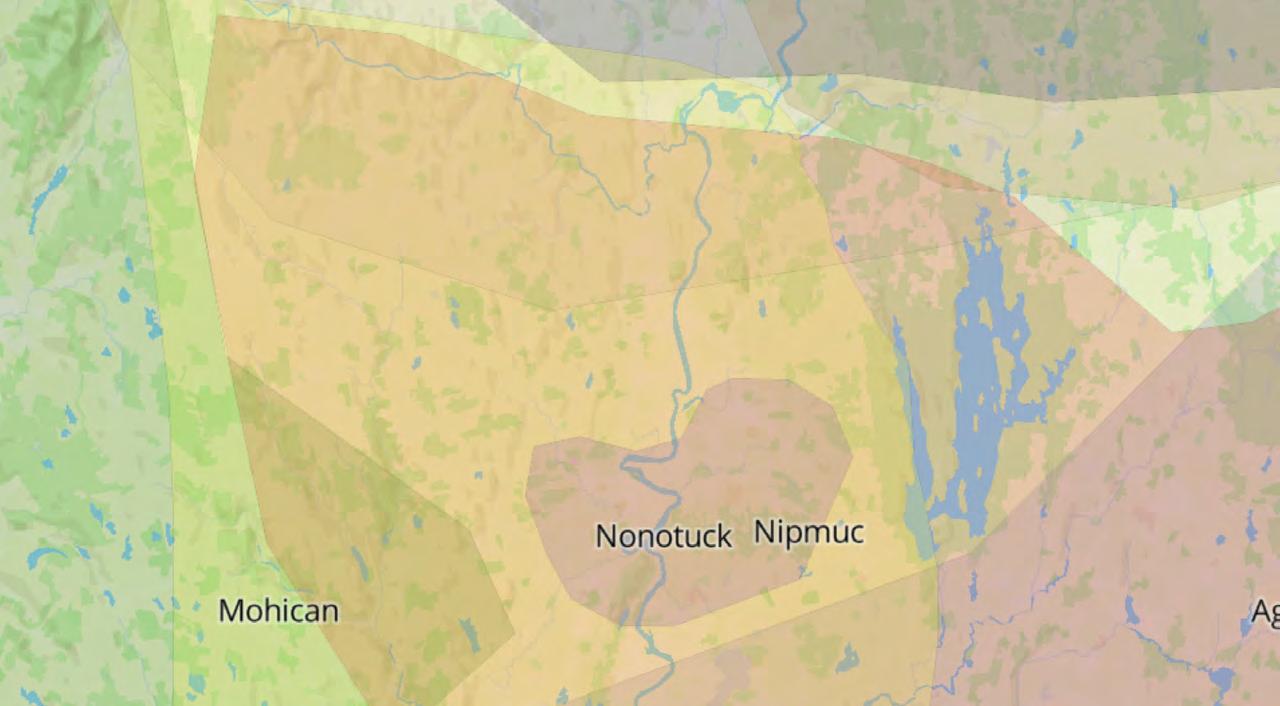
Whately sits on the land of the Nipmuc, Nonotuck, and Pocumtuc people. Margaret M. Bruchac writes about the histories of Indigenous people in the area in her work for Historic Northampton’s website. Archaeological evidence reveals the presence of Indigenous people along the Connecticut River, known to native people as the Quinneticook or Kwinitekw (“long river”), since at least the retreat of the last glacial coverage in the area, around 10,000 years B.C.E.
There were multiple distinct Native communities who lived along the fertile land of the region’s rivers who were interconnected with one another through trade, diplomacy, and kinship. The Nipmuc, Nonotuck, and Pocumtuc people are all “Algonkian,” which includes all of the Native peoples of present-day New England, parts of southern Quebec, and the Great Lakes area. Their language is called “Algonquian,” which is a linguist group that encompasses multiple dialects (Bruchac, “Nonotuck Histories Essay”).
Settler Colonization
English settlers came to the Connecticut River Valley in the 1600s, and by a hundred years later, had made it too violent for Native inhabitants of the area to live safely in their homelands. At first, leaders of indigenous communities in the area thought it would be useful to have some English trading outposts in the area and build diplomatic relationships with them to avoid them becoming potential enemies. Bruchac describes the posture of Native nations towards English colonists: “Native nations were interested in intercultural trade and diplomacy, but they also expressed a sense of independence and autonomy, and stood ready to resist colonial exertions of power as needed” (“Nonotuck Histories Essay”).
Land-Stealing Tactics
For the first half of the seventeenth century, Pocumtuc, Nipmuc, and Nonotuck communities engaged in trade and diplomatic relationships with English settlers. But over time, settlers and the Massachusetts colony government used a variety of tactics to first take land from native communities and then to force them out of the region entirely. Early in the century, land agreements, which indigenous leaders viewed as shared-use agreements but which settlers viewed as purchases, were one way settlers took land away. Later, settlers would ask indigenous people the names of places they were living, and write the names of those places into deeds without their knowledge.
King Phillip’s War
By 1675, various individual acts of violence between settlers and members of native communities built to a boiling point which led to a rebellion across the region. Bruchac writes that Metacom, the Wampanoag sachem who was known to English settlers as King Phillip, “blamed the English for provoking this war by pressuring Native people to sell land, cheating them in bargains, crowding them out of their traditional territories, failing to honor agreements, and tricking them into drunkenness” (“Nonotuck Histories Essay”). The conflict, named King Phillips war, was bloody: at least 5,000 native people, both combatants and not, were killed, while more than 2,500 colonists died–about one third of the population at the time (Bruchac).
After King Phillips war, the diplomatic relationships that had existed, if tenuously, before, fully broke down. English colonists became increasingly suspicious of Native people and the General Court of Massachusetts passed a declaration offering bounties to white soldiers and volunteers for murdering or capturing native people. This meant that essentially any indigenous person living along the Connecticut River could be considered a hostile enemy combatant. In order to survive, Native people left the area and joined communities in Sokoki, Pennacook, or Saint Francis Abenaki territory to the north, or the Schaghticoke refugee area in present day New York.
Return
During the late 1700s and throughout the 1800s, indigenous families and individuals moved back to the area, either temporarily or permanently. By the mid 1800s, many native families lived on homesteads or in villages and practiced sedentary agricultural lifestyles. Others moved through various familiar homelands, tapping into still-available natural resources and old kinship networks (Bruchac).
Despite this history of violence and displacement, native people and communities continue to live in western Massachusetts today. The census does not report any native people currently residing in Whately. Official documentation of indigenous identity through the census can be complicated, however, and not necessarily the only indicator of where native people are living. The Nipmuc Nation is a state-recognized tribal nation with many members living in the Worcester area, and there are a number of indigenous-led organizations in Western Massachusetts, including the Native American Inter-Tribal Council of Western Massachusetts and the Ohketeau Cultural Center, working to preserve and build indigenous community, cultural practices, and sovereignty.
6 | Introduction | Indigenous Land
Whately
Whately
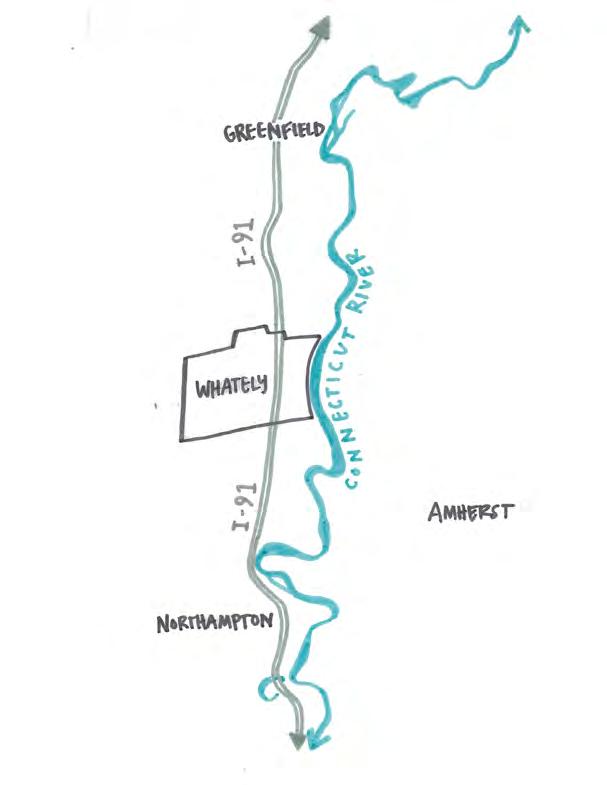
Whately is a small town in Western Massachusetts that lies along the western banks of the Connecticut River. It is home to a community of about 1,600 people who live in 700 households and has an average density of 82 people per square mile–about one tenth as dense as nearby Northampton (Census Reporter).
From Whately, it takes fifteen to twenty minutes to drive south to Northampton, east to Amherst or north to Greenfield. Its proximity to these social and economic hubs means that in addition to supporting a strong agricultural community, Whately is also a home for commuters working in universities, healthcare, and other industries beyond the town bounds (Whately Open Space Committee 3-17).
Introduction | Indigenous Land | 7
Source: Native Land Digital
Whately sits on the ancestral lands of the Nonotuck, Nipmuc, and Pocumtuc people.
Community Demographics
Whately is home to 1,660 residents working in a wide range of professions, including tradespeople, agriculturalists, health care workers, and professors.
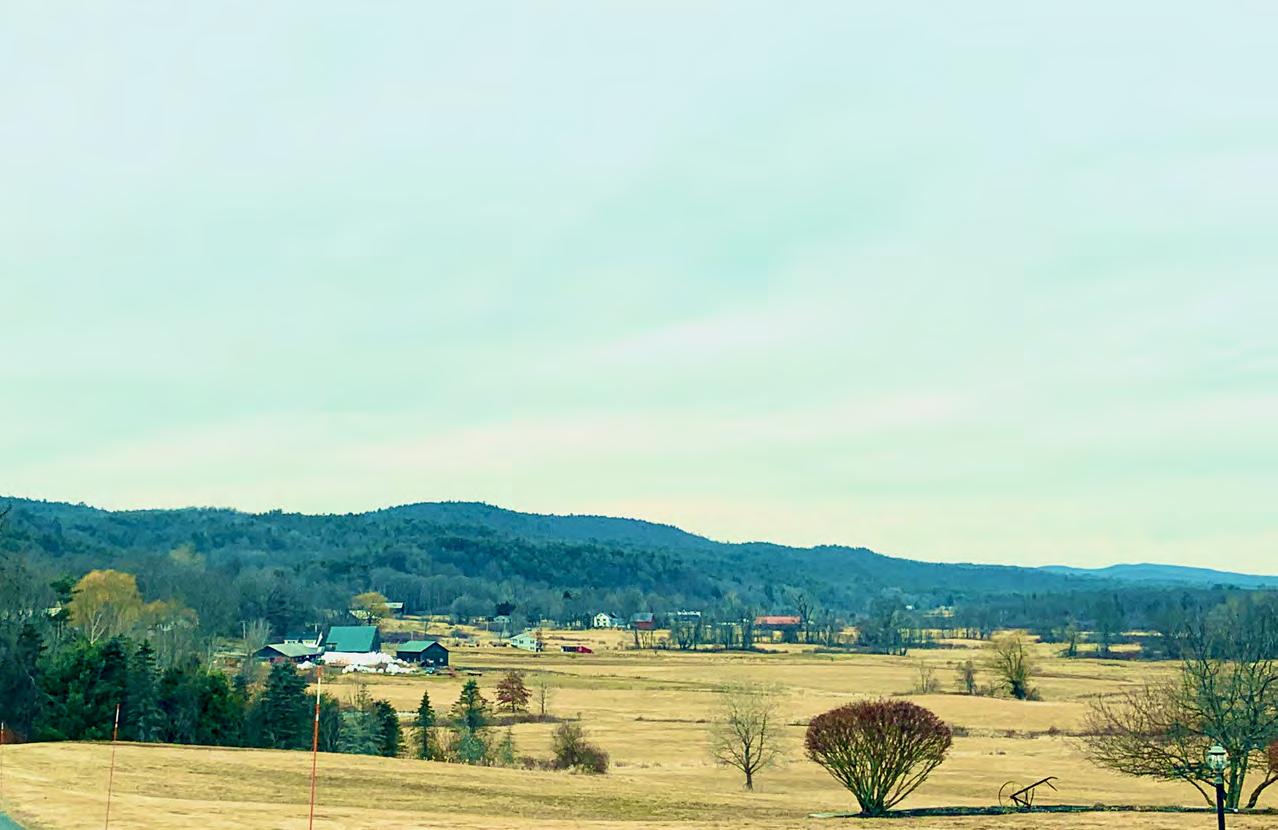
Commercial businesses, industrial enterprises, and agriculture are located in Whately, bringing 1,535 employees intow town--almost as many people as the population of Whately (Whately Open Space Committee). Meanwhile, 63.4% of residents commute over 20 minutes to jobs out of town and 9.3% work from home (U.S. Census Bureau).
Whately has a healthier tax base compared to other Massachusetts towns, with industry contributing 20%, private residences 79%, and open space 1% (Whately Open Space Committee). This ratio still places much financial burden on residents in Whately, who, according to other plans, desire more development in the other sectors to relieve the pressure property taxes pose on homeowners.
According to the most recent Census Data from 2021, Whately’s residents tend to be slightly more racially homogenous and have a higher income than the median of Franklin County as a whole.
U.S. Census Bureau 2021 American Community Survey Five-Year Estimates; U.S. Census Bureau 2015 American Community Survey Five-Year Estimates Selected Population Detailed Tables
8 | Introduction | Community Demographics
2021 POPULATION Franklin County Whately Median Age 47 46 % White (2015) 94% 96% Median Income $64,949 $88,533
Project Introduction
Whately has a number of highly engaged residents who work to steward the land, protect biodiversity and wildlife, support agriculture and businesses, and enhance the livelihoods of people in town. Whately’s town calendar is packed with committee meetings, and in the last several years, the town has completed an impressive number of planning processes including an Open Space and Recreation Plan (OSRP), a Hazard Mitigation Plan, and a Municipal Vulnerability Preparedness (MVP) Plan. In the fall of 2022, Whately’s Community Development Administrator reached out to the Conway School about continuing this planning work by developing a climate resilience plan.
During January, February, and March of 2023, the Conway School student team worked with Whately’s Climate Resilience Planning Committee to develop this document.
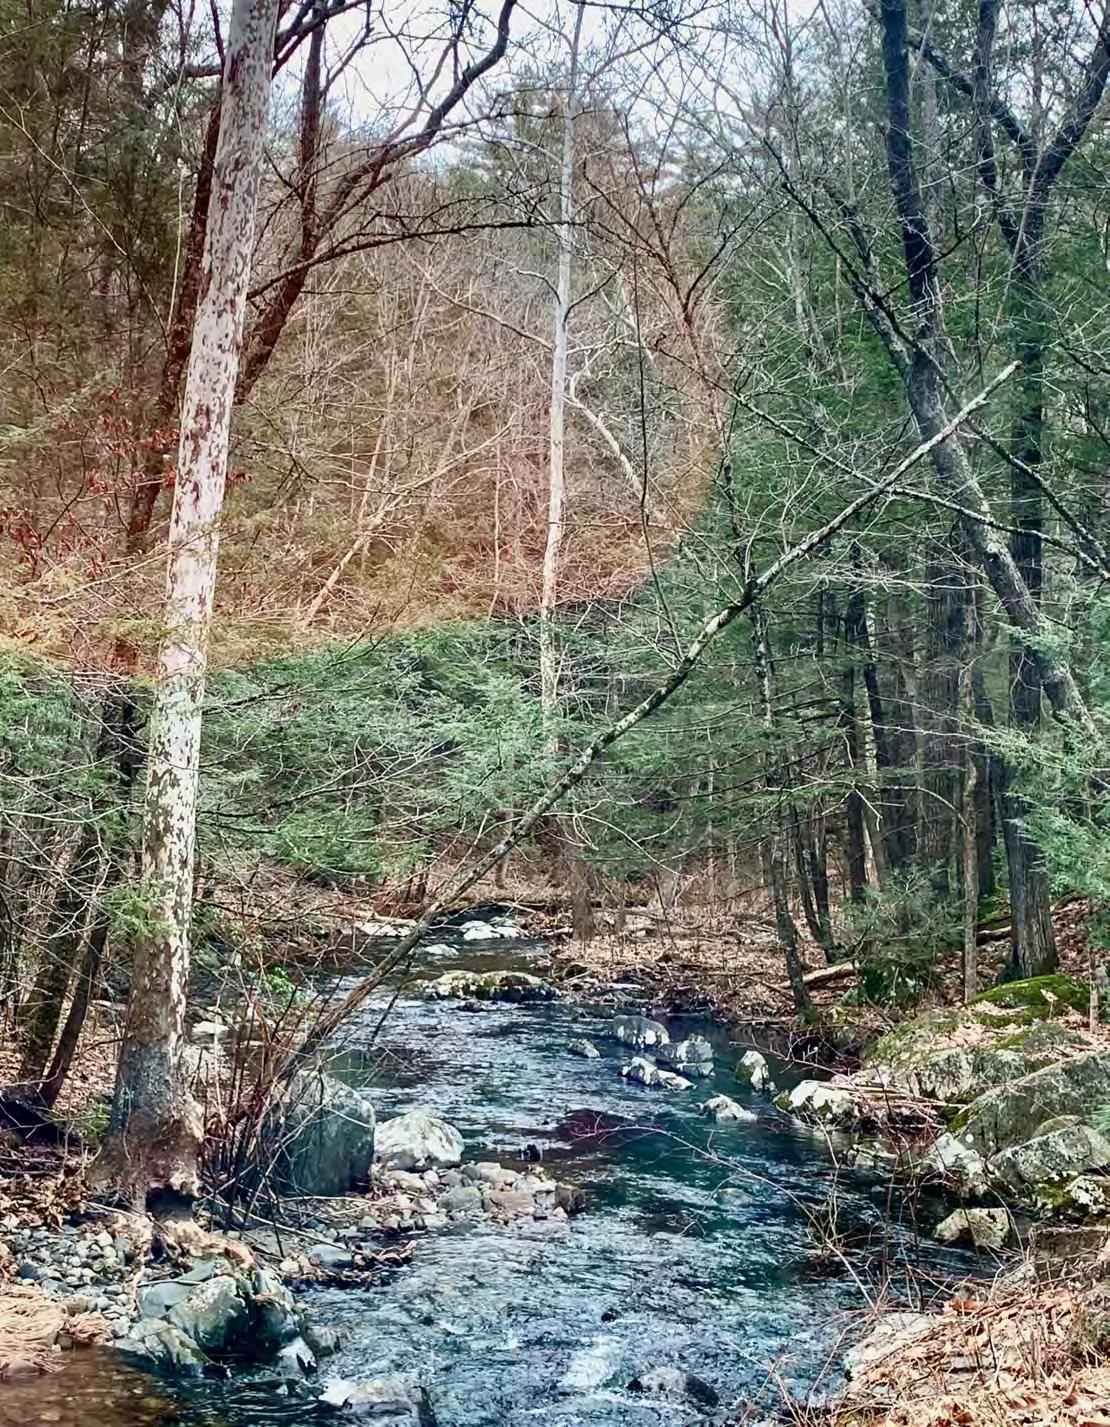
Climate Resilience Planning Project Goals
Explore the watershed-scale conditions affecting water quality and availability and identify recommended strategies to address areas of concern.
Identify where there are existing natural resources, ecosystems, and wildlife corridors that are worthy of long-term conservation but are not currently preserved or protected.
Explore how existing ecological systems and social conditions impact each other in Whately.
Identify and suggest climate change mitigation and adaptation strategies that stakeholders ranging from individual residents to municipal staff could enact.
Craft materials that can be used to support future grant applications for climate resilience project implementation.
Introduction | Project Intro | 9
Climate Change
While the impacts of climate change were, not too long ago, projections and hypotheses about a distant future, they are now a part of our everyday lives. Residents of Whately are already familiar with the major impacts of climate change on the region: these include rising temperatures and increased precipitation, paired with more floods, droughts, and extreme weather.
Observed
RISING TEMPERATURES
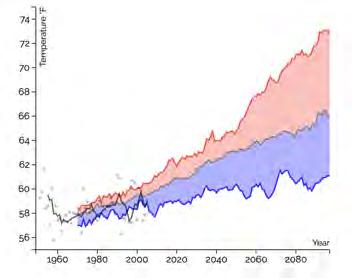
By mid-century, according to the Massachusetts Climate Change Clearinghouse, average temperatures will rise by 4 to 8 degrees Fahrenheit. The middle Connecticut River watershed will have 15 to 38 days per year with temperatures above 90 degrees F, compared to 2 to 12 days today (EEA “Projections Dashboard”).
Despite these rising temperatures making growing seasons longer, Massachusetts’ 2022 Climate Change Assessment names decreasing agricultural productivity as a key impact to Western Massachusetts. Rising temperatures will also threaten maple syrup production (Rapp et al.), increase the ability of invasive insects to survive through the winter and cause more damage to forests (Catanzaro et al. 5), and impact when snow melts and streams flow (EEA “Changes in Precipitation”).
Extreme heat days also increase heat-related visits to the emergency room and put seniors and children, especially, at risk of heat-related health problems (Massachusetts Department of Public Health - Bureau of Environmental Health).
EXTREME WEATHER
As warmer oceans provide more energy for storms, and warmer air increases rainfall rates, tropical storms/hurricanes and severe winter storms/nor’easters are on the rise in frequency and intensity (SHMCAP 4-209).
In August of 2011, Tropical Storm Irene dumped 10 to 15 inches of rain and caused power outages throughout much of the state for more than five days (SHMCAP 4-210). In Whately, Irene caused flooding and erosion along the Mill River.
Just a few months later, in October of that year, numerous power outages occurred and many secondary roads were closed as a result of fallen trees and power lines when “Snow-tober” hit.
PRECIPITATION CHANGES
Precipitation is expected to increase, which on the surface may sound like a relief, but much annual precipitation (12% to 30%) will fall as rain rather than snow, and precipitation will occur more sporadically, increasing both droughts and floods (EEA “Changes in Precipitation”).
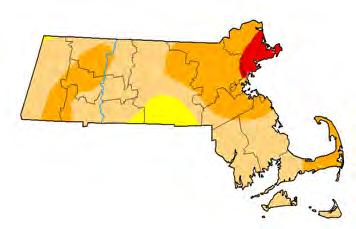
Massachusetts is expected to experience an increase in drought due to increased evaporation from warmer temperatures, alterations in the timing and amount of streamflow following reductions in snowpack, and changes in the amount, timing, and type of precipitation (EEA “Rising Temperatures”). A prolonged and extreme drought in 2016 devastated farmers across Massachusetts, causing the Commonwealth to open a Drought Emergency Loan Fund (“Framework for Resilience” 15).

Meanwhile, the intensity of “100-year floods” will increase to one every 2-3 years (“Framework for Resilience” 14).
10 | Introduction | Climate Change
Annual Average Temperature in the Connecticut River Basin
Source: MA Climate Change Clearinghouse
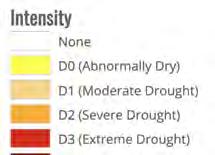
Massachusetts Drought Map at Beginning of Water Year 2022
Source: U.S. Drought Monitor
Change in Very Heavy Precipitation
Source: EPA Climate Change Adaptation Resource Center
WHY A CLIMATE RESILIENCE PLAN ABOUT WATER?
During February 2023, conversations with residents, municipal staff, and core team members identified water as both a core strength and vulnerability in Whately. Clean, safe, reliable water supplies are critical for Whately’s agriculture, ecosystems, and drinking water for tens of thousands of people in surrounding towns.
The waterbodies and water infrastructure that make Whately a regional asset and a beautiful place to live are vulnerable to the compound impacts of the changing climate. Warming temperatures, extreme weather, and changes in precipitation all affect water quality, quantity, and ecosystem health. Rising temperatures are causing snowpack to melt and runoff earlier in the year. This shift can interfere with aquatic species reproduction cycles. It also changes how water-supply reservoirs are managed to accomodate for higher winter flows and lower spring flows (U.S. Global Change Research Program). Increases in floods or “high flow” events cause more sediment, nutrients, and microbial pathogens to travel to rivers and lakes. Decreases in the amount of water flowing through rivers and streams during periods of drought, on the other hand, causes higher water temperatures and reduced dissolved oxygen, which can both harm aquatic life and decrease water quality (U.S. Global Change Research Program).
Understanding the impacts climate change has Whately’s water systems, and taking action to protect and restore these valuable natural resources with those impacts in mind, is central to increasing Whately’s climate resilience.

Changes to timing of snowmelt related streamflow in the Northeast 1960-2014
The increase of average winter–spring air temperature in the Northeast between 1940 and 2014 is thought to be the cause of the average earlier streamflow timing illustrated in the map above (National Climate Assessment, 2018).

Introduction | Climate Change | 11
The Mill River Northampton, which has a handful of headwater streams in Whately, flows south to Northampton.
Defining Resilience
Resilience
The resilience of systems and communities is defined by their ability to absorb the stresses caused by climate change while maintaining critical functions. Further, resilience describes the capacity of systems and communities to adapt, reorganize, and evolve in ways that leave the community better prepared for the future impacts of climate change.
Water Resilience
Water resilience applies this definition of resilience to the combination of water systems and structures necessary for a community to thrive (Rodina and Chan).
These systems and structures are:
• ecological systems: healthy aquatic and terrestrial ecosystems
• community structures: social and political structures that support equitable and adaptive water governance
• engineered infrastructure: built infrastructure that provides drinking water, mitigates flood risks, manages stormwater, etc (Rodina and Chan).
Water Resilience is an Emerging Term
Water resilience is an emerging term in the fields of water resource management, water governance, and ecology. In their 2019 survey of 420 global academics and leaders working in fields related to water resilience, Rodina and Chan found that despite diverse and divergent thinking about how to best realize resilience within different water management and governance sectors, there was resounding agreement about what broad actions are most likely to increase water resilience in the face of climate change.
Preserving and restoring healthy ecosystems and managing them for their continued health was considered to be the most important strategy. The top four general strategies for increasing resilience specifically in freshwater systems were restoring healthy ecosystems; adopting integrated land and water use planning; utilizing natural or green infrastructure; water resource management at the catchment (watershed) scale and were all scored “ important” or “very important” by nearly all respondents (Rodina and Chan).
Strategies & Elements of a Water-Resilient Whately
The text in teal names the top four strategies for building resilience in freshwater systems identified by water resilience professionals worldwide.
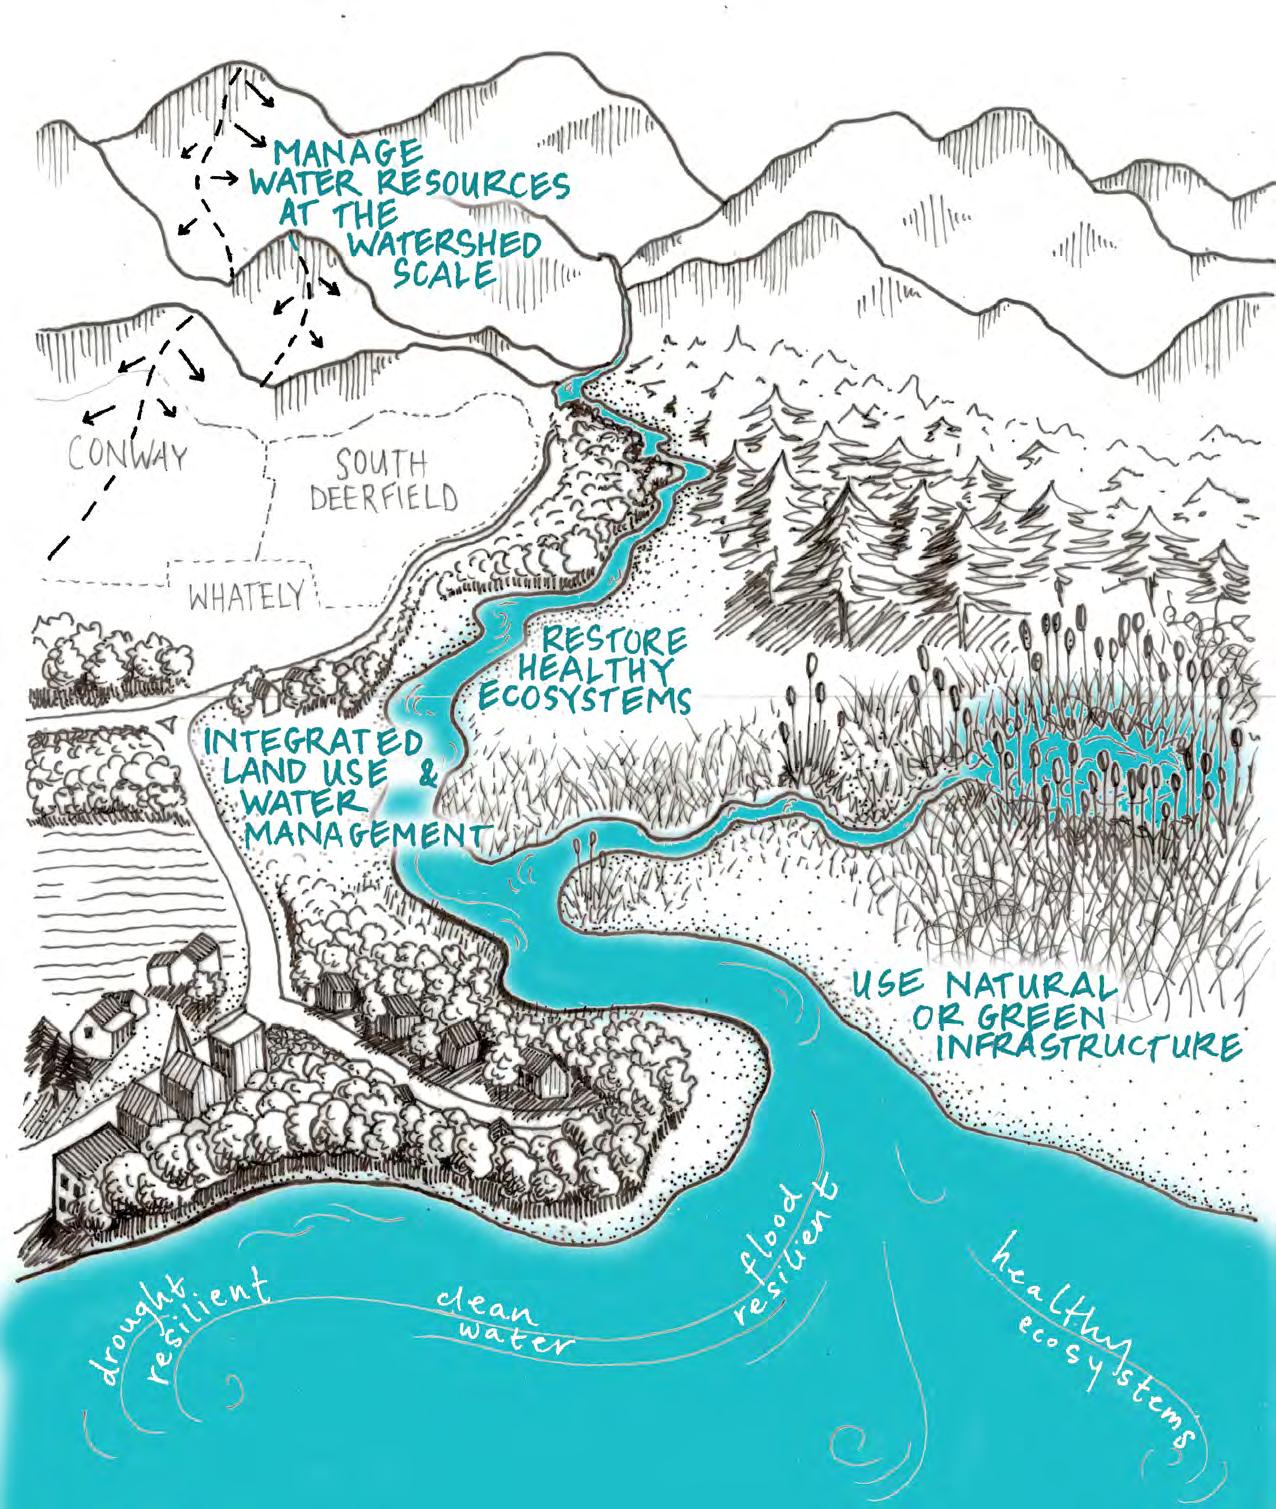 The white text “flowing out” of the river (i.e. resulting from the strategies above) names the four key elements of a water-resilient Whately identified in this planning process.
 The Connecticut River flows through western Massachusetts.
Source: Adobe Stock
ANALYSIS FRAMEWORK
In order to analyze the resilience of Whately’s water, it is necessary to look at ecological conditions not only within the town of Whately, but also at the scale of the watersheds within which Whately sits.
The following section provides an introduction to the concept of watersheds. It then explains the format that will be used in the next section to illustrate the ecological conditions impacting water in Whately.

Whately’s watersheds all nest inside the New England regional HUC 2: (01).
Hydrologic Unit Codes
The USGS divides the country into successively smaller hydrologic areas and numbers them in a way that allows people to identify individual watersheds based on their size and location.
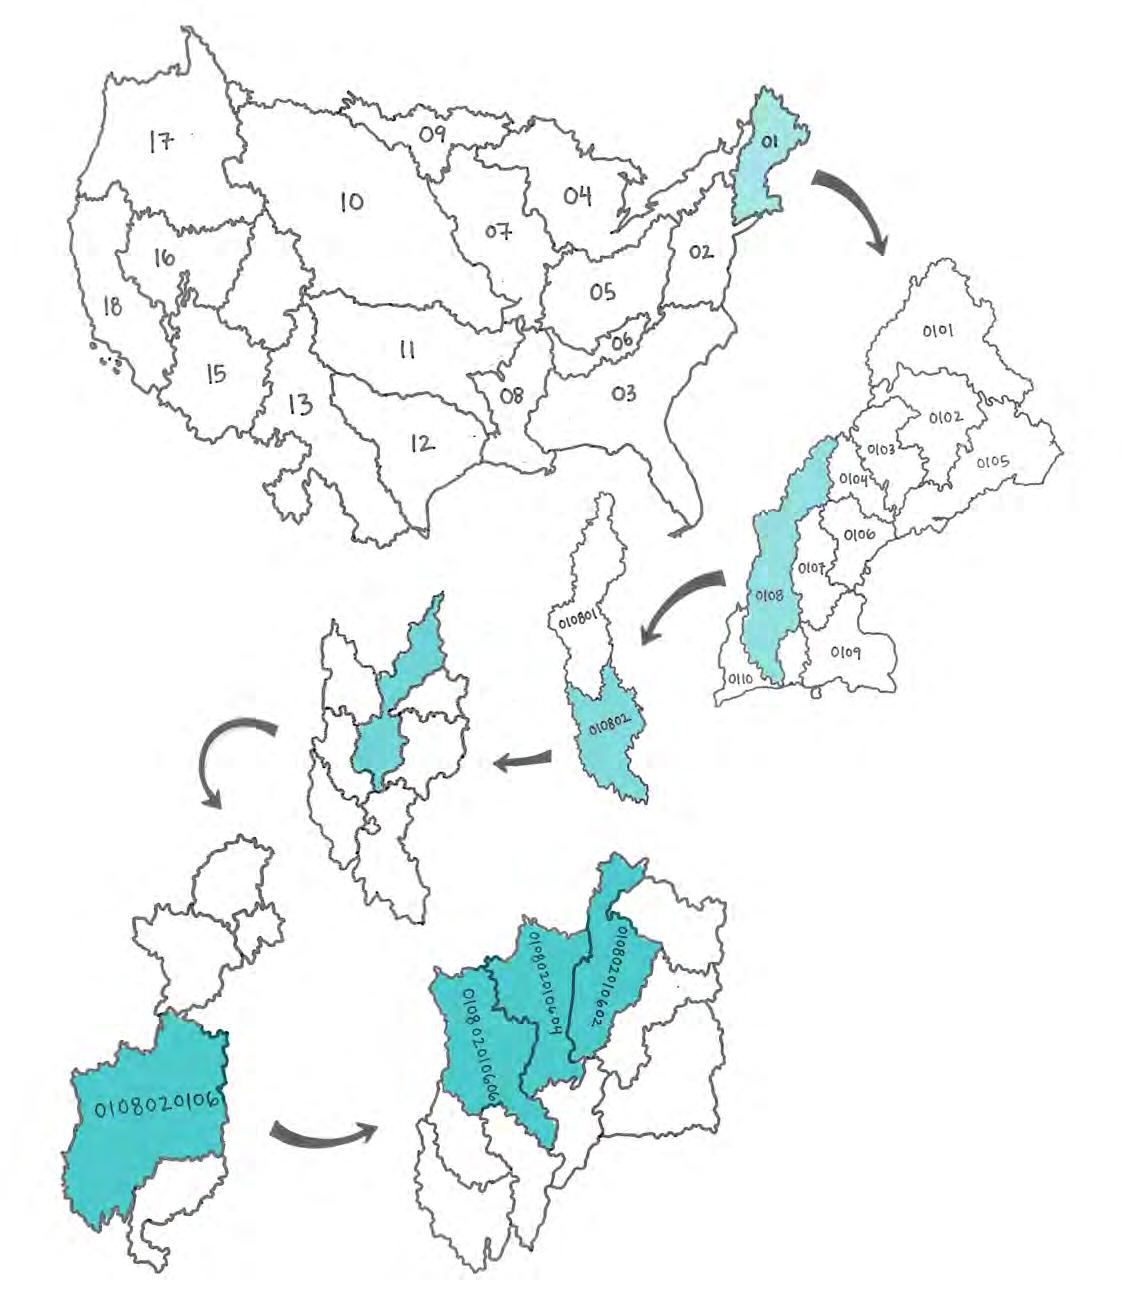
Each area or watershed gets a number called a Hydrologic Unit Code (HUC). The largest areas get 2-digit HUCs, and the smallest watersheds get 12-digit HUCs.
Whately lies in three twelve-digit HUCs:
• The Mill River Northampton Watershed (010802010606)
• Mill River Hatfield Watershed (010802010604)
• Connecticut River: Deerfield to Mill River Watershed (010802010602).
16 | Analysis Framework | Watersheds 101
To understand water, you have to know about watersheds
Watersheds are the unit that scientists analyze when studying the causes and effects of water-related issues in an area. Watersheds are also the unit scientists use when assessing what interventions will best improve those issues.
It is important to understand what watersheds are and how water moves through them because everything happening on the land in a watershed impacts the quality and quantity of the water flowing through it. Human and non-human activities on the land in a watershed can either serve to clean, store, and slow the movement of water, or can serve to pollute water, block it from soaking into the ground, and quicken its movement.
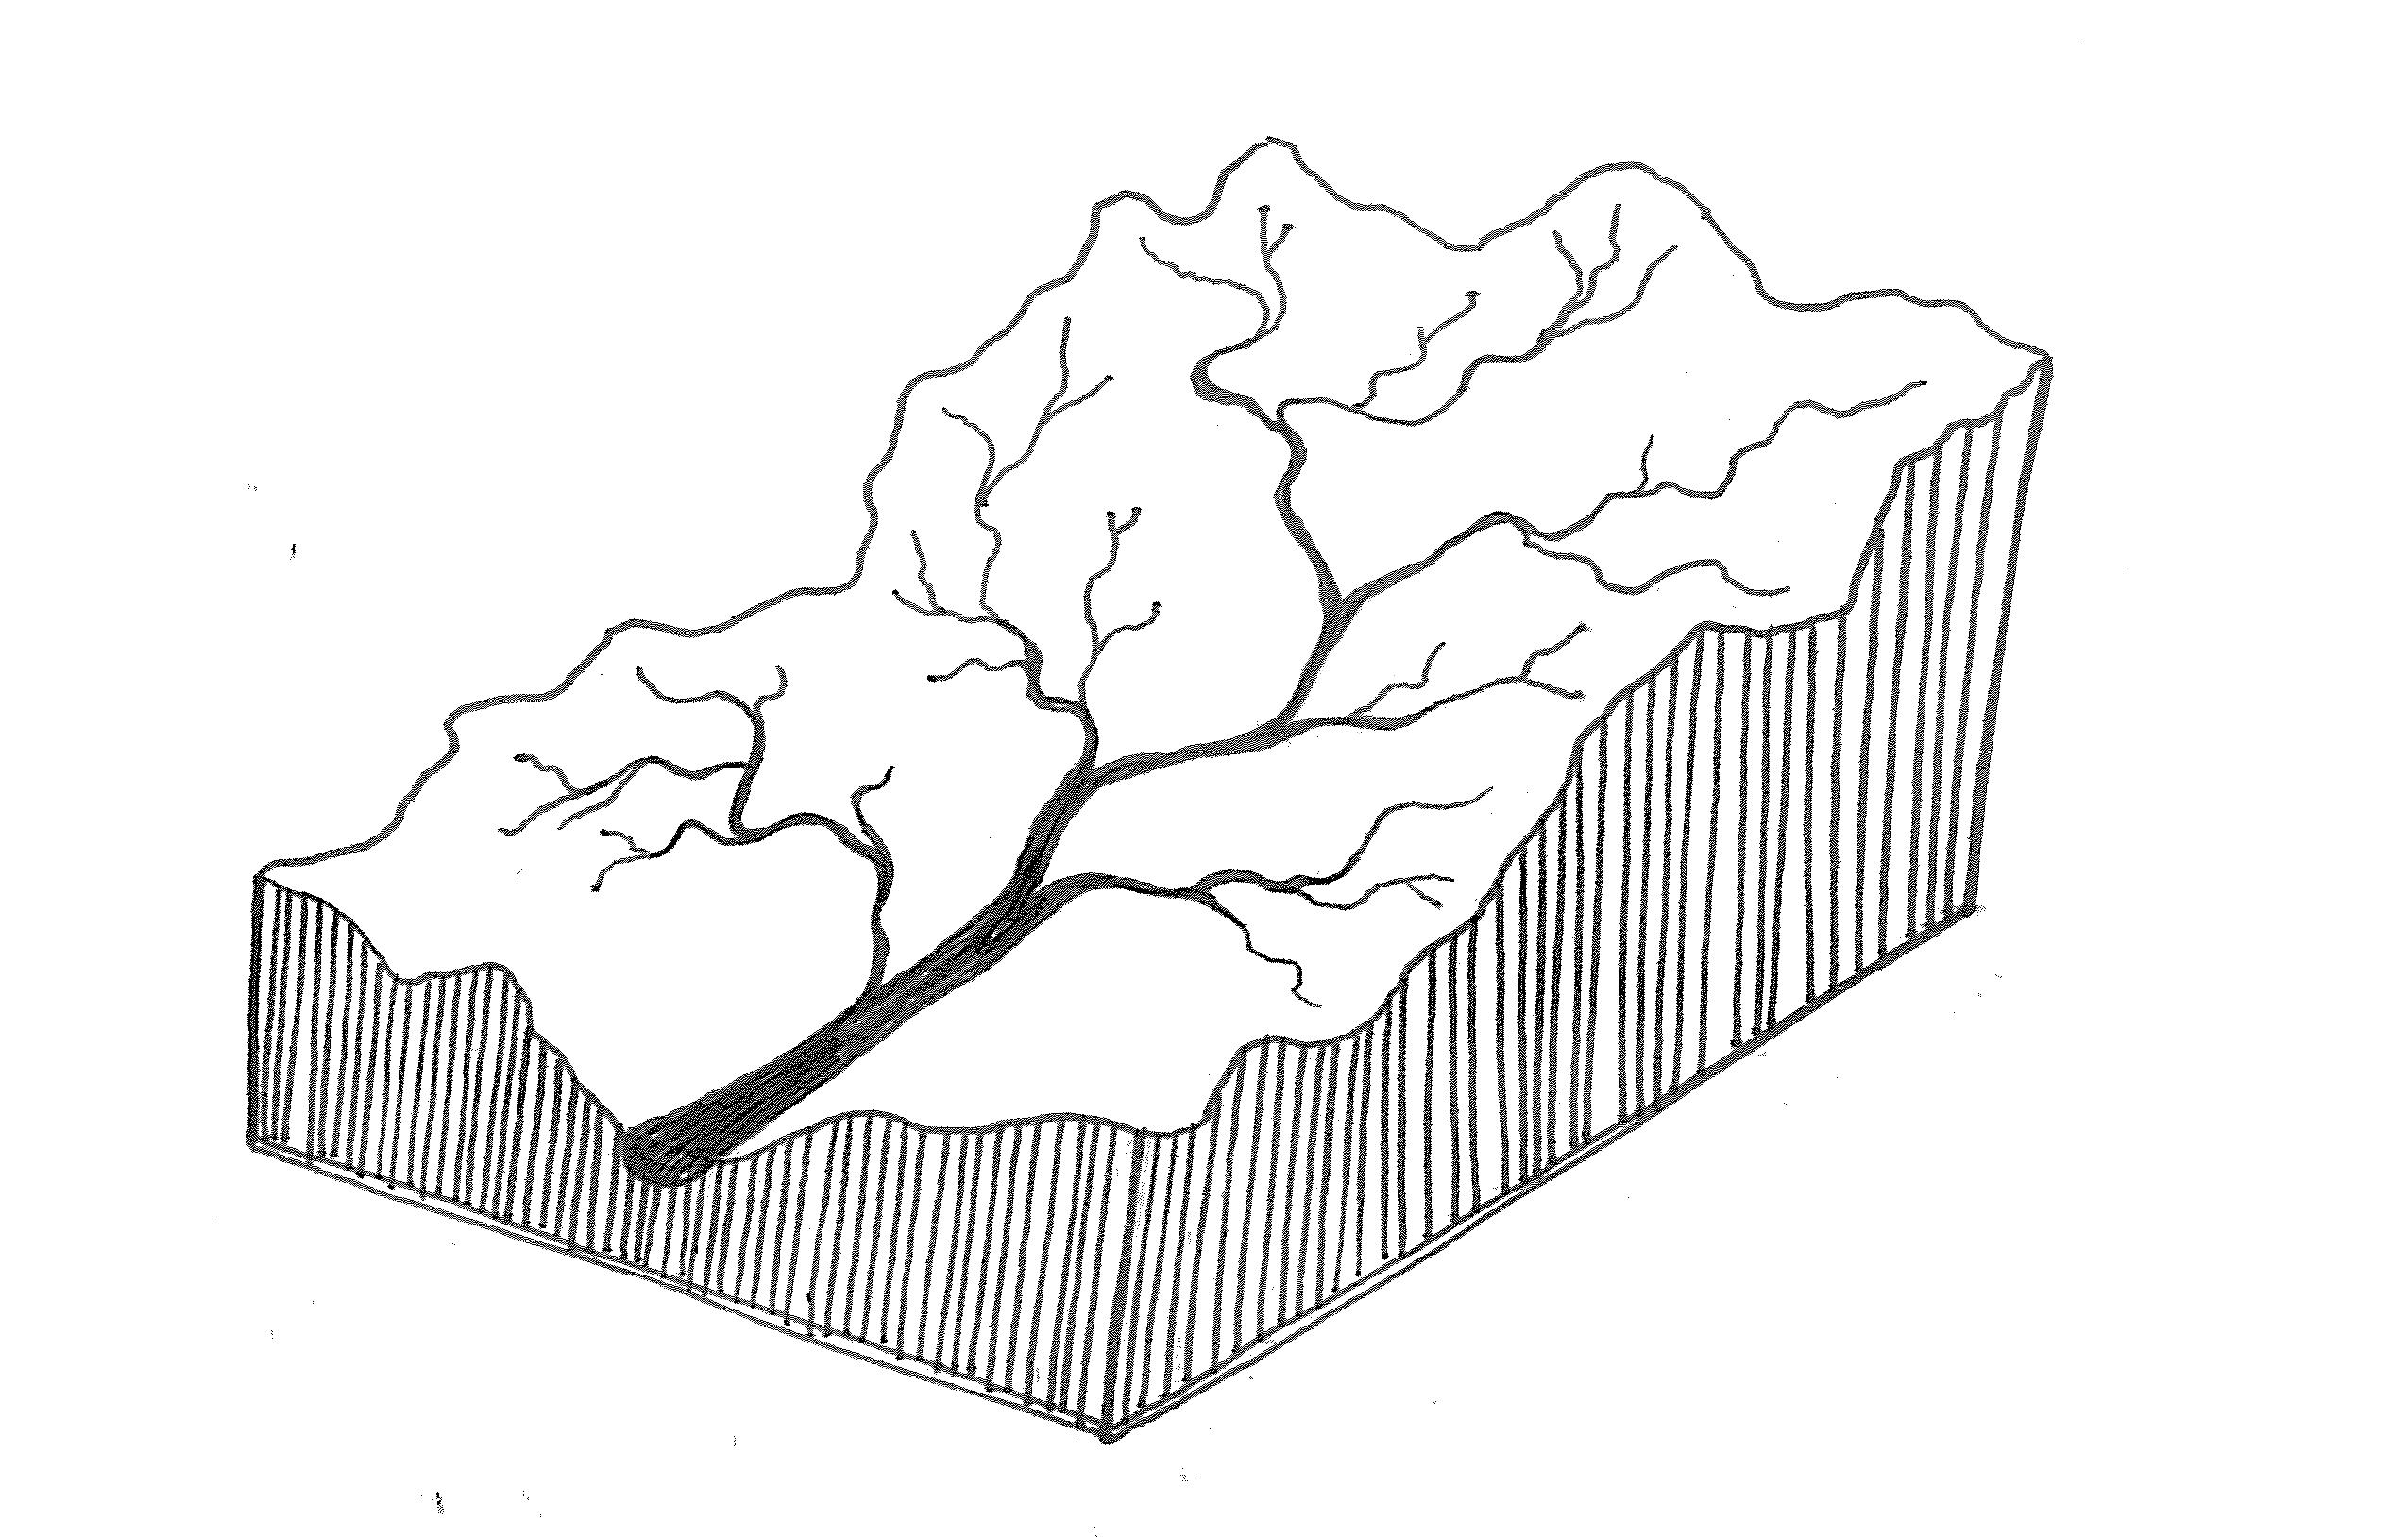
What is a watershed?
A watershed is an area of land from which all water ultimately drains to the same waterbody. Watersheds are precipitation collectors, operating like a large funnel. Their outer edges are at the highest elevations, while the waterbody receiving all of the area’s water is at the lowest elevation, and with the help of gravity, water flows from high to low. The line of high points, or ridges, separating two watersheds is called the “drainage divide,” because water that falls on one side of the ridge flows to a different water body than precipitation that falls on the ridge’s opposite side (USGS).
Surfacewater v. Groundwater
Watersheds include both surface and groundwater within their boundaries.
• Surface water is the umbrella category for water bodies that flow or sit above ground, like streams, lakes, rivers, and reservoirs.
• Groundwater refers to all of the water stored in the earth in aquifers and saturated soil.
Watersheds exist at a variety of scales, ranging from a small catchment area that flows to a creek in a backyard to the watersheds of the entire Mississippi or Connecticut River, which cover hundreds of thousands of square miles. Small watersheds nest within larger watersheds.
Watershed Vocabulary
Terminology this document uses to talk about watersheds includes basin, subbasin, and Hydrologic Unit Codes (HUCs).
• The terms “basin” and “drainage basin” are used interchangeably with watershed to mean the area of land that all drains to the same waterbody.
• When a larger basin is divided into a series of smaller basins that each have their own high and low points, each smaller basin is a “subbasin.”
• Hydrologic Unit Codes (HUCs) are assessment and monitoring units delineated by the United States Geological Survey (USGS).
Analysis Framework | Watersheds 101 | 17 Watersheds 101
Looking at aquatic ecosystems and the land use and underlying natural systems that impact them exclusively within the boundaries of Whately tells only one part of a larger story. The story continues both upstream and downstream of Whately’s municipal borders. To more fully understand the conditions impacting water quality and availability in Whately, it is necessary to look beyond the town boundaries, to the places where streams and rivers originate, called “headwaters.” To gain a more wellrounded sense of the impact Whately’s policies and land use patterns have on water, we have to look downstream, to the places water flows after it leaves town. Exploring and analyzing water in this more complete way means looking at patterns not just within Whately, but within its watersheds.
For this reason, the analyses that follow feature both an up-close look at conditions within Whately and a zoomed-out view of the same conditions at the scale of the three HUC 12 watersheds that flow through town. Watersheds range in size, and there are various scales of watershed that could have been chosen for this side-by-side comparison. This document uses the HUC 12 watershed scale because it is both large enough for viewing aquatic ecosystem issues in a holistic manner and small enough to reasonably take action at (Schueler and Holland).
Whately’s Position Within the Watersheds
Whately sits, most broadly, within the Connecticut River watershed. All water that passes through Whately drains to the Connecticut River and ultimately into the Long Island Sound.
Of the three watersheds in Whately, two of them are named the Mill River watershed. To avoid confusion, this plan refers to the western-most Mill River watershed, which flows south to Northampton, as the Mill River Northampton watershed. The middle watershed of the three, which flows south to Hatfield, will be referred to as the Mill River Hatfield watershed. These names align with Whately’s other planning documents including the OSRP.
The Mill River Hatfield Watershed covers the majority of Whately. Its headwaters begin just one town north, in Conway and South Deerfield. This means that water doesn’t travel very far before arriving in Whately, and that there’s a limited amount of land use and policy impacting water upstream of town.
Only a very small portion of the Mill River Northampton watershed is in Whately; it has a small handful of headwater streams that begin in the southwest corner of town before flowing west and south to join the Mill River in Williamsburg, Florence, and Northampton. This means that Whately plays a role in the cleanliness of water flowing through those downstream communities.
The eastern third of town all lies within the Connecticut River: Deerfield River to Mill River watershed. All but one of the streams in East Whately begin in town and flow for less than two miles before draining directly to the Connecticut River. This means that, other than the Connecticut River, East Whately’s surface waters are mostly only affected by the land use in town but contribute directly to the water quality of the Connecticut River.
18 | Analysis Framework | Whately’s Watersheds
ANALYSIS FRAMEWORK



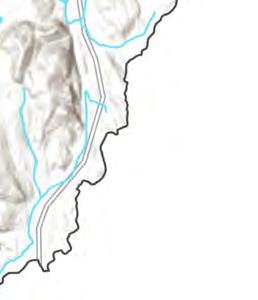






ennoC c t i c ut R i ver Mill River Northampton Watershed Mill River Hatfield Watershed Connecticut River: Deerfield River to Mill River Watershed Interstate 91 Whately’s Watersheds
 Fluvial erosion exposes tree roots along the West Brook.
ECOLOGICAL CONDITIONS
Whately supports three distinct landscapes. The flat, prime agricultural soils that line the Connecticut river floodplain define East Whately. Meanwhile, in West Whately, many streams flow across ridges of bedrock outcrop and rolling, forested hills. Central Whately, where east and west knit themselves together, lies low in the landscape and is home to the wetlands lining the Mill River. This unique combination is the result of the underlying bedrock.
The following section describes the natural and human-made features that shape the lives of Whately’s residents and impact Whately’s waters.

Landscape Character
Connecticut River Valley Origin Stories

Two parallel origin stories explain the landscape of the Connecticut River Valley. Modern geologic and archaeologic work attributes the soils and mountains of the area to the retreat of the most recent glacier. During the peak of the last ice age, which lasted from about 100,000 to 11,000 years ago, glaciers reached as far south as New Jersey. Western Massachusetts lay under this glacier until it began to melt and retreat around 15,000 years ago (The Editors of Encyclopaedia Britannica). As it melted, water flowing off its edge filled the Connecticut Valley, forming a vast lake now known as Glacial Lake Hitchcock that was long and narrow and stretched from northern Vermont to southern Connecticut. When the glacial dam at the southern end of the lake broke about 3,000 years later, Lake Hitchcock drained, but what we call the Connecticut River today flows through the deepest parts of what was once that lake (Ridge and Larsen).
Margaret M. Bruchac describes how Indigenous oral tradition from the Pocumtuck people tells the story of a giant beaver who built a great dam, which, when it ruptured, caused dramatic flooding and reshaped the landscape of the Connecticut River Valley. Today, if you look at Pemawatchuwatunck (the narby Pocumtuck Range) from the top of Mount Tom, or from across the river just
north of Whately, it looks like a beaver swimming through the water. The story is a “deep-time story” and the giant beaver is an example of an “earthshaper” motif; indigenous storytelling techniques that use metaphor to explain ancient geological events. Bruchac writes, “this beaver story does more than simply point to a mountain that is coincidentally shaped like a beaver... The story offers a warning about the dangers that result when human or nonhuman agents indulge in extreme earth-shaping activities” (“Beaver Hill Story”).
Whether told through metaphor or through technical geologic and archaeological terms, the landform and waterways surrounding residents of Whately today were formed by these historic forces. The existing conditions section that follows outlines some of the ways that land cover and earth-shaping activities, like those that the beaver story warns against, impact the resilience of Whately’s waterways and resources. The recommendations that flow from these existing conditions suggest alternative or improved landshaping activities that have the potential to improve the resilience of Whately’s water cycle, water quality, and availability, so that current and future generations are able to depend on the life-giving resource of water.
22 | Ecological Conditions | Landscape Character
A view of the Connecticut River looking south from Mount Holyoke Summit House in Hadley in 1900.
Source: Library of Congress, Detroit Publishing Company Collection

Ecological Conditions | Landscape Character | 23
Fluvial erosion exposes tree roots along the West Brook.
Mill River Hatfield flows through the lowlands of central Whately.
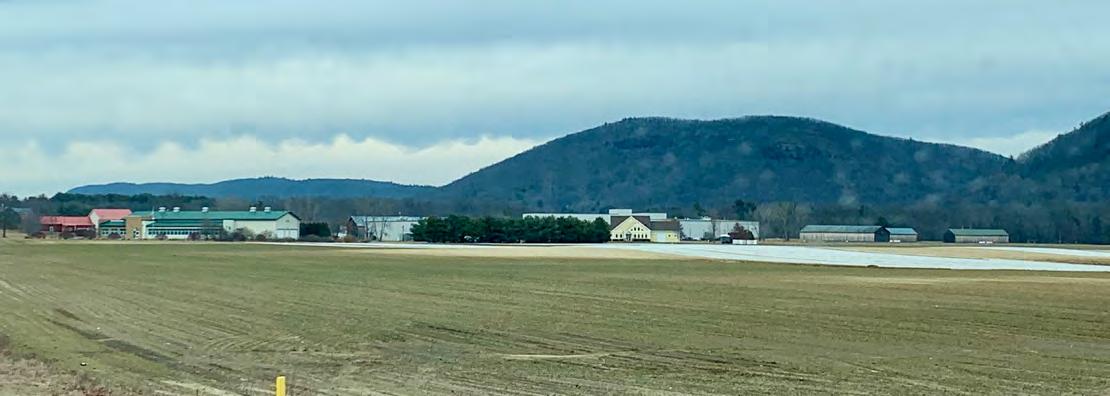
Flat agricultural field in East Whately near the Connecticut River
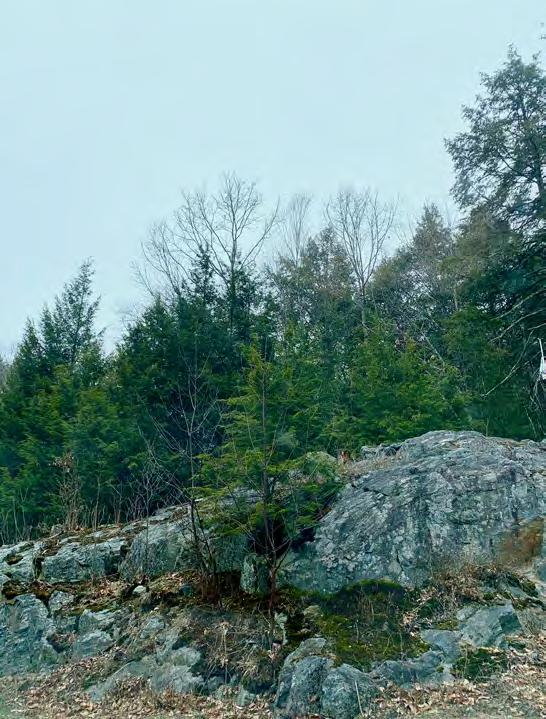
Maple sugar line crosses above the West Brook. Bedrock outcrop in West Whately
Physical Characteristics
SURFICIAL GEOLOGY & SOILS
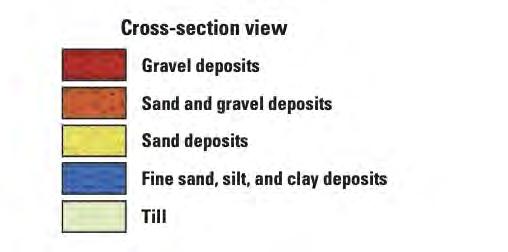
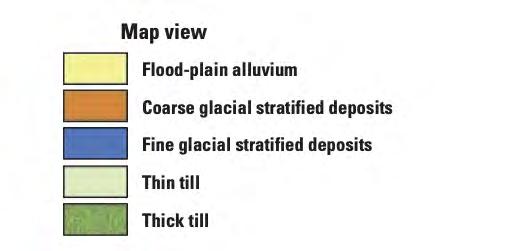
Surficial geology and soils have significant implications for surface and subsurface hydrology. Broadly speaking, surficial geologic elements are layers of unconsolidated material that sit atop bedrock and beneath soils. These elements are grouped into four broad categories: glacial till and moraine deposits, glacial stratified deposits, early postglacial deposits, and postglacial deposits. The surficial geology of Whately and Whately’s Watersheds are primarily the results of the period of Wisconsinan Glaciation and the formation and subsequent draining of Glacial Lake Hitchcock around 15,000 and 12,000 years ago respectively.
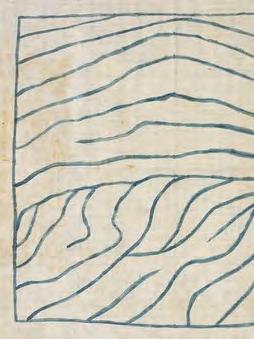
These surficial layers exist in various combinations and thicknesses atop the underlying bedrock within the region as seen in the generalized cross section below. Surficial layers with larger particle size allow water to percolate more readily through them while layers of finer particles, like the layer of fine glacial deposits denoted on the map below, tend to drain more slowly.





Source: Amherst College Archives & Special Collections

Source: USGS



24 | Ecological Conditions | Physical Characteristics
This cross section of the Connecticut River Valley reveals how surficial geology layers stack and interact with one another.
Above: Orra White Hitchcock drawing for Professor Edwated Hitchcock’s classes on geology and natural history.
ECOREGIONS
An ecoregion is an area that has similar geology, hydrology, climate, and species within it. Since ecoregions describe the ecosystems of the area, their delineation and accompanying descriptions “are designed to serve as a spatial framework for environmental resource management” (Massachusetts Executive Office of Technology Services and Security).
Whately is one of only a few towns in the state that contains the confluence of three ecoregions. The ecoregions that converge in Whately are the Connecticut River Valley, Vermont Piedmont, and the Berkshire Transition.
The abrupt transition from the flat, rich soils of east Whately to the steep hills and forested areas of west Whately is explained by these ecoregion characteristics.
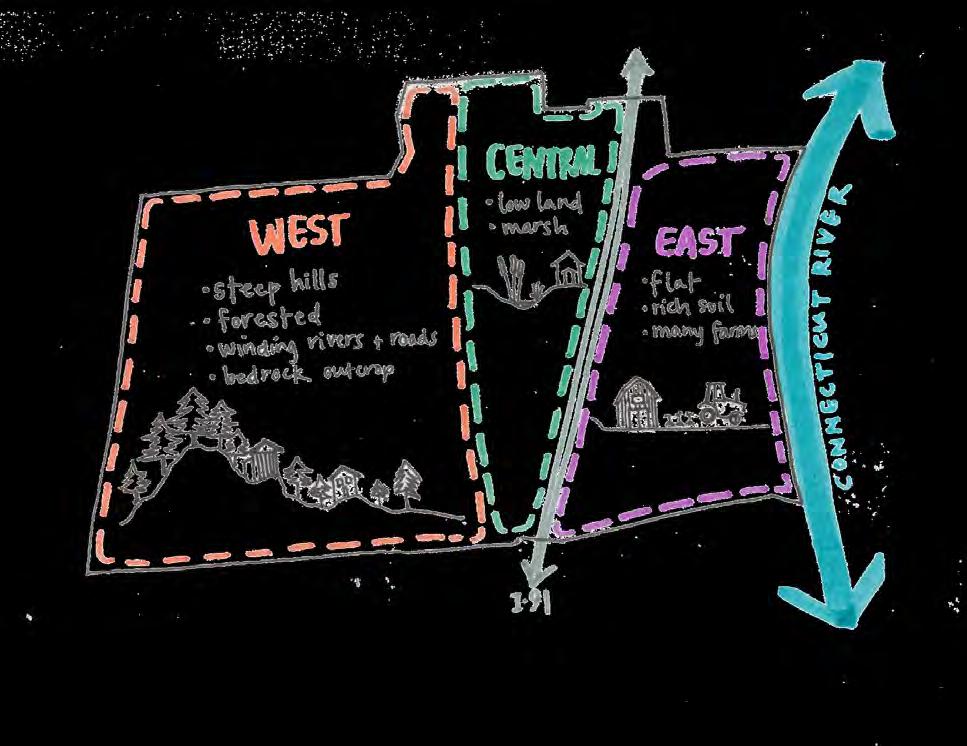
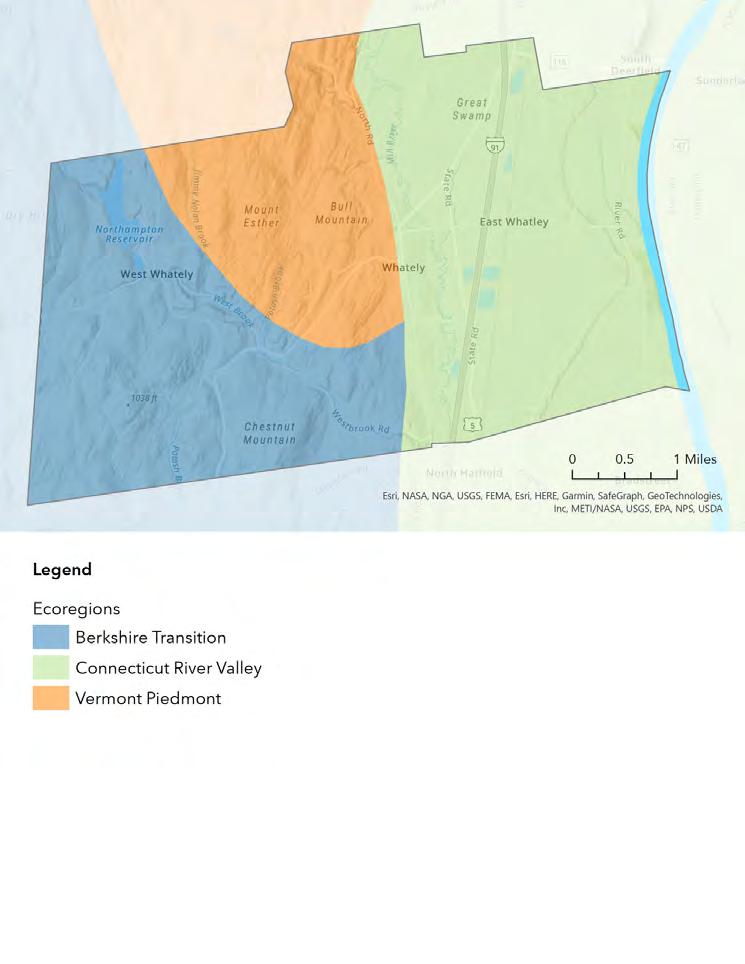
The Connecticut River Valley, characterized by rich soils, mild climate, and low rolling topography, maps to the eastern half of Whately, where many farms take advantage of the flat, fertile land along the Connecticut River.



In West Whately, the Berkshire Transition and Vermont Piedmont both describe the northern hardwood and transition hardwood forest and steep hills that dominate the landscape.

Ecological Conditions | Physical Characteristics | 25
Surficial Geology
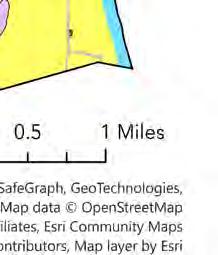
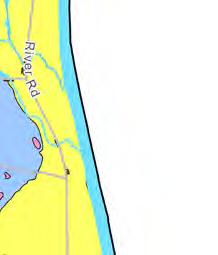

Whately


In West Whately, the hills are defined by a thin layer of glacial till with extensive areas of exposed or shallow to bedrock soils. To the east, fine glacial stratified deposits, remnants of the silt and clay that settled out of the waters of Lake Hitchcock, were subsequently covered by postglacial floodplain alluvium and in select areas by glacial dune deposits. The dense silt clay layer restricts the movement of water through the soil profile and is the confining layer to the aquifer utilized by the Town for its municipal drinking water.


In areas where thin till and shallow bedrock predominate, natural plant communities are greatly influenced by the chemical composition of the underlying bedrock (Searcy page #). The species that flourish in the mixed hardwood and coniferous forests of West Whately, extending to the expansive blocks of upland forest that make up most of the two Mill River Watersheds, are determined, in great part, by the calcareous pelite bedrock that underlies the thin till deposited by the most recent retreat of the laurentide ice sheet.
Watersheds

The surficial elements present in Whately’s watersheds follow the broader regional patterns seen within Whately itself, though the distribution of these elements varies between the individual watersheds. The Mill RiverNorthampton watershed consists almost entirely of thin till and shallow to bedrock elements while the Connecticut River-Whately watershed consists mainly of floodplain alluvium and glacial lake deposits with the significant exception of the thin till and shallow to bedrock soils of Mt. Toby.

26 | Ecological Conditions | Surficial Geology
Interstate 91 nnoC e c t i c u t R i ver

Soils By Drainage Class


Whately and Its Watersheds


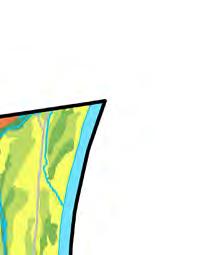
West Whately’s soils range from well to excessively well drained. Because of these soils and the steep topography and underlying surficial geology of thin till and shallow to exposed bedrock, water moves quickly through the soil profile and along bedrock formations into surface waters, causing streams and brooks in this area of town to run fast and flashy in response to precipitation events.

In East Whately, the soils range from well drained to very poorly drained, with bands of excessively well drained soils which correspond to the bands of inland dune deposits seen on the preceding surficial geology map. Generally speaking, the poorly and very poorly drained areas are where forested wetlands and other forest cover are present, including the Great Swamp Wildlife Management Area to the north. Areas of tillage-based agriculture roughly follow the distribution of well drained to moderately well drained soils in the east, where the siltrich soils are famously fertile. However, in areas where less


well draining soils sit atop floodplain alluvium and the fine layer of Lake Hitchcock sediment, water can pool and pond during heavy precipitation events which are predicted to occur more frequently with a warming climate.
The agricultural lands of west Whately, which are predominantly grass-based enterprises, sit atop well drained soils, but these soils are typically not as deep and are rocky thin-till soils, and are generally poorly suited for tillage-based agriculture.
Because soil type and soil drainage characteristics are so closely related to surficial geology, the distribution of soil drainage characteristics closely follows the pattern of surficial geology discussed on previous pages.


28 | Ecological Conditions | Soils By Drainage Class
Interstate 91 nnoC e c t i c u t R i ver






Title
BioMap
Biomap is a conservation planning tool based on many years of analysis and mapping by MassWildlife and the Massachusetts chapter of the Nature Conservancy. It is a data set available through MassGIS that identifies areas of ecological importance within the state in order to highlight ecological assets and pinpoint opportunities for conservation and restoration. Biomap aims to help decision makers protect the diversity of species and natural ecosystems in the state.
This report uses Biomap data as the foundation for biodiversity and habitat-related analysis in order to align with the broad spectrum of conservation organizations across the state that use this same data. The following descriptions of the dataset components are from the MassGIS Data website.
(MassGIS “What is BioMap?)

30 | Ecological Conditions | BioMap
“BioMap is an important tool to guide strategic protection and stewardship of lands and waters that are most important for conserving biological diversity in Massachusetts.”
Below: The Wood Turtle is part of the Massachusetts Natural Heritage and Endangered Species Program. Photo Source: Adobe Stock
Biomap Layers
• Core Habitat identifies areas critical for the longterm persistence of rare species, exemplary natural communities, and resilient ecosystems.
• Critical Natural Landscape identifies large landscapes minimally impacted by development and buffers to core habitats and coastal areas, both of which enhance connectivity and resilience.
Core Habitat Components
• Forest Core: The most intact forests of Massachusetts, least impacted by development and essential for animals and plants dependent on remote habitat.
• Rare Species Core: Areas critical to the long-term conservation of our most vulnerable species and their habitats.
• Priority Natural Communities: Assemblages of plant and animal species with limited distribution and the best examples of common assemblages. This data set is maintained by MassWildlife’s Natural Heritage and Endangered Species Program (NHESP).
• Wetland Core: The most intact, least disturbed wetlands within resilient, less developed landscapes, with fewer stressors such as pollution.
• Aquatic Core: Intact aquatic habitats (rivers, streams, lakes and ponds) supporting a diversity of aquatic species and important physical and ecological processes.
• Vernal Pool Core: Clusters of ecologically significant pools and intact surrounding upland habitat to ensure connectivity between pools.
Critical Natural Landscape Components
• Landscape Blocks: Landscape Blocks, the primary component of Critical Natural Landscapes, are large areas of intact and connected forest, wetland, river, and coastal habitat that sustain healthy populations of countless species.
• Aquatic Buffers: Intact upland areas surrounding Aquatic Cores which support habitat function and enable species to move between habitat types.
• Wetland Buffers: Intact upland areas surrounding Wetland Cores which support habitat function and enable species to move between habitat types.
• Coastal Adaptation Areas: Areas adjacent to existing salt marshes that are most conducive to habitat movement as sea levels rise.
Local Components
• Local Landscapes: The most intact natural areas in each city and town—mosaics of forests, wetlands, and streams. Meant to be viewed in conjunction with statewide data.
• Local Wetlands: Resilient wetlands in less developed areas of each municipality, supporting species and community benefits. Meant to be viewed in conjunction with statewide data.
• Local Wetland Buffers: Intact upland habitat surrounding wetlands that supports wetland functions and connectivity between habitats. Meant to be viewed in conjunction with statewide data.
• Local Rare Species: Habitats within each municipality that support highly vulnerable and imperiled species. Meant to be viewed in conjunction with statewide data.
• Local Aquatic Habitats: Areas in each municipality with above average fish and freshwater mussel native species diversity. Meant to be viewed in conjunction with statewide data.
• Local Aquatic Habitat Buffers: Intact upland habitat surrounding Aquatic Habitats that supports aquatic functions and connectivity between habitats. View with statewide data.
• Local Vernal Pools: Vernal pool clusters that support critical breeding habitats within each municipality. Meant to be viewed in conjunction with statewide data.
Regional Components
• Regional Connectivity: Areas that are particularly important for maintaining connections among habitats across the Northeast US, which will support the shifting ranges of native species.
• Regional Rare Species: Habitats within the state that support highly vulnerable and imperiled species which are at high risk regionally, nationally, or globally due to factors such as restricted ranges, few populations or occurrences, history of decline, and high threat levels.
These descriptions are from the MassGIS website. (https://www.mass.gov/info-details/massgis-data-biomapthe-future-of-conservation)
Ecological Conditions | BioMap | 31
Biomap Core Elements


Whately and Its Watersheds
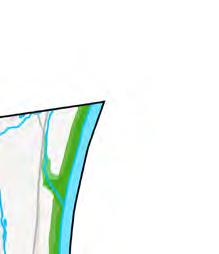
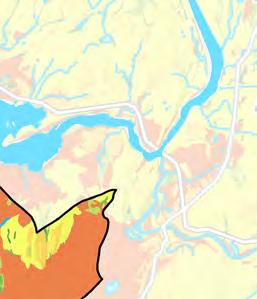
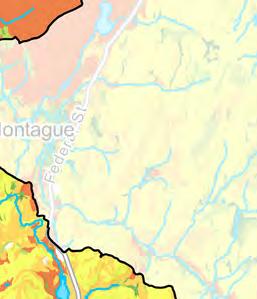
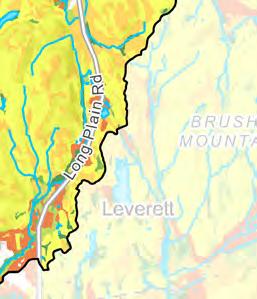
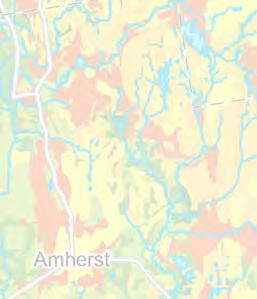
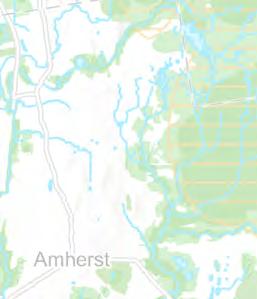
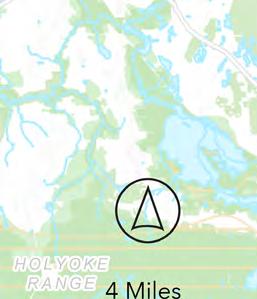
Biomap Core Habitat and Biomap Critical Natural Landscapes cover large swaths of Whately, with 65.5% of Whately’s total land area of 13,227 acres falling under one or both of these designations. 46.3% of Whately is within the Core Habitat Designation and 58.5% of the town is designated a Critical Natural Landscape. When zooming out to the watershed scale, 63.25% of the combined 98,432.50 acres of the HUC 12 watersheds that intersect Whately is watersheds covered by one or both of these designations.
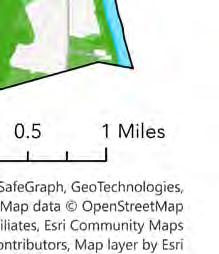
The Regional Connectivity layer is a designation of large connected habitats that could facilitate the migration of plant and animal species to more favorable ecological conditions in response to climate change as average temperatures increase. They are therefore critical to maintaining local and regional biodiversity in a changing climate. West Whately intersects this Regional Connectivity layer. The large block of contiguous forest in West Whately, the riparian habitat along the Mill River, and the forested

wetlands to the east of the river make up most of core habitat and critical natural landscapes with a narrow band following the riparian and aquatic habitats of the Connecticut River.
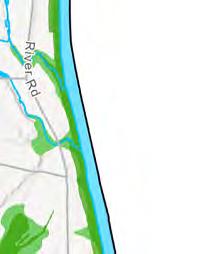
Patterns of more intense development and agricultural and commercial land use along the Connecticut River have created more fragmented and patchy habitat in these areas (see map page x) causing them to contribute less to regional connectivity, and making the broad swaths of contiguous forest in West Whately and their place as part of a much larger block of contiguous forest running to the north, west, and south, even more important to present and future biodiversity and resilience.


32 | Ecological Conditions | Biomap Core Elements
Interstate 91 nnoC e c t i c u t R i ver

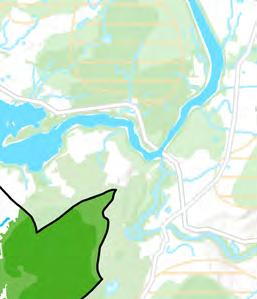

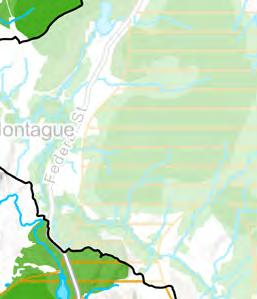

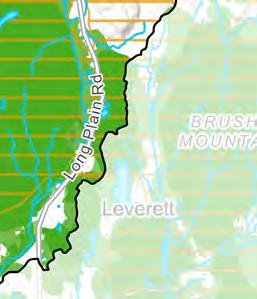




Title
Biomap Rare Species Habitat
Whately and Its Watersheds


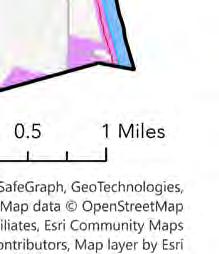

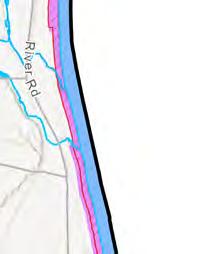

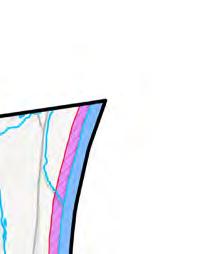

According to MassWildlife’s Natural Heritage and Endangered Species Program that catalogs observations of the 432 species listed on the 2020 Massachusetts Endangered Species Act (MESA) by locality, Whately is home to nine listed vascular plant species and twelve listed animal species. Four of the plant species are listed as endangered—winged monkey-flower, Tuckerman’s sedge, thread rush, and great blue lobelia. Five of the animal species are listed as endangered—American bumble bee, American bittern, shortnose sturgeon, little brown bat, and the dwarf wedgemussel (MassWildlife NHESP). The shortnose sturgeon and dwarf wedgemussel are also federally listed endangered species (US Fish and Wildlife Service). Additionally, the forested uplands in West Whately and the corridors along the Mill River and Connecticut River are the prime habitats for these rare species, as identified by the Biomap Rare Species Core layer.
The forested wetlands to the east of the Mill River are listed as Biomap Priority Natural Communities, which are habitat areas where the combination of plant and wildlife species are rare or exemplary, and are foundational to the persistence and viability of these ecosystems and their component species in the state and region. Whately is home to nearly all of the designated Priority Natural Communities within the combined HUC 12 watersheds that intersect the town.
The aquatic habitats of the Mill and Connecticut Rivers and the terrestrial habitats along their banks provide important habitat connectivity for rare species beyond the boundaries of Whately’s watersheds. This regional habitat connectivity will become increasingly important as a species’s survival in the face of climate change may necessitate migration.
34 | Ecological Conditions | Biomap Rare Species
Interstate 91 nnoC e c t i c u t R i ver






Title
IMPACTS TO WATER QUALITY
“Land Cover” refers to the physical land type in a place, like forest or wetland. “Land Use,” on the other hand, refers to how people are using the land in that place. For example, the land cover on a property that a farmer hays could be considered grassland while the land use is documented as agriculture.


Both land use and land cover impact water quality in a watershed. The presence of forests and aquatic ecosystems generally improve water quality and regulate the hydrologic cycle, while human development like impervious surfaces and railways often disrupt the water cycle and degrade water quality. Agricultural lands can, depending on how they are managed, either benefit or cause stress to water systems and quality.
The following pages illustrate and analyze each of the land use and land cover types presented here within Whately and its three watersheds.
IMPERVIOUS SURFACES
Impervious surfaces, like roads, roofs, and even large swaths of groundmounted solar panels, disrupt the natural water cycle by blocking precipitation from being able to infiltrate where it falls. Impervious surfaces also warm and concentrate stormwater runoff which increases the sediment and pollutant loads washing into streams (NOAA). Increased levels of sediments, pollution, and warmer temperatures all impact the quality of water bodies.
Stream impairment generally occurs when more than 10% of the land within a watershed is covered with impervious surfaces. Sensitive streams can be impacted by less than 10% coverage, however, especially when they are located next to or near roads or other development (New Hampshire Estuaries Project).
ROAD INFRASTRUCTURE
Road infrastructure poses a number of challenges to terrestrial and aquatic ecosystems, most notably from:
• Negative impacts on aquatic and terrestrial habitats from habitat fragmentation and disruption of dispersal and migration corridors
• Increased aquatic species mortality and degradation to aquatic habitats due to declining watershed health from increased erosion, sedimentation and altered chemical composition of surface runoff
• Alteration of stream channels, floodplains, and wetlands morphology and function from bridges and culverts
• Increased impacts on terrestrial and aquatic wildlife and habitats by roads acting as dispersal mechanisms for non-native and invasive species (“Habitat Fragmentation and the Impacts of Roads on Wildlife and Habitats” 10)
Rail infrastructure poses similar ecological challenges to roadways. In addition, railways are often associated with high levels of heavy metal and hydrocarbon contamination in soils and waterways in the vicinity of railways (Lucas et al 83).
36 | Ecological Conditions | Land Use & Land Cover Types LAND
& LAND
COVER
USE
AGRICULTURAL LAND

Agriculture, core to Whately’s history, identity, and economy, is intimately intertwined with hydrologic cycles in town. Farms rely on stable water availability for sustainable operations and are also put at risk during periods of drought or excessive rainfall. While agricultural operations are impacted by the water cycle, they also impact it. The nutrients, pesticides, and fertilizers used for farming operations can flow off of farms and into waterways, potentially harming quality of local water supplies. The residents of Whately are acutely aware of this dynamic: in the 1980s, the aquifer from which many homes got their water was compromised when it became contaminated with agricultural chemicals.
Agricultural runoff also contributes to greenhouse gas emissions, which contribute to global warming. Fertilizer that runs off into rivers and streams carries loads of nitrogen in it; when that nitrogen enters rivers and streams, nitrogen-breathing microbes break it down into Nitrous oxide, which is a potent greenhouse gas (Winnick). This cyclical relationship of impacts to and impacts from water quality and availability in town is illustrated most clearly by agriculture, but manifests in other areas of local life, too.
AQUATIC ECOSYSTEMS

Aquatic ecosystems are indispensable natural resources when it comes to regulating the water cycle. Wetlands, especially those connected directly to streams, mitigate flooding by providing water storage, slowing flows, and reducing flood peaks (Sather and Smith 5). They are also important for maintaining water quality; wetlands filter pollutants and sediments out of moving waters through micro-organisms that decompose organic substances and plants and animals that metabolize and photosynthesize (Sather and Smith 14).
Vernal pools are shallow, seasonal wetlands. They are essential breeding habitat for amphibians like salamanders and frogs and also home to rare and important habitat. Coldwater Fisheries Resources are waterbodies that coldwater species need during some part of their life cycle. Coldwater species are especially sensitive to changes in stream flow, temperature, and water quality (MassGIS).
FORESTS

Forest cover is often the best indicator of watershed health. Watersheds that are over 65% forested have been found to be protective of a stream’s biological community (NOAA). This is because forests do a lot of work to regulate the water cycle and the quality of water in their watersheds. Tree roots filter pollution out of water as it infiltrates into the ground and prevent erosion by anchoring soil in place. The canopy above participates in a process called evapotranspiration, through which leaves release water vapor into the air; this helps to regulate precipitation, cool the landscape, and keep droughts at bay. Forests also mitigate flooding by slowing and infiltrating water during heavy rainfall before it reaches streams and rivers (Lyons and Gartner).
Needless to say, healthy forests are critical to regulating water quality and quantity. They are, however, under threat in Massachusetts. Conversion of forest land to other uses, invasive insects and diseases changing forest composition, over-browsing by deer, and climate change causing habitat conditions to shift are four key stressors on the forests of Massachusetts (Catanzaro et al.).
Ecological Conditions | Land Use & Land Cover Types | 37
Whately


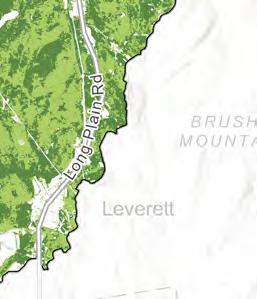
Whately has two starkly different sections when it comes to forest cover. The dense forest of mixed deciduous and evergreen trees that covers West Whately stops abruptly in the middle of town; tree canopy only speckles East Whately. This means that rivers and streams running through West Whately benefit directly from the waterquality work of forests, while tributaries flowing through East Whately are more impacted by the development and agricultural land use along the Connecticut River.
Watersheds

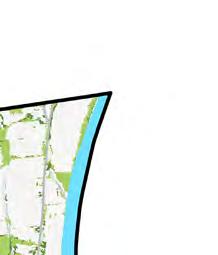

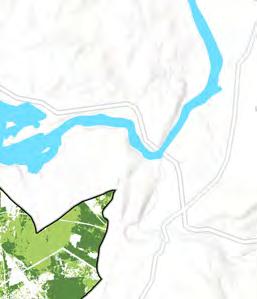
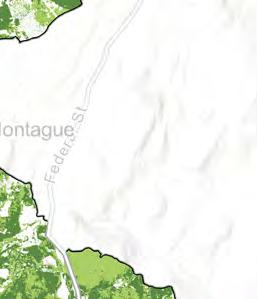
The dense forest cover of West Whately characterizes the western half of the three-watershed area, too, with a similarly even mix of deciduous and evergreen trees. Of the three watersheds, the West Mill River is the most forested, while the central Mill River watershed and the Connecticut River watershed portion are both about twothirds forested. The headwaters in these watersheds, which are especially vulnerable and important to protect, are largely forested, which is positive for the water quality of downstream areas.

The large amount of forest cover in Whately and the surrounding watersheds is good news for water quality and quantity, but much of the forest may be more vulnerable than is immediately apparent. Ensuring the long-term resilience of forests in Whately and the region will be an important part of building the resilience of Whately’s waters to climate change.


38 | Ecological Conditions | Forest Cover
Interstate 91 nnoC e c t i c u t R i ver
Forest Cover






Title
Aquatic Habitat
Whately


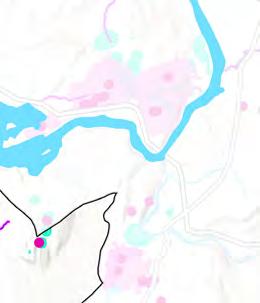
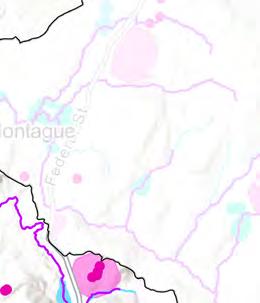
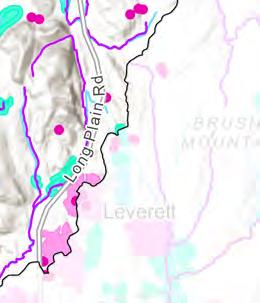
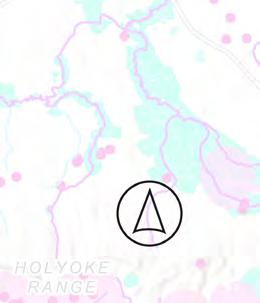
Whately is home to a unique abundance of aquatic ecosystems. A wide swath of wetlands stretches northsouth through the center of town, while smaller wetlands dot the tributaries to the West Brook in the uplands of west Whately. Even more wetlands used to line the lowlands along the central Mill River, but many were filled in to create agricultural lands in the early 1900s. Vernal pools also speckle the landscape around the West Brook and its tributaries. A lone vernal pool overlaps with a section of wetland in east Whately. Many of Whately’s rivers and streams are Coldwater Fisheries Resources (CFRs). Maintaining CFRs is vital to the survival of coldwater species like brook trout.
Watersheds


Examining aquatic habitat within the three watersheds at large, Whately has the two largest wetlands within its bounds. Given the role that wetlands play in cleaning water and mitigating flooding, protecting and improving the quality and function of these wetlands would likely have a large positive impact on Whately and downstream communities. The western half of the central Mill River Watershed and the west Mill River Watershed are home to numerous cold-water fisheries that are sensitive to the impacts of climate change and will need protection for survival into the future.

40 | Ecological Conditions | Aquatic Habitat
Interstate 91 nnoC e c t i c u t R i ver







Title
Agricultural Land Use

Whately


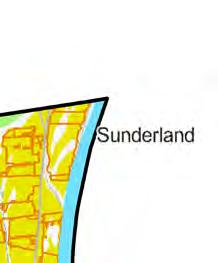
Whately is home to some of the best farmland in the country (Whately Open Space Committee). The soils that flank the Connecticut River are rich and fertile, and much land along the river is mapped by the state as prime farmland, which are areas of land considered to be the best in the state for productive agriculture. Twenty-one percent of Whately is composed of these high-quality soils, and about half of that land is currently cultivated. As of 2021, there were 31 farms of varying size in Whately (Whately Open Space Committee) which collectively gross about $20 million annually and employ around 425 workers (Whately Food Assessment). Ensuring that these farms are able to operate through periods of drought and excess precipitation is important for Whately’s economy.
More than half of the land currently being farmed lies in the flat floodplain between the Connecticut River and Interstate 91. The rest is mostly located on the other side of I-91, in the marshy lowlands of central Whately along


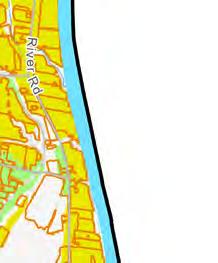
the Mill River. A lot of the farmland here is on land that was once swamp and was drained, a process that was common in the early and mid twentieth century (Capel et al.). Agricultural runoff from these farms has the potential to have a large impact on the water quality of the Connecticut River and the Mill River.
Watersheds
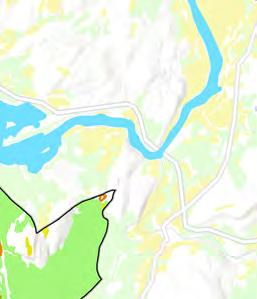
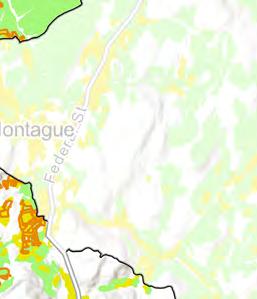
Most of the agricultural land use in Whately’s watersheds occurs along the Connecticut River in Sunderland, North Amherst, and Hatfield. The prevalence of farms along the river likely directly impacts the water quality of the Connecticut River. Additionally, around one third of the land area within the headwaters of the Mill River Hatfield is agricultural land. Headwaters are especially vulnerable to water contamination and especially important to protect for water quality in the rest of the watershed downstream.


Interstate 91 nnoC e c t i c u t R i ver 42 | Ecological Conditions | Agricultural Land Use






Title
Road and Rail Infrastructure
Whately


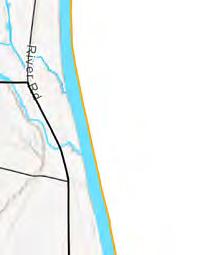
Many of Whately’s roads are near its surface waters, creating ample opportunities for stormwater, sediment, and nonpoint source pollutants to enter streams and other water bodies. Whaltey has 27.5 miles of roads within 100 feet of a wetland, 7.7 miles of roads within NHESP Priority Habitat, 8.8 miles of roads within 200 feet of an upland stream, and 3 miles of roads within 200 feet of major rivers, ponds or reservoirs (“Sustainable Stormwater” 11). Over 16% of Town maintained roads are unpaved, most of which are in the steeper terrain of West Whately (“Unpaved Roads”). Gravel roads have higher potential for erosion and subsequent sedimentation of nearby waterways than unpaved roads (Strayer). These roads are also experiencing increased damage as a result of climate change. In their 2022 survey of Highway Department Superintendents, FRGOG reported that intense rain events, an extended mud season, and increased freeze/thaw cycles were the top causes of damage to unpaved roads in the county (8).
The 1-91 corridor is the most ecologically significant roadway in Whately in terms of its surface area, traffic rates, and nonpoint source pollutant load. The most significant ecological impact to waterways in Whately is the chlorination of stormwater runoff caused by road salt into the forested wetlands of the Great Swamp. Also of note is the extent to which the Springfield Terminal
rail line, because of its raised bed construction, becomes the delineation between the Mill River-Hatfield and Connecticut River-Whatley watershed, denoting the extent to which the topographical changes created by rail and road infrastructure can impact hydrology at the site, neighborhood, and watershed scale.



Watersheds

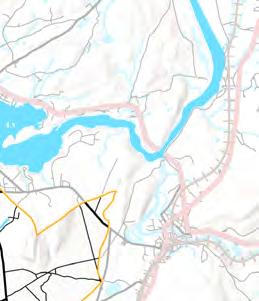
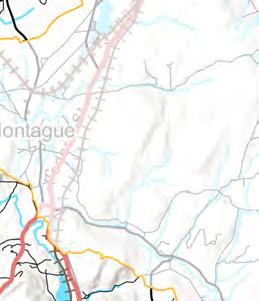
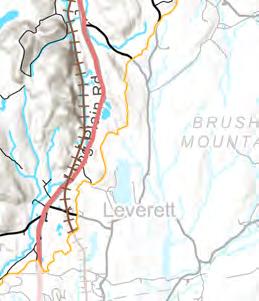
Whately’s watersheds and the municipalities therein share similar patterns of road and rail infrastructure, most notably their frequent proximity to surface waters; the prominence of unpaved roads in steep terrain; and the extent to which the I-91 corridor and Springfield Terminal rail line serve as major sources of ecological fragmentation, separating the broad floodplain of the Connecticut River from the upland habitats to the west and east of the river corridor.
As the predominant contribution to impervious surfaces in the watersheds, roadways are an opportune place to make interventions that improve both the functional capacity of the roadways for human use while mitigating the impacts of stormwater runoff, sedimentation, and aquatic habitat and hydrological connectivity fragmentation caused by roads and railways.
44 | Ecological Conditions | Road and Rail Infrastructure
Interstate 91 nnoC e c t i c u t R i ver






Title
Impervious Surfaces


Whately


Whately has relatively low impervious coverage: only 3.5 % of town is paved or developed in some way. Runoff leaving impervious surfaces in Whately is largely untreated, generally flowing across the surface directly into surface waters or infiltrating into the soil without any pre-treatment or filtration. Occasionally, runoff collects in ditches or storm drains, which concentrate and release the untreated runoff into surface waters.

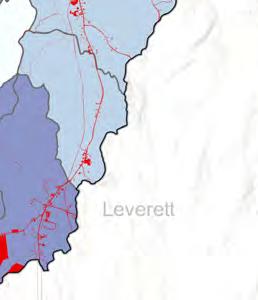
The most concentrated area of impervious coverage is in the subbasin that Interstate 91 and the center of town run through. The subbasin at the southwest corner of town represented in dark purple is mostly undeveloped within Whately but connects to a subbasin that stretches into a much more densely developed area of Northampton.


Watersheds
Whately’s watersheds at large also have low impervious coverage, with only 4.5 % of them paved or developed. The northwest half of the Mill River Northampton watershed has extremely low impervious coverage, as does the western half of the Mill River Hatfield watershed. The eastern third of the Mill River Hatfield watershed has some denser concentrations of impervious surfaces along the Interstate 91 corridor. The Connecticut River: Deerfield to Mill River watershed has a relatively even distribution of impervious surfaces throughout.
The overall low level of impervious coverage likely contributes to better water quality in Whately and its watersheds. Protecting natural areas from further development could be an important strategy in strengthening the resilience of the area to the impacts of climate change on water. Areas with more impervious coverage are areas to potentially target for strategic water-quality interventions, as are areas where roads or development lie directly adjacent to water bodies.
Interstate 91 nnoC e c t i c u t R i ver 46 | Ecological Conditions | Impervious Surfaces
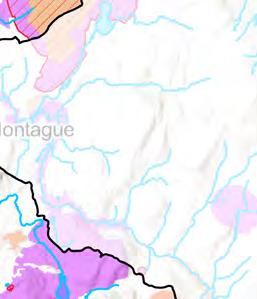
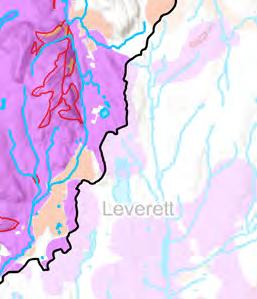
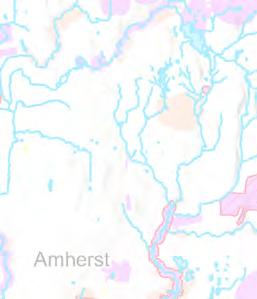
Watershed
Hatfield



Watershed
Connecticut

Watershed



Title
Mill River
Northampton
Mill River
River: Deerfield River to Mill River
Impaired Waters
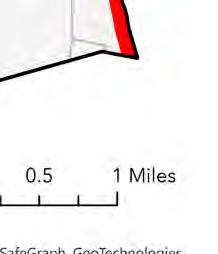
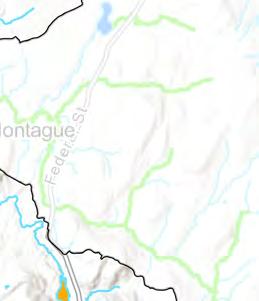
The Federal Clean Water Act requires states to assess the water quality of surface waters and report their assessments periodically to the EPA. The most recent reporting cycle for Massachusetts was 2018 - 2020; the maps above and to the right display the data from that assessment.
Massachusetts evaluates what “uses” water bodies are clean enough to support, and ranks them accordingly. Each water body is tested for whether it can support aquatic life, fish consumption, drinking water, shellfish harvesting, primary (e.g., swimming) and secondary (e.g., boating) contact-recreation, and aesthetics.
Water bodies get ranked as one of five categories, ranging from Category 1: Unimpaired and not threatened for all designated uses to Category 5: Impaired for one or more uses and requiring a restorative action plan.
When a water body is identified as impaired, it is then assessed to determine the source of impairment. If it is identified as impaired by a pollutant, the Massachusetts Department of Environmental Protection is required to develop a total maximum daily load (TMDL). “A TMDL
establishes the maximum amount of a pollutant that may be introduced into a waterbody and still ensure attainment and maintenance of water quality standards” (MassDEP).
Whately


Two waterbodies in Whately are listed as Category 5: the Mill River Hatfield and the Connecticut River.


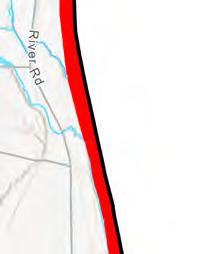


The Mill River supports primary and secondary contact recreation and aesthetics, but does not support fish, other aquatic life, and wildlife because of the elevated temperature of the water. The Connecticut River does not support any uses other than aesthetics due to the presence of the invasive water chestnut, E. Coli, and PCBs in fish tissue (MassDEP).
Watersheds
The Mill River Northampton supports aesthetics, fish, other aquatic life and wildlife, and secondary contact recreation, but does not support swimming due to the presence of E. Coli (MassDEP).

Interstate 91 nnoC e c t i c u t R i ver 48 | Ecological Conditions | Impaired Waters





 View East of the Pocumtuck Range from behind the Whately Public Library
WATER USE
In addition to the wildlife and ecosystems that rely on, and support, the water in Whately’s streams, wetlands, and ponds, thousands of people in town and surrounding municipalities also depend on Whately’s water.
Understanding who uses the surface and ground water in Whately helps clarify why building water-resilience is central to climate change resilience planning in the area.
This section describes who benefits from the different branches of drinking water infrastructure in Whately and the ecological impacts of that infrastructure. It outlines what sectors of town use what portion of Whately’s public water supply, and identifies who and what might be impacted should water become an unreliable resource in town.

Drinking Water
Northampton
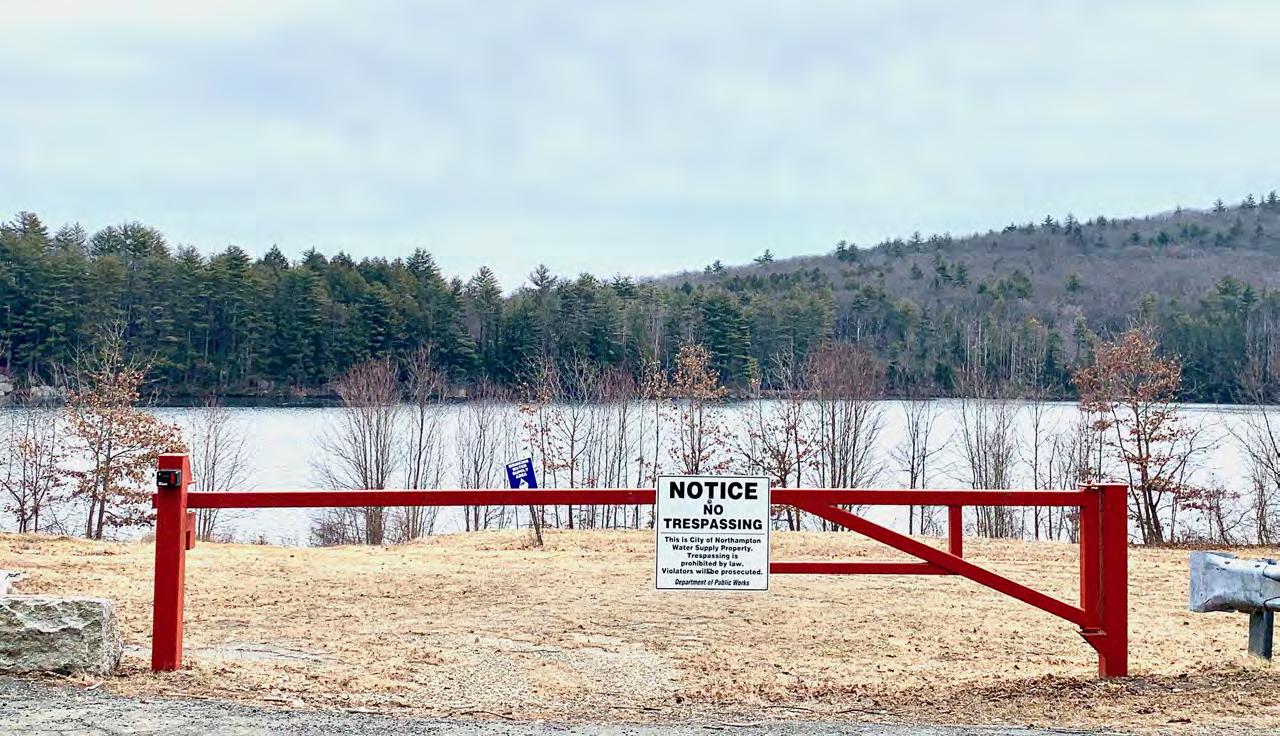
As of 2022, 98.7% of Northampton’s water comes from Whately (City of Northampton DPW). The primary source of water for Northampton is the Ryan Reservoir, which is fed by Avery Brook and other streams higher up in the watershed in the towns of Conway and Williamsburg. Overflow discharges to the West Whately Reservoir (Tata and Howard).
While the West Whately Reservoir receives overflow from Ryan Reservoir and is fed by its surrounding watershed in Whately and Williamsburg, it is primarily fed by an upper tributary of West Brook, which it dams and then discharges the water for four miles across Whately via pipe and open channel (Borowski Brook) to the Mountain Street Reservoir and Water Treatment Plant. These facilities are located outside of the West Brook Drainage Basin, predominantly on the Williamsburg side of Whately’s southern town boundary. In addition to diverted waterflow from the West Brook, the Mountain Street Reservoir is fed by its surrounding watershed, which is largely located within Whately. Overflow from West Whately Reservoir enters West Brook and eventually the Mill River in Hatfield, and overflow from Mountain Street Reservoir enters Beaver Brook and eventually the Mill River in Northampton (Tata and Howard).
South Deerfield
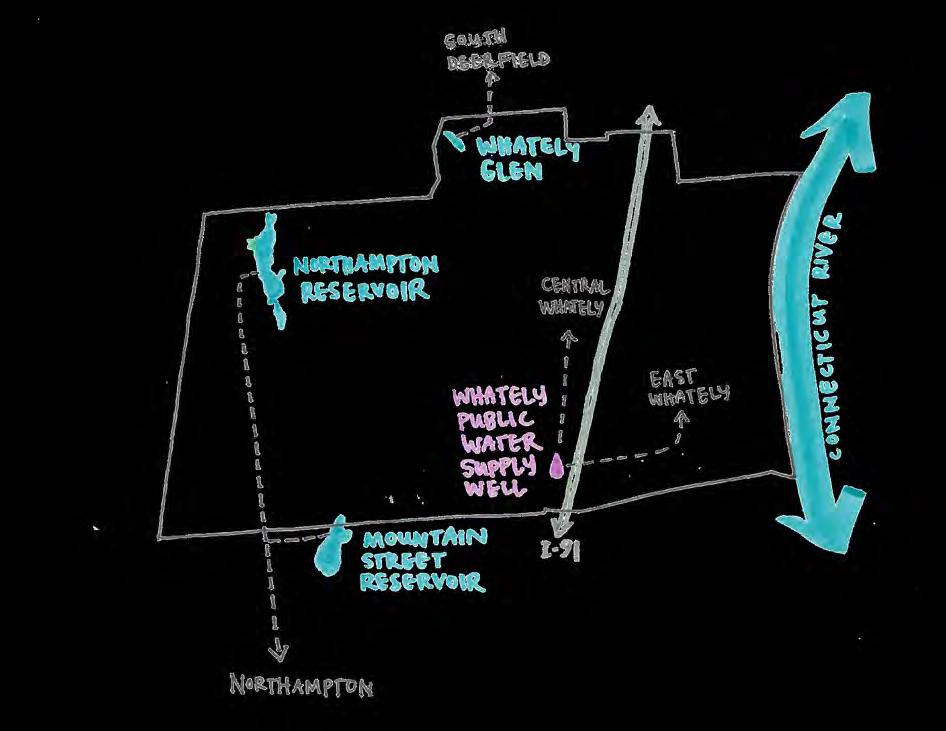
South Deerfield Water Supply District relies entirely on the Roaring Brook and its watershed as a source. The Roaring Brook Reservoir is located upstream across town lines in Conway, but the Whately Glen Reservoir and Roaring Brook Water Treatment Facility that supply clean drinking water to South Deerfield are located in Whately (South Deerfield Water Supply District).
Aging Infrastructure
The infrastructure is aging–recommendations were made in 2013 to analyze whether improvements are necessary and to close the connection between West Whately Reservoir and Mountain Street Reservoir, in part to reduce the potential risk of contamination from the road adjacent to the Brook (Tata and Howard).
Because of the extent of piping through town and the proximity of residences and farms to the reservoir, maintenance of the reservoirs and the transmission main that runs through Whately would likely be disruptive for Whately residents along Webber Road and Mountain Street.
52 | Water Use | Drinking Water
Whately is a drinking water resource hub. In addition to supplying water to its own residents, it also provides water to the municipalities of Northampton and South Deerfield.
Mountain Street Reservoir, which sits in Hatfield and Whately, is part of Northampton’s drinking source waters.
Additionally, Ryan Reservoir was constructed in 1971 and both the West Whately Reservoir and the Mountain Street Reservoir were built in 1904 and may not be sufficiently designed for the intensity of precipitation events that is likely to increase as the climate changes. The Northampton dams are all rated as “high risk” and South Deerfield’s as “significant risk” by the Massachusetts Office of Dam Safety, rated not on the state of the infrastructure, but rather the extent of destruction and fatality that could occur if they failed. Concerns regarding the risk the dams pose to Whately residents and workers came up repeatedly in the MVP and Hazard Mitigation Plans.
Capacity
In Northampton’s 2013 Water Supply Asset Management Plan that details future water supply needs, the population for Northampton was projected to grow by 5% to be approximately 30,250 by 2032. In Deerfield’s 2014 Housing Production Plan, the population for Deerfield was expected to grow by 8% to 5,530. Whately is also growing at a rate of 8%, and may reach a point where the ground and surface waters within the town’s boundaries can no longer sustainably meet the needs of these expanding populations.
Potential Implications
This kind of infrastructure for potable water can have implications for ecological health and human safety: damming and diverting surface waters for drinking water supply disrupts natural hydrologic patterns and aquatic habitat. Transferring water out of one watershed basin into another can lead to insufficient recharge if not managed sustainably, depleting the waterway as a resource for people and the greater ecosystem. Additionally, Whately’s Highway Superintendent suggested a correlation between releases of water by the reservoirs before and during higher intensity precipitation events to erosive flooding damage in town.
Northampton’s 2013 Water Supply Asset Management Plan completed a critical component assessment for the water distribution system to evaluate the impact of potential water main failures on the system; however, this evaluation only considers the impact on Northampton water users should water mains break, not the ecological impacts nor impacts on the town of Whately and its residents should Northampton’s water infrastructure fail. Because the infrastructure for these potable water supplies crosses town boundaries, it can be challenging for water districts of other municipalities to manage these water resources for uses beyond their own municipality’s interests, namely the health of these waterways as potential sources feeding Whately’s own public water, and as habitat that bolsters Whately’s scenic and recreational assets. In turn, Whately may not be considering its impact on water sources
Water Use | Drinking Water | 53
Whately’s Drinking Water
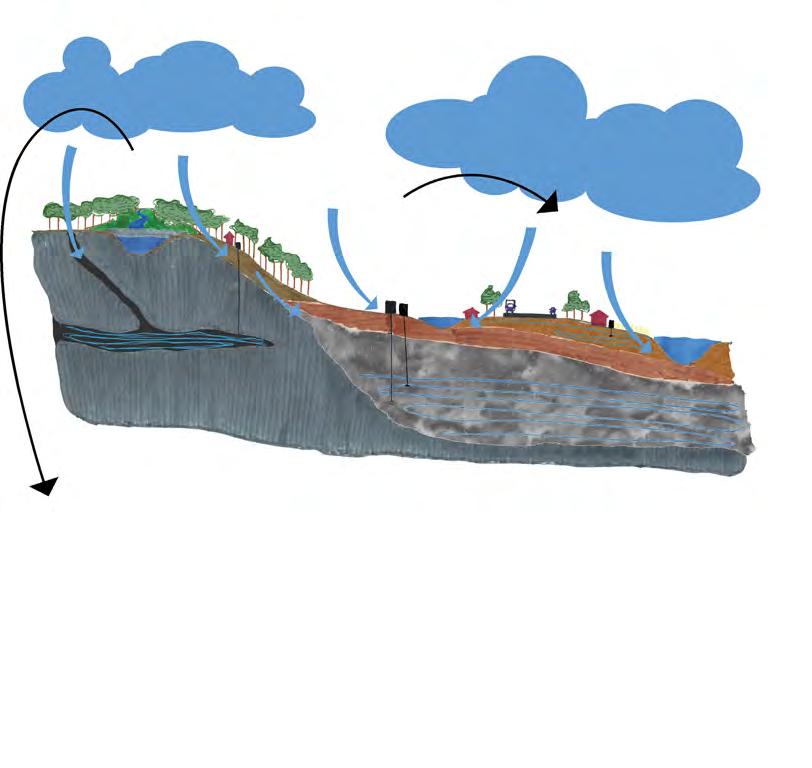
Whately does not have its own reservoir, instead relying on public and private wells. A small public Water Works previously served a small section of central Whately. When the shallow, subsurface aquifer supplying the private wells in East Whately became contaminated by pesticides in 1984, two new public wells were drilled on the western edge of the Mill River, and the Whately Water Department (WWD) was created to supply the sudden demand. The pre-existing, smaller Water Works continued to operate until it merged with the WWD in 2020.
Whately’s water is still susceptible to vulnerabilities, however. The current public wells are in close proximity to each other and both tap into the same deep aquifer, which is more protected than surface water or the shallow, subsurface aquifer, but is still susceptible to contamination by the water that recharges it. Engineering studies suggest that recharge primarily enters the aquifer along edges of the valley and in areas north of the wells (Mass DEP “Whately SWAP”). Although the deep aquifer is under a 100-foot layer of clay that naturally prevents contaminant migration from the ground surface, the aquifer is considered highly vulnerable to contamination, as there is some evidence that the layer “pinches out” where much of the recharge is likely to occur. There is also no comprehensive understanding of the extent and consistency of this protective clay layer, so pinpointing additional areas on the surface that impact the aquifer directly, including areas that may be outside town boundaries, is challenging. The identified aquifer recharge area within Aquifer Protection Districts, Zone II, is where land use is likely to have the most direct impact on aquifer
health. High levels of sodium in Whately’s water supply have been attributed to the use of road salt; Interstate 91 runs along the eastern side of the Zone II protection area. Because of the interconnected nature of water systems and the uncertainty of where the aquifer may be vulnerable, keeping all surface waters and wetlands healthy is imperative for the quality of the groundwater Whately residents and businesses rely on.
Because of the location of the wells at the base of the uplands in Central Whately, only Central and East Whately are connected to the public water supply. Residents and farms in West Whately at a higher elevation than the public water supply rely on private wells. Even though FEMA assisted the town with moving the Mill River to a former meander channel farther from the Whately Water Department wells in 2015, concerns that they are susceptible to flood damage and contamination were still reported in the 2020 Hazard Mitigation and 2021 MVP Plans. This was not deemed a vulnerability in the 2023 Water System Capital Improvements Plan (Resilient Civil Engineering, P.C.).
The supply system still requires expansion to meet requirements from MA DEP that have been put in place to ensure emergency preparedness, like backup power for the pumps and increasing the draw capacity to create redundancy in the distribution system, and that also protect the sustainability of the hydrology through times of drought and for the long term. The recommendations in this document seek to protect and enhance the quality and quantity of Whately’s drinking water resources.
54 | Water Use
Ryan Reservoir
Whately Water District Wells Farms of East Whately
Private Wells of West Whately
Lower Aquifer
Sand + Gravel Clay
Subsurface Aquifer
Bedrock
Bedrock Aquifer
GlacialTill Mill River Connecticut River
I-91
The City of Northampton Drinking Water Systems of Whately
Climate Change & Water Quality
The quality and availability of the drinking water supplies for Whately, Northampton, and South Deerfield are inextricably intertwined with the the impacts of climate change and human development on the local hydrologic cycle.
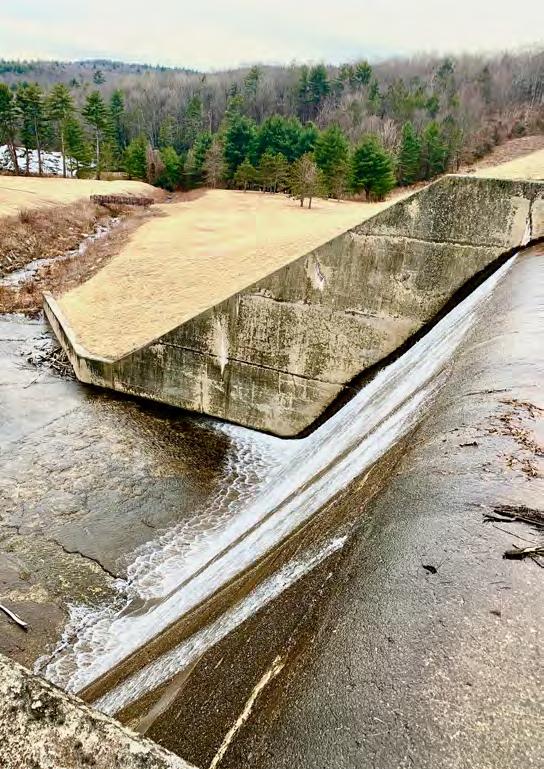
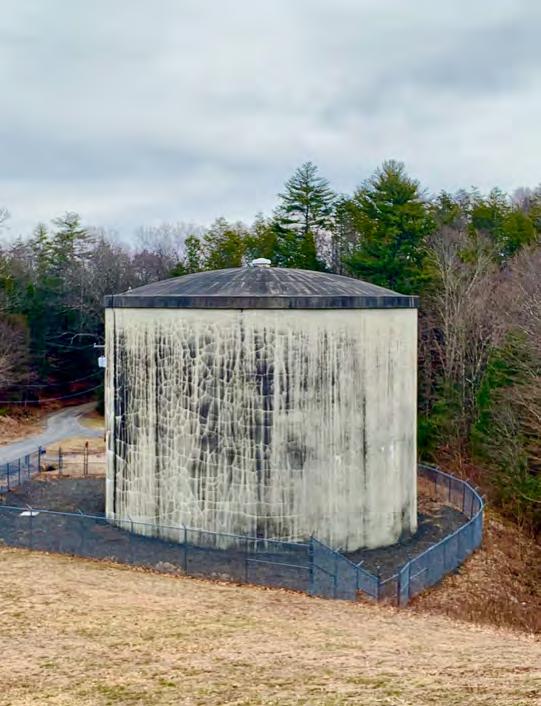
Increased water temperatures can cause eutrophication and excess algal growth in reservoirs and other surface waters, which reduces drinking water quality. Drinking water sources can also be compromised by increased sediment or nutrient inputs from runoff during and after extreme storm events (EPA). Climate change is also impacting groundwater recharge. Changes in the water cycle affect the amount of soil infiltration and deeper percolation that occurs, which can diminish groundwater recharge. Rising temperatures are increasing evaporation of water from land, which also reduces the amount of water available to replenish groundwater (Wu et al.).
Dams & Water Quality
Ironically, despite the existence of dams for providing drinking water, they cause massive negative impacts to water quality. Organic materials that would usually flow through the entire extent of a river get built up behind dams and consume large amounts of oxygen as they decompose. This can cause algae blooms which sometimes leads to oxygen-starved “dead zones.” Algal blooms increase cleaning costs, and dead zones aren’t able to support aquatic life. Meanwhile, the absence of materials like rocks, wood, and sand beyond the dam prevents the formation of quality habitat and riparian corridors downstream (Scheer and Moss). Dams also prevent fish migration, limiting their ability to access spawning habitat, find food, and escape predators. The periodic releases of water from reservoirs also destroy natural seasonal flow variations which would otherwise trigger natural growth and reproduction cycles in many species (“Dams & Hydropower”).
Several years ago, Northampton’s drinking water supply managers, at the request of Whately’s Conservation Commission, conducted a study to see if it was possible to increase the steady baseflow of the West Brook beyond the Ryan Reservoir for increasing the ecological health for aquatic species. According to their engineering team, Northampton is not able to increase the baseflow while maintaining safe reservoir levels for drinking water quality (Stacy).
Water Use | Water Quality | 55
This Northampton Reservoir dam in northwest Whately is one example of the grey infrastructure supplying drinking water to other towns.
This tank holds water for the Deerfield Water supply by the Whately Glen.
Water Use
Whately Public Water Supply Use
Private residences use the largest amount of Whately’s public water supply, at 68% of total water usage. Commerce and industry in town are the next biggest consumers of the public water supply, collectively using 23%. The Yankee Candle factory, which is Whately’s largest employer and the largest employer in Franklin County, uses the most water of all the commerce and industry operations in town (Whately Open Space and Recreation Commission).
Agriculture makes up only 8% of public water supply usage--a surprisingly small percentage for a town with so many farms. This is likely because many farms source their water mostly from private wells and by pumping water from the Connecticut River.
If water becomes an unreliable resource, this could threaten the stability of commercial and industrial stakeholders like Yankee Candle, which the town relies on as a source of tax revenue. Additionally, although the agricultural industry uses a surprisingly small amount of town water, yields are deeply affected by flooding and drought. Strategizing to protect and improve water quality and availability for all water users through the impending impacts of climate change is foundational to maintaining a healthy town constituency.
Whately Public Water Supply Use 2022
Recreation
Currently, there is not much access to water for recreation in Whately. There is a desire to improve access to swimming and boating opportunities in town including access to the Connecticut River. The Tri-Town beach area is the one available recreational swimming spot, however water quality is a frustration for community members. It is frequently closed during the end of the summer due to temperature and bacteria concerns.
Whately Oaks CT River Paddlers Tent Site is a campsite for boaters but is not accessible by land--only to boaters passing through on the Connecticut River. There are no commonly known or used swimming holes (Whately Open Space and Recreation Commission 7-12).

56 | Water Use | Current Practices
Residential 68% Agriculture 8% Commercial 17% Industrial 6% Municipal 0% Other 1%
Data from Whately Water Department
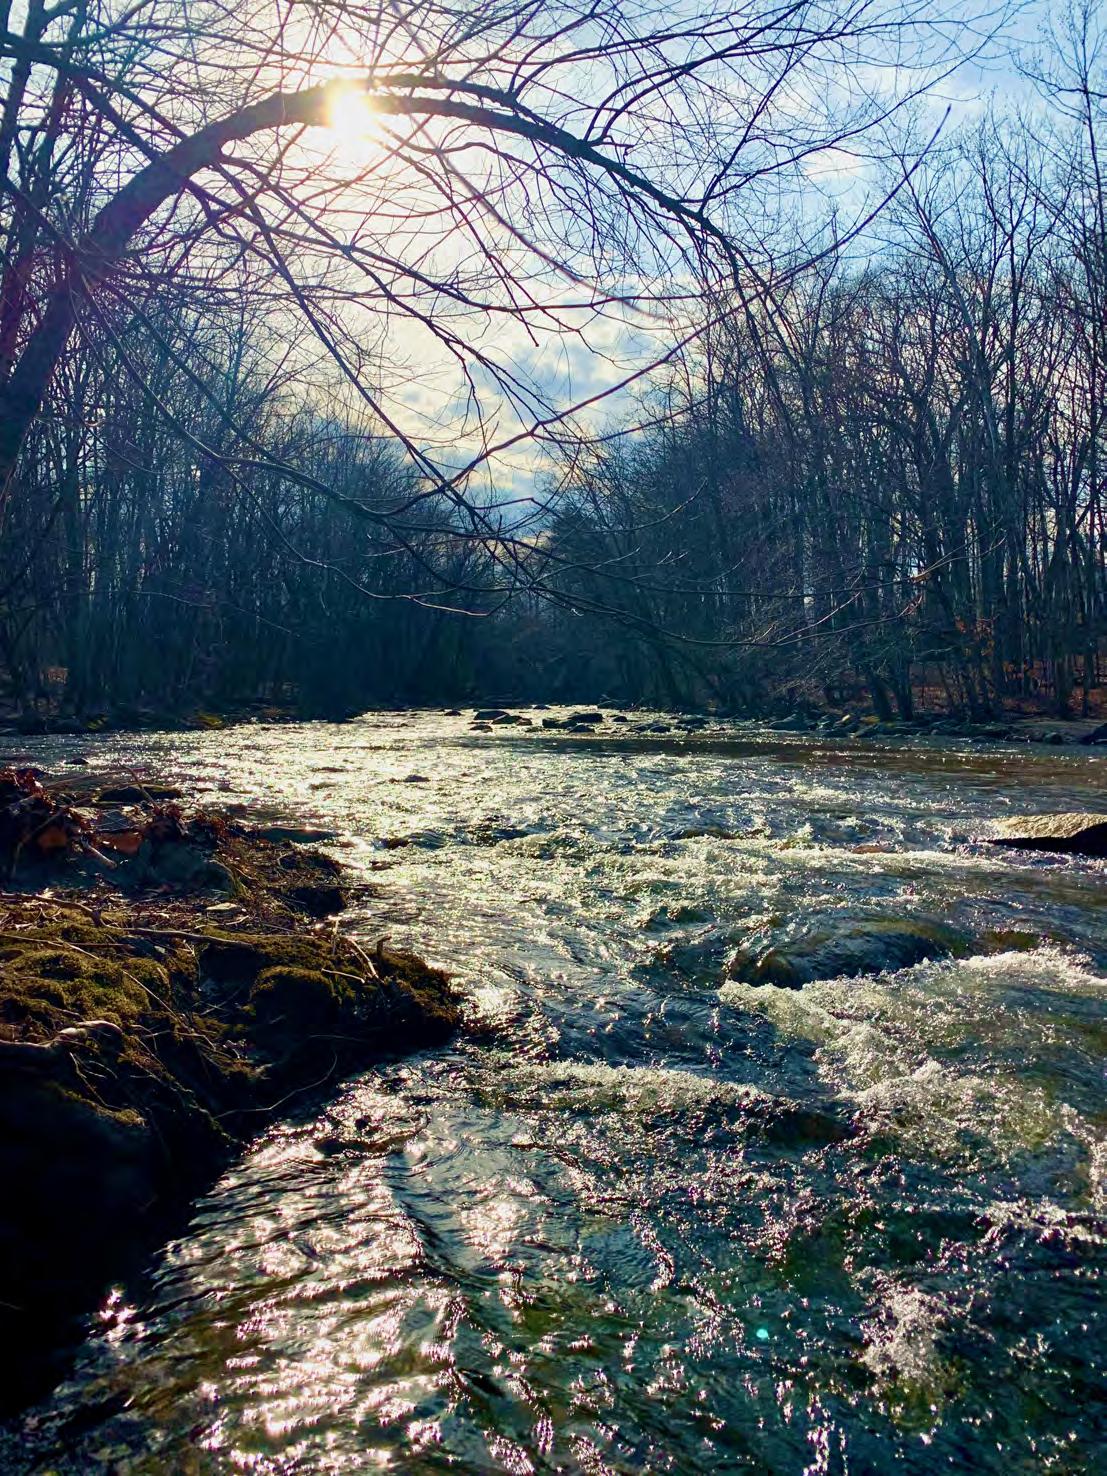
Title | Section | 57
The Mill River Northampton, which has a handful of headwater streams in Whately, flows south to Northampton.
 The Connecticut River flows through agricultural lands of western Massachusetts. Source: Adobe Stock
RECOMMENDATIONS
Whately already has many policies and practices in place that either directly or indirectly aim to protect water quality and regulate the water cycle in town. Low-impact development incentives, an active conservation commission, and aquifer protection overlay zones are all pieces in the existing water-protection puzzle. The recommendations that follow aim to build on, amplify, and fill in gaps in that puzzle.
Each recommended action is based on best practices from the emerging water resilience field. The first recommendation suggests policy and funding strategies for pairing conservation and development in ways that support ecosystem health and water quality in town. The second identifies specific land-management practices for cleaning water and mitigating flooding in town and suggests locations to prioritize implementing them. The third recommendation makes the case that working at the watershed scale, rather than exclusively the town scale, is foundational to increasing the health of Whately’s water and bolstering the town’s capacity to mitigate and adapt to the shifting nature of water-related weather events.
RECOMMENDATION 1
• 1.1 Promote the benefits of the Conservation Restriction Review Program and the Agricultural Preservation Restriction Program to land owners across Whately.
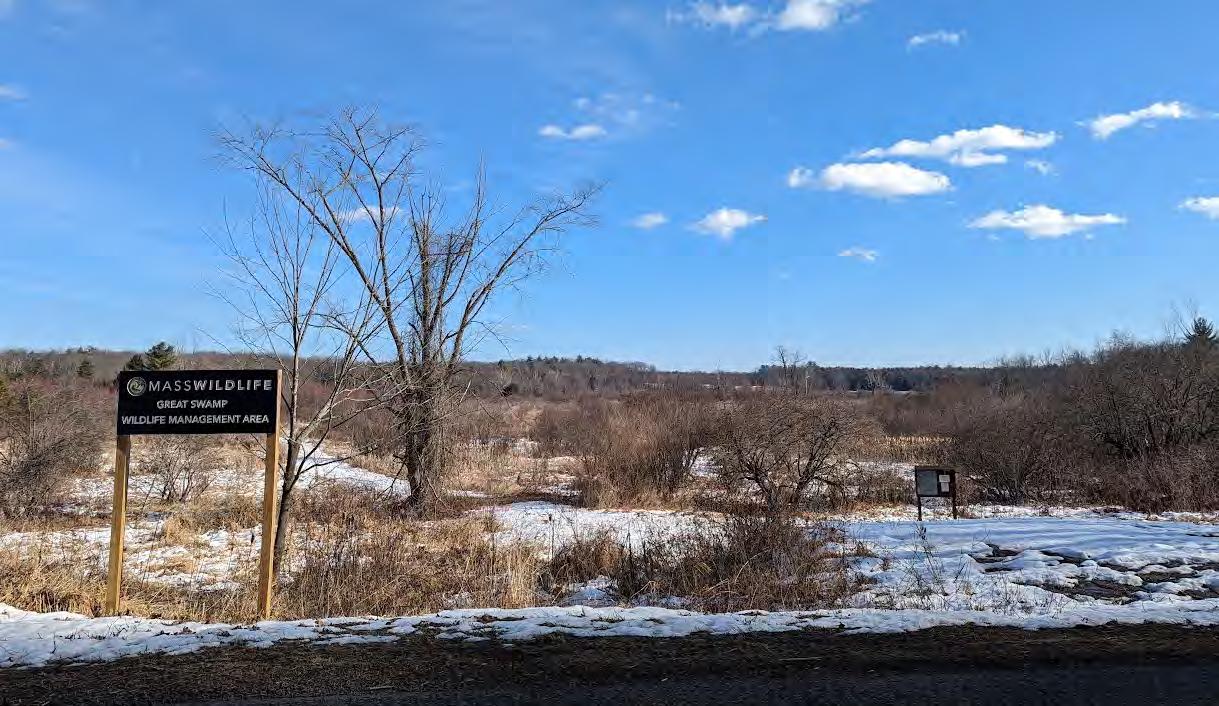
• 1.2 Place land into permanent protection for strategic conservation of forest ecosystems and aquatic habitat to protect water system health, the aesthetic quality of the community’s landscape, and greater ecological resilience
• through transfer of land owned by the Town of Whately to the ownership of the Whately Conservation Commission.
• via Whately’s Conservation Commission through direct aquisition and/or holding the CR for properties aquired by state and nonprofit partners.
• by exercising the right of first refusal on priority parcels that are transferred out of Article 61 and that contribute significant ecological benefits.
• 1.3 Hire a town Natural Resource Manager to coordinate the stewardship of these permanently protected town lands so the ecosystems they protect can continue to mitigate flooding, be stable during drought, and continue to support and enhance water quality.
• 1.4 Encourage the stakeholders of conservation lands in Whately to annually convene to discuss the ecological challenges, assets, and management goals of individual properties so as to determine opportunities for collaborative solutions and to develop a conservation management strategy for the collective to implement together.
60 | Recommendation One | Conservation & Water-Wise Development
Recommendation One
Pair natural resource conservation with proactive, water-wise development strategies.
• 1.5 Create zoning districts that promote conservation-oriented growth by clustering and concentrating development and placing undeveloped parts of parcels under CRs. Allow for more types of mixed-use by special permit.
• 1.6 Acquire land as a municipality to be used for joint conservation and affordable housing development.
• 1.7 Update the municipal Master Plan to unlock the ability to receive funding and to renew a development strategy that continues to prioritize natural resource protection.
• 1.8 Develop a Housing Production Plan (HPP) to better understand Whately’s specific housing needs and outline priorities and pathways for strategic development that aligns with the town’s other values of natural resource protection and economic growth. Developing an HPP and displaying progress in affordable housing can restore the autonomy of the town’s Zoning Board of Appeals in vetting comprehensive permit (40B) applications.
• 1.9 Perform a Town Wastewater Study to determine options for infrastructural upgrades and to identify priority service areas or areas well-suited for a 40R Smart Growth District based on where denser development is recommended from previous plans.
Recommendation One | Conservation & Water-Wise Development | 61
Conservation
Conservation in Previous Planning
The 2021 OSRP and 2011 Master Plan already provide comprehensive background, community feedback, analysis, strategy, and resources to achieve the conservation and development goals of Whately. This chapter synthesizes the information in these documents that is most pertinent to and aligns most specifically with maintaining and improving water quality and availability, bolsters these plans’ recommendations with additional analyses, and adds updated information where available.
Along with the 2021 OSRP and 2011 Master Plan, Whately also completed an Economic Development Plan in 2018. These documents all inform the development goals of Whately. The 2019 Massachusetts Rural Policy Plan and 2013 Sustainable Franklin County Plan help place Whately and its municipal values within the greater state and county landscape by identifying regional patterns and determining larger-scale goals and recommendations.
This chapter explains how development can impact water quality, examines Whately’s recent development trajectory, and considers the uncertainties of the town’s future growth in an unprecedented national and regional development context. Finally, this chapter synthesizes the information and recommendations from previous town and regional documents that are most pertinent to the promotion of water quality and availability, and bolsters existing recommendations with additional analyses and graphics.
Why Conservation?
Functional ecosystems, particularly the forests and wetlands that extend across much of Whately, are critical to the overall health of a watershed. These ecosystems provide necessary functions to slow, clean, and infiltrate water to protect aquatic and riparian systems from pollution, sedimentation, and temperature fluctuation. Protecting just waterways and water bodies alone from development would not ensure water quality and availability without the additional protection of interdependent ecosystems on the land that drains into them.
Massachusetts’ Executive Office of Energy and Environmental Affairs (EEA) is the umbrella for all state conservation-related entities. The EEA identifies land protection as a core strategy for preserving “natural infrastructure,” specifically mentioning the role forests play in filtering drinking water that “reduces the need for costly state and municipal investments in man-made drinking and storm water filtration infrastructure” (EEA). The link between conserving land from development and the protection and improvement of water supply is repeatedly stated as a primary motivation for conservation by organizations at all scales, whether federal, state, or regional.
According to Whately’s OSRP, the Whately Conservation Commission has assessed that “nearly every remaining unprotected open space parcel has conservation value” for “scenic, aquifer protection, wildlife and biodiversity, historic and agricultural resources” (Whately Open Space Committee, 7-5). Although they provide minimal tax revenue for the town, they also do not require the same amount of public services as other land uses and contribute valuable ecological services resulting in a general tax gain for the town (Whately Open Space Committee, 3-30).
Defining Conservation
“Protected land” is an umbrella term for parcels that have restrictions preventing development, whether temporary or permanent. “Conserved land” specifically refers to parcels that have transferred or placed restrictions on the deed so as to permanently protect it from being developed. For the purposes of this document, the goal of “conservation” equates to the protection of land in perpetuity via legally binding terms along with strategic planning and active land management for ecological resilience to climate change impacts.
62 | Recommendation One | Conservation & Water-Wise Development
Whately Open Space Committee
Areas of Significant BioMap Habitat
This map stacks the different BioMap layers to determine where the different habitat types overlap the most, factoring in all scales of conservation importance – state, regional, and municipal. The darker the area, the more types of habitat and/or the more scales of habitat importance. See pages 26-27 for details on BioMap layers.
West Whately is notable because of large areas of intact forest core habitat and landscape blocks, vernal pool hotspots, rare species core habitat around Mount Esther, local aquatic and riparian habitat significance, and its overall importance for regional habitat connectivity.


Mill River corridor is one of the most important ecosystems in Whately because it functions as rare species core habitat, wetland core habitat, priority natural commities core habitat, wetland and landscape blocks of local significance.


The Connecticut River and the riparian buffer along its shore is most notably an aquatic and rare species core habitat.
Areas with least habitat significance tend to match the pattern of human development.


Because 82.4% of the land in Whately is considered important habitat for conservation, Whately’s development trajectory will require proactive intention to reduce altering or fragmenting these ecosystems. For the community to prioritize the protection of the major rivers and forest blocks within Whately would contribute to achieving longterm, wide-ranging goals for healthy biodiversity and environmental stability.


Recommendation One | Conservation & Water-Wise Development | 63
Permanently Conserved and Temporarily Protected Land
Land Ownership in Whately
Land in Whately is owned by a variety of different entities and held under different levels of protection. Understanding the distribution of private, public, and non-profit owners of land with existing protections within Whately and the extent of those protections reveals opportunities for aligning management strategies and identifying areas in the landscape to prioritize next for conservation.
Permanently Conserved Land
State and Nonprofit Conservation Agencies
Land owned by a state conservation agency, a nonprofit conservation organization, or land trust for the purpose of habitat preservation and outdoor recreation is considered permanently protected from development.
State Departments:
Department of Fish and Game (DFG)
Department of Conservation and Recreation (DCR)
Municipal Entities
Nonprofits/Land Trusts: Kestrel Land Trust Mass. Audubon Society
Private Landowners
Private landowners can attach a Conservation Restriction (CR) to the deed for their land. This ultimately cedes the rights to development to a conservation entity like the ones mentioned above, and establishes a plan for use and maintenance developed by wildlife biologists. To conserve farmland, landowners can use the Agricultural Preservation Restriction (APR) Program which cedes development rights to the Massachusetts Department of Agricultural Resources (MDAR). MDAR offers farmland owners the difference between the fair market value and the agricultural value of their farms, and strives to develop a permanent deed restriction that does not impose on the land’s agricultural potential (Mass.gov, APR Program).
Land owned by a municipality or water district for the purposes of water supply protection under Article 97 is considered permanently protected. Land designated as cemeteries and land held and managed by municipal conservation commissions is considered permanently protected (Whately Open Space Committee, 5-16). Whately’s Conservation Commission currently does not own any land, though it holds the CR for the Whately Woods, owned by Kestrel Land Trust.
Municipalities:
City of Northampton
Town of Deerfield
Town of Whately
By eliminating the ability to develop these lands, property tax revenue often drops because these lands are no longer taxed for their development potential. APRs require a local match of funds: Whately has developed municipal infrastructure that reduces the required match from 20% to 5%, dramatically increasing the likelihood of successful acquisition (Whately Open Space Committee, 5-3).
Holders of Rights of CRs and APRs on Privately Owned Land in Whately:
MDAR
DCR
DFG
Franklin Land Trust
Kestrel Land Trust
Hilltown Land Trust
64 | Recommendation One | Conservation & Water-Wise
Development
5,781 acres, or 43.7% of Whately’s 13,227 acres of land has some level of protection from development.
Of this, 3,994 acres, or 36.6% of land in Whately, is considered permanently preserved.
Land with Permanent Protection


This map shows where significant habitat is permanently protected and the types of landowners that are responsible for holding the deeds to these conserved lands in Whately.


Privately-owned, permanently protected land is largely in the agricultural area of East Whately. Nonprofit entities only own a small portion of land outright, but play a large role in the conservation of land in Whately by holding CRs for private landowners. The only land permanently protected by the Town of Whately is the land around the public wellheads. The City of Northampton is by far the largest municipal landowner in Whately, protected large tracts of land for water supply protection.The state-owned sections of land all serve important habitat funtions and are conserved as three separate Wildlife Management Areas.


Despite relatively contiguous conservation in parts of West Whately, there are multiple different stakeholders involved who may have different conservation strategies and approaches. There are still areas with the most ecological significance in this area that have yet to be placed under permanent protection.

Most of the privately protected land in Whately conserves important working landscapes, but is not necessarily protecting ecosystems important for habitat conservation. Most of the Mill River corridor, Whately’s most significant ecological asset, is vulnerable to development. The remaining areas in West Whately and along the Mill River are important areas to prioritize for permanent protection.

Recommendation One | Conservation & Water-Wise Development | 65
Temporarily Protected Land
In addition to lands considered permanently protected, there are lands that are protected currently, but only temporarily or in a limited way. This means that there is some amount of land in Whately that is protected now, but could become vulnerable to development in the future. Land enrolled in Chapter 61 and land owned by the Town of Whately for purposes other than water protection are the two types of land in Whately that have temporary or limited protection.
Whately-Owned Land
Municipal lands that are not cemeteries or are not held by the Conservation Commission can be converted for a different land use or sold based on a Town Meeting vote (Whately Open Space Committee, 5-19).
Privately Owned Land in the Chapter 61 Program
Parcels enrolled in Massachusetts’ Forest Tax Program Chapter 61’s Current Use Tax Programs (Chapter 61) are considered temporarily protected because they must be reapplied for either every year or every 10 years, depending on which program. They can also be withdrawn from the program for development at any time. If the land use is changed after withdrawal, payment for the tax difference plus interest is required. There is no penalty if the use of the land remains as open space, but this opens up the opportunity for future development to occur on the land without restraints.
Landowners who maintain their property as open, undeveloped space for timber production, agriculture, or recreation can enroll in the program. The program is “designed to help landowners with the costs to maintain farms, natural areas, and working forests” (Mass.gov, Chapter 61).
The Vulnerability of Permanence
The “permanence” of permanently protected lands is still subject to vulnerability, although retraction of permanent protection is rare. CRs, APRs, water supply lands, and lands held by agencies under the Massachusetts Executive Office of Energy and Environmental Affairs (EEA) – in Whately’s case, lands owned by DCR or DFG – are p ommon, lands under this protection can be disposed of with a two-thirds vote of the State Legislature. While the EEA has a “no net loss” policy, it’s unclear if the replacement land would necessarily benefit Whately directly (Mass.gov, Article 97). It is unlikely that the water supply lands will be jeopardized anytime soon, but more protections could be placed to ensure Whately can control areas critical to the health of its waterways if other municipalities ceased to use the areas as water sources.
Most-to-Least Vulnerable Land Types
Unprotected, privately-owned, developable land
Temporarily protected private lands in Chapter 61
Whately-owned lands with limited protections
Lands owned by conservation organizations or protected by CRs and APRs under Article 97
Water supply lands protected by Article 97
Land owned by state departments for conservation and open space
66 | Recommendation One | Conservation & Water-Wise Development
CHAPTER 61 Forestry 17 parcels 637 acres CHAPTER 61A Agriculture/ Horticulture 65 parcels 1306 acres CHAPTER 61B Open Space/ Recreation 12 parcels 531 acres U.S. Census Bureau 2021 American Community Survey Five-Year Estimates % of Whately’s land cover >21.0% 12.7% 0.8% 13.1% 8.9% 12.2%
Land with Limited or Temporary Protection


This map shows that the Town of Whately owns a very small amount of land–only about 110 acres. However, some of it is located on significant habitat. The Town can still contribute to habitat protection by transferring these landholdings into permanent conservation.


This map shows land protected under Chapter 61 that is not also protected by a CR or APR. The town can approach the landowners of properties on areas with particularly significant habitat designations about putting a CR or APR on their land, or utilize their right of first refusal should any of those significant habitat parcels go up for sale.
Of the 2,474 acres of Whately’s land enrolled in Chapter 61, 1,677 are not permanently protected by a CR or APR.


Recommendation One | Conservation & Water-Wise Development | 67
Analysis: Identifying Priority Areas for Conservation
Process and Considerations
According to the OSRP, the Town recently developed a protocol for considering land best suited for the APR program, but mentioned that the town would benefit from prioritizing potential areas for protection and creating a list of parcels that can be used by the town committees, commissions, and local land trusts to expedite acquisition for purposes beyond farmland protection. It suggests focusing attention on parcels that are less likely to be prioritized by other public entities who are invested in
conserving parcels adjacent to their current land holdings to bolster the protection of priority habitats and water supply resources (Whately Open Space Committee, 7-5).
This analysis identifies undeveloped land that has the potential to be developed, highlighting areas that contain particularly important ecosystems that help maintain and improve water quality in Whately.
The hatched lines show parcels that are unprotected, that do not have existing development on them, and that do not have land use codes in tax assessor data that deems them “undevelopable.” This map does not show the full scope of land that could be developed, as it does not include areas that have already been developed on but that can be further subdivided for development.
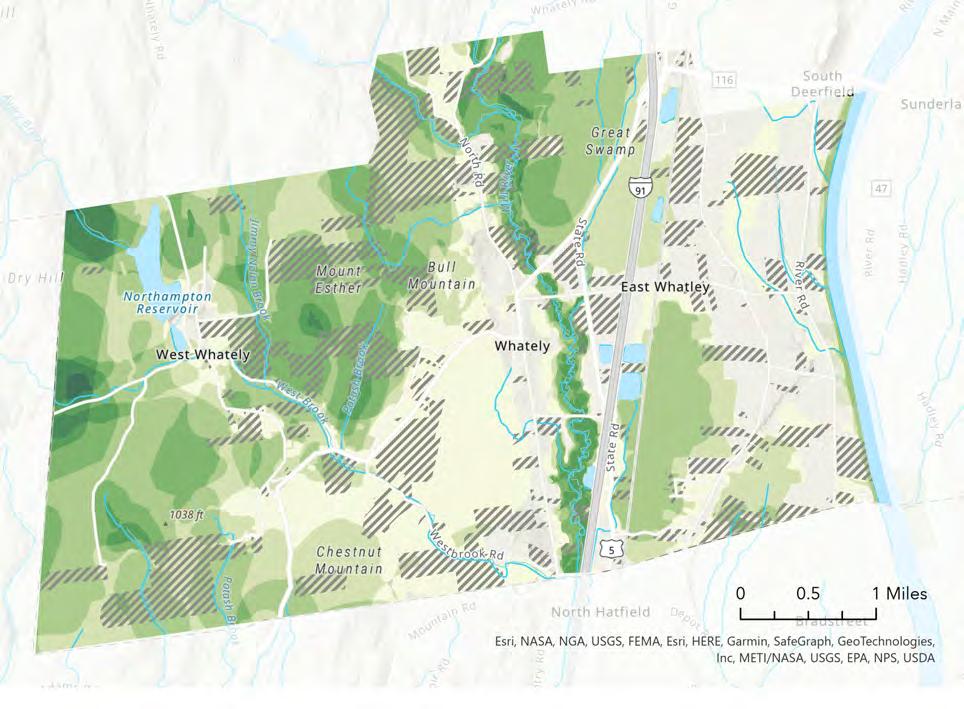
68 | Recommendation One
These highlighted parcels are developable parcels that overlap with at least four BioMap habitat types and thus carry the most ecological significance at the state, regional, and Whately scale. Parcels outlined in orange are currently enrolled in the Chapter 61 Program which means they are temporarily protected from development and that the Town could exercise the right of first refusal should any of those properties be sold.
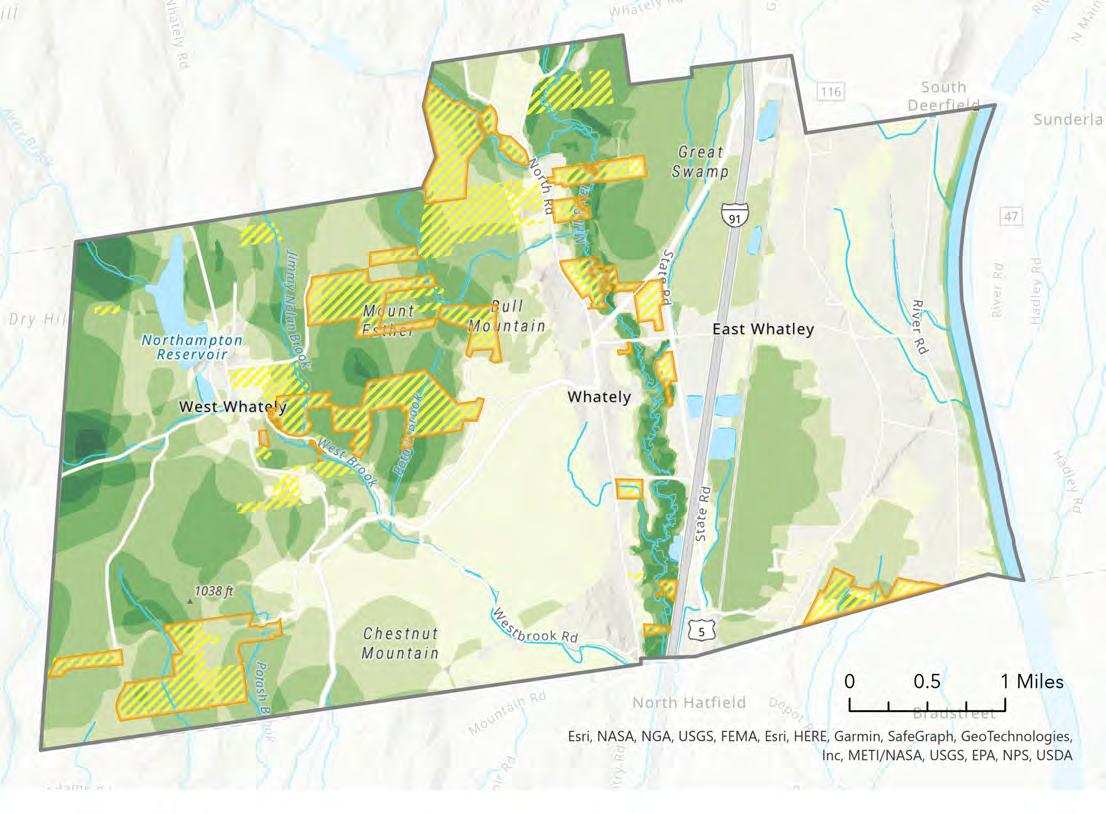
| Conservation & Water-Wise Development | 69
Conservation Strategies
Reduce the Vulnerability of Land, Including Properties with Temporary Protections, to Future Development
The town can contribute to land protection most easily by promoting CRs, APRs, and Chapter 61 to private landowners. Whately may also consider which parcels they own are most relevant to water and natural resource protection and transfer them to the Conservation Commission for permanent protection.
The town can also acquire more property via the Conservation Commission, whether as the direct deed holder or as the holder of CRs for land owned by a conservation entity. Whately can also stategically exercise the right of first refusal on Chapter 61 land with ecological significance.
Manage Land for a Changing Climate
As expressed on MassWildlife’s website: “Although land protection is a centerpiece of the Commonwealth’s conservation strategy, land protection alone is not enough for long-term conservation in Massachusetts. Some species and community types need direct intervention to remove invasive plants or restore and improve habitats” (Mass. gov, Land Protection). Especially given the pressures local ecosystems face with the changing climate, protection will need to be paired with active stewardship and restoration.
The parcelization of the landscape and the establishment of private property ownership are constructs that have become normalized practice since the onset of colonization over the last 300 years. The parcel-by-parcel development, management, and neglect of land has played a large role in the treatment of a natural environment as fracturable or expendable, as if the holistic health of the landscape were not the very root of humans’ ability to survive and sustain thriving communities. Communities now face the implications of environmental systems overloaded or extracted from, and implementing strategies to address these problems at an effective scale is made particularly difficult with the parcelization and individual ownership of land.
The ownership of land by individuals and entities who all have different values makes managing the land at effective scales for ecological health difficult. A one-acre forested parcel within a greater context of primarily lawns and roads, for example, provides an incomplete set of habitat needs that cannot support species like wideranging mammals that require many acres of contiguous forest to adequately feed and breed. Conflict can arise between owners of two adjacent parcels of conserved land if the owners have different management goals. A parcel managed for vernal pools and wetlands may encourage ponding across property lines on a neighboring parcel preserved for agriculture; in turn, excess nutrients from the agricultural soils may threaten the viability of those sensitive breeding grounds.
In acknowledging that “land ownership” has prevented functional, large-scale, resilient land management historically, private and public land owners can operate
within this system by continuing to weave together a network of connected, undevelopable parcels for conservation, while also better collaborating to manage the lands at a scale more effective for collective resilience to climate change.
Currently, the town has limited capacity for maintenance of town land. By hiring a consultant or employing a town Natural Resource Manager to develop management plans for town-owned properties, Whately can apply for grants to fund maintenance and restoration projects, contributing to the mosaic of stewardship of regional ecological health. Approaches to land management for water system health that could be applied to conserved land are recommended in the following chapter.
This Natural Resource Manager and the Conservation Commission could organize an annual convergence of the owners of conservation land in Whately to develop a conservation strategy that supports specific management goals within the community while connecting to regional goals and recommendations. This meeting could also track ecological constraints and successes within the town over time; facilitate the exchange of perspectives, expertise, and successful tactics; and serve as a platform to notify the larger community of funding, resources, and important updates. Creating subgroups for each tract of contiguous conservation land could provide an opportunity for different stakeholders within the tract to discuss ecological challenges, assets, and management goals on their individual properties, and to identify ways that implementing larger landscape solutions across property boundaries could provide mutual benefit. Developing land management strategies for Whately’s greater landscape of conserved land, and promoting collaboration within each collective network of contiguous parcels, could result in more effective resilience at the individual parcel scale.
Coordinated, active land management across different ownership types can be a challenge, but intentional stewardship of these lands is a necessary component of conservation to restore and maintain healthy ecosystems and working landscapes that directly influence long-term water quality.
70 | Recommendation One | Conservation & Water-Wise Development
Permanently Protected vs. Vulnerable Habitat


This map suggests what the landscape of important habitat in Whately might look like if high-impact development were to encroach into these areas.


Recommendation One | Conservation & Water-Wise Development | 71
How Human Habitat Impacts Water System Health
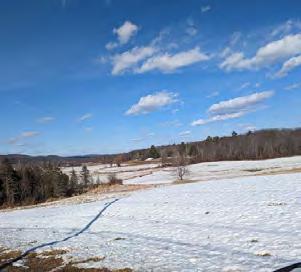
The Impact of Development on Water
Impervious surface | Impervious surfaces prevent localized percolation of water into the ground which can intensify the rate of runoff, causing erosion. They can warm the temperature of runoff and can collect pollutants, excess sediment, and nutrients. This negatively impacts the health of aquatic organisms–particularly cold water fish and rare and sensitive species–and the greater ecosystems that rely on them. Because of their low percolation rate, turf lawns can yield as much runoff as paved surfaces.
Pollution | Oil and gas from cars, pesticides, and road salt are all examples of contaminants that can be carried by runoff from impervious surfaces before merging with waterways. These are all considered non-point source pollutants. Point source pollutants are easier to identify sources of contamination like hazardous waste facilities or car washes.
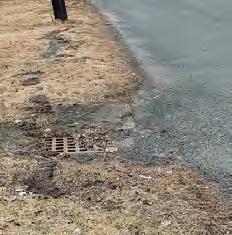
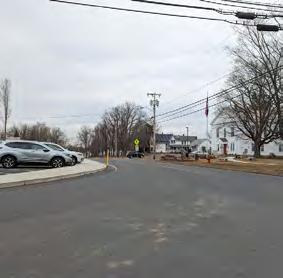
Water flow disruption | Damming and diverting water and transporting it out of its natural hydrological cycle can cause irregular water flow that is disruptive to the life cycles of aquatic organisms. Attempts to restrict rivers’ tendency to alter course can result in flooding.
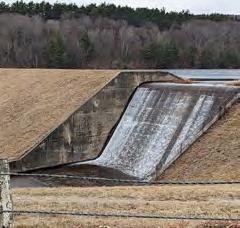
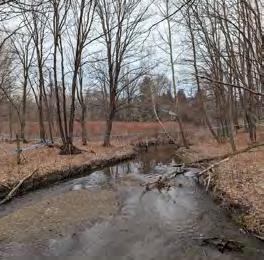
Sedimentation and erosion | Sediment can enter waterways via runoff from impervious surfaces or from streambank erosion. When vegetation is removed from the river’s edge, the shore lacks stability and can erode away into the water, especially if the rivers’ natural meander has been altered. Floodwaters during periods of intense precipitation or from areas with poor drainage can also deposit debris into water systems.
Ecosystem fragmentation | Many bird and animal species need to cross a broad geographic range, but development can reduce the amount of viable habitat and interrupt safe connectivity corridors.
72 | Recommendation One | Conservation & Water-Wise Development
This snapshot of land use in Whately shows impervious surfaces – including structures, roads, and lawns – as dark grey, agricultural and pasture lands as light yellow, shrubs and meadow as light green, and forest as dark green.
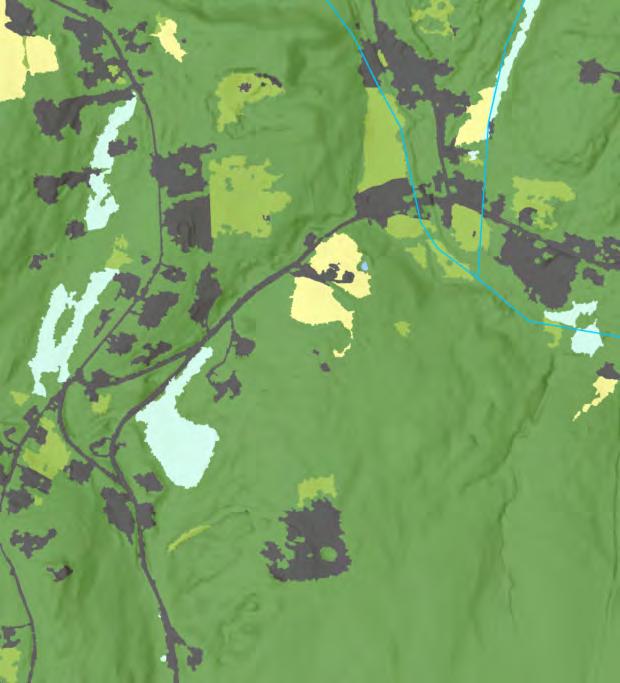
Notice how grey lines have begun sectioning off segments of forest, creating a patchier ecological mosaic.
Reducing Sprawl
The typical pattern of rural development in America is for singlefamily homes on large parcels to spread across the landscape over time. This pattern, referred to as sprawl, causes ecological fragmentation, increases social vulnerability of residents during emergencies, and requires higher use of fuel because of home distance from amenities. Further, connecting homes to services often uses municipal funds inefficiently. As stated in the Rationale for Smart Growth Fiscal Impact Analysis (Nelson, Nicholas, and Juergensmeyer, 6), “one mile of infrastructure costs roughly the same to build no matter where it is, but that mile can serve many times more people in a high-density place than in a low-density place.”
This development style directly affects water sources by increasing runoff and non-point source pollution, especially from roadways, while demanding more from municipal funds and services. Continuing sprawled development reduces the extent and capacity of naturally filtering ecosystems, and was identified in both the OSRP and Municipal Plan as a threat to the very landscape character that residents love the most about living in Whately.
Recommendation One | Conservation & Water-Wise Development | 73
What Lies in Whately’s Development Future?
A Growing, Changing Whately
Whately’s residential population has trended toward growth, especially in comparison to other towns in Franklin County. Growth at the scale of a small town may seem insignificant, but Whately increased by 51 households, or 8%, between 2020 and 2021–or 15% growth since 2015 (US Census Bureau). Likely in part because the COVID pandemic disrupted many development patterns, Whately has already surpassed many expected population projections which model either population decline (UMass Donahue) or a growth rate so slow that Whately has already exceeded the projection for 2030 by 60 people (FRCOG, 2012 Regional Transportation Plan).
Whately experienced considerably greater change in population in the decade leading up to 2020 than other towns in Franklin County.
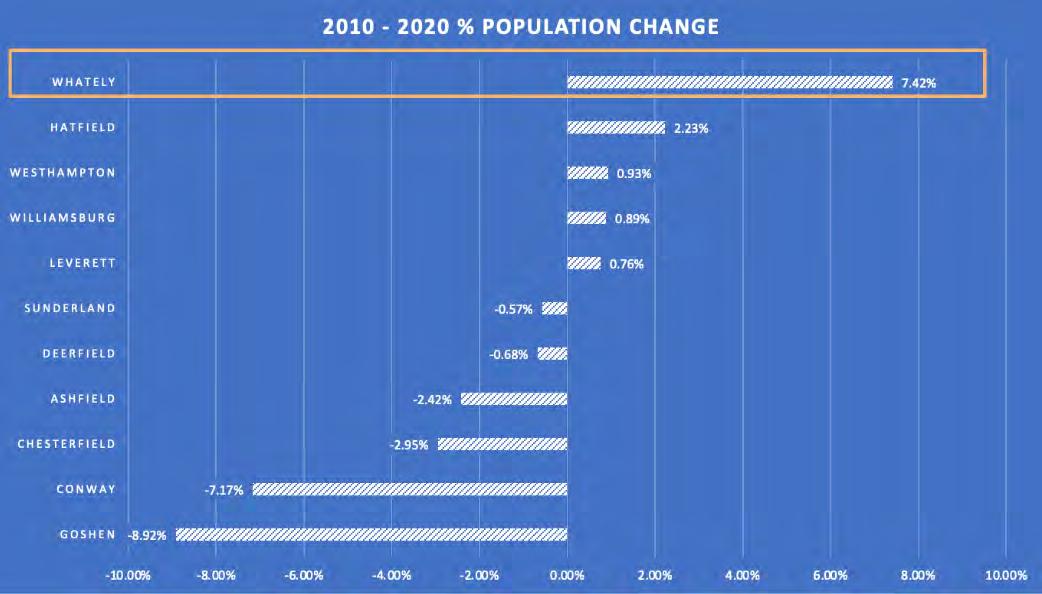
U.S. Census Bureau 2021 American Community Survey Five-Year Estimates
The Cost of Living in Whately
The decrease in older residents may be related to the lack of housing options suitable for elders, a concern expressed in both the OSRP and Master Plan. Most residences in Whately are detached, single-family homes with at least five rooms, which require much upkeep. Residents also require cars to access basic services like groceries or health care and face increased social vulnerability from living alone in rural areas. Although efforts have been made to allow homeowners to develop alternative dwellings on their properties, specifically to provide more opportunities for people to afford staying on their properties, Whately’s cost of living, including fuel for commuting and property taxes, adds to the unsustainability of aging-in-place, especially for elders on fixed income.
While the overall population has recently grown significantly, demographics in town are shifting. The town’s population has historically been older than the county average, though the population’s median age has dropped from 50 to 46 between 2020 and 2021. This may indicate young people moving to the area–65% of new residents in this time period are below the age of 45–along with a 3% decrease of residents older than 50 (US Census Bureau).
Whately’s housing stock and cost of living may be a challenge for sustaining the current population and attracting new residents. Whately’s median household income has historically been higher than the county average and has increased over time, however 70% of new residents in 2021 are making less than Whately’s average income. Monthly housing costs are higher in Whately than the county average, and 27% of Whately homeowners, including households considered middle and high income, are considered cost burdened, meaning 30% or more of household income is spent on housing (US Census Bureau). This may increase if the trend of new residents and regional housing demand continues, or may instead make moving to Whately prohibitive for all but the wealthiest people looking to move to the area. Creating diverse housing stock that offers smaller, affordable options beyond single-family homes may be one way of relieving financial burden on current and future Whately residents.
74 | Recommendation One | Conservation & Water-Wise Development
Housing Needs and Demand
As of December 2022, Whately needs 65 units to meet the goal of 10% affordable units required by the Comprehensive Permit Law, also known as Chapter 40B (FRCOG, SHI). Affordable housing is defined as housing costs not exceeding 30% of household income for households earning at or below 80% of the area median income. Towns with less than 10% long-term affordable housing may be required to allow new housing developments that provide 20-25% affordable housing units, that do not abide by local zoning restrictions. However, because the statute streamlines the permitting process for development that meets the criteria, affordable housing development is much easier for municipalities to initiate. Whately can partner with community development corporations and nonprofit real estate developers who also share the priority of maintaining the town’s rural character and natural resource value.
Developing affordable housing units and allowing for diversity of housing types provides options for cost-burdened Whately residents to remain in the community. By initiating this kind of development, Whately can also participate in ensuring the greater Pioneer Valley can maintain the workforce that is the foundation of this area’s economy, from the people growing the region’s food to those providing educational and social services.
Whately’s Development Pattern
Whately’s convenient location along I-91 and within a 25-minute drive of Amherst and Northampton make it a viable place for second homes and wealthy remote workers as has been the national trend since COVID (Mangold et al.). It is also a potentially appealing town for affordable housing developers trying to meet the increasing demand of the housing market. The demand for affordable housing has ballooned, especially for students and the workforce, as housing costs have escalated and wages have stagnated (RPAC, 56; Sunderland Housing Committee, 46-48).
As an otherwise desirable location because of its beautiful scenery and convenient proximity to larger towns, Whately’s growth and development may actually be more extreme if not for its infrastructural limitations. As a town with no central wastewater system and a limited public water supply system, building or maintaining a residence in Whately is more expensive, and particularly limiting for denser affordable housing. The expense of installing and maintaining on-site septic or wastewater treatment, as well as the spatial constraints posed by these systems, especially for those in West Whately that need to drill private wells for lack of ability to hook up to town water, may explain why, despite incentives like the Open Space/ Cluster Development and Flexible Development bylaws and pressures like the statewide housing shortage, Whately has not experienced more of these types of development. Development continues to take the form of single family homes and segregated uses.
Whately is uniquely positioned to proactively plan for water-wise development in which water system health and drinking water resource capacity informs the town’s growth to meet housing needs and maintain a healthy economy. Acting swiftly to protect undeveloped land that directly plays a role in the health of surface and groundwater in Whately, initiating and encouraging new housing development that meets the needs of the population, and promoting low-impact development of commerce and industry will greatly benefit the town’s resilience going into the future.
The majority of homeowners and renters in the lowest three income brackets are spending more than 30% of the household income on housing, and almost 40% of homeowners making between $50,000 and $74,999 are also cost-burdened. Although this is ultimately a small proportion of overall households because of the town’s predominantly affluent populous, it is still a significant subsect of the community.
Recommendation One | Conservation & Water-Wise Development | 75 TOTAL WHATELY RESIDENTS COST-BURDENED BY HOUSING 158 of 585 Homeowner Households 27% of Homeowners 31 of 96 Renter Households 32% of Renters U.S. Census Bureau 2021 American Community Survey Five-Year Estimates % COST BURDENED HOUSEHOLDS BY INCOME IN 2021 Homeowners Renter Income Bracket Franklin County Whately Franklin County Whately < $20,000 93% 100% 80% 100% $20,000 - $34,999 64% 85% 81% 100% $35,000 - $49,999 46% 69% 49% 71% $50,000 - $74,999 30% 39% 25% 0% $75,000+ 6% 8% 3% 0%
Zoning
The Role of Zoning
Zoning districts exist with the intention of directing a town or city’s development in a way that feels logical and safe to the community, by managing where land uses that could be irritating or harmful to people and the environment are allowed to take place. Additional zoning regulations create standards for the design, construction process, and long-term impacts of development. Zoning in rural areas has historically encouraged sprawled development that fragments habitat. However, zoning can be an important tool for protecting natural resources from the potentially harmful impacts of community growth.
The OSRP’s Seven-Year Action Plan states that the most important action step is to “[r]eview Whately’s zoning bylaws, subdivision regulations, and general Town bylaws and suggest updates for open space protection, stormwater management, habitat (including pollinator habitat), water resource protection, drought tolerance, and other open space priorities” (Whately Open Space Committee, 9-4).
Whately already has protections for natural resources in place that were initiated or are enforced at both the state and local level.
State Protections
Wetlands and Rivers Protection Acts: protect wetlands, vernal pools, rivers, and floodplains by prohibiting or limiting development or alteration within or near resource areas.
Natural Heritage and Endangered Species Program: regulates projects that may alter habitat for rare and endangered species.
Massachusetts Endangered Species Act: prevents removal of rare and endangered species.
Forest Tax Program Chapter 61: gives preferential tax treatment to landowners with over 10 acres of contiguous forest land who maintain their property as open, undeveloped space for timber production, agriculture, or recreation.
Article 97: includes water supply protection, CRs, and APRs.
NPDES Stormwater Permits: a federal regulation administered through the state that regulates stormwater discharges for construction exceeding one acre.
Identifying Vulnerabilities
Despite having an Aquifer Protection District, many pre-existing sources of non point pollution were identified in the 2003 Source Water Assessment and Protection (SWAP) Report within this primary aquifer recharge area (3-29). Single family homes–Whately’s most typical development type–are not required to submit stormwater management plans, and Low Impact Development is a recommendation not a requirement. Extra protections in this area would be beneficial to enforce.
The Flood Hazard Overlay District is based on FEMA floodplain data is from 1979 and is likely not an adequate gauge of flooding extent and frequency given the change in precipitation patterns observed in the
last few decades and the increases in severity of storm events predicted for the future. Additionally, the data does not adequately consider flood threats to developed areas away from riparian zones that are vulnerable to water damage from ponding on soils with poor drainage. Holisitic consideration would help prevent development in areas that are susceptible to flooding beyond just river floodplains.
The Growth Control Ordinance only allows for multiple building permits of up to 10 units, only 5 of which can be allotted to the same developer in a year. This may not be economically viable for developing multifamily residential dwellings, especially when multifamily dwelling units are capped at 4 per structure. Development that meets 40B requirements could override this restriction.
76 | Recommendation One | Conservation & Water-Wise Development
Local Bylaws
These bylaws contribute to natural resource protection vital to water health by limiting lot coverage of impervious surfaces, encouraging reuse of existing structures to reduce the need to clear land or increase impervious surface by building anew, and instating strict environmental protections for development. Some offer strategies that begin to open the door to economic growth and denser residential development that strategically ties to land conservation.
Aquifer Protection District: prohibits certain land uses and enforces a maximum of 10% lot coverage in the primary recharge area defined by hydrogeologic studies and approved by the Massachusetts Department of Environmental Protection, also referred to as Zone II.
Environmental Performance Standards: applies to all development and includes regulations enforcing on-site stormwater filtration and infiltration if the rate of runoff increases after construction.
Converted Dwellings: allows up to three dwelling units, given one is owner-occupied, in any structure over ten years old and under 35-feet tall.
Converted Historic Municipal, Religious, and Commercial Buildings: allows for more than three residential units per building if water and wastewater infrastructure is sufficient.
Solar Electric Generating Facilities Bylaw: regulates new large-scale ground-mounted solar electrical installations, providing standards for the placement, design, construction, operation, monitoring, modification, and removal of installations to optimize public safety and minimize impacts to environmental, scenic, natural, and historic resources. Requires minimal disturbance to the land and allows continued agricultural use whenever possible. A one-time fee goes to the CPA Open Space Reserve for every acre that had been under Chapter 61 or 61A.
Parking requirements in various sections of zoning bylaws could be amended to reduce the development of excess impervious surfaces.
The constraints in place for the Clustered Development are extremely thorough in protecting environmental resources but may also be phrased in a way that makes compliance too difficult to be a viable development option. Lack of centralized sewer and limited public water supply infrastructure adds spatial and financial constraints that may be hindering the viability of this type of development. Since its adoption in 2010, no developments of this kind have been constructed in Whately.
Single-family dwellings on individual lots and normal agricultural uses are the only uses currently exempt from Site Plan Review that must be presented to the
Flood Hazard Overlay District: prohibits new development or substantial improvements to existing structures within areas designated as most vulnerable to flooding.
Open Space/Cluster Development: allows subdivision for the development of one- to two-family dwellings that sets all undeveloped land – a minimum of 40% of the total parcel – into permanent protection with the intention of preserving natural resources by reducing sprawl and encouraging harmonious development. Facilitates more efficient and economical construction of housing and necessary infrastructure.
Flexible Development: allows for subdivision of a parcel in the Agricultural/Residential District into up to ten lots, granting flexible lot size and frontage requirements with the intention of encouraging development that is responsive to Whately’s topography and that preserves unique natural and cultural features.
Planned Industrial District: at least 25% of the total parcel must be set aside as permanent open space.
Site Plan Review: includes a detailed ecological report and analysis. Is required for all uses allowed by right or special permit aside from single-family residences or normal agricultural uses and accessory structures. Regulations require measures to be taken to integrate the development into the existing landscape to minimize impact on farmland, forests, critical habitat, Priority Heritage Landscapes, and scenic and historic landscapes.
Growth Control Measures: only ten individual building permits are issued per year, as well as five special conservation permits for applicants willing to put all but one acre of a minimum fifteen-acre parcel into a conservation restriction. Ten additional permits are granted for up to ten units for clustered development or if the proposed development incorporates a minimum of 25% affordable units.
Planning Board and the appropriate Town Boards or officials. This may be facilitating the continuation of status quo development by making it more challenging to employ more ecological alternatives.
Ultimately, Whately’s zoning emphasis seems to be oriented around limiting density and controlling growth, which is understandable for a town of its size and with its infrastructural limitations. However, there may be room to reconsider zoning regulations that open the door to slightly denser development that can still fit into the form and rural character of the town. By encouraging more economically viable development styles and mixed uses, the town could better attract development that can meet regulations that prioritize Whately’s core values, like natural resource protection.
Recommendation One | Conservation & Water-Wise Development | 77
Planning for the Future
Recommendations from Previous Plans
Land-use goal highlight from the Master Plan (p 46-7):
Additional Development Strategies
One of the Land Use Goals from the 2011 Master Plan is:
To encourage the adoption implementation of balanced regulations that promoted encourage environmentally sensitive and economically sustainable development, protect the valued natural, agricultural, scenic, and cultural resources of the Town, and ensure that new development reflects the town’s overall vision.
Farm Building Reuse to allow adaptive reuse of vacant or underutilized farm buildings for commercial use compatible with the landscape
“To encourage the adoption and implementation of balanced regulations that promote and encourage environmentally sensitive and economically sustainable development, protect the valued natural, agricultural, scenic, and cultural resources of the Town, and ensure that new development reflects the town’s overall vision” (6).
Village Center Reuse Overlay District to encourage limited commercial uses in the town center
Some of the zoning recommendations from the plan further the town’s commitment to development that incorporates natural resource protection strategies. These include:
Mixed Use Overlay District at or near the intersection of Routes 5 and 10 and Christian Lane and at the intersection of Christian Lane and Long Plain Road to encourage a compact mix of pedestrian-friendly, small-scale commercial development and diverse housing options.
Farm Building Reuse to allow adaptive reuse of vacant or underutilized farm buildings for commercial use compatible with the landscape.
Planned Unit Development Overlay District in the northern Commercial District in town at the intersection of Routes 5 and 10 and Route 116 to create a mixed-use, commercial campus that efficiently uses the land
Village Center Reuse Overlay District to encourage limited commercial uses in the town center.
Commercial Cluster Development Overlay District in the southern Commercial District along Routes 5 and 10 containing a mix of uses while permanently protecting open space.
Mixed Use Overlay District at or near the intersection of Routes 5 and 10 and Christian Lane and at the intersection of Christian Lane and Long Plain Road to encourage a compact mix of pedestrian-friendly, small-scale commercial development and diverse housing options.
Planned Unit Development Overlay District in the northern Commercial District in town at the intersection of Routes 5 and 10 and Route 116 to create a mixed-use, commercial campus that efficiently uses the land.
Commercial Cluster Development Overlay District in the southern Commercial District along Routes 5 and 10 containing a mix of uses while permanently protecting open space.
A more detailed overview of these recommendations are shown in the map on the following page and in the Appendix.
In addition to the zoning goals and strategies recommended in the 2011 Master Plan, these are additional approaches used by municipalities to encourage efficient development while protecting natural resources:
Conservation Development Overlay District in the areas with significant conservation value as identified by resources like BioMap. This could establish higher standards by requiring Site Plan Review for single-family dwellings on individual lots and normal agricultural uses and would incentivizes or requires the placement of land into conservation according to the same standards outlined in 171.25 G of Whately’s zoning bylaws. Open Space/ Cluster Development and “Special Conservation Permits” as defined in 171.39 B.3 could be allowed by-right, while development not oriented around conservation needs to apply for a special permit.
The Pioneer Valley Planning Commission’s Conservation Development Model Bylaw can be a good place to start. It is important to provide this option for singular dwelling development in addition to subdivisions.
40R Smart Growth Overlay District signal to developers that the town would like to prioritize development in this location, and defines the standards for developers to follow as they design their projects. Whately’s current Open Space/Cluster Development bylaw could inform these standards, which could include specifications for Smart Growth development on parcels with different natural resource areas prioritized for protection.
Establishing this district would enable more opportunities to apply for funding to establish a centralized wastewater system for that area of town. Identifying a strategic area for establishing a limited-scope public sewer system may enable growth within this specifically targeted area.
Reducing sprawl by directing development to areas with existing infrastructure, building denser housing, and stacking functions through mixed-use structures helps protect the ecological infrastructure necessary for sustainable water resource protection (MD Dept of Planning).
78 | Recommendation One | Conservation & Water-Wise Development
Recommended Overlay Districts from 2011 Master Plan


By proactively directing the development of affordable residential units while growing commercial amenities and industrial employment areas, Whately can ensure the protection of the landscape components responsible for improving water quality as the town grows.


Recommendation One | Conservation & Water-Wise Development | 79
Case Study: ConservationBased Affordable Housing
Island Cohousing in West Tisbury, MA
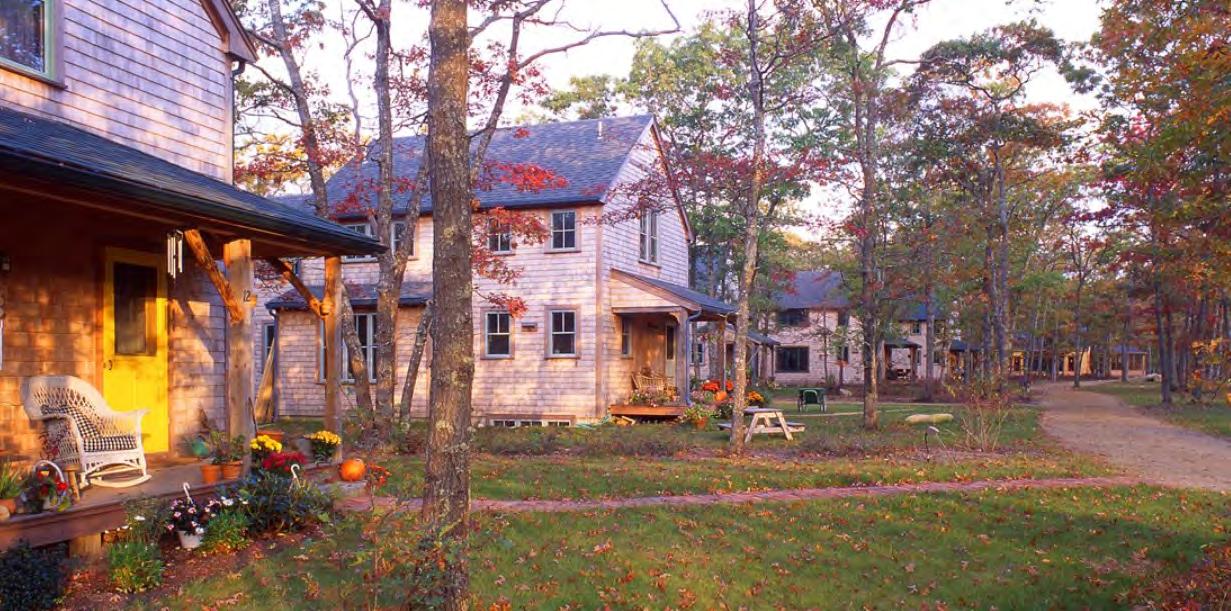
Island Cohousing is a community of sixteen single family homes with 50% of the units designated as affordable. South Mountain Company, the developer, cooperated with the town and planning officials using a “friendly 40B” approach which allowed for a collaboration to improve the town’s supply of affordable housing while also easing the permitting process for the developer. The homes are clustered, leaving 24 of the 30 forested acres as open space, including a pond, playing fields, and community gardens.
Along with creating affordable housing units, protecting the sensitive aquifer and maintaining tree cover were priorities for the developer. Since the development of Island Cohousing, the town has rewritten zoning codes to facilitate future development of similar projects (ULI).
The homes are configured in an oval around a central park area. Constructing around existing trees was a priority to keep the feeling of being nestled in the forest; wood from the trees that ultimately needed to be cleared was used to build front porches.
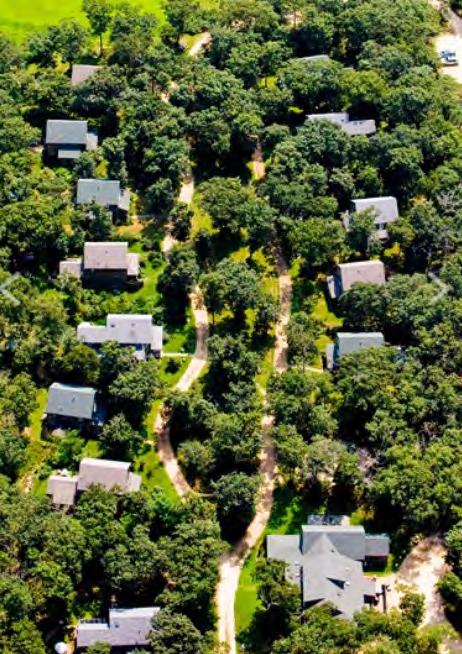
80 | Recommendation One | Conservation & Water-Wise Development
Photo courtesy of South Mountain Company
Photo courtesy of South Mountain Company
Resources
• Smart Growth Toolkit by Pioneer Valley Planning Commission
• Franklin Regional Council of Governments (FRCOG) Zoning Bylaw Technical Assistance service and related planning reports
• Tighe and Bond’s 2022 Franklin County Water and Wastewater Systems Study
• Kendra Briechle’s Report on Conservation Based Affordable Housing Development for the Conservation Fund
• Metropolitan Area Planning Council’s (MAPC) Resource Library
• The Franklin County Regional Housing and Redevelopment Authority
Funding Streams
Pairing conservation of natural resources with affordable housing development can also increase the availability of funding.
Existing Funding Resources
• Whately is eligible for grants through the Division of Conservation Services for seven years after updating their OSRP.
• Whately collects annual funds for conservation and open space via the Community Preservation Act (CPA).
• Funds are available for natural resource protection through the Municipal Vulnerability Preparedness (MVP) Program
Additional Conservation Funding Resources
• State Revolving Fund (SRF) Clean Water Trust
• Drinking Water Supply Protection Grant Program
• Landscape Partnership Grant Program
• Massachusetts Land and Water Conservation Fund
• Conservation Partnership Grant Program
• Local Acquisitions for Natural Diversity (LAND) Grant Program

• Conservation Assistance for Small Communities Grant Program
• Community Forest Stewardship Grant Program
Additional Development Funding Resources
• Rural and Small Town Development Fund
• Massachusetts Housing Partnership (MHP) Climate Ready Housing Program Funds
• Executive Office of Energy and Environmental Affairs (EEA) Planning Assistance Grants
• Department of Housing and Community Development (DHCD) 40R Program
• Funding for implementation of Low-Impact Development
Recommendation One | Conservation & Water-Wise Development | 81
“Given that it is unclear whether population will increase or decrease in Whately over the next few decades, the challenge for its residents will be to find a sustainable development model that sustains and enhances the community’s agricultural, rural, and historic character and promotes a stable and equitable property tax rate…
By continuing to pursue growth management strategies that include active land conservation and zoning measures that balance development with the protection of natural resources, Whately will be better positioned to maintain a high quality of life for its residents.” (Whately Open Space Committee, 3-31)
RECOMMENDATION 2
Why Restoration and Management?

This chapter will present recommendations for improved management and restoration for Whately’s dominant landscape types–forest and agricultural lands–to increase water resiliency, highlighting management strategies and interventions at the site and landscape scale. Improved land management approaches constitute two-thirds of low cost opportunities for atmospheric carbon reductions worldwide by 2030; in the US, this number is closer to 75% (Cook-Patton et al.). Additionally, when compared to land conservation and ecological restoration approaches to climate mitigation, improved land management is often less disruptive to existing patterns of land use and can even improve the economic production of lands managed for crop production and forest products (Cook-Patton et al.).
Improved land management has a high number of co-benefits, both on and beyond the site of implementation. For example, improving active forest management to include climate smart practices improves forest health at the site and can improve the surface water quality of its watershed. Increasing active carbon sequestration on agricultural lands by increasing the use of cover crops, for example, can increase soil health, decrease surface erosion and sedimentation of surface waters, and decrease nonpoint source pollution through the absorption of excess water-soluble plant nutrients in the soil. These and other natural climate solutions have the potential to provide 37% of total reduction of global CO2 emissions needed by 2030 to keep global warming under 2 degrees Celsius (Griscom et al.).
Ecosystem restoration has the greatest potential globally for mitigating the negative impacts of climate change when compared to strategies for land conservation and changes to land management (Cook-Patton et al.). Restoration interventions, however, tend to be more expensive and take longer to have an impact on global carbon emissions than land conservation and improved management interventions because they tend to focus more on carbon removal than on reduced emissions, and often involve significant changes to land use and cover. For example, restoring riparian corridors and floodplain forests increases the landscape’s ability to sequester and store carbon by increasing total tree cover. The co-benefits of this particular strategy are significant–reduced surface water pollution from bordering agricultural land use, decreased inland flooding, and increased habitat connectivity for critical aquatic species–to name a few. But these strategies typically require removing some land from active agricultural use and take multiple years to establish, hence the need to support these and similar initiatives with financial and technical assistance.
Harnessing the power of improved land management and strategic ecosystem restoration, the residents of Whately and its watersheds can further invest in water resilience while simultaneously protecting and enriching the forests and agricultural lands that are so deeply woven into the ecological, social, and economic life of the region.
82 | Recommendation Two | Manage and Restore Critical Landscapes
Recommendation Two
Manage and restore critical landscapes and ecosystems across scales.
• 2.1 Promote climate-smart forestry management on Whately’s forested lands using the framework established in Increasing Forest Resiliency for an Uncertain Future to increase overall forest resilience and health.
• 2.1.1 Hold workshops in collaboration with MassWoods and state service foresters to educate forest owners about how they can increase the resiliency of their forests through engaged management.
• 2.1.2 Integrate climate-smart forestry management into forestry related projects done by and contracted by the Whately Department of Public Works.
• 2.2 Restore riparian buffers and floodplain forests to mitigate flood risks, improve aquatic species habitat, and reduce nonpoint source pollution and sedimentation of surface waters.
• 2.2.1 Support and fund improvements in riparian buffers along Whately’s surface waters, focusing specifically on coldwater fisheries and areas that border impaired waters.
• 2.3 Prioritize water-resiliency in the planning, design, and implementation of critical infrastructure projects.
• 2.3.1 Utilize a combination of NPS Competitive Grants 310, Water Quality Management Planning Grants 604(b), and Municipal Vulnerability Action Grants to assess, design, and implement an integrated road improvement and critical stream crossing and culvert replacement plan.
Recommendation Two | Manage and Restore Critical Landscapes | 83
Manage and Restore
Identifying Key Interventions and Priority Areas for Implementation
GIS mapping and analysis can be a powerful tool to help communities in the process of identifying and screening sites for climate resilience interventions. In 2020 The Nature Conservancy along with partners including the Charles River Watershed Association, created Siting Nature-Based Solutions for Climate Resilience in Massachusetts: A Tool to Support Natural Hazard Resilience Planning at the Local Level. This tool combines a number of relevant GIS data layers to highlight potential sites for municipal and regional projects. It focuses on conservation for drought resilience, inland flood resilience, and coastal flood resilience; restoration of inland flood resilience and aquatic connectivity via dam removal, culvert replacement, and the restoration of riparian buffers and wetlands; improved stormwater management and remediation for inland flooding and drought resilience; and improved agricultural best management practices for inland flood and drought resilience.
Because the tool is structured to identify project sites based on their potential for conservation, restoration, management, and natural hazard mitigation, and how these various priorities overlap, it can be used to identify sites for project development and potential funding through the MVP Action Grants and the Commonwealth’s Hazard Mitigation and Climate Adaptation Plan funds. The high level analysis it enables can be used by communities to inform further investigation and prioritization via site visits, community engagement, and professional assessment and focus the scope of the initial design process.
For the purpose of this report, this tool has been used to inform the types of management and restoration projects to recommend based on their applicability for funding; identify areas where water resiliencefocused interventions in Whately could potentially have multiple co-benefits; and to inform subsequent analysis performed by the project team.
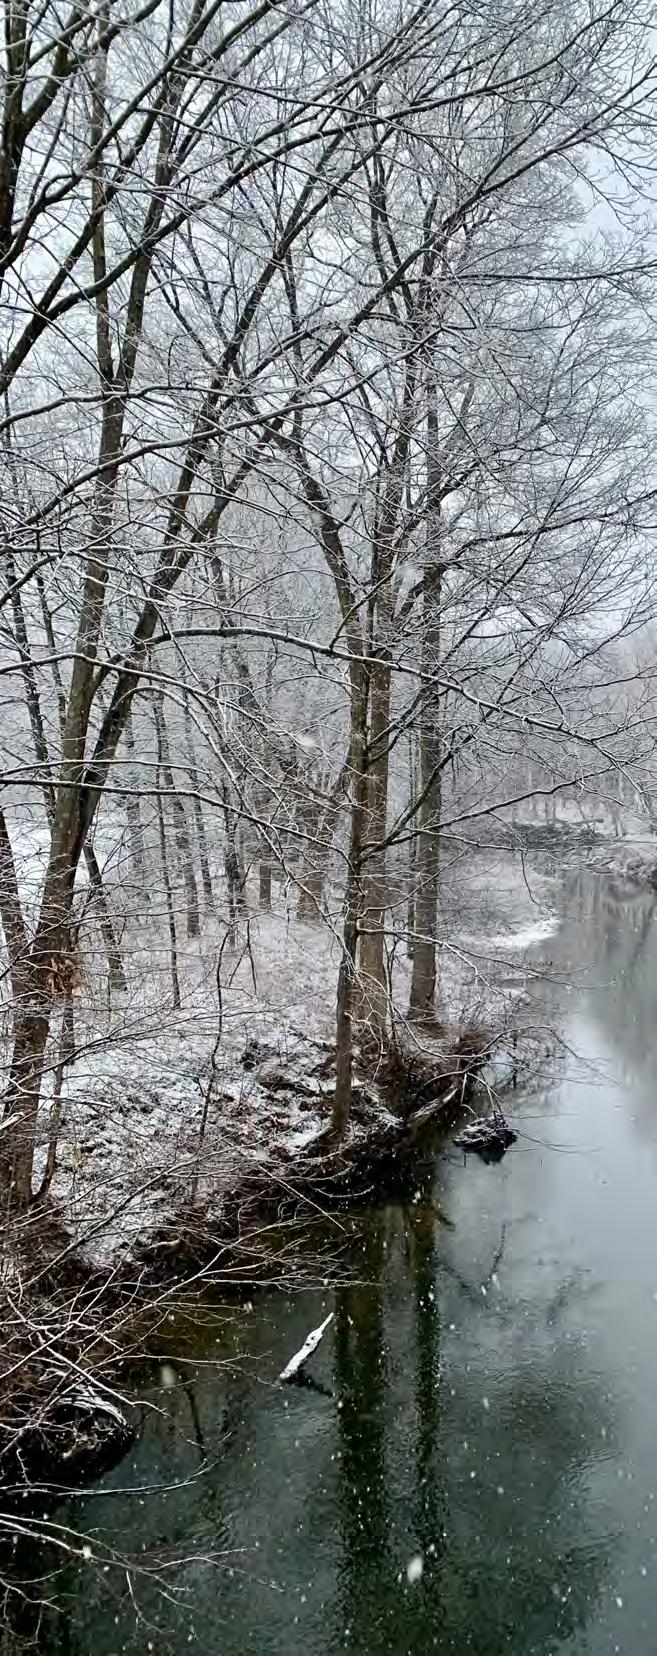
84 | Recommendation Two
These sample maps from The Nature Conservancy’s Siting Nature Based Solutions for Climate Resilience tool show how individuals and communities can use this tool to increase their spatial understanding of climate related risks and hazards faced by their communities (maps.coastalresilience.org/massachusetts).

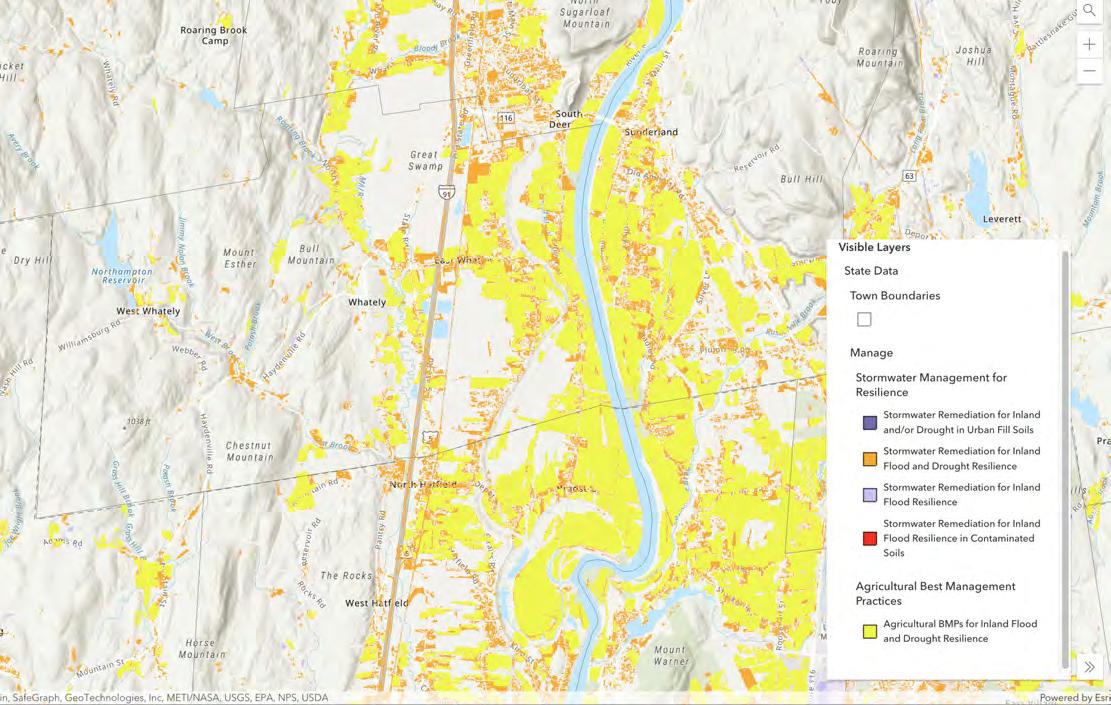
Recommendation Two | Manage and Restore Critical Landscapes | 85
Manage: Climate-Smart Forestry
Forest Health is Foundational to Water Resilience
Each forested acre of land surrounding a public water source filters over half a million gallons of water per year(MassAudubon “The Value of Nature”). Healthy floodplain forests and forested riparian buffers diminish the negative effects of riparian flooding, reducing erosion and subsequent sediment loading of surface waters, and reducing the speed and height of floodwaters to communities downstream (Bentrup). Forested riparian buffers are an arboreal shield against warming water temperatures, supporting the vitality of coldwater aquatic species, including the federally endangered dwarf wedgemussel. These buffers also help filter surface runoff from agricultural fields, pastures, and residential lawns while stabilizing the banks of the rivers, streams, and brooks that meander through Whately’s agricultural lands, helping keep Whately’s prized agricultural soils where they belong, in the field.
The report Increasing Forest Resiliency for an Uncertain Future provides a science-based framework for managing New England’s forested landscapes taking into account the changes already underway in the region’s forests and how increased temperatures, drought, and other climate stressors are likely to affect the health and composition of New England’s forests. This can be used as a guide to help private landowners, conservation agencies, and the Town prioritize forest conservation and best management practices to increase the resiliency of Whately’s forests and the ecosystem services that they provide. Importantly, this framework for assessing and prioritizing management decisions for climate resilience covers a spectrum of landowner priorities, from hands-off conservation with no commercial harvests to forested lands managed specifically to balance the needs of commercial production with overall forest resilience (Catanzaro et al.). The following pages use this framework to describe the major stressors facing Whately’s forests and define the elements of a climate resilient forest as well as goals and strategies for management.
86 | Recommendation Two | Climate-Smart Forestry
Promote climate-smart forestry management on Whately’s forested lands using the framework established in Increasing Forest Resiliency for an Uncertain Future to increase overall forest resilience and health.
Stressors that diminish forest resilience
Forest Conversion
Converting forests to other land uses obliterates the ecosystem services provided by that forest and adds to the fragmentation of the broader forest system. In addition to disrupting contiguous habitat and reducing the percentage of interior forest habitat within a given unit of forest, fragmentation can lead to increasingly isolated blocks of forest, which can be highly susceptible to intrusion from invasive plant and pest species (Catanzaro et al.).
active forest management without a multi-year invasive plant mitigation program due to the risk of spreading these invasives via timber harvesting operations (Mauri et al.). Multiflora rose, Japanese barberry, and Japanese knotweed are also highly distributed throughout forests and edge habitats in town (Whately Open Space Committee).
Multiflora rose is an invasive species that is present in many forest and field edge environments in Whately and throughout the region. In the 1930s and 40s the USDA encouraged farmers in New England to plant it as a living fence line. It has since spread and can be found in many recently disturbed areas including stream banks in riparian forests and in recent forest clearings. While the plant does provide a number of habitat functions, its vigorous growth can reduce regeneration of native tree and shrub species.
Invasive Plants

Invasive plants can significantly alter the health and species composition of a forest by out-competing slower-growing native plants through rapid growth and vigorous reproduction and potentially reducing the overall biodiversity of the forest (Catanzaro et al. ).

There are a number of non-native species that are problematic in Whately’s forests and forest edge habitats. Oriental bittersweet is present throughout forested areas and is particularly aggressive along roadsides, at times pulling down whole trees and damaging infrastructure and private property in the process (Whately Open Space Committee). Bittersweet is also a significant management concern in many of 1,073 acres of forest that the City of Northampton manages around the Ryan, West Whately, and Mountain Street Reservoirs. According to the Forestry Management Plans for these water supply protection areas, there are numerous stands that are off limits to potential timber harvest and
Invasive Insects and Diseases

The forests of New England tell the stories of past and present disturbance from invasive insects and disease, most notably the Chestnut Blight that decimated the American chestnut which was once a dominant canopy tree in many areas of New England. More recently pests like the hemlock woolly adelgid and emerald ash borer have had drastic impacts on the health and composition of the region’s forests.
In Whately, hemlock health in many areas is in decline, affected by hemlock woolly adelgid and elongate hemlock scale, though the mortality is not currently as bad as in some other areas of the region. Beech bark disease is present in most of Whately’s beech population, causing significant dieback (Mauri et al. 19).
Recommendation Two | Climate-Smart Forestry | 87
Asiatic bittersweet is a problematic plant in Whately’s forests, particularly in edge habitats along roadways and recent clearings.
Hemlock woolly adelgid feeding on a hemlock needle.
Over Browsing
The impact of over browsing of young seedlings by deer is so severe in some areas of the region that many forests have little to no viable seedling stock. This lack of actively growing tree stock can lead to significant age-class gaps in the forest, as there are not adequate stocks of young trees in the understory to successfully establish in response to openings in the canopy made by natural or anthropogenic disturbance (Catanzaro et al.). Additionally, white tailed deer tend to prefer to browse on native trees and shrubs, which limits habitat for a number of forest animal species that depend on these plants for habitat and increases the opportunity for nonnative plant species to establish and dominate in the understory, which further suppresses the establishment of native tree and shrub seedlings (Janowiak et al. “Forest Ecosystem Vulnerability”). According to MassAudubon, 20 deer per square mile or less is the carrying capacity of forested lands in Massachusetts, populations in many areas are two to eight times this level (“MassAudubon Deer Management Plan”). Warming temperatures brought by climate change are expected to decrease the energy needs of White-tailed deer while simultaneously increasing access to forage due to a decrease in snow cover, likely contributing to an increase in total population and range (Janowiak et al. “Managing Forests”).
In Whately, there is a lack of desirable regeneration of many significant species in many forests, due in full or in part to over browsing (Mauri et al.). This can and is leading to changes in the composition of Whately’s forests. Without more thorough controls on deer population, options for active forest management will be limited (Stacey).
In the public drinking water supply lands that surround the Ryan, West Whately, Mountain Street Reservoirs, a lack of healthy regeneration due to deer browse constricts the ability of the Northampton DPW to selectively harvest and attempt to curate the future forest cover based on the predicted impacts of climate change. As a result, the emphasis of its current management plan is to maintain the health of the existing forest cover (Stacy). The impact of deer browse on species regeneration and future forest composition is highlighted by the Northampton DPWs participation in a deer exclusion study facilitated by Harvard Forest. The exclusion site in Whately shows a dramatically denser stock of regeneration and a broader range of species, with robust red oak and other hardwood species that are either sparse or not present in the rest of the forest due to deer and moose pressure (Stacy).
There are successful examples of deer management in public drinking water supply lands reducing pressure on tree regeneration, most notably in the lands managed by the Massachusetts Department of Conservation and Recreation Lands surrounding the Quabbin Reservoir. In response to excessive deer populations, DCR initiated a deer population reduction program in 1991. This program divided the DCR lands around the Quabbin into discrete zones and DCR facilitated controlled deer hunting in these zones. According to the DCR, within five years, deer populations were reduced to levels that balanced continued health of the deer population with successful forest regeneration. DCR transitioned to a more limited hunting program to maintain these populations. In 2019, in response to rebounding deer populations, DCR began opening zones for hunting during the two week shotgun season (DCR Office of Watershed Management). This approach, in combination with targeted two-day hunts in specific zones, continues to be successful, and serves as a model for how well-regulated, data-driven, controlled hunting programs in drinking water supply areas can balance present and future forest health and a thriving deer population. In response to the success of this program, a number of other large conservation land owners in the state have implemented their own controlled deer hunting programs, including Mass Audubon and the Trustees of Reservation (“MassAudubon Deer Management Plan”).

88 | Recommendation Two | Climate-Smart Forestry
White-tailed deer feeding on a young tree.
Climate Change
Climate change is already changing forests in New England.
• Increased drought conditions can limit successful seed germination, limiting regeneration and causing species-scale and site-specific stress to existing trees, particularly those growing in excessively drained soils. Oak and ash species have been shown to be particularly susceptible to drought induced stress (Janowiak et al. Forest Ecosystem Vulnerability” ).
• Combinations of extreme precipitation and severe wind events will affect forest composition and health as a result of wind damage, flooding, soil loss and sedimentation (Janowiak et al. “Managing Forests”).
• Warming winter temps and more frequent heavy precipitation events throughout the year will limit the timing and viability of commercial harvests, making active management of forests more difficult.

• Increases in many non-native and invasive plant species as climate related stress causes deterioration in the health of some native tree species (Catanzaro et al.)
Northern Red Oak is now a predominant hardwood in many of the region’s forests. As temperatures warm, climactic conditions for this species will potentially improve in northern New England and decline in southern New England.
Eastern white oak is projected become more prolific hardwood species in Whately and the surrounding areas as temperatures warm. Climate -smart forestry practices that promote eastern white oak, which is now only a small component of most hardwood forests in the region, may benefit from encouraging ample regeneration of this species.
Recommendation Two | Climate-Smart Forestry | 89
Elements of a climate and water resilient forest
Minimal Forest Stress
Resilient forests show minimal stress from invasive species, forest pests and disease, development pressure, herbivory and climate change induced stressors. Low levels of forest stressors can be maintained through thoughtful, climate-smart forestry practices including active and passive management approaches (Catanzaro et al.).
High Forest Complexity
Forests with higher levels of species and habitat complexity will be more resilient to the changing conditions wrought by climate change. Managing forests towards the following characteristics will increase the likelihood that healthy and diverse forest ecosystems will continue to adapt and evolve in response to future disturbance(Catanzaro et al.)
Diversity of Tree Species
Changing temperature and moisture patterns are causing shifts in the preferred habitat ranges of tree species in the Northeast. Managing stands to ensure a diversity of species will buffer the negative impacts on forest health when the health of a given species suffers and increase the likelihood that there will be some species within the complex that will thrive in the future conditions (Catanzaro et al. 6).
Ample Regeneration of Future-Adapted Species
Some species already present in Northeastern forests are likely to be more adaptable to the changing climate than others. Broadly speaking, species that rely on colder habitats and/or rely on a narrow range of conditions will likely be less competitive in the future (Eastern white pine, paper birch) and species that are more associated with warmer temperature ranges and have broader site adaptability (white oak, chestnut oak, and shagbark hickory) will likely be more likely to proliferate. While many of these more competitive species do not make up significant populations in Whately’s forests today, they are likely to be more competitive and numerous in the future. This information is useful when planning active forest management. Management plans that select for healthy specimens of target species and encourage their regeneration may lead to a more resilient forest
in the long term than management plans that favor regeneration of species that are currently prevalent but are likely to be less so in the future (Catanzaro et al.).
Appropriate Amount of Deadwood
Standing deadwood (snags) and deadwood on the forest floor are important habitats for a wide range of animal species, sources of long-term carbon storage in forested ecosystems, and important sources of nutrient cycling for future growth. Leaving standing deadwood and downed logs in the forest during management operations will improve habitat diversity and overall ecosystem health. When these features are absent in a forest, techniques such as girdling trees and felling trees that have low value and leaving them on the forest floor can help establish this important ecosystem element (Catanzaro et al.).
Vigorous Trees of Various Sizes and Ages
One of the greatest vulnerabilities to the future health and resilience of Northeastern forests is their lack of diversity of age class across the forest complex and within a given species. Many of the forests in the Northeast lack this age class diversity because they grew back in clear cut or old field conditions, resulting in canopy trees that are all similar in age, and often lack the species diversity of the old growth forests that preceded them. This has been compounded in many forests by a combination of harvests that target specific species and age classes to maximize profitability and high levels of herbivory reducing or eliminating healthy stocks of regeneration (Catanzaro et al.)
Protection for Threatened, Endangered and At-Risk Species
Special consideration should be made to protect habitats for existing rare plant and animal species within Northeastern forests, especially those that are particularly vulnerable to climate change. This may mean looking for refugia that allow for these once more widespread species to persist in a changing climate, such as north-facing mesic sites that may buffer the impacts of climate change. This approach is useful for species that are already considered rare as well as those species projected to become more so in the near future (Catanzaro et al.).
90 | Recommendation Two | Climate-Smart Forestry
Active, low-impact forest management will be a necessary component of climate-smart forestry management. When forests are managed using promote the components of a climate resilient forest, landscapes and communities can become more climate and water resilient.
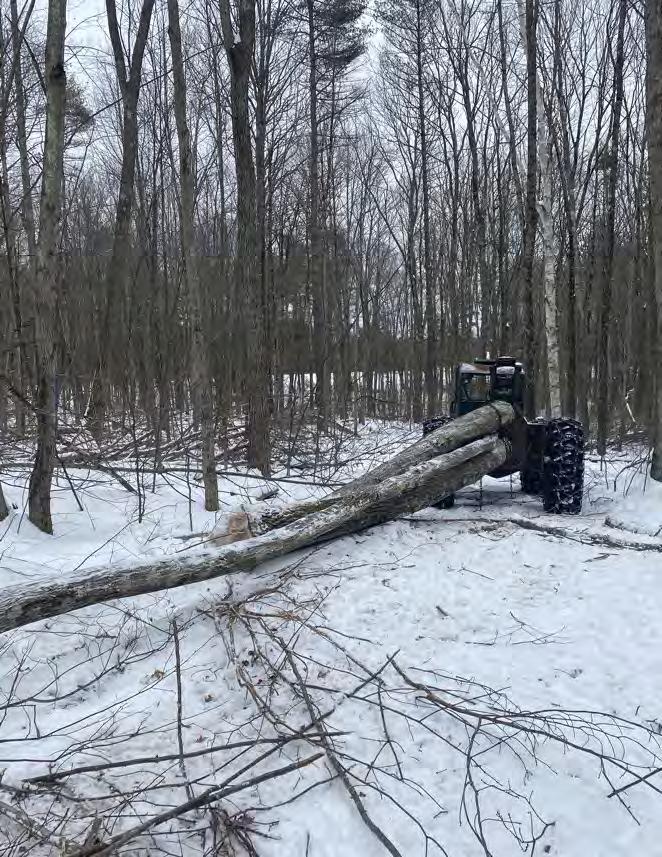
Increasing Forest Resiliency for an Uncertain Future groups the actions individuals and communities can take under towards four overarching goals of forest resilience (Catanzaro et al. )
Goal 1: Keep Forest Forested and Conserved
1.1 Engage in conservation-based estate planning to ensure the continuation of the land as forest.
1.2 Conserve resilience forests and the connection between them.
Goal 2: Reduce Stressors
2.1 Prevent the introduction of invasive plants, remove small populations of existing ones and learn to manage extensive areas of infestation.
2.2 Prevent the introduction of invasive insects and diseases, and limit the impact of existing ones.
2.3 Manage deer to ensure ample regeneration.
2.4 Maintain or restore soil and water health.
Goal 3: Reduce Vulnerability
3.1 Promote diverse species of various sizes, ages and spatial arrangements.
3.2 Promote the establishment of well-adapted species.
3.3 Reduce the proportion of trees that host invasive insects and diseases.
3.4 Reduce stem crowding to increase forest vigor.
3.5-3.6 Increase the amount of large snags and logs.
3.7 Restore and protect riparian areas.
Goal 4: Provide Refuge
4.1 Protect threatened, endangered, and at-risk species.
4.2 Harbor species that are at risk of being lost from the landscape.
92 | Recommendation Two | Climate-Smart Forestry
Key Factors in Fostering The Emergence and Continuity of Cooperative Forest Management Between Private Land Owners
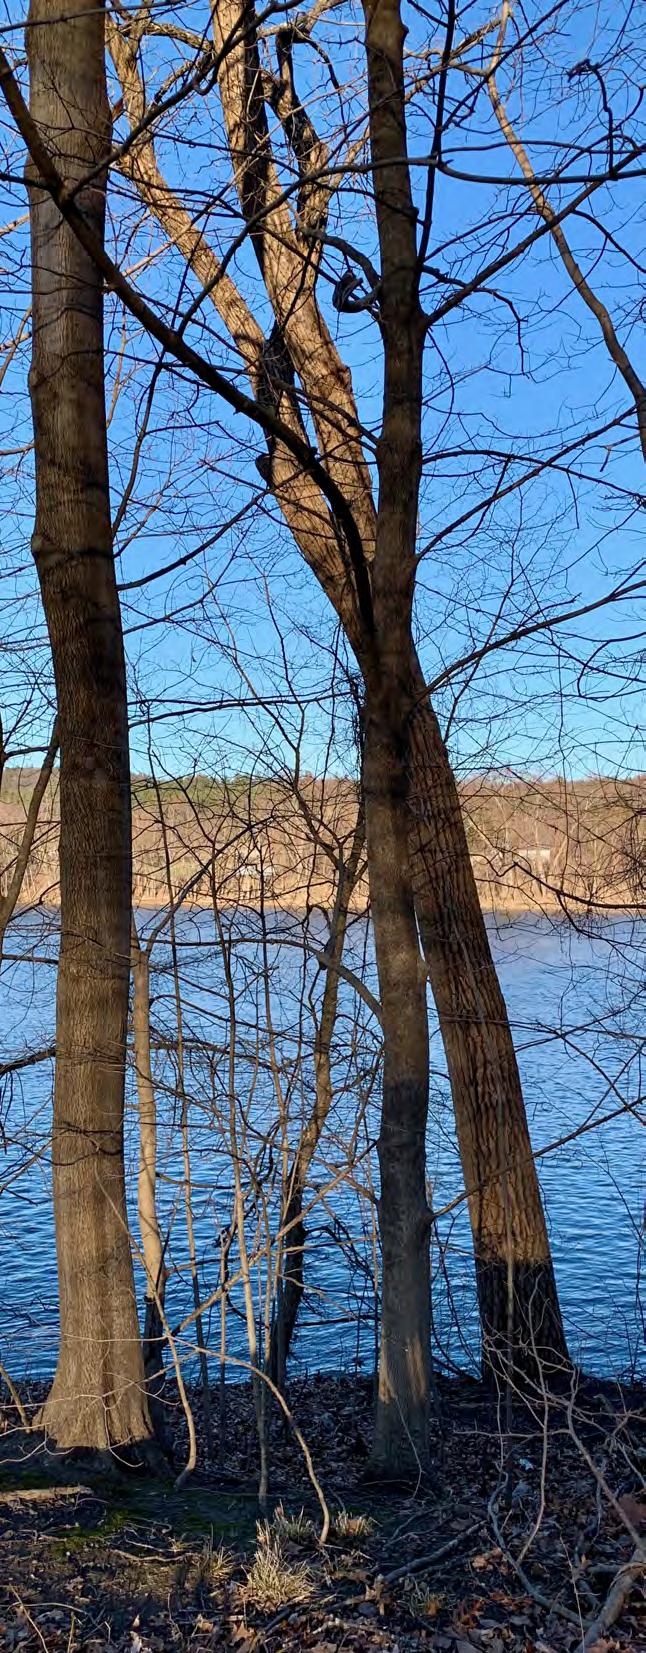
In their study Cross-Boundary cooperation for landscape management: Collective action and social exchange among individual private forest landowners, A.P. Fischer et al. interviewed eight groups of private landowners in the Pacific Northwest and Upper Midwest who were actively coordinating and implementing landscapescale forest management across private property boundaries. While the importance of landscapescale forest management from both ecological and social perspectives is well supported in the literature, collective planing and implementation of forestry management by private land owners in the US is relatively rare and understudied (152). A.P. Fischer et al. identified six key factors that “fostered the emergence and continuity of cooperative management” (157):
• Shared concern
• Pre-existing social networks
• Access to outside expertise and resources
• Trust
• Local leadership
• Formal institutions
And a host of perceived outcomes on the part of private landowners who participated in these cooperatives
• Increased access to information about management
• Increased management skill
• Reduced financial burden of management
• Increased area under management
• Improved ecological conditions
• Greater self-confidence in management
• Reduced physical burden of management
While the groups who participated in the study were more focused on forest management for the purposes of wildfire risk reduction, ecological restoration, and invasive plant management, there is opportunity to use similar approaches in fostering collaboration between private forest owners in Whately and its watersheds to make active and passive management for climate resilient forests more viable and reduce the potential for forest fragmentation that can come with management practices that stop abruptly at property boundaries.
Climate-Smart Forestry | 93
Restore: Riparian Buffers
Restore riparian buffers (including floodplain forests) to mitigate flood risks, improve aquatic species habitat, and reduce nonpoint source pollution and sedimentation of surface waters.
Why Riparian Buffers?
Healthy riparian buffers and floodplain forests serve a multitude of ecological functions that are critical to water resilience. They improve water quality by capturing sediment; absorbing nitrogen, phosphorus and other nutrients; stabilizing banks with living roots making them less susceptible to erosion; and increasing infiltration rates for better groundwater recharge (Sweeney and Newbold).
Riparian buffers also increase flood resilience by reducing sediment loads and surface flows to waterways during flood events, which lowers downstream flood height (Bentrup). This decreases flood damage to downstream property, crops, and ecosystems–saving farmland from erosion, homes from destruction, and critical infrastructure like roads and bridges from being washed away. A 2016 study by Watson et al. quantified the flood mitigation services provided to Middlebury, Vermont, by healthy upstream wetlands, floodplain forests, and riparian buffers. They found that the collective flood attenuation benefit of this upstream “green infrastructure” reduced damage from Tropical Storm Irene by 84 to 95% (16).
The health of aquatic habitats benefits from forested riparian buffers as well. Decreased levels of nitrogen and phosphorus loads increases dissolved oxygen levels, making it easier for aquatic animals to breathe. The shade cast by a diverse tree canopy keeps cold water streams cold buffers, buffering them from fluctuations in temperatures during periods of extreme heat, critical for the health of sensitive cold water species like the endangered dwarf wedgemussel. Woody detritus like leaves and branches enter the stream flow, providing both food and habitat to a number of aquatic species. Downed trees and large branches in the stream bed create important pool habitat and increase overall habitat complexity in the stream.
Many wetland-dependent species require upland habitats for some aspect of their life cycle. A 2001 study in Massachusetts found that 65 species of wetland dependent freshwater species have critical habitat needs in upland buffer areas ranging from within 100 feet of the wetland to beyond 200 feet from the edge of the wetland (Boyd).
Terrestrial habitats and ecosystems benefit as well. Contiguous riparian buffers can serve as critical regional habitat linkages, particularly when surrounding land use has been significantly altered via development or agriculture. They can also provide long stretches of critical edge habitat between grasslands, croplands, and other more open land cover types.
Riparian Buffers and Ecosystem Services
In addition to their ecological value, riparian buffers also provide a number of ecosystem services to communities within their watersheds and serve as important “green infrastructure,” providing critical services that would otherwise require increased investment in built infrastructure. Reduction in nitrogen and phosphorus nutrient loads and sediment loading reduce the costs of water treatment for communities that rely on surface water sources. Forested riparian buffers store and sequester carbon, contributing to climate change mitigation and improving air quality.
A 2018 report commissioned by the Delaware Riverkeeper Network entitled The Economic Value of Riparian Buffers Delaware River Basin valued the combined ecosystem services of water quality improvement, carbon sequestration, air pollution mitigation, wildlife habitat provision, flood prevention, and outdoor recreation improvement, to be worth a conservative average of $9,188 per acre of healthy riparian buffer per year. And that estimate does not include the projected 1% to 16% increase in property values of neighboring properties created by the improved aesthetics (Rempel and Buckley).
94 | Recommendation Two | Restore Riparian Buffers
Elements of a Riparian Buffer
A three-zone approach is often used when managing existing forested riparian buffers as well as planning the planting and management of riparian buffer restoration installations.
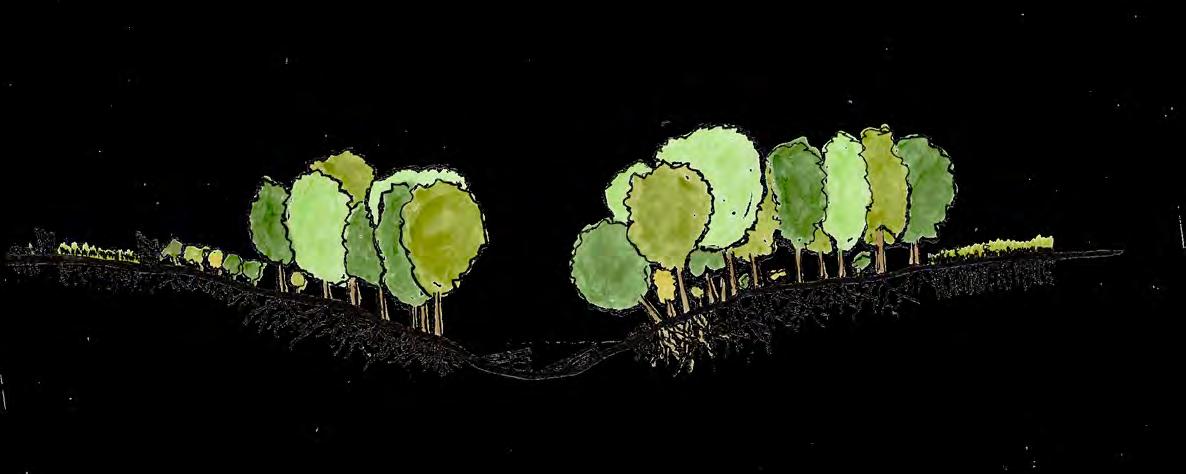
Zone 1
Mature forest or species planted with the intention creating a future mature forest. This zone is not managed for commercial timber harvest.
Zone 2
Managed forest or shrubland. This zone can be managed for commercial timber harvest or non-non timber forest products using climate-smart forestry.
Zone 3
Mixed native grasses and herbaceous perennials are best suited on the upland side of the buffer. These plants are key to capturing sediment, absorbing plant nutrients, and slowing surface and subsurface flows to the stream. If adjacent to pastureland, fencing is used to differentiate this zone from the adjacent pastures.
Buffer Width
In their 2014 review of scientific literature surrounding the relationship between forested riparian buffer width, water quality, habitat, and the broad host of ecological services these buffers provide, Sweeney and Newbold conclude that “buffers ≥ 30 m are needed to protect the physical, chemical, and biological integrity of small streams” (560). This review focused on subsurface nitrate removal, sediment trapping, stream width, stream channel meandering, water temperature, and the habitat provision for macroinvertebrate and fish communities. Buffers narrower than 30 meters (roughly 100 feet) can still provide many of these benefits, though often at a reduced rate. Buffers wider than 100 feet are required for some habitat types (Sweeney and Newbold).
A three zone riparian buffer. The width and management of each zone may vary depending on site conditions. Riparian buffers with a width ≥ 100 feet are more effective in providing communities with critical ecosystem services though narrower buffers can still provide a broad range of habitats and ecosystem services
Recommendation Two | Restore Riparian Buffers | 95
Zone 1 Zone 1 Zone 2 Zone 2
Zone 3 Zone 3
Streambed
Cropland
Pasture
Analysis: Where to target riparian buffer restoration
In this analysis, the current status of Whately’s riparian buffers are evaluated using two different approaches. Both evaluate the types and relative percentages of land cover present within the respective buffers. In this context, land cover is used as a simplified proxy for riparian health, with concentrations of impervious cover, bare land, lawn, or agriculture being priorities for restoration in areas where riparian forests have been cleared , as these land covers have higher potential for negative impacts on the quality of neighboring surface waters.
200-Foot Buffer Analysis
The first map,(top right) uses a 200-foot buffer, from the edge of surface waters defined by the MassDEP. This buffer corresponds to the area protected by the 1996 Massachusetts River Protection Act (Suuburg). For the purpose of this analysis, the 200-foot buffer around reservoirs, lakes, and ponds is also evaluated as these are also critical to water resilience.
• Overall, the state of Whately’s land cover within this 200-foot buffer is good, with over 60% forested or tree-covered, with another 20% composed of water and wetlands.
• There are three main areas, circled in red, where there are high concentrations of non-forested cover within the buffer. These areas could be considered candidates for further investigation for installation of forested riparian buffers.
• The section of the Mill River extending from the town line to Swamp Road.
• The length of the Connecticut as it flows through whately and collection of brooks to the west that feed it.
• A small area to the southeast of the Ryan Reservoir in northwest Whately.
Variable Width Buffer Analysis
The second map shows uses a more nuanced approach, using a variable width buffer composed of Biomap layers relevant to riparian protection at the statewide and local level—Aquatic Core, Aquatic Buffer, Local Aquatic Habitats and Local Aquatic Habitat Buffers (see description of Biomap in the Ecological Conditions section). Collectively, these layers identify areas of critical aquatic connectivity and habitat where there is less development and habitat fragmentation to accommodate changes in riverine habitats and hydrological function, like stream meanders (Biomap).
• This analysis also highlights the extent of agricultural land cover surrounding the northern section of the Mill River and its adjacent wetlands as well as the corridor to the west of the Connecticut River, further suggesting that these areas may be good candidates for extending the riparian buffer westward from the existing narrow band of trees along the river
• This analysis shows the extent to which wetlands border the southern stretch of the Mill River’s course through Whately, with some areas of agricultural land abutting these wetlands with no intervening riparian forest. These farmlands could also be priority areas for riparian restoration.
Land cover types within a 200-foot buffer of Whately’s surface waters shown on the top map on the opposite page
Land cover types within a variablewidth buffer of Whately’s surface waters shown on the bottom map on the opposite page
96 | Recommendation Two | Restore Riparian Buffers Simplified Land Cover Acres % of Total Area Agriculture 484.34 11.47 Bare Land 6.85 0.16 Impervious 19.30 0.46 Lawn 25.79 0.61 Shrub/Grassland 46.19 1.09 Trees 2952.48 69.95 Water 224.37 5.32 Wetlands 461.82 10.94 TOTALS 4221.13 100.00 Simplified Land Cover (2016) Acres % of Total Area Agriculture 317.64 10.87 Bare Land 14.04 0.48 Impervious 72.67 2.49 Lawn 84.13 2.88 Shrub/Grassland 64.52 2.21 Trees 1774.80 60.75 Water 189.79 6.50 Wetlands 403.77 13.82 TOTALS 2921.35 100.00
Areas to prioritize for forested riparian buffer restoration
Simplified land cover within a 200-foot buffer from the edge of surface waters within Whately.


Areas to prioritize for forested riparian buffer restoration


Simplified land cover within a variable width riparian buffer layer made up of Biomap layers relevant to riparian protection and habitat within Whately.

Recommendation Two | Restore Riparian Buffers | 97
Restore: Aquatic Connectivity

Like many towns in the region, many of Whately’s roads follow in close proximity to its surface waters, creating ample opportunities for stormwater runoff, sediment, and nonpoint source pollutants to enter neighboring streams. Additionally, in areas where stormwater enters these surface waters directly and in substantial volumes, the increased water temperature from the road runoff can increase stream temperatures. In addition to the negative stormwater impacts these rural roads have on Whately’s surface waters, the numerous steam crossings and culverts along these roadways can negatively impact aquatic connectivity by blocking the passage of aquatic species and short-circuiting the upstream nutrient flows of anadromous species. When undersized for the peak flows of Whately’s streams and brooks, these stream crossings can become sites of temporary flooding, particularly along West Brook, Roaring Brook, and Sanderson Brook (Whately).
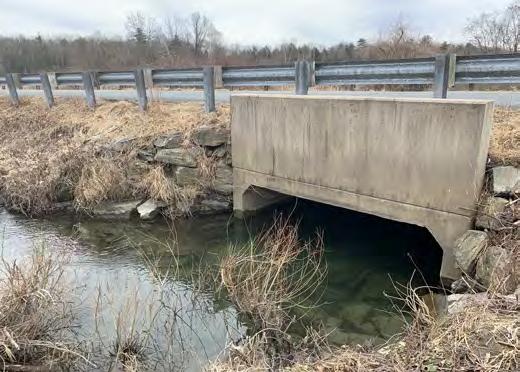
The importance of improving stream crossings for aquatic connectivity is highlighted by the regionaland national-level research and advocacy of the North Atlantic Connectivity Collaborative, The Nature Conservancy, Trout Unlimited, and the US Geological Survey amongst others. Stream crossing assessment and replacement is one of the key watershed scale interventions of the New York State Water Resources Institute and its work in the Hudson River Estuary where it is working with project partners to assess and replace undersized culverts through its Culvert Prioritization Project (Cornell CALS).
The University of Massachusetts at Amherst has been at the forefront of this work for over 20 years and Whately resident and UMass Extension Professor in the Department of Environmental Conservation Scott Jackson has been at the center of this work. In 2006, in collaboration with The Nature Conservancy, and the Massachusetts Division of Ecological Restoration and other project partners created the Massachusetts River and Stream Crossing Standards, outlining six stream crossing standards that have since been incorporated into the US Army Corps of Engineers Massachusetts General Permit Regulations, the Massachusetts 401 Water Quality Certification( 314 CMO 9.00), and the performance standards of the Massachusetts Wetlands Protection Act (319 CMR 10.00) (MASS Department of Ecological Restoration).
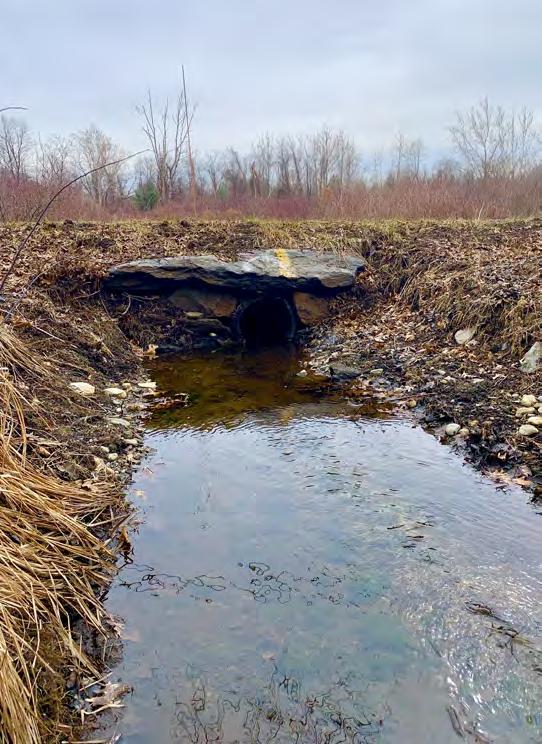
98 | Recommendation 2 | Restore Aquatic Connectivity
Improving critical stream crossings can increase aquatic connectivity, improve inland flood resilience, and protect critical road infrastructure from flood damage
A small culvert crosses under a road in West Whately.
The Mill River flows under a bridge in East Whately.
Massachusetts River and Stream Crossing Standards
Massachusetts Stream Crossings Handbook (Division of Ecological Restoration 7)
1. TYPE OF CROSSING
• General: Spans (bridges, 3-sided box culverts, openbottom culverts or arches) are strongly preferred.
• Optimum: Use a bridge.
2. EMBEDMENT
• All culverts should be embedded (sunk into stream) a minimum of 2 feet, and round pipe culverts at least 25%.
• If pipe culverts cannot be embedded this deep, then they should not be used.
• When embedment material includes elements >15 inches in diameter, embedment depths should be at least twice the D84 (particle width larger than 84% of particles) of the embedment material.
3. CROSSING SPAN
• General: Spans channel width (a minimum of 1.2 times the bankfull width of the stream).
• Optimum: Spans the streambed and banks (at least 1.2 times bankfull width) with sufficient headroom to provide dry passage for wildlife
4. OPENNESS
• General: Openness ratio (cross-sectional area/crossing length) of at least 0.82 feet (0.25 meters). The crossing should be wide and high relative to its length.
• Optimum: Openness ratio of at least 1.64 feet (0.5 meters) and minimum height of 6 feet. If conditions significantly reduce wildlife passage near a crossing (e.g. steep embankments, high traffic volumes, and physical barriers), maintain a minimum height of 8 feet (2.4 meters) and openness ratio of 2.46 feet (0.75 meters).
5. SUBSTRATE
• Natural bottom substrate should be used within the crossing and it should match the upstream and downstream substrates. The substrate and design should resist displacement during floods and maintain an appropriate bottom during normal flows.
6. WATER DEPTH AND VELOCITY
• Water depths and velocities are comparable to those found in the natural channel at a variety of flows.
Recommendation Two | Restore Aquatic Connectivity | 99
STREAM CROSSINGS
These references pages from the Massachusetts Stream Crossings Handbook (Division of Ecological Restoration) clearly illustrate common problems and consequences of poorly designed stream crossings and their impacts on infrastructure, habitat, and aquatic connectivity (4-6).
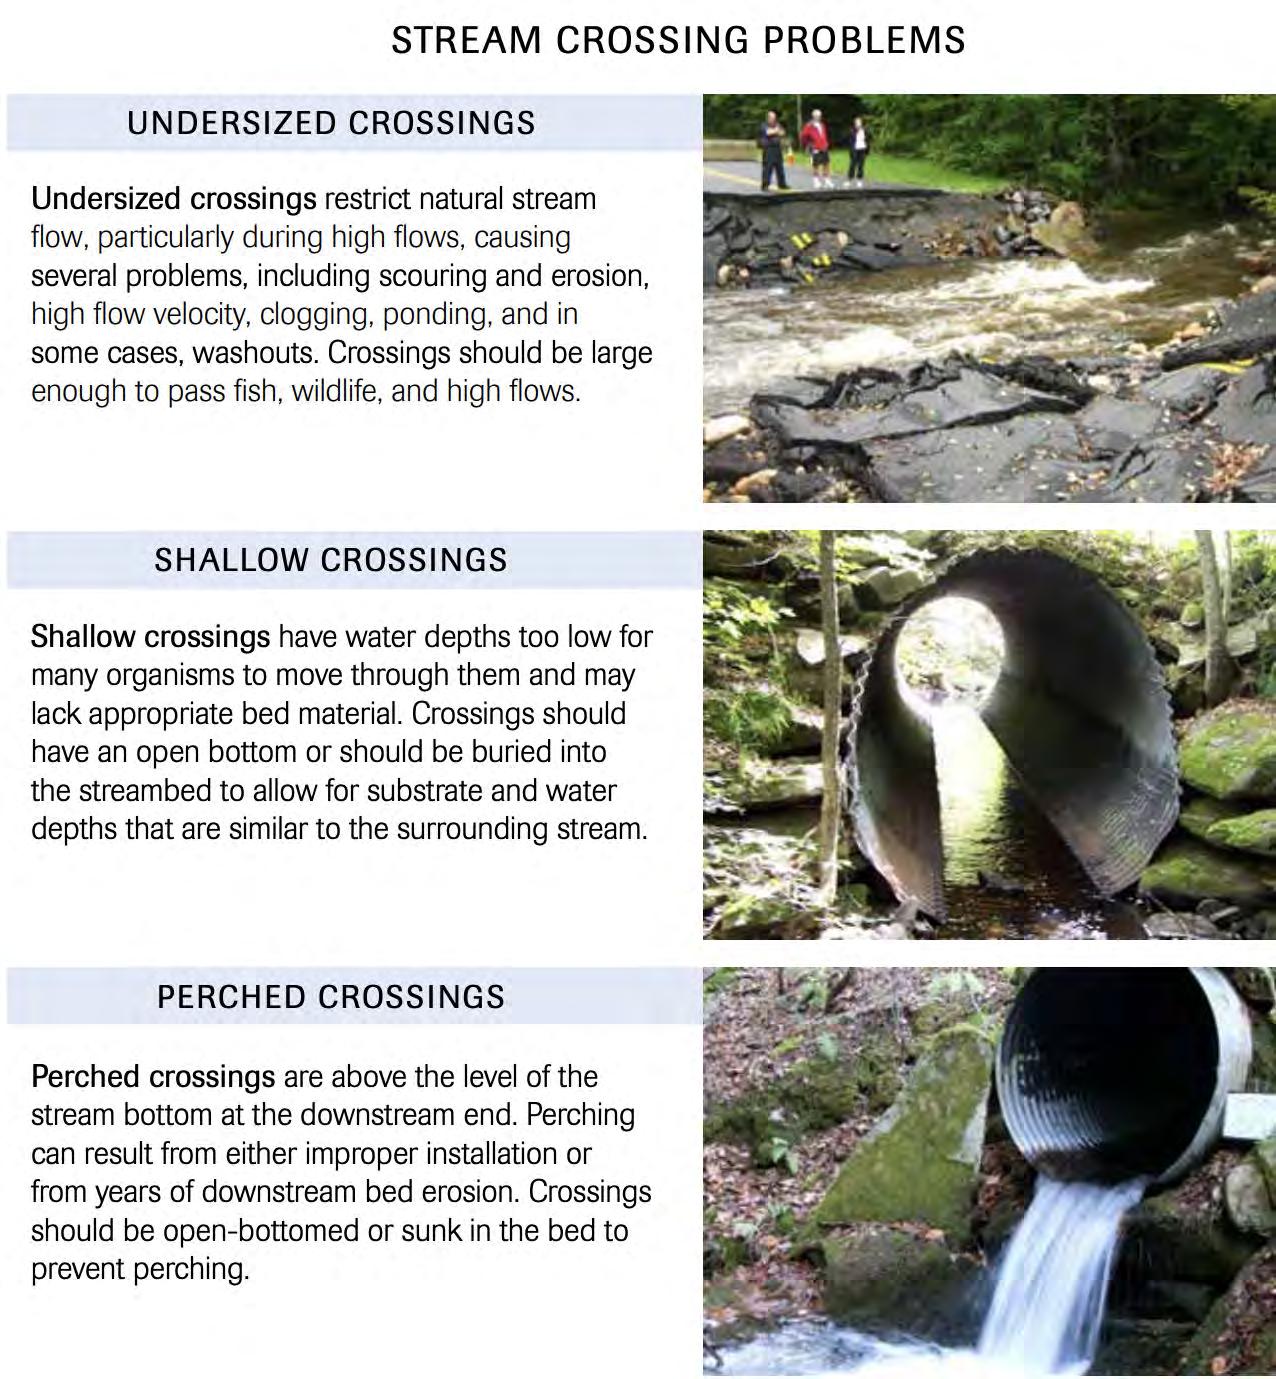
100 | Recommendation Two | Restore Aquatic Connectivity
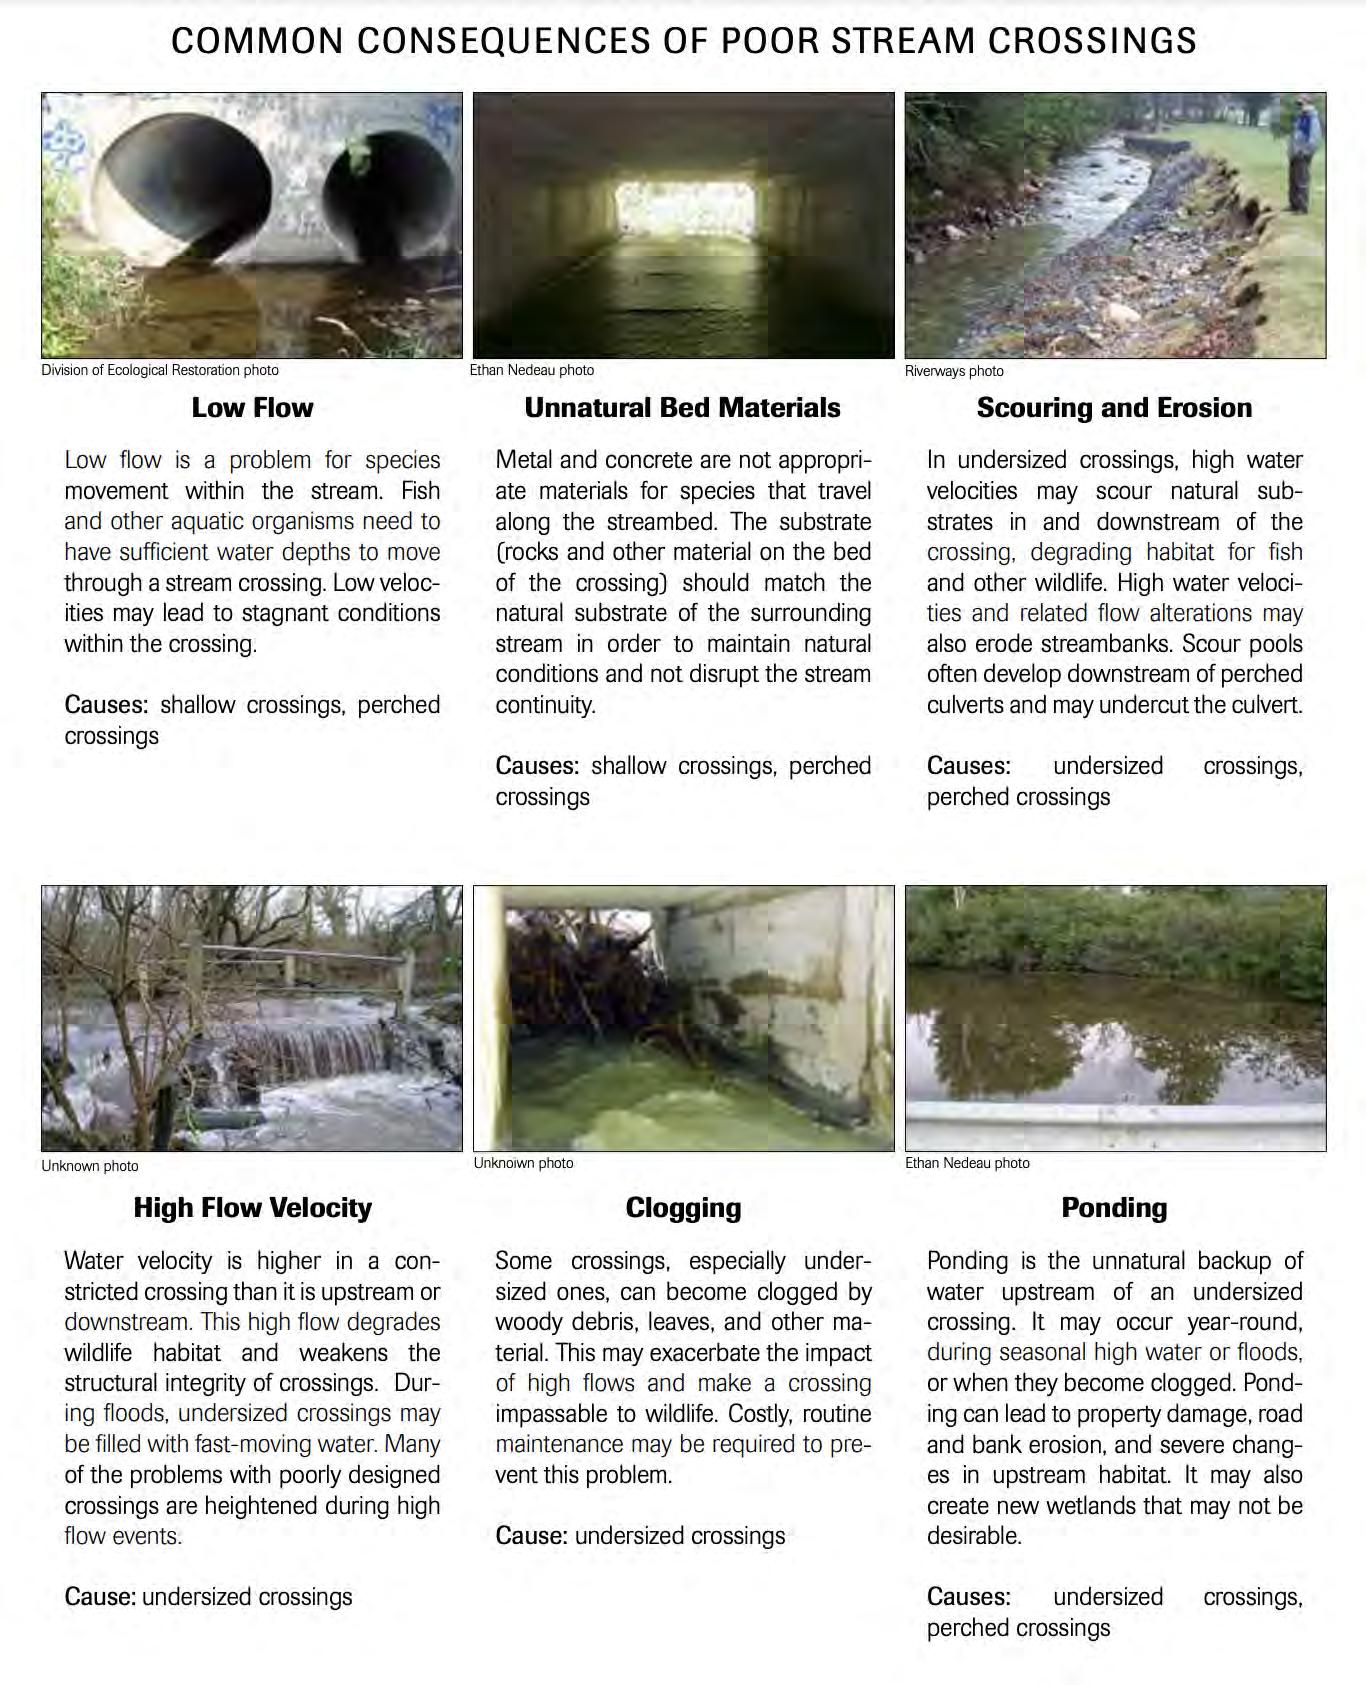
Recommendation Two | Restore Aquatic Connectivity | 101
Analysis: Whately’s Stream Crossings Rated by Aquatic Passability and Restoration Potential Index
The stream crossings and culverts shown in the two maps opposite are critical opportunities to address the health of aquatic life, improve inland flood resilience while addressing necessary improvements to road infrastructure. When thinking about where to site and how to prioritize stream crossings for improvement, the approaches for evaluating stream crossings developed in the UMASS Critical Linkages Tool and the North Atlantic Aquatic Connectivity Collaborative can be helpful guides. For the purposes of simplification this analysis we will focus on aquatic passability score and restoration potential index.
Aquatic Passability Score
The aquatic passability score evaluates conditions against criteria including the grade of the inlet and outlet, the typical water depth, water velocity etc., of each crossing. It creates a composite score for each variable, a weighted average for all variables, then compares this value to a rating of the outlet drop and assigns a value for whichever is lower. What this translates to is that a crossing with a stream passability of 0 is impassible to aquatic species and a score of 1 means that there is no difference in aquatic passability in the crossing compared to the natural streambed (UMASSCAPS).
• Most of the stream crossings in Whately cross streams that are classified as coldwater fisheries. These coldwater fisheries are home to many NHESP listed species. These sensitive habitats are particularly sensitive to changes in flow rates, increased turbidity, and disruptions to aquatic connectivity.
• The greatest number and concentration of crossings in Whately is along West Brook. While most of these crossings show a high to very high aquatic passability score, the sheer number of crossings can still severely impede anadromous species from navigating upstream, disrupting upstream nutrient flows and species composition.
Restoration Potential Index (Delta X IEI)
The restoration potential index represents the potential improvement in local aquatic connectedness from upgrading the crossing with one that meets the specifications set forth in the Massachusetts Stream Crossing Standards crossing weighted by IEI (Index of Ecological Integrity). Delta represents the difference the existing aquatic connectedness in neighborhood of the crossing (before upgrading the crossing) and the calculated aquatic connectedness of the same area after upgrading the crossing.(UMASSCAPS).
• Crossings circled in red, where both the restoration potential index and the aquatic passability score are red, orange, and/ or yellow are good potentials for upgrading. These can be further evaluated through ground truthing.
Funding Streams
and stream crossings with those that meet the Massachusetts Stream Crossing Standards, the projects can be prohibitively expensive due to the need for site assessment, engineered plans, extensive permitting, and other project costs including wetlands delineation when necessary. In 2020 a successful stream crossing upsizing was completed on Mitchell Brook in Whately. This project was made possible by funding from the Massachusetts Division of Ecological Restoration and the nonprofit Trout Unlimited. The design, permitting, and construction costs for these types of projects is often well beyond what local municipalities can afford in their annual budget. This is why we recommend utilizing a combination of NPS Competitive Grants 310, Water Quality Management Planning Grants 604(b), and Municipal Vulnerability Action Grants to assess, design, and implement an integrated road improvement and critical stream crossing and culvert replacement plan.
102 | Recommendation Two | Restore Aquatic Connectivity
Stream crossings and culverts by aquatic passability score.


Stream crossings and culverts by aquatic passability score and restoration potential index.




Recommendation Two | Restore Aquatic Connectivity | 103
RECOMMENDATION 3
Watershed-Scale Management
The types of land use, development, and infrastructure within a watershed impact the quality of water flowing through it. Managing a watershed means making decisions about how land in the watershed is used and where development and infrastructure are placed with an understanding of how those decisions will affect the quality of water bodies like streams, lakes, wetlands, and aquifers in the area.
Watershed-scale management approaches water quality protection and restoration at the scale of a watershed instead of at the scale of individual municipalities. Since water flows within watersheds, but across town and city boundaries, working to protect and restore water quality is most effective when it also transcends municipal borders. Improving riparian buffers at the town level, for example, may yield water quality improvements, but more significant improvement in water quality might occur if interventions extend up and downstream. The same goes for planning water-wise development or
strategically conserving and managing land. Watersheds are whole systems: this means that problems like drought and flooding do not happen in isolated spots or for one specific reason; they happen for complex, interconnected reasons and have impacts that ripple throughout entire watersheds. Similarly, development in one part of a watershed has repercussions watershed-wide. Building resilience to drought and flooding requires interventions coordinated throughout watersheds in ways that address the interconnected nature of aquatic ecosystems, too.
Watershed-scale analysis and planning can be especially important for climate change adaptation and mitigation work. Analyzing the impacts of climate change, and building climate resilience, at the watershed level helps us to see the ways that human development and water systems are interconnected.

104 | Recommendation Three | Watershed-Scale Management
Recommendation 3
Analyze, and strategically act, at the watershed scale.
• 3.1 Work with watershed neighbors to analyze the resiliency of shared water bodies and pool resources to implement interventions. This could include the following:
• 3.1.1 Work with Northampton to study the impacts of Ryan Reservoir and its dam on the downstream areas of the West Brook. Identify interventions for increasing ecological health of West Brook.
• 3.1.2 Work with Conway and Deerfield to study health and resilience of Mill River Hatfield headwaters. Identify interventions for lowering the temperature of Mill River Hatfield.
• 3.1.3 Work with Hatfield and Sunderland to develop climate resilient water policies and programs for agricultural businesses. The goal of these policies and programs would be to both support farms through the changing climate and improve water quality.
• 3.1.4 Work with watershed neighbors to analyze the impacts of zoning on water resilience in the watershed and align land use regulations to protect healthy waters and reduce pollutant loads.
• 3.1.5 Work with municipal water districts within the watersheds to create development recommendations and proactive strategies to ensure sustainable drinking water supplies, taking into account expected frequencies and duration of drought in the region.
• 3.2 Work with FRCOG and PVPC to create Watershed Based Plans for each HUC 12 watershed that runs through Whately. Apply for 604(b) funds to write the plans. Apply for Section 319 funds and MVP implementation funds to implement projects identified in the plans.
Recommendation Three | Watershed-Scale Management | 105
Watershed-Scale Management: A Brief History
There is a long history of watersheds being used as the primary scale of hydrologic analysis, water quality management, and shared governance. Water quality management literature today ubiquitously refers to watersheds as the geographic unit to use for analysis and management. Literature abounds about the practice of watershed protection, and scientific studies about water quality generally occur at the watershed scale. Watersheds have also been, more recently, considered a useful scale at which to plan for issues as broad as public health and climate change.
Watersheds have been understood as a useful hydrologic boundary for a long time. Evidence of watershed mapping dates as far back as the third century BCE in China. Spain and France mapped drainage areas in the mid 1800s (Cohen and Davidson). In the United States, water resources management within watersheds began as early as the 1890s with the U.S. Inland Waterways Commission, which recognized that each river system in the country, “from its headwaters in the mountains to its mouth at the coast, is an integrated system and must be treated as such” (Watershed Protection: A Statewide Approach 10). During the first half of the 20th century, managing water for human uses such as flood control, irrigation, drainage efforts, and power within the hydrologic boundaries of watersheds was common (Cohen and Davidson).
In the 1950s and 60s, there was an increased interest and focus on improving ambient water quality. During that time, Integrated Water Resources Management (IWRM) was coined as a term and a paradigm that saw social and natural systems as interconnected. Foundational to IWRM was the idea that watershed boundaries were the scale at which IWRM should be ideally implemented. At the same time, several river basin compacts were formed for major watershed systems like the Delaware and Colorado Rivers and some state sanitation commissions developed basin plans that classified individual water bodies according to their best uses (Watershed Protection: A Statewide Approach).
Integrated Water Resources Management exploded in popularity and usage in the 1990s, and became the main form of water resource management in international water policy. A culminating moment in the popularity and widespread adoption of watershed management as the main approach to water quality protection was in 1995, when the EPA published Watershed Protection: A Statewide Approach. “The Watershed Protection Approach,” the
report stated, “is a strategy for effectively protecting and restoring aquatic ecosystems and protecting human health. This strategy has as its premise that many water quality and ecosystem problems are best solved at the watershed level rather than at the individual waterbody or discharger level” (Watershed Protection: A Statewide Approach 4). The report went on to explain how the intertwined nature of natural systems with themselves and with human development led the authors to believe that an ecosystem-based approach that facilitated interdisciplinary collaboration across scales in both policy creation and regulation was necessary (Watershed Protection: A Statewide Approach).
By the early 2000s, “watershed approach” and “watershed partnerships” became major buzzwords and frameworks in the water resource management world (Cohen and Davidson). The watershed initiatives that proliferated in the 1990s and early 2000s shared key characteristics including the use of watersheds and sub-watersheds as the key unit for analysis and management. They also addressed issues of ecosystem health, economic benefits, and resource management through a systems-oriented approach, facilitated collaboration among multiple agencies and levels of government, and emphasized volunteer participation from private and public entities (Born and Genskow).
Massachusetts was on the leading edge of this “watershed approach” trend. From 1994 to 2003, Massachusetts had a Watershed Initiative Program. Each year, Watershed Team Leaders, in conjunction with State and Federal agencies, municipal governments and regional planning agencies, universities, local watershed associations, businesses, and other groups developed work plans that identified the most important goals for each watershed and the specific projects and programs needed to meet those goals. Priority projects under the Watershed Initiative Program included hydrologic and water quality monitoring and assessment, habitat assessment, nonpoint source assessment, hydrologic modeling, open space and growth planning, and technical assistance and outreach (Giles).
106 | Recommendation Three | Watershed-Scale Management
Opposite Page Photo Sources: digitalcommonwealth.org & Northampton Department of Public Works


Recommendation Three | Watershed-Scale Management | 107
This map from 1906 illustrates the Metropolitan Water District made up of the Wachusett, Sudbury, and Cochituate Watersheds.
First US Geological Survey of Mill River Northampton Watershed. 1895.
Office of the Charles River Watershed Association interior. 1973.
Watershed Management Programs Today
Today, the EPA provides multiple programs and resources aimed at stewarding watersheds across the nation, including the Healthy Watersheds Program and the Handbook for Developing Watershed Plans to Restore and Protect Our Waters. The Natural Resources Conservation Service of the USDA also hosts a suite of watershed programs that provide technical and financial assistance to local government agencies to help communities implement conservation practices that address watershed resource concerns including the Watershed and Flood Prevention Operations (WFPO) Program and the Watershed Rehabilitation Program. At the state level, Massachusetts has the Watershed Planning Program, which is responsible for developing surface water quality standards, monitoring and evaluating water quality, and creating plans to restore and protect surface waters.
There are abundant examples of non-governmental partnerships and organizations that have convened to protect specific watersheds, too. These partnerships and organizations often form out of a concern for an impaired waterbody; focus on conservation, restoration and education; and rely on non-profit management structures and volunteers to power their work. In Massachusetts, numerous watershed partnerships exist, including the Merrimack Conservation Partnership, the Charles River Watershed Association, The Deerfield River Watershed Association, The Westfield River Watershed Association, and the Connecticut River Conservancy. Collectively, these organizations engage in volunteer-assisted water quality monitoring, river restoration projects, advocacy, land conservation planning, and watershed educational programming throughout the state.



Watershed Plans
Watershed planning is an especially powerful tool in the watershed management and protection toolbox. The authors of Practices of Watershed Protection describe how “watershed planning is the first and perhaps most important watershed protection tool” (131), and the attendees of a conference on effective watershed initiatives agree that “Watershed Plans are necessary precedents for successful watershed management, protection, and restoration interventions” (Born and Genskow 19). Watershed plans identify scientifically-based and prioritized actions for increasing the resiliency of a watershed. They can facilitate collaboration between diverse stakeholders, help partners see the interconnections between natural systems and social and economic activities, and help to unlock funding for plan writing and project implementation by demonstrating multiple-interest-based priorities.
A note on terminology: “watershed plan” is a broad term that can refer to any plan made for a watershed. Watershed plans sometimes refer to land use planning within the boundaries of a specific watershed, or refer more specifically to water-quality analysis and restoration planning for all of the water bodies within one watershed. They can also focus on building climate resilience at the watershed scale. Watershed-Based Plans, on the other hand, have a structure outlined by the Massachusetts DEP which follows a recommended format from the EPA, and are associated with particular funding streams.
108 | Recommendation Three | Watershed-Scale Management
Watershed-Based Plans
One specific form of watershed-scale planning is what the EPA calls Watershed-Based Plans. The EPA requires states to develop Watershed-Based Plans (WBPs) precisely because they recognize the complex and diffuse nature of water quality problems (Watershed Plans Quick Guide). The Massachusetts Department of Environmental Affairs describes on their website how WBPs work in the state. A WBP is a document that follows a structure set by the EPA with the goal of organizing information about a watershed, its nonpoint source (NPS) pollutants, and actions to protect or restore its waters. Watershed-Based Plans help municipalities, regional planning commissions, and other decision-makers identify causes and sources of nonpoint source pollution in their watershed. They also help to prioritize which problems should be addressed first and identify best management practices and watershed-scale strategies to apply.
Because states are required to develop Watershed-Based Plans, creating a WBP is a way to unlock funding for water quality protection and restoration. Two major funding sources that support or reward Watershed-Based Plans in Massachusetts are the Section 319 Nonpoint Source Competitive Grants Program and the 604(b) Grant Program for Water Quality Management Planning.
Section 319 Nonpoint Source Competitive Grants Program
The Section 319 Program provides financial support for projects that address nonpoint source pollution in Massachusetts. In order to receive funding through Section 319, projects have to be preceded by, and identified in, a Watershed-Based Plan. Massachusetts’ 2020-2024 Nonpoint Source Management Program Plan explains that projects in certain categories are more competitive for receiving 319 funds. The priority project categories for 2020-2024 include: nonpoint source watershed projects in impaired waters, healthy watersheds and protection of high-quality waters, implementation projects for climate change adaptation and resiliency projects, outreach and education, and developing Total Maximum Daily Loads (TMDLs). Whately’s watersheds have both impaired waters in need of restoration and healthy waters that can help with climate change adaptation; this means the Town could potentially be a competitive applicant for receiving funding.
Whately has received 319 funds in the past. A water quality assessment report for the Connecticut River watershed in Massachusetts was completed in 2003. The assessment included information on the Connecticut River tributaries in Whately. The Town used the assessment to apply for 319 funds, and used the money to implement bank restoration on the Mill River to protect the Town drinking water supply from fluvial erosion.
604(b) Grant Program for Water Quality Management Planning
The 604(b) Grant Program provides funding to towns, cities, regional planning agencies, and other entities to undertake watershed-based nonpoint source assessment and planning projects. For fiscal year 2022, Massachusetts focused Section 604(b) funds on three project types: developing WatershedBased Plans for future access to 319 funds, developing preliminary designs for addressing water quality in impaired watersheds, and developing green infrastructure projects. Whately could benefit from using 604(b) funds to develop a Watershed-Based Plan, and then applying for Section 319 funds for implementation.
Recommendation Three | Watershed-Scale Management | 109
Case Studies
A Watershed-Based Plan to Maintain the Health and Improve the Resiliency of the Deerfield River Watershed
In 2017, The Franklin Regional Council of Governments (FRCOG) created a Watershed-Based Plan (WBP) for the Deerfield River Watershed that exemplifies the benefits of WBPs for unlocking state funding and guiding action at the HUC 12 level.
Kimberly MacPhee, a Land Use and Natural Resources Program Manager and Climate Resiliency Specialist at FRCOG, spearheaded the project after learning about the EPA’s Healthy Watersheds Program. The WBP was created for the entire Deerfield River Watershed, which is a HUC 8, and included both recommendations for the entire watershed, as well as individual assessments of each HUC 12 within it.
Examples of recommendations include:

• “update and align land use regulations across the 14 watershed towns, with a focus on mapping and managing the river corridor
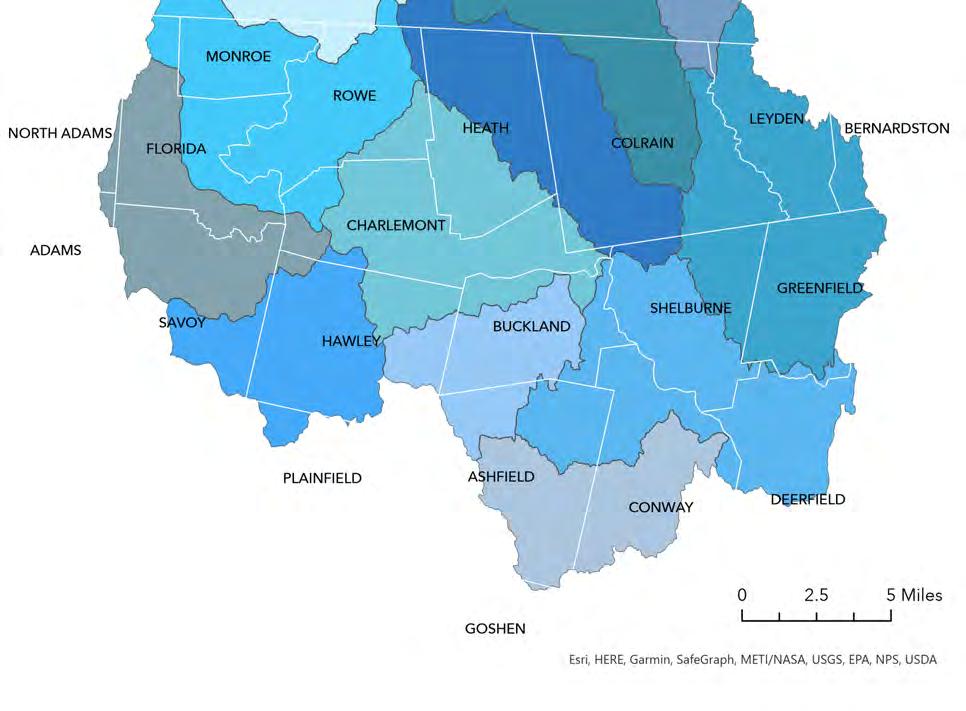
• identify sediment storage, water quality protection and conservation opportunities in the upland areas of the HUC 12 watersheds
• conduct conservation/restoration projects that protect green infrastructure, improve flood resiliency and reduce sediment inputs to streams and rivers” (“Framework for Resilience” 61)
The planning process also involved watershed health assessments for each HUC 12. These assessments identified watersheds that are particularly vulnerable and should be prioritized for support.
Since the plan was published, towns within the Deerfield River Watershed have successfully applied for funding to implement actions identified in the plan in their HUC 12 watersheds. The plan has supported these successful applications for funding and served as a guide prioritizing actions within the broader watershed (MacPhee).
110 | Recommendation Three | Case Studies
Towns and HUC 12 watersheds within the Massachusetts portion of the Deerfield River Watershed
Iowa Watershed Approach
A project that began in 2016, in Iowa, illustrates the power of upstream and downstream communities collaborating to control flooding along their rivers, the benefits of having a paid watershed manager, and the importance of involving private landowners in watershed scale projects.
In 2016, the Iowa Flood Center at the University of Iowa pursued funding made available by the national Department of Housing and Urban Development for bolstering the country’s resilience to extreme weather. The Flood Center used the funds to form a project called the Iowa Watershed Approach. The goals of the project were to reduce flooding during heavy rainfall and improve water quality year-round. The project defines community flood resilience as “the ability of people living in a common watershed to plan and act collectively using local capacities to mitigate, prepare for, respond to, and recover from a flood.” Further, “flood resilient communities also know how to use local and regional resources that make collective action successful” (Giannini). In order to meet their goals, leaders of the project helped to organize nine Watershed Management Authorities across the state by traveling and educating groups of residents and other stakeholders about watersheds and the benefits of working with other communities in their watersheds. Each Watershed Management Authority (WMA) includes stakeholders ranging from private landowners to municipal employees and soil and water conservation districts, and

each has a paid staff person to coordinate projects and build partnerships.
Once formed, each WMA worked with a consultant to develop a watershed management plan to guide longterm planning and decision-making about the watershed. Then, watershed project coordinators worked with WMA members to identify eligible HUC 12 watersheds in which to construct and implement built projects to mitigate flooding, improve water quality, and build community resilience. This process involved sharing information to help people understand the purpose of watershed planning and flood mitigation structures like ponds, wetlands, and sediment control basins. The kinds of interventions implemented in each HUC 12 watershed depended on what stakeholders were interested in and the landform in the area, and included things like ponds, wetlands, water and sediment control basins, terraces, and stream bank stabilization. The educational opportunities were successful at getting private landowners on board with building flood-mitigation structures on their properties and at getting upstream and downstream communities to work together. Between 2018 and 2022, 700 flood-reduction structures were built across the state–many of them on private property and in upstream communities that benefit not only those individuals and communities, but also those downstream (Giannini).
Recommendation Three | Case Studies | 111
The town of Pacific Junction in Iowa is submerged in a flood during March 2019.
Source: Adobe Stock Photos
Case Studies
Provincetown, MA
Provincetown, MA, is an example of a municipality that didn’t complete a WBP, but did conduct watershed-scale planning that resulted in water quality improvements.

In 2004, Cape Cod completed a Watershed Assessment for the 52 subwatersheds on the peninsula. The assessment contained a fact sheet for each subwatershed that provided an overview of the area, studies conducted, ongoing water quality monitoring, management actions taken, and priority actions for the area. Provincetown implemented one of the priority projects identified in the Watershed Assessment.
Provincetown Harbor, on the tip of Cape Cod, was placed on the list of impaired waters for pathogens caused by polluted stormwater runoff. A major cause for the pollution was that Commercial Street, the heart of Provincetown’s
downtown commercial area, runs closely parallel to the beaches of Provincetown Harbor. The high amount of impervious surface provided no infiltration or treatment of stormwater before it flowed directly into the harbor.
The city embarked on a four-phase project to replace Commercial Street’s surface with porous pavement. Funding for the project came from multiple grants through MassDEP’s water quality planning and assessment grant program (Section 604(b)) and the water quality implementation grant program (Section 319). The project resulted in significant reduction of the number of beach closures due to the presence of pathogens.
Assessing water quality issues at the watershed scale allows for strategic identification of problems and prioritization of projects that will have the most impact.
112 | Recommendation Three | Case Studies
Commercial Street, a main social and economic hub and source of pollution, runs parallel to Provincetown Harbor just one block inland.
Source: Adobe Stock Photos
Watershed Scale Climate Resilience
Watersheds are increasingly being used as a framework for regional climate resilience-building. Two examples from Massachusetts illuminate some of the benefits of doing so.
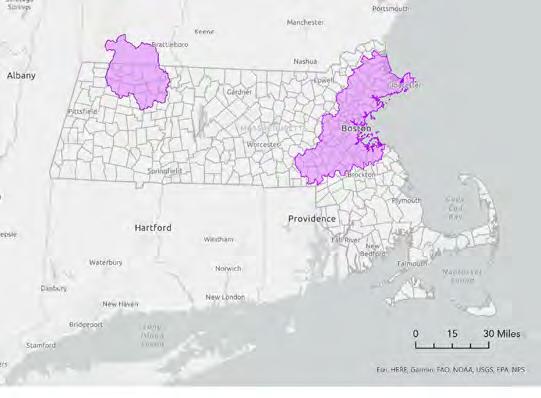
Framework for Resilience in the Deerfield Watershed
Another plan focusing on the Deerfield River Watershed in Franklin County demonstrates the power of innovative planning for climate change at the watershed scale. Kimberly MacPhee, the person who spearheaded the Deerfield River WBP, also authored the Framework for Resilience in the Deerfield Watershed. Since there was no predetermined structure for such a plan, she was creative with its form and content. Since publishing the document, MacPhee has been able to use it to educate people within the watershed about new concepts, such as the idea of “watershed neighbors.” She has used this idea to jumpstart a collaboration between three towns in the watershed who are watershed neighbors.
Greenfield, Bernardston, and Shelburne will work together to update and align their land use regulations to protect healthy water bodies and reduce pollutant loadings to impaired waters from new development and redevelopment projects. With facilitation from FRCOG, and looking to model bylaws in nearby towns and resources from Mass Audubon, MassDEP and Massachusetts state agencies, the Planning Boards in each town will draft updates to their Zoning and Subdivision Regulations (FRCOG). The Framework for Resilience in the Deerfield Watershed was able to be used as a launching pad for getting this exciting project at the intersection of water quality, flood resilience, climate change planning, and watershed scale management off the ground.
Charles River Climate Compact
In the eastern part of the state, the Charles River Watershed Association (CRWA) is also working at the watershed scale to build climate resilience. The CRWA founded the Charles River Climate Compact in 2019. Their website describes that “The Charles River Climate Compact (CRCC) is a voluntary partnership of twenty-eight watershed communities that takes a watershed approach to climate adaptation and mitigation to address precipitationbased flooding, sea level rise, extreme heat, and ecosystem
health through regional collaboration and information sharing” (Charles River Watershed Association). Currently, members of the compact are in the process of developing a five-year strategic plan for the watershed which will identify high-priority actions for advancing climate adaptation. This process is being facilitated by the Metropolitan Area Planning Council and a core team of Climate Compact members with input from stakeholders.
This planning process is still underway, so it cannot yet be used to identify the efficacy of the work. However, the practitioners involved in the process name several key reasons for planning for climate resilience at the watershed level. They believe that regional collaboration is critical in building climate resilient communities because as many cities and towns are stepping up to take climate action where federal action is lacking they need to support one another. Further, they state that “taking a watershed view allows us to identify the most cost-effective solutions and equitably address flooding concerns by considering upstream impacts on downstream communities” (Charles River Watershed Association). They are using a watershedscale approach because it allows them to share resources and knowledge and prioritize actions for the most benefit within the watershed communities.
| Case Studies | 113
Deerfield River Watershed
Charles River Watershed
Ecological Benefits
Scientific literature describes a range of benefits that watershed-scale analysis provides for ecological communities. Watershed-scale analysis allows water quality managers to prioritize conservation efforts based on the location of natural resources in relation to water bodies within the watershed, facilitates holistic and transdisciplinary management of ecosystem communities, and prevents the misdiagnosis of aquatic problems that can happen when only analyzing at the scale of a single site.
Analyzing water quality at the watershed scale allows water managers to strategically prioritize natural resources like wetlands for conservation based on where they are within a watershed. Wetland loss upstream in a watershed, for example, decreases baseflow, increases peak flow, and leads to major flooding in downstream areas. The closer a wetland is to the main stream network, the bigger impact it can have in flood mitigation. When siting wetland conservation, restoration, or construction is informed by analysis at the watershed scale, benefits to water quality will be maximized (Crumpton).
Nguyen et al. (2016) argue that inland fisheries, like those running through Whately, need to be managed at the watershed scale to ensure their resilience. Impacts all along the stream’s extent can compound to reduce the viability of the waterway as a fishery. To really protect inland fisheries, managers need to work in “holistic,
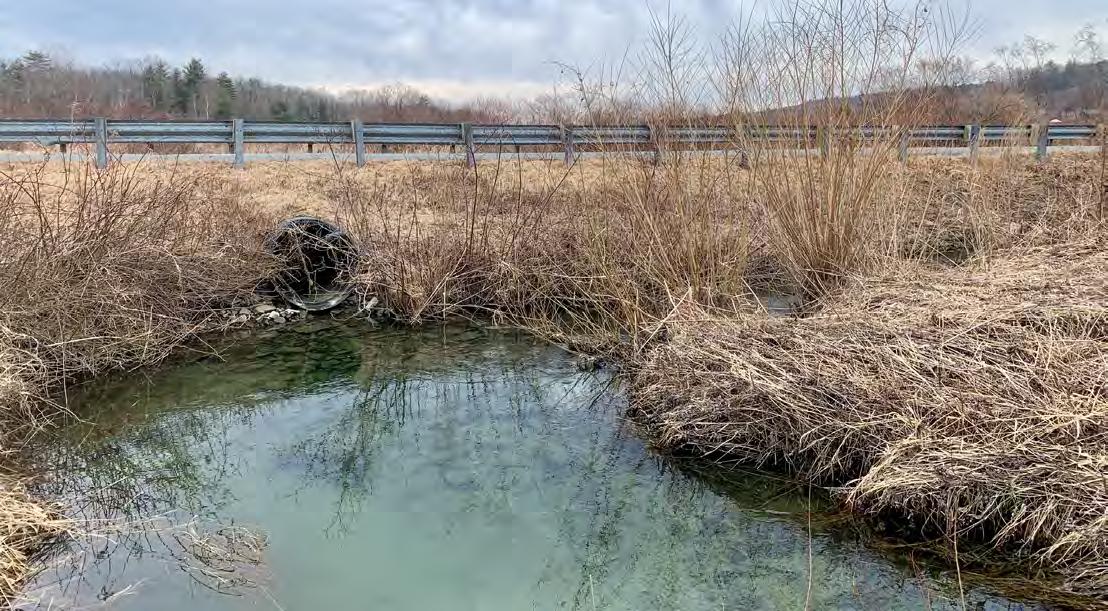
transdisciplinary” ways, which is exactly the kind of work that watershed-scale approaches facilitate. Nguyen et al. make the case that because inland fisheries are inextricably interconnected with their associated watershed, they are extremely complex and challenging to manage and the watershed is a logical management unit. They propose governing inland fisheries across municipal boundaries and forming transdisciplinary projects and teams to carry out monitoring and research on fishery systems.
Bohn and Kershner (2002) describe the benefits of establishing aquatic restoration priorities using a watershed approach. They describe that in order to meaningfully improve water quality, restoration practitioners need to understand the many overlapping and interconnected ecosystems at play within a watershed. They emphasize how a watershed approach can prevent the pitfalls of relying on data or analysis from a single site, which was an issue historically in water quality restoration work. Bohn and Kershner underscore how despite the time and resources necessary for completing a watershed analysis process, it is critical for accurately diagnosing problems in aquatic ecosystems.
114 | Recommendation Three | Benefits & Best Practices
The Mill River Hatfield in north central Whately just before it flows through the Great Swamp, a wildlife protection area with the largest contiguous wetland in any of Whately’s watersheds.
Best Practices
Five Key Elements of Quality Watershed Planning
Quality watershed management requires prioritizing actions so that limited funds and capacity can be leveraged most efficiently. Gatgash and Sadeghi (2022) argue that in order to manage a watershed most effectively, subwatersheds need to be evaluated for their health and then prioritized for action based on which ones have the worst problems and are most-fixable. This allows for efficient watershed management.
While hydrologic benefits are best achieved at the macrowatershed level, political action taking is best achieved at the micro-watershed level (Kerr). There is not one universally agreed upon ideal scale for watershed planning and management to happen at; rather, the scale should be chosen as the best means to the desired end.
Watershed-scale analysis is uncontroversial in the scientific community, but a watershed approach has some controversy associated with it in the planning world. While watershed scale planning has many benefits, it is not a panacea. Just as with planning at any scale, there are pitfalls and shortcomings that can happen in the process. Quality watershed planning involves representation of people most affected in the planning process, prioritization of actions for the efficient leveraging of limited resources, strategic choosing of what scale to plan at versus what scale to take action at, planning on long time horizons, and skilled coordination and facilitation by leadership.
Watershed planning can perpetuate any of the social issues associated with other planning processes, including a lack of representation of affected stakeholders. Watershed approaches to water management are often touted as being more participatory than other forms of water management. Scaling water-quality governance to the watershed does not inherently make it more participatory or democratic, however (Cohen and Davidson). Creative methods will need to be employed to bring diverse groups of people into the process. Forms of engagement that accommodate community members’ constraints and concerns should be utilized. Ensuring representation of people most affected by watershed actions in the planning process leads to the creation and implementation of solutions with the most benefit to the most people.
Toward Understanding New Watershed Initiatives, A Report from the Madison Watershed Workshop (2000) identified nine key aspects of a successful watershed initiative, several of which are about the organizational structure of leadership and staffing. Watershed partnerships can take a range of forms and still be successful: they can be loosely networked affiliations, informal partnerships, or government-sanctioned watershed councils. For longer term initiatives, some degree of institutionalization is required, though. Watershed partnerships also need coordination, facilitation, and entrepreneurship to succeed. These leadership roles can be shared between partners. Another way to ensure clear leadership is through having a paid staff person, which can greatly enhance a watershed partnership’s effectiveness, but it can be hard to find funding for a dedicated staff person, and hard to find candidates with the necessary combination of skills. Sometimes, agencies (like regional councils of government) can “donate” staff support to watershed initiatives. Governmental support is critical for watershed initiatives to succeed. Without administrative support, “institutional inertia will overrun attempts to integrate actions within watersheds” (18).
More recently, Warren et al. (2016) propose a new agenda for watershed restoration that relies on planning many decades into the future, integrates climate change projections, and plans for changing demographics and social values. Good watershed planning accounts for major trends that are likely to impact the watershed far into the future.
Recommendation Three | Benefits & Best Practices | 115
1. Equitable participant representation
2. Prioritization of actions
3. Strategic use of scale
4. Planning far into the future
5. Skilled coordination and facilitation
Applying watershed-scale analysis to Whately’s Watersheds
One way that watershed scale analysis could be applied to the HUC 12 watersheds in Whately is assessing the health of each watershed by identifying the comparative amounts of varying land cover types known to impact watershed resilience. This is one of the analysis types the Deerfield River Watershed Based Plan used for prioritizing actions across their HUC 12s.
Comparing the amounts of land cover type within each watershed can provide some high-level insight about the types of interventions that should be prioritized within and across Whately’s three HUC 12s. The table below shows the percentage of varying types of land cover in each watershed as well as the rationale explaining the utility of each percentage. It is adapted from a table in the WBP for the Deerfield River Watershed.
Permanently Protected Land
Higher percentages of permanently protected land indicate less land susceptible to development pressure.
Lower amounts of agricultural land can correlate to higher water quality.
Natural Land Cover
Higher amounts of natural land cover indicate more habitat, higher water quality, and higher resilience.
Land Covered by BioMap Core Habitat
Higher percentage of acreage indicates greater potential for species diversity/resiliency and water quality.
BioMap Core Habitat Protected
Lower percentages indicate areas that may be susceptible to development pressures.
Aquatic Core Habitat & Upland Buffer
Higher percentages indicate more intact river corridors which are important for physical and ecological processes of the rivers.
Impervious Surfaces
Lower percentages tend to correlate with higher water quality.
Dams *using hazard level as proxy for volume
The number of dams indicates stream habitat fragmentation. The more water a dam impounds compared to its flow volume at outlet, the more significant streamflow alteration.
116 | Recommendation Three | Whately’s Watersheds
Watershed Health Assessment Metric Mill River Northampton Mill River Hatfield Connecticut River: Deerfield to Mill River
30.13% 29.38% 32.29%
Land in Agriculture
4.10% 10.20% 20.30%
87.42% 80.17% 70.44%
31.70% 37.33% 56.18%
47% 41% 37.3%
43.17% 69.77% 73.53%
4.2% 4.4% 4.9%
1 High Hazard 0 Signif. Hazard 2 Low Hazard 3 High Hazard 1 Signif. Hazard 2 Signif. Hazard
Application






| Section | 117
Areas in darker green that are not already protected could be prioritized for conservation.





This map illustrates where habitat elements as identified by BioMap exist within the three watersheds, and where they overlap with each other. Areas in darkest green are where the most layers of important ecosystems overlap. Locations with overlapping habitat not under permanent protection could be prioritized for conservation action.

118 | Recommendation Three | Whately’s Watersheds
Implications
Connecticut River: Deerfield to Mill River
The Connecticut River section has the most land in agriculture of the three watersheds. This means that interventions improving the resilience of farms in this watershed while also increasing agriculture-specific water quality policies and procedures should potentially be prioritized in the Connecticut River: Deerfield to Mill River watershed.
Mill River Northampton
The West Mill River Watershed has the least percentage of land surrounding coldwater fisheries under some form of protection. This means these areas could be vulnerable to development. Cross-town collaboration to target protection of the riparian buffers around the coldwater fisheries in the West Mill River should be prioritized.

Mill River Hatfield
The Mill River Hatfield has the highest number of High Hazard Dams. These dams hold the highest volumes of water of dams in the area, and therefore have the greatest impact on streamflow. Interventions for improving ecosystem health of the Central Mill River downstream of the dams could be important to prioritize. Working with Northampton and South Deerfield on this, even though Northampton isn’t a watershed neighbor, could be beneficial, because the dams exist to provide drinking water reservoirs for those municipalities.
Recommendation Three | Whately’s Watersheds | 119
Works Cited
Arthur C. Nelson, Ph.D. FAcSS, FAIC, et al. Rationale for Smart Growth Fiscal Impact Analysis and Model Fiscal Impact Assessment Ordinance Smart Growth America, June 2022, https://smartgrowthamerica.org/wpcontent/uploads/2022/06/Rationale-for-Smart-Growth-FiscalImpact-Analysis-and-Model-Fiscal-Impact-AssessmentOrdinance.pdf.
“Aquatic Connectivity and Barrier Removal.” CALS, https://cals.cornell.edu/water-resourcesinstitute/watersheds/hudson-river-estuary/watershedmanagement/aquatic-connectivity-and-barrier-removal. Accessed 22 Mar. 2023.
Bardwell, Keith. Interview with Whately Highway and Building Superintendent. Interview by Tyson Neukirch, 1 Feb. 2023.
Barrientos, Rafael, and Luís Borda-de-Água. “Railways as Barriers for Wildlife: Current Knowledge.” Railway Ecology, edited by Luís Borda-de-Água et al., Springer International Publishing, 2017, pp. 43–64, https://doi.org/10.1007/978-3-319-57496-7_4.
Bentrup, Gary. Conservation Buffers: Design Guidlines for Buffers, Corridors, and Greenways. General Technical Report SRS-109, USDA Forest Service, Southern Research Station, Sept. 2008, p. 136, https://www.fs.usda.gov/nac/buffers/docs/conservation_buffers.p df.
Bohn, B. A., and J. L. Kershner. “Establishing Aquatic Restoration Priorities Using a Watershed Approach.” Journal of Environmental Management, vol. 64, no. 4, Apr. 2002, pp. 355–63, https://doi.org/https://doi.org/10.1006/jema.2001.0496.
Born, Stephen, and Kenneth Genskow. Toward Understanding New Watershed Initiatives: A Report from the Madison Watershed Workshop. University of Wisconsin-Madison, 21 July 2000.
Boyd, Lynn. Buffer Zones and Beyond: Wildlife Use of Wetland Buffer Sones and Their Protection under the Massachusetts Wetland Protection Act. University of Massachusetts Department of Natural Resources Conservation, July 2001, https://ag.umass.edu/sites/ag.umass.edu/files/pdf-docppt/final_project.pdf.
Briechle, Kendra J. Conservation-Based Affordable Housing: Improving the Nature of Affordable Housing to Protect Place and People. The Conservation Fund, 2006, https://www.conservationfund.org/images/resources/Conservatio n-Based-Affordable-Housing-Study-all-9-06-lo-res.pdf.
Bruchac, Margaret. “The Geology and Cultural History of the Beaver Hill Story.” Deerfield History Museum, http://1704.deerfield.history.museum/voices/transcripts/wob_cre ation_essay.html.
Bruchac, Margaret. “From Nonotuck to Northampton: Recovering Indigenous Histories.” Historic Northampton, https://www.historicnorthampton.org/ntn.html#NTNP_4.
Burns, Sarah, and Jessica Dietrich. Siting Nature-Based Solutions for Climate Resilience in Massachusetts: A Tool to Support Natural Hazard Resilience Planning at the Local Level. The Nature Conservency, 2020, https://tnc.app.box.com/s/jfwouhde4z9ik712p5v72iv5vylrd6an. Cape Cod Watershed Assessment and Action Plan. Executive Office of Environmental Affairs, 2004, https://www.mass.gov/doc/cape-codwatershed-assessment/download.
Capel, Paul, et al. The Quality of Our Nation’s Waters: Agriculture A River Runs Through It The Connections Between Agriculture and Water Quality. U.S. Department of the Interior and U.S. Geological Survey, 1999, https://pubs.usgs.gov/circ/1433/cir1433.pdf.
Catanzaro, Paul, Anthony D’Amato, and Emily Silver Huff. “Increasing Forest Resiliency for an Uncertain Future.” University of Massachusetts Amherst, 2016, https://masswoods.org/sites/masswoods.net/files/ForestResiliency.pdf
Catanzaro, Paul, and Anthony D’Amato. “Forest Carbon: An Essential Natural Solution for Climate Change.” University of Massachusetts Amhearst, 2019, https://masswoods.org/sites/masswoods.org/files/Forest-Carbonweb_2.pdf.
Chapman, Melissa, et al. “Large Climate Mitigation Potential from Adding Trees to Agricultural Lands.” Global Change Biology, vol. 26, no. 8, 2020, pp. 4357–65, https://doi.org/10.1111/gcb.15121. “Chapter 4: Risk Assessment.” Massachusetts State Hazard Mitigation and Climate Adaptation Plan (SHMCAP), Executive Office of Energy and Environmental Affairs, Executive Office of Public Safety and Security, and Massachusetts Emergency Management Agency, 2018, https://www.mass.gov/files/documents/2018/09/17/SHMCAPSeptember2018-Chapter4.pdf.
Charles River Watershed Association. “Charles River Climate Compact.” Charles River Watershed Association, https://www.crwa.org/climate-compact.
City of Northampton Department of Public Works. Northampton Water Quality Report for 2022. 2022, https://www.northamptonma.gov/DocumentCenter/View/14490/ Northampton-Water-Quality-Report-2022?bidId=.
Cohen, Alice, and Seanna Davidson. “The Watershed Approach: Challenges, Antecedents, and the Transition from Technical Tool to Governance Unit.” Water Alternatives, vol. 4, no. 1, 2011, pp. 1–14, https://www.water-alternatives.org/index.php/allabs/123-a4-11/file.
Cook-Patton, Susan C., et al. “Protect, Manage and Then Restore Lands for Climate Mitigation.” Nature Climate Change, vol. 11, no. 12, Dec. 2021, pp. 1027–34, https://doi.org/10.1038/s41558-021-01198-0. Crumpton, W. G. “Using Wetlands for Water Quality Improvement in Agricultural Watersheds; the Importance of a Watershed Scale Approach.” Water Science Technology, vol. 44, no. 11–12, 2001, pp. 559–64.
D’Amato, Anthony, and Paul Catanzaro. RESTORING OLD-GROWTH CHARACTERISTICS
“Dams & Hydropower.” Massachusetts Rivers Alliance, https://www.massriversalliance.org/hydropower-anddams#:~:text=Massachusetts%20has%203%2C000%20dams%20o n,dams%20are%20considered%20high%20hazard.&text=Dams%2 0deplete%20and%20degrade%20fisheries,recreational%20opport unities%20on%20these%20rivers.&text=To%20power%20Massac husetts%27%20economy%20in,the%20state%20to%20power%20 mills.
DCR Office of Watershed Management. Quabbin Reservation Deer Hunt | Mass.Gov. https://www.mass.gov/info-details/quabbin-reservationdeer-hunt. Accessed 29 Mar. 2023.
Deerfield Planning Board Housing Subcommittee, and Franklin Regional Council of Governments (FRCOG). Town of Deerfield Housing Production Plan. 24 Mar. 2014, htttp://frcog.org/wpcontent/uploads/2018/07/Deerfield-Housing-Production-Plan2014.pdf.
Department of Environmental Protection. Nonpoint Source Management Program Plan 2020-2024. 2019, https://www.mass.gov/doc/final2020-2024-massachusetts-nonpoint-source-management-programplan/download.
120 | Bibliography
Ecology and Vulnerability Rivers and Streams: Coldwater Fisheries Resources Streams | Massachusetts Wildlife Climate Action Tool https://climateactiontool.org/ecogroup/rivers-and-streamscoldwater-fisheries-resources-streams. Accessed 20 Mar. 2023.
Edwards, Jonathan, et al. Prepared by the Whately Open Space Committee (OSC):
EPA. “Climate Impacts on Water Quality.” Climate Change Adaptation Resource Center, https://www.epa.gov/arc-x/climate-impactswater-quality.
Executive Office of Energy and Environmental Affairs (EEA). “Changes in Precipitation.” ResilientMA, https://resilientma.mass.gov/changes/changes-in-precipitation.
“Top Impacts in the Greater Connecticut River Valley Region.” Mass.Gov, https://www.mass.gov/info-details/top-impacts-in-thegreater-connecticut-river-valley-region.
“Resilient MA Climate Change Projections Dashboard.” Massachusetts Climate Change Clearinghouse, https://resilientmamapcenter-mass-eoeea.hub.arcgis.com/#ClimateDashboard.
. “Rising Temperatures.” ResilientMA, https://resilientma.mass.gov/changes/rising-temperatures.
Fisher, A. P., et al. “Cross-Boundary Cooperation for Landscape Management_ Collective Action and Social Exchange among
Individual Private Forest Landowners.” Landscape and Urban Planning, vol. 188, pp. 151–62, https://doi.org/10.1016/j.landurbplan.2018.02.004. Accessed 31 Mar. 2023.
Foster, David, et al. “Wildlands and Woodlands Farmlands and Communities: Broadening the Vision for New England.” Harvard Forest, Harvard University, 2017, https://www.wildlandsandwoodlands.org/sites/default/files/Wildl ands%20and%20Woodlands%202017%20Report.pdf.
Franklin Regional Council of Governments (FRCOG). 2012 Franklin Regional Transportation Plan. Sept. 2011, https://frcog.org/publications/2012-regional-transportation-planfranklin-county/.
A Framework for Resilience: Responding to Climate Change in the Deerfield River Watershed. 2019, https://frcog.org/wpcontent/uploads/2019/03/Framework-for-Resilience-in-theDeerfield-River-Watershed.pdf.
Franklin County Chapter 40B Subsidized Housing Inventory . 21 Dec. 2020, https://frcog.org/wp-content/uploads/2022/11/FranklinCounty-SHI-2020-11-07-22.pdf.
Sustainable Stormwater Management for Franklin County . June 2021, p. 54.
Town of Whately MVP Resiliency Plan. 2021, https://www.mass.gov/doc/whatley-report/download.
Unpaved Road Assessment in Franklin County. 2022, https://frcog.org/wp-content/uploads/2023/03/Unpaved-RoadsAssessment-Summary-Final-3.23.pdf.
Whately Food Assessment. 2015, https://frcog.org/publications/2015-whately-food-assessmentreleased/.
Gatgash, Zahra Ebrahimi, and Seyed Hamidreza Sadeghi. “PrioritizationBased Management of the Watershed Using Health Assessment Analysis at Sub-Watershed Scale.” Environment, Development and Sustainability, June 2022, https://doi.org/https://doi.org/10.1007/s10668-022-02455-8.
Giannini, Kate. “Iowa Watershed Approach: A Vision For A More Resilient Iowa.” Iowa Watershed Approach, https://storymaps.arcgis.com/stories/1f5fd6cac60b4fafa7089b907 3a8d30f.
Giles, Cynthia. Massachusetts Watershed Initiative Program Indicative Project Summaries 1999-2003. Massachusetts Department of Environmental Protection, 2002.
“Green Infrastructure & Stormwater Management.” CALS, https://preview-cals-public-web.pantheonsite.io/water-resourcesinstitute/watersheds/hudson-river-estuary/watershedmanagement/green-infrastructure-stormwater-management. Accessed 20 Mar. 2023.
Griscom et al. “Natural Climate Solutions.” PNAS, vol. 114, no. 44, Oct. 2017, pp. 11645–50, https://www.pnas.org/doi/epdf/10.1073/pnas.1710465114.
Island Cohousing: West Tisbury, Massachusetts. ULI Development Case Studies, Urban Land Institute, https://casestudies.uli.org/wpcontent/uploads/2015/12/C032003.pdf.
Janowiak, Maria, et al. Managing Forests For Climate Change in Massachusetts. 2020, https://www.mass.gov/doc/managingforests-for-climate-change-in-massachusetts-foresterguide/download.
Janowiak, Maria K., et al. New England and Northern New York Forest Ecosystem Vulnerability Assessment and Synthesis: A Report from the New England Climate Change Response Framework Project. NRSGTR-173, U.S. Department of Agriculture, Forest Service, Northern Research Station, 2018, p. NRS-GTR-173, https://doi.org/10.2737/NRS-GTR-173.
Kerr, John. “Watershed Management: Lessons from Common Property Theory.” International Journal of the Commons, vol. 1, no. 1, Oct. 2007, pp. 89–109, https://doi.org/https://www.jstor.org/stable/26522983.
Land Protection | Mass.Gov. https://www.mass.gov/land-protection. Accessed 31 Mar. 2023.
Lucas, Priscila Silva, et al. “Railway Disturbances on Wildlife: Types, Effects, and Mitigation Measures.” Railway Ecology, edited by Luís Borda-de-Água et al., Springer International Publishing, 2017, pp. 81–99, https://doi.org/10.1007/978-3-319-57496-7_6.
Lyons, Katie, and Todd Gartner. “3 Surprising Ways Water Depends on Healthy Forests.” World Resources Institute, 21 Mar. 2017, https://www.wri.org/insights/3-surprising-ways-water-dependshealthy-forests.
MacPhee, Kimberly. Personal Interview. 3 Mar. 2023.
Mangold, Kelly, et al. “2021 Second-Home Consumer Research Survey Results.” RCLCO Real Estate Consulting, Dec. 2021, https://www.rclco.com/2021-vacation-and-second-homeconsumer-research-survey-results/.
Maryland Department of Planning. “Smart Growth Principles.” Smart Growth Online, http://smartgrowth.org/smart-growth-principles/. Accessed 27 Mar. 2023.
MassAudubon. The Value of Nature–Forests
https://www.massaudubon.org/content/download/43199/106852 1/version/3/file/ValueOfNature_Forests.pdf. Accessed 9 Mar. 2023. “Mass Audubon White-Tailed Deer Management Plan FAQs.” Mass Audubon, https://www.massaudubon.org/our-conservationwork/wildlife-research-conservation/deer-management-plan-faqs. Accessed 29 Mar. 2023.
Mass Department of Fish and Game Division of Ecological Restoration. Massachusetts Stream Crossing Handbook. 2018, https://www.mass.gov/doc/massachusetts-stream-crossinghandbook/download.
MassWildlife NHESP. Rare Species Viewer | Mass.Gov
https://www.mass.gov/info-details/rare-species-viewer. Accessed 21 Mar. 2023.
Bibliography | 121
Works Cited
Massachusetts Department of Environmental Protection. “Grants and Financial Assistance: Watersheds & Water Quality.” Mass.Gov, https://www.mass.gov/info-details/grants-financial-assistancewatersheds-water-quality.
. “Watershed-Based Plan Information.” Mass.Gov, https://www.mass.gov/guides/watershed-based-plan-information Source Water Assessment and Protection (SWAP) Report for Whately Water Department. 27 Nov. 2002, https://www.mass.gov/doc/whately-water-department-swapreport/download.
Massachusetts Department of Public Health - Bureau of Environmental Health. “Climate Change.” Massachusetts Environmental Public Health Tracking, https://matracking.ehs.state.ma.us/ClimateChange/index.html.
Massachusetts Executive Office of Technology Services and Security. “MassGIS Data: U.S. EPA Ecoregions.” Mass.Gov, https://www.mass.gov/info-details/massgis-data-us-epaecoregions.
MassDCR. Caring For Your Woods: Managing Forest Carbon https://www.massaudubon.org/conte.
Mass.gov. Agricultural Preservation Restriction (APR) Program https://www.mass.gov/agricultural-preservation-restriction-aprprogram. Accessed 30 Mar. 2023.
Article 97 & The Public Lands Preservation Act https://www.mass.gov/info-details/article-97-the-public-landspreservation-act. Accessed 30 Mar. 2023.
Forest Tax Program Chapter 61. 24 Mar. 2023, https://www.mass.gov/service-details/forest-tax-program-chapter61.
Land Conservation Benefits. https://www.mass.gov/servicedetails/land-conservation-benefits. Accessed 28 Mar. 2023. MassWildlife, The Nature Conservancy. “BioMap Components.” ArcGIS StoryMaps, 31 Aug. 2022, https://storymaps.arcgis.com/collections/7ced005b87864d32987c 11b48a6339d7.
Mauri, Michael, et al. Combined Forest Stewardship Overview: “Ryan Reservoir & West_Whately Reservoir Watersheds” and the “Mountain Street Reservoir” Watershed, Land of the City of Northampton, Department of Public Works, Hatfield, Conway, Whately and Williamsburg, MA. June 2012,
https://northamptonma.gov/DocumentCenter/View/14362/Ryanand-West-Whately-Reservoir-Watersheds-Forest-StewardshipPlan?bidId=.
Forest Management Plan : The City of Northampton, Department of Public Works, Ryan and West Whately Reservoir Watersheds, 20132022. June 2012,
https://northamptonma.gov/DocumentCenter/View/14362/Ryanand-West-Whately-Reservoir-Watersheds-Forest-StewardshipPlan?bidId=.
Mikkelson, Kristin, et al. “Water-Quality Impacts from Climate-Induced Forest Die-Off.” Nature Climate Change, no. 3, Oct. 2012, pp. 218–22, https://doi.org/https://doi.org/10.1038/nclimate1724.
Mountain-Street-Reservoir-Watershed-Forest-Stewardship-Plan.Pdf https://www.northamptonma.gov/DocumentCenter/View/14364/ Mountain-Street-Reservoir-Watershed-Forest-StewardshipPlan?bidId=. Accessed 29 Mar. 2023.
New Hampshire Estuaries Project. “The Impacts of Impervious Surfaces on Water Resources, NHEP.” PREP Reports & Publications, 2007, p. 236.
NOAA. “How To Use Land Cover Data as a Water Quality Indicator.” NOAA Office for Coastal Management,
https://coast.noaa.gov/howto/waterquality.html#:~:text=Impervious%20surfaces%20and%20other%2 0forms,which%20can%20degrade%20water%20quality. Nguyen, Vivian, et al. “To Manage Inland Fisheries Is to Manage at the Social-Ecological Watershed Scale.” Journal of Environmental Management, vol. 181, Oct. 2016, pp. 312–25, https://doi.org/https://doi.org/10.1016/j.jenvman.2016.06.045. Office of Water. Watershed Protection: A Statewide Approach. U.S. EPA, 1995, https://www.epa.gov/sites/default/files/201506/documents/state_approach_1995.pdf.
Pioneer Valley Planning Commisssion (PVPC). Pioneer Valley Sustainability Toolkit: Smart Growth https://www.pvpc.org/content/smart-growth-toolkit. Rapp, Joshua, et al. “Finding the Sweet Spot: Shifting Optimal Climate for Maple Syrup Production in North America.” Forest Ecology and Management, vol. 448, Sept. 2019, pp. 187–97, https://doi.org/https://doi.org/10.1016/j.foreco.2019.05.045. Rempel, Austin, and Mark Buckley. The Economic Value of Riparian Buffers in the Delaware River Basin . Final Report, ECONorthwest, Aug. 2018, https://www.delawareriverkeeper.org/sites/default/files/Riparian %20Benefits%20ECONW%200818.pdf.
Resilient Civil Engineering, P.C. Report on Water Systems Capital Improvements Plan. Whately Water Department, 16 Feb. 2023. Ridge, John, and Frederick Larsen. “Re-Evaluation of Antevs’ New England Varve Chronology and New Radiocarbon Dates of Sediments from Glacial Lake Hitchcock.” Geological Society of America, vol. 102, no. 7, July 1990, pp. 889–99.
Rodina, Lucy, and Kai Chan. “Expert Views on Strategies to Increase Water Resilience: Evidence from a Global Survey.” Ecology and Society, vol. 24, no. 4, Dec. 2019, https://doi.org/10.5751/ES11302-240428.
Rural Policy Advisory Commission. Rural Policy Plan. The Commonwealth of Massachusetts, Oct. 2019, https://frcog.org/wpcontent/uploads/2019/10/Rural_Policy_Plan_10.01.19.pdf.
Ryan-and-West-Whately-Reservoir-Watersheds-Forest-StewardshipPlan.Pdf
https://northamptonma.gov/DocumentCenter/View/14362/Ryanand-West-Whately-Reservoir-Watersheds-Forest-StewardshipPlan?bidId=. Accessed 29 Mar. 2023.
Sather, Henry, and Daniel Smith. AN OVERVIEW OF MAJOR WETLAND FUNCTIONS AND VALUES. U.S. Fish and Wildlife Service, 1984, https://pubs.usgs.gov/fwsobs/1984/0018/report.pdf.
Scheer, Roddy, and Doug Moss. “The Downside of Dams: Is the Environmental Price of Hydroelectric Power Too High?” E - The Environmental Magazine, 18 Sept. 2012,
https://www.scientificamerican.com/article/how-do-dams-hurtrivers/.
Schueler, Thomas, and Heather Holland. The Practice of Watershed Protection; Techniques for Protecting Our Nation’s Streams, Lakes, Rivers, and Estuaries. Center for Watershed Protection, 2000.
SECTION IX - FLOOD PLAIN AND WESTFIELD RIVER PROTECTION ZONING
Siting Nature-Based Solutions for Climate Resilience in Massachusetts.Docx | Powered by Box. https://tnc.app.box.com/s/jfwouhde4z9ik712p5v72iv5vylrd6an. Accessed 27 Mar. 2023.
South Deerfield Water Supply District. January 1, 2021 through December 31, 2021 Water Quality Report. 2022, https://southdeerfieldwater.com/water-quality.
122 | Bibliography
South Mountain Company. Island Cohousing. Photos, https://www.southmountain.com/project/island-cohousing/. Accessed 28 Mar. 2023.
Stacy, Johanna. Personel Interview. 17 Mar. 2023.
Strayer, David L. “The Dirty Truth about Unpaved Roads.” Cary Institute of Ecosystem Studies, 20 May 2012, https://www.caryinstitute.org/news-insights/feature/dirty-truthabout-unpaved-roads.
Sunderland Housing Committee, and Franklin Regional Council of Governments (FRCOG). Town of Sunderland Housing Plan: 2022 Update. 26 Jan. 2022, https://frcog.org/wpcontent/uploads/2022/12/Sunderland-HousingPlan_Update_Approved_1-26-22.pdf.
Suuberg, Martin. “Massachusetts Rivers Protection Act.” Mass.Gov, https://www.mass.gov/doc/about-the-massachusetts-riversprotection-act/download. Accessed 11 Mar. 2023.
Sweeney, Bernard W., and J. Denis Newbold. “Streamside Forest Buffer Width Needed to Protect Stream Water Quality, Habitat, and Organisms: A Literature Review.” JAWRA Journal of the American Water Resources Association, vol. 50, no. 3, 2014, pp. 560–84, https://doi.org/10.1111/jawr.12203
Tata & Howard: Water and Wastewater Consultants. Water Supply System Asset Management Plan: Northampton, Massachusetts. City of Northampton Department of Public Works, Apr. 2013, https://www.northamptonma.gov/DocumentCenter/View/14491/Nor thampton-Water-Supply- Asset-Management-Plan?bidId=.
The Editors of Encyclopaedia Britannica. “Wisconsin Glacial Stage.” Britannica, https://www.britannica.com/science/WisconsinGlacial-Stage.
The United Nations World Water Development Report 2022: Groundwater: Making the Invisible Visible; Executive Summary - UNESCO Digital Library
https://unesdoc.unesco.org/ark:/48223/pf0000380726. Accessed 20 Mar. 2023.
Tighe & Bond. Franklin County Water and Wastewater Systems Study
Franklin Regional Council of Governments, June 2022, https://frcog.org/wp-
content/uploads/2022/07/Franklin_County_Water_Wastewater_St udy_ExecSum_Conclusion.pdf
TNC_HRE_Barriers_FinalReport_April2013.Pdf | Powered by Box
https://cornell.app.box.com/s/kl1j5nysyfibb2e7vqme6o20c0oj2le3 . Accessed 22 Mar. 2023.
Trombulak, Stephen C., and Christopher A. Frissell. “Review of Ecological Effects of Roads on Terrestrial and Aquatic Communities.” Conservation Biology, vol. 14, no. 1, 2000, pp. 18–30, https://doi.org/10.1046/j.1523-1739.2000.99084.x.
UMass Donahue Institute. “Massachusetts Population Projections.” UMass Donahue Institute Population Estimates Program, https://public.tableau.com/views/UMDIProjections/Massachusetts PopulationProjections?:embed=y&:display_count=y?:embed=y&:sho wVizHome=no&:host_url=https%3A%2F%2Fpublic.tableau.com%2 F&:embed_code_version=3&:toolbar=yes&:animate_transition=yes& :display_static_image=no&:display_spinner=no&:display_overlay=ye s&:display_count=yes&:loadOrderID=0. Accessed 31 Mar. 2023.
U.S. Census Bureau. “Whately Town, Franklin County, MA.” Census
Reporter,
https://censusreporter.org/profiles/06000US2501179110whately-town-franklin-county-ma/.
U.S. EPA, Office of Wetlands, Oceans and Watersheds. A Quick Guide to Developing Watershed Plans to Restore and Protect Our Waters. U.S. Environmental Protection Agency, 2013.
US Fish and Wildlife Service. ECOS: Home. https://ecos.fws.gov/ecp/. Accessed 21 Mar. 2023.
U.S. Global Change Research Program. “FOURTH NATIONAL CLIMATE ASSESSMENT II: Impacts, Risks, and Adaptation in the United States.” National Climate Assessment, https://nca2018.globalchange.gov/.
USGS. “Hydrologic Unit Maps.” Water Resources of the United States, https://water.usgs.gov/GIS/huc.html.
USGS ∙ New England Water Science. “Developing a Statewide Hydraulic Modeling Tool.” ArcGIS StoryMaps, 17 Jan. 2023, https://storymaps.arcgis.com/stories/09359fada3924c7a9254022 59ae5616f.
USGS. Surficial Materials of Massachusetts A 1:24,000-Scale Geologic Map Database. Scientific Investigations Map, 2018.
. “Watersheds and Drainage Basins.” United States Geologic Survey, https://www.usgs.gov/special-topics/water-scienceschool/science/watersheds-and-drainagebasins#:~:text=A%20watershed%20is%20an%20area,point%20al ong%20a%20stream%20channel.
ValueOfNature_Forests.Pdf
https://www.massaudubon.org/content/download/43199/106852 1/version/3/file/ValueOfNature_Forests.pdf. Accessed 21 Mar. 2023.
Warren, Robert, et al. “Reimagining Watershed Restoration: A Call for New Investment and Support Structures for Greater Resiliency and Long-Term Impact.” WIREs Water, vol. 4, no. 1, Sept. 2016, https://doi.org/https://doi.org/10.1002/wat2.1174.
Watson, Keri B., et al. “Quantifying Flood Mitigation Services: The Economic Value of Otter Creek Wetlands and Floodplains to Middlebury, VT.” Ecological Economics, vol. 130, Oct. 2016, pp. 16–24, https://doi.org/10.1016/j.ecolecon.2016.05.015.
Watson, Mark L. “Habitat Fragmentation and the Effects of Roads on Wildlife and Habitats: Background and Literature Review.” New Mexico Department of Fish and Game Conservation Services Division, Jan. 2005, http://safepassagecoalition.org/resources/Habitat%20Fragmentati on.pdf.
Whately Master Plan Update Committee, and Franklin Regional Council of Governments (FRCOG). Town of Whately Master Plan. 2011.
Whately Open Space Committee. Whately Open Space and Recreation Plan 2021-2028. 2021.
Whately Water Department. Customer Usage Data. 2022. Wildlands and Woodlands 2017 Report.Pdf
https://www.wildlandsandwoodlands.org/sites/default/files/Wildl ands%20and%20Woodlands%202017%20Report.pdf. Accessed 20 Mar. 2023.
Winnick, Matthew. “Stream Transport and Substrate Controls on Nitrous Oxide Yields From Hyporheic Zone Denitrification.” AGU Advances, vol. 2, no. 4, Oct. 2021,
https://doi.org/https://doi.org/10.1029/2021AV000517.
Wu, Wen-Ying, et al. “Divergent Effects of Climate Change on Future Groundwater Availability in Key Mid-Latitude Aquifers.” Nature Communications, July 2020,
https://doi.org/https://doi.org/10.1038/s41467-020-17581-y.
Wwdr_2020_main_messages.Pdf
https://en.unesco.org/sites/default/files/wwdr_2020_main_messag es.pdf. Accessed 20 Mar. 2023.
Bibliography | 123
Appendix A: Summary of Relevant Recommendations from Previous Plans
PREVIOUS PLANNING
Whately has developed an impressive number of plans that provide analyses, collect community perspectives, develop recommendations for the town, and increase eligibility for a wider array of funding options. Each of these plans inform the ones that follow and are intended to collectively guide actions the Town takes.
This document was informed most notably by the following:
2021 Open Space and Recreation Plan (OSRP): OSRPs are planning documents that towns in the state of Massachusetts can develop to strategize for the future of their conservation and recreation resources. The plan outlines the community’s desires for a beautiful, ecological, and recreational Whately, and best practices for fostering that vision for the landscape in perpetuity.
2021 Municipal Vulnerability Preparedness Plan (MVP): the MVP program supports cities and towns in Massachusetts to plan for climate change resilience and begin implementing identified actions. Communities that complete this planning process are eligible for state funding, like the MVP Action Grant.
2020 Hazard Mitigation Plan: this type of plan is required by the Federal Emergency Management Agency (FEMA) and the Massachusetts Emergency Management Agency (MEMA) to receive funding to proactively prevent or reduce damage from extreme events. The purpose of this document is to identify the potential hazards Whately might experience and outline actions that the town should take to be better prepared for emergencies. Having completed this plan, Whately is eligible for funding through the Hazard Mitigation Grant Program (HMGP), the Flood Mitigation Assistance Program (FMA), and the Pre-Disaster Mitigation Program.
2011 Master Plan: this plan outlines development goals for the town. Because residents expressed that the forests and working lands are aspects they love the most about the town, the plan prioritizes the protection of these assets in the proposed approaches to growth.
Additonal Plans for the Town of Whately:
2023 Water System Capital Improvements Plan
2018 Economic Development Plan
2016 A More Welcoming, Walkable Whately: A Master Plan for the Whately Center Historic District
2015 Community Food Assessment
2009 Heritage Landscape Report
Relevant Regional Plans:
2022 Franklin County Water and Wastewater Study
2019 MA Rural Policy Plan
2014 Franklin County Regional Housing Study
2013 Sustainable Franklin County
124 | Appendix A | Recommendations from Previous Plans
2021 OPEN SPACE AND RECREATION PLAN
Relevant Open Space Goal:
• Ensure that Whately protects farmland, forestland, scenic views, and other open space vital to sustaining the town’s historical rural character and maintaining the quality of air, water, and wildlife habitats.
Relevant Open Space Recommendations:
Work to preserve areas of Whately that are most important to protect, recognizing the reality of climate change.
Work with the selectboard to hire a consultant to conduct a geomorphic assessment of the Mill River Watershed and identify flooding and fluvial erosion threats to Whately’s public water supply wells and other critical infrastructure (culverts, roads, utilities) within the watershed. Identify new priority nature-based solutions to mitigate these threats. Prepare conceptual designs and cost estimates for projects that increase climate resiliency and mitigate flood and fluvial erosion hazards.
Use existing or emerging tools, including land use regulations, to incorporate Best Management Practices for River Corridor areas (FRCOG’s River Corridor Toolkit) to secure more effective riparian buffers along the Connecticut and Mill Rivers and their tributaries.
Assess road salt impacts on the health of waterways and trees town-wide, with special attention to the Great Swamp. Secure funding for remediation options. Enlist help of state legislators to advocate for beneficial measures under the jurisdiction of MassDOT.
Request technical assistance from the FRCOG to assist with a review of Whately’s zoning bylaws, subdivision regulations, and general Town bylaws for best practices for open space protection, stormwater management, habitat (including pollinator habitat), water resource protection, drought tolerance, climate-resilient landscapeing, and other open space priorities to ensure Whately continues to update its land use regulations to protect natural resources and to increase resilience to climate change
Tap into local expertise or hire a consultant to complete an assessment of all culverts and drainage systems in Town for hazard mitigation and resilience that also considers which culverts are in need of repair to strengthen coldwater critical linkages. The assessment should include an evaluation of the physical state of the culverts and GIS data to have record of where culverts are located. Based on the results of the inventory, prioritize repairs and replacements.
Whately Water Department
2022 MVP
Planning Board Conservation Commission
2022 NRCS EQIP, Agricultural Lands Conservation Program/ Wetlands Reserve Easements
Conservation Commission 2023 Legislative earmark, MassDOT
Planning Board 2021, ongoing
MVP, District Local Technical Assistance (DLTA)
Highway Department 2023 MVP, 3C Transportation funding from FRCOG, DLTA
Appendix A | Recommendations from Previous Plans | 125
Responsible Group Start Date Potential Funding Sources
Objective Action
Relevant Open Space Recommendations, continued:
Objective Action
Conduct a baseline tree inventory on public and private land to identify species and health, and opportunities to enhance the public tree canopy to provide climate resilience benefits, such as carbon sequestration, forest health, stormwater management, pollinator habitat, and biodiversity, and to enhance recreation areas by providing additional shade and native landscaping. Follow up with creation of tree planting plan and installation based on inventory’s findings. Reference FRCOG’s Climate REsilient Trees for Streetside Tree Belt Planting list.
Tap into local expertise or hire a consultant to identify riparian areas in the greatest need of restoration along West Brook, Roaring brook, and other tributaries and develop/implement restoration projects to improve the health of coldwater streams.
Responsible Group
Date Potential Funding Sources
Tree Warden 2025 MVP, DCR, DCS
Engage Whately residents and staff in practices that protect and enhance public open space areas, environmental health, and climate resilience.
Use planning tools, such as mapping resources, consultants, public engagement, and land use regulations, to meet the recreation needs of the community.
Work with the Recreation Committee to create and improve recreational facilities of public interest.
Tap into local expertise or hire a consultant to create an invasive plant management plan to inventory sites, prioritize areas for treatment and provide recommendation for treatment and ongoing maintenance activities. To help slow the spread of invasives in the interim, research best practices for controlling invasives, especially at stream crossings.
Investigate potential for environmentally responsible means of access to the Connecticut River in Whately and in surrounding towns.
Selectboard 2025 MVP
Conservation Commission, Highway Department
2023 MVP, Town
Selectboard 2022 MVP, DCS
Improve public awareness of environmental issues, natural resource protection, and open space, recreation, and multi-use trail opportunities
Coordinate with the Town of Deerfield and the Tri-Town Beach Distric Commission to determine how Tri-Town Beach can meet the needs of a greater number of residents and present as mre welcoming. Conduct a site analysis and feasibility study of water quality and infrastructure improvements to the TriTown Beach facilities.
Identify community organizations and volunteers (including students), to develop materials and use existing communication systems (e.g., the Town website, The Scoop) to provide information to the Whately community about open space and recreation (including trail information), and resource protection (e.g., drought and heat tolerant landscaping, pesticide use, good forest stewardship practices). Work with the Conservation Commission and Agricultural Commission to identify topics.
Selectboard 2021 MVP, DPA, PARC MA Land & Water Conservation Fund
Open Space Committee 2021 and ongoing
Volunteer time, Town funds for staff time
Start
126 | Appendix A | Recommendations from Previous Plans
Relevant Open Space Recommendations, continued:
Objective
Action
Encourage forest owners to use the USFS Adaptation Workbook and other resources to determine best management practices and climate adaptation efforts would be right for their property. Encourage the Highway Department and private property owners to plant climate resistant trees, including in the road right-of-way.
Work with the City of Northampton, the South Deerfield Water Supply District, and the MA DEP to determine the best management for stream flow standards (min or max) if it is determined that there are minimum stream flow requirements for the West Brook and Roaring Brook that are part of the permits for these public water supplies.
Research deeds of land owned by the City of Northampton and South Deerfield Water Supply Protection District to determine level of protection. If needed, identify if there is a path toward permanently protecting properties.
Responsible Group Start Date
Potential Funding Sources
Open Space Committee 2024 Town funds for staff time
Conser-vation Commission 2022 Volunteer time, Town funds for staff time
Selectboard 2023 Volunteer time, Town funds for staff time and Town Counsel time
Appendix A | Recommendations from Previous Plans | 127
2021 MUNICIPAL VULNERABILITY PREPAREDNESS PLAN
Top Priority Recommendations:
• Obtain funding to address stormwater management and drainage issues throughout Town
• Hire a consultant to identify additional locations where a municipal well could be installed
Relevant MVP Issues and Proposed Actions:
Issues
• Hire a consultant to conduct a geomorphic assessment of the Mill River Watershed to identify flooding and fluvial erosion threats to public water supply wells
• Conduct an assessment of vulnerable populations and drinking water needs for farm workers.
• Identify locations in need of vegetated buffers along the Mill River and identify riparian areas in need of restoration.
Water Resiliency/Drought
Proposed Actions
Aquifer depletion Creating a Drought Management Plan
Provide water to other towns but can’t rely on drawing from that water if Whately’s own supply is running dry
West Whately particularly vulnerable
Use of water by agriculture, generally. Greenhouses use Town supply: concern about current draw plus the expectation for more greenhouse use in the future
Exemptions mean that the town cannot require farms to reuse/recapture water
Create rainwater harvesting systems on municipal buildings and land and provide residents with rain barrels and guidance on their installation, maintenance, and appropriate uses of stored rainwater.
The Town and water department are working on formalizing emergency water sharing agreements with surrounding communities.
Hire a consultant to conduct an assessment in order to identify additional locations where a municipal well could be installed.
Hire a consultant to conduct a geomorphic assessment of the Mill River Watershed and identify flooding and fluvial erosion threats to Whately’s public water supply wells and other critical infrastructure (culverts, roads, utilities) within the watershed. Identify priority Nature-Based Solutions to mitigate these threats. Prepare conceptual designs and cost estimates for projects that increase climate resiliency and mitigate flood and fluvial erosion hazards
There are a significant number of greenhouses on the farms in East Whately. Seek funding to install rainwater harvesting systems on local farms to assist with irrigation needs.
Equip the Water Department pump houses with backup power (generator). Assess whether solar battery storage is feasible for backup power.
Evaluate the Town’s zoning bylaws to determine how best to encourage LID techniques Town-wide.
Native American sites are located throughout town but are left unmarked to limit vandalism. Some of these sites are in East Whately, which are at high risk to flood damage. Prepare an assessment to determine which sites are at the highest risk to flood damage and develop nature based solutions that could be implemented to mitigate flood damage.
Wildfire
Issues
Lack of infrastructure for firefighting - no hydrants in West Whately which is more forested/vulnerable to fire
Proposed Actions
Promote construction of fire ponds, underground storage tanks, and dry hydrants in areas not served by public water supply, especially when new construction is proposed.
128 | Appendix A | Recommendations from Previous Plans
Drought/Heavy Precipitation/Extreme Temperatures/Heavy Wind on Farms Issues
Wet fields following heavy rains
Increased disease pressure
Increased labor costs due to more frequent irrigation needs
Dustiness when cover crops not sowed (perhaps due to later growing season)
Issues
Issues
15% of Whately’s roads are gravel and more prone to wash outs - concerned by roads that may become impassable after significant precipitation
Proposed Actions
Seek funding to create a municipal database to show how local farmers are adapting to climate change. The database could provide information about any grant funding received and opportunities for other funding to support adaptation efforts.
Work with the NRCS to identify techniques that could help to minimize the amount of dust/soil blowing off of fields such as inter-seeding between rows after crops are established, flail mowing instead of disking, etc. Techniques will need to be tailored to the farms’ needs.
Partner with CISA to open a line of communication with local farmers, which could be especially useful after an event to document damage.
Work with CISA/UMass Agricultural Extension to identify cover crops that could be used with changing growing seasons to limit dirt blowing off farm fields in the winter.
Extreme Heat
Proposed Actions
More frequent heat waves stress workers who spend the majority of their time outside. Develop and implement a training program for supervisors to ensure workers are getting enough breaks and water, as there is frequent turnover in these positions.
Road Drainage
Proposed Actions
Seek funding to improve stormwater drainage on gravel roads to aid with evacuation efforts. For priority locations, the Town can coordinate with FRCOG to conduct stormwater site assessments and develop stormwater BMP concept designs based on the recent Franklin County Stormwater Pilot Project.
Protect water quality of the many streams that run alongside the roads
More culverts need repair or replacement than the Highway Department has the capacity to address in a timely manner
Continuing culvert maintenance
Hire a consultant to complete an assessment of all culverts and drainage systems in Town. The assessment should include an evaluation of the physical state of the culverts and GIS data to have record of where culverts are located. Based on the results of the inventory, prioritize repairs and replacements. Prioritization should consider which culverts are in need of repair to strengthen coldwater critical linkages.
Culverts are not mapped
Advocate for MassDOT to clean out the pores in the pervious pavement at the Whately Park and Ride to ensure proper stormwater drainage, and identify additional opportunities for stormwater filtration.
Hire a consultant to assess options for rainwater harvesting and implementing stormwater BMPs to reduce flooding risks at the school. As a part of the assessment, determine if the roads leading to the shelter would benefit from stormwater BMPs to aid with access.
Appendix A | Recommendations from Previous Plans | 129
Relevant MVP Issues and Proposed Actions, continued:
Northern Hardwood Forests
Issues
Shifting conditions weakening trees, changing forest compostion and altering habitat conditions
Proposed Actions
Seek funding and technical assistance to develop educational materials and conduct outreach to landowners to encourage climate resilient forest stewardship practices. Encourage forest owners to use the USFS Adaptation Workbook to determine adaptation efforts would be right for their property.
Streambank Erosion
Issues
Mill River streambank erosion increasing due to heavier precipitation events
Proposed Actions
Partner with CISA and local farmers to evaluate riparian buffers along the Mill River that are vulnerable to erosion. Identify interested farmers to develop vegetated buffers using funding through the USDA Conservation Reserve program or the NRCS Environmental Quality Incentives Program.
Hire a consultant to identify riparian areas in the greatest need of restoration along West Brook, Roaring Brook, and other tributaries and develop/implement restoration projects to improve the health of coldwater streams.
Invasive Species
Issues
All ecosystems represented in Whately are becoming more susceptible and/or are being actively degraded by invasive species
Proposed Actions
Secure funding for invasive plant management to control invasive plants along Whately’s roads. Additionally, develop a comprehensive list of invasive plant species in the Town, and develop a public education & town staff training program to manage invasives and control spread using resources available from the Massachusetts Invasive Plants Advisory Group.
Threatening infrastructure in town by clogging culverts, overwhelming roadsides, destabilizing drainage areas, and increasing vulnerability of trees to windblow
Vector-Borne Diseases
Issues
Increased cases of tick-borne illnesses (Franklin County has highest rate of emergency department visits for tickrelated illness in whole state)
Longer active seasons of tick activity, and less die-off, drastic increase in tick and mosquito populations in the last 10-15 years
Issues
Repairs becoming more expensive
U.S. Census Bureau 2021 American Community Survey Five-Year Estimates
Proposed Actions
Explore tick and mosquito control options, and educate residents about risks associated with vector-borne diseases and actions they can take at home to protect their community, such as eliminating sources of standing water.
Energy Resilience
Proposed Actions
Whately’s industrial park is well drained, but has a lot of impervious surfaces. Identify opportunities for implementing LID/stormwater management projects and solar PV projects; form partnerships with businesses in the industrial park to design and implement projects.
130 | Appendix A | Recommendations from Previous Plans
Relevant MVP Issues and Proposed Actions, continued:
Dam Failure
Issues
Homes are located in the inundation zone of two high risk dams
Increased, heavier precipitation events could lead to the dams failing
Proposed Actions
West Whately has poor cell phone service, which may cut off communications. There is a high risk of isolation in the event of a dam failure for residents/workers in the Harriman Dam inundation zone.
Appendix A | Recommendations from Previous Plans | 131
2020 HAZARD MITIGATION PLAN
Relevant Hazard Mitigation Issues and Proposed Actions:
General Issues
Proposed Actions
Equip the Water Department pump houses with backup power (generator). Assess whether solar battery storage is feasible for backup power.
Flooding - High Priority
Issues
Whately’s public water supply wells near the Mill River are likely still vulnerable to flooding, fluvial erosion and contamination from the Mill River, especially given the more frequent and intense storm events due to climate change and the unstable geomorphology of the river due to historic river channel straightening downstream.
Proposed Actions
Hire a consultant to conduct a geomorphic assessment of the Mill River Watershed and identify flooding and fluvial erosion threats to Whately’s public water supply wells and other critical infrastructure (culverts, roads, utilities) within the watershed. Identify priority Nature-Based Solutions to mitigate these threats. Prepare conceptual designs and cost estimates for projects that increase climate resiliency and mitigate flood and fluvial erosion hazards
Whately’s public water supply pump heads are within the 100-year flood plain of the Mill River and do not have back-up power generation. Power outages due to flooding could cause a disruption to the town water supply. The Town is working to secure funding for a back-up generator.
The potential for ice jams on the Connecticut River is greater now that Vermont Yankee is closed. Farmland along the banks of the river could be impacted by flooding from an ice jam.
Hire a consultant to complete an assessment of all culverts in Town. The assessment should include an evaluation of the physical state of the culverts and GIS data to have record of where culverts are located. Based on the results of the inventory, prioritize repairs and replacements.
Review and amend the Floodplain District Overlay Zoning Bylaw using the state Model Floodplain District Bylaw (which should be available in 2021) to reduce the risk of flooding and damage to infrastructure and natural resources. Special consideration should be given to further restricting or limiting new development within the 100year floodplain and requiring more detailed standards for review of storm water plans for developments.
Whately does not have a comprehensive list or GIS mapping of culverts in town.
The only access road to the White Birch Campground is within the 100-year flood plain. This places those residents at risk during a flood event.
Some of Whately residents rely on private wells, placing them at risk during prolonged power outages.
Private wells along the Mill River Floodplain are vulnerable to contamination and erosion caused by flooding. Wells on North Street are of particular concern because they are not properly capped.
Westbrook Road, Williamsburg Road, State Road, and the north end of North Street experience chronic flooding. In addition, the steeper elevation of the west side of town causes the road side ditches to flood after heavy rain events.
Many farms and other industry in Whately have large above ground propane storage. Tanks within the flood plain are at risk of becoming untethered during a flood event.
132 | Appendix A | Recommendations from Previous Plansn
Relevant Hazard Mitigation Issues and Proposed Actions, continued:
Wildfires - Low Priority Issues
A lack of access to forested areas and availability of water/ manpower for firefighting purposes in rural Whately is a concern.
Hydrants in Whately have been located via GPS but not yet mapped.
Proposed Actions
Implement forest stewardship practices that produce more stable, successional forested landscapes and which reduce the risk of fire hazards (such as the removal of slash)
Educate homeowners about the risk of wildfires and brushfires and how to reduce the risk by adopting general fire safety techniques.
Promote construction of fire ponds, underground storage tanks, and dry hydrants in areas not served by public water supply, especially when new construction is proposed.
Earthquakes - Low Priority
Issues
Damage to the two dams in Whately from an earthquake is a concern.
The Water Department’s 500,000-gallon storage tank is vulnerable to earthquakes. The above/below ground storage tank in South Deerfield is also vulnerable.
Dam Failure - High Priority Issues
Whately houses a number of migrant farm workers with limited or no English language ability, many of whom are expected to live and work within the Harriman Dam Inundation area along River Road. Public warning and emergency communications with this population is very limited and it would be difficult to communicate warnings in the event of a critical dam failure.
Whately’s EMD maintains a call lists for residents within the inundation areas of dams in Whately. However, this information is not yet available for residents whom would be impacted by a critical failure of the Harriman Dam. The residents and businesses along River Road are within that inundation area. This includes a large swaths of agricultural land.
Continue to maintain call lists and emergency evacuation drills for residents living below the dams on the Northampton Reservoir and downstream from the Conway Dam along the Roaring Brook.
Bridges on West Brook Road and North Street are vulnerable to flooding if there is a breach of the Northampton Ryan Reservoir dam.
Proposed Actions
Proposed Actions
Prepare a map of significant hazard dams and their potential inundation areas. Include all dams in the town and immediately upstream of the town’s borders and the areas that are likely to be flooded in the event of a dam failure. Review evacuation procedures for the flood prone areas in town (identified on the map, including areas shown on the mapper tool) and update, if necessary. Distribute map to public safety officials in Whately
Appendix A | Recommendations from Previous Plans | 133
Relevant Hazard Mitigation Issues and Proposed Actions, continued:
Drought - Medium Priority
Issues
Some of Whately’s residents are serviced by private wells that run the risk of going dry during prolonged drought.
Proposed Actions
Complete a Drought Management Plan that includes an evaluation of how long the water supply can serve residents during a drought and recommendations for demand management, emergency supplies, and the need for locating a new public water supply (through interconnections with neighboring towns).
The Water Department does not have an accurate estimate of total water availability. An evaluation is needed to determine how long the supply can serve residents during a drought.
The agricultural industry in town could suffer severe economic hardship during prolonged droughts.
Periods of prolonged drought make Whately’s forests more vulnerable to wildfire.
A drought could compromise firefighting efforts in areas of town reliant on surface water sources for fire suppression.
Landslides - Low Priority
Issues
While no significant landslide events have been observed in Whately, the potential for landslides exist due to the hilly terrain and ridgelines in the western parts of Town.
Proposed Actions
Protect existing development from potential landslides by ensuring that surface water and groundwater are properly managed. Update and amend, if necessary, the town’s Zoning Bylaws and Subdivision Rules and Regulations to include provisions for stormwater management, native plantings, etc. to build climate resiliency and mitigate impacts from natural hazards.
Invasive Species - Low Priority
Issues
Japanese knotweed forms monocultures along stream and riverbanks in town, and is poor erosion control compared to native vegetation.
Agriculture and forestry in Whately rely on biodiverse ecosystems and are experiencing negative impacts due to invasive species. The scope of successfully controlling invasives long-term is often beyond the reach of what farmers and foresters can manage on their own.
Man-Made Hazards - No priority listed
Proposed Actions
Issues
Whately is vulnerable to a spill of hazardous materials and/or hazardous waste transported on Interstate 91, Route 5/10, or on the rail line through town.
Whately is vulnerable to a spill of hazardous materials and/or hazardous waste at one of several facilities in town that use and store hazardous materials. These facilities and/or hazardous materials storage may be in the 100year floodplain.
Proposed Actions
Improve communication with the railroad company by organizing with other communities on the freight line and talking to state representatives.
134 | Appendix A | Recommendations from Previous Plans
2011 MASTER PLAN
Relevant Housing Goals:
• To provide housing in character with the community that is financially attainable and meets the needs of all Whately citizens, with emphasis on seniors, current residents, and people who work within town.
• To encourage the innovative use or reuse of existing structures to create diverse housing opportunities while preserving the rural, agricultural character of Whately.
• To balance new residential development with the protection of Whately’s natural, historic, and scenic assets.
Relevant Housing Recommendations:
Consider requiring that a certain percentage of new housing units in any subdivision be set aside as affordable through a deed restriction. The regulations should ensure that the affordable units are of the same design quality as the market rate units in the subdivision.
Community Preservation Act funds could be used towards subsidizing the affordable units. Further investigate strategies for using the Community Preservation Act community housing funds to support and create more affordable housing in Whately. Research how other similar CPA communities have used these funds for developing community housing, such as Leverett.
The Housing Committee could conduct outreach and education about the Housing Rehabilitation Loan Program to residents to increase participation and improve Whately’s existing housing stock, including making accessibility improvements to homes. Conduct greater outreach and education about the Town’s Elderly Tax Exemption to ensure qualifying residents are aware of this option. Consider adopting the Senior Property Tax Work-off Program to allow senior residents to do volunteer work for the town in exchange for a reduction in their property taxes.
To encourage diverse housing options located close to existing transit, shops and services, the town could explore allowing residential apartments on the upper floors of new commercial buildings by-right within the Commercial Districts.
Relevant Land Use Goals:
• To encourage economic, industrial, and commercial growth to occur in a manner consistent with the best interests of the community to promote a stable tax base, while ensuring such development does not overburden the town’s infrastructure or damage the town’s natural resources and rural character.
• To encourage the adoption and implementation of balanced regulations that promote and encourage environmentally sensitive and economically sustainable development, protect the valued natural, agricultural, scenic, and cultural resources of the Town, and ensure that new development reflects the town’s overall vision.
Relevant Land Use Recommendations on next page.
Appendix A | Recommendations from Previous Plans | 135
Relevant Land Use Recommendations:
Consider adding a Farm Building Reuse bylaw for the AR1 and AR2 zoning districts to encourage the adaptive reuse of vacant or underutilized farm buildings with Site Plan Review. Examples of adaptive reuse could include: event space for weddings and other functions, studio space for artists or musicians, professional office space, or other commercial use that is compatible with the surrounding landscape.
Consider encouraging the reuse of existing buildings in the town center for limited commercial uses through a Village Center Reuse Overlay District bylaw. The Town should conduct further outreach and research to determine what commercial uses would be appropriate in the town center. Design guidelines and a Design Review process should be developed as part of the bylaw to help maintain the historic character of the center.
Consider developing a Mixed Use Overlay District at or near the intersection of Routes 5 and 10 and Christian Lane, and at the intersection of Christian Lane and Long Plain Road, to encourage a compact mix of small-scale commercial development and diverse housing options. Design guidelines and a Design Review process could be developed for the overlay district bylaw to ensure that development is consistent with community character, is transit-supportive, and pedestrian friendly.
Consider adding a Planned Unit Development (PUD) Overlay District in the northern Commercial District in town at the intersection of Routes 5 and 10 and Route 116. Through PUD, a parcel could be developed as a single project with a mix of uses based on a comprehensive site plan. A PUD requires a design and permitting process that encourages multiple-story buildings and a campus-like form of development to make more efficient use of land and utilities, and to reduce the length of streets and the number of curb cuts needed. Uses currently allowed in the Commercial District would also be allowed in the PUD.
Prioritize updating the Infrastructure and Capital Facilities Chapter of the Master Plan to determine the Town’s existing and forecasted needs in the areas of schools, roads, water, library, public safety, and Town offices. Particular attention should be given to planning the future renovation and uses of the Town-owned buildings in the Town Center.
Examine the use of a Commercial Cluster Development Overlay District in the southern Commercial District in town along Routes 5 and 10. This bylaw would allow for the clustering of commercial uses on a smaller scale than the PUD bylaw, and would require a certain percentage of the developable area of the parcel to be permanently protected from development. Similar to the PUD bylaw, the Commercial Cluster bylaw would allow for a unified development of multiple buildings containing a mix of uses based on a comprehensive site plan. This type of development would limit the number of curb-cuts along Routes 5 and 10, and promote a less sprawling form of development while also protecting open space.
Consider encouraging residential infill development along Long Plain Road north of Christian Lane and south of the Industrial Park, and along Christian Lane west of Long Plain Road and east of the I-91 overpass, through a Residential Infill Development Overlay District bylaw. The bylaw would allow for flexibility in lot sizes within the district, and require infill development to be consistent in style and scale as abutting structures. The intent of the bylaw would be to concentrate new housing development in an area located close to employment opportunities and the school.
Consider encouraging residential infill development around the intersection of Poplar Hill Road, Conway Road, Williamsburg Road, and Webber Road, and around the intersection of Webber Road and Haydenville Road, through a Residential Village Infill Development Overlay District bylaw. As with the above recommendation, the bylaw would allow for flexibility in lot sizes within the district, and require infill development to be consistent in style and scale as abutting structures. The intent of the bylaw would be to accommodate new housing in West Whately in a residential village-like setting.
Consider adopting a Ridgeline Protection Bylaw that would help to protect the scenic and environmental resources of the slopes and ridgelines of the West Whately hills from poorly planned development. All proposed development in designated areas would be reviewed for potential negative impacts to the environment, including erosion, sedimentation, septic tank failures, flooding, and water pollution, as well as to the scenic amenities that contribute to the character of the community.
Finish developing a Chapter 61 policy that prioritizes parcels currently enrolled in the Chapter 61 program. The Town could utilize its right-of-first refusal option under Chapter 61 to purchase Conservation Restrictions (CR) on these parcels if they become available, or transfer the right to a local land trust or the Massachusetts Department of Agricultural Resources in order to place an Agricultural Preservation Restriction (APR) or CR on the property. The Town could use Community Preservation Act funds for this purpose.
136 | Appendix A | Recommendations from Previous Plans

Appendix B: Maps by chapter
ANALYSIS FRAMEWORK
WHATELY’S WATERSHEDS
This map orients readers to the three HUC 12 watersheds in Whately.
MassGIS
• MassDEP Hydrography (1:25,000)
• 2020 U.S. Census - Town Boundary Lines
• NRCS HUC Basins (8,10,12)
ESRI
• World Terrain Basemap with Labels
• Google Open Street Map Labels
ECOLOGICAL CONDITIONS
SOILS BY DRAINAGE CLASS
This map displalys soils reclassified by drainage class within Whately and its watersheds.
MassGIS
• Soils SSURGO - Certified NRCS (Reclassified to Drainage Class)
• MassDEP Hydrography (1:25,000)
• 2020 U.S. Census - Town Boundary Lines
ESRI
• World Terrain Basemap with Labels
IMPAIRED WATERS
This map displays the water quality classifications of surface waters in Massachusetts’ Integrated List of Waters.
MassGIS
• MassDEP 2018/2020 Integrated List of Waters (305(b)/303(d))
• MassDEP Hydrography (1:25,000)
• NRCS HUC Basins (8,10,12)
• 2020 U.S. Census - Town Boundary Lines
ESRI
• World Terrain Basemap with Labels
IMPERVIOUS SURFACES
This map displays impervious surface coverage by subbasin within Whately and its watersheds.
MassGIS
• Impervious Surface 2005
• Drainage Sub-basins
• NRCS HUC Basins (8,10,12)
• 2020 U.S. Census - Town Boundary Lines
ESRI
• World Terrain Basemap with Labels
AGRICULTURAL LAND USE
This map displays parcels of land that are currently being cultivated as well as prime farmland soils and soils of statewide importance.
The current agricultural use layer is reclassified from the Land Use attribues. It includes both cultivated land and pasture/hay.
MassGIS
• 2016 Land Cover/Land Use
• Soils SSURGO-Certified NRCS
• 2020 U.S. Census - Town Boundary Lines
• NRCS HUC Basins (8,10,12)
FOREST COVER
This map illustrates the presence of deciduous and evergreen forest cover within Whately and its watersheds.
MassGIS
• 2016 Land Cover/Land Use
• 2020 U.S. Census - Town Boundary Lines
• NRCS HUC Basins (8,10,12)
ESRI
• World Terrain Basemap with Labels
SURFICIAL GEOLOGY
This map shows the surficial geology of Whately and its Watersheds.
MassGIS
• Surficial Geology (1:24,000)
• 2020 U.S. Census - Town Boundary Lines
• NRCS HUC Basins (8,10,12)
• MassDEP Hydrography (1:25,000)
ESRI
• World Terrain Basemap with Labels
• Google Open Street Map Labels
138 | Appendix B | Maps by Chapter
ROAD AND RAIL INFRASTRUCTURE
This map shows road and rail infrastructure within Whately and its watershes
MassGIS
• DOT Roads
• Railroad-Active Service
• 2020 U.S. Census - Town Boundary Lines
• NRCS HUC Basins (8,10,12)
• MassDEP Hydrography (1:25,000)
ESRI
• World Terrain Basemap with Labels
• Google Open Street Map Labels
AQUATIC HABITAT
This map displays the locations of wetlands, coldwater fisheries, and vernal pools within Whately and its watersheds. The wetlands layer is a combination of four separate BioMap layers: wetland core, wetland buffers, local wetlands, and local wetland buffers.
MassGIS
• MA Wildlife Coldwater Fisheries Resources
• MassDEP Hydrography (1:100,000)
• NHESP Certified Vernal Pools
• BioMap: Wetland Core & Wetland Buffers
• BioMap: Vernal Pool Core & Local Vernal Pools
• BioMap: Local Wetlands & Local Wetland Buffers
ESRI
• World Terrain Basemap with Labels
BIOMAP CORE ELEMENTS
This map shows where Biomap Core Habitat, Critical Natural Landscape, and Regional Connectivity Layers overlap and interact within Whately and its watersheds.
• Biomap: Core Habitat
• Biomap: Critical Natural Landscapes
• Biomap: Regional Connectivity
• MassDEP Hydrography (1:25,000)
• 2020 U.S. Census - Town Boundary Lines
• NRCS HUC Basins (8,10,12)
ESRI
• World Terrain Basemap with Labels
• Google Open Street Map Labels
BIOMAP RARE SPECIES HABITAT
This map shows where Biomap Rare Species, Local Rare Species, Priority Natural Communities Core, and Regional Rare Species layers inteact within Whately and its watersheds.
MassGIS
• Biomap: Regional Rare Species
• Biomap: Local Rare Species
• Biomap: Priority Natural Communities Core
• Biomap: Rare Species Core
• 2020 U.S. Census - Town Boundary Lines
• NRCS HUC Basins (8,10,12)
• MassDEP Hydrography (1:25,000)
ESRI
• World Terrain Basemap with Labels
• Google Open Street Map Labels
Appendix B | Maps by Chapter | 139
RECOMMENDATION ONE AREAS OF SIGNIFICANT BIOMAP HABITAT
This map displays areas where habitat types with conservation significance as identified in BioMap overlap the most.
MassGIS
• BioMap: All local, regional, and statewide layers were combined in a union to determine how many overlapping habitat layers exist at any given location.
• MassGIS Building Structures Polygon: Clipped to Whately boundary
• USGS Ponds 100k
• USGS Streams 100k
• 2020 U.S. Census - Town Boundary Lines
ESRI
• World Terrain Basemap with Labels
• Google Open Street Map Labels
LAND WITH PERMANENT PROTECTION
This map displays where permanently protected lands are in relationship to the areas with most habitat functions. Protected parcels were separated into layers based on ownership: state, nonprofit, private, Whately, other municipal. Parcels in each layer were then joined to remove individual parcel boundary lines.
MassGIS
• MassGIS Protected and Recreational OpenSpace
• USGS Ponds 100k
• USGS Streams 100k
• 2020 U.S. Census - Town Boundary Lines
• BioMap: All local, regional, and statewide layers were combined in a union to determine how many overlapping habitat layers exist at any given location.
ESRI
• World Terrain Basemap with Labels
• Google Open Street Map Labels
LAND WITH LIMITED OR TEMPORARY PROTECTION
This map displays where lands with temporary or limited protection are in relationship to the areas with most habitat functions. The author created a layer called “limited protection” by extracting all parcels with land use codes that designate them as part of Chapter 61, Chapter 61A, or Chapter 61B, then joined the parcels to remove individual parcel boundary lines. Used the OpenSpace Layer to erase Chapter 61 parcels that are permanently protected.
MassGIS
• MassGIS Protected and Recreational OpenSpace
• MassGIS Property Tax Parcels
• USGS Ponds 100k
• USGS Streams 100k
• 2020 U.S. Census - Town Boundary Lines
• BioMap: All local, regional, and statewide layers were combined in a union to determine how many overlapping habitat layers exist at any given location.
ESRI
• OpenStreet Map Labels
• World Terrain Basemap with Labels
LAND THAT IS DEVELOPABLE
This map displays parcels of land that are not permanently protected and that have land use codes designated in tax assessor data that do not deem them undevelopable. The author created a layer called “developable land” by extracting parcels with land use codes that do not deem them undevelopable into a seperate layer. Parcels were then removed that overlapped with permanently protected land identified in the OpenSpace layer.
MassGIS
• MassGIS Protected and Recreational OpenSpace
• MassGIS Property Tax Parcels: (“developable land layer”)
• USGS Ponds 100k
• USGS Streams 100k
• 2020 U.S. Census - Town Boundary Lines
• Biomap: All local, regional, and statewide layers were combined in a union to determine how many overlapping habitat layers exist at any given location.
ESRI
• OpenStreet Map Labels
• World Terrain Basemap with Labels
PRIORITY AREAS FOR CONSERVATION
This map displays developable parcels where four or more BioMap layers overlap, also showing which of those parcels is under Chapter 61 temporary protection. This map uses the “developable land” and “limited protection” layers described above. Developable parcels that did not overlap with four or more BioMap layers were removed from the developable land layer. Chapter 61 lands were removed from the limited protection layer that did not overlap with remaining developable parcels.
MassGIS
• USGS Ponds 100k
• USGS Streams 100k
• 2020 U.S. Census - Town Boundary Lines
• Biomap: All local, regional, and statewide layers were combined in a union to determine how many overlapping habitat layers exist at any given location.
140 | Appendix B | Maps by Chapter
ESRI
• OpenStreet Map Labels
• World Terrain Basemap with Labels
PERMANENTLY PROTECTED VS. VULNERABLE HABITAT
This map displays the mosaic of priority habitat for conservation that is permanently protected and suggests what the loss could look like if the habitat without protections were altered by development.
MassGIS
• MassGIS Building Structures Polygon
• USGS Ponds 100k
• USGS Streams 100k
• 2020 U.S. Census - Town Boundary Lines
ESRI
• OpenStreet Map Labels
• World Terrain Basemap with Labels
RECOMMENDED OVERLAY DISTRICTS FROM 2011 MASTER PLAN: ZONING
This map highlights the areas where overlay districts were proposed in the 2011 Master Plan as they relate to Whately’s existing zoning.
MassGIS
• MassGIS Property Tax Parcels
• MassGIS Building Structures Polygon
• USGS Ponds 100k
• USGS Streams 100k
• 2020 U.S. Census - Town Boundary Lines
Author-created layers
• Proposed Overlay District Polygons
ESRI
• OpenStreet Map Labels
RECOMMENDED OVERLAY DISTRICTS FROM 2011 MASTER PLAN: HABITAT
This map highlights the areas where overlay districts were proposed in the 2011 Master Plan as they relate to priority habitat for conservation.
MassGIS
• MassGIS Building Structures Polygon
• USGS Ponds 100k
• USGS Streams 100k
• 2020 U.S. Census - Town Boundary Lines
Author-created layers
• Proposed Overlay District Polygons
ESRI
• OpenStreet Map Labels
Appendix B | Maps by Chapter | 141
RECOMMENDATION TWO
LAND COVER WITHIN 200’ RIPARIAN CORRIDOR
This map shows the simplified landcover within a 200’ buffer from the edge of surface waters within Whately. The simplified land cover map was clipped to a 200’ buffer from the edge of surface waters.
MassGIS
• 2016 Land Cover/Land Use
• 2020 U.S. Census - Town Boundary Lines
• NRCS HUC Basins (8,10,12)
• MassDEP Hydrography (1:25,000)
ESRI
• World Terrain Basemap with Labels
• Google Open Street Map Labels
LAND COVER WITHIN AREAS OF CRITICAL AQUATIC CONNECTIVITY AND HABITAT
This map shows the simplified landcover within a buffer layer made up of Biomap layers relevat to riparion protection and habitat within Whately. The simplified land cover map was clipped to a composit buffer from the edge of surface waters made from the Biomap layers.
MassGIS
• 2016 Land Cover/Land Use
• Biomap:Aquatic Core
• Biomap: Aquatic Buffer
• Biomap: Local Aquatic Habitats
• Biomap: Local Aquatic Habitat Buffer
• 2020 U.S. Census - Town Boundary Lines
• NRCS HUC Basins (8,10,12)
• MassDEP Hydrography (1:25,000)
ESRI
• World Terrain Basemap with Labels
• Google Open Street Map Labels
RECOMMENDATION THREE
TOWNS IN WHATELY’S WATERSHEDS
This map shows the towns that share HUC 12 watersheds with Whately.
MassGIS
• NRCS HUC Basins (8,10,12)
• 2020 U.S. Census - Town Boundary Lines
• MassDEP Hydrography (1:25,000)
STREAM CROSSINGS & CULVERTS: AQUATIC PASSABILITY SCORE
This map shows stream crossings and culverts in Whately rated by their aquatic passbility score.
North Atlantic Aquatic Connectivity Collaborative Data
Center Stream Crossing Explorer
• NAACCC Non-Tidal Connectivity Assesments: Displayed by Aquatic Passability Score and color coded
MassGIS
• 2020 U.S. Census - Town Boundary Lines
• NRCS HUC Basins (8,10,12)
• MassDEP Hydrography (1:25,000)
ESRI
• World Terrain Basemap with Labels
• Google Open Street Map Labels
STREAM CROSSINGS & CULVERTS: AQUATIC PASSABILITY SCORE & RESTORATION POTENTIAL INDEX
This map shows stream crossigns and culverts in Whately rated by their aquatic passbaility score and their restoration potentical index.
North Atlantic Aquatic Connectivity Collaborative Data
Center Stream Crossing Explorer
• NAACCC Non-Tidal Connectivity Assesments: Displayed by Aquatic Passability Score and color coded
• NAACCC Non-Tidal Connectivity Assesments: Displayed by Restoration Potential Index
MassGIS
• 2020 U.S. Census - Town Boundary Lines
• NRCS HUC Basins (8,10,12)
• MassDEP Hydrography (1:25,000)
ESRI
• World Terrain Basemap with Labels
• Google Open Street Map Labels
APPLYING CONSERVATION PRIORITIZATION TO
WHATELY’S WATERSHEDS
This map shows where BioMap habitat layers overlap with one another and permanently protected parcels to demonstrate a potential conservation prioritization method.
MassGIS
• BioMap: All local, regional, and statewide layers were combined in a union to determine how many overlapping habitat layers exist at any given location.
• Protected and Recreational OpenSpace
142 | Appendix B | Maps by Chapter

A small town known for its fertile agricultural soil and beautiful rocky, brook-laden hills, Whately is the very essence of pastoral Massachusetts. Being a small, rural town can result in vulnerabilities, however; incidents like contamination of the aquifer source for private wells in East Whately in 1984 continue to inform the concerns and values of residents to this day. Whately adapted quickly in response to this emergency and has directed much attention in the years since to plan for and mitigate the impacts of other hazards on residents, workers, and infrastructure.
This plan was developed as the oscillation between extreme precipitation and drought in recent years has begun to palpably affect the town and its stakeholders, and water resources are once again brought to the forefront of the collective mind. While specifically addressing the expressed interest in ecological effects by the Whately Climate Resilience Plan Committee, this plan also considers the possible social factors that may affect Whately in the future, and the interconnected implications that lie at the confluence of climate change and development for the human and nonhuman communities of Whately, its watersheds, and beyond.
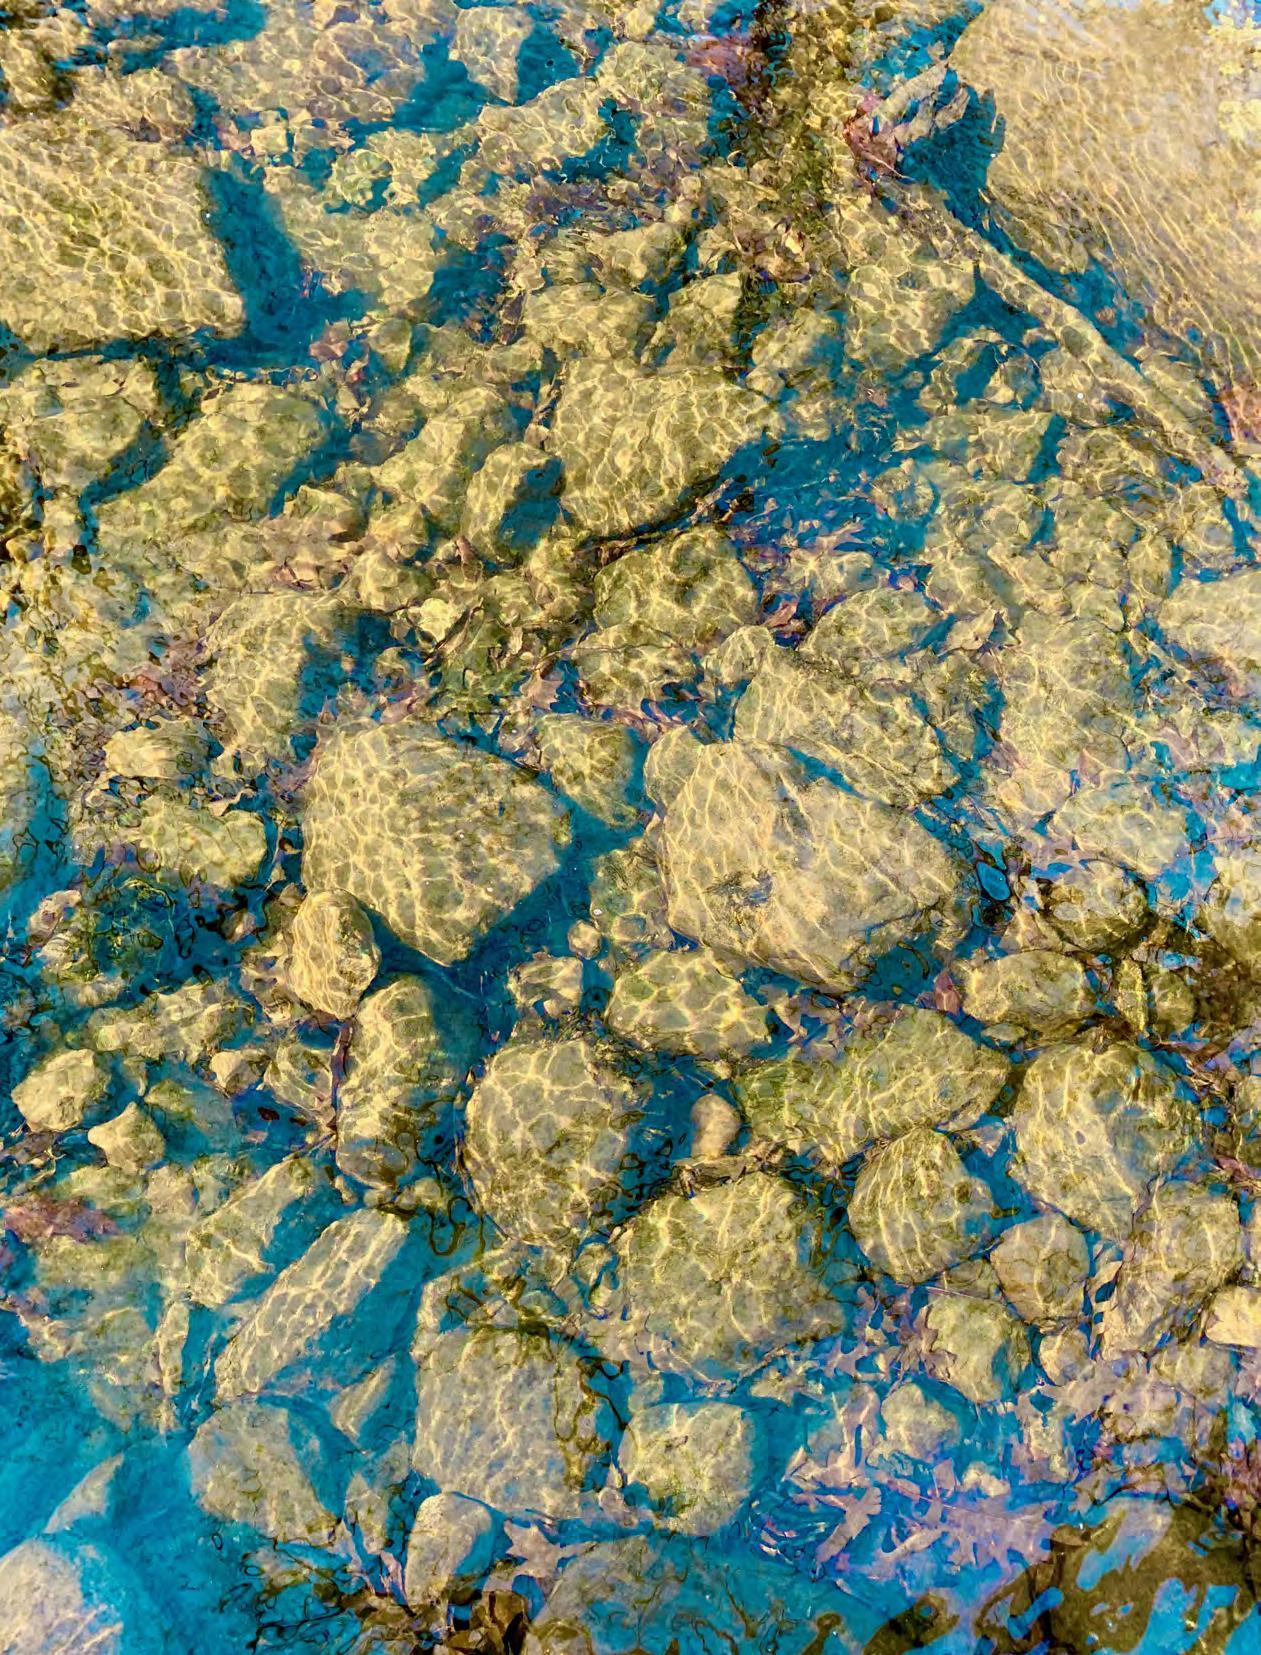


 The West Brook flows under a maple sugar line in West Whately.


 The white text “flowing out” of the river (i.e. resulting from the strategies above) names the four key elements of a water-resilient Whately identified in this planning process.
 The Connecticut River flows through western Massachusetts.
Source: Adobe Stock


 Fluvial erosion exposes tree roots along the West Brook.


 View East of the Pocumtuck Range from behind the Whately Public Library


 The Connecticut River flows through agricultural lands of western Massachusetts. Source: Adobe Stock


