MAIN STREET


June 2023

In 2020 the Wareham’s Climate Change Flood Vulnerability Assessment and Adaptation Planning Study which focused on identifying areas that are vulnerable to anticipated sea level rise conditions was completed. A number of priorities were identified, includin g addressing the Main Street business district.
The Town was awarded a Coastal Zone Management Coastal Resilience Grant in the summer of 2022 to develop a conceptual plan to reduce flood risk to the Main Street business district with an initial phase focused on businesses on the east side of Main Street and the large paved area of Merchant’s way. This area, abutting the tidally influenced Wankinco River, is the heart of downtown Wareham, encompassing local businesses, the entrance to Toby Hospital, the Fire Department, the MBTA line for the Cape Flyer, and a major evacuation route. Concurrently, the Town was updating its Urban Redevelopment Plan, and had gathered feedback for the community vision for Main Street and Merchant’s way. The adaptation planning further informed the Redevelopment Plan.
More specifically, this project assessed the vulnerability of the site to sea level rise and storm surge through 2070, provided a planning framework, gathered community input on site objectives and risk tolerance, assessed the feasibility of employing adaptation strategies, and conducted a cost-benefit analysis for two neighborhood-scale adaptation strategies with a focus on maximizing the use of nature-based solutions and creating additional community benefits.
The two alternatives developed - Maximize Resilience and Maximize Redevelopment - represented two ends of a spectrum of objectives heard through the Urban Redevelopment planning effort, and through the Redevelopment Authority and public engagement meetings. To summarize, there were strong voices for both redeveloping in the current footprint and for converting at risk commercial building space to greenspace that would provide reduced risk and public amenities. After receiving feedback on the benefit-cost analysis and site objectives comparison matrix, a third alternative was recommended, Balancing Resilience and Redevelopment.
The recommended next steps are to 1. develop a broader educational campaign on the town-wide climate vulnerability, 2. expand the project boundaries and vulnerability assessment, and 3. develop community consensus for a final preferred adaptation approach.
Coordination with Urban Redevelopment Plan
Planning Framework for Resilience/Adaptation
Sea Level Rise and Storm Surge Vulnerability Assessment Summary
Understanding Site Constraints
Neighborhood-Scale Adaptation Concepts
Benefit-Cost Analysis of Two Alternatives
Hybrid Climate Adaptation Alternative
Building-scale Adaptation Approaches Appendices
Deteriorating buildings/2018 Blight Inventory

Substantial change to business and economic conditions
Several properties have an insurmountable threshold for private investment
Impervious surface along Merchant's Way contributes to the heat island effect, increases non-point source pollution of surface water and the vulnerability of the area to storm surges and more frequent daily flooding
Lack of a clear traffic pattern contributes to more conflict between vehicles and pedestrians along Merchant’s Way
Disconnection from the waterfront

Become Resilient to Future Flooding
Enhance Economic Vitality (development opportunities)
Improve the Public Realm (Strengthen community and civic gathering)
Improve Multimodal Access and Connectivity
Improve Waterfront Connectivity

Maintain Character (Cape style, Building Height Concerns)
Improve Delineation of Parking and Traffic flow
Other Considerations
Maintain cost effectiveness
Retain the ability to implement future adaptations (Phasing)
Reduce negative impacts (environment, surrounding properties)
There are generally four types of adaptation strategies to adapt to the risks of flooding from sea level rise and storm surge. In some cases they can be used alone, in other situations a combination of approaches may be most appropriate. The four adaptation strategies are:


Reference: CoastAdapt (NCCARF, 2019) as cited in Climate Change Flood Vulnerability Assessment Town of Wareham, February 2020, by Woods Hole Group.

Future Vulnerability
Site Constraints
Planning Horizon
Future storm risk
Future sea level rise Adaptation Strategies

Risk Reduction/Asset Protection
Benefit/Cost Analysis Reimaging Space/Site Objectives
Decision Process
Long-term, Phased Implementation Plan
Reference/Credit: Estes Park CO Downtown Plan/Resilience

Systematic retreat or movement of people and assets inland, out of harms way, instead of attempting to hold the line with structural engineering.


INPUTS
SEA LEVEL RISE


TROPICAL / EXTRATROPICAL STORMS
LANDSCAPE ELEVATION
CHANGING CLIMATE
PROBABILISTIC / HYDRODYNAMIC


MODEL
FLOOD PROBABILITY
FLOOD DEPTH
FLOOD DURATION


FLOOD VOLUMES
Includes relevant physical processes: sea level rise, tides, storm surge, wind, wave setup / run-up / overtopping, future climate scenarios
Future version to incorporate coastal erosion


FLOOD
PATHWAYS
WINDS
WAVES

CURRENTS OUTPUTS


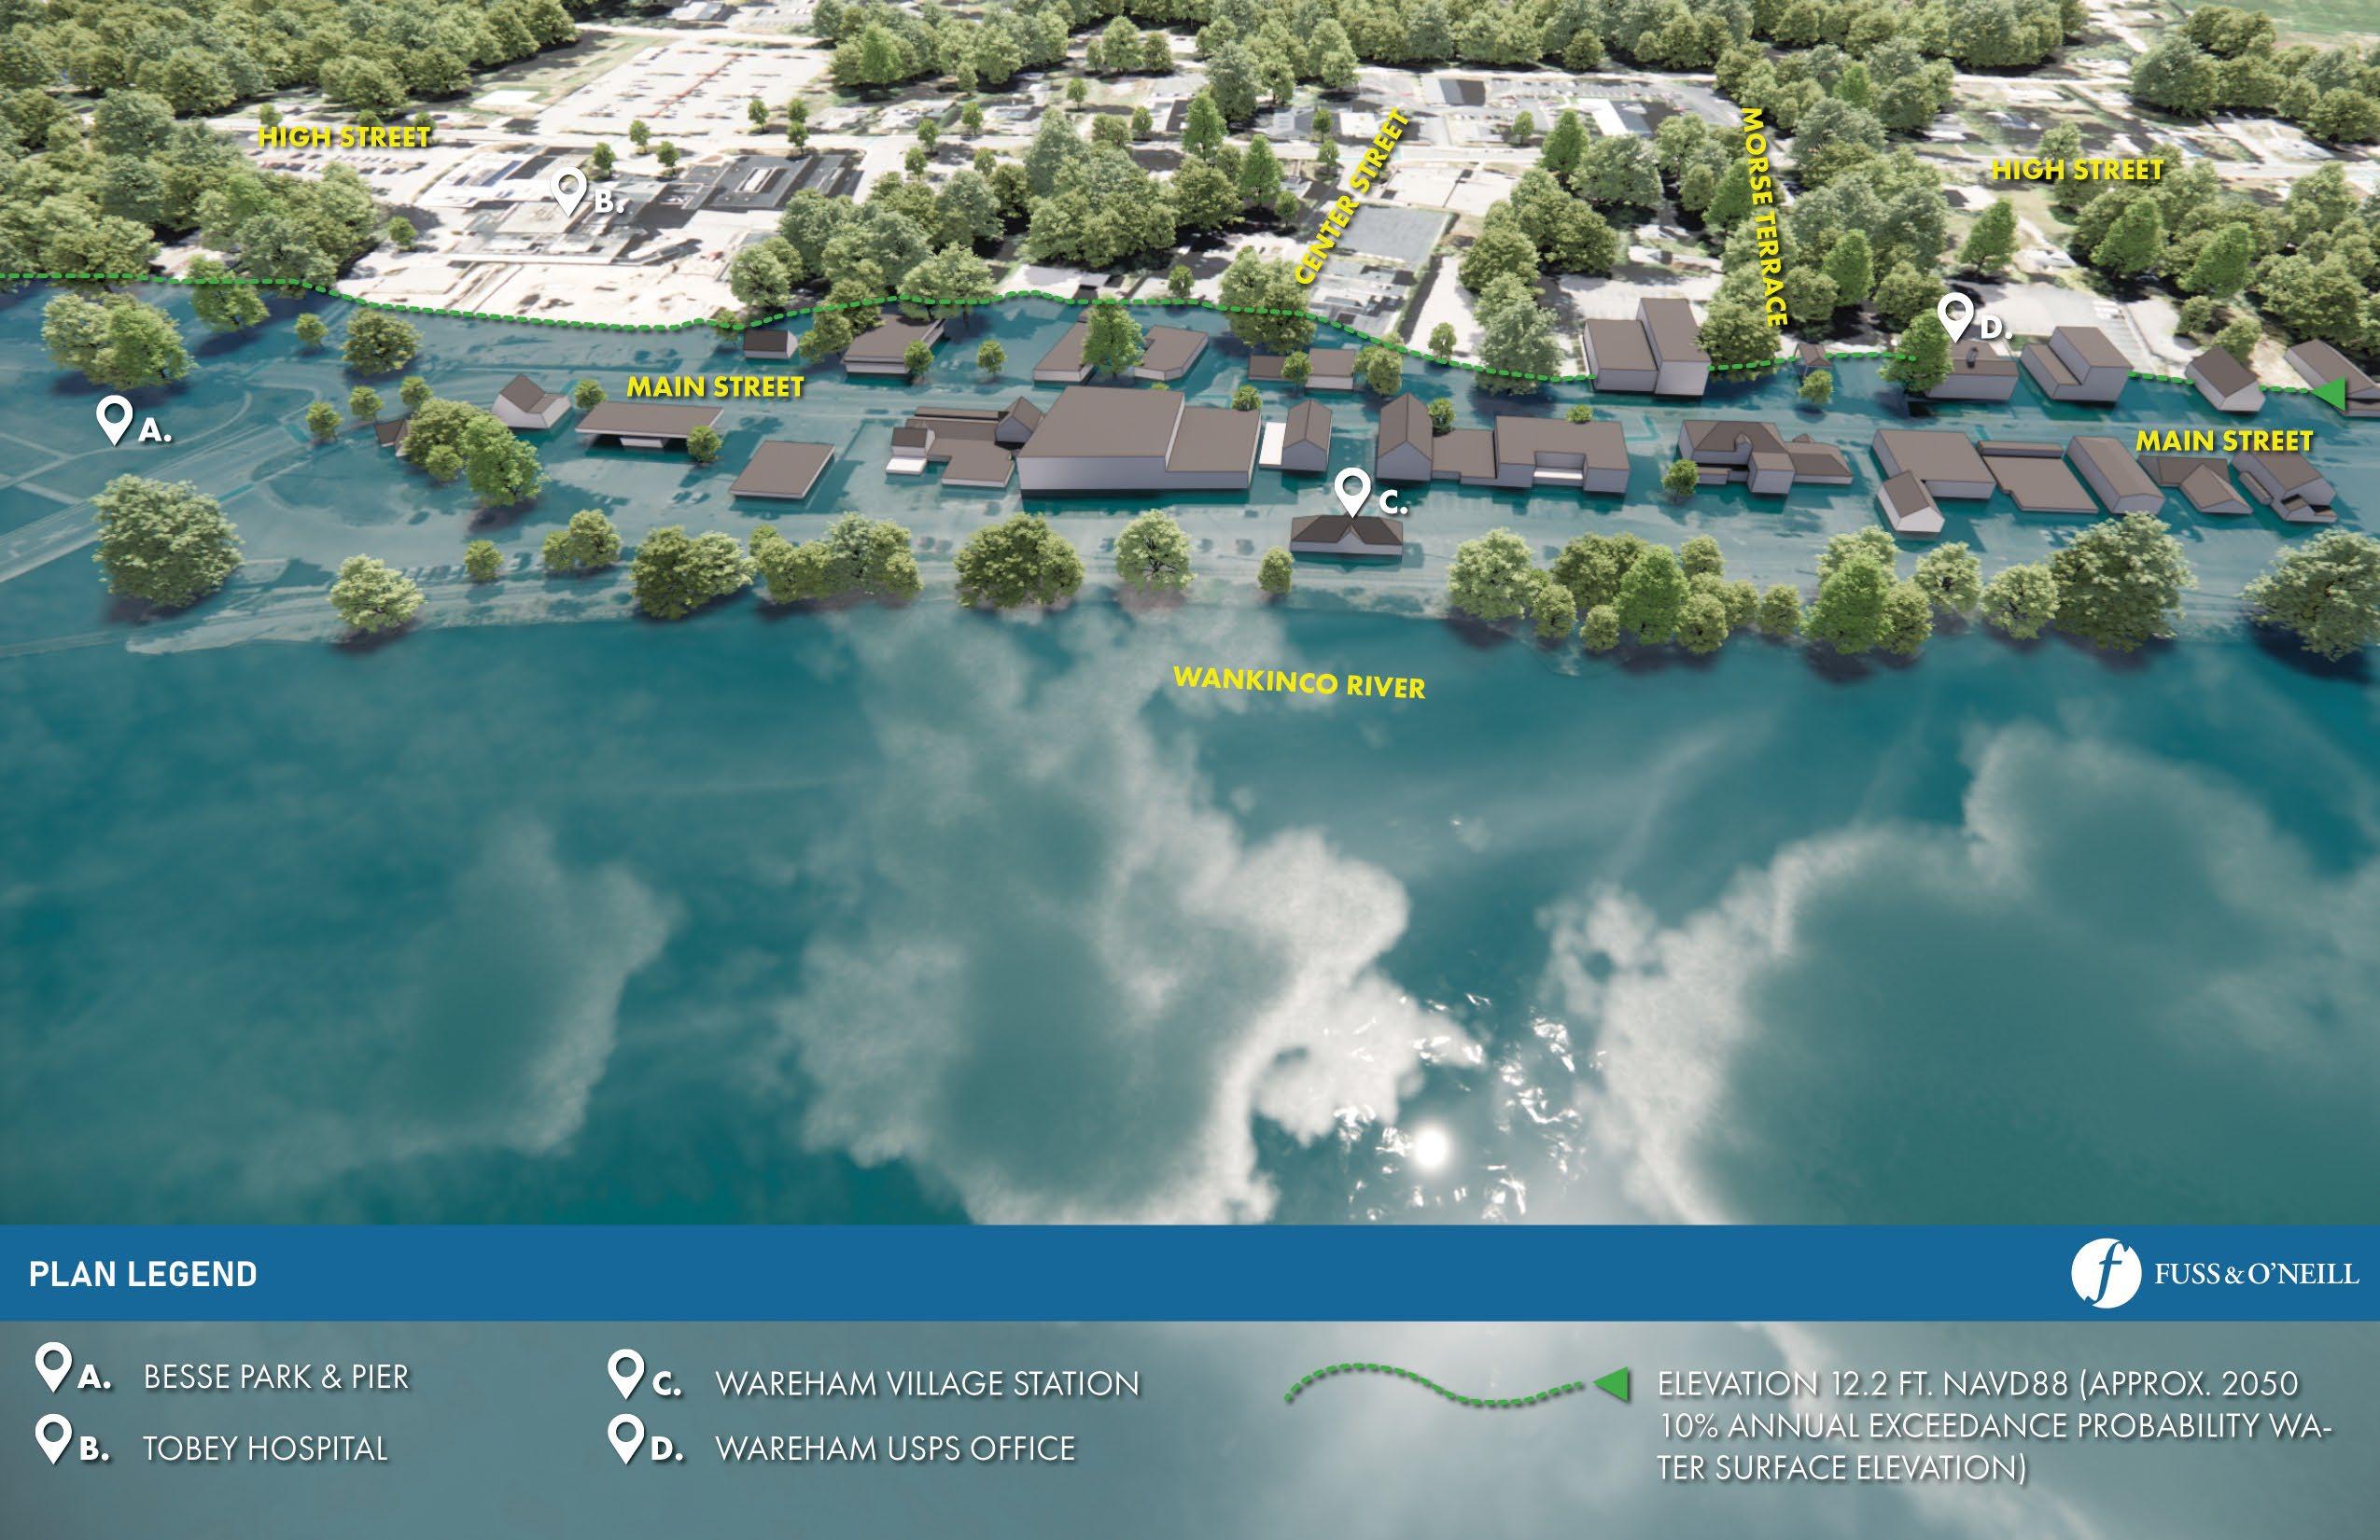
Most of the project area should remain unaffected by daily tidal flooding in the near (2030) to midterm (2050) time horizons.

As soon as 2070 (darkest blue), high tide flooding may impact access to Merchants Way and parts of Main Street and could become an issue for some of the buildings in the southeastern part of the project area – from addresses 137 to 191 Main Street.

Mean Higher High Water Projections (Feet above NAVD88) for Wareham, MA

Massachusetts Coastal Flood Risk Model- MCFRM tells us water surface elevations (WSEs) and extent of flooding associated with each storm probability.
Annual exceedance probabilities (AEPs) range from 0.1% through 50%.
A 1% AEP water level has a 1 in 100 chance of occurring annually (in any given year).
A 50% AEP water level has a 1 in 2 chance of occurring annually (in any given year).
In 2030, a 50% storm is associated with a maximum water surface elevation of 6.7ft, while a 0.1% storm could have a maximum water surface elevation at 15.7ft (9 feet higher).
A 1% storm in 2030 has a maximum water surface elevation of 12.7ft, and by 2070 water levels associated with a 1% storm are 18.7ft.
Massachusetts Coastal Flood Risk Model- MC-FRM Maximum Projected Water Surface Elevations (Feet above NAVD88) for different time horizons and annual storm probability levels

By 2050 larger areas of Merchants Way and Main Street could be impacted by storm surge flooding.
Annual flood exceedance probabilities for all buildings in the project area will have increased due to sea level rise and intensifying storms increasing flood extents and water surface elevations for AEP.

Compared to 2030, more buildings have a 25 – 50% annual chance of flooding, with the concentration of buildings most likely to flood being in the southeastern part of the project area.
Further up Main Street, most buildings sit between 2% - 10% annual chance of flooding.
The buildings are colored according to the highest probability (and lowest intensity) AEP that would impact the building at the Finished Floor Elevation (FFE).
A screening level assessment for buildings outside of the project area and within the 2070 0.1% flood extent indicates:

2030
As soon as 2030, 10% AEP water level could flood nearly half of Main St. and virtually all of Merchant's Way.
2050
In 2050, the 10% AEP water level would produce more severe flooding, impacting all Merchant's Way and about two-thirds of Main St. within the project area (up to Fire Station).
2070
2070 and beyond, a 10% AEP water level would flood both streets across the entire project area.
The buildings are colored according to the highest probability (and lowest intensity) AEP that would impact the building at the Finished Floor Elevation (FFE).
As time progresses and coastal flooding increases in frequency and intensity, the number of buildings flooded by each Annual Exceedance Probability (AEP) water surface elevation increases.
For example, focusing on the 50% AEP, the number of buildings impacted goes from 3 in 2030 to 13 by 2070. The same probability storm gets bigger as storms intensify due to climate change and sea level rise.


The next series of slides show the Massachusetts Coastal Flood Risk Model’s water surface elevation in 3D.
First is the present day (shown here) mean high water level, followed by the 10% (1 in 10 chances annually) Annual Exceedance Probability Storm’s water surface (at mean high water) for the years 2030, 2050 and 2070.


When developing alternatives for climate adaptation it is necessary to examine the site constraints. Site constraints include space restrictions and property boundaries, such as the right-of-way for the rail line owned by MBTA. In order to build adaptation features to a certain elevation, such as a mounded park or elevated berm/bikeway, a certain slope is needed. The site constraints constrain what features can be built and what degree of risk reduction can be achieved.

Similar to the horizontal constraints described, there are also vertical constraints to designing adaptation features. Vertical constraints restrict how high adaptation features can be constructed. Shown here are the structural features, the bridge abutment and knee wall at the Fire Station that new vertical features could be tied in to or connected to without creating new flood pathways in the future.

IMPROVE PARKING AND TRAFFIC FLOW
IMPROVE PUBLIC REALM
STRENGTHEN COMMUNITY AND CIVIC GATHERING
BECOME RESILIENT TO FLOODING MAINTAIN CHARACTER
ENHANCE ECONOMIC VITALITY (DEVELOPMENT OPPORTUNITIES)
MAINTAIN COST EFFECTIVENESS
IMPROVE MULTIMODAL ACCESS AND CONNECTIVITY
IMPROVE WATERFRONT CONNECTIVITY
RETAIN THE ABILITY TO IMPLEMENT FUTURE ADAPTATIONS (PHASING)
ENSURE SOLUTIONS DO NOT CREATE ADVERSE IMPACTS ELSEWHERE
AGAINST TAKING BY EMINENT DOMAIN

The goal of this alternative is to redevelop and adapt Merchant’s Way to enhance resiliency and maintain commercial space.
Voluntary buy-out of buildings that cannot be floodproofed in the proposed “sponge park” area.
Redevelop “red” buildings to reduce flood risk to the Base Flood Elevation (maximum of 10 feet above street level) using a combination of raised buildings and dry floodproofing.
Create a 3- to 4-foot high elevated feature, such as a vegetated berm terraced hardscaped feature, or planters along the MBTA Right of Way.
Maintain one-way vehicular access to the extent practical on Merchant’s Way.
Provide a gateway treatment delineation/raised surface to enhance pedestrian connectivity between Besse Park and future Sponge Park.
The following set of slides depicts the potential flood risk reduction along a profile of Merchant’s Way and Main Street for Alternative 1.
The colored bands correspond to the annual risk of inundation during coastal storm events. For example, as early as 2030, there is an estimated 50% chance that water will rise to the low point on Merchant’s during a coastal storm at least in any given year.
The following three images show that the colored bands rise vertically on the profile, indicating that flood risk on Merchant’s Way and Main Street increases over time. The proposed alternative provides moderate risk reduction in the short term and becomes less effective over time.
This table indicates the risk reduction in any given year provided by elevating and/or dry floodproofing redeveloped buildings and a vegetated berm compared to the existing conditions at the highest and lowest points on Merchant’s Way.


Annual Flood
Probability (%)


Merchant’s Way
Main Street
Berm Dry floodproofing level
Redeveloped elevated structure

LEGEND
Annual Flood
Probability (%)

Merchant’s Way
Main Street
Berm Dry floodproofing level
Redeveloped elevated structure

LEGEND
Annual Flood
Probability (%)

Merchant’s Way Main Street
Berm Dry floodproofing level
Redeveloped elevated structure

The goal of this alternative is to transform the waterfront area to public green space as a redevelopment engine to attract redevelopment on parcels with substantially less risk.
Voluntary buy-out of red and yellow buildings to transform the flood prone area on Merchant’s Way to create public green space.
Create an elevated feature along the MBTA Right of Way, such as a mounded park, a terraced hardscaped feature, or planters.
Floodproof “green” buildings as a mid-term resiliency strategy.
Provide a gateway treatment delineation/raised surface, such as a wide brick crosswalk, to provide pedestrian connectivity between Besse Park and the transformed Merchant’s Way green space.
After implementation of this alternative consider a long-term adaptation to elevate Main Street in conjunction with future investment at the bridge. Low points on Main Street are vulnerable to flooding under the current and proposed configuration and elevating Main Street would make the road and hospital emergency access more resilient to flooding.
The following set of slides depicts the potential flood risk reduction along a profile of Merchant’s Way and Main Street for Alternative 2.
The colored bands correspond to the annual risk of inundation during coastal storm events. For example, as early as 2030, there is an estimated 50% chance that water will rise to the low point on Merchant’s during a coastal storm at least in any given year.
By toggling through following three images, the colored bands rise vertically on the profile, indicating that flood risk on Merchant’s Way and Main Street increases over time. The proposed berm and dry floodproofing provides moderate risk reduction in the short term and becomes less effective over time. Since the expanded sponge park is intended to flood, there are no consequences to structures or property resulting from flooding in the park. Flooding in the park is anticipated to occur more frequently under the future projected scenarios.
This table indicates the risk reduction in any given year provided by dry floodproofing existing buildings and a vegetated berm compared to the existing conditions at the highest and lowest points on Merchant’s Way.


LEGEND
Annual Flood
Probability (%)

Merchant’s Way
Main Street
Berm Dry floodproofing level

LEGEND
Annual Flood
Probability (%)

Merchant’s Way Main Street
Berm Dry floodproofing level

LEGEND
Annual Flood
Probability (%)

Merchant’s Way
Main Street
Berm Dry floodproofing level
The matrix below shows the relative degree to which the two alternatives examined meet the site objectives stated by the community. There are tradeoffs with each approach.

IMPROVE PARKING AND TRAFFIC FLOW
IMPROVE PUBLIC REALM
MAINTAIN CAPE-STYLE ARCHITECTURE
STRENGTHEN COMMUNITY AND CIVIC GATHERING
AGAINST TAKING BY EMINENT DOMAIN
BECOME RESILIENT TO FLOODING (reduce repetitive loss)
MAINTAIN CHARACTER
WANT TO ATTRACT PRIVATE DEVELOPMENT
WANT TO IMPROVE WATERFRONT ACCESS
ENHANCE ECONOMIC VITALITY (REDEVELOPMENT OPPORTUNITIES)
ENSURE SOLUTIONS DO NOT CREATE ADVERSE IMPACTS ELSEWHERE
MAINTAIN WATER VIEW
IMPROVE MULTIMODAL ACCESS AND CONNECTIVITY
IMPROVE WATERFRONT CONNECTIVITY
MAINTAIN ROUTE 6 EVACUATION ROUTE
MAINTAIN EMERGENCY
ROOM ACCESS
MAINTAIN COST EFFECTIVENESS
A project evaluation tool by FEMA to compare the benefits and costs of any project intended to reduce the future risk or associated hazards of flooding
A Cost-Effective project has a BCR greater than 1.0
Source: https://www.fema.gov/sites/default/files/202004/fema_bca_instructor-guide_unit-1.pdf

The FEMA BCA Calculator calculates the benefits of a project through building data for each structure located in the project area and projected Stillwater Elevations. This information was acquired through a variety of resources.
Building information was obtained from property cards through Vision Government Solutions for the Town of Wareham (https://gis.vgsi.com/warehamma/Search.aspx).
Stillwater Elevations for the current (2030) 10-, 50-, 100-, and 500-year recurrence intervals and approximate values for Projected Sea Level Rise were modeled and provided by Woods Hole Group.
Elevations (lowest finished floor and ground elevations) were determined through a field survey from Woods Hole Group, LIDAR, and measurements of the lowest entry point for water to enter a building from Fuss & O’Neill personnel.
The Base Flood Elevation (BFE), elevation 14, was acquired from FEMA Flood Insurance Rate Maps (FIRM).
Costs for each mitigation action for each individual building are based on an engineering order of magnitude cost relying on past experience. Costs will be refined as the project moves through design.
The project useful life is how long the mitigation action will be effective. Each mitigation action useful life varies and was based on the FEMA BCA Reference Guide, June 2009. The useful life for each mitigation action are:
Building Elevation = 25 years
Acquisition = 100 years
Floodproofing = 25 years
Floodplain and Stream Restoration (greenspace) = 30 years
The following building information was obtained through property cards.
The lowest finished floor.
For the Elevation Action and Floodproofing Action, all buildings would be raised or floodproofed to elevation 15, except for the firehouse. Because the firehouse is a critical facility, it would be mitigated to elevation 16. These elevations are required and dictated by FEMA flood protection design standards and are calculated by being 1 foot above the FEMA FIRM BFE of elevation 14 for non-critical facilities, and 2 feet above the BFE for critical facilities.
The following data were retrieved from the building’s property card:
Lowest finished floor
If the building is elevated on an open foundation
Building Type
First Floor Area
Building size (area of entire building)
Several assumptions and generalizations were made and can be refined if this BCA is submitted as part of a FEMA grant application. The assumptions and generalizations were made to provide a more conservative BCR. The costs included for each alternative were determined in accordance with FEMA standards and documentation which states what costs funding will be provided for. Relocation and redevelopment costs were not included as they would not be reimbursed by FEMA. The purpose of this BCA was to determine the scale of what FEMA would provide funding for and if the alternatives would qualify for FEMA funding by having a BCR above 1.0.
Multiple buildings had varying uses and types due to having multiple store fronts in a single structure. The least beneficial building use and type were used to produce more conservative benefits.
All buildings were assumed to not have an Active NFIP Policy. The in-force, active NFIP Policy number will need to be acquired and documented to account for these benefits.
The FEMA default values were used for the:
Building replacement value
Demolition threshold
Contents value
Monthly cost of temporary space
One time displacement cost
One building, 195 Main Street, did not use the FEMA default value for contents due to the building being abandoned. Instead, the estimated value for contents inside the building was assumed to be zero.
For the Elevation Action in Alternative 1, it was assumed that the buildings would be acquired and demolished. The relocation of the businesses and redevelopment of the property would be part of a private investment.
For the Acquisition Action in Alternative 2, it was assumed that the buildings would be acquired, demolished, and the property redeveloped into a greenspace. The relocation of the business would be part of a private investment.
For the greenspace in Alternative 2, it was assumed that all acquired properties’ land and the parking lot behind them would turn into a greenspace.
Benefits considered:
FEMA pre-calculated benefits associated with acquisition, demolition, and relocation or floodproofing

Building damage
Displacement costs
Greenspace creation
Benefits difficult to quantify:
Benefits and cost of elevating Main Street
Loss of Function/Loss of Income
Service interruption to public roads
Emergency Room access interruption
Source: Wareham Week
207 Main Street

Alternative 1- Maximize Redevelopment
Acquire
Relocate
Demolish
Private redevelopment of elevated structures(cost not included in BCA)
Costs: ~$900,000
Benefits: ~$1,500,000
Alternative 2 – Maximize Resiliency:
Acquire
Relocate
Demolish
Transform to greenspace
Costs: ~$800,000
Benefits: ~$1,800,000
Current day FEMA floodproofing requirement
231-239 Main Street
Feasible to floodproof
Estimated remaining useful life: >25 years
Floodproofing solutions:
Exterior coating


Flood doors
Deployable flood shield
Mechanical adaptations
*See detail of all project site buildings on Building Assessment memo ~ project website
Mitigation costs: ~$63,000
Mitigation benefits: ~$550,000
Both Alternatives have a BCR above 1.0.
The current BCR encompasses 20 buildings in the project area but can be customized to include only voluntary property owners.
The BCR will change based on participation.
Some buildings have a BCR below 1.0 and therefore are not considered cost effective.
Buildings that have a BCR above 1.0 are considered cost effective to mitigate, however some buildings have a BCR below 1.0 and are not considered cost effective to mitigate. If the BCA is looked at on a building-by-building basis, these buildings would not be eligible for FEMA funding. However, if the total BCR is above 1.0 for the entire project, the project would be considered cost effective and be eligible for FEMA funding.
Concern for potential loss of building redevelopment opportunity in red zone/Not in favor of retreating from Main Street, but may be best course of action

A closer look is needed to understand:
How we can optimize development along the West side of Main Street
The cost of relocating a business, and not just a building
What the community thinks about converting non-floodproofable buildings to greenspace
How can we Activate the proposed greenspace so community will use/economic driver
The recommended Phased timeline is longer than anticipated
Against eminent domain
There is a cost associated with not implementing a resilience plan
Recent bylaw allows elevated buildings
A next phase could include:
Expanding the project site and analysis area west, north and south.
Broader educational campaign on town-wide climate impacts.
An expanded benefit-cost analysis that covers expanded project site
Business valuation

The goal of the hybrid approach is to transform the waterfront area with programmed public space as a redevelopment engine to attract redevelopment on parcels with substantially less risk while maintaining existing commercial space on less flood prone areas on Merchant’s Way.
Voluntary buy-out of red buildings in the most flood prone area on Merchant’s Way to convert to public green space or redevelop near the intersection of Center Street.
Create an elevated feature along the MBTA Right of Way, such as a mounded park, a terraced hardscaped feature, or planters.
Dry floodproof “green” and “yellow” buildings as a mid-term resiliency strategy.
Provide a gateway treatment delineation/raised surface, such as a wide brick crosswalk, to provide pedestrian connectivity between Besse Park and the transformed Merchant’s Way green space.
After implementation of this alternative consider a long-term adaptation to elevate Main Street in conjunction with future investment at the bridge. Low points on Main Street are vulnerable to flooding under the current and proposed configuration and elevating Main Street would make the road and hospital emergency access more resilient to flooding.
Short–term 0-4 years
Evaluate vulnerabilities on the west side of Main St, and north and south of current project area
Targeted outreach to property owners most vulnerable to flooding on the south side of Main Street
Identify commercial relocation sites for business
Floodproof green buildings and feasible yellow buildings not amenable to voluntary buyout
Design/Permitting of Sponge Park Phase I, including a vegetated berm at elevation 8.6
Adopt a design guide for future redevelopment
Mid-term 4-7 years
Acquire and re-develop red properties. Redeveloped buildings will be set back from Main St and elevated by hybrid of mounded earth, piles, and/or dry floodproofing
Provide a floodable pavilion, which can serve as a farmer’s market, modular retail, or event center, as an anchor at the park.
Construct expanded Sponge Park Phase I
Mid-term 10-20 years
Assess previous adaptations and continue to reevaluate the plan
As floodproofed structures end useful life, redevelop with a hybrid setback, mounded grade, pile, and/or dry floodproofing
Sponge Park Phase II – Increase the elevation of Sponge park vegetated edge where site constraints allow
Long-term 20+ years
Assess previous adaptations and continue to reevaluate plan
Elevate Main St (coordinate with bridge replacement)
Feedback after the second, May 17, public workshop was diverse. Comments included:
In favor of creating a greenspace over Merchant’s Way. Need to find a way to “Activate the space”
Want to improve access to and enjoyment along the waterfront
Preservation of buildings and parking should be a priority. Want to attract development.
Concerns were raised about:
The potential loss of parking if space was converted to green space for adaptation
The impact on remaining business viability in either adaptation scenario
Who would be responsible for paying for project implementation
How to incorporate the value of a business, not just the building/property, into the benefit-cost analysis
Wastewater capacity given any increase in development
Levels of concern about current and future flooding were varied; some community members expressed high levels of concern, while others were not as concerned if their business wasn’t impacted.
Residents and business owners on Main Street want improved outreach efforts
Rebuilding a Structure (Elevate and/or Floodproof)
Local Building Permit and comply with Massachusetts State Building Code
Order of Conditions from Conservation Commission if removing, filling, or altering the Riverfront area
Determination of Applicability from Conservation Commission for any activity within the 100 ft buffer to protected wetlands, other than minor activities described in 310 CMR 10.02(2)(b)2
Wareham Historic District Commission
Wareham Zoning By-Laws
Floodplain Zoning Overlay District
Wareham Village District Design Standards and Guidelines
Design Standards and Guidelines for Commercial Districts
Landscaping
Retrofit a Structure (Elevate and/or Floodproof)
Local Building Permit and comply with Massachusetts State Building Code
Determination of Applicability from Conservation Commission for any activity within the 100 ft buffer to protected wetlands, other than minor activities described in 310 CMR 10.02(2)(b)2
Wareham Historic District Commission
Wareham Zoning By-Laws
Floodplain Zoning Overlay District
Wareham Village District Design Standards and Guidelines
Design Standards and Guidelines for Commercial Districts
Regulatory Considerations to Construct a Flood Protection Berm and Resilient Open Space
Local Permits/Review
Order of Conditions from Conservation Commission, if in the Riverfront area or within 100 feet of a protected wetland
Wareham Historic District Commission
Wareham Zoning By-Laws
Floodplain Zoning Overlay District
Landscaping
State Permits/Review
MEPA Environmental Notification Form
If associated with a new urban redevelopment project
If associated with a new urban renewal plan or major modification of an existing urban renewal plan
State permits/review (cont.)
MEPA Environmental Notification Form
Demolition of all or any exterior part of any Historic Structure listed in or located in any Historic District listed in the State Register of Historic Places or the Inventory of Historic and Archaeological Assets of the Commonwealth
MEPA Environmental Impact Report
Within 1 mile of an Environmental Justice community
MassDEP Chapter 91 License
Berm considered a structure on historically filled tidelands
Berm for the purpose of coastal resilience/protection should be considered a “water dependent use” and more favorable to convert impervious surfaces to pervious surfaces
Any existing use of historically filled tidelands not previously authorized
As part of a 2023 Coastal Zone Management Coastal Resilience Grant – Resilient Main Street, Fuss & O’Neill (F&O) completed visual assessments of the existing buildings along Merchant Way commercial area along the west side of Main Street in Wareham, MA to determine the feasibility of implementing floodproofing measures to improve and enhance the existing buildings’ performance when exposed to rising floodwater.
The Project Area map, shown here, indicates the buildings included in this assessment, 137 to 311 Main Street (Wankinco River side).

Using the data collected during the building assessments and the current and future projected flood elevations we assessed the viability of implementing various dry floodproofing measures as outlined in FEMA P-936 Floodproofing Nonresidential Structures
.
In addition, potential future design flood elevation or adaptations for redeveloped parcels was examined.
For the purpose of the building assessment and floodproofing evaluation, the Design Flood Elevation (DFE) was established based on the FEMA 1% floodplain level plus one foot. The site is currently located within Zone AE with Base Flood Elevation of 14 feet (NAVD88, Figure 1), therefore the current DFE would be 15ft.

It is very important to note that the DFE is subject to change as future FEMA and Massachusetts State Building Code revisions are released. It should be anticipated that the DFE will be required to increase in the future.
FEMA Flood Insurance Rate Map (Source: https://msc.fema.gov/portal/home)

The site is currently located within Zone AE with FEMA Base Flood Elevation of 14 feet (NAVD88). FEMA BFE is 1% (100-yr storm)
Floodproofing today must meet 14ft + 1ft = 15ft elevation.
Subject to change with Mass Building Code and FEMA
This key shows how high 15ft elevation is compared to first floor lowest elevation.
Colors indicate range of 15ft elevation relative to doorway


“GREEN” Buildings – Cost $
Possible to floodproof, but must consider:
Long-term DFE projections may overwhelm floodproofing
Most floodproofing recommendations will require human intervention
Buildings include critical public safety infrastructure that must remain operational in severe flood events
Based on the 15ft benchmark elevation in, each of the buildings within the study area were categorized in one of the following groups.
“YELLOW” Buildings – Cost $$
Possible to floodproof, but must consider:
Not a long-term solution – future DFE too high
Moderate cost to floodproof with minor to moderate structural repairs required
Existing utility/HVAC equipment relocation may be required
“RED” Buildings – Cost $$$
Not practical to floodproof:
Current and future DFE is too high
Little remaining useful life
Benefits considered:
FEMA pre-calculated benefits associated with acquisition, demolition, and relocation or floodproofing
Building damage
Displacement costs
Greenspace creation
Benefits difficult to quantify:
Benefits and cost of elevating Main Street
Loss of Function/Loss of Income
Service interruption to public roads
Emergency Room access interruption
Source: Wareham Week
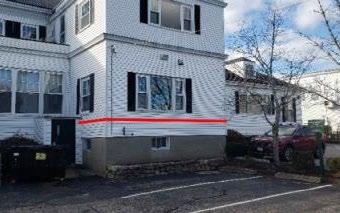
The following slides show the recommended floodproofing measures that could be deployed at each building site as well as the high-level benefits and costs. The red line on each building represents current day (May 2023) floodproofing requirement for this flood zone.
The following assumptions were made in the BCA:
Due to multiple buildings had varying uses and types due to having multiple store fronts in a single structure. The least beneficial building use and type were used to produce more conservative benefits.
For the Elevation Action in Alternative 1, it was assumed that the buildings would be acquired and demolished, the businesses relocated, and that redevelopment would be part of a private investment. Redevelopment and relocation costs were not included in the BCA.
For the Acquisition Action in Alternative 2, it was assumed that the buildings would be acquired and demolished, the businesses relocated, and the property redeveloped into a greenspace. Relocation costs were not included in the BCA.
For the greenspace in Alternative 2, it was assumed that all acquired properties’ land and the parking lot behind them would turn into a greenspace.
Additional assumptions and generalizations were made and can be refined if this BCA is submitted as part of a FEMA grant application. The assumptions and generalizations were made to provide a more conservative BCR and are listed in further detail the Benefit-Cost Analysis Summary Memo.
Feasible to floodproof
Estimated remaining useful life: >25 years
Floodproofing solutions:
Exterior coating


Flood doors
Deployable flood shield
Mechanical adaptations
Mitigation costs: ~$63,000
Mitigation benefits: ~$560,000

Feasible to floodproof
Estimated remaining useful life: >25 years
Floodproofing solutions:
Masonry Repairs

Exterior coating
Flood doors
Deployable flood shield
Mechanical adaptations
Mitigation costs: ~$130,000
Mitigation benefits: ~$400,000
Feasible to floodproof
Estimated remaining useful life: >25 years
Floodproofing solutions:

Exterior coating

Flood doors
Deployable flood shield
Mechanical adaptations
Mitigation costs: ~$87,000
Mitigation benefits: ~$270,000

Feasible to floodproof
Estimated remaining useful life: >25 years
Floodproofing solutions:
Exterior coating
Flood doors
Deployable flood shield
Mechanical adaptations
Mitigation costs: ~$96,000
Mitigation benefits: ~$160,000

Feasible to floodproof
Estimated remaining useful life: >25 years
Floodproofing solutions:

Masonry Repairs

Exterior coating
Flood doors
Deployable flood shield
Mechanical adaptations
Mitigation costs: ~$35,000
Mitigation benefits: ~$96,000

Feasible to floodproof
Estimated remaining useful life: >25 years
Floodproofing solutions:
Exterior coating

Flood doors
Deployable flood shield
Mechanical adaptations
Mitigation costs: ~$42,000
Mitigation benefits: ~$43,000

Feasible to floodproof
Estimated remaining useful life: >25 years
Floodproofing solutions:
Exterior coating
Flood doors
Deployable flood shield
Mechanical adaptations
Mitigation costs: ~$120,000
Mitigation benefits: ~$400,000
Feasible to floodproof
Estimated remaining useful life: >25 years
Floodproofing solutions:
Masonry Repairs


Exterior coating
Flood doors
Deployable flood shield
Mechanical adaptations
Mitigation costs: ~$28,000
Mitigation benefits: ~$10,000
Feasible to floodproof
Estimated remaining useful life: >25 years
Floodproofing solutions:
Exterior coating
Flood doors

Deployable flood shield
Mechanical adaptations
Mitigation costs: ~$63,000
Mitigation benefits: ~$46,000

To inform future commercial and/or residential development in the project area considering sea level rise, coastal storm surge and wave action, Woods Hole Group calculated Significant Wave Crest Elevations (SWCEs) from the MC-FRM based on the projected near-term (2050) and long-term (2070) peak still water elevation plus the significant wave height (approximately equal to the average of the highest one-third of waves) at the 1% Annual Exceedance Probability (AEP).
The 1% AEP (or 100-year return period) is standard for building design in the floodplain. Since MC-FRM includes physical processes, wave action and sea level rise, it is not necessary to apply freeboard to SWCEs. Freeboard is typically applied to FEMA Base Flood Elevations because these parameters are not accounted for in FEMA modeling for this region.
* Values range across the study area. The lower end of the range represents areas north of Morse Terrace; the higher end of the range represents areas south of Morse

The Massachusetts Executive Office of Energy and Environmental Affairs (EEA) developed a series of additional coastal data products from the MC-FRM to support the Resilient Massachusetts Action Team (RMAT) Climate Resilience Design Standards & Guidelines. RMAT coastal design parameters include Water Surface Elevations (WSEs), Maximum Wave Heights, and Maximum Wave Crest Elevations (MWCEs). These coastal design parameters were developed for six (6) selected annual exceedance probabilities (AEPs), including the 1%, 2%, 5%, 0.5%, 0.2%, 0.1% probability levels, and three (3) time horizons (2030, 2050, and 2070).
RMAT MWCEs (provided in units of feet referenced to the NAVD88 datum) are derived from the MC-FRM peak still water surface elevation and the maximum wave height that is projected to occur during storm events for any given location in the model domain at each AEP, and are used as a recommended design criteria in the RMAT Climate Resilience Design Standards & Guidelines Tool where projects are potentially exposed to future coastal flooding and wave action. MWCEs are computed by adding the maximum wave crest to the still water level, thereby producing the maximum wave crest elevation. In general, maximum wave heights are used for bridge design where no wave load is desired, so the MWCE may be too conservative for typical commercial and/or residential development within the project area.
For this project’s coastal design parameters, Woods Hole Group calculated Significant Wave Crest Elevations (SWCEs) based on the projected near-term (2050) and long-term (2070) peak still water elevation plus the significant wave height at the 1% AEP. The 1% AEP is a standard for building design in the floodplain. Significant wave height is approximately equal to the average of the highest one-third of waves, measured from trough to crest for a given AEP and time horizon (and is therefore lower than the maximum wave height). SWCEs (provided in units of feet referenced to the NAVD88 datum) for the project area are recommended to inform future development in this area and do not include any freeboard.
In considering redeveloping Main Street with new commercial buildings, the DFE can be achieved by any combination of elevation and/or dry floodproofing (if the ground floor use is non-residential).

Many communities are now developing Design Guidelines that consider future conditions, such as Nantucket.
Source: Resilient Nantucket Design Guidelines.
Https://Nantucket-ma.Gov/1634/Resilient-nantucket
Another climate adaptation strategy is to design/build to accommodate future projected conditions. Shown here is an image of a design challenge for Narragansett Bay and a building that allows for flooding in historic Wickford Rhode Island.

https://www.envisionresilience.org/newsandstories

https://tinyurl.com/resilientmainstreet


 Dean Audet, PE Principal-in-Charge
Eileen Gunn, AICP Project Manager
Andrea Judge, PE Neighborhood Scale Adaptation Lead
Jason LeDoux, PE Building Assessment
Rebecca Meyers Water Resources Engineer
Chelsea Zakas, AICP Assistant Project Manager, Stakeholder Engagement
Joe Famely Climate Resilience Planner, Vulnerability Assessment
Dean Audet, PE Principal-in-Charge
Eileen Gunn, AICP Project Manager
Andrea Judge, PE Neighborhood Scale Adaptation Lead
Jason LeDoux, PE Building Assessment
Rebecca Meyers Water Resources Engineer
Chelsea Zakas, AICP Assistant Project Manager, Stakeholder Engagement
Joe Famely Climate Resilience Planner, Vulnerability Assessment
For a more detailed technical memorandum on the building assessment and floodproofing and future design parameters considereations, see the Technical Memorandum at: Building Assessment Memo - https://www.docdroid.net/mheFgxB/resilient-main-st-warehambuilding-assessment-finaltask-2-2023-03-20-pdf
Dry Floodproofing – A combination of measures that results in a structure being watertight with all elements substantially impermeable to the entrance of floodwater with structural components having the capacity to resist flood loads.
What does this mean?
Keep water out of the building and make sure the water outside the building doesn’t break the structure.
Wet Floodproofing – The use of flood-damage-resistant materials and construction techniques to minimize flood damage to areas below the flood protection level of a structure (which is intentionally allowed to flood).
What does this mean?
Allow water to get into the building, under controlled terms, and then force it out.
Sealing exterior walls using technologies that include impermeable waterproofing membranes. Includes both positive and negative side applications.

Sealants for openings
Protect abandoned doors, windows, and utility penetrations.


Flood shields for openings in exterior walls

Watertight structural systems that close the openings in a building’s exterior walls to the entry of water.


