Rit LbhÍ nr. 90
Waterbirds in the Andakíll Ramsar site: distribution and abundance from bi-weekly estuarine surveys in 2017
Landbúnaðarháskóli Íslands
Andakíll Ramsar Bird Monitoring Project 2017

2020
Rit LbhÍ nr. 90
ISBN 978 9979 881 61 2 ISSN 1670 5785
Waterbirds in the Andakíll Ramsar site: distribution and abundance from bi-weekly estuarine surveys in 2017
Landbúnaðarháskóli Íslands
Andakíll Ramsar Bird Monitoring Project 2017
Niall Tierney & Rachel A. Tierney
Desember, 2020 Landbúnaðarháskóli Íslands
Contents
Executive Summary
of Figures
of Tables
Introduction
Methods
Study area
Low tide and rising tide surveys
Data storage and validation
Preparation of the species accounts
Results
Site level results
Subsite usage
Use of substrates and waterbird behaviour
Waterbird abundance during surveys: low tide versus rising tide
Roost sites
Human activities, birds of prey and disturbance
Species accounts
Wildfowl and allies
Greylag Goose
Pink footed Goose
Greenland White fronted Goose
Whooper Swan
Common Shelduck
Eurasian Wigeon
Mallard
Northern Pintail
Eurasian Teal
Greater Scaup
Common Eider
Harlequin Duck
Long tailed Duck
Barrow's Golden Eye
Goosander
Red breasted Merganser
Red throated Diver
Great Northern Diver
Slavonian Grebe
Cormorant
Landbúnaðarháskóli Íslands Andakíll Protected Habitat Area Monitoring 2017 Estuarine Monitoring Final Report 2 | Page
4 Table
5 Table
13 1.
14 2.
16 2.1
16 2.2
17 2.3
19 2.4
19 3.
20 3.1
20 3.2
23 3.3
25 3.4
28 3.5
29 3.6
31 3.7
33
33
34
36
36
38
40
42
44
45
46
48
49
50
50
51
52
53
55
57
57
58
Waders 59
Eurasian Oystercatcher 60
European Golden Plover 62
Ringed Plover 64
Common Snipe 65
Black tailed Godwit 66 Whimbrel 68
Common Redshank 70
Ruddy Turnstone 72
Red Knot 74 Dunlin 75
Purple Sandpiper 77
Red necked Phalarope 79
Seabirds 80
Northern Fulmar 81
Black legged Kittiwake 81
Black headed Gull 82
Common Gull 84
Great Black backed Gull 86
Glaucous Gull 88 Iceland Gull 90
Unidentified Glaucous/Iceland Gull 91 Herring Gull 92
Lesser Black backed Gull 94
Arctic Tern 96
Parasitic Jaeger / Arctic Skua 98
species 98
Landbúnaðarháskóli Íslands Andakíll Protected Habitat Area Monitoring 2017 Estuarine Monitoring Final Report 3 | Page
Other
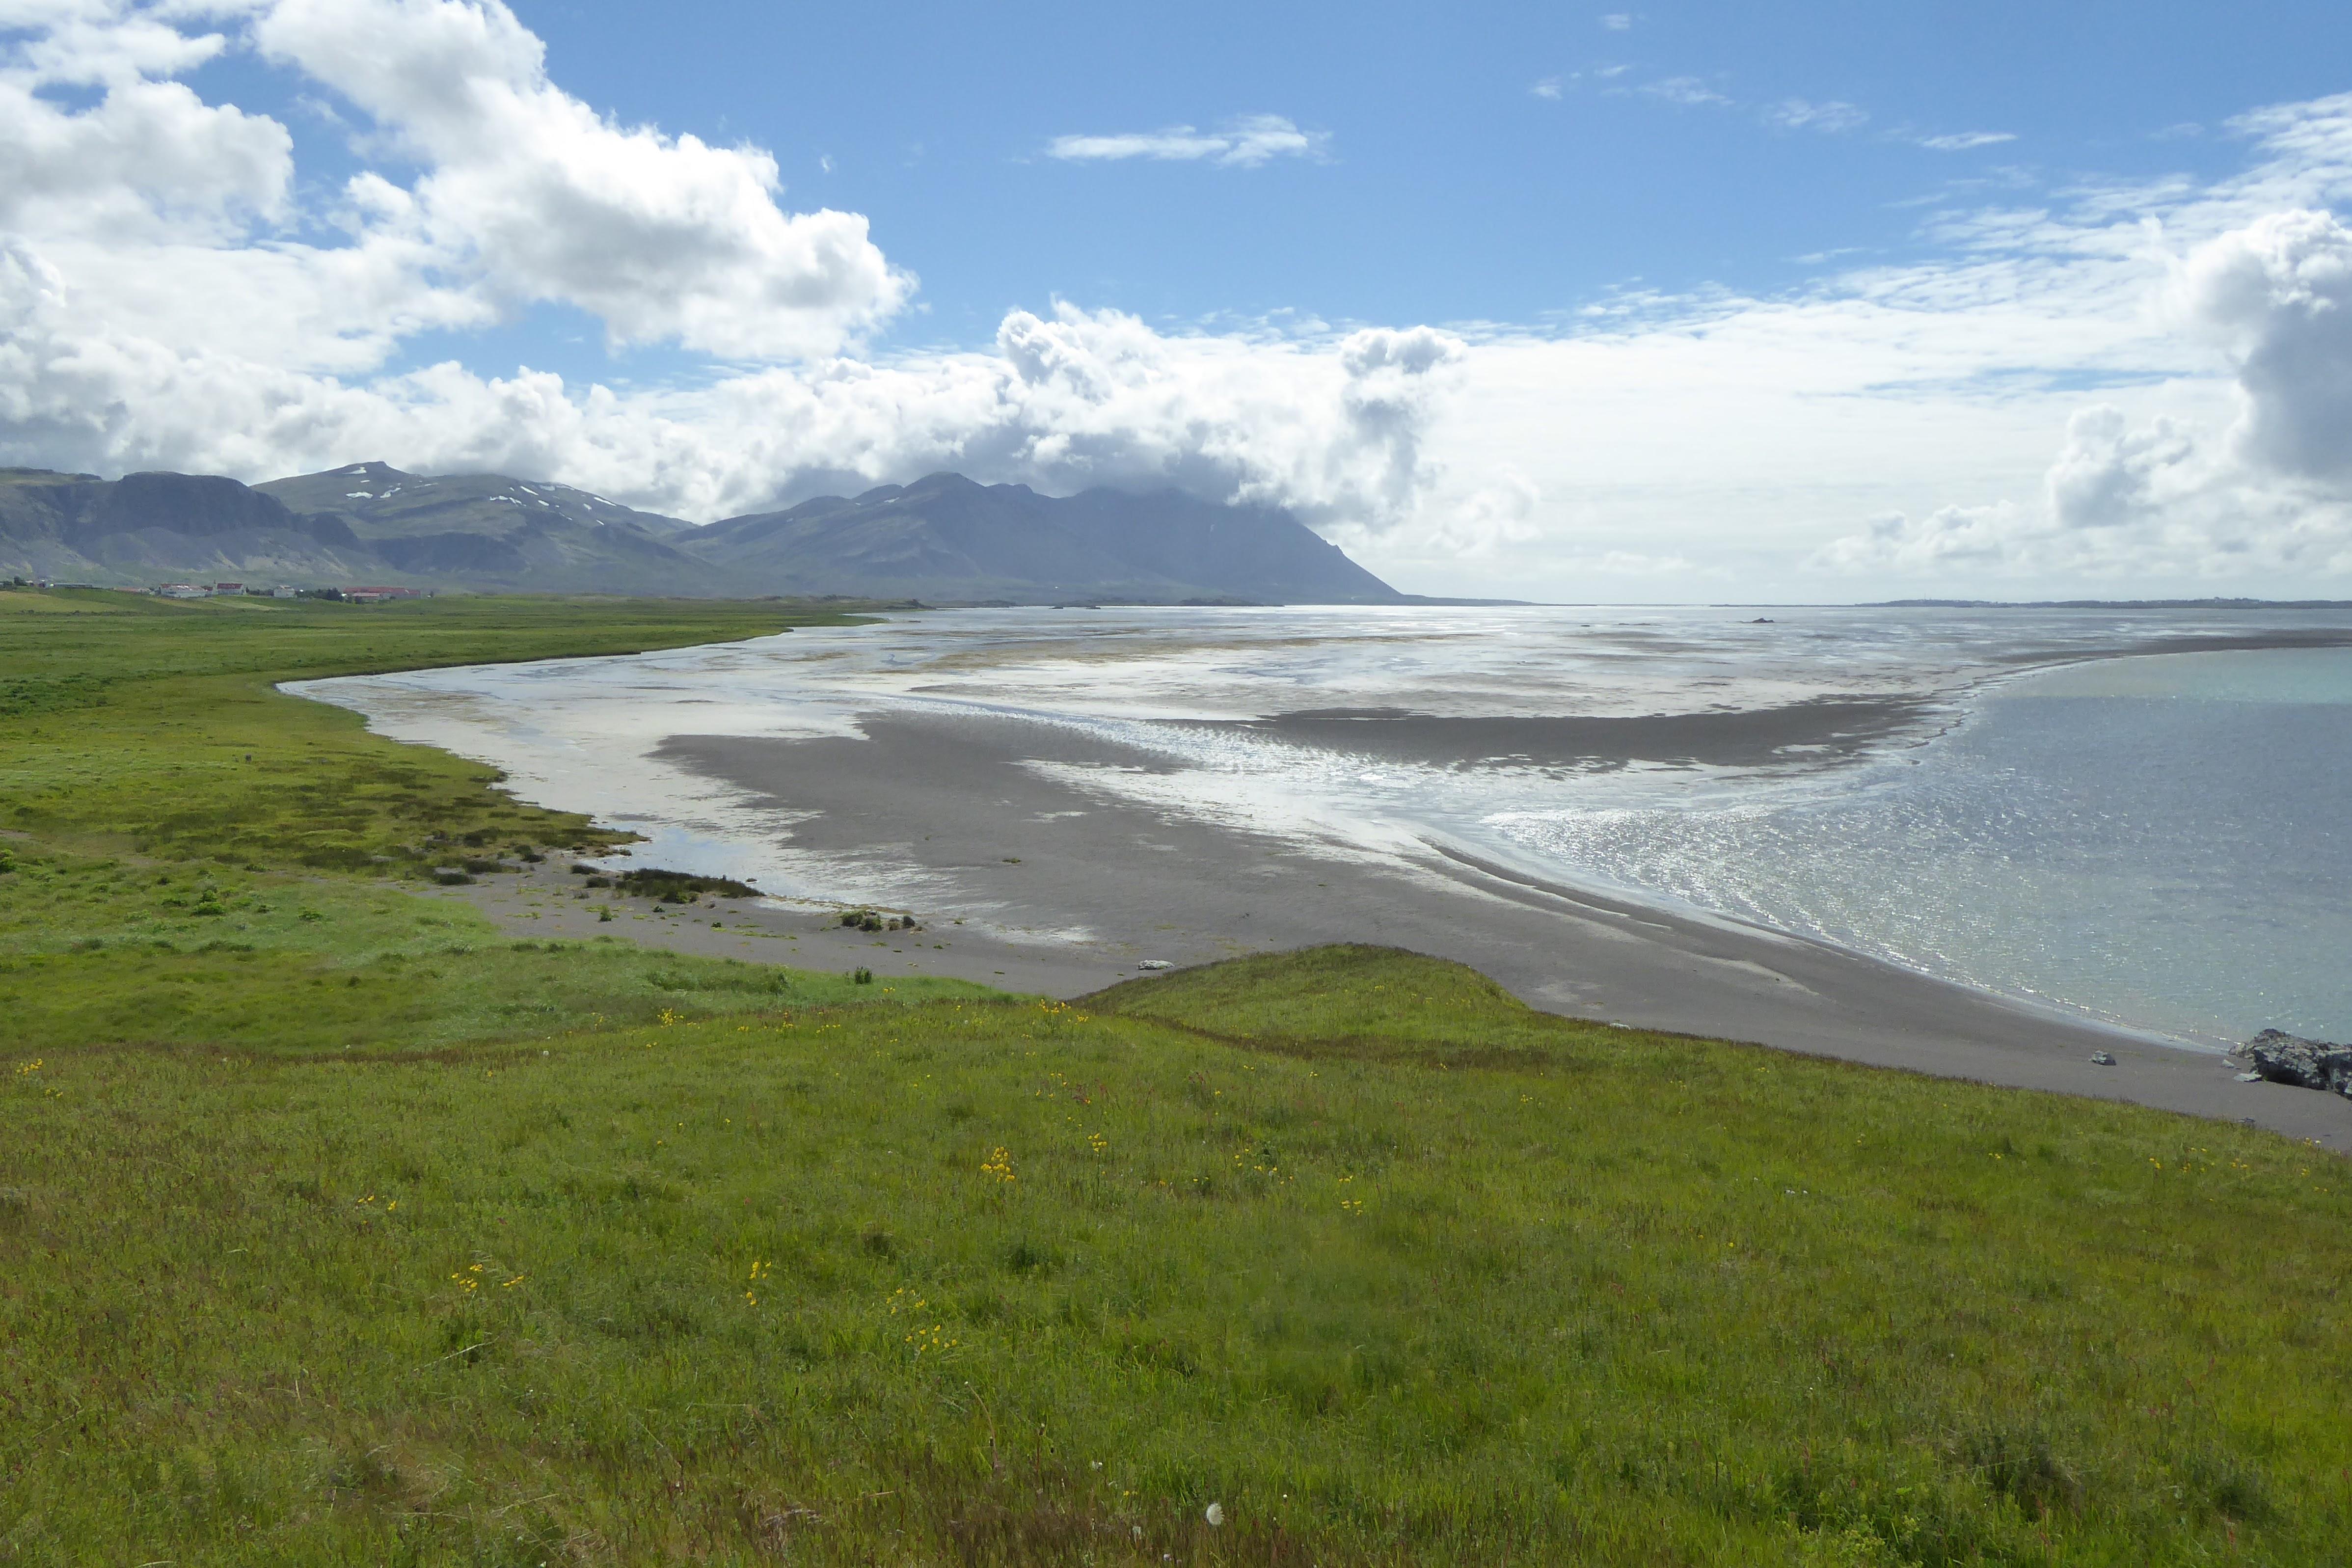
4. Recommendations 99 4.1 Uses of the dataset 99 4.2 Monitoring and research in the future 99 5. Acknowledgements 100 6. References 100 7. Appendices 103 7.1 Appendix 1 Survey dates and details 103 7.2 Appendix 2 Field recording forms 104 Recommended citation: Tierney, N. & Tierney, R.A. 2020 Waterbirds in the Andakíll Ramsar site: distribution and abundance from bi weekly surveys in 2017. Cover photo Rachel A. Tierney.
Executive Summary
This publication is part of a suite of surveys investigating bird abundance, diversity and seasonality in the Andakíll Ramsar site in Borgarfjörður, western Iceland (64°33'N, 21°46'W). Here, the estuarine part of the site was investigated. Greenland White fronted Geese and breeding birds are covered elsewhere (Tierney & Stroud 2018; Tierney & Tierney 2020).
In order to capture the arrival and departure dates for the migratory waterbirds, surveys were conducted in each week between 12th March and 25th October 2017. One low tide and one rising tide survey was conducted each week to determine waterbird distribution and abundance at low tide, when the intertidal areas are exposed and available to feeding waterbirds; and rising/high tide, when most birds are at, or moving to, their high tide roosting areas. All waterbirds and seabirds were recorded, as well as each bird’s behaviour and their use of different habitat zones.
A total of 31 low tide and 30 rising tide surveys were conducted, and 43 waterbird and seabird species were recorded.
Survey totals ranged from 51 birds (on 12th March) to 5,155 birds (on 7th August). Waterbird and seabird species diversity ranged from five species on 23rd March to 33 species on 8th May.
Overall, the total number of waterbirds and seabirds recorded increased throughout March and April and then remained relatively constant until the end of June, when the numbers doubled. Waterbird and seabird numbers declined throughout September until surveys ceased at the end of October.
The number of birds recorded during low tide surveys was generally higher than during rising tide surveys, especially for some wader species. This suggests that, for some birds, the site is important for foraging during low tide, and roosting refuges outwith the Andakíll Ramsar site are used during high tides.
High tide roost location, size and species composition was investigated. A total of 37 roosts were identified, and 12 of which were used consistently or by relatively large numbers of birds.
Species accounts are provided for 21 wildfowl, 12 waders, 10 seabirds and White tailed Eagle. These accounts present: weekly abundance; site distribution maps (at low tide and rising tide, and during spring and autumn); and a summary of the proportion of time spent feeding or roosting at subsite level.
Low levels of anthropomorphic disturbance were observed. This work represents an unprecedented level of information on the diversity, abundance, distribution and seasonality of the waterbirds and seabirds in the Andakíll Ramsar site throughout almost the entire period of the year when there are waterbirds present. However, it is recommended that some form of repeat surveys are conducted, ideally at regular intervals. These data are potentially useful for conservation casework and research purposes, but should be considered as a baseline, upon which further projects can be built.
Landbúnaðarháskóli Íslands Andakíll Protected Habitat Area Monitoring 2017 Estuarine Monitoring Final Report 4 | Page
Table of Figures
Figure 2 1. The study area in Borgarfjörður covering the estuarine part of the Andakíll Ramsar site. The subsite boundaries are show as red lines and vantage points used as green dots. The dashed black line shows the boundary of the Andakíll Ramsar site.
Figure 3 1. Number of waterbird and seabird species recorded each month during estuarine surveys in the Andakíll Ramsar site between 12th March and 25th October 2017.
Figure 3 2. Total number of waterbirds and seabirds recorded during weekly low tide and rising tide estuarine surveys in the Andakíll Ramsar site between 12th March and 25th October 2017. No surveys were conducted during weeks 33 and 34.
Figure 3 3. Waterbird and seabird density in each of the six subsites during weekly low tide and rising tide estuarine surveys in the Andakíll Ramsar site between 12th March and 25th October, 2017. See Figure 2 1 for subsite locations and boundaries.
Figure 3 4. Total number of bird records in six subsites in the estuarine habitat of the Andakíll Ramsar site recorded in weekly low tide and rising tide estuarine surveys between 12th March and 25th October, 2017.
Figure 3 5. The proportion of a) wildfowl and allies b) waders and c) seabirds recorded in four habitat zones during low tide and rising tide estuarine surveys in the Andakíll Ramsar site between 12th March and 25th October 2017.
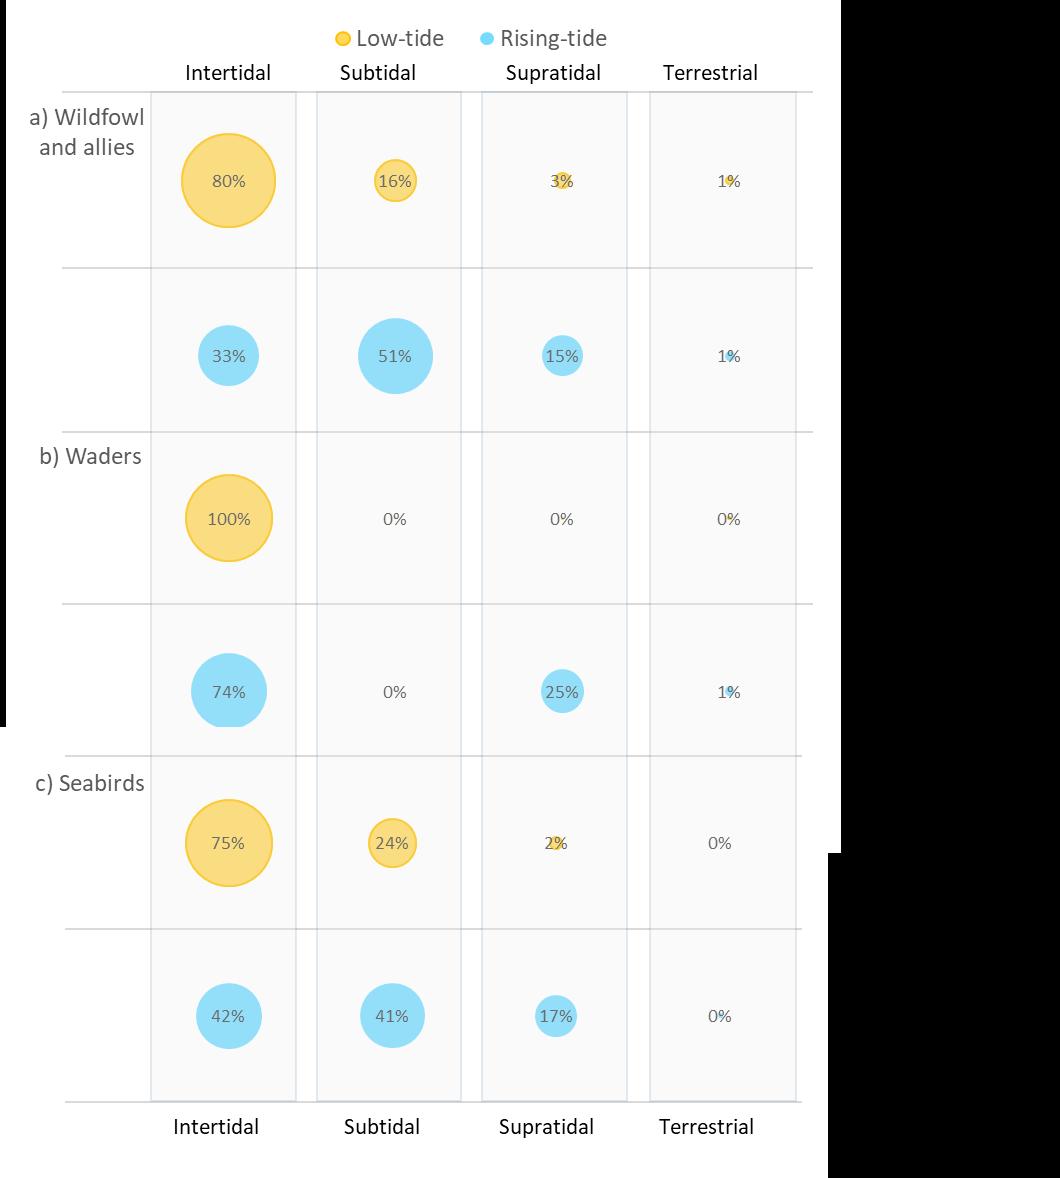
Figure 3-6. Proportion of encounters of a) wildfowl and allies b) waders and c) seabirds during low tide and rising tide estuarine surveys in the Andakíll Ramsar site between 12th March and 25th October 2017 according to their location in four habitat zones.
Figure 3 7. Location of roost sites (orange) and twelve main roosts (red) recorded during weekly rising tide estuarine surveys in the Andakíll Ramsar site in spring (12th March and 7th June 2017).
Figure 3-8. Location of roost sites (orange) and twelve main roosts (blue) recorded during weekly rising tide estuarine surveys in the Andakíll Ramsar site in autumn (12th June and 25th October 2017).
Figure 3 9. Frequency of disturbance sources recorded during weekly low tide and rising tide estuarine surveys in the Andakíll Ramsar site between 12th March and 25th October 2017
Figure 3 10. Number of wildfowl and allies recorded during weekly low tide and rising tide estuarine surveys in the Andakíll Ramsar site between 12th March and 25th October 2017.
Figure 3-11. Number of Anser anser recorded during weekly low tide and rising tide estuarine surveys in the Andakíll Ramsar site between 12th March and 25th October 2017.
Figure 3-12. Relative abundance of Anser anser during weekly (a) low tide and (b) rising tide estuarine surveys in the Andakíll Ramsar site between 12th March and 25th October 2017.
Figure 3 13. Relative abundance during (a) spring and (b) autumn of Anser anser counted on twice weekly estuarine surveys in the Andakíll Ramsar site in 2017.
Figure 3 14. Proportion of foraging and roosting Anser anser during weekly (a) low tide and (b) rising tide estuarine surveys in six subsites in the Andakíll Ramsar site between 12th March and 25th October 2017.
Figure 3 15. Number of Anser albifrons flavirostris recorded during weekly low tide and rising tide estuarine surveys in the Andakíll Ramsar site between 12th March and 25th October 2017.
Landbúnaðarháskóli Íslands Andakíll Protected Habitat Area Monitoring 2017 Estuarine Monitoring Final Report 5 | Page
17
22
22
.......................................................................................................... 24
..................................................................................................................................................................... 24
26
27
30
30
.................................................... 32
33
34
35
............................................................................... 35
..................................................................................................................................................................... 35
...................................... 36
Figure 3 16. Relative abundance of Anser albifrons flavirostris during weekly (a) low tide and (b) rising tide estuarine surveys in the Andakíll Ramsar site between 12th March and 25th October 2017.
Figure 3 17. Relative abundance during (a) spring and (b) autumn of Anser albifrons flavirostris counted on twice weekly estuarine surveys in the Andakíll Ramsar site in 2017.
Figure 3 18. Proportion of foraging and roosting Anser albifrons flavirostris during weekly (a) low tide and (b) rising tide estuarine surveys in six subsites in the Andakíll Ramsar site between 12th March and 25th October 2017.
Figure 3 19. Number of Cygnus cygnus recorded during weekly low tide and rising tide estuarine surveys in the Andakíll Ramsar site between 12th March and 25th October 2017.
Figure 3-20. Relative abundance of Cygnus cygnus during weekly (a) low tide and (b) rising tide estuarine surveys in the Andakíll Ramsar site between 12th March and 25th October 2017.
Figure 3-21. Relative abundance during (a) spring and (b) autumn of Cygnus Cygnus counted on twice weekly estuarine surveys in the Andakíll Ramsar site in 2017.
Figure 3 22. Proportion of foraging and roosting Cygnus cygnus during weekly (a) low tide and (b) rising tide estuarine surveys in six subsites in the Andakíll Ramsar site between 12th March and 25th October 2017.
Figure 3 23. Number of Tadorna tadorna recorded during weekly low tide and rising tide estuarine surveys in the Andakíll Ramsar site between 12th March and 25th October 2017.
Figure 3 24. Relative abundance of Tadorna tadorna during weekly (a) low tide and (b) rising tide estuarine surveys in the Andakíll Ramsar site between 12th March and 25th October 2017.
Figure 3 25. Relative abundance during (a) spring and (b) autumn of Tadorna tadorna counted on twice weekly estuarine surveys in the Andakíll Ramsar site in 2017.
Figure 3-26. Proportion of foraging and roosting Tadorna tadorna during weekly (a) low tide and (b) rising tide estuarine surveys in six subsites in the Andakíll Ramsar site between 12th March and 25th October 2017.
Figure 3 27. Number of Mareca penelope recorded during weekly low tide and rising tide estuarine surveys in the Andakíll Ramsar site between 12th March and 25th October 2017.
Figure 3 28. Relative abundance of Mareca penelope during weekly (a) low tide and (b) rising tide estuarine surveys in the Andakíll Ramsar site between 12th March and 25th October 2017.
Figure 3 29. Relative abundance during (a) spring and (b) autumn of Mareca penelope counted on twice weekly estuarine surveys in the Andakíll Ramsar site in 2017.
Figure 3 30. Proportion of foraging and roosting Mareca penelope during weekly (a) low tide and (b) rising tide estuarine surveys in six subsites in the Andakíll Ramsar site between 12th March and 25th October 2017.
Figure 3-31. Number of Anas platyrhynchos recorded during weekly low tide and rising tide estuarine surveys in the Andakíll Ramsar site between 12th March and 25th October 2017.
Figure 3 32. Relative abundance of Anas platyrhynchos during weekly (a) low tide and (b) rising tide estuarine surveys in the Andakíll Ramsar site between 12th March and 25th October 2017.
Figure 3 33. Relative abundance during (a) spring and (b) autumn of Anas platyrhynchos counted on twice weekly estuarine surveys in the Andakíll Ramsar site in 2017.
Landbúnaðarháskóli Íslands Andakíll Protected Habitat Area Monitoring 2017 Estuarine Monitoring Final Report 6 | Page
37
37
37
38
...................................... 38
............................................................................... 39
39
....................................................... 40
...................................... 41
41
41
42
42
................................................................... 43
43
................................................... 44
44
45
Figure 3 34. Proportion of foraging and roosting Anas platyrhynchos during weekly (a) low tide and (b) rising tide estuarine surveys in six subsites in the Andakíll Ramsar site between 12th March and 25th October 2017.
Figure 3-35. Number of Anas crecca recorded during weekly low tide and rising tide estuarine surveys in the Andakíll Ramsar site between 12th March and 25th October 2017.
Figure 3 36. Relative abundance of Anas crecca during weekly (a) low tide and (b) rising tide estuarine surveys in the Andakíll Ramsar site between 12th March and 25th October 2017.
Figure 3 37. Relative abundance during (a) spring and (b) autumn of Anas crecca counted on twice weekly estuarine surveys in the Andakíll Ramsar site in 2017.
Figure 3-38.Proportion of foraging and roosting Anas crecca during weekly (a) low tide and (b) rising tide estuarine surveys in six subsites in the Andakíll Ramsar site between 12th March and 25th October 2017.
Figure 3 39. Number of Aythya marila recorded during weekly low tide and rising tide estuarine surveys in the Andakíll Ramsar site between 12th March and 25th October 2017.
Figure 3-40. Relative abundance of Aythya marila during weekly (a) low tide and (b) rising tide estuarine surveys in the Andakíll Ramsar site between 12th March and 25th October 2017.
Figure 3 41. Relative abundance during (a) spring and (b) autumn of Aythya marila counted on twice weekly estuarine surveys in the Andakíll Ramsar site in 2017.
Figure 3 42. Number of Somateria mollissima recorded during weekly low tide and rising tide estuarine surveys in the Andakíll Ramsar site between 12th March and 25th October 2017.
Figure 3 43. Relative abundance of Somateria mollissima during weekly (a) low tide and (b) rising tide estuarine surveys in the Andakíll Ramsar site between 12th March and 25th October 2017.
Figure 3-44. Number of Clangula hyemalis recorded during weekly low tide and rising tide estuarine surveys in the Andakíll Ramsar site between 12th March and 25th October 2017.
Figure 3 45. Relative abundance of Clangula hyemalis during weekly (a) low tide and (b) rising tide estuarine surveys in the Andakíll Ramsar site between 12th March and 25th October 2017.
Figure 3 46. Proportion of foraging and roosting Clangula hyemalis during weekly (a) low tide and (b) rising tide estuarine surveys in six subsites in the Andakíll Ramsar site between 12th March and 25th October 2017.
Figure 3 47 Number of Mergus merganser recorded during weekly low tide and rising tide estuarine surveys in the Andakíll Ramsar site between 12th March and 25th October 2017.
Figure 3 48. Relative abundance of Mergus merganser during weekly (a) low tide and (b) rising tide estuarine surveys in the Andakíll Ramsar site between 12th March and 25th October 2017.
Figure 3 49. Proportion of foraging and roosting Mergus merganser during weekly (a) low tide and (b) rising tide estuarine surveys in six subsites in the Andakíll Ramsar site between 12th March and 25th October 2017.
Figure 3 50. Number of Mergus serrator recorded during weekly low tide and rising tide estuarine surveys in the Andakíll Ramsar site between 12th March and 25th October 2017.
Figure 3 51. Relative abundance of Mergus serrator during weekly (a) low tide and (b) rising tide estuarine surveys in the Andakíll Ramsar site between 12th March and 25th October 2017.
Landbúnaðarháskóli Íslands Andakíll Protected Habitat Area Monitoring 2017 Estuarine Monitoring Final Report 7 | Page
............................................................................................................................................................ 45
............................................................. 46
46
47
..................................................................................................................................................................... 47
48
48
............................................................................... 49
...................................... 49
50
50
...................................... 51
51
....................................................... 52
52
............................................................................................................................................................ 53
53
54
Figure 3 52. Relative abundance during (a) spring and (b) autumn of Mergus serrator counted on twice weekly estuarine surveys in the Andakíll Ramsar site in 2017.
Figure 3 53. Proportion of foraging and roosting Mergus serrator during weekly (a) low tide and (b) rising tide estuarine surveys in six subsites in the Andakíll Ramsar site between 12th March and 25th October 2017.
Figure 3 54. Number of Gavia stellata recorded during weekly low tide and rising tide estuarine surveys in the Andakíll Ramsar site between 12th March and 25th October 2017.
Figure 3 55. Relative abundance of Gavia stellata during weekly (a) low tide and (b) rising tide estuarine surveys in the Andakíll Ramsar site between 12th March and 25th October 2017.
Figure 3-56. Proportion of foraging and roosting Gavia stellata during weekly (a) low tide and (b) rising tide estuarine surveys in six subsites in the Andakíll Ramsar site between 12th March and 25th October 2017.
Figure 3 57. Number of Gavia immer recorded during weekly low tide and rising tide estuarine surveys in the Andakíll Ramsar site between 12th March and 25th October 2017.
Figure 3-58. Relative abundance of Gavia immer during weekly (a) low tide and (b) rising tide estuarine surveys in the Andakíll Ramsar site between 12th March and 25th October 2017.
Figure 3 59. Number of Phalacrocorax carbo recorded during weekly low tide and rising tide estuarine surveys in the Andakíll Ramsar site between 12th March and 25th October 2017.
Figure 3 60. Relative abundance of Phalacrocorax carbo during weekly (a) low tide and (b) rising tide estuarine surveys in the Andakíll Ramsar site between 12th March and 25th October 2017.
Figure 3 61. Number of waders recorded during weekly low tide and rising tide estuarine surveys in the Andakíll Ramsar site between 12th March and 25th October 2017.
Figure 3-62. Number of Haematopus ostralegus recorded during weekly low tide and rising tide estuarine surveys in the Andakíll Ramsar site between 12th March and 25th October 2017.
Figure 3 63. Relative abundance of Haematopus ostralegus during weekly (a) low tide and (b) rising tide estuarine surveys in the Andakíll Ramsar site between 12th March and 25th October 2017.
Figure 3 64. Relative abundance during (a) spring and (b) autumn of Haematopus ostralegus counted on twice weekly estuarine surveys in the Andakíll Ramsar site in 2017.
Figure 3 65. Proportion of foraging and roosting Haematopus ostralegus during weekly (a) low tide and (b) rising tide estuarine surveys in six subsites in the Andakíll Ramsar site between 12th March and 25th October 2017.
Figure 3 66.Number of Pluvialis apricaria recorded during weekly low tide and rising tide estuarine surveys in the Andakíll Ramsar site between 12th March and 25th October 2017.
Figure 3 67. Relative abundance of Pluvialis apricaria during weekly (a) low tide and (b) rising tide estuarine surveys in the Andakíll Ramsar site between 12th March and 25th October 2017.
Figure 3 68. Relative abundance during (a) spring and (b) autumn of Pluvialis apricaria counted on twice weekly estuarine surveys in the Andakíll Ramsar site in 2017.
Figure 3 69. Proportion of foraging and roosting Pluvialis apricaria during weekly (a) low tide and (b) rising tide estuarine surveys in six subsites in the Andakíll Ramsar site between 12th March and 25th October 2017.
Landbúnaðarháskóli Íslands Andakíll Protected Habitat Area Monitoring 2017 Estuarine Monitoring Final Report 8 | Page
54
..................................................................................................................................................................... 54
55
55
..................................................................................................................................................................... 56
57
57
................................................... 58
...................................... 58
59
60
...................... 60
................................................................... 61
.............................................................................................................................................. 61
62
62
63
63
Figure 3 70. Number of Charadrius hiaticula recorded during weekly low tide and rising tide estuarine surveys in the Andakíll Ramsar site between 12th March and 25th October 2017.
Figure 3 71. Relative abundance of Charadrius hiaticula during weekly (a) low tide and (b) rising tide estuarine surveys in the Andakíll Ramsar site between 12th March and 25th October 2017.
Figure 3 72. Relative abundance during (a) spring and (b) autumn of Charadrius hiaticula counted on twice weekly estuarine surveys in the Andakíll Ramsar site in 2017.
Figure 3 73. Proportion of foraging and roosting Charadrius hiaticula during weekly (a) low tide and (b) rising tide estuarine surveys in six subsites in the Andakíll Ramsar site between 12th March and 25th October 2017.
Figure 3-74.Number of Limosa limosa recorded during weekly low tide and rising tide estuarine surveys in the Andakíll Ramsar site between 12th March and 25th October 2017.
Figure 3-75. Relative abundance of Limosa limosa during weekly (a) low tide and (b) rising tide estuarine surveys in the Andakíll Ramsar site between 12th March and 25th October 2017.
Figure 3 76. Relative abundance during (a) spring and (b) autumn of Limosa limosa counted on twice weekly estuarine surveys in the Andakíll Ramsar site in 2017.
Figure 3 77. Proportion of foraging and roosting Limosa limosa during weekly (a) low tide and (b) rising tide estuarine surveys in six subsites in the Andakíll Ramsar site between 12th March and 25th October 2017.
Figure 3 78. Number of Numenius phaeopus recorded during weekly low tide and rising tide estuarine surveys in the Andakíll Ramsar site between 12th March and 25th October 2017.
Figure 3 79.Relative abundance of Numenius phaeopus during weekly (a) low tide and (b) rising tide estuarine surveys in the Andakíll Ramsar site between 12th March and 25th October 2017.
Figure 3-80. Proportion of foraging and roosting Numenius phaeopus during weekly (a) low tide and (b) rising tide estuarine surveys in six subsites in the Andakíll Ramsar site between 12th March and 25th October 2017.
Figure 3 81.Number of Tringa totanus recorded during weekly low tide and rising tide estuarine surveys in the Andakíll Ramsar site between 12th March and 25th October 2017.
Figure 3 82. Relative abundance of Tringa totanus during weekly (a) low tide and (b) rising tide estuarine surveys in the Andakíll Ramsar site between 12th March and 25th October 2017.
Figure 3 83. Relative abundance during (a) spring and (b) autumn of Tringa totanus counted on twice weekly estuarine surveys in the Andakíll Ramsar site in 2017.
Figure 3 84. Proportion of foraging and roosting Tringa totanus during weekly (a) low tide and (b) rising tide estuarine surveys in six subsites in the Andakíll Ramsar site between 12th March and 25th October 2017.
Figure 3-85.Number of Arenaria interpres recorded during weekly low tide and rising tide estuarine surveys in the Andakíll Ramsar site between 12th March and 25th October 2017.
Figure 3 86. Relative abundance of Arenaria interpres during weekly (a) low tide and (b) rising tide estuarine surveys in the Andakíll Ramsar site between 12th March and 25th October 2017.
Figure 3 87. Relative abundance during (a) spring and (b) autumn of Arenaria interpres counted on twice weekly estuarine surveys in the Andakíll Ramsar site in 2017.
Landbúnaðarháskóli Íslands Andakíll Protected Habitat Area Monitoring 2017 Estuarine Monitoring Final Report 9 | Page
64
64
65
65
............................................................. 66
...................................... 66
67
..................................................................................................................................................................... 67
................................................... 68
68
69
70
71
............................................................................... 71
71
....................................................... 72
73
73
Figure 3 88. Proportion of foraging and roosting Arenaria interpres during weekly (a) low tide and (b) rising tide estuarine surveys in six subsites in the Andakíll Ramsar site between 12th March and 25th October 2017.
Figure 3-89.Number of Calidris canutus recorded during weekly low tide and rising tide estuarine surveys in the Andakíll Ramsar site between 12th March and 25th October 2017.
Figure 3 90. Relative abundance of Calidris canutus during weekly (a) low tide and (b) rising tide estuarine surveys in the Andakíll Ramsar site between 12th March and 25th October 2017.
Figure 3 91. Number of Calidris alpina recorded during weekly low tide and rising tide estuarine surveys in the Andakíll Ramsar site between 12th March and 25th October 2017.
Figure 3-92. Relative abundance of Calidris alpina during weekly (a) low tide and (b) rising tide estuarine surveys in the Andakíll Ramsar site between 12th March and 25th October 2017.
Figure 3-93.Relative abundance during (a) spring and (b) autumn of Calidris alpina counted on twice weekly estuarine surveys in the Andakíll Ramsar site in 2017.
Figure 3 94. Proportion of foraging and roosting Calidris alpina during weekly (a) low tide and (b) rising tide estuarine surveys in six subsites in the Andakíll Ramsar site between 12th March and 25th October 2017.
Figure 3 95. Number of Calidris maritima recorded during weekly low tide and rising tide estuarine surveys in the Andakíll Ramsar site between 12th March and 25th October 2017.
Figure 3 96. Relative abundance of Calidris maritima during weekly (a) low tide and (b) rising tide estuarine surveys in the Andakíll Ramsar site between 12th March and 25th October 2017.
Figure 3 97. Relative abundance during (a) spring and (b) autumn of Calidris maritima counted on twice weekly estuarine surveys in the Andakíll Ramsar site in 2017.
Figure 3-98. Proportion of foraging and roosting Calidris maritima during weekly (a) low tide and (b) rising tide estuarine surveys in six subsites in the Andakíll Ramsar site between 12th March and 25th October 2017.
Figure 3 99. Number of Phalaropus lobatus recorded during weekly low tide and rising tide estuarine surveys in the Andakíll Ramsar site between 12th March and 25th October 2017.
Figure 3 100. Number of seabirds recorded during weekly low tide and rising tide estuarine surveys in the Andakíll Ramsar site between 12th March and 25th October 2017.
Figure 3 101. Number of Fulmarus glacialis recorded during weekly low tide and rising tide estuarine surveys in the Andakíll Ramsar site between 12th March and 25th October 2017.
Figure 3 102. Relative abundance of Fulmarus glacialis during weekly (a) low tide and (b) rising tide estuarine surveys in the Andakíll Ramsar site between 12th March and 25th October 2017.
Figure 3 103. Number of Chroicocephalus ridibundus recorded during weekly low tide and rising tide estuarine surveys in the Andakíll Ramsar site between 12th March and 25th October 2017.
Figure 3 104. Relative abundance of Chroicocephalus ridibundus during weekly (a) low tide and (b) rising tide estuarine surveys in the Andakíll Ramsar site between 12th March and 25th October 2017.
Figure 3 105. Relative abundance during (a) spring and (b) autumn of Chroicocephalus ridibundus counted on twice weekly estuarine surveys in the Andakíll Ramsar site in 2017.
Landbúnaðarháskóli Íslands Andakíll Protected Habitat Area Monitoring 2017 Estuarine Monitoring Final Report 10 | Page
............................................................................................................................................................ 73
....................................................... 74
74
75
...................................... 75
............................................................................... 76
76
....................................................... 77
...................................... 77
78
78
79
80
................................................... 81
81
82
82
......................................................... 83
Figure 3 106. Proportion of foraging and roosting Chroicocephalus ridibundus during weekly (a) low tide and (b) rising tide estuarine surveys in six subsites in the Andakíll Ramsar site between 12th March and 25th October 2017.
Figure 3-107. Number of Larus canus recorded during weekly low tide and rising tide estuarine surveys in the Andakíll Ramsar site between 12th March and 25th October 2017.
Figure 3 108. Relative abundance of Larus canus during weekly (a) low tide and (b) rising tide estuarine surveys in the Andakíll Ramsar site between 12th March and 25th October 2017.
Figure 3 109. Relative abundance during (a) spring and (b) autumn of Larus canus counted on twice weekly estuarine surveys in the Andakíll Ramsar site in 2017.
Figure 3-110. Proportion of foraging and roosting Larus canus during weekly (a) low tide and (b) rising tide estuarine surveys in six subsites in the Andakíll Ramsar site between 12th March and 25th October 2017.
Figure 3 111. Number of Larus marinus recorded during weekly low tide and rising tide estuarine surveys in the Andakíll Ramsar site between 12th March and 25th October 2017.
Figure 3-112. Relative abundance of Larus marinus during weekly (a) low tide and (b) rising tide estuarine surveys in the Andakíll Ramsar site between 12th March and 25th October 2017.
Figure 3 113. Relative abundance during (a) spring and (b) autumn of Larus marinus counted on twice weekly estuarine surveys in the Andakíll Ramsar site in 2017.
Figure 3 114. Proportion of foraging and roosting Larus marinus during weekly (a) low tide and (b) rising tide estuarine surveys in six subsites in the Andakíll Ramsar site between 12th March and 25th October 2017.
Figure 3 115. Number of Larus hyperboreus recorded during weekly low tide and rising tide estuarine surveys in the Andakíll Ramsar site between 12th March and 25th October 2017.
Figure 3 116. Relative abundance of Larus hyperboreus during weekly (a) low tide and (b) rising tide estuarine surveys in the Andakíll Ramsar site between 12th March and 25th October 2017.
Figure 3 117. Relative abundance of Larus hyperboreus during autumn (6th September 25th October), counted on twice weekly estuarine surveys in the Andakíll Ramsar site in 2017.
Figure 3 118. Proportion of foraging and roosting Larus hyperboreus during weekly (a) low tide and (b) rising tide estuarine surveys in six subsites in the Andakíll Ramsar site between 12th March and 25th October 2017. 89
Figure 3 119. Number of Larus glaucoides recorded during weekly low tide and rising tide estuarine surveys in the Andakíll Ramsar site between 12th March and 25th October 2017. 90
Figure 3 120. Relative abundance of Larus glaucoides during weekly (a) low tide and (b) rising tide estuarine surveys in the Andakíll Ramsar site between 12th March and 25th October 2017. 90
Figure 3-121. Number of Larus hyperboreus/glaucoides recorded during weekly low tide and rising tide estuarine surveys in the Andakíll Ramsar site between 12th March and 25th October 2017.
91
Figure 3 122. Relative abundance of Larus hyperboreus/glaucoides during weekly (a) low tide and (b) rising tide estuarine surveys in the Andakíll Ramsar site between 12th March and 25th October 2017. 91
Landbúnaðarháskóli Íslands Andakíll Protected Habitat Area Monitoring 2017 Estuarine Monitoring Final Report 11 | Page
.............................................................................................................................................. 83
............................................................. 84
84
85
..................................................................................................................................................................... 85
86
86
............................................................................... 87
87
................................................... 88
88
89
......................
Figure 3 123. Proportion of foraging and roosting Larus hyperboreus/glaucoides during weekly (a) low tide and (b) rising tide estuarine surveys in six subsites in the Andakíll Ramsar site between 12th March and 25th October 2017.
Figure 3-124. Number of Larus argentatus recorded during weekly low tide and rising tide estuarine surveys in the Andakíll Ramsar site between 12th March and 25th October 2017.
Figure 3 125. Relative abundance of Larus argentatus during weekly (a) low tide and (b) rising tide estuarine surveys in the Andakíll Ramsar site between 12th March and 25th October 2017.
Figure 3 126. Proportion of foraging and roosting Larus argentatus during weekly (a) low tide and (b) rising tide estuarine surveys in six subsites in the Andakíll Ramsar site between 12th March and 25th October 2017.
Figure 3 127. Number of Larus fuscus recorded during weekly low tide and rising tide estuarine surveys in the Andakíll Ramsar site between 12th March and 25th October 2017.
Figure 3 128. Relative abundance of Larus fuscus during weekly (a) low tide and (b) rising tide estuarine surveys in the Andakíll Ramsar site between 12th March and 25th October 2017.
Figure 3-129. Relative abundance during (a) spring and (b) autumn of Larus fuscus counted on twice weekly estuarine surveys in the Andakíll Ramsar site in 2017.
Figure 3 130. Proportion of foraging and roosting Larus fuscus during weekly (a) low tide and (b) rising tide estuarine surveys in six subsites in the Andakíll Ramsar site between 12th March and 25th October 2017.
Figure 3 131. Number of Sterna paradisaea recorded during weekly low tide and rising tide estuarine surveys in the Andakíll Ramsar site between 12th March and 25th October 2017. 96
Figure 3 132. Relative abundance of Sterna paradisaea during weekly (a) low tide and (b) rising tide estuarine surveys in the Andakíll Ramsar site between 12th March and 25th October 2017.
97
Figure 3 133. Relative abundance during (a) spring and (b) autumn of Sterna paradisaea counted on twice weekly estuarine surveys in the Andakíll Ramsar site in 2017. 97
Figure 3 134. Proportion of foraging and roosting Sterna paradisaea during weekly (a) low tide and (b) rising tide estuarine surveys in six subsites in the Andakíll Ramsar site between 12th March and 25th October 2017.
Figure 3 135. Number of Stercorarius parasiticus recorded during weekly low tide and rising tide estuarine surveys in the Andakíll Ramsar site between 12th March and 25th October 2017. 98
Figure 3 136. Relative abundance of Stercorarius parasiticus during weekly (a) low tide and (b) rising tide estuarine surveys in the Andakíll Ramsar site between 12th March and 25th October 2017. 98
Landbúnaðarháskóli Íslands Andakíll Protected Habitat Area Monitoring 2017 Estuarine Monitoring Final Report 12 | Page
.............................................................................................................................................. 92
.................................................... 92
93
............................................................................................................................................................ 93
............................................................. 94
95
95
95
......................................
............................................................................................................................................................ 97
Table of Tables
Table 2 1. Subsites covered during low tide and rising tide surveys between 12th March and 25th October 2017
Table 2 2. Habitat categories used when recording waterbird and seabird location.
Table 3-1. Peak numbers of waterbirds and seabirds recorded during low tide and rising tide estuarine surveys in the Andakíll Ramsar site between 12th March and 25th October 2017.
Table 3 2. Waterbird and seabird species recorded during estuarine surveys in the Andakíll Ramsar site between 12th March and 25th October 2017.
Table 3 3 Waterbird and seabird species distribution across six subsites in the Andakíll Ramsar site between 12th March and 25th October 2017 showing the percentage of all records in each subsite.
Table 3 4. The main roosting areas in the Andakíll Ramsar site, including waterbird and seabird composition, numbers in spring and autumn and total records throughout the survey period.
Table 7-1. Low tide and rising tide survey dates of estuarine surveys in the Andakíll Ramsar site between 12th March and 25th October
Landbúnaðarháskóli Íslands Andakíll Protected Habitat Area Monitoring 2017 Estuarine Monitoring Final Report 13 | Page
..................................................................................................................................................................... 16
18
................................................... 20
21
25
31
2017.................................................................................................................... 103
1. Introduction
The importance estuaries for waterbirds is well understood and documented (e.g. BirdLife International 2001; Boere et al. 2007; Prater 1981). Estuaries traditionally hold large numbers of waterbirds, especially during migratory staging periods and they are used by breeding and non breeding waterbirds during the breeding season. Some of the waterbirds staging in Iceland in spring and autumn are en route between Greenland or Arctic Canada and western Europe, migrations that involve two considerable sea crossings, and the prior deposition of considerable fat reserves. Therefore, the stopover sites that Iceland provides are crucial to the success of these migratory journeys As waterbirds are highly visible, reactive to change and easily counted, they can serve as useful indicators of the health of wetland ecosystems and, over time, reveal changes brought about by natural and anthropogenic processes
Human infrastructure developments on, and close to, wetland habitats has led to modification and loss of wetlands and to increased disturbance to waterbirds (Boere et al. 2007, van de Kam et al. 2004). Similarly, pressure from recreational activities has increased in many areas that are important for waterbirds and this is among the main cases of population declines (Goss Custard & Yates 1992; Davidson & Rothwell 1993; van de Kam et al. 2004).
Sea level rise and an increasing frequency of significant storms associated with climate change will result in an increased risk of coastal flooding in low lying areas (IPCC 2007). This is likely to cause significant losses of feeding and roosting areas for waterbirds (Watkinson et al. 2004; Galbraith et al. 2005; Durell et al. 2006). Waterbirds will also be affected by the indirect effects of climate change, such as: land use change; changes in the condition of wetlands; alterations in prey availability; changes in matching of the timing of (migratory bird) arrival dates and prey dynamics; altered predation effects; disease and parasitism, amongst others (Poulin & Mouritsen 2006; Boere et al. 2007; Mustin et al. 2007; Thompson et al. 2012; Sutherland et al. 2012).
With these changes in land use and climate change, many bird populations are experiencing dramatic contractions or expansions (McCarty 2001; Bohning-Gaese & Lemoine 2004; McDonald et al. 2012) and at this time of unprecedented change, information on population sizes and site usage is especially important.
Waterbirds use estuarine sites differently at different stages of the tide as the changing water levels are constantly changing the area available for foraging (Dias 2009; Granadeiro et al. 2006). Most species segregate themselves according to preferences for sediment penetrability and water depth. As the tide rises waterbirds are pushed towards their roosting areas as the water deepens and the mud and sand flats become inundated, and either roost adjacent to the foraging areas or fly to high tide roosts in other parts of the site, or beyond. And then, when the foraging areas begin to uncover as the tide recedes, these high tide aggregations break up and the birds disperse across the estuary again. While waterbird distribution is mainly governed by prey availability, high tide roosts can be a crucial factor. Loss of favoured roost sites can decrease survival rates due to the increased energetic costs of flying further to suitable roosting areas (Durell et al. 2005). Furthermore, the availability of suitable roost locations can influence the distribution of waders at low tide, as birds seek to reduce energetic expenditure by foraging close to roosting areas (Rogers 2003), even if there are more profitable foraging areas in the vicinity (Dias et al. 2006; van Gils et al. 2006). The selection of these
Landbúnaðarháskóli Íslands Andakíll Protected Habitat Area Monitoring 2017 Estuarine Monitoring Final Report 14 | Page
foraging and roosting places can change between and within seasons depending on factors such as weather (wind direction), prey availability and variations in human disturbance.
So, in order to be fully informed about how waterbirds make use of sites, it is necessary to collate information on their abundance and distribution throughout the tidal cycle, or at least during low tide and high tide periods. And, information on the seasonality of site use is required for the complete picture. Waterbird usage of estuarine sites also changes through the year, with sites being used as stopover sites during spring and or autumn migration, during the breeding season, as post breeding moulting sites or as wintering sites.
The aim of this study is to investigate the abundance, distribution and seasonality of waterbirds in the estuarine parts of the Andakíll Ramsar site in Borgarfjörður, western Iceland. The result is a baseline dataset with information on how waterbirds use the protected area during the spring and autumn staging periods and during the breeding season. It is hoped that when future studies are made on the waterbirds on the site, they can be conducted in a way that allows comparisons with the data collected as part of this study. In order to facilitate further monitoring, comprehensive rationale and methodology for this survey is presented as a Survey Handbook (Stroud & Tierney 2017)
Landbúnaðarháskóli Íslands Andakíll Protected Habitat Area Monitoring 2017 Estuarine Monitoring Final Report 15 | Page
2. Methods
2.1 Study area
The Andakíll Ramsar site is situated in Borgarfjörður, western Iceland (64°33'N, 21°46'W). The protected area is a 3,086 hectare wetland complex, a significant proportion of which is estuarine. The intertidal zone and areas of open water visible from land based vantage points were surveyed by dividing the area into six subsites, and surveying them consecutively on each survey day. Initially (until 24th April), five subsites were surveyed, but from then onwards a sixth subsite, Flæðhöfðasker (Est 6) was included in the weekly surveys (Table 2 1; Figure 2 1).
Table 2 1. Subsites covered during low tide and rising tide surveys between 12th March and 25th October 2017
Subsite name Subsite code Central coordinates
Grjóteyrarklakkur Est_1 64.538370, -21.835521
Kistufjörđur Est_2 64.539563, -21.800028
Kistuhöfðahólmar Est_3 64.551628, -21.810875
Ásgarđshöfđi Est_4 64.562727, -21.790447
Hvítárleirur Est_5 64.571413, -21.778509
Flæðhöfðasker1 Est_6 64.533389, -21.861501 1 Surveyed from 24th April onwards.
Landbúnaðarháskóli Íslands Andakíll Protected Habitat Area Monitoring 2017 Estuarine Monitoring Final Report 16 | Page
subsite boundaries are show as red lines and vantage points used as green dots. The dashed black line shows the boundary of the Andakíll Ramsar site. The arrows represent the approximate areas covered from each vantage point. Subsite Est 6 was surveyed from the 24th April onwards.

2.2
Low tide and rising tide surveys
A combination of low tide and rising tide waterbird surveys covering the main part of Borgarfjörður and Kistufjörđur were undertaken between 12th March and 25th October 2017 by two observers to determine waterbird distribution and abundance at low tide, when the intertidal flats are exposed and available to feeding waterbirds; and rising/high tide, when most birds are at, or moving to, their high tide roosting areas
One low tide and one rising tide survey was undertaken in each week. Low tide surveys were used to establish the main feeding distributions of waterbirds and were carried out within a four hour period, starting two hours before low tide and being completed within two hours after low tide Rising tide surveys were used to establish waterbird distribution in the period before high tide, when waterbirds are congregating to roost. Surveys commenced three hours before high tide and were completed by high tide.
Surveys were carried out in daylight between the hours of 07:00 and 22:55. On each survey, the date, survey type, surveyors present, start and finish times, tidal state and extent of coverage were
Landbúnaðarháskóli Íslands Andakíll Protected Habitat Area Monitoring 2017 Estuarine Monitoring Final Report 17 | Page
recorded. Weather and visibility were recorded by assessing ice coverage, rain, wind and cloud cover (see Appendix 2 Field recording forms).
In order to facilitate the interpretation of the count data, waterbird species were divided into three groups, wildfowl and allies, waders and seabirds, and the following families were recorded:
Wildfowl and allies: Gaviidae (divers), Podicipedidae (grebes), Phalacrocoracidae (cormorant), Anatidae (swans, geese and ducks)
Waders: Haematopodidae (oystercatchers), Charadriidae (plovers and lapwings), Scolopacidae (sandpipers and allies)
Seabirds: Procellariidae (fulmar), Laridae (gulls and terns) and Stercorariidae (skuas/jaegers).
Waterbirds were recorded within four habitat categories: intertidal, subtidal, supratidal and terrestrial (Table 2 2)
Table 2-2 Habitat categories used when recording waterbird and seabird location
Zone Description
Intertidal
Between the mean low-water and mean high-water lines, i.e. the area uncovered by the tide during the survey, usually dominated by mud or sand flats or rocky shores.
Subtidal Area covered by water, i.e. offshore areas and pools and channels within the intertidal area.
Supratidal Shore and habitats immediately above the mean high-water line.
Terrestrial Above the intertidal and supratidal levels, and having no, or weak coastal influence, e.g. agricultural land.
The behaviour of all waterbirds was recorded as either ‘feeding’ or ‘roosting/other’. Birds that were not actively foraging (roosting, loafing, or engaged in social interaction) were recorded as ‘roosting/other’. The locations of all aggregations of waterbirds and seabirds were mapped on a fieldmap (see Appendix 2 Field recording forms). During rising tide surveys, the location of all aggregations of roosting birds was recorded. All activities and/or disturbance events and their duration were recorded. The presence of birds of prey were also recorded, whether they caused disturbance to waterbirds or not.
Equipment used for fieldwork included:
• binoculars (Zeiss Victory 8 x 42, Zeiss Dialyt 10 x 40 B)
• telescope and tripod (Swarovski ATS 65 HD 20 60 x 65 mm, Hawke Endurance 16 48 x 68)
• clicker counter
• WeatherWriter clipboard
• bespoke Field recording forms and subsite level fieldmaps (see Appendix 2 Field recording forms)
Landbúnaðarháskóli Íslands Andakíll Protected Habitat Area Monitoring 2017 Estuarine Monitoring Final Report 18 | Page
2.3
Data storage and validation
All data were digitised from field maps following each survey. Survey data were entered into MS Excel which included data validation procedures. Live ‘dashboards’ and validation procedures were used to identify and check unusually high or low counts. Aggregations of birds (spatial data) were digitised in QGIS (v2.14.20) All records, including significant aggregations and roost sites were given a unique identifier, which was added to the field map after digitisation. Field maps were scanned and stored digitally.
2.4
Preparation of the species accounts
In the species accounts, dot density maps are used to present some of the count data They show species distribution by presenting one dot per bird in the relevant subsite. The resulting map provides an indication of both numbers and density for each species. Dot density maps do not show the precise location of individual birds the dots are placed randomly within subsites therefore no conclusions on distributions can be made at a scale finer than subsite (However, see Section 3.5 Roost sites for an assessment of high tide roosts, which was undertaken at a finer scale than subsite). To account for the different lengths of time in the spring and autumn periods, the bird records have been divided by the number of weeks in the period (Spring 13 weeks, Autumn 16 weeks). This explains why there are fewer dots on the seasonal dot density maps compared with low tide and rising tide maps
The following information is presented for each species:
• the total number of birds in the site at each low tide and rising tide survey;
• two dot density maps of the six subsites showing distribution during low tide and rising tide;
• two dot density maps of the six subsites showing distribution during spring and autumn;
• two maps showing the birds’ behaviour (feeding or roosting/other) within each subsite during low tide and rising tide.
For species that were observed on relatively few occasions, only relevant maps are presented (e.g., if a species was not recorded during rising tide surveys, no rising tide map is presented). Maps were not produced for species with fewer than 100 records throughout the survey period.
In order to account for potential differences in numbers before and after the breeding season, the survey period is divided in two. Spring is defined as the 13 week period between weeks 12 and 23 (12th March 7th June), and Autumn is defined as the 16 week period between weeks 24 and 43 (12th June 25th October).
Landbúnaðarháskóli Íslands Andakíll Protected Habitat Area Monitoring 2017 Estuarine Monitoring Final Report 19 | Page
3. Results
3.1
Site level results
A total of 31 low tide and 30 rising tide counts were undertaken between 12th March and 25th October 2017.
In total, 43 waterbird and seabird species were recorded (Table 3 2), with the highest species diversity occurring in May (Figure 3 1), when 36 species were recorded.
The highest species diversity within a single survey occurred during the low tide survey in week 19 (on 8th May) when 33 species were recorded. The lowest species diversity on a single survey day was on the rising tide count in week 12 (23rd March), when 5 species were recorded.
Overall, the total number of waterbirds and seabirds recorded increased throughout March and April and then remained relatively constant until the end of June, when the numbers doubled. No surveys took place during week 33 and 34 (14th August 27th August). Numbers started to decline throughout September and surveys ceased at the end of October (Figure 3 2). The differences in the numbers of birds recorded during low tide and rising tide surveys are discussed in Section 3.4.
The highest number of all waterbirds and seabirds recorded on a single survey was 5,155, and was recorded during the rising tide survey in week 32 (7th August) (Figure 3 2). The peak number of birds recorded during a low tide survey was 4,513 and also occurred in week 32 (6th August). The lowest total number of birds was 51 recorded during the rising tide survey in week 12 (12th March).
With regard to peak numbers within the species groups (Table 3 1), wildfowl and allies numbers were highest during the surveys on 6th and 7th July. Wader numbers were highest during surveys on 6th and 7th August (but note no surveys took place in the second half of August so these numbers may have been surpassed). The highest number of seabirds occurred at low tide on 15th May, and at rising tide on 6th September.
Table 3 1. Peak numbers of waterbirds and seabirds recorded during low tide and rising tide estuarine surveys in the Andakíll Ramsar site between 12th March and 25th October 2017.
Species group
Low-tide Rising-tide
Wildfowl and allies 2,195 (6th July) 1,920 (7th July)
Waders 2,620 (6th August) 2,810 (7th August)
Seabirds 673 (15th May) 854 (6th September)
Landbúnaðarháskóli Íslands Andakíll Protected Habitat Area Monitoring 2017 Estuarine Monitoring Final Report 20 | Page
Table 3 2. Waterbird and seabird species recorded during estuarine surveys in the Andakíll Ramsar site between 12th March and 25th October 2017. Species listed in order of International Ornithological Congress (IOC) (Gill et al. 2020).
English name Scientific name
Icelandic name
Greylag Goose Anser anser Grágæs Pink-footed Goose Anser brachyrhynchus Heiðagæs Greenland White-fronted Goose Anser albifrons flavirostris Blesgæs Whooper Swan Cygnus cygnus Álft
Common Shelduck Tadorna tadorna Brandönd Eurasian Wigeon Mareca penelope Rauðhöfðaönd Mallard Anas platyrhynchos Stokkönd
Northern Pintail Anas acuta Grafönd
Eurasian Teal Anas crecca Urtönd Greater Scaup Aythya marila Duggönd
Common Eider Somateria mollissima Æðarfugl Harlequin Duck Histrionicus histrionicus Straumönd
Long-tailed Duck Clangula hyemalis Hávella Barrow's Golden Eye Bucephala islandica Húsönd Goosander Mergus merganser Gulönd
Red-breasted Merganser Mergus serrator Toppönd
Red-throated Diver Gavia stellata Lómur
Great Northern Diver Gavia immer Himbrimi
Northern Fulmar Fulmarus glacialis Fýll
Slavonian Grebe Podiceps auritus Flórgoði
Great Cormorant Phalacrocorax carbo Dílaskarfur
Eurasian Oystercatcher Haematopus ostralegus Tjaldur
European Golden Plover Pluvialis apricaria Heiðlóa Ringed Plover Charadrius hiaticula Sandlóa
Common Snipe Gallinago gallinago Hrossagaukur
Black-tailed Godwit Limosa limosa Jaðrakan Whimbrel Numenius phaeopus Spói
Common Redshank Tringa totanus Stelkur
Ruddy Turnstone Arenaria interpres Tildra
Red Knot Calidris canutus Rauðbrystingur Dunlin Calidris alpina Lóuþræll
Purple Sandpiper Calidris maritima Sendlingur Red-necked Phalarope Phalaropus lobatus Óðinshani
Black-legged Kittiwake Rissa tridactyla Rita Black-headed Gull Chroicocephalus ridibundus Hettumáfur
Common Gull Larus canus Stormmáfur
Great Black-backed Gull Larus marinus Svartbakur
Glaucous Gull Larus hyperboreus Hvítmáfur
Iceland Gull Larus glaucoides Bjartmáfur Herring Gull Larus argentatus Silfurmáfur
Lesser Black-backed Gull Larus fuscus Sílamáfur
Arctic Tern Sterna paradisaea Kría
Parasitic Jaeger Stercorarius parasiticus Kjói
Landbúnaðarháskóli Íslands Andakíll Protected Habitat Area Monitoring 2017 Estuarine Monitoring Final Report 21 | Page
of species
Apr


Figure 3 1. Number of waterbird and seabird species recorded each month during estuarine surveys in the Andakíll Ramsar site between 12th March and 25th October 2017. Eight surveys were conducted each month, except for March and August, when five surveys were conducted.
Low-tide Rising-tide
number of birds Week number and month
Figure 3 2 Total number of waterbirds and seabirds recorded during weekly low tide and rising tide estuarine surveys in the Andakíll Ramsar site between 12th March and 25th October 2017. No surveys were conducted during weeks 33 and 34.
Landbúnaðarháskóli Íslands Andakíll Protected Habitat Area Monitoring 2017 Estuarine Monitoring Final Report 22 | Page
0 5 10 15 20 25 30 35 40 Mar
May Jun Jul Aug Sep Oct Number
0 1000 2000 3000 4000 5000 6000 10 11 12 13 14 15 16 17 18 19 20 21 22 23 24 25 26 27 28 29 30 31 32 33 34 35 36 37 38 39 40 41 42 43 Mar Apr May Jun Jul Aug Sep Oct Total
3.2 Subsite usage
Birds’ preferences for particular parts of a site are likely driven by the type of substrate; density or availability prey; shelter from winds or waves; disturbance; distance to high tide roosts; or perceived or actual predation pressure
Kistufjörđur (Est 2) supported a higher density of birds, during both low tide and rising tide surveys, than the other subsites. Bird density was higher during low tide surveys in Grjóteyrarklakkur (Est 1), Kistufjörđur (Est 2) and Flæðhöfðasker (Est 6) during low tide surveys, compared to rising tide surveys (Figure 3 3) For the other three subsites the density of birds records was similar during low tide and rising tide surveys. While no benthic sampling was carried out within the study area as part of this study or previously, the birds’ apparent preference for Kistufjörđur (Est 2), Grjóteyrarklakkur (Est 1) and to Flæðhöfðasker (Est 6) during low tides is likely driven by prey availability. These subsites have a higher proportion of muddier substrates than the other subareas and are the least exposed to wind and waves (especially Kistufjörđur (Est 2)). Such conditions typically support high numbers of benthic invertebrates (Little 2000; McLusky & Elliot 2004; Fujii 2012), with sandier sediments supporting comparatively fewer invertebrates (Prater 1981). Furthermore, the Andakílsá river flows into for Kistufjörđur (Est 2). This is a productive river and supports high levels of biodiversity (Ólafsson et al. 2006). The particulate organic carbon values for Andakílsá are among the highest recorded in Iceland, and much of this particulate matter is algae that flows from Lake Skorradalsvatn (c. 10 km inland) (Eiríksdóttir et al. 2010). When this enters the calm waters of the estuary, a large portion of it is deposited onto the estuarine mud, promoting the benthic invertebrate communities that are important for waterbirds. Subareas 3, 4, and 5 are sandier and comprise the outflow of the glacial Hvítá river, which is likely to carry fewer nutrients.
For wildfowl, by far the highest density was recorded in Kistufjörđur (Est 2) (Figure 3 4). The highest density of waders was recorded in Kistufjörđur (Est 2). Relatively high densities of waders were recorded in Grjóteyrarklakkur (Est 1) compared to the other subsites (Figure 3 4). For seabirds, highest densities were recorded in Flæðhöfðasker (Est 6). This is mostly driven by an Arctic Tern colony, which is adjacent to Flæðhöfðasker (Est 6).
Landbúnaðarháskóli Íslands Andakíll Protected Habitat Area Monitoring 2017 Estuarine Monitoring Final Report 23 | Page
Rising-tide
Figure 3 3. Waterbird and seabird density in each of the six subsites during weekly low tide and rising tide estuarine surveys in the Andakíll Ramsar site between 12th March and 25th October, 2017. See Figure 2 1 for subsite locations and boundaries.
Wildfowl and allies Waders Seabirds
name and code


Figure 3 4 Total number of bird records in six subsites in the estuarine habitat of the Andakíll Ramsar site recorded in weekly low tide and rising tide estuarine surveys between 12th March and 25th October, 2017. See Figure 2 1 for subsite locations and boundaries.
Some species or species groups have specific requirements, whereas others have a wider tolerance for different conditions. Those with specific requirements are more likely to be impacted by changes or developments in, or close to, the site. The distribution of each species at subsite level is presented in Table 3 3 This shows that some species were regularly recorded in different subsites, and others showed a preference for a particular subsite (or subsites). For example, Teal and Oystercatcher were recorded disproportionately in Kistufjörđur (Est 2) during low tide and rising tide surveys and Eider showed a preference for Flæðhöfðasker (Est 6) during low tide surveys. Greenland White fronted Geese were disproportionately recorded in Ásgarđshöfđi (Est 4), and were rarely encountered in other subsites. Fulmars were recorded in Flæðhöfðasker (Est 6), Grjóteyrarklakkur (Est 1) and Kistufjörđur (Est 2) as they commuted between the breeding colony at Brekkufjall (c. 1.5 km south of the survey area) and the open sea, and were not recorded as ‘using’ the site for foraging or roosting.
Landbúnaðarháskóli Íslands Andakíll Protected Habitat Area Monitoring 2017 Estuarine Monitoring Final Report 24 | Page
0 1000 2000 3000 4000 5000 6000 7000 8000 9000 10000 11000
Grjóteyrarklakkur
Kistufjörđur Kistuhöfðahólmar Ásgarđshöfđi Hvítárleirur Flæðhöfðasker Est 1 Est 2 Est 3 Est 4 Est 5 Est 6 Bird records per km 2 Subsite name and code Low-tide
0 1000 2000 3000 4000 5000 6000 7000 8000 9000 10000 11000 Grjóteyrarklakkur
Kistufjörđur
Kistuhöfðahólmar Ásgarđshöfđi Hvítárleirur Flæðhöfðasker Est 1 Est 2 Est 3 Est 4 Est 5 Est 6 Bird records per km 2 Subsite
Table 3-3 Waterbird and seabird species distribution across six subsites in the Andakíll Ramsar site between 12th March and 25th October 2017 showing the percentage of all records in each subsite. The total number of bird records is also included. Heavier shading indicates a higher proportion of bird records in the subsite. See Figure 2 1 for subsite locations and boundaries Sixteen species with fewer than 100 bird records are excluded.
Rising-tide
Species
Greylag Goose
Greenland White-fronted Goose
Whooper Swan
Common Shelduck
Eurasian Wigeon
Eurasian
Common Eider
Long-tailed
Red-breasted Merganser
Northern
Great
Eurasian Oystercatcher
European Golden Plover 23 61
Ringed Plover 47 34
Black-tailed Godwit 28 41 12
Common Redshank 32 54
Ruddy Turnstone 29 23 0
Red Knot 30 60
Dunlin 35 46 2 15
Purple Sandpiper 72 25 0
Black-headed Gull 32 41 14
Common Gull 19 52 18
Great Black-backed Gull 9 19 11 40
Glaucous Gull 12 32 1 0
Lesser Black-backed Gull 14 22 37 16 3
Arctic Tern 36 32 3 1
3.3
Use of substrates and waterbird behaviour
7
18 11 22
38
10
13 2
0
3 26 18 40 13 0
56 0 0 0 0
12 0 22
40 2 9
24
33
5 14 5 62 10 5 21
22 11 0 11 0 56
5
13 17 22
29 10 2 2 1 57
Conservation of species and sites relies on knowing the number of individuals, but it is important also to understand how these individuals use sites, both in time and space. A principle aim of this work was to understand the feeding and roosting habitats used by the birds at low and high tides.
Wildfowl were most frequently recorded in the intertidal areas during low tide surveys, and subtidal, intertidal and supratidal areas during rising tide surveys. Waders were found exclusively in intertidal areas during low tide surveys and in intertidal and supratidal areas during rising tide surveys. Seabirds were mostly recorded in intertidal areas during low tide surveys and were encountered in intertidal, subtidal and terrestrial areas during rising tide surveys.
Landbúnaðarháskóli Íslands Andakíll Protected Habitat Area Monitoring 2017 Estuarine Monitoring Final Report 25 | Page
Est 1 Est 2 Est 3 Est 4 Est 5 Est 6 Birdrecords Est 1 Est 2 Est 3 Est 4 Est 5 Est 6 Birdrecords
19 68 2 6 1 4 2992 14 42 15 4 13 11 494
0 0 0 98 2 0 249 0 12 0 79 10 0 205
41 41 4 2 2 9 1999 27 20 17 27 4 6 839
5 65 6 23 1 0 13884 14 48 13 19 5 0 1122 Mallard 24 42 12 9 3 10 612 20 16 36 11 14 2 91
11 61 0 10 18 0 669 22 9 5 49 15 0 195
Teal 1 95 0 1 3 0 6334 0 79 6 9 5 0 1215
4 26 0 2 0 68 170 4 7 0 9 0 80 45
Duck 17 16 0 0 0 67 125 8 46 0 44 0 2 90
28 31 1 0 0 39 1529 25 48 3 18 2 4 296
Fulmar 4 2 0 0 0 94 51 21 25 0 2 0 53 57
Cormorant 28 19 1 0 0 52 105 27 45 0 0 0 27 11
70 24 3 1 0 2 2751 19 76 2 1 1 1 624
5 4 6 1 7448 0 17 43 28 11 0 977
1 0 3 16 355 11
31 7 45
2 2 15 755 3 44 29
7 7 146
4 4 0 6 8499
65 9
4 949
0 0 48 1246 43
7
0 12 131
0 10 0 0 133 0 95 0 1 0 3 147
0 1 7482
1152
0 0 3 1827 44
411
1 0 12 2750 34
8
1051
1 0 9 522 11
5
88
8 13 306
0 56 113
9
8 830 36
7
83
1 27 1934
595
Low-tide
Figure 3 5. The proportion of a) wildfowl and allies b) waders and c) seabirds recorded in four habitat zones during low tide and rising tide estuarine surveys in the Andakíll Ramsar site between 12th March and 25th October 2017. See Table 2 2 for a description of each zone.
Landbúnaðarháskóli Íslands Andakíll Protected Habitat Area Monitoring 2017 Estuarine Monitoring Final Report 26 | Page
0%
a) Wildfowl and allies
Foraging Roosting
Low-tide (23161) Rising-tide (8447) Low-tide (4734) Rising-tide (13150) Low-tide (763) Rising-tide (3850) Low-tide (196) Rising-tide (228)
Intertidal Subtidal Supratidal Terrestrial
b) Waders
Rising-tide (10631) Low-tide (30348) Rising-tide (6) Low-tide (25) Rising-tide (3527) Low-tide (38) Rising-tide (156) Low-tide (85)
Intertidal Subtidal Supratidal Terrestrial
c) Seabirds
Rising-tide (1964) Low-tide (5105) Rising-tide (1875) Low-tide (1614) Rising-tide (776) Low-tide (129) Rising-tide (11) Low-tide (2)
Intertidal Subtidal Supratidal Terrestrial
Figure 3-6. Proportion of encounters of a) wildfowl and allies b) waders and c) seabirds during low tide and rising tide estuarine surveys in the Andakíll Ramsar site between 12th March and 25th October 2017 according to their location in four habitat zones. Numbers in brackets indicate the number of bird records. See Table 2 2 for a description of each zone.
Landbúnaðarháskóli Íslands Andakíll Protected Habitat Area Monitoring 2017 Estuarine Monitoring Final Report 27 | Page
10% 20% 30% 40% 50% 60% 70% 80% 90% 100%
0% 10% 20% 30% 40% 50% 60% 70% 80% 90% 100%
0% 10% 20% 30% 40% 50% 60% 70% 80% 90% 100%
For wildfowl and their allies, regardless of the habitat zone, more birds were recorded foraging during low tide surveys and as roosting during rising tide surveys (Figure 3 6 (a)). Small numbers of wildfowl were recorded in terrestrial areas, and these birds were more frequently recorded foraging than roosting. Waders were mostly recorded as foraging in intertidal and subtidal areas, and roosting in supratidal and terrestrial areas (Figure 3 6 (b)). The records of waders in subtidal areas are Red necked Phalaropes which swims while foraging. Seabirds were most commonly recorded foraging when in intertidal and subtidal areas, and roosting when in supratidal areas (Figure 3 6 (c)).
3.4 Waterbird abundance during surveys: low tide versus rising tide
In most cases, the number of birds recorded during low tide surveys was greater than during rising tide surveys (Figure 3 2). This is often the case for surveys like this, and indeed is the reason that rising tide surveys were undertaken rather than high tide surveys. Waterbirds are easier to count when they are dispersed across extensive intertidal areas at low tide, compared to at high tide, when they are squeezed together in high tide roosts, and often obscured by vegetation or rocks Therefore, in some cases the explanation for higher counts during low tide surveys may be greater detectability. However, this pattern may also reflect differential use of the site for foraging (at low tide) and roosting (at high tide). It is apparent that, for some species, some birds use high tide roosting areas outside the survey area and forage in the survey area when the intertidal sand and mudflats are exposed at low tide.
During the spring, Oystercatcher, Golden Plover, Ringed Plover, Black tailed Godwit, Redshank, Turnstone, Dunlin and Purple Sandpiper were recorded in considerably larger numbers during low tide surveys compared to rising tide surveys. In the autumn, considerably more Golden Plover, Ringed Plover, Redshank, Turnstone and Dunlin were recorded during low tide surveys compared to rising tide surveys. This suggests that they avail of high tide refuges outside the Andakíll Ramsar site. It is also possible that some small or inconspicuous roost sites were missed during these surveys. This highlights the importance of conducting both low tide and rising tide surveys to understand the complete picture on how the birds use the protected area. However as systematic surveys were not conducted outside the Andakíll Ramsar site, it is not known if there are regular high tide roosts that these birds commute to.
Landbúnaðarháskóli Íslands Andakíll Protected Habitat Area Monitoring 2017 Estuarine Monitoring Final Report 28 | Page
3.5 Roost sites
In the context of a tidal ecosystem, a roost site is generally considered to be a place where birds congregate when feeding on intertidal mud or other estuarine habitats is not possible due to the depth of water. Roost sites are of vital importance to waterbirds, especially waders, during the high tide period. Information on the location and composition of roosts is valuable for conservation, as it can help to determine if proposed developments or activities could lead to negative impacts for a given species or assemblage of waterbirds
As the tide rises, many species follow the tidal edge and may continue to forage as the tide pushes them to a high tide roost, or at some point stop feeding and fly to a high tide roost in another part of the site or beyond. Waders are constrained to forage in shallow water or intertidal flats, and roost close to the high tide line. Similarly, some other waterbirds and seabirds prefer shallow water for foraging and also roost at high tide when the water is deepest. Waterfowl and gulls often roost alongside waders above the high tide line, or in the water, adjacent to the wader roost.
Roosting behaviours are not site and species specific (Scheiffarth et al. 1996), but can vary between years depending on factors such as weather (e.g. direction of prevailing wind), variability in prey abundance and availability, and variations in predation pressure. This highlights the value of monitoring over several years a way to more thoroughly understand how waterbirds and seabirds use wetland sites.
The definition of a roost has, for the purposes of this report is any place where birds regularly congregate during rising or high tides. Birds roosted extensively throughout the survey area, and 37 roosts were recorded. Fourteen roosts that were infrequently used, or were comprised of relatively small numbers of birds (< 100 bird records throughout the survey period), are not documented here.
Of the remaining 23 roosts, some were not consistently used, either in space or time. Some formed at various places along a stretch of coastline, and others were used in one part of the season and not another. For these reasons, these 23 roosting locations were amalgamated into 12 main roosts, and these are described here.
Most roosts were small comprising several hundred birds. Roosts were recorded in all subsites except Hvítárleirur (Est 5). Most of the roosting assemblages, in terms of frequency of use, consistency in location and abundance of birds were recorded in Kistufjörđur (Est 2) both in spring and in autumn (Figure 3 7, Figure 3 8). The majority of its northern shore was used by roosting birds at some point in the survey period, making it a very important area for roosting waterbirds. The number of birds using each roost was generally greater in autumn (than in the spring), corresponding to the greater abundance of birds at this time. However, some roosts (e.g Roost 6), were important in spring and practically unused in autumn and vice versa.
Overall, the roosts that supported greatest numbers, or most consistently supported birds were Roosts 2, 3 ,5 and 6. The species composition, abundance (in spring and autumn) and frequency of use of the main roosts is outlined in Table 3 4.
Landbúnaðarháskóli Íslands Andakíll Protected Habitat Area Monitoring 2017 Estuarine Monitoring Final Report 29 | Page
Figure 3 7. Location of roost sites (orange) and twelve main roosts (red) recorded during weekly rising tide estuarine surveys in the Andakíll Ramsar site in spring (12th March and 7th June 2017)

Figure 3 8. Location of roost sites (orange) and twelve main roosts (blue) recorded during weekly rising tide estuarine surveys in the Andakíll Ramsar site in autumn (12th June and 25th October 2017).

Landbúnaðarháskóli Íslands Andakíll Protected Habitat Area Monitoring 2017 Estuarine Monitoring Final Report 30 | Page
Table 3-4. The main roosting areas in the Andakíll Ramsar site, including waterbird and seabird composition, numbers in spring and autumn and total records throughout the survey period (spring = 12th March 7th June; autumn = 12th June 25th October).
Roost number Subsite Coordinates
Number of birds
Spring Autumn
Total records Description and species usage
1 Est_6 64.530, -21.884 0-100 <50 229
2 Est_1 64.530, -21.832 0-200 0-100 1114
3 Est_2 64.535, -21.812 0-150 0-300 1501
4 Est_2 64.534, -21.784 <50 0-650 727
5 Est_2 64.544, -21.783 0-100 0-450 1626
6 Est_2 64.544, -21.812 0-500 <50 1133
7 Est_3 64.558, -21.795 0-100 0-100 277
8 Est_3 64.551, -21.805 <50 0-150 338
9 Est_3 64.546, -21.810 <50 0-100 162
10 Est_3 64.549, -21.801 <50 0-450 1303
11 Est_4 64.562, -21.785 0 0-150 234
Gravel bank exposed on all tides. Almost exclusively used by Arctic Tern.
Saltmarsh, exposed on all but the highest tides. Consistently used, mainly by Shelduck, Arctic Tern, Black-headed Gulls and Oystercatcher.
Used regularly, mainly by Shelduck, gulls, Oystercatcher and Turnstone.
Saltmarsh margin. Used infrequently by Redshank.
Extensive area that includes vegetated headlands and bays. Used regularly, particularly in autumn by Greylag goose, Whooper Swan, Shelduck and Redshank.
Rocky outcrops, exposed on all tides. Used regularly during spring, mainly by Oystercatcher. Used infrequently in autumn.
Vegetated island, exposed on all tides. Used regularly, especially in autumn, mainly by Shelduck.
Vegetated island, exposed on all tides. Used infrequently by Shelduck, Whooper Swan and Redshank.
Saltmarsh. Exposed on most tides. Used infrequently, by Shelduck, Redshank and Dunlin.
Saltmarsh with freshwater inlet. Exposed on most tides. Used infrequently in spring and consistently in autumn by Shelduck, Redshank and Dunlin.
Saltmarsh. Exposed on most tides. Regularly used, mainly by Shelduck and Redshank in autumn.
12 Est_4 64.558, -21.787 0 0-150 167 Saltmarsh. Occasionally used, mainly by Dunlin and Shelduck.
3.6
Human activities, birds of prey and disturbance
The presence or absence of human activities and birds of prey was recorded during each low tide and rising tide survey. The types of human activity, and, based on the birds’ reaction, whether it was deemed to be affecting waterbirds or not, was recorded.
Potential sources of disturbance were recorded on 59 occasions (38 surveys) and disturbance to waterbirds was observed on 14 occasions (12 surveys). Disturbance usually resulted in some of the birds present flying a short distance. There were no observed incidences of disturbance that caused birds to fly out of the survey area entirely, or to be in flight for prolonged periods of time Birds of prey were the most frequently observed cause of disturbance to foraging or roosting waterbirds. This was followed by aircraft and humans (on foot) (Figure 3 9).
Landbúnaðarháskóli Íslands Andakíll Protected Habitat Area Monitoring 2017 Estuarine Monitoring Final Report 31 | Page
White tailed Eagle, Gyr Falcon, Merlin and Arctic Skua1 were recorded during surveys. The presence of a bird of prey was recorded on 47 occasions (32 surveys), and were observed to cause disturbance to waterbirds on 10 occasions (9 surveys). When one or both of the resident pair of White tailed Eagles were present, they were recorded as a potential source of disturbance to the waterbirds. The eagles were mainly recorded loafing on or close to the eerie or on commuting flights. On three occasions one of both of the pair were observed actively hunting; and Shelducks, Greylag Geese and Lesser Black
Backed Gulls flew to another location within the subsite or to an adjacent subsite. There were two occasions where an Arctic Skua flushed waders, prompting them to move short distances. Similarly, a Gyrfalcon was observed flushing waders and gulls on one occasion. The disturbance caused by particular raptor species is broadly aligned with the predation risk posed by each species. Light aircraft were recorded on seven occasions (six surveys), and caused some birds to relocate within the subsite on two occasions (two surveys) Humans (on foot) were recorded on four occasions (four surveys), and caused some birds to relocate a short distance on one occasion.
No response
Number of potential disturbance events
Some birds relocated within subsite
Birds of prey Aircraft Humans (on foot)
Figure 3-9. Frequency of disturbance sources recorded during weekly low tide and rising tide estuarine surveys in the Andakíll Ramsar site between 12th March and 25th October 2017, including the number of times when the (potential) disturbance source was recorded and the number of occasions when the birds reacted by relocating to another part of the subsite.
1 Due to their kleptoparasitic nature and tendency to harass other seabirds and waterbirds, Arctic Skuas often cause birds to flush. For this reason, they were classed as ‘birds of prey’ for the purpose of the assessment of disturbance factors.
Landbúnaðarháskóli Íslands Andakíll Protected Habitat Area Monitoring 2017 Estuarine Monitoring Final Report 32 | Page
0 5 10 15 20 25 30 35 40
3.7 Species accounts
Wildfowl and allies
Overall, the wildfowl abundance was principally driven by Shelduck, Greylag Geese, Whooper Swans and Teal The increase in the number of wildfowl during April, May and June was mainly driven by the sustained increase in the number of Shelduck. However, the peak numbers of wildfowl recorded in July were due to Greylag Geese and Whooper Swans arriving to moult in the protected area Peaks in wildfowl numbers in August and September are mainly a result of high numbers of Teal. While the numbers of birds recorded during rising tide surveys is generally lower than during low tide surveys, the general trends in abundance are consistent between both survey types (Figure 3 10)
Low-tide Rising-tide
Total number of wildfowl and allies Week number and month
Apr

Figure 3 10 Number of wildfowl and allies recorded during weekly low tide and rising tide estuarine surveys in the Andakíll Ramsar site between 12th March and 25th October 2017.

Landbúnaðarháskóli Íslands Andakíll Protected Habitat Area Monitoring 2017 Estuarine Monitoring Final Report 33 | Page
0 500 1000 1500 2000 2500 10 11 12 13 14 15 16 17 18 19 20 21 22 23 24 25 26 27 28 29 30 31 32 33 34 35 36 37 38 39 40 41 42 43 Mar
May Jun Jul Aug Sep Oct
Greylag Goose
Anser anser
Grágæs


Greylag Geese were recorded in low numbers on the estuary throughout the spring, with generally less than 20 birds recorded on each survey during April and May. No dedicated effort was made to search for or quantify the numbers of nesting pairs, but three nests were located on islands within the estuary on 3rd June (clutch sizes: 3, 4, and 6). The first sightings of goslings in the survey area were on 6th June. The highest number of family groups was recorded during a single survey was on 24th July, when 12 families were observed. Throughout June, July and August, brood sizes between one and eight were recorded. Adult numbers increased from the second week of June and peaked in July, with 502 birds recorded in mid July. Kistufjörđur (Est 2) was the most important subsite during autumn for this moulting flock. They were most often recorded roosting (/loafing) during surveys, presumably taking the refuge on the open water by day and foraging on the coastal and terrestrial vegetation in the vicinity of the Kistufjörđur by night, but this was not confirmed in the field. The vast majority of Greylag Geese had emigrated by the first week in September. From 6th September onwards, counts were lower than 60 birds per survey, and there were no birds recorded after 2nd October.
Low-tide Rising-tide
of Anser anser recorded during weekly low tide and rising tide estuarine surveys in the Andakíll Ramsar site between
Landbúnaðarháskóli Íslands Andakíll Protected Habitat Area Monitoring 2017 Estuarine Monitoring Final Report 34 | Page
Figure 3 11. Number
12th March and 25th October 2017. 0 100 200 300 400 500 600 10 11 12 13 14 15 16 17 18 19 20 21 22 23 24 25 26 27 28 29 30 31 32 33 34 35 36 37 38 39 40 41 42 43 Mar Apr May Jun Jul Aug Sep Oct Number of individuals
Week
number
and month
(a) Low tide
(b) Rising tide
Figure 3 12. Relative abundance of Anser anser during weekly (a) low tide and (b) rising tide estuarine surveys in the Andakíll Ramsar site between 12th March and 25th October 2017. Dots are randomly positioned within each subsite. While each dot refers to a single bird, it refers to the bird’s presence in that subsite only, and not the bird’s actual location.
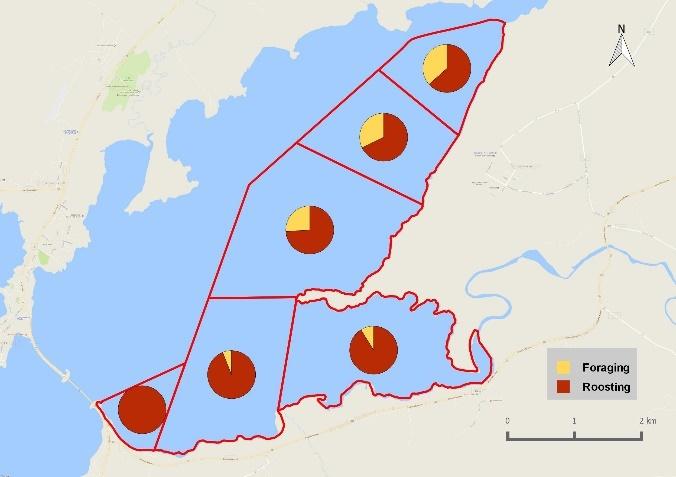
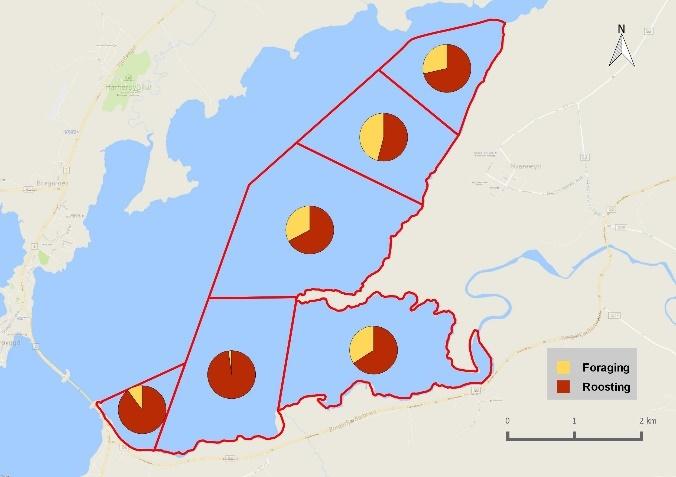
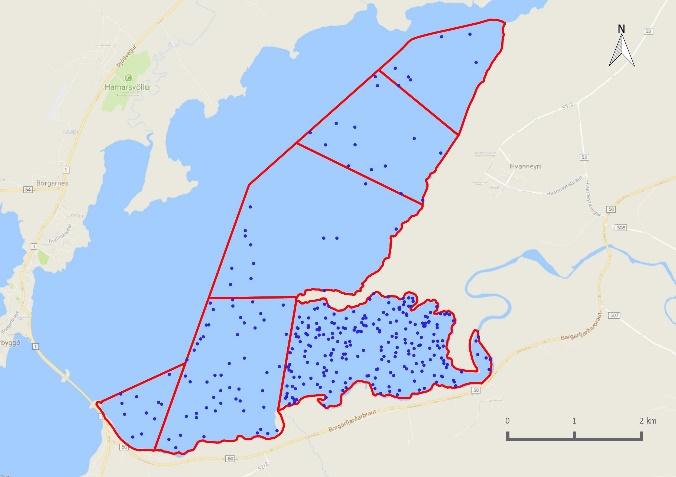

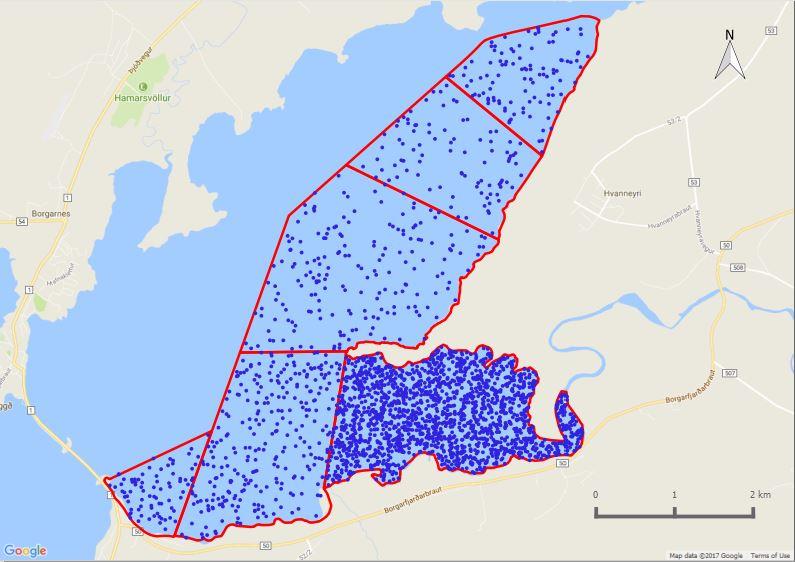
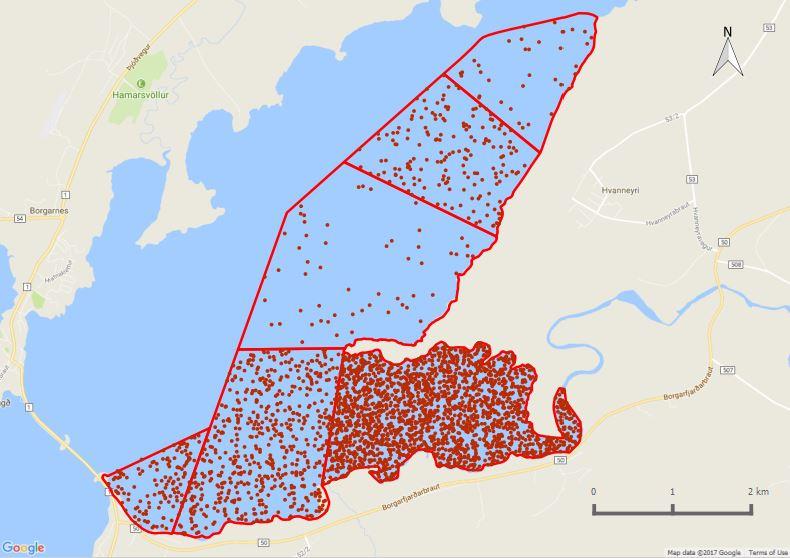
(a) Spring
(b) Autumn
Figure 3 13. Relative abundance during (a) spring and (b) autumn of Anser anser counted on twice weekly estuarine surveys in the Andakíll Ramsar site in 2017. Spring = 12th March 7th June; Autumn = 12th June 25th October. The number of dots in each subsite refers to the total number of bird records (from weekly low tide and rising tide surveys) in spring and autumn, adjusted for the length of the season, and reflects the species’ abundance in that season, not the specific location of birds.
(a) Low tide
(b) Rising tide
Figure 3 14 Proportion of foraging and roosting Anser anser during weekly (a) low tide and (b) rising tide estuarine surveys in six subsites in the Andakíll Ramsar site between 12th March and 25th October 2017.
Landbúnaðarháskóli Íslands Andakíll Protected Habitat Area Monitoring 2017 Estuarine Monitoring Final Report 35 | Page
Pink footed Goose
Anser brachyrhynchus


Heiðagæs
The only record of Pink footed Geese was recorded in Flæðhöfðasker (Est 6) during the low tide survey on 7th June, when a single individual was observed. However, small numbers were observed foraging in the hay meadows on Hvanneyri farm with Greenland White fronted Geese during spring and autumn. Season maxima of 6 and 13 birds were recorded in spring and autumn respectively (Tierney & Stroud, 2018).
Greenland White fronted Goose Anser albifrons flavirostris
Blesgæs
The Andakíll Ramsar site is an important stopover site for this species during spring and autumn, and this contributed significantly to the designation of the site under the Ramsar Convention (Thrainsson et al. 2013). The site provides the full range of different functional habitats needed by the birds: the estuarine component of the Ramsar site is the principal night time roosting area and the agricultural areas the principal foraging areas On Hvanneyri farm in 2017, average numbers of 808 and 1,584 individuals were recorded during spring (24th March 10th May) and autumn (6th September 3rd November), respectively (Tierney and Stroud, 2018).
Greenland White fronted Geese were occasionally recorded during estuarine surveys in spring and autumn. During spring staging, small flocks (<50 birds) were recorded in Ásgarđshöfđi (Est 4) and Hvítárleirur (Est 5). On two surveys during the autumn staging period, flocks of greater than 160 birds were recorded on Ásgarđshöfđi (Est 4). These day time congregations are generally short lived and occur as a result of farm activity or another disturbance at their foraging areas in the hay meadows, which are c. 1 km away. A comprehensive account on this species in the Andakíll Ramsar site in 2017 is provided by Tierney and Stroud (2018). This includes arrival and departure dates, daily numbers at Hvanneyri farm during the spring and autumn staging periods, and detail on fattening rates during spring and the age profile (proportion of adults and juveniles) of the flock in the autumn.
Low-tide Rising-tide
Landbúnaðarháskóli Íslands Andakíll Protected Habitat Area Monitoring 2017 Estuarine Monitoring Final Report 36 | Page
Figure 3 15. Number of Anser
albifrons flavirostris recorded during
weekly
low tide and rising tide estuarine surveys in
the
Andakíll Ramsar site between
12th March and 25th
October 2017.
0 50 100 150 200 10 11 12 13 14 15 16 17 18 19 20 21 22 23 24 25 26 27 28 29 30 31 32 33 34 35 36 37 38 39 40 41 42 43 Mar Apr May Jun Jul Aug Sep Oct Number of individuals Week number and month
(a) Low tide
(b) Rising tide
Figure 3 16. Relative abundance of Anser albifrons flavirostris during weekly (a) low tide and (b) rising tide estuarine surveys in the Andakíll Ramsar site between 12th March and 25th October 2017. Dots are randomly positioned within each subsite. While each dot refers to a single bird, it refers to the bird’s presence in that subsite only, and not the bird’s actual location.
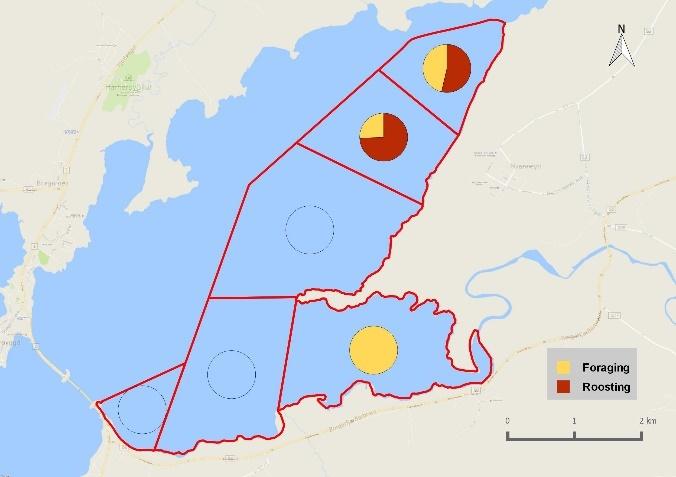
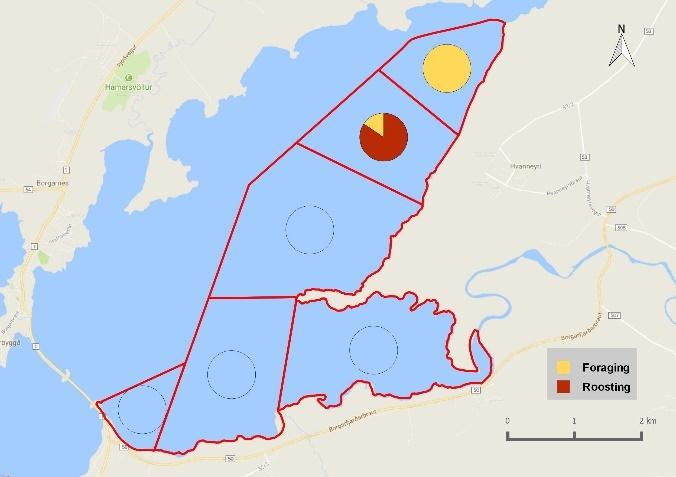

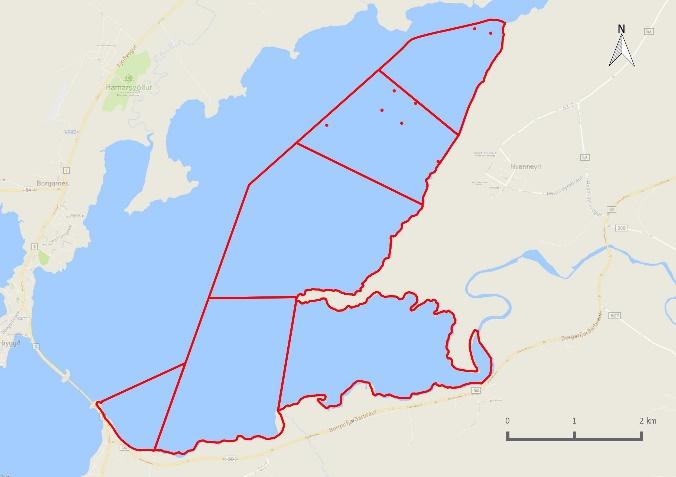
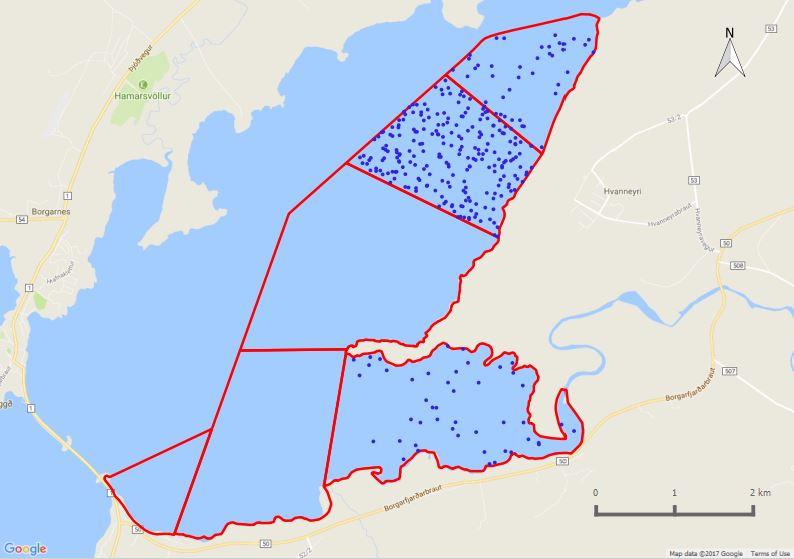
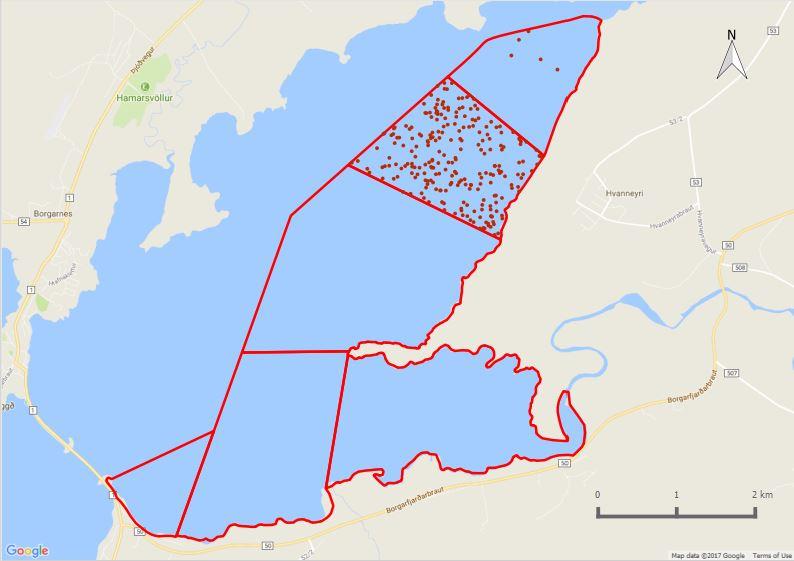
(a) Spring
(b) Autumn
Figure 3 17. Relative abundance during (a) spring and (b) autumn of Anser albifrons flavirostris counted on twice weekly estuarine surveys in the Andakíll Ramsar site in 2017. Spring = 12th March 7th June; Autumn = 12th June 25th October. The number of dots in each subsite refers to the total number of bird records (from weekly low tide and rising tide surveys) in spring and autumn, adjusted for the length of the season, and reflects the species’ abundance in that season, not the specific location of birds.
(a) Low tide
(b) Rising tide
Figure 3 18. Proportion of foraging and roosting Anser albifrons flavirostris during weekly (a) low tide and (b) rising tide estuarine surveys in six subsites in the Andakíll Ramsar site between 12th March and 25th October 2017.
Landbúnaðarháskóli Íslands Andakíll Protected Habitat Area Monitoring 2017 Estuarine Monitoring Final Report 37 | Page
Whooper Swan
Cygnus cygnus Álft


Whooper Swans were recorded in low numbers throughout the spring, with generally fewer than 10 birds recorded during March, April and May. No dedicated effort was made to search for or quantify the numbers of nesting swans. However, several territorial pairs were detected (<10) within the Ramsar site. The first sightings of cygnets in the survey area were on 12th June, and broods of two, three and four cygnets were observed from June through to October. Adult numbers increased from the second week of June and peaked in the last week of July, when 399 birds were recorded. These moulting birds were most often located in Kistufjörđur (Est 2) and Grjóteyrarklakkur (Est 1), but the other subsites were also used, especially during rising tide surveys. They were most often recorded roosting (/loafing) during surveys, and presumably moved from the water to forage on coastal and terrestrial vegetation in adjacent areas by night, however, this was not confirmed in the field. By the first week of September, the vast majority of the swans had emigrated, and last record on the estuary was a single swan on 11th October.
Low-tide Rising-tide
of individuals Week number and month
Figure 3 19. Number of Cygnus cygnus recorded during weekly low tide and rising tide estuarine surveys in the Andakíll Ramsar site between 12th March and 25th October 2017.
Figure 3 20. Relative abundance of Cygnus cygnus during weekly (a) low tide and (b) rising tide estuarine surveys in the Andakíll Ramsar site between 12th March and 25th October 2017. Dots are randomly positioned within each subsite. While each dot refers to a single bird, it refers to the bird’s presence in that subsite only, and not the bird’s actual location.
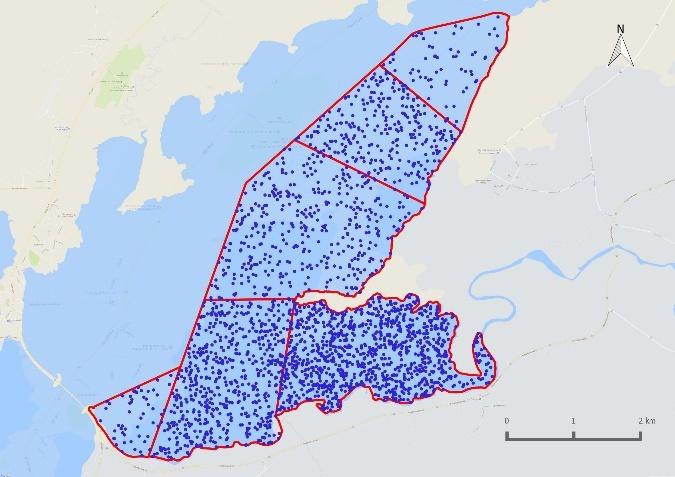
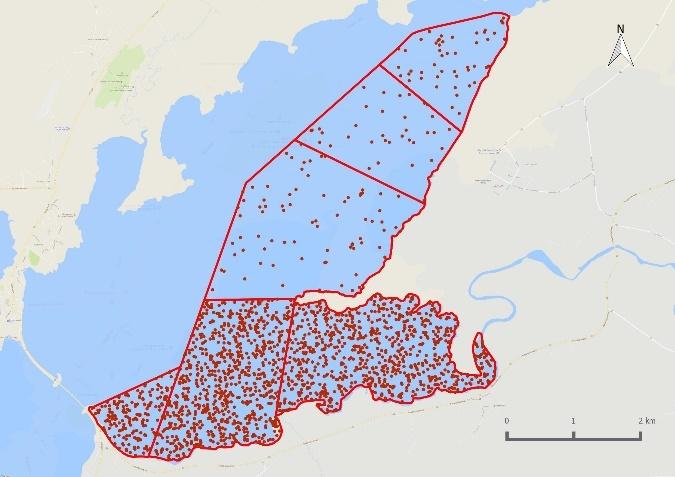
Landbúnaðarháskóli Íslands Andakíll Protected Habitat Area Monitoring 2017 Estuarine Monitoring Final Report 38 | Page
0 100 200 300 400 500 10 11 12 13 14 15 16 17 18 19 20 21 22 23 24 25 26 27 28 29 30 31 32 33 34 35 36 37 38 39 40 41 42 43 Mar Apr May Jun Jul Aug Sep Oct Number
(a) Low tide (b) Rising tide
(a) Spring
(b) Autumn
Figure 3 21. Relative abundance during (a) spring and (b) autumn of Cygnus Cygnus counted on twice weekly estuarine surveys in the Andakíll Ramsar site in 2017. Spring = 12th March 7th June; Autumn = 12th June 25th October. The number of dots in each subsite refers to the total number of bird records (from weekly low tide and rising tide surveys) in spring and autumn, adjusted for the length of the season, and reflects the species’ abundance in that season, not the specific location of birds.
(a) Low tide
(b) Rising tide
Figure 3 22 Proportion of foraging and roosting Cygnus cygnus during weekly (a) low tide and (b) rising tide estuarine surveys in six subsites in the Andakíll Ramsar site between 12th March and 25th October 2017.
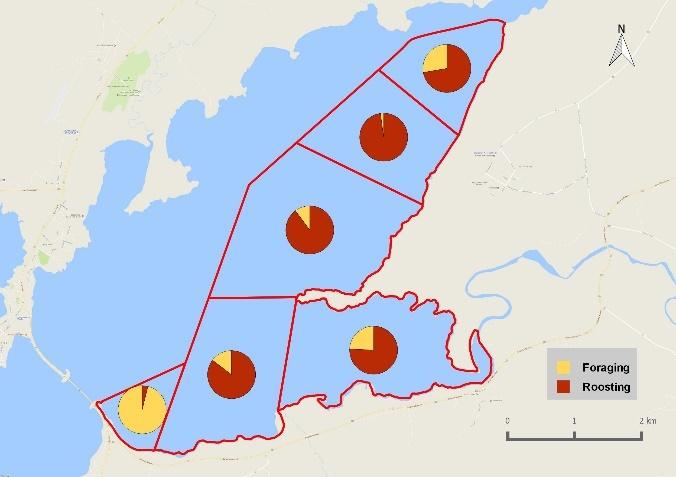


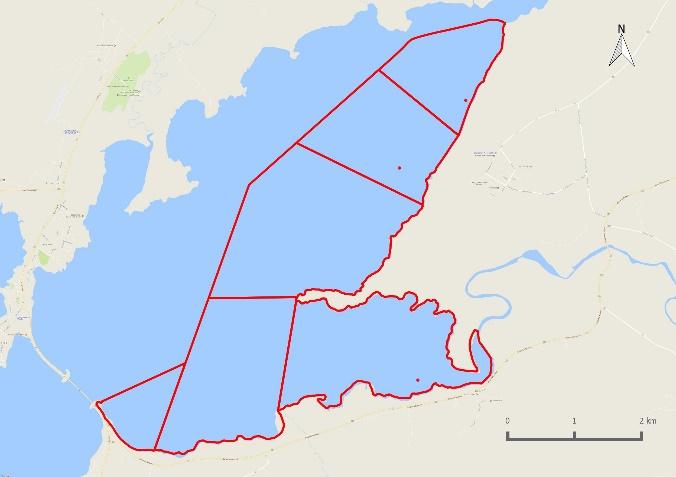
Landbúnaðarháskóli Íslands Andakíll Protected Habitat Area Monitoring 2017 Estuarine Monitoring Final Report 39 | Page
Common Shelduck Tadorna tadorna Brandönd
Shelduck were present on the estuary during all surveys. Numbers rose during March and there were c. 200 birds present throughout April. Numbers rose again throughout May and June and peaked at 1,368 in the last week of June. Numbers gradually declined throughout August, September and October, and there were 100 birds recorded on the last survey of the season, on 25th October. In 2019, two additional surveys on 12th and 18th October resulted in totals of 1,176 and 1,025 birds, respectively. These counts are unprecedented, both in scale and timing. This disparity in October numbers between 2017 and 2019 suggest considerable interannual differences in migratory behaviour.
While Shelduck were recorded in each of the six subsites during low tide and rising tide surveys, greatest numbers were routinely found in Kistufjörđur (Est 2) and Ásgarđshöfđi (Est 4). There was increased usage of Ásgarđshöfđi (Est 4) in the autumn, compared to the spring. It is not clear whether this expansion (into Ásgarđshöfđi (Est 4)) was driven by new, seasonal availability of food there, increased feeding competition in Kistufjörđur (Est 2), immigration of new birds into the estuary, or other factors. Birds were most often recorded as foraging during low tide surveys and roosting during rising tide surveys, with the exception of Ásgarđshöfđi (Est 4), where birds were more frequently recorded as foraging during rising tide surveys.

The Ramsar site supports the biggest aggregations of Shelduck in Iceland and an estimated 158 breeding pairs (Tierney et al. 2020).

Low-tide Rising-tide
Landbúnaðarháskóli Íslands Andakíll Protected Habitat Area Monitoring 2017 Estuarine Monitoring Final Report 40 | Page
Figure 3 23. Number of Tadorna tadorna recorded during weekly low tide and
rising
tide
estuarine surveys
in the Andakíll Ramsar site between 12th March and 25th October 2017. 0 200 400 600 800 1000 1200 1400 1600 10 11 12 13 14 15 16 17 18 19 20 21 22 23 24 25 26 27 28 29 30 31 32 33 34 35 36 37 38 39 40 41 42 43 Mar Apr May Jun Jul Aug Sep Oct Numebr of individuals Week number and month
(a) Low tide
(b) Rising tide
Figure 3 24. Relative abundance of Tadorna tadorna during weekly (a) low tide and (b) rising tide estuarine surveys in the Andakíll Ramsar site between 12th March and 25th October 2017. Dots are randomly positioned within each subsite. While each dot refers to a single bird, it refers to the bird’s presence in that subsite only, and not the bird’s actual location.
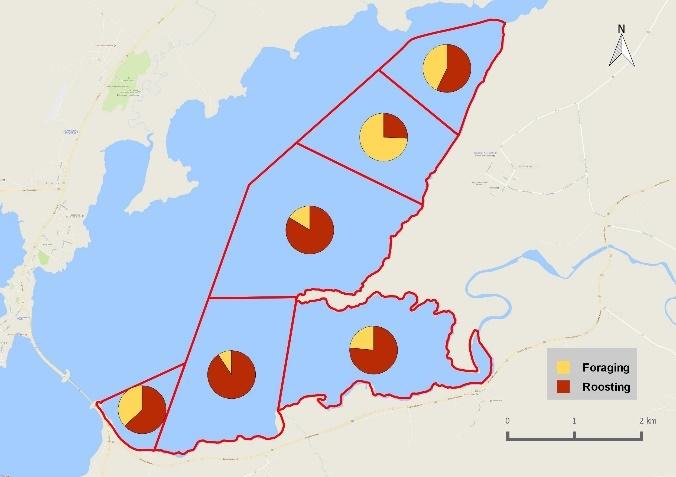
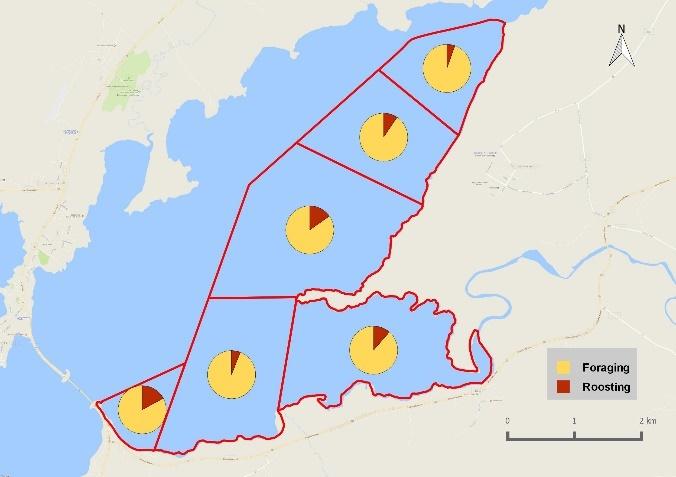
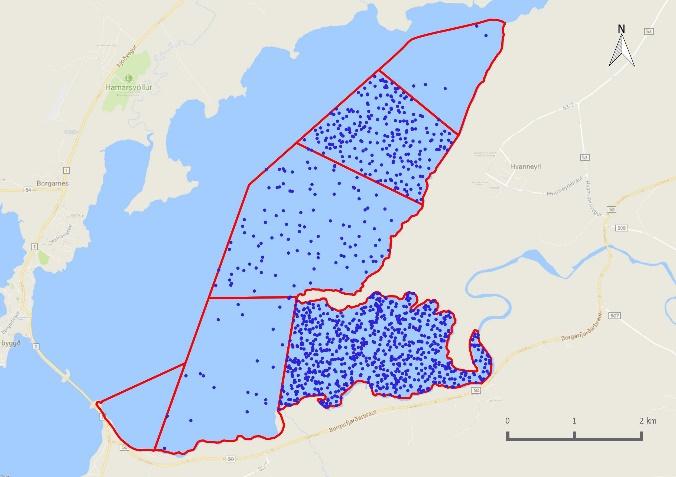
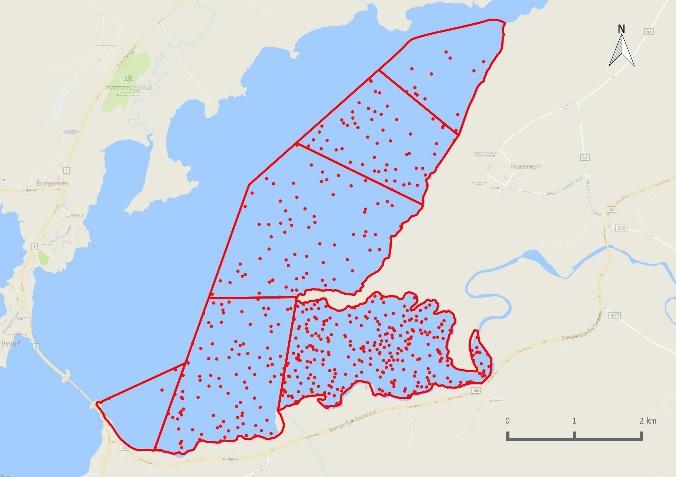
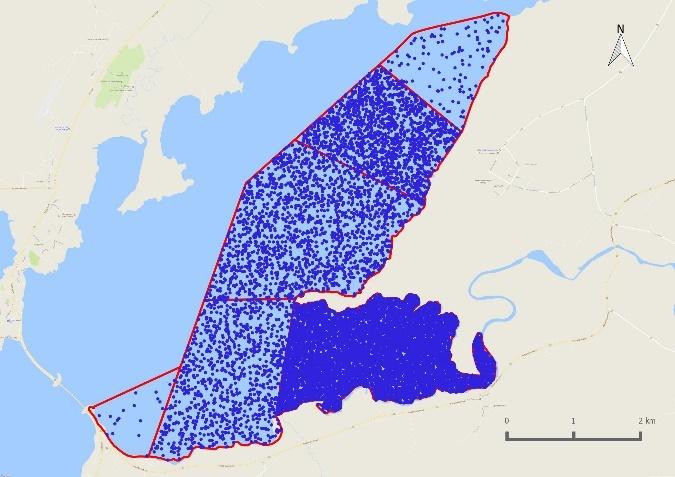
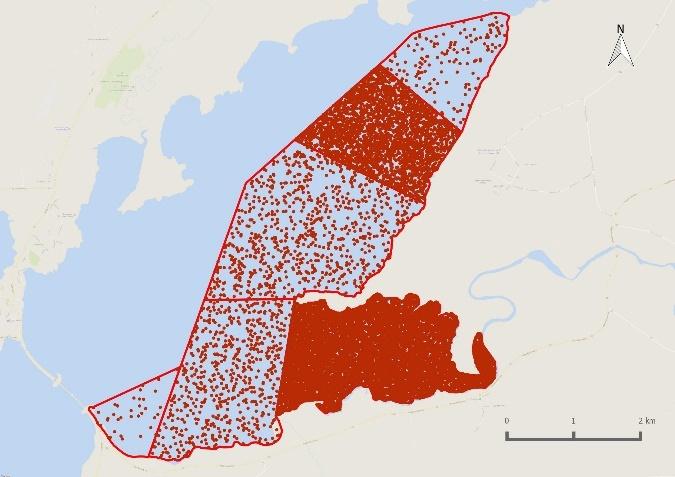
(a) Spring
(b) Autumn
Figure 3-25. Relative abundance during (a) spring and (b) autumn of Tadorna tadorna counted on twice weekly estuarine surveys in the Andakíll Ramsar site in 2017. Spring = 12th March 7th June; Autumn = 12th June 25th October. The number of dots in each subsite refers to the total number of bird records (from weekly low tide and rising tide surveys) in spring and autumn, adjusted for the length of the season, and reflects the species’ abundance in that season, not the specific location of birds.
(a) Low tide
(b) Rising tide
Figure 3 26. Proportion of foraging and roosting Tadorna tadorna during weekly (a) low tide and (b) rising tide estuarine surveys in six subsites in the Andakíll Ramsar site between 12th March and 25th October 2017.
Landbúnaðarháskóli Íslands Andakíll Protected Habitat Area Monitoring 2017 Estuarine Monitoring Final Report 41 | Page
Eurasian Wigeon
Mareca penelope
Rauðhöfðaönd
Wigeon were recorded sporadically between March and August, until an influx in late August. During September and October, Wigeon were recorded on all surveys except one. A peak of 148 birds was recorded in early October. They were well distributed across the site being recorded in all but two subsites during low tide survey, and all but one during rising tide surveys. The peak in late June/July may represent moulting males (and non breeders) (Delany et al. 2006). The late August influx may represent moulting females, or staging ahead of onward migration to North America or Western Europe (BirdLife International 2020).
Low-tide Rising-tide
of individuals
number and month


Figure 3 27. Number of Mareca penelope recorded during weekly low tide and rising tide estuarine surveys in the Andakíll Ramsar site between 12th March and 25th October 2017.
Figure 3-28. Relative abundance of Mareca penelope during weekly (a) low tide and (b) rising tide estuarine surveys in the Andakíll Ramsar site between 12th March and 25th October 2017. Dots are randomly positioned within each subsite. While each dot refers to a single bird, it refers to the bird’s presence in that subsite only, and not the bird’s actual location.


Landbúnaðarháskóli Íslands Andakíll Protected Habitat Area Monitoring 2017 Estuarine Monitoring Final Report 42 | Page
0 20 40 60 80 100 120 140 160 10 11 12 13 14 15 16 17 18 19 20 21 22 23 24 25 26 27 28 29 30 31 32 33 34 35 36 37 38 39 40 41 42 43 Mar Apr May Jun Jul Aug Sep Oct Number
Week
(a) Low tide (b) Rising tide
(a) Spring
(b) Autumn
Figure 3 29. Relative abundance during (a) spring and (b) autumn of Mareca penelope counted on twice weekly estuarine surveys in the Andakíll Ramsar site in 2017. Spring = 12th March 7th June; Autumn = 12th June 25th October. The number of dots in each subsite refers to the total number of bird records (from weekly low tide and rising tide surveys) in spring and autumn, adjusted for the length of the season, and reflects the species’ abundance in that season, not the specific location of birds.
(a) Low tide
(b) Rising tide
Figure 3 30 Proportion of foraging and roosting Mareca penelope during weekly (a) low tide and (b) rising tide estuarine surveys in six subsites in the Andakíll Ramsar site between 12th March and 25th October 2017.


Landbúnaðarháskóli Íslands Andakíll Protected Habitat Area Monitoring 2017 Estuarine Monitoring Final Report 43 | Page
Mallard
Anas platyrhynchos Stokkönd
Mallard occurred on all surveys but were generally observed in low numbers (< 30). A peak of 106 birds was recorded in late June. Mallards were recorded feeding and roosting in all of the subsites during low tide and rising tide surveys but were most commonly recorded in Grjóteyrarklakkur (Est 1) and Kistufjörđur (Est 2). There were c. 20 Mallard present during the last surveys in late October.
Low-tide Rising-tide
Number of Individuals


Figure 3 31. Number of Anas platyrhynchos recorded during weekly low tide and rising tide estuarine surveys in the Andakíll Ramsar site between 12th March and 25th October 2017.
(a) Low tide (b) Rising tide
Figure 3 32. Relative abundance of Anas platyrhynchos during weekly (a) low tide and (b) rising tide estuarine surveys in the Andakíll Ramsar site between 12th March and 25th October 2017. Dots are randomly positioned within each subsite. While each dot refers to a single bird, it refers to the bird’s presence in that subsite only, and not the bird’s actual location.
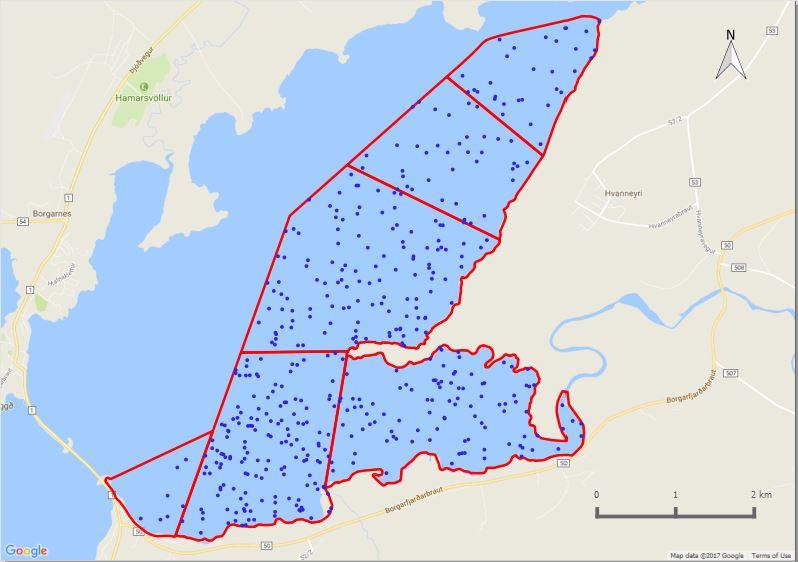
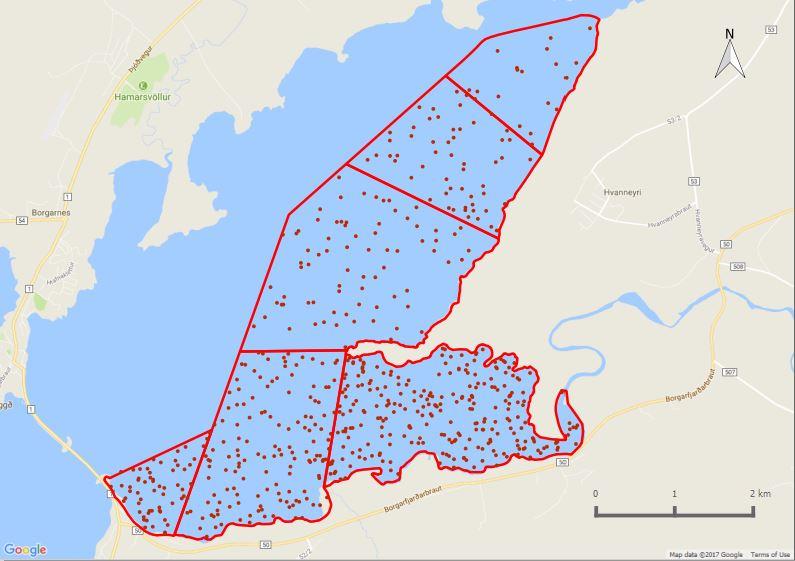
Landbúnaðarháskóli Íslands Andakíll Protected Habitat Area Monitoring 2017 Estuarine Monitoring Final Report 44 | Page
0 20 40 60 80 100 120 10 11 12 13 14 15 16 17 18 19 20 21 22 23 24 25 26 27 28 29 30 31 32 33 34 35 36 37 38 39 40 41 42 43 Mar Apr May Jun Jul Aug Sep Oct
(a) Spring
(b) Autumn
Figure 3 33. Relative abundance during (a) spring and (b) autumn of Anas platyrhynchos counted on twice weekly estuarine surveys in the Andakíll Ramsar site in 2017. Spring = 12th March 7th June; Autumn = 12th June 25th October. The number of dots in each subsite refers to the total number of bird records (from weekly low tide and rising tide surveys) in spring and autumn, adjusted for the length of the season, and reflects the species’ abundance in that season, not the specific location of birds.
(a) Low tide
(b) Rising tide
Figure 3 34 Proportion of foraging and roosting Anas platyrhynchos during weekly (a) low tide and (b) rising tide estuarine surveys in six subsites in the Andakíll Ramsar site between 12th March and 25th October 2017.
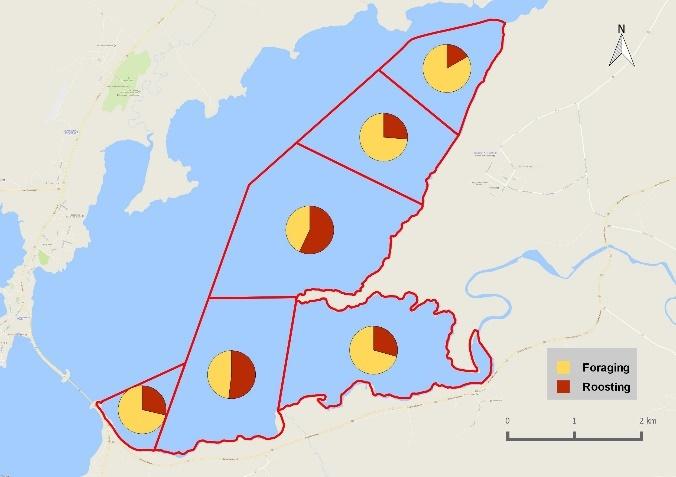
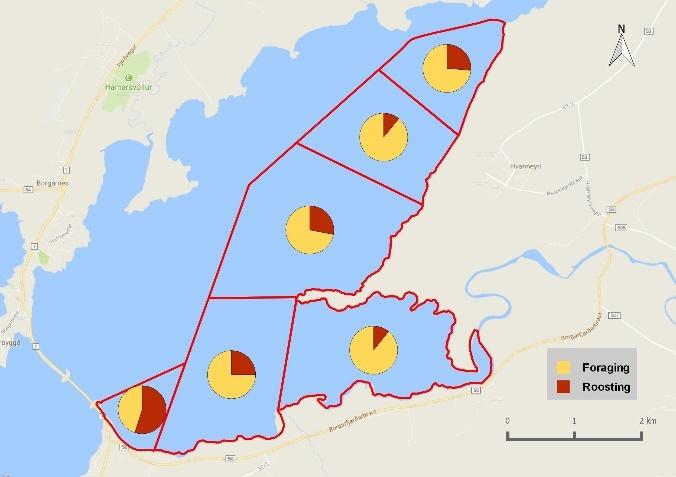


Northern Pintail
Anas acuta
Grafönd
Pintail occurred in low numbers, with a peak of nine on the rising tide survey on the 19th June. Otherwise, three sightings of two individuals occurred in April and June.
Landbúnaðarháskóli Íslands Andakíll Protected Habitat Area Monitoring 2017 Estuarine Monitoring Final Report 45 | Page
Eurasian Teal
Anas crecca Urtönd
Teal were recorded in low numbers (< 50 birds), sporadically, until the end of July. Numbers grew throughout August and peaked at 1,327 birds on 30th August. These numbers were sustained through September (c. 900 birds). There were 200 400 birds recorded during October. The Icelandic population of Teal is estimated at 3,000 5,000 breeding pairs (Skarphéðinsson et al 2006). Therefore, the numbers recorded in late August and September represent a significant proportion of the national population. Birds were most often recorded in Kistufjörđur (Est 2) during both low tide and rising tide surveys.
Low-tide Rising-tide
of


Week number and month
Figure 3 35. Number of Anas crecca recorded during weekly low tide and rising tide estuarine surveys in the Andakíll Ramsar site between 12th March and 25th October 2017.
Low tide
Figure 3 36. Relative abundance of Anas crecca during weekly (a) low tide and (b) rising tide estuarine surveys in the Andakíll Ramsar site between 12th March and 25th October 2017. Dots are randomly positioned within each subsite. While each dot refers to a single bird, it refers to the bird’s presence in that subsite only, and not the bird’s actual location.


Landbúnaðarháskóli Íslands Andakíll Protected Habitat Area Monitoring 2017 Estuarine Monitoring Final Report 46 | Page
0 200 400 600 800 1000 1200 1400 10 11 12 13 14 15 16 17 18 19 20 21 22 23 24 25 26 27 28 29 30 31 32 33 34 35 36 37 38 39 40 41 42 43 Mar Apr May Jun Jul Aug Sep Oct Number
individuals
(a)
(b) Rising tide
(a) Spring
(b) Autumn
Figure 3 37. Relative abundance during (a) spring and (b) autumn of Anas crecca counted on twice weekly estuarine surveys in the Andakíll Ramsar site in 2017. Spring = 12th March 7th June; Autumn = 12th June 25th October. The number of dots in each subsite refers to the total number of bird records (from weekly low tide and rising tide surveys) in spring and autumn, adjusted for the length of the season, and reflects the species’ abundance in that season, not the specific location of birds.
(a) Low tide
(b) Rising tide
Figure 3 38 Proportion of foraging and roosting Anas crecca during weekly (a) low tide and (b) rising tide estuarine surveys in six subsites in the Andakíll Ramsar site between 12th March and 25th October 2017.


Landbúnaðarháskóli Íslands Andakíll Protected Habitat Area Monitoring 2017 Estuarine Monitoring Final Report 47 | Page
Greater Scaup Aythya marila Duggönd
Small numbers of Scaup were recorded between mid May and mid August, with a peak of 15 birds on 19th July. Scaup were almost exclusively recorded in Kistufjörđur (Est 2).
Low-tide Rising-tide
of


Mar
Week number and month
Figure 3-39. Number of Aythya marila recorded during weekly low tide and rising tide estuarine surveys in the Andakíll Ramsar site between 12th March and 25th October 2017.
(a) Low tide
Rising tide
Figure 3-40. Relative abundance of Aythya marila during weekly (a) low tide and (b) rising tide estuarine surveys in the Andakíll Ramsar site between 12th March and 25th October 2017. Dots are randomly positioned within each subsite. While each dot refers to a single bird, it refers to the bird’s presence in that subsite only, and not the bird’s actual location.

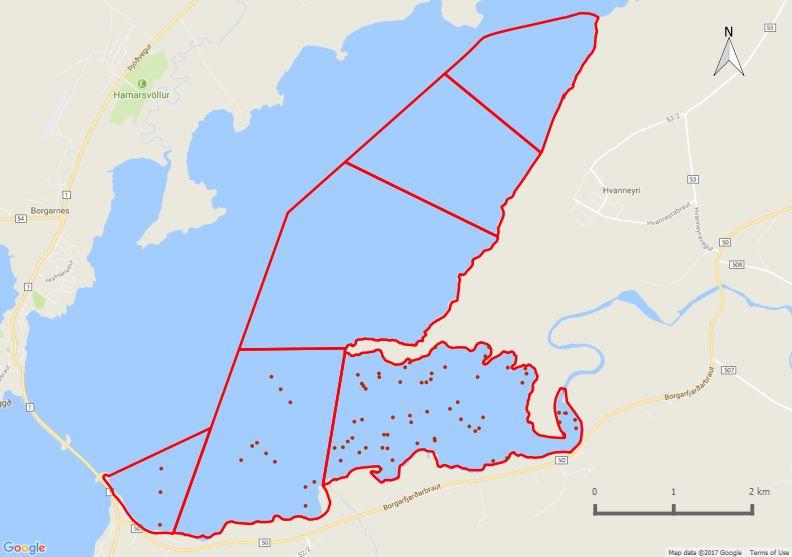
Landbúnaðarháskóli Íslands Andakíll Protected Habitat Area Monitoring 2017 Estuarine Monitoring Final Report 48 | Page
0 2 4 6 8 10 12 14 16 10 11 12 13 14 15 16 17 18 19 20 21 22 23 24 25 26 27 28 29 30 31 32 33 34 35 36 37 38 39 40 41 42 43
Apr May Jun Jul Aug Sep Oct Number
individuals
(b)
Autumn
Figure 3 41. Relative abundance during (a) spring and (b) autumn of Aythya marila counted on twice weekly estuarine surveys in the Andakíll Ramsar site in 2017. Spring = 12th March 7th June; Autumn = 12th June 25th October. The number of dots in each subsite refers to the total number of bird records (from weekly low tide and rising tide surveys) in spring and autumn, adjusted for the length of the season, and reflects the species’ abundance in that season, not the specific location of birds.
Common Eider Somateria mollissima
Æðarfugl

Eider were not numerous within the survey area and there were generally 10 15 birds recorded per survey. The highest number of birds was recorded in the last week of April, and the last record occurred on the first week of October. Eider showed a strong preference for Flæðhöfðasker (Est 6), which is adjacent to Borgarnes Bridge, the west side of which is a popular area for Eider. Small Eider ducklings were observed in the survey area on 21st June. Due to their small size, these birds must have hatched near to, or in, the Ramsar site, but no nests were found.
Low-tide Rising-tide
Figure 3 42. Number of Somateria mollissima recorded during weekly low tide and rising tide estuarine surveys in the Andakíll Ramsar site between 12th March and 25th October 2017.


Landbúnaðarháskóli Íslands Andakíll Protected Habitat Area Monitoring 2017 Estuarine Monitoring Final Report 49 | Page
0 10 20 30 40 50 60 10 11 12 13 14 15 16 17 18 19 20 21 22 23 24 25 26 27 28 29 30 31 32 33 34 35 36 37 38 39 40 41 42 43 Mar Apr May Jun Jul Aug Sep Oct Number of individuals Week number and month
(a) Spring (b)
Low tide
Rising tide
Figure 3 43. Relative abundance of Somateria mollissima during weekly (a) low tide and (b) rising tide estuarine surveys in the Andakíll Ramsar site between 12th March and 25th October 2017. Dots are randomly positioned within each subsite. While each dot refers to a single bird, it refers to the bird’s presence in that subsite only, and not the bird’s actual location.


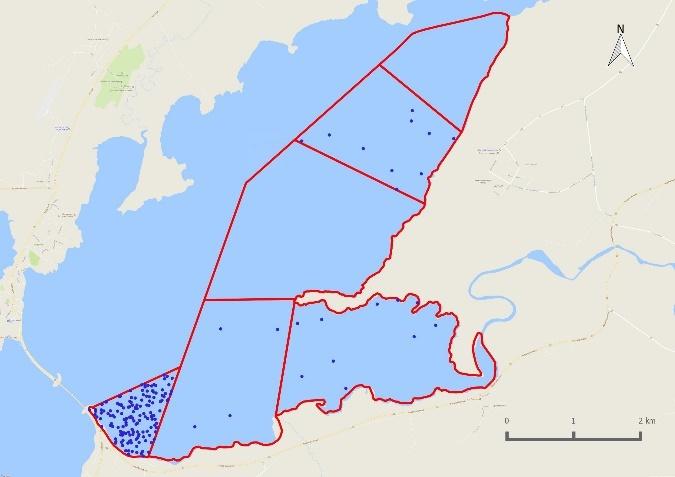
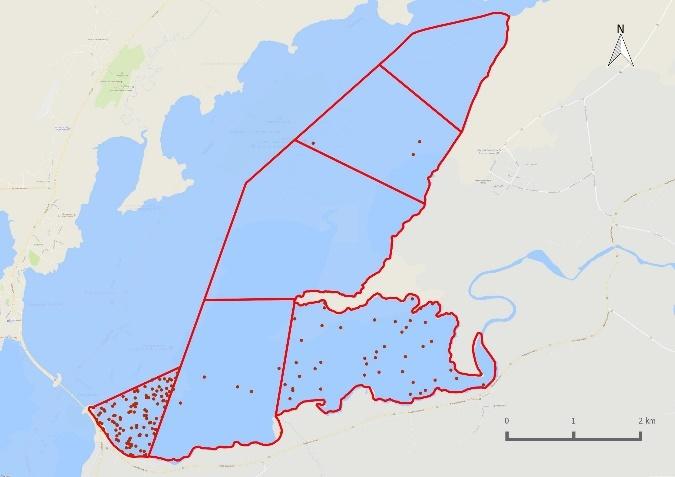
Harlequin Duck Histrionicus histrionicus Straumönd
Harlequin Duck occurred in low numbers on the site with a peak of two individuals on the low tide survey on 12th June, and two records of one individual on the rising tide surveys on 5th June and 18th September.
Long tailed Duck Clangula hyemalis Hávella
Long tailed Ducks were recorded between mid April and the end of June, with a peak of 66 birds in the last week of April. There were no records after June. They were recorded in the southern three subsites: Flæðhöfðasker (Est 6), Grjóteyrarklakkur (Est 1) and Kistufjörđur (Est 2), during low tide surveys, and during rising tide surveys they were also recorded in Ásgarđshöfđi (Est 4).
Low-tide Rising-tide
Week number and month
Figure 3 44. Number of Clangula hyemalis recorded during weekly low tide and rising tide estuarine surveys in the Andakíll Ramsar site between 12th March and 25th October 2017.
Landbúnaðarháskóli Íslands Andakíll Protected Habitat Area Monitoring 2017 Estuarine Monitoring Final Report 50 | Page
0 10 20 30 40 50 60 70 10 11 12 13 14 15 16 17 18 19 20 21 22 23 24 25 26 27 28 29 30 31 32 33 34 35 36 37 38 39 40 41 42 43 Mar Apr May Jun Jul Aug Sep Oct Number of individuals
(a)
(b)
(a) Low tide
Rising tide
Figure 3 45. Relative abundance of Clangula hyemalis during weekly (a) low tide and (b) rising tide estuarine surveys in the Andakíll Ramsar site between 12th March and 25th October 2017. Dots are randomly positioned within each subsite. While each dot refers to a single bird, it refers to the bird’s presence in that subsite only, and not the bird’s actual location.
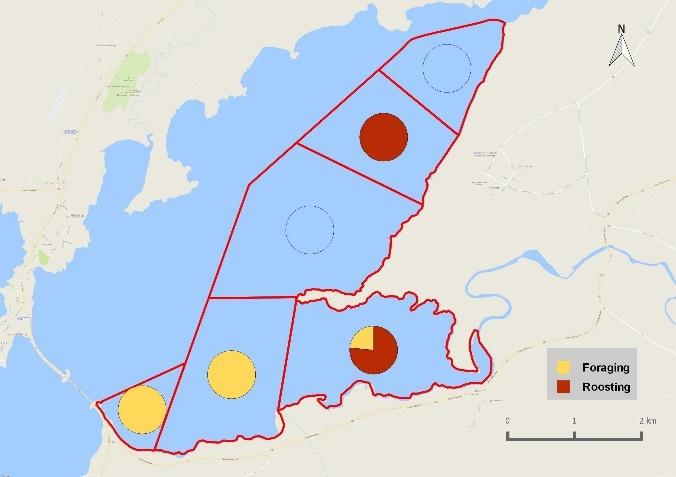
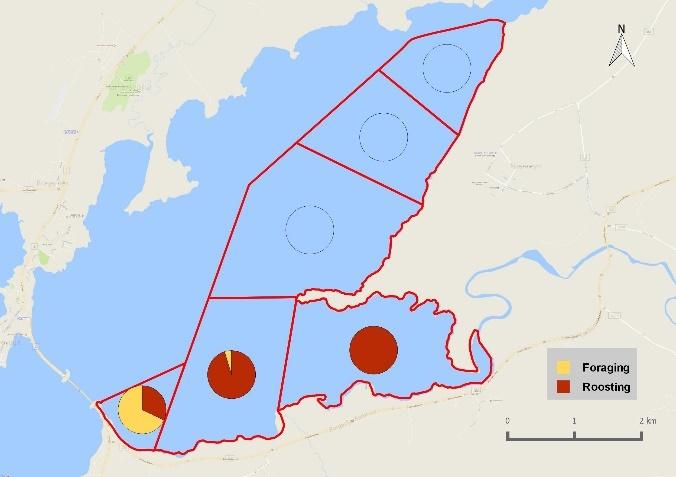


(a) Low tide
Rising tide
Figure 3-46. Proportion of foraging and roosting Clangula hyemalis during weekly (a) low tide and (b) rising tide estuarine surveys in six subsites in the Andakíll Ramsar site between 12th March and 25th October 2017.
Barrow's Golden Eye
Bucephala islandica
Húsönd
There were three sightings of individual Barrow’s Golden Eye throughout the survey period. These occurred on 10th and 17th July and 11th September.
Landbúnaðarháskóli Íslands Andakíll Protected Habitat Area Monitoring 2017 Estuarine Monitoring Final Report 51 | Page
(b)
(b)
Goosander
Mergus merganser Gulönd
Apart from a record of three Goosanders on 21st March, there were no Goosanders recorded until September. The majority of birds were recorded in October, with a peak of 35 birds during a rising tide survey on the 11th . Goosanders were mainly found foraging in the main channels of the Hvítá and Andakílsá rivers. With a national population estimate of 100 300 breeding pairs (Skarphéðinsson et al 2006) the site supported an important proportion of the national population in October.
Low-tide Rising-tide
Apr May
Week number and month
Figure 3-47 Number of Mergus merganser recorded during weekly low tide and rising tide estuarine surveys in the Andakíll Ramsar site between 12th March and 25th October 2017.
Figure 3-48. Relative abundance of Mergus merganser during weekly (a) low tide and (b) rising tide estuarine surveys in the Andakíll Ramsar site between 12th March and 25th October 2017. Dots are randomly positioned within each subsite. While each dot refers to a single bird, it refers to the bird’s presence in that subsite only, and not the bird’s actual location.


Landbúnaðarháskóli Íslands Andakíll Protected Habitat Area Monitoring 2017 Estuarine Monitoring Final Report 52 | Page
0 5 10 15 20 25 30 35 40 10 11 12 13 14 15 16 17 18 19 20 21 22 23 24 25 26 27 28 29 30 31 32 33 34 35 36 37 38 39 40 41 42 43 Mar
Jun Jul Aug Sep Oct Number of individuals
(a) Low tide (b) Rising tide
Low tide
(b) Rising tide


Red breasted Merganser Mergus serrator
Toppönd
There were three Red breasted Mergansers recorded in the first week of March. They were not subsequently present in the estuary until the third week of April, after which their numbers gradually increased throughout May and June. There was a notable increase in July, presumably as birds arrived to moult, and numbers peaked at 320 on 7th August. As no surveys were conducted over a two week period in late August, the pattern of abundance during this period is unknown. However, with an estimated 2,000 4,000 breeding pairs in Iceland (Skarphéðinsson et al 2006), the site supported an important proportion of the population. There is a sustained decline in numbers from 30th August onwards and most of the birds had emigrated by the end of September. A single Red breasted Merganser was recorded on the final rising tide survey on 25th October. During low tides the birds favoured the southern portion of the site: Flæðhöfðasker (Est 6), Grjóteyrarklakkur (Est 1) and Kistufjörđur (Est 2), but they were also recorded in Ásgarđshöfđi (Est 4) during rising tide surveys.
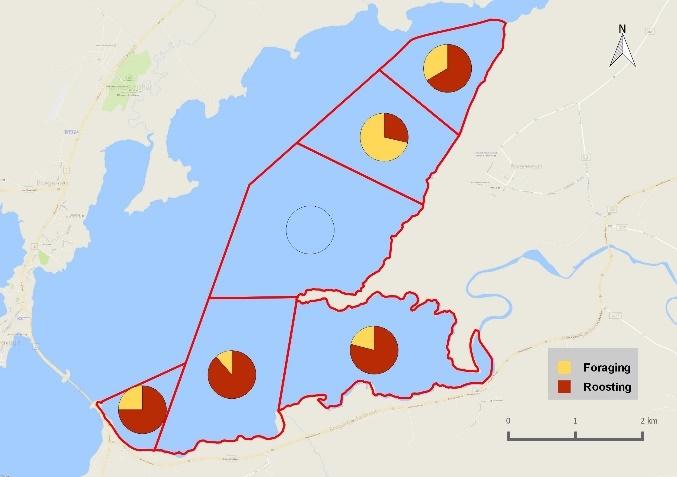
Low-tide Rising-tide
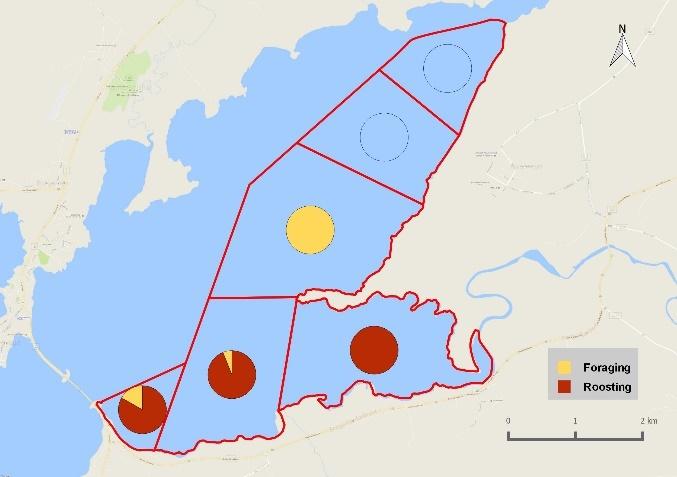
Landbúnaðarháskóli Íslands Andakíll Protected Habitat Area Monitoring 2017 Estuarine Monitoring Final Report 53 | Page
Figure 3 49. Proportion of foraging and roosting Mergus merganser during weekly (a) low tide and (b) rising tide estuarine surveys in six subsites in the Andakíll Ramsar site between 12th March and 25th October 2017.
Figure 3 50 Number of Mergus serrator recorded during weekly low tide and rising tide estuarine surveys in the Andakíll Ramsar site between 12th March and 25th October 2017.
0 50 100 150 200 250 300 350 10 11 12 13 14 15 16 17 18 19 20 21 22 23 24 25 26 27 28 29 30 31 32 33 34 35 36 37 38 39 40 41 42 43 Mar Apr May Jun Jul Aug Sep Oct Number of individuals Week number and month
(a)
(a) Low tide
(b) Rising tide
Figure 3 51. Relative abundance of Mergus serrator during weekly (a) low tide and (b) rising tide estuarine surveys in the Andakíll Ramsar site between 12th March and 25th October 2017. Dots are randomly positioned within each subsite. While each dot refers to a single bird, it refers to the bird’s presence in that subsite only, and not the bird’s actual location.
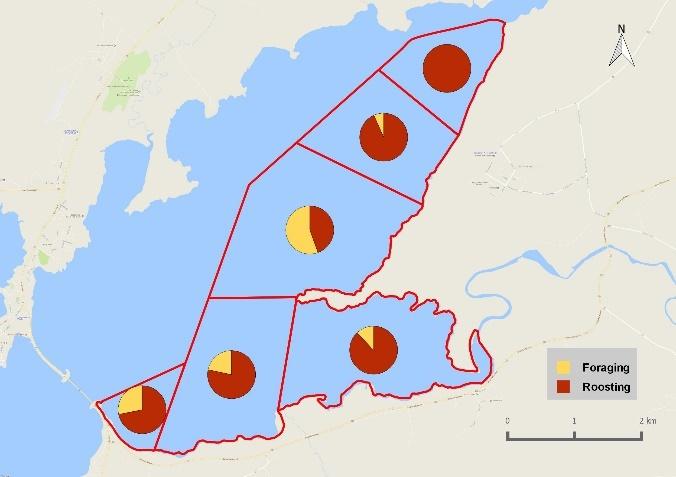
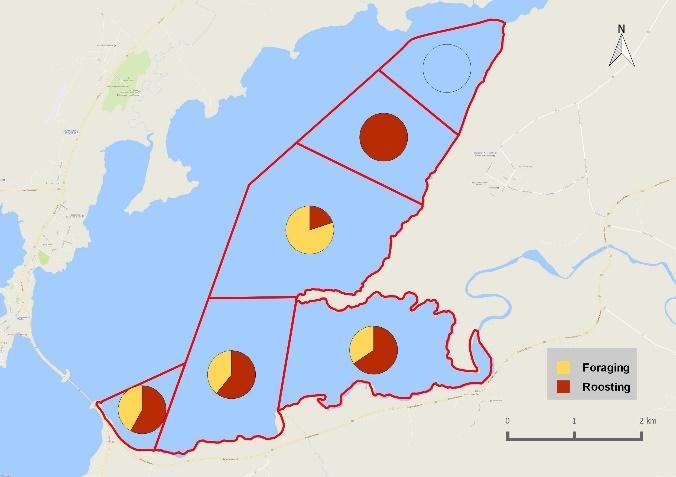


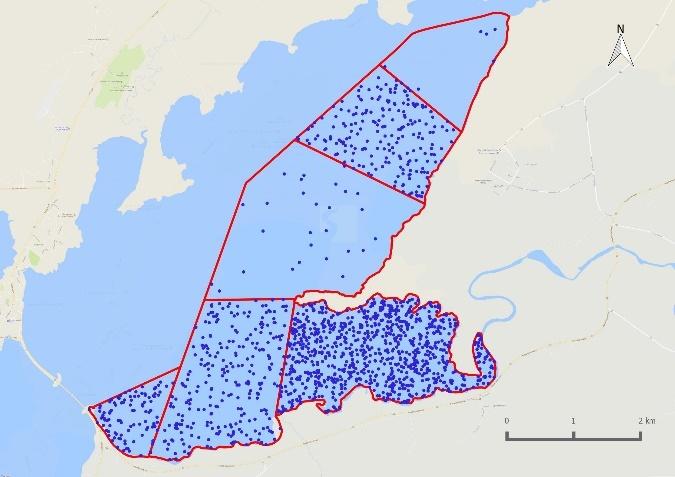
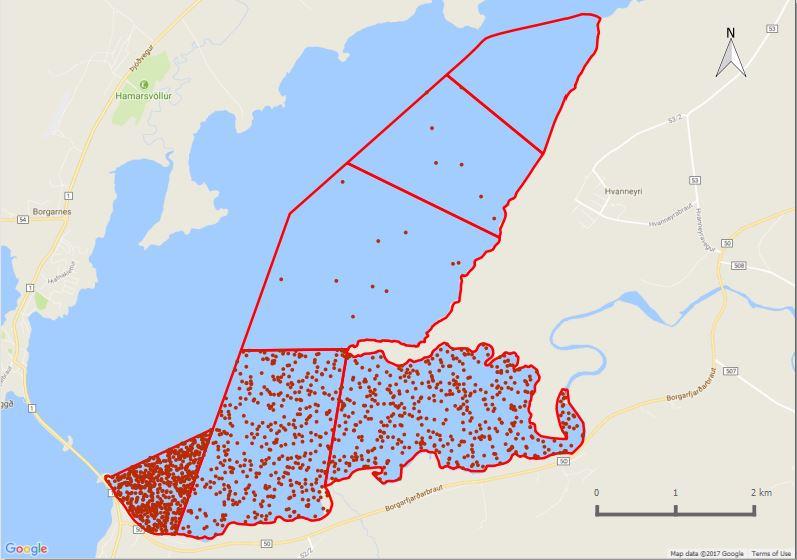
(a) Spring
(b) Autumn
Figure 3-52. Relative abundance during (a) spring and (b) autumn of Mergus serrator counted on twice weekly estuarine surveys in the Andakíll Ramsar site in 2017. Spring = 12th March 7th June; Autumn = 12th June 25th October. The number of dots in each subsite refers to the total number of bird records (from weekly low tide and rising tide surveys) in spring and autumn, adjusted for the length of the season, and reflects the species’ abundance in that season, not the specific location of birds.
(a) Low tide
(b) Rising tide
Figure 3 53. Proportion of foraging and roosting Mergus serrator during weekly (a) low tide and (b) rising tide estuarine surveys in six subsites in the Andakíll Ramsar site between 12th March and 25th October 2017.
Landbúnaðarháskóli Íslands Andakíll Protected Habitat Area Monitoring 2017 Estuarine Monitoring Final Report 54 | Page
Red throated Diver Gavia stellata Lómur
Red throated Divers were recorded sporadically throughout the majority of the survey period. Highest numbers (14 birds) occurred on 29th May, and the species was recorded on most surveys between mid May and mid August. Up to six birds were recorded on Lake Vatnshamravatn throughout April, with high counts of 14 and 10 birds recorded there on 24th and 27th April respectively. Two nesting territories were observed on Lake Vatnshamravatn on 28th May. Both pairs successfully hatched chicks, and broods of two and one unfledged chicks were observed on 9th July. There were intermittent records in the estuarine survey area during August and September. The last record was of a single bird on 25th September. While Red throated Divers were recorded in each of the six subsites during low tide and rising tide surveys, greatest numbers were routinely found in the three southernmost subsites, Flæðhöfðasker (Est 6), Grjóteyrarklakkur (Est 1) and Kistufjörđur (Est 2).
Low-tide Rising-tide
Figure 3 54. Number of Gavia stellata recorded during weekly low tide and rising tide estuarine surveys in the Andakíll Ramsar site between 12th March and 25th October 2017.
Figure 3 55. Relative abundance of Gavia stellata during weekly (a) low tide and (b) rising tide estuarine surveys in the Andakíll Ramsar site between 12th March and 25th October 2017. Dots are randomly positioned within each subsite. While each dot refers to a single bird, it refers to the bird’s presence in that subsite only, and not the bird’s actual location.


Landbúnaðarháskóli Íslands Andakíll Protected Habitat Area Monitoring 2017 Estuarine Monitoring Final Report 55 | Page
0 2 4 6 8 10 12 14 16 10 11 12 13 14 15 16 17 18 19 20 21 22 23 24 25 26 27 28 29 30 31 32 33 34 35 36 37 38 39 40 41 42 43 Mar Apr May Jun Jul Aug Sep Oct Number of individuals Week number and month
(a) Low tide (b) Rising tide
(a) Low tide
(b) Rising tide
Figure 3 56. Proportion of foraging and roosting Gavia stellata during weekly (a) low tide and (b) rising tide estuarine surveys in six subsites in the Andakíll Ramsar site between 12th March and 25th October 2017.


Landbúnaðarháskóli Íslands Andakíll Protected Habitat Area Monitoring 2017 Estuarine Monitoring Final Report 56 | Page
Great Northern Diver Gavia immer Himbrimi
Great Northern Divers were regularly recorded in the estuary, with one or two birds recorded on most surveys between late May and mid September.
Low-tide Rising-tide
of


Figure 3-57. Number of Gavia immer recorded during weekly low tide and rising tide estuarine surveys in the Andakíll Ramsar site between 12th March and 25th October 2017.
(a) Low tide
(b) Rising tide
Figure 3-58. Relative abundance of Gavia immer during weekly (a) low tide and (b) rising tide estuarine surveys in the Andakíll Ramsar site between 12th March and 25th October 2017. Dots are randomly positioned within each subsite. While each dot refers to a single bird, it refers to the bird’s presence in that subsite only, and not the bird’s actual location.


Slavonian Grebe Podiceps auritus Flórgoði
Two Slavonian Grebes were recorded in Flæðhöfðasker (Est 6) during the low tide survey on 24th May. An additional Slavonian Grebe was recorded on Vatnshamrarvatn on 1st May.
Landbúnaðarháskóli Íslands Andakíll Protected Habitat Area Monitoring 2017 Estuarine Monitoring Final Report 57 | Page
0 1 2 3 4 10 11 12 13 14 15 16 17 18 19 20 21 22 23 24 25 26 27 28 29 30 31 32 33 34 35 36 37 38 39 40 41 42 43 Mar Apr May Jun Jul Aug Sep Oct Number
individuals Week number and month
Cormorant Phalacrocorax carbo Dílaskarfur
Cormorants were recorded in most surveys from late April until the last survey on 25th October. A peak of 13 birds was recorded in July. There were no records of birds breeding within the Andakíll Ramsar site, but as several juveniles were recorded during July and August. Birds were most frequently recorded fishing or roosting in the three southernmost subsites, Flæðhöfðasker (Est 6), Grjóteyrarklakkur (Est 1) and Kistufjörđur (Est 2).
Low-tide Rising-tide
Figure 3-59. Number of Phalacrocorax carbo recorded during weekly low tide and rising tide estuarine surveys in the Andakíll Ramsar site between 12th March and 25th October 2017.
Rising tide
Figure 3-60. Relative abundance of Phalacrocorax carbo during weekly (a) low tide and (b) rising tide estuarine surveys in the Andakíll Ramsar site between 12th March and 25th October 2017. Dots are randomly positioned within each subsite. While each dot refers to a single bird, it refers to the bird’s presence in that subsite only, and not the bird’s actual location.
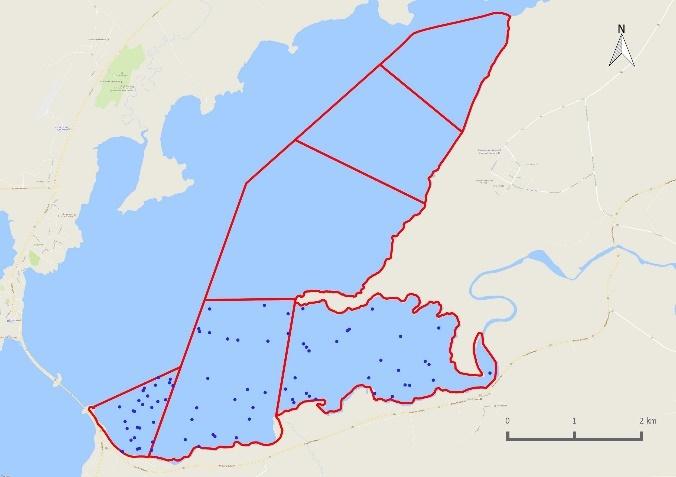
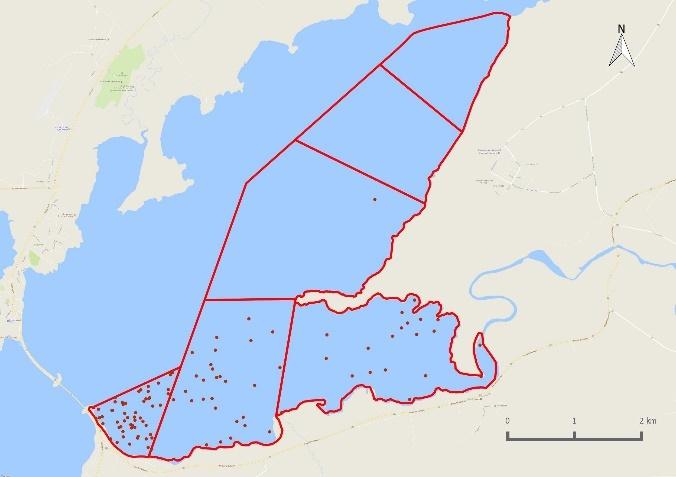

Landbúnaðarháskóli Íslands Andakíll Protected Habitat Area Monitoring 2017 Estuarine Monitoring Final Report 58 | Page
0 2 4 6 8 10 12 14 10 11 12 13 14 15 16 17 18 19 20 21 22 23 24 25 26 27 28 29 30 31 32 33 34 35 36 37 38 39 40 41 42 43 Mar Apr May Jun Jul Aug Sep Oct Number of individuals Week number and month
(a) Low tide (b)
Waders
There were two distinct peaks in the number of waders using the site, in late April and late August. In almost all weeks, the number of birds recorded during low tide surveys was greater than during rising tide surveys (Figure 3 61). This is often the case for surveys like this, and indeed is the reason that rising tide surveys were undertaken rather than high tide surveys. Waders are easier to count when they are dispersed across extensive intertidal areas at low tide, compared to rising or high tides when they are squeezed together in high tide roosts, and often obscured by vegetation or rocks. Therefore, in some cases the explanation for higher counts during low tides may be greater detectability at this time. However, it is more likely that this pattern reflects differential use of the site for foraging (at low tide) and roosting (at high tide).

During the spring, Oystercatcher, Golden Plover, Ringed Plover, Black tailed Godwit, Redshank, Turnstone, Dunlin and Purple Sandpiper were recorded in considerably larger numbers during low tide surveys compared to rising tide surveys. In the autumn, considerably more Golden Plover, Ringed Plover, Redshank, Turnstone and Dunlin were recorded during low tide surveys compared to rising tide surveys. This suggests that they avail of high tide refuges outside the Andakíll Ramsar site. It is also possible that some small or inconspicuous roost sites were missed during surveys, but this is unlikely to account for the considerable and consistent differences in low tide and rising tide survey totals. This highlights the importance of conducting both low tide and rising tide surveys to gain the complete picture on how the birds use the protected area.

Low-tide Rising-tide
Landbúnaðarháskóli Íslands Andakíll Protected Habitat Area Monitoring 2017 Estuarine Monitoring Final Report 59 | Page
Figure 3 61 Number of waders recorded during weekly
low tide and rising tide
estuarine
surveys in the Andakíll Ramsar
site between 12th March and 25th October 2017. 0 500 1000 1500 2000 2500 3000 10 11 12 13 14 15 16 17 18 19 20 21 22 23 24 25 26 27 28 29 30 31 32 33 34 35 36 37 38 39 40 41 42 43 Mar Apr May Jun Jul Aug Sep Oct Total number of waders Week number and month
Eurasian Oystercatcher Haematopus ostralegus
Tjaldur


Oystercatchers were first recorded on 12th March, and then in all surveys between 27th March and 7th August. The last records of Oystercatcher in the survey area was ten birds on 9th October. At least 200 birds were recorded during all surveys in April, with a peak count of 585 on 18th April. Numbers reduced considerably in May and remained at a low level (c. 30 birds of less) throughout June, July and until 7th August. Oystercatchers nested throughout the Andakíll Ramsar site: on the fringes of the fjord and within the farmland and village (Tierney & Tierney 2020). While Oystercatchers were recorded in all subsites, they displayed a preference for Grjóteyrarklakkur (Est 1) and Kistufjörđur (Est 2) during low tides, and for Kistufjörđur (Est 2) during rising tides. As the available foraging area in Grjóteyrarklakkur (Est 1) was inundated on rising tides, the birds foraged in Kistufjörđur (Est 2), before roosting on the rocks at the north of the subsite.
Low-tide Rising-tide
Number of individuals Week number and month
Figure 3 62. Number of Haematopus ostralegus recorded during weekly low tide and rising tide estuarine surveys in the Andakíll Ramsar site between 12th March and 25th October 2017.
Low tide
Rising tide
Figure 3 63. Relative abundance of Haematopus ostralegus during weekly (a) low tide and (b) rising tide estuarine surveys in the Andakíll Ramsar site between 12th March and 25th October 2017. Dots are randomly positioned within each subsite. While each dot refers to a single bird, it refers to the bird’s presence in that subsite only, and not the bird’s actual location.
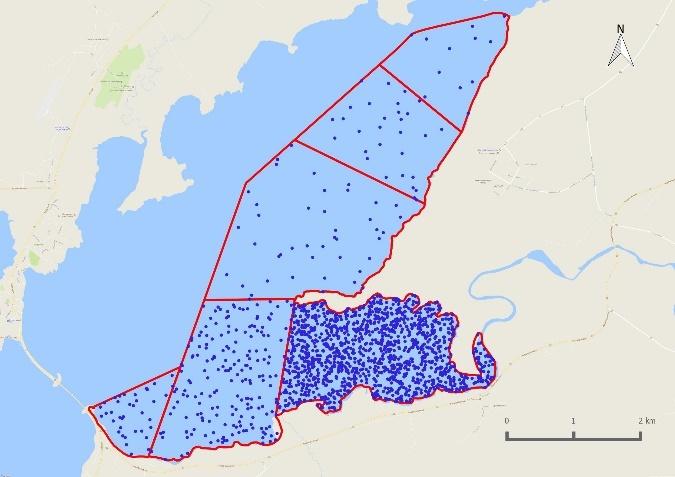
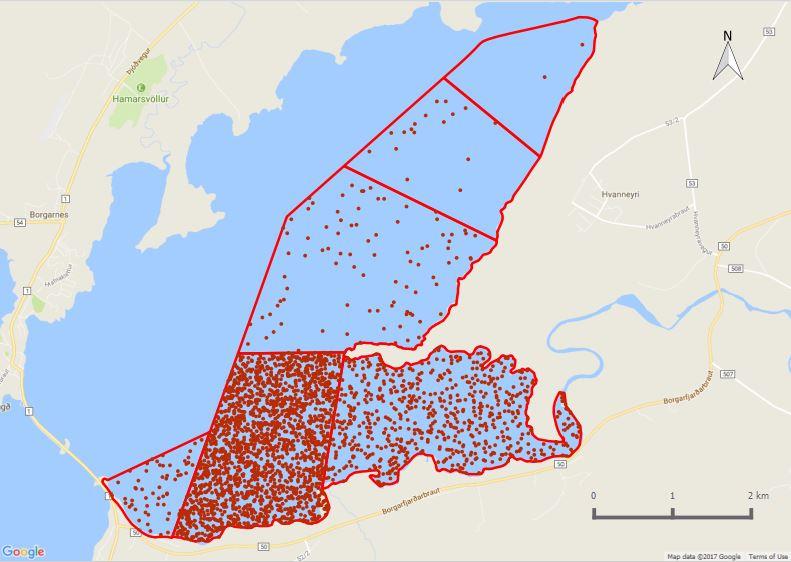
Landbúnaðarháskóli Íslands Andakíll Protected Habitat Area Monitoring 2017 Estuarine Monitoring Final Report 60 | Page
0 100 200 300 400 500 600 700 10 11 12 13 14 15 16 17 18 19 20 21 22 23 24 25 26 27 28 29 30 31 32 33 34 35 36 37 38 39 40 41 42 43 Mar Apr May Jun Jul Aug Sep Oct
(a)
(b)
(a) Spring
(b) Autumn
Figure 3 64. Relative abundance during (a) spring and (b) autumn of Haematopus ostralegus counted on twice weekly estuarine surveys in the Andakíll Ramsar site in 2017. Spring = 12th March 7th June; Autumn = 12th June 25th October. The number of dots in each subsite refers to the total number of bird records (from weekly low tide and rising tide surveys) in spring and autumn, adjusted for the length of the season, and reflects the species’ abundance in that season, not the specific location of birds.
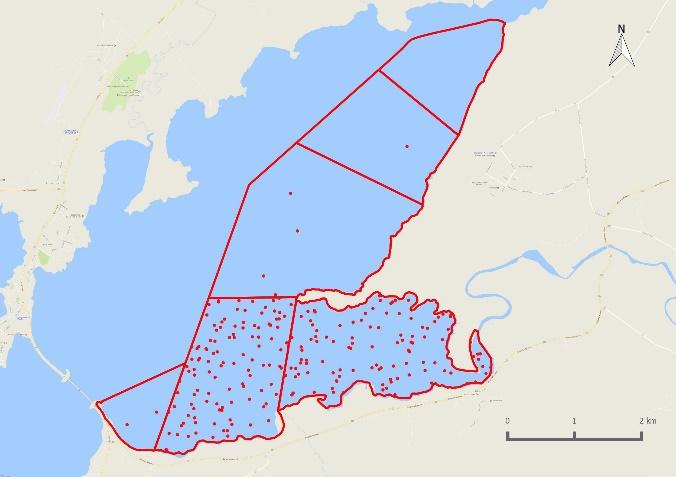
(a) Low tide
(b) Rising tide
Figure 3 65. Proportion of foraging and roosting Haematopus ostralegus during weekly (a) low tide and (b) rising tide estuarine surveys in six subsites in the Andakíll Ramsar site between 12th March and 25th October 2017.
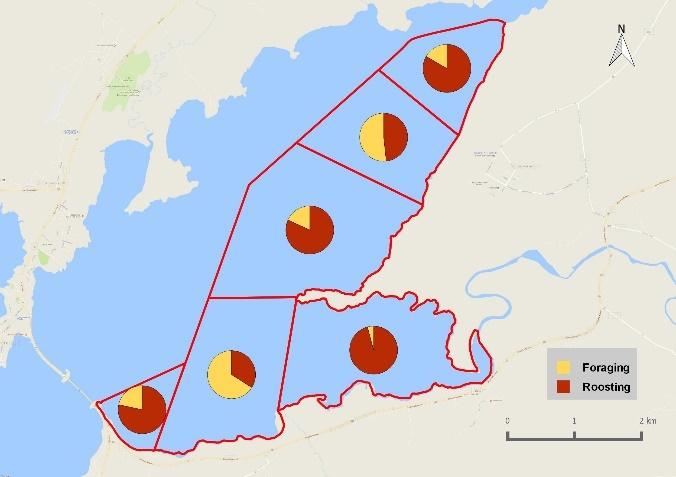
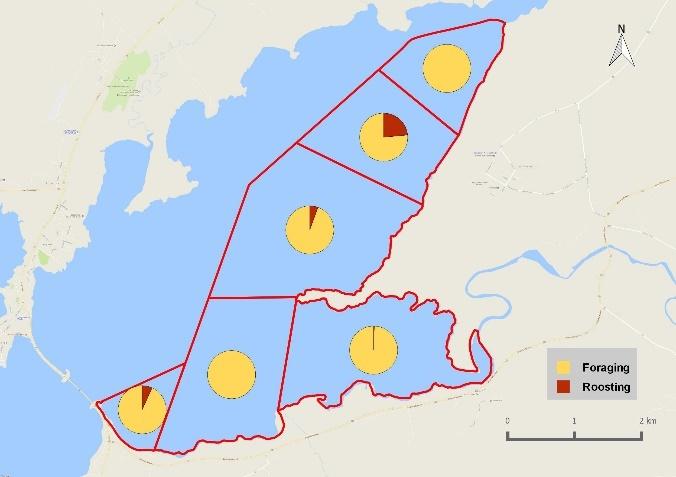

Landbúnaðarháskóli Íslands Andakíll Protected Habitat Area Monitoring 2017 Estuarine Monitoring Final Report 61 | Page
European Golden Plover Pluvialis apricaria
Heiðlóa


Golden Plover were present in the survey area on almost all surveys between 3rd April and 25th October, albeit in low numbers (< 50 birds) before 2nd August. During August, September and October, the mudflats were well used by Golden Plovers, especially during low tides there were greater than 600 birds present on each low tide survey throughout September, and there was a peak of 950 birds on 9th October. Golden Plover were distributed throughout the six subsites, with largest numbers recorded in Kistufjörđur (Est 2) and Grjóteyrarklakkur (Est 1) during low tides, and Ásgarđshöfđi (Est 4) during rising tide surveys. The greatly reduced numbers during rising tide surveys suggest the birds must be exploiting terrestrial foraging areas at this tidal stage.
Low-tide Rising-tide
Number of individuals Week number and month
Mar Apr May Jun
Oct
Figure 3-66.Number of Pluvialis apricaria recorded during weekly low tide and rising tide estuarine surveys in the Andakíll Ramsar site between 12th March and 25th October 2017.
(a) Low tide
Rising tide
Figure 3-67. Relative abundance of Pluvialis apricaria during weekly (a) low tide and (b) rising tide estuarine surveys in the Andakíll Ramsar site between 12th March and 25th October 2017. Dots are randomly positioned within each subsite. While each dot refers to a single bird, it refers to the bird’s presence in that subsite only, and not the bird’s actual location.
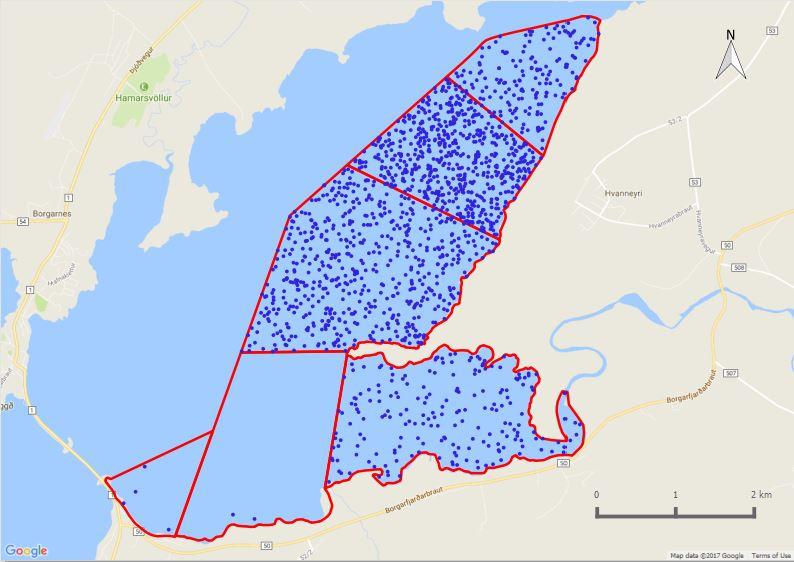
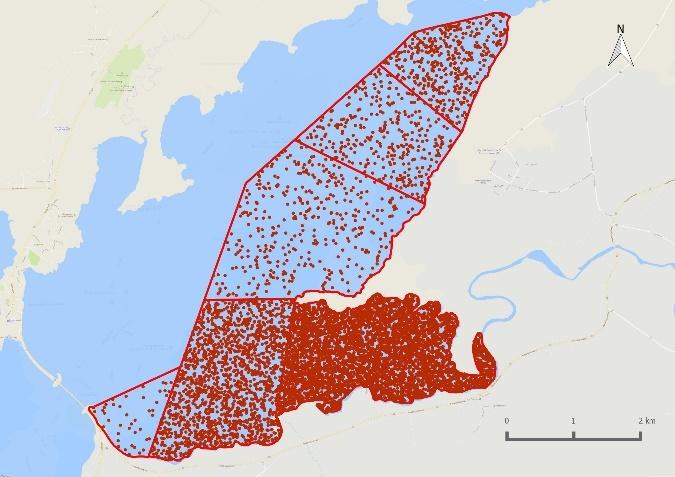
Landbúnaðarháskóli Íslands Andakíll Protected Habitat Area Monitoring 2017 Estuarine Monitoring Final Report 62 | Page
0 200 400 600 800 1000 10 11 12 13 14 15 16 17 18 19 20 21 22 23 24 25 26 27 28 29 30 31 32 33 34 35 36 37 38 39 40 41 42 43
Jul Aug Sep
(b)
(a) Spring
(b) Autumn
Figure 3 68. Relative abundance during (a) spring and (b) autumn of Pluvialis apricaria counted on twice weekly estuarine surveys in the Andakíll Ramsar site in 2017. Spring = 12th March 7th June; Autumn = 12th June 25th October. The number of dots in each subsite refers to the total number of bird records (from weekly low tide and rising tide surveys) in spring and autumn, adjusted for the length of the season, and reflects the species’ abundance in that season, not the specific location of birds.
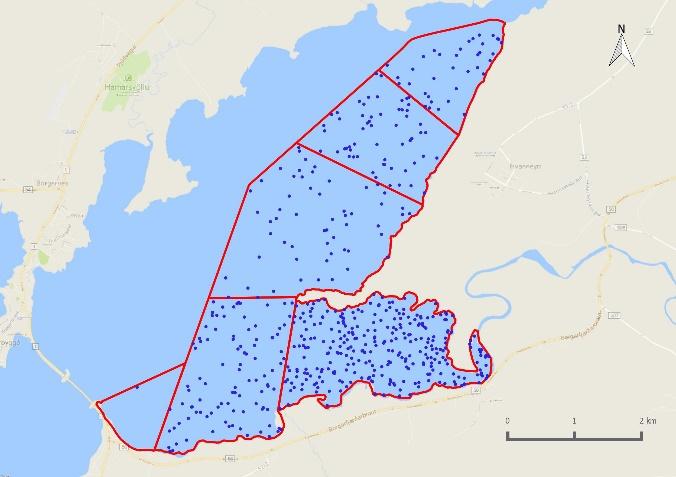
(a) Low tide
(b) Rising tide
Figure 3 69. Proportion of foraging and roosting Pluvialis apricaria during weekly (a) low tide and (b) rising tide estuarine surveys in six subsites in the Andakíll Ramsar site between 12th March and 25th October 2017.
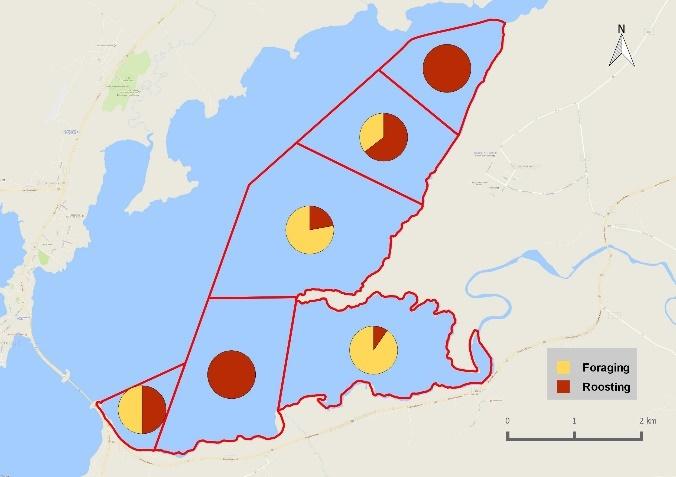
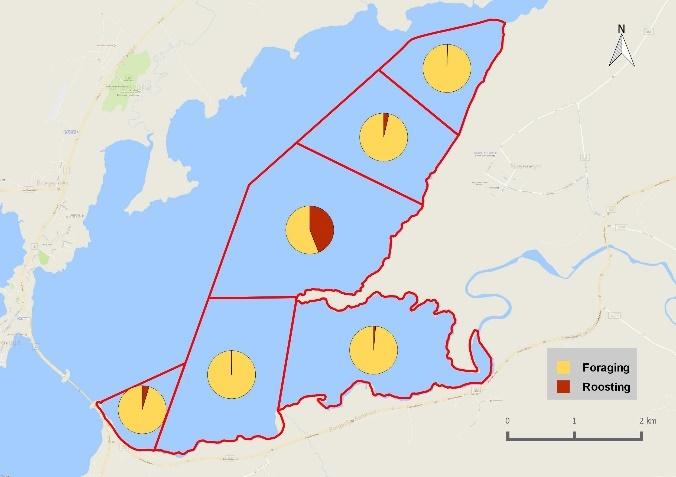

Landbúnaðarháskóli Íslands Andakíll Protected Habitat Area Monitoring 2017 Estuarine Monitoring Final Report 63 | Page
Ringed Plover
Charadrius hiaticula
Sandlóa


Ringed Plovers were first recorded in the survey area on 18th April and were present in all weeks until 11th September. Birds were observed in greater numbers during low tide surveys than rising tide surveys, which suggests that the birds avail of high tide refuges outside the Andakíll Ramsar site. The first chicks were recorded on the 12th June. At least one pair nested close to the Arctic Tern colony adjacent to Flæðhöfðasker (Est 6) Highest counts occurred during low tide counts in July and August, with monthly peaks of 65 and 64 birds, respectively. During low tide surveys, birds displayed a preference for the three southernmost subsites (Grjóteyrarklakkur (Est 1), Kistufjörđur (Est 2), and Flæðhöfðasker (Est 6)), but were dispersed throughput the six subsites during rising tide surveys.
Low-tide Rising-tide
Number of individuals Week number and month
Mar Apr May Jun
Oct
Figure 3-70. Number of Charadrius hiaticula recorded during weekly low tide and rising tide estuarine surveys in the Andakíll Ramsar site between 12th March and 25th October 2017.
Low tide
Rising tide
Figure 3 71. Relative abundance of Charadrius hiaticula during weekly (a) low tide and (b) rising tide estuarine surveys in the Andakíll Ramsar site between 12th March and 25th October 2017. Dots are randomly positioned within each subsite. While each dot refers to a single bird, it refers to the bird’s presence in that subsite only, and not the bird’s actual location.


Landbúnaðarháskóli Íslands Andakíll Protected Habitat Area Monitoring 2017 Estuarine Monitoring Final Report 64 | Page
0 10 20 30 40 50 60 70 10 11 12 13 14 15 16 17 18 19 20 21 22 23 24 25 26 27 28 29 30 31 32 33 34 35 36 37 38 39 40 41 42 43
Jul Aug Sep
(a)
(b)
(a) Spring
(b) Autumn
Figure 3 72. Relative abundance during (a) spring and (b) autumn of Charadrius hiaticula counted on twice weekly estuarine surveys in the Andakíll Ramsar site in 2017. Spring = 12th March 7th June; Autumn = 12th June 25th October. The number of dots in each subsite refers to the total number of bird records (from weekly low tide and rising tide surveys) in spring and autumn, adjusted for the length of the season, and reflects the species’ abundance in that season, not the specific location of birds.
(a) Low tide
(b) Rising tide
Figure 3 73. Proportion of foraging and roosting Charadrius hiaticula during weekly (a) low tide and (b) rising tide estuarine surveys in six subsites in the Andakíll Ramsar site between 12th March and 25th October 2017.
Common Snipe Gallinago gallinago
Hrossagaukur
While there was very little suitable habitat within the survey area, Snipe were recorded on two occasions. Six birds were observed foraging above the high tide line on 4th April, and a single bird was recorded on 31st July. Elsewhere in the Andakíll Ramsar site, they were the most abundant breeding wader (Tierney & Tierney 2020).


Landbúnaðarháskóli Íslands Andakíll Protected Habitat Area Monitoring 2017 Estuarine Monitoring Final Report 65 | Page
Black tailed Godwit Limosa limosa
Jaðrakan


Black tailed Godwit were recorded in the survey area in all weeks between 24th April and 11th September, in most cases there were fewer than 50 birds. However, there were short lived seasonal peaks: 122 birds on 24th April and 180 on 7th August. Birds were recorded in all subsites during low tide and rising tide surveys. During rising tide surveys, roosting aggregations occurred in Kistufjörđur (Est 2), Kistuhöfðahólmar (Est 3) and Ásgarđshöfđi (Est 4). They are common breeders within the Andakíll Ramsar site (Tierney & Tierney 2020)
Low-tide Rising-tide
of individuals Week number and month
Apr May
Figure 3 74.Number of Limosa limosa recorded during weekly low tide and rising tide estuarine surveys in the Andakíll Ramsar site between 12th March and 25th October 2017.
Low tide
Rising tide
Figure 3 75. Relative abundance of Limosa limosa during weekly (a) low tide and (b) rising tide estuarine surveys in the Andakíll Ramsar site between 12th March and 25th October 2017. Dots are randomly positioned within each subsite. While each dot refers to a single bird, it refers to the bird’s presence in that subsite only, and not the bird’s actual location.


Landbúnaðarháskóli Íslands Andakíll Protected Habitat Area Monitoring 2017 Estuarine Monitoring Final Report 66 | Page
0 50 100 150 200 10 11 12 13 14 15 16 17 18 19 20 21 22 23 24 25 26 27 28 29 30 31 32 33 34 35 36 37 38 39 40 41 42 43 Mar
Jun Jul Aug Sep Oct Number
(a)
(b)
(a) Spring
(b) Autumn
Figure 3 76. Relative abundance during (a) spring and (b) autumn of Limosa limosa counted on twice weekly estuarine surveys in the Andakíll Ramsar site in 2017. Spring = 12th March 7th June; Autumn = 12th June 25th October. The number of dots in each subsite refers to the total number of bird records (from weekly low tide and rising tide surveys) in spring and autumn, adjusted for the length of the season, and reflects the species’ abundance in that season, not the specific locati on of birds.
(a) Low tide
(b) Rising tide
Figure 3 77. Proportion of foraging and roosting Limosa limosa during weekly (a) low tide and (b) rising tide estuarine surveys in six subsites in the Andakíll Ramsar site between 12th March and 25th October 2017.


Landbúnaðarháskóli Íslands Andakíll Protected Habitat Area Monitoring 2017 Estuarine Monitoring Final Report 67 | Page
Whimbrel
Numenius phaeopus Spói
Whimbrel were recorded in the survey area in two distinct peaks: from 3rd to 15th May; and19th July to 7th August. A peak count of 16 birds was recorded on 2nd August. Whimbrel showed a preference for the southernmost three subsites (Grjóteyrarklakkur (Est 1), Kistufjörđur (Est 2), and Flæðhöfðasker (Est 6)), and were recorded foraging when the sand and mudflats were exposed during low tide surveys and roosting on rising tide surveys. Whimbrel are common breeders within the Andakíll Ramsar site (Tierney & Tierney 2020).
Low-tide Rising-tide
of


Apr May
Week number and month
Figure 3 78. Number of Numenius phaeopus recorded during weekly low tide and rising tide estuarine surveys in the Andakíll Ramsar site between 12th March and 25th October 2017.
(a) Low tide
Rising tide
Figure 3 79.Relative abundance of Numenius phaeopus during weekly (a) low tide and (b) rising tide estuarine surveys in the Andakíll Ramsar site between 12th March and 25th October 2017. Dots are randomly positioned within each subsite. While each dot refers to a single bird, it refers to the bird’s presence in that subsite only, and not the bird’s actual location.


Landbúnaðarháskóli Íslands Andakíll Protected Habitat Area Monitoring 2017 Estuarine Monitoring Final Report 68 | Page
0 5 10 15 20 10 11 12 13 14 15 16 17 18 19 20 21 22 23 24 25 26 27 28 29 30 31 32 33 34 35 36 37 38 39 40 41 42 43 Mar
Jun Jul Aug Sep Oct Number
individuals
(b)
(a) Low tide
(b) Rising tide
Figure 3 80. Proportion of foraging and roosting Numenius phaeopus during weekly (a) low tide and (b) rising tide estuarine surveys in six subsites in the Andakíll Ramsar site between 12th March and 25th October 2017.


Landbúnaðarháskóli Íslands Andakíll Protected Habitat Area Monitoring 2017 Estuarine Monitoring Final Report 69 | Page
Common Redshank Tringa totanus
Stelkur


Redshank were recorded on almost every survey between 28th March and 25th September, and showed a bimodal peak, with a spring peak of 527 birds on 24th April, and an autumn peak of 1,206 on 24th July. There were fewer than 300 birds recorded on each survey during May and June before an influx on 6th July, when numbers rose to 821 birds. There followed a weekly increase in numbers until 24th July.
On 24th July, at 19:15, a flock of 270 Redshank were observed departing from a high tide roost, gaining considerable altitude and flying in a south easterly direction across the Brekkufjall mountain (c. 1.5 km away) and out of sight, presumably on migration
Redshank were distributed throughout the survey area but favoured the southernmost three subsites during low tides (Grjóteyrarklakkur (Est 1), Kistufjörđur (Est 2), and Flæðhöfðasker (Est 6)), and Kistufjörđur (Est 2) during rising tide surveys. While larger numbers occurred during autumn, the patterns of distribution during spring and autumn were broadly similar. Redshanks were almost exclusively recorded as foraging during low tide surveys, and were recorded as both foraging and roosting during rising tide surveys. Redshank were the second most numerous breeding wader (after Snipe) in the Andakíll Ramsar site (Tierney & Tierney 2020)
Low-tide Rising-tide
Landbúnaðarháskóli Íslands Andakíll Protected Habitat Area Monitoring 2017 Estuarine Monitoring Final Report 70 | Page
Figure 3-81.Number of
Tringa totanus recorded during
weekly
low tide and rising tide estuarine surveys in the Andakíll Ramsar site between
12th
March
and 25th
October 2017.
0 200 400 600 800 1000 1200 1400 10 11 12 13 14 15 16 17 18 19 20 21 22 23 24 25 26 27 28 29 30 31 32 33 34 35 36 37 38 39 40 41 42 43 Mar Apr May Jun Jul Aug Sep Oct Number of individuals Week number and month
(a) Low tide
(b) Rising tide
Figure 3 82. Relative abundance of Tringa totanus during weekly (a) low tide and (b) rising tide estuarine surveys in the Andakíll Ramsar site between 12th March and 25th October 2017. Dots are randomly positioned within each subsite. While each dot refers to a single bird, it refers to the bird’s presence in that subsite only, and not the bird’s actual location.


(a) Spring
(b) Autumn
Figure 3-83. Relative abundance during (a) spring and (b) autumn of Tringa totanus counted on twice weekly estuarine surveys in the Andakíll Ramsar site in 2017. Spring = 12th March 7th June; Autumn = 12th June 25th October. The number of dots in each subsite refers to the total number of bird records (from weekly low tide and rising tide surveys) in spring and autumn, adjusted for the length of the season, and reflects the species’ abundance in that season, not the specific location of birds.
(a) Low tide
(b) Rising tide
Figure 3 84. Proportion of foraging and roosting Tringa totanus during weekly (a) low tide and (b) rising tide estuarine surveys in six subsites in the Andakíll Ramsar site between 12th March and 25th October 2017.
Landbúnaðarháskóli Íslands Andakíll Protected Habitat Area Monitoring 2017 Estuarine Monitoring Final Report 71 | Page
Ruddy Turnstone
Arenaria interpres Tildra


Turnstone was first recorded on 28th March, and the last record was on 9th October. Numbers in spring peaked at 112 birds on 24th April, but there were generally less than 50 birds per survey during April and May. The first record after the breeding season was of five birds on 10th July. Numbers increased from then onwards to peak at 218 on 6th August. Numbers during autumn low tide surveys were generally between 100 and 200. The number of birds recorded on rising tide surveys was generally lower than on low tide surveys, and no large high tide roosts were located, suggesting that at least some of the birds sought high tide refuges outside the Andakíll Ramsar site.
During both low tide and rising tide surveys, Turnstone displayed a preference for the three southernmost subsites: Grjóteyrarklakkur (Est 1), Kistufjörđur (Est 2), and Flæðhöfðasker (Est 6)). The general pattern is that the birds foraged during low tides and roosted during rising tides. Occasionally, c. 50 birds were recorded roosting on the promontory delineating the boundary between Grjóteyrarklakkur (Est 1) and Kistufjörđur (Est 2), but as high tide observations were not conducted, it is not known whether this roost was used throughout the high tide period or if the rising water pushed the birds elsewhere.
Low-tide Rising-tide
Landbúnaðarháskóli Íslands Andakíll Protected Habitat Area Monitoring 2017 Estuarine Monitoring Final Report 72 | Page
Figure 3-85.Number of Arenaria interpres recorded during weekly low tide and rising tide estuarine surveys in the Andakíll Ramsar site between 12th March and 25th October 2017.
0 50 100 150 200 250 10 11 12 13 14 15 16 17 18 19 20 21 22 23 24 25 26 27 28 29 30 31 32 33 34 35 36 37 38 39 40 41 42 43 Mar Apr May Jun Jul Aug Sep Oct Number of individuals Week
number and
month
(a) Low tide
(b) Rising tide
Figure 3 86. Relative abundance of Arenaria interpres during weekly (a) low tide and (b) rising tide estuarine surveys in the Andakíll Ramsar site between 12th March and 25th October 2017. Dots are randomly positioned within each subsite. While each dot refers to a single bird, it refers to the bird’s presence in that subsite only, and not the bird’s actual location.


(a) Spring
(b) Autumn
Figure 3-87. Relative abundance during (a) spring and (b) autumn of Arenaria interpres counted on twice weekly estuarine surveys in the Andakíll Ramsar site in 2017. Spring = 12th March 7th June; Autumn = 12th June 25th October. The number of dots in each subsite refers to the total number of bird records (from weekly low tide and rising tide surveys) in spring and autumn, adjusted for the length of the season, and reflects the species’ abundance in that season, not the specific location of birds.
(a) Low tide
(b) Rising tide
Figure 3 88. Proportion of foraging and roosting Arenaria interpres during weekly (a) low tide and (b) rising tide estuarine surveys in six subsites in the Andakíll Ramsar site between 12th March and 25th October 2017.
Landbúnaðarháskóli Íslands Andakíll Protected Habitat Area Monitoring 2017 Estuarine Monitoring Final Report 73 | Page
Red Knot
Calidris canutus
Rauðbrystingur
During May, Knot occur along the west coast of Iceland, from Keflavik to the West Fjords while staging en route to arctic breeding grounds. In May 2017, a survey of seven areas known to be used by Knot in mid western Iceland (Hvalfjordur to Stikkisholmur), resulted in a total of 37,000 Knot (J. Wilson, pers. comm.).
Despite the numbers of this species recorded in the vicinity of the Andakíll Ramsar site (the survey covered areas within 20 km to the north and south of the survey area), it is not used by large numbers of Knot. Knot were present in the survey area between 8th and 23rd May. Numbers built steadily and peaked at 145 birds on 23rd May. Two birds were recorded on 31st July. Knot were mainly recorded in the south of the survey area, in Grjóteyrarklakkur (Est 1) and Kistufjörđur (Est 2)
Low-tide Rising-tide
of


Week number and month
Figure 3 89.Number of Calidris canutus recorded during weekly low tide and rising tide estuarine surveys in the Andakíll Ramsar site between 12th March and 25th October 2017.
Figure 3 90 Relative abundance of Calidris canutus during weekly (a) low tide and (b) rising tide estuarine surveys in the Andakíll Ramsar site between 12th March and 25th October 2017. Dots are randomly positioned within each subsite. While each dot refers to a single bird, it refers to the bird’s presence in that subsite only, and not the bird’s actual location.
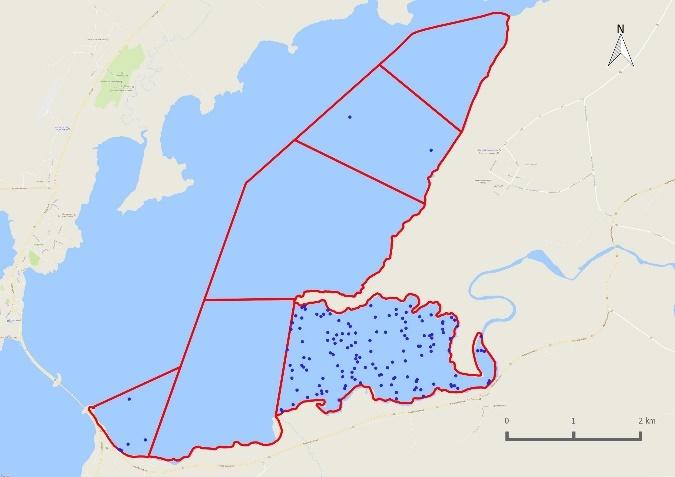

Landbúnaðarháskóli Íslands Andakíll Protected Habitat Area Monitoring 2017 Estuarine Monitoring Final Report 74 | Page
0 20 40 60 80 100 120 140 160 10 11 12 13 14 15 16 17 18 19 20 21 22 23 24 25 26 27 28 29 30 31 32 33 34 35 36 37 38 39 40 41 42 43 Mar Apr May Jun Jul Aug Sep Oct Number
individuals
(a) Low tide (b) Rising tide
Dunlin
Calidris alpina
Lóuþræll
Dunlin were first recorded on 18th April and were present in the survey area until 25th September. During April and May, and for most of June there were fewer than 200 birds recorded on each survey. However, numbers rose from the second half of June onwards. In July, counts during low tide surveys were highest, suggesting that the birds used high tide refuges outside the survey area. There were between c. 750 and 1,000 birds during low tide surveys in July. A count of 1,478 was recorded during the rising tide survey on 7th August. By the last week August, and during September, the number of birds was c. 200 or less. During August, the number of birds recorded during rising tide surveys was higher than in low tide surveys, due to the formation of a new high tide roost in Kistuhöfðahólmar (Est 3). While Dunlin were distributed throughout the six subsites, they showed a preference for Grjóteyrarklakkur (Est 1), Kistufjörđur (Est 2) and Ásgarđshöfđi (Est 4) during low tides, and Kistufjörđur (Est 2), Kistuhöfðahólmar (Est 3), Ásgarđshöfđi (Est 4) and Hvítárleirur (Est 5) during high tides. In all subsites except Kistuhöfðahólmar (Est 3), birds were most often recorded as foraging. Dunlin are common breeders within the Andakíll Ramsar site (Tierney & Tierney 2020)
Low-tide Rising-tide
of


Figure 3 91. Number of Calidris alpina recorded during weekly low tide and rising tide estuarine surveys in the Andakíll Ramsar site between 12th March and 25th October 2017.
Figure 3 92. Relative abundance of Calidris alpina during weekly (a) low tide and (b) rising tide estuarine surveys in the Andakíll Ramsar site between 12th March and 25th October 2017. Dots are randomly positioned within each subsite. While each dot refers to a single bird, it refers to the bird’s presence in that subsite only, and not the bird’s actual location.


Landbúnaðarháskóli Íslands Andakíll Protected Habitat Area Monitoring 2017 Estuarine Monitoring Final Report 75 | Page
0 200 400 600 800 1000 1200 1400 1600 10 11 12 13 14 15 16 17 18 19 20 21 22 23 24 25 26 27 28 29 30 31 32 33 34 35 36 37 38 39 40 41 42 43 Mar Apr May Jun Jul Aug Sep Oct Number
indivuiduals Week number and month
(a) Low tide (b) Rising tide
(a) Spring
(b) Autumn
Figure 3 93.Relative abundance during (a) spring and (b) autumn of Calidris alpina counted on twice weekly estuarine surveys in the Andakíll Ramsar site in 2017. Spring = 12th March 7th June; Autumn = 12th June 25th October. The number of dots in each subsite refers to the total number of bird records (from weekly low tide and rising tide surveys) in spring and autumn, adjusted for the length of the season, and reflects the species’ abundance in that season, not the specific locat ion of birds.
(a) Low tide
(b) Rising tide
Figure 3 94. Proportion of foraging and roosting Calidris alpina during weekly (a) low tide and (b) rising tide estuarine surveys in six subsites in the Andakíll Ramsar site between 12th March and 25th October 2017.


Landbúnaðarháskóli Íslands Andakíll Protected Habitat Area Monitoring 2017 Estuarine Monitoring Final Report 76 | Page
Purple Sandpiper Calidris maritima Sendlingur
The first Purple Sandpiper record within the survey area was on 20th March (114 birds had been recorded in Hvalfjordur (20 km to the south) on 4th March) (N. Tierney, unpublished dataset), and greater than 100 birds were recorded during all low tide surveys from then until the end of April. By 3rd May, numbers had reduced to 30 birds, and there were fewer than 15 birds recorded per survey until the first week of June. Small numbers of purple Sandpipers were recorded in late June, July and September, with the peak count in this period being 28 birds. Purple Sandpipers were recorded in the southern three subsites only: Flæðhöfðasker (Est 6), Grjóteyrarklakkur (Est 1) and Kistufjörđur (Est 2).
Low-tide Rising-tide
Number of individuals Week number and month


Mar Apr May
Figure 3-95. Number of Calidris maritima recorded during weekly low tide and rising tide estuarine surveys in the Andakíll Ramsar site between 12th March and 25th October 2017.
Low tide
Rising tide
Figure 3 96. Relative abundance of Calidris maritima during weekly (a) low tide and (b) rising tide estuarine surveys in the Andakíll Ramsar site between 12th March and 25th October 2017. Dots are randomly positioned within each subsite. While each dot refers to a single bird, it refers to the bird’s presence in that subsite only, and not the bird’s actual location.


Landbúnaðarháskóli Íslands Andakíll Protected Habitat Area Monitoring 2017 Estuarine Monitoring Final Report 77 | Page
0 100 200 300 400 500 10 11 12 13 14 15 16 17 18 19 20 21 22 23 24 25 26 27 28 29 30 31 32 33 34 35 36 37 38 39 40 41 42 43
Jun Jul Aug Sep Oct
(a)
(b)
(a) Spring
(b) Autumn
Figure 3 97. Relative abundance during (a) spring and (b) autumn of Calidris maritima counted on twice weekly estuarine surveys in the Andakíll Ramsar site in 2017. Spring = 12th March 7th June; Autumn = 12th June 25th October. The number of dots in each subsite refers to the total number of bird records (from weekly low tide and rising tide surveys) in spring and autumn, adjusted for the length of the season, and reflects the species’ abundance in that season, not the specific location of birds.
(a) Low tide
(b) Rising tide

Figure 3-98. Proportion of foraging and roosting Calidris maritima during weekly (a) low tide and (b) rising tide estuarine surveys in six subsites in the Andakíll Ramsar site between 12th March and 25th October 2017.


Landbúnaðarháskóli Íslands Andakíll Protected Habitat Area Monitoring 2017 Estuarine Monitoring Final Report 78 | Page
Red necked Phalarope
Phalaropus lobatus
Óðinshani


The first Red necked Phalarope record was on 24th May, and they were recorded in most weeks during June and July. The last record was on 6th August. A peak count of seven birds was recorded on 21st June. While the general timing of their arrival and departure was captured here, their habitat preference means the survey methodology employed here is not the optimal way to record Red necked Phalaropes. Tierney & Tierney (2020) provide a better assessment of their abundance and distribution within the Andakíll Ramsar site.
Low-tide Rising-tide
Number of
Mar Apr May Jun Jul Aug Sep Oct
Week number and month
Figure 3 99. Number of Phalaropus lobatus recorded during weekly low tide and rising tide estuarine surveys in the Andakíll Ramsar site between 12th March and 25th October 2017.
Landbúnaðarháskóli Íslands Andakíll Protected Habitat Area Monitoring 2017 Estuarine Monitoring Final Report 79 | Page
0 1 2 3 4 5 6 7 8 10 11 12 13 14 15 16 17 18 19 20 21 22 23 24 25 26 27 28 29 30 31 32 33 34 35 36 37 38 39 40 41 42 43
individuals
Seabirds
There were two distinct peaks in the number of seabirds using the site; in late May, and during August and early September (Figure 3 100). The springtime peak is almost entirely explained by Arctic Terns, which were first recorded on 3rd May, and had largely passed through by the end of the month. Black headed Gulls are responsible for the high counts of seabirds in August and September. There was a discrete influx of Glaucous (and/or Iceland Gulls) in October, which peaked at 262 birds in the second week of the month. Otherwise, the number of seabirds was approximately between 50 and 200 during each survey, usually with more birds recorded during low tide surveys.
Low-tide Rising-tide
of seabirds
number and month


Figure 3-100. Number of seabirds recorded during weekly low tide and rising tide estuarine surveys in the Andakíll Ramsar site between 12th March
2017
Landbúnaðarháskóli Íslands Andakíll Protected Habitat Area Monitoring 2017 Estuarine Monitoring Final Report 80 | Page
and 25th October
0 100 200 300 400 500 600 700 800 900 10 11 12 13 14 15 16 17 18 19 20 21 22 23 24 25 26 27 28 29 30 31 32 33 34 35 36 37 38 39 40 41 42 43 Mar Apr May Jun Jul Aug Sep Oct Number
Week
Northern Fulmar Fulmarus glacialis Fýll
Northern Fulmars were recorded on most surveys between mid April and mid September. Usually birds were recorded commuting between the breeding colony at Brekkufjall (c. 1.5 km south of the survey area) and the open sea.
Low-tide Rising-tide
of


number and month
Figure 3 101. Number of Fulmarus glacialis recorded during weekly low tide and rising tide estuarine surveys in the Andakíll Ramsar site between 12th March and 25th October 2017.
(a) Low tide
Rising tide
Figure 3 102. Relative abundance of Fulmarus glacialis during weekly (a) low tide and (b) rising tide estuarine surveys in the Andakíll Ramsar site between 12th March and 25th October 2017. Dots are randomly positioned within each subsite. While each dot refers to a single bird, it refers to the bird’s presence in that subsite only, and not the bird’s actual location. The red square represents the approximate location of the breeding colony at Brekkufjall

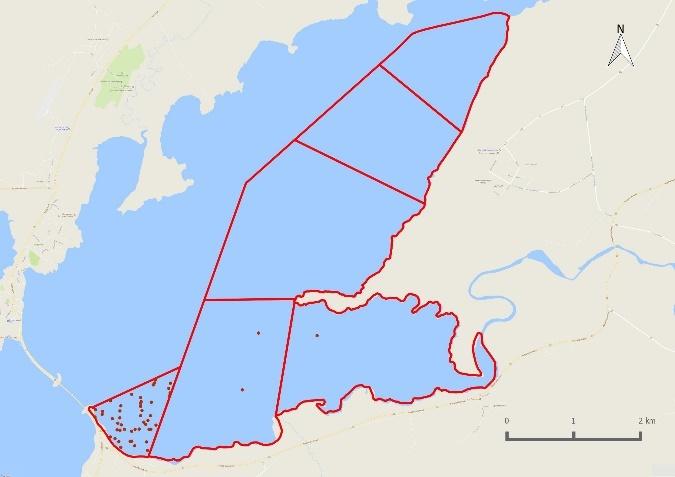
Black-legged Kittiwake
Rissa tridactyla Rita
Kittiwake was recorded on two surveys, with 26 birds on 17th April and a single bird on 24th April.
Landbúnaðarháskóli Íslands Andakíll Protected Habitat Area Monitoring 2017 Estuarine Monitoring Final Report 81 | Page
0 10 20 30 40 50 10 11 12 13 14 15 16 17 18 19 20 21 22 23 24 25 26 27 28 29 30 31 32 33 34 35 36 37 38 39 40 41 42 43 Mar Apr May Jun Jul Aug Sep Oct Number
individuals Week
(b)
Black headed Gull Chroicocephalus ridibundus Hettumáfur
Black headed Gulls were recorded in low numbers (< 100 birds) in the survey area during late March, April and May, and were absent in June. Numbers gradually increased throughout July and August. Peaks of 626 and 778 were recorded on 7th August and 6th September, respectively, and then numbers declined during September and October. There were clear differences in distribution within the survey area between low tide and rising tide surveys. The birds showed a preference for the more southerly subsites during low tides, and exploited all subsites except Kistuhöfðahólmar (Est 3) during rising tides. During spring, the birds were mostly distributed in the three southernmost subsites (Flæðhöfðasker (Est 6), Grjóteyrarklakkur (Est 1) and Kistufjörđur (Est 2)). In the autumn, they were more widely distributed and were recorded throughout the survey area. Birds were most often foraging during low tides and roosting during rising tides.
Low-tide Rising-tide
number

Figure 3 103. Number of Chroicocephalus ridibundus recorded during weekly low tide and rising tide estuarine surveys in the Andakíll Ramsar site between 12th March and 25th October 2017.
Figure 3 104. Relative abundance of Chroicocephalus ridibundus during weekly (a) low tide and (b) rising tide estuarine surveys in the Andakíll Ramsar site between 12th March and 25th October 2017. Dots are randomly positioned within each subsite. While each dot refers to a single bird, it refers to the bird’s presence in that subsite only, and not the bird’s actual location.


Landbúnaðarháskóli Íslands Andakíll Protected Habitat Area Monitoring 2017 Estuarine Monitoring Final Report 82 | Page
0 200 400 600 800 1000 10 11 12 13 14 15 16 17 18 19 20 21 22 23 24 25 26 27 28 29 30 31 32 33 34 35 36 37 38 39 40 41 42 43 Mar Apr May Jun Jul Aug Sep Oct Number of individuals Week
and month
(a) Low tide (b) Rising tide
(a) Spring
(b) Autumn
Figure 3 105. Relative abundance during (a) spring and (b) autumn of Chroicocephalus ridibundus counted on twice weekly estuarine surveys in the Andakíll Ramsar site in 2017. Spring = 12th March 7th June; Autumn = 12th June 25th October. The number of dots in each subsite refers to the total number of bird records (from weekly low tide and rising tide surveys) in spring and autumn, adjusted for the length of the season, and reflects the species’ abundance in that season, not the specific location of birds.


(a) Low tide
(b) Rising tide
Figure 3-106. Proportion of foraging and roosting Chroicocephalus ridibundus during weekly (a) low tide and (b) rising tide estuarine surveys in six subsites in the Andakíll Ramsar site between 12th March and 25th October 2017.

Landbúnaðarháskóli Íslands Andakíll Protected Habitat Area Monitoring 2017 Estuarine Monitoring Final Report 83 | Page
Common Gull Larus canus Stormmáfur
Common Gulls were present in most surveys, with the exception of surveys in late May, June and July, when almost no birds were recorded. In the spring, birds mainly used the survey area for foraging during low tides. A peak count of 83 birds was recorded on 3rd April. There was an influx from the last week of August onwards, when up to 65 birds were recorded, and Common Gulls were present on almost all of the surveys between then and the last survey on 25th October. In general, Common Gulls were present on the estuary in much greater numbers during low tide surveys, compared to rising tide surveys
Low-tide Rising-tide
of


Apr
Week number and month
Figure 3 107. Number of Larus canus recorded during weekly low tide and rising tide estuarine surveys in the Andakíll Ramsar site between 12th March and 25th October 2017.

tide
Figure 3-108. Relative abundance of Larus canus during weekly (a) low tide and (b) rising tide estuarine surveys in the Andakíll Ramsar site between 12th March and 25th October 2017. Dots are randomly positioned within each subsite. While each dot refers to a single bird, it refers to the bird’s presence in that subsite only, and not the bird’s actual location.
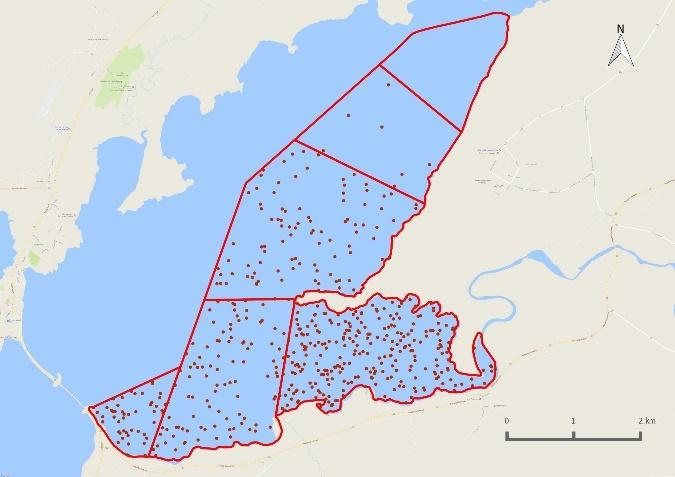
Landbúnaðarháskóli Íslands Andakíll Protected Habitat Area Monitoring 2017 Estuarine Monitoring Final Report 84 | Page
0 20 40 60 80 100 10 11 12 13 14 15 16 17 18 19 20 21 22 23 24 25 26 27 28 29 30 31 32 33 34 35 36 37 38 39 40 41 42 43 Mar
May Jun Jul Aug Sep Oct Number
individuals
(a) Low tide (b) Rising
(a) Spring
(b) Autumn
Figure 3 109. Relative abundance during (a) spring and (b) autumn of Larus canus counted on twice weekly estuarine surveys in the Andakíll Ramsar site in 2017. Spring = 12th March 7th June; Autumn = 12th June 25th October. The number of dots in each subsite refers to the total number of bird records (from weekly low tide and rising tide surveys) in spring and autumn, adjusted for the length of the season, and reflects the species’ abundance in that season, not the specific location of birds.
(b) Rising tide
Figure 3 110. Proportion of foraging and roosting Larus canus during weekly (a) low tide and (b) rising tide estuarine surveys in six subsites in the Andakíll Ramsar site between 12th March and 25th October 2017.
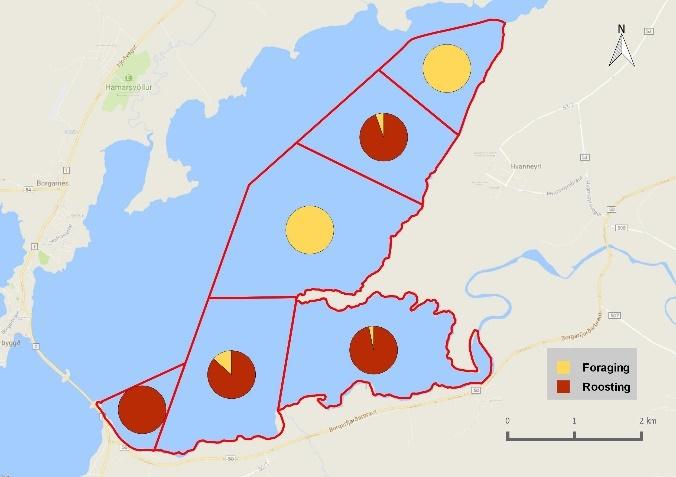
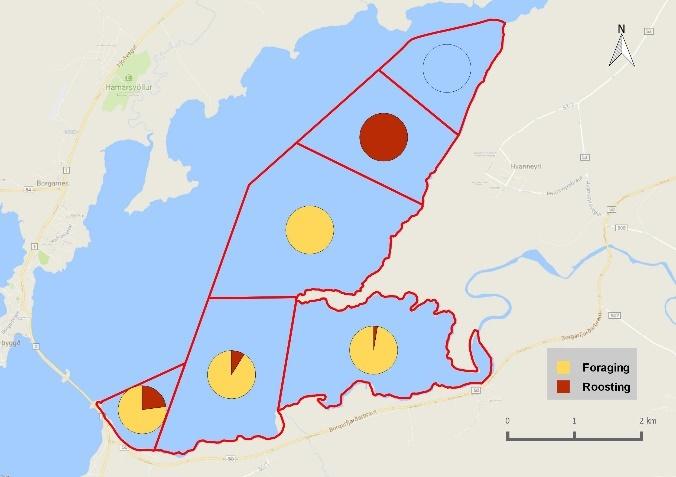


Landbúnaðarháskóli Íslands Andakíll Protected Habitat Area Monitoring 2017 Estuarine Monitoring Final Report 85 | Page
(a) Low tide
Great Black backed Gull Larus marinus Svartbakur
Great Black backed Gulls were present in the survey area in almost all surveys, from the first one on 12th March until the final one on 25th October. Highest numbers were 20 27 birds in spring, and 31 33 in autumn. Adults were present on a small island in the middle of Ásgarđshöfđi (Est 4), between 12th March and 18th September, and there were approximately 5 to 10 nests in May and June. At least two pairs reproduced successfully, as two broods of two large chicks were observed on 7th August. However, this must be considered a minimum, as the colony was not visited and observations were made from 1.5 to 2 km away. Due to the undulating topography of the island, and the cryptic nature of juvenile gull plumage, it is likely that other chicks were present and were not detected There were an estimated 12 14 nests on Lake Vatnshamravatn, and chicks were observed on 9th July, but no concerted effort was made to accurately survey this colony. Throughout the survey period, the southernmost four subsites: Flæðhöfðasker (Est 6), Grjóteyrarklakkur (Est 1), Kistufjörđur (Est 2) and Kistuhöfðahólmar (Est 3) were mostly used for foraging during low tides and for both roosting and foraging during rising tides.
Low-tide Rising-tide
Number of individuals Week number and month

Apr May
Figure 3 111. Number of Larus marinus recorded during weekly low tide and rising tide estuarine surveys in the Andakíll Ramsar site between 12th March and 25th October 2017.
Low tide
Rising tide
Figure 3 112. Relative abundance of Larus marinus during weekly (a) low tide and (b) rising tide estuarine surveys in the Andakíll Ramsar site between 12th March and 25th October 2017. Dots are randomly positioned within each subsite. While each dot refers to a single bird, it refers to the bird’s presence in that subsite only, and not the bird’s actual location.


Landbúnaðarháskóli Íslands Andakíll Protected Habitat Area Monitoring 2017 Estuarine Monitoring Final Report 86 | Page
0 5 10 15 20 25 30 35 10 11 12 13 14 15 16 17 18 19 20 21 22 23 24 25 26 27 28 29 30 31 32 33 34 35 36 37 38 39 40 41 42 43 Mar
Jun Jul Aug Sep Oct
(a)
(b)
(a) Spring
(b) Autumn
Figure 3 113. Relative abundance during (a) spring and (b) autumn of Larus marinus counted on twice weekly estuarine surveys in the Andakíll Ramsar site in 2017. Spring = 12th March 7th June; Autumn = 12th June 25th October. The number of dots in each subsite refers to the total number of bird records (from weekly low tide and rising tide surveys) in spring and autumn, adjusted for the length of the season, and reflects the species’ abundance in that season, not the specific locat ion of birds.
(a) Low tide
(b) Rising tide
Figure 3-114. Proportion of foraging and roosting Larus marinus during weekly (a) low tide and (b) rising tide estuarine surveys in six subsites in the Andakíll Ramsar site between 12th March and 25th October 2017.


Landbúnaðarháskóli Íslands Andakíll Protected Habitat Area Monitoring 2017 Estuarine Monitoring Final Report 87 | Page
Glaucous Gull
Larus hyperboreus Hvítmáfur
Glaucous Gulls occurred in single numbers in the survey area during April and May, and then were absent until 6th September. A peak count of 96 Glaucous Gulls was recorded on 9th October. However, due to difficulty accurately differentiating Glaucous and Iceland Gulls (which share identical plumage characteristics and differ only in body proportions), during surveys when observation conditions were suboptimal or when the birds were being observed at considerable distance, these two species were recorded as ‘Unidentified Glaucous /Iceland Gull’ (see below).
Low-tide Rising-tide
of

12
Apr May Jun Jul
Week number and month
Oct
Figure 3 115. Number of Larus hyperboreus recorded during weekly low tide and rising tide estuarine surveys in the Andakíll Ramsar site between 12th March and 25th October 2017.
Low tide
Rising tide
Figure 3 116. Relative abundance of Larus hyperboreus during weekly (a) low tide and (b) rising tide estuarine surveys in the Andakíll Ramsar site between 12th March and 25th October 2017. Dots are randomly positioned within each subsite. While each dot refers to a single bird, it refers to the bird’s presence in that subsite only, and not the bird’s actual location.


Landbúnaðarháskóli Íslands Andakíll Protected Habitat Area Monitoring 2017 Estuarine Monitoring Final Report 88 | Page
0 20 40 60 80 100 120 10 11
13 14 15 16 17 18 19 20 21 22 23 24 25 26 27 28 29 30 31 32 33 34 35 36 37 38 39 40 41 42 43 Mar
Aug Sep
Number
individuals
(a)
(b)
(a) Autumn
Figure 3 117. Relative abundance of Larus hyperboreus during autumn (6th September 25th October), counted on twice weekly estuarine surveys in the Andakíll Ramsar site in 2017. No map is provided for spring due to the low numbers recorded The number of dots in each subsite refers to the total number of bird records (from weekly low tide and rising tide surveys), and reflects the species’ abundance, not the specific location of birds.


(a) Low tide
(b) Rising tide
Figure 3-118. Proportion of foraging and roosting Larus hyperboreus during weekly (a) low tide and (b) rising tide estuarine surveys in six subsites in the Andakíll Ramsar site between 12th March and 25th October 2017.
Landbúnaðarháskóli Íslands Andakíll Protected Habitat Area Monitoring 2017 Estuarine Monitoring Final Report 89 | Page
Iceland Gull Larus glaucoides Bjartmáfur
Iceland Gulls were present in single numbers in April, September and October. Due to difficulty accurately differentiating Iceland and Glaucous Gulls (which share identical plumage characteristics), during surveys when observation conditions were suboptimal or when the birds were being observed at considerable distance, these two species were recorded as ‘ Unidentified Glaucous /Iceland Gull’ (see below).
Low-tide Rising-tide
Number of individuals Week number and month

Mar Apr May Jun Jul
Sep Oct
Figure 3-119. Number of Larus glaucoides recorded during weekly low tide and rising tide estuarine surveys in the Andakíll Ramsar site between 12th March and 25th October 2017.
Low tide
(b) Rising tide
Figure 3-120. Relative abundance of Larus glaucoides during weekly (a) low tide and (b) rising tide estuarine surveys in the Andakíll Ramsar site between 12th March and 25th October 2017. Dots are randomly positioned within each subsite. While each dot refers to a single bird, it refers to the bird’s presence in that subsite only, and not the bird’s actual location.


Landbúnaðarháskóli Íslands Andakíll Protected Habitat Area Monitoring 2017 Estuarine Monitoring Final Report 90 | Page
0 1 2 3 4 5 10 11 12 13 14 15 16 17 18 19 20 21 22 23 24 25 26 27 28 29 30 31 32 33 34 35 36 37 38 39 40 41 42 43
Aug
(a)
Unidentified Glaucous/Iceland Gull Larus hyperboreus/glaucoides Hvítmáfur/Bjartmáfur
As Glaucous and Iceland Gulls share identical plumage characteristics and differ only subtly in proportion, it is often difficult to differentiate the two species in the field, especially at distance, or when visibility is suboptimal. Therefore, the two species were grouped in October, when several tens of birds were present, and differentiating each individual bird in a flock was not practical. There was an influx of Glaucous /Iceland Gulls during October, and a peak count of 162 birds were recorded during the low tide survey on 9th October. These birds were distributed throughout the survey area, with the exception of Hvítárleirur (Est 5).
Low-tide Rising-tide
Number of individuals Week number and month


Figure 3 121. Number of Larus hyperboreus/glaucoides recorded during weekly low tide and rising tide estuarine surveys in the Andakíll Ramsar site between 12th March and 25th October 2017.
Low tide
Rising tide
Figure 3-122. Relative abundance of Larus hyperboreus/glaucoides during weekly (a) low tide and (b) rising tide estuarine surveys in the Andakíll Ramsar site between 12th March and 25th October 2017. Dots are randomly positioned within each subsite. While each dot refers to a single bird, it refers to the bird’s presence in that subsite only, and not the bird’s actual location.
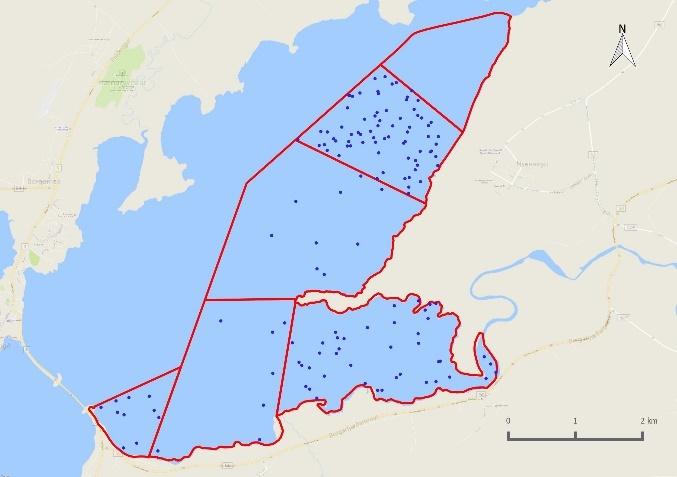
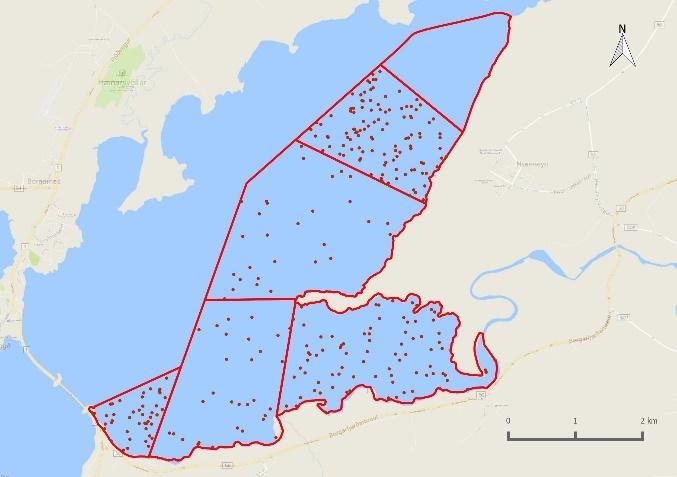
Landbúnaðarháskóli Íslands Andakíll Protected Habitat Area Monitoring 2017 Estuarine Monitoring Final Report 91 | Page
0 50 100 150 200 10 11 12 13 14 15 16 17 18 19 20 21 22 23 24 25 26 27 28 29 30 31 32 33 34 35 36 37 38 39 40 41 42 43 Mar Apr May Jun Jul Aug Sep Oct
(a)
(b)
Rising tide
Figure 3 123. Proportion of foraging and roosting Larus hyperboreus/glaucoides during weekly (a) low tide and (b) rising tide estuarine surveys in six subsites in the Andakíll Ramsar site between 12th March and 25th October 2017.
Herring Gull Larus argentatus
Silfurmáfur

Small numbers of Herring Gulls (< 10) were present in the survey area in spring and autumn, and were absent between late May and September.


Low-tide Rising-tide
124. Number of Larus argentatus recorded during weekly low tide and rising tide estuarine surveys in the Andakíll Ramsar site between 12th March and 25th October 2017.
Landbúnaðarháskóli Íslands Andakíll Protected Habitat Area Monitoring 2017 Estuarine Monitoring Final Report 92 | Page
Figure 3
0 2 4 6 8 10 10 11 12 13 14 15 16 17 18 19 20 21 22 23 24 25 26 27 28 29 30 31 32 33 34 35 36 37 38 39 40 41 42 43 Mar Apr May Jun Jul Aug Sep Oct Number of individuals Week number and month
(a) Low tide (b)
(a) Low tide (b) Rising tide
Figure 3 125. Relative abundance of Larus argentatus during weekly (a) low tide and (b) rising tide estuarine surveys in the Andakíll Ramsar site between 12th March and 25th October 2017. Dots are randomly positioned within each subsite. While each dot refers to a single bird, it refers to the bird’s presence in that subsite only, and not the bird’s actual location.


(a) Low tide (b) Rising tide
Figure 3 126. Proportion of foraging and roosting Larus argentatus during weekly (a) low tide and (b) rising tide estuarine surveys in six subsites in the Andakíll Ramsar site between 12th March and 25th October 2017.
Landbúnaðarháskóli Íslands Andakíll Protected Habitat Area Monitoring 2017 Estuarine Monitoring Final Report 93 | Page
Lesser Black backed Gull
Larus fuscus Sílamáfur


Two Lesser Black backed Gulls were observed in the fjord on the 1st March, at a time when it was still frozen, and before this survey had formally started. Between April and October, in the region of 10 30 birds were recorded in the survey area on each survey, but there were several surveys when much larger numbers (60 100 birds) were recorded. The reasons for these influxes, which occurred mainly during low time surveys, is not known.
Two to three pairs of Lesser Black backed Gull were present at the Great Black backed Gull colony in Ásgarđshöfđi (Est 4) during the summer months, but it is not known whether they nested successfully or not, as the island was not visited and observations were made from the closest elevated vantage points 1.5 to 2 km away. Due to the undulating topography of the island, and the cryptic nature of juvenile gull plumage, it was not possible to ascertain the presence of incubating adults or chicks. Similarly, Lesser Black backed Gulls were present on the island on Lake Vatnshamravatn during April, where Great Black backed Gulls nested, but no dedicated survey was undertaken to ascertain breeding status.
Lesser Black backed Gulls were distributed throughout the survey area during low tide and rising tide surveys. The four southernmost subsites: Flæðhöfðasker (Est 6), Grjóteyrarklakkur (Est 1), Kistufjörđur (Est 2) and Kistuhöfðahólmar (Est 3), were mainly used for foraging during low tides and for both roosting and foraging during rising tides.
Low-tide Rising-tide
Landbúnaðarháskóli Íslands Andakíll Protected Habitat Area Monitoring 2017 Estuarine Monitoring Final Report 94 | Page
Figure 3 127. Number of Larus fuscus recorded during weekly low tide and rising tide estuarine surveys in the Andakíll Ramsar site between 12th March and 25th October 2017. 0 20 40 60 80 100 10 11 12 13 14 15 16 17 18 19 20 21 22 23 24 25 26 27 28 29 30 31 32 33 34 35 36 37 38 39 40 41 42 43 Mar Apr May Jun Jul Aug Sep Oct Number of individuals Week number and month
(a) Low tide
(b) Rising tide
Figure 3 128. Relative abundance of Larus fuscus during weekly (a) low tide and (b) rising tide estuarine surveys in the Andakíll Ramsar site between 12th March and 25th October 2017. Dots are randomly positioned within each subsite. While each dot refers to a single bird, it refers to the bird’s presence in that subsite only, and not the bird’s actual location.


(a) Spring
(b) Autumn
Figure 3-129. Relative abundance during (a) spring and (b) autumn of Larus fuscus counted on twice weekly estuarine surveys in the Andakíll Ramsar site in 2017. Spring = 12th March 7th June; Autumn = 12th June 25th October. The number of dots in each subsite refers to the total number of bird records (from weekly low tide and rising tide surveys) in spring and autumn, adjusted for the length of the season, and reflects the species’ abundance in that season, not the specific location of birds.
(a) Low tide
(b) Rising tide
Figure 3 130. Proportion of foraging and roosting Larus fuscus during weekly (a) low tide and (b) rising tide estuarine surveys in six subsites in the Andakíll Ramsar site between 12th March and 25th October 2017.
Landbúnaðarháskóli Íslands Andakíll Protected Habitat Area Monitoring 2017 Estuarine Monitoring Final Report 95 | Page
Arctic Tern Sterna paradisaea Kría
Arctic Terns were first recorded on 3rd May, and peaks of 627 and 682 were recorded on 15th and 23rd May, respectively, as birds moved through the site. Smaller numbers, c. 30 50 birds were present throughout June, July and the beginning of August, with the last record being on the 7th August. Birds were mostly observed foraging or loafing in the southernmost three subsites: Flæðhöfðasker (Est 6), Grjóteyrarklakkur (Est 1) and Kistufjörđur (Est 2).
There was a breeding colony adjacent to Flæðhöfðasker (Est 6) at 64.527617, 21.882915. No dedicated nest count was undertaken, so no information on colony size or productivity cannot be provided. However, there were 53 and 45 individuals present in the colony on 5th and 7th June, respectively, several unfledged chicks were observed on 10thand 24th July There was considerable disturbance to the colony throughout the breeding season, as the area is used as a car park for recreational activities such as fishing and dog walking. Furthermore, several piles of gravel, and occasionally road maintenance machinery, were stored at this location. Such machinery was present on 19th July, and there was loading/unloading of gravel in the colony in the days before and after this. As this colony is directly adjacent to two roads, it is expected that the nesting terns are relatively resilient to vehicular disturbance, but their nests and flightless chicks are at risk from trampling by humans or vehicles.

Low-tide Rising-tide

Landbúnaðarháskóli Íslands Andakíll Protected Habitat Area Monitoring 2017 Estuarine Monitoring Final Report 96 | Page
Figure 3 131. Number of Sterna paradisaea recorded during weekly low tide and
rising tide estuarine
surveys in the Andakíll
Ramsar
site between 12th March and 25th October 2017. 0 100 200 300 400 500 600 700 800 10 11 12 13 14 15 16 17 18 19 20 21 22 23 24 25 26 27 28 29 30 31 32 33 34 35 36 37 38 39 40 41 42 43 Mar Apr May Jun Jul Aug Sep Oct Number of individuals Week number and month
(a) Low tide
(b) Rising tide
Figure 3 132. Relative abundance of Sterna paradisaea during weekly (a) low tide and (b) rising tide estuarine surveys in the Andakíll Ramsar site between 12th March and 25th October 2017. Dots are randomly positioned within each subsite. While each dot refers to a single bird, it refers to the bird’s presence in that subsite only, and not the bird’s actual location.


(a) Spring
(b) Autumn
Figure 3-133. Relative abundance during (a) spring and (b) autumn of Sterna paradisaea counted on twice weekly estuarine surveys in the Andakíll Ramsar site in 2017. Spring = 12th March 7th June; Autumn = 12th June 25th October. The number of dots in each subsite refers to the total number of bird records (from weekly low tide and rising tide surveys) in spring and autumn, adjusted for the length of the season, and reflects the species’ abundance in that season, not the specific location of birds.
(a) Low tide
(b) Rising tide
Figure 3 134. Proportion of foraging and roosting Sterna paradisaea during weekly (a) low tide and (b) rising tide estuarine surveys in six subsites in the Andakíll Ramsar site between 12th March and 25th October 2017.
Landbúnaðarháskóli Íslands Andakíll Protected Habitat Area Monitoring 2017 Estuarine Monitoring Final Report 97 | Page
Parasitic Jaeger / Arctic Skua Stercorarius parasiticus Kjói
Arctic Skuas were recorded in most surveys between 18th April and 31st July, and records were distributed throughout the survey area. Several nesting territories were recorded within the Andakíll Ramsar site (Tierney & Tierney 2020).
Low-tide Rising-tide
of


Week number and month
Figure 3 135. Number of Stercorarius parasiticus recorded during weekly low tide and rising tide estuarine surveys in the Andakíll Ramsar site between 12th March and 25th October 2017.
(a) Low tide
Rising tide
Figure 3 136. Relative abundance of Stercorarius parasiticus during weekly (a) low tide and (b) rising tide estuarine surveys in the Andakíll Ramsar site between 12th March and 25th October 2017. Dots are randomly positioned within each subsite. While each dot refers to a single bird, it refers to the bird’s presence in that subsite only, and not the bird’s actual location.

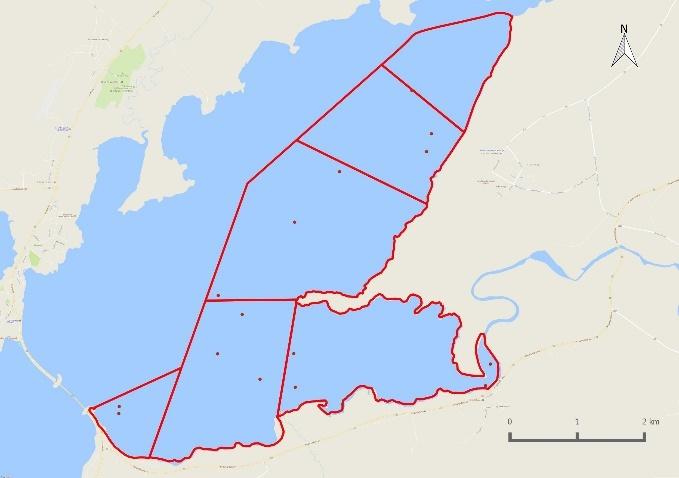
Other species
Several other species were observed during low tide and rising tide surveys, but are not covered here as they do not rely on estuarine habitat. A White tailed Eagle Haliaeetus albicilla territory was occupied, and one or both of the pair were recorded on most surveys between 12th March and 16th October. However, no breeding activity was detected. A Gyrfalcon Falco rusticolus was recorded during the low tide survey on 2nd October.
Landbúnaðarháskóli Íslands Andakíll Protected Habitat Area Monitoring 2017 Estuarine Monitoring Final Report 98 | Page
0 2 4 6 8 10 11 12 13 14 15 16 17 18 19 20 21 22 23 24 25 26 27 28 29 30 31 32 33 34 35 36 37 38 39 40 41 42 43 Mar Apr May Jun Jul Aug Sep Oct Number
individuals
(b)
4. Recommendations
4.1 Uses of the dataset
These data are of value for the conservation of estuarine habitats and estuarine birds in Andakíll, and should act as a foundation for more pure research into particular species or patterns. These data are potentially useful for conservation casework, and could be used for objective decision making on (changes to) land management, or to avert or mitigate against potentially damaging activities or developments. These data can be used, or built upon, for research purposes, e.g. to investigate how waterbird distributions vary according to prey densities or to look at species’ habitat use and preferences. Or at a larger spatial scale, to investigate variation in the density of waterbirds between estuaries in relation to variables like estuary location or sediment type.
4.2 Monitoring and research in the future
We have been successful in gathering baseline data on the waterbirds in the Andakíll Ramsar site, and the data recorded is likely to be a reasonably predictor of longer term distributions. However, it would be short sighted to consider this as a completed undertaking. Changes in invertebrate distribution or abundance, or increases in external pressures (e.g. human activities) could result in broad scale changes in waterbird usage of the site. Long term monitoring schemes have many advantages compared to once off or reactive surveys. A long term scheme, with regular surveys and standardised methodology will yield data of a consistent nature. Surveys carried out on an ad hoc basis, instigated as and when a need arises, are unlikely to be consistent, which makes comparisons and assessments of population trends difficult. Furthermore, carrying out short term ad hoc surveys can only address short term issues. And some important questions can only be answered using a suite of consistent surveys carried out at regular intervals over a longer time period. These include the effects of climate change or sea level rise or gradual changes in pollution levels or disturbance. Waiting for a problem to be identified before carrying out a survey can greatly reduce the chance of being able to measure its impact.
Therefore, it is recommended that some form of repeat surveys are conducted, ideally at regular intervals. Potential approaches to scaling back on the amount of time or effort required, while still ensuring comparable data include: covering a smaller area (provided the areas surveyed allow comparison with the existing subsite boundaries), surveying at a reduced frequency, or focusing on particular species or species groups. Suggested approaches, instructions and field recording materials are provided in Stroud & Tierney (2017). Nonetheless, some modifications and developments could be introduced to add value to the process.
Aside from regular monitoring, targeted research could be undertaken to scrutinise some of the patterns of waterbird presence in the estuary such as, for example, between site movements, or investigations into prey distribution and abundance. Colour ringing would elucidate patterns and timing of movements; facilitate the calculation of survival rates; and expand on knowledge of staging, moulting and wintering areas.
Jónsson (2011) and Tierney et al. (2020) investigated Shelduck use of the site and estimated the number of breeding pairs. However, further exploration into this expanding population would undoubtedly be enlightening. Colour ringing would be especially pertinent as a means to determine their wintering areas. The use of geolocators or GPS devices would provide such information quicker,
Landbúnaðarháskóli Íslands Andakíll Protected Habitat Area Monitoring 2017 Estuarine Monitoring Final Report 99 | Page
as well as arrival and departure dates; the proportion of migratory and sedentary birds in the population; and fine scale investigation of habitat use.
5. Acknowledgements
We are extremely grateful to Dr. Björn Þorsteinsson, Dr. Hlynur Óskarsson, Ragnhildur Jónsdóttir and Ragnar Frank Kristjánsson for seeing the value in this work, and for helping us to get the project up and running. We thank Náttúruverndarsjóður Pálma Jónssonar, who funded part of this work
6. References
BirdLife International. 2001. Important Bird Areas and Potential Ramsar Sites in Europe. BirdLife International, Wageningen
BirdLife International 2020 Species factsheet: Mareca penelope. Downloaded from http://www.birdlife.org on 24/05/2020.
Boere, G.C., Galbraith, C.A. & Stroud, D.A. (eds) 2007. Waterbirds Around the World. Edinburgh: The Stationery Office.
Bohning-Gaese, K. & Lemoine, N. 2004. Importance of climate change for the ranges, communities and conservation of birds. Advances in Ecological Research 35, 211 236.
Davidson, N.C. and Rothwell, P.I. 1993 Disturbance to waterfowl on estuaries. Wader Study Group Bulletin Special Issue 68, 3 5
Delany, S., Veen, J. & Clark, J.A. (eds) 2006. Urgent preliminary assessment of ornithological data relevant to the spread of Avian Influenza in Europe. Report to the European Commission. Study contract: 07010401/2005/425926/MAR/B4. Authors: Atkinson, P.W., Clark, J.A., Delany, S., Diagana, C.H., du Feu, C., Fiedler, W., Fransson, T., Gaulthier Clerc, M., Grantham, M.J., Gschweng, M., Hagemeijer, W., Helmink, T., Johnson, A., Khomenko, S., Martakis, G., Overdijk, O., Robinson, R.A., Solokha, A., Spina, F., Sylla, S.I., Veen, J. & Visser, D.
Dias, M. 2009 Use of salt ponds by wintering shorebirds throughout the tidal cycle. Waterbirds 32, 531 537.
Dias, M.P., Granadeiro, J.P., Lecoq, M., Santos, C.D. and Palmeirim, J.M. 2006. Distance to high tide roosts constrains the use of foraging areas by dunlins: implications for the management of estuarine areas. Biological Conservation 131, 446 452.
Durell, S.E.A. le V. dit, Stillman, R., Caldow, R.W.G., McGrorty, S., West, A.D. and Humphreys, J. 2006 Modelling the effect of environmental change on shorebirds: a case study on Poole Harbour, UK. Biological Conservation 131, 459 473.
Eiríksdóttir, E.S., Gíslason, S.R., Snorrason, A., Harðardóttir, J., Þorláksdóttir, S.B., &. Eyþórsdóttir, K.G. 2010. Efnasamsetning, rennsli og aurburður straumvatna á Vesturlandi IV. Gagnagrunnur Raunvísindastofnunar og Orkustofnunar. RH21 2010, 46 bls. [In Icelandic].
Landbúnaðarháskóli Íslands Andakíll Protected Habitat Area Monitoring 2017 Estuarine Monitoring Final Report 100 | Page
Fujii, T. 2012. Climate Change, Sea Level Rise and Implications for Coastal and Estuarine Shoreline Management with Particular Reference to the Ecology of Intertidal Benthic Macrofauna in NW Europe. Biology 1, 597 616.
Galbraith, H., Jones, R., Park, R., Clough, J., Herrod Julius, S., Harrington, B. and Page, G. 2005 Global climate change and sea level rise: potential losses of intertidal habitat for shorebirds. Washington DC: USDA Forest Service General Technical Report. Pp. 1119 1122
Gill F, D Donsker & P Rasmussen (Eds). 2020. IOC World Bird List (v10.1). doi 10.14344/IOC.ML.10.1.
Goss Custard, J.D. and Yates, M.G. 1992 Towards predicting the effect of salt marsh reclamation on feeding bird numbers on the Wash. Journal of Applied Ecology 29, 330 340.
Granadeiro, J.P., Dias, M.P. Dias, Martins, R.C. & Palmeirim, J.M. 2006. Variation in numbers and behaviors of waders during the tidal cycle: implications for the use of estuarine sediment flats. Acta Oecological 29(2), 293 300.
IPCC. 2007. Fourth Assessment Report: Climate Change 2007 (AR4) Pachauri, R.K. and Reisinger, A. (Eds.) IPCC, Geneva, Switzerland.
Jónsson, J.E. 2011. Brandendur í Borgarfirði 2007 og 2008. Bliki 31: 25 30. [In Icelandic with English summary.
Skarphéðinsson, K.H., Katrínardóttir, B., Guðmundsson, G.A.& Auhage, N.V.S. 2016. Mikilvæg fuglasvæði á Íslandi. Fjölrit Náttúrufræðistofnunar Nr. 55, 295 s.
Little, C. 2000. The Biology of Soft Shores and Estuaries. Oxford University Press: Oxford, UK.
Mustin, K., Sutherland, W.J. & Gill, J.A.2007. The complexity of predicting climate-induced ecological impacts. Clim. Res 35, 165 175.
McCarty, J.P. 2001 Ecological consequences of recent climate change. Conservation Biology 15, 320 331.
McLusky, D.S. & Elliott, M. 2004. The Estuarine Ecosystem: Ecology, Threats and Management, 3rd ed Oxford University Press: Oxford, UK.
McDonald, K.W., McClure, C.J.W., Rolek, B.W. & Hill, G.E. 2012 Diversity of birds in eastern North America shifts north with global warming. Ecology and Evolution 2, 3052 3060.
Olafsson, J., Adalsteinsson, H. & Gíslason, G. 2006. Vistfræði vatnsfalla á Íslandi, flokkun með tilliti til rykmýs. Orkuþing 2006, 218 223. [In Icelandic.]
Poulin, R. & Mouritsen, K.N. 2006. Climate change, parasitism and the structure of intertidal ecosystems. Journal Helminthology 80, 183 191.
Prater, A.J. 1981. Estuary Birds of Britain and Ireland. A Report of the Birds of Estuaries Enquiry. Calton: T. & A.D. Poyser Ltd.
Rogers, D.I. 2003. High tide roost choice by coastal waders. Wader Study Group Bulletin 100, 73 79.
Landbúnaðarháskóli Íslands Andakíll Protected Habitat Area Monitoring 2017 Estuarine Monitoring Final Report 101 | Page
Stroud, R.A. & Tierney, N. 2017. Survey Handbook: Landbúnaðarháskóli íslands Andakíll Ramsar Bird Monitoring Programme. Available online at: https://andakillbirdmonitoring2017.wordpress.com/counter handbook/counter handbook 2/
Sutherland, W.J., Alves, J.A., Amano, T., Chang, C.H., Davidson, N.C., Max Finlayson, C., Gill, J.A., Gill, R.E., González, P.M., Gunnarsson, T.G., Kleijn, D., Spray, C.J., Székely, T. & Thompson, D.B.A. 2012. A horizon scanning assessment of current and potential future threats to migratory shorebirds. Ibis 154, 663 679.
Thompson, D.B.A., Kålås, J.A. & Byrkjedal, I. 2012. Arctic-alpine mountain birds in northern Europe: contrasts between specialists and generalists. In Fuller, R.J.(ed.) Birds and Habitat: Relationships in Changing Landscapes: 237 252. Cambridge: Ecological Review Series, Cambridge University Press.
Thrainsson, S., Þorsteinsson, B. Oskarsson, H. & Sigurdardottir, R. 2013. Information Sheet on Ramsar Wetlands Andakill Protected Habitat Area. Available online: rsis.ramsar.org/RISapp/files/RISrep/IS2129RIS.pdf Accessed 30th November, 2017.
Tierney, N., Tierney, R.A., Björnsson, Þ., Kolbeinsson, Y., Townsend, S.E., & Petersen. A. 2020. Status and distribution of Shelduck in Iceland with special reference to the core area in Borgarfjörður. Wildfowl 70: 127 147.
Tierney, N. & Stroud, R.A. 2018. Greenland White fronted Geese in Hvanneyri: studies during spring and autumn in 2017. Landbúnaðarháskóli Íslands Report no. 89. 40 pages.
Tierney, R.A & Tierney, N 2020. Breeding birds in the Andakíll Ramsar site: distribution and abundance in 2017 Landbúnaðarháskóli Íslands Report no. 91. 32 pages
Þráinsson, G., Pétursson, G. & Ólafsson, E. 1994. Sjaldgæfir fuglar á Íslandi 1992. Bliki 14, 17 48. [In Icelandic with English summary.]
van de Kam, J., Ens, B., Piersma, T. and Zwarts, L. 2004 Shorebirds: an illustrated behavioural ecology. Utrecht, The Netherlands: KNNV Publishers.
van Gils, J. A., Spaans, B., Dekinga, A. and Piersma, T. 2006 Foraging in a tidally structured environment by red knots (Calidris canutus): ideal, but not free. Ecology 87, 1189 1202.
Watkinson, A. R., Gill, J. A. and Hulme, M. 2004. Flying in the face of climate change: a review of climate change, past, present and future. Ibis 146 S1, 4 10.
Landbúnaðarháskóli Íslands Andakíll Protected Habitat Area Monitoring 2017 Estuarine Monitoring Final Report 102 | Page
7. Appendices
7.1 Appendix 1
Survey dates and details
Table 7 1. Low tide and rising tide survey dates of estuarine surveys in the Andakíll Ramsar site between 12th March and 25th October 2017
Month Week Survey type Date
Month Week Survey type Date
10 Low tide 12-Mar 27 Low tide 06-Jul
12 Low tide 20-Mar 27 Rising tide 07-Jul
Rising tide 21-Mar 28 Low tide 10-Jul
13 Low tide 27-Mar 28 Rising tide 10-Jul
13 Rising tide 28-Mar 29 Rising tide 17-Jul
14 Low tide 03-Apr 29 Low tide 19-Jul
14 Rising tide 04-Apr 30 Low tide 24-Jul
15 Rising tide 11-Apr 30 Rising tide 24-Jul
Low tide 12-Apr 31 Rising tide 31-Jul
16 Rising tide 17-Apr 31 Low tide 02-Aug
Low tide 18-Apr 32 Low tide 06-Aug
Low tide 24-Apr 32 Rising tide 07-Aug
17 Rising tide 26-Apr 35 Low tide 30-Aug
Low tide 03-May 35 Rising tide 30-Aug
Rising tide 03-May 36 Low tide 04-Sep
Low tide 08-May 36 Rising tide 06-Sep
Rising tide 08-May 37 Low tide 11-Sep
Low tide 15-May 37 Rising tide 12-Sep
Rising tide 15-May 38 Rising tide 18-Sep
Rising tide 23-May 38 Low tide 19-Sep
Low tide 24-May 39 Low tide 25-Sep
Low tide 31-May 39 Rising tide 26-Sep
Rising tide 31-May
Rising tide 05-Jun
Low tide 07-Jun
Low tide 12-Jun
Rising tide 12-Jun
Rising tide 19-Jun
Low tide 21-Jun
Low tide 26-Jun
Rising tide 26-Jun
Low tide 02-Oct
Rising tide 02-Oct
Low tide 09-Oct
Rising tide 11-Oct
Low tide 16-Oct
Rising tide 17-Oct
Low tide 23-Oct
Rising tide 25-Oct
Landbúnaðarháskóli Íslands Andakíll Protected Habitat Area Monitoring 2017 Estuarine Monitoring Final Report 103 | Page
12
15
16
17
18
18
19
19
20
20
21
21
22
22
40
23
40
23
41
24
41
24
42
25
42
25
43
26
43
26
September October March April May June July August
7.2 Appendix 2 Field recording forms
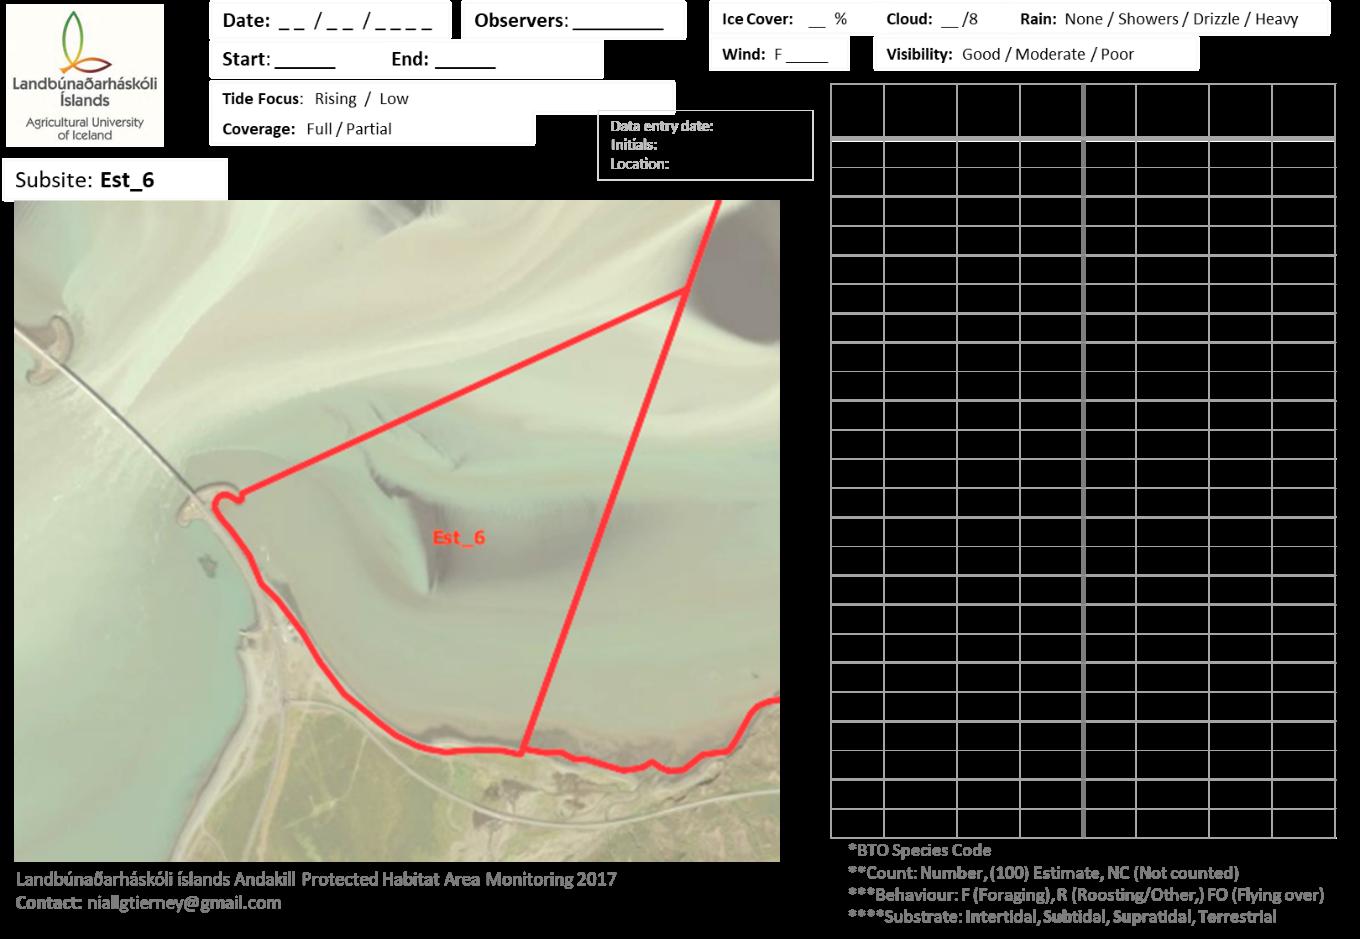
Landbúnaðarháskóli Íslands Andakíll Protected Habitat Area Monitoring 2017 Estuarine Monitoring Final Report 104 | Page
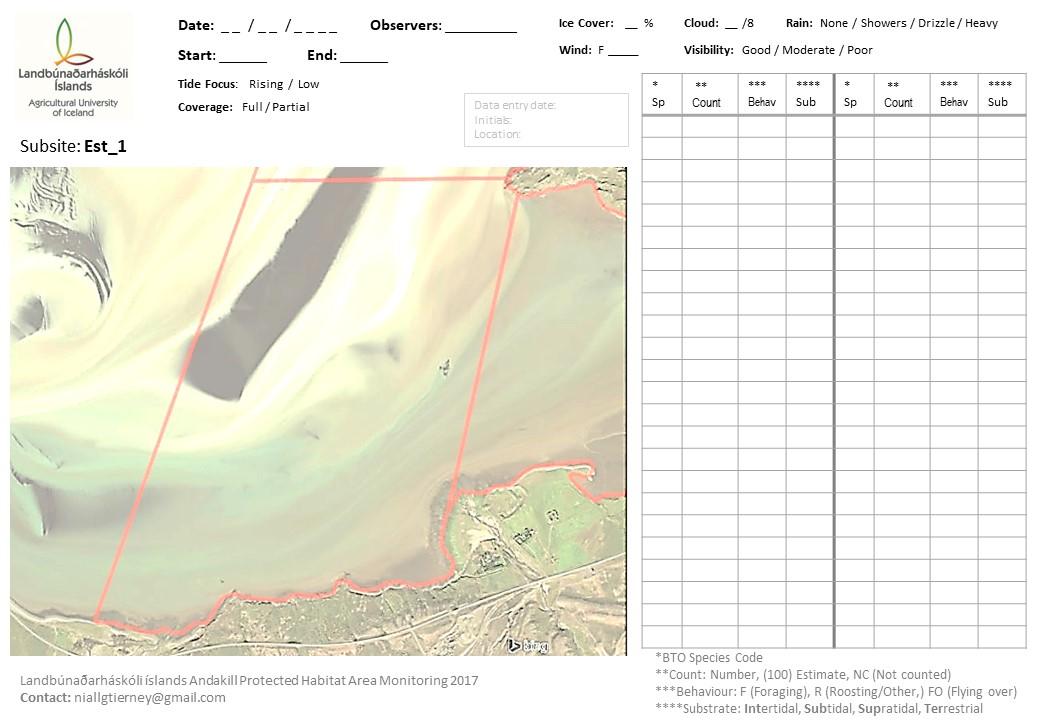

Landbúnaðarháskóli Íslands Andakíll Protected Habitat Area Monitoring 2017 Estuarine Monitoring Final Report 105 | Page
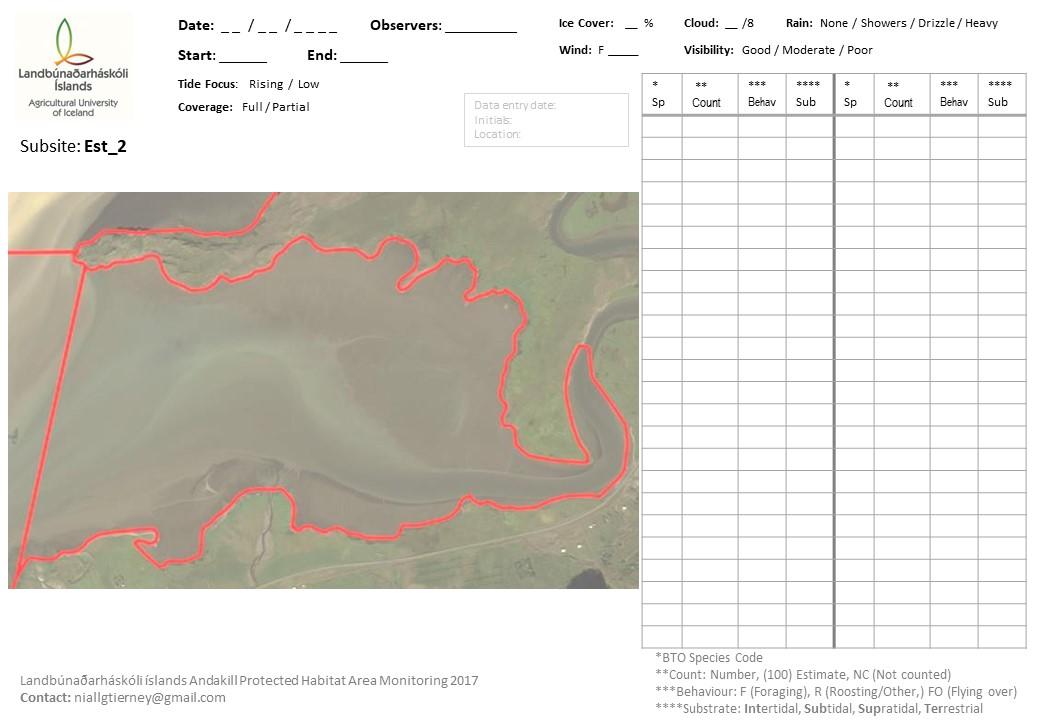

Landbúnaðarháskóli Íslands Andakíll Protected Habitat Area Monitoring 2017 Estuarine Monitoring Final Report 106 | Page
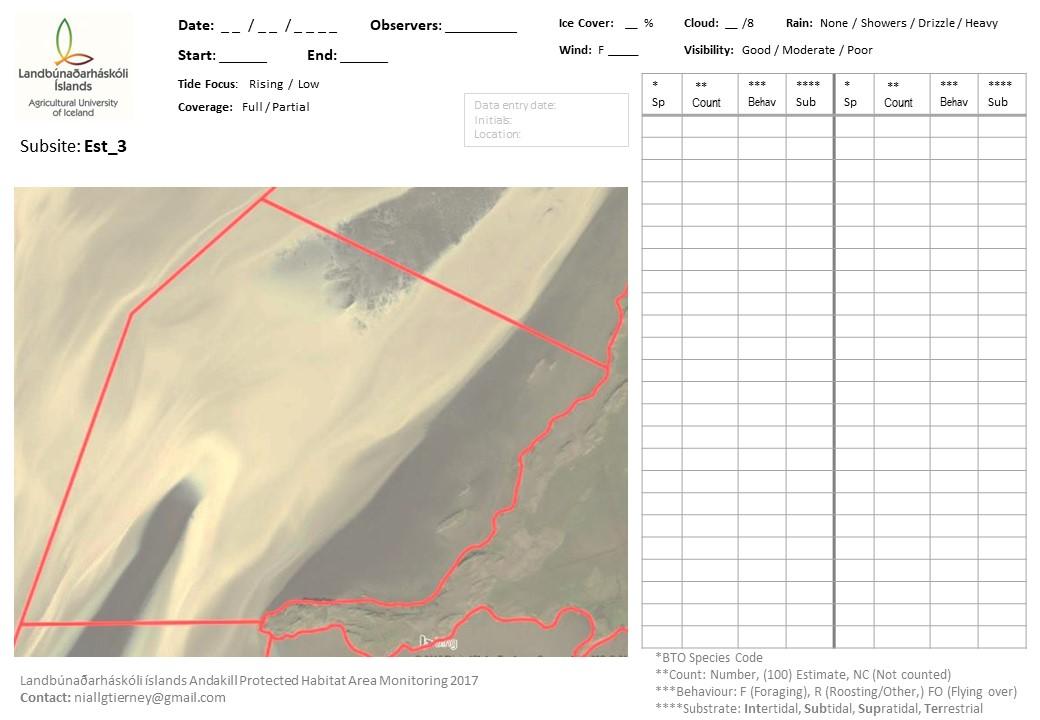

Landbúnaðarháskóli Íslands Andakíll Protected Habitat Area Monitoring 2017 Estuarine Monitoring Final Report 107 | Page
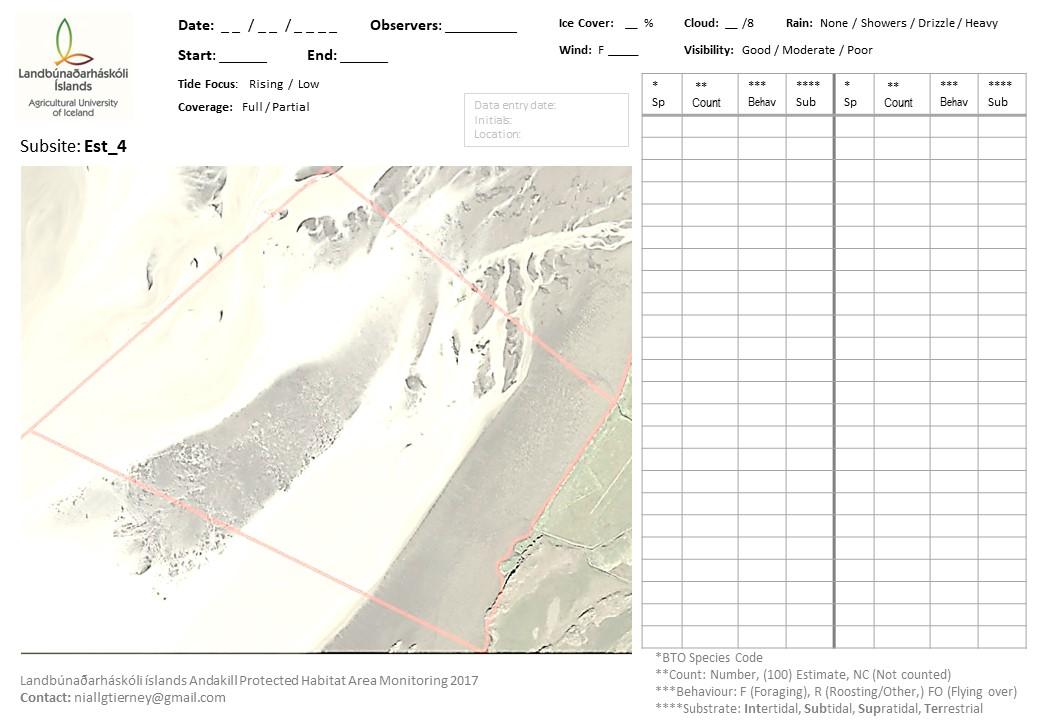
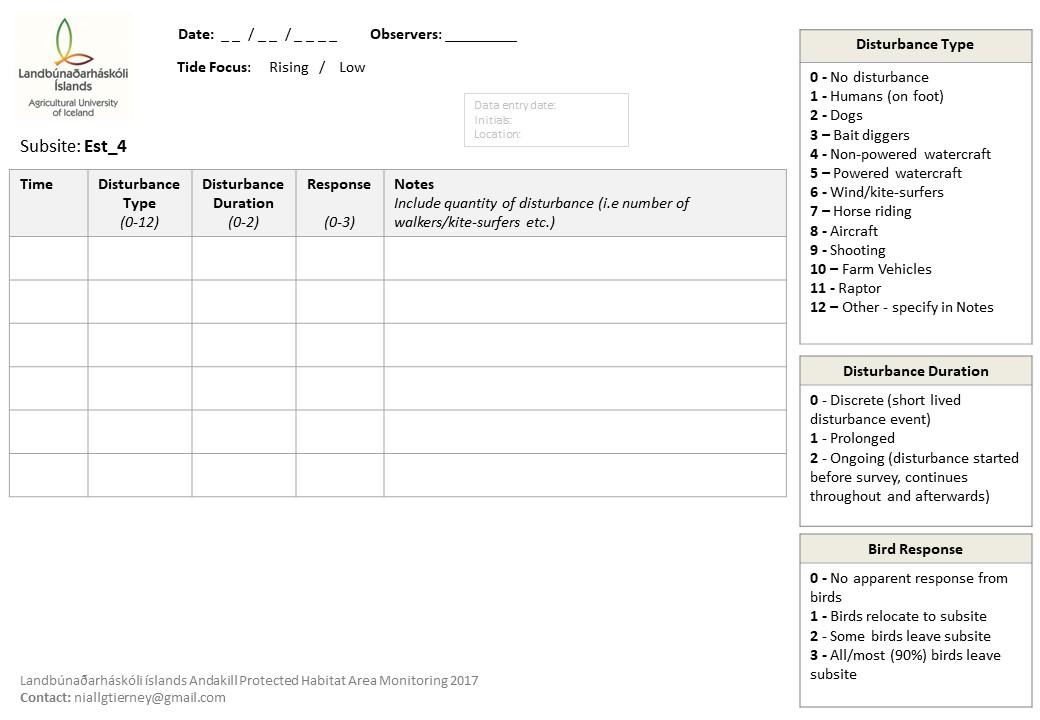
Landbúnaðarháskóli Íslands Andakíll Protected Habitat Area Monitoring 2017 Estuarine Monitoring Final Report 108 | Page

Landbúnaðarháskóli Íslands Andakíll Protected Habitat Area Monitoring 2017 Estuarine Monitoring Final Report 109 | Page


