REVIEW OF BULAHDELAH FLOODPLAIN RISK MANAGEMENT STUDY AND PLAN FLOOD STUDY REVIEW


Report MHL2789
July 2023
Prepared for: MidCoast Council

Department of Planning, Industry and Environment
Cover Photograph: Flooding of Stroud Street, Looking North, on 8 June 2007. Courtesy of Eric Saville
Review of Bulahdelah floodplain risk management study and plan
Flood study review
Report MHL2789
July 2023
Bronson McPherson Director of Engineering, MHL
110b King Street
Manly Vale NSW 2093
T: 02 9949 0200
E: Bronson.McPherson@mhl.nsw.gov.au
W: www.mhl.nsw.gov.au
Document Control
COPYRIGHT NOTICE
This document, Review of Bulahdelah Floodplain Risk Study and Plan 2023, is licensed under the Creative Commons Attribution 4.0 Licence, unless otherwise indicated. Please give attribution to: © MidCoast Council 2023
We also request that you observe and retain any notices that may accompany this material as part of the attribution.
Notice Identifying Other Material and/or Rights in this Publication:
The author of this document has taken steps to both identify third-party material and secure permission for its reproduction and reuse. However, please note that where these third-party materials are not licensed under a Creative Commons licence, or similar terms of use, you should obtain permission from the rights holder to reuse their material beyond the ways you are permitted to use them under the Copyright Act 1968 Please see the Table of References at the rear of this document for a list identifying other material and/or rights in this document.
Further Information
For further information about the copyright in this document, please contact: MidCoast Council
Yalawanyi Ganya 2 Biripi Way PO Box 482, Taree NSW 2430 council@midcoast.nsw.gov.au
02 7955 7777
DISCLAIMER
The Creative Commons Attribution 4.0 Licence contains a Disclaimer of Warranties and Limitation of Liability. In addition: This document (and its associated data or other collateral materials, if any, collectively referred to herein as the ‘document’) were produced by Manly Hydraulics Laboratory for MidCoast Council only. The views expressed in the document are those of the author(s), or as informed by the FRM Committee, and do not necessarily represent the views of the MidCoast Council. Reuse of this study or its associated data by anyone for any other purpose could result in error and/or loss. You should obtain professional advice before making decisions based upon the contents of this document.
Report Classification
☒ Public Report existence and contents publicly available.
Report No. MHL2789
First published as draft in December 2020
SEO SYSTEM Manly Hydraulics Laboratory is Safety, Environment & Quality System Certified to AS/NZS 4801, ISO 14001 and ISO 9001
110B King Street
Manly Vale NSW 2093
T 02 9949 0200


TTY 1300 301 181
ABN 20 770 707 468 www.mhl.nsw.gov.au

Issue/ Revision Author Reviewer Approved for Issue Name Date Draft Report A. Severi; M. Glatz B. McPherson B. McPherson 28/07/2021 Draft Report v2 M. Glatz B. McPherson B. McPherson 20/09/2021 Draft Report v3 M. Glatz B. McPherson B. McPherson 17/07/2023
Foreword
NSW government’s professional specialist advisor, Manly Hydraulics Laboratory (MHL) were commissioned by MidCoast Council to undertake a review of the Bulahdelah Floodplain Risk Management Study and Plan.
The report was prepared by Armaghan Severi, Matthieu Glatz and Bronson McPherson. This report is release by consent report classification and is for the use of MidCoast Council only for the purposes of the specific engagement of services agreed to be provided by MHL. No part of it may, in any form or by any means, be reproduced, altered, manipulated, stored in a retrieval system or transmitted without prior written consent without prior written permission from the Director, Manly Hydraulics Laboratory.
© Crown 2021
Classification: Release by consent
MHL2789 – i
Executive summary
The Review of Bulahdelah Floodplain Risk Management Study and Plan (FRMSP) consists of a two-stage review: the first stage consists of reviewing the flood study and the second stage consists of reviewing the floodplain risk management study and plan. This report documents the review of the flood study and has been prepared in accordance with the New South Wales Government’s Floodplain Development Manual (2005) A flood study is the first step of the floodplain management process set up to reduce flood risks and private/public losses resulting from flood while using eco-friendly solution where possible.
Manly Hydraulic Laboratory (MHL) were engaged by MidCoast Council (Council) to undertake the Review of Bulahdelah Floodplain Risk Management Study and Plan The original flood study was completed in 1991 using a 1D model and the FRMSP was completed in 2002-2003. The previous studies, while providing relevant information that relates to the flooding of Bulahdelah, were completed prior to the creation of the latest guidelines It was therefore required to update the model of the area using a two-dimensional TUFLOW model with inflow from an updated WBNM hydrological model for the estimation of mainstream (i.e. from the Myall and Crawford Rivers) and potential local overland (i.e. in Bulahdelah township) flood behaviour in the study area. This also took into account the performance of the stormwater drainage network including overflows from the drainage network.
The study outputs will inform the subsequent review of the FRMSP as well as decision making for investing in the floodplain; managing flood risk through prevention, preparedness, response and recovery activities; pricing insurance, and informing and educating the community on flood risk and response to floods. Each of these areas has different user groups or stakeholder, whose needs vary. Meeting the requirements of the identified end user groups and stakeholders in regards to flooding, is a key objective of this study.
The study has been overseen and guided by the Floodplain Management Advisory Committee of MidCoast Council, which includes representatives from key stakeholder and end user groups.
The flood study review has been completed to provide a detailed flooding assessment of Bulahdelah and the surrounding local catchment. The objective of this study is to improve understanding of flood behaviour and impacts, and better inform management of flood risk in the study area. The study also provides a sound technical basis for further flood risk management investigation in the area.
The key components of the flooding assessment included:
• Review of previous studies and available data
• Community consultation
• Hydrological analysis and modelling
• Hydraulic analysis and modelling
• Calibration and validation of the hydraulic model
• Sensitivity analysis
MHL2789 – ii
Crown 2021 Classification: Release by consent
©
• Flood mapping
• Description of consequences of flooding
• Development of a draft flood study review report followed by a final report
The hydraulic model was calibrated and validated against recent historical events including the March 2021 flood event. The model provided a fair match with available data such as recorded water levels at local gauges, historical photographs information provided by local community members and flood marks measured around Bulahdelah by MHL’s project team following the March 2021 event
The flood maps appended to this report are presenting the flood levels, depths and velocities for the critical duration and rainfall pattern of a full set of events including the 20%, 5%, 1%, 1 in 200, 1 in 500 AEP and Probable Maximum Flood (PMF) events and represent an envelope of the critical duration/pattern of a selected representative catchment for the Bulahdelah township and the critical duration/pattern for the Myall River. The township catchment is very flashy with very short critical durations between 45 minutes and 2 hours to reach the peak level while the river catchment have typical critical durations ranging between 6 hours and 18 hours
Sensitivity analysis highlighted the following points:
• Tailwater conditions (including sea level rise) typically have relatively small impact on river flooding levels due to a number of natural choke points located at various locations along the Myall River raising the level much higher than the downstream level However, for smaller catchment events that do not lead to a major response in the overall river catchment flooding, changes in Bombah Broadwater levels will propagate directly up the Myall River.
• Changes in roughness or in antecedent conditions of the catchment (wet/dry catchment leading to varying losses) could have moderate impacts on river flooding and low impact on overland flooding.
• Blockages of structures can have severe impact in areas with no gravity flow that only rely on the drainage network (e.g. ponding area), and maintaining the pits and pipes network is essential to avoid exacerbating the flooding in such locations. It is also noted that no blockage can lead to small increases in flood level at the downstream end of the township.
The above results allowed the definition of the flood hazard (i.e. H1-H6 flood life hazard categories) and hydraulic categories in the Bulahdelah catchment. These have been created and mapped to inform development control planning.
Results of the model allow the identification of main flooding areas, key infrastructure impacted by flooding and road closures around the catchments. Key infrastructure typically may have impeded access during severe flood events rather than being flooded, except during the PMF event.
Key issue areas potentially subject to deep flooding from the river include:
• Properties located west of Stroud Street and south of Jackson Street (including most properties along Jackson Street);
• Properties located in the two blocks enclosed within Prince Street, Richmond Street,
MHL2789 – iii
© Crown 2021 Classification: Release by consent
Alexandra Street and Jackson Street;
• Properties east of Stroud Street and west of Crawford Street between Meade Street and Jackson Street; and
• The area around the intersection of River Street and Richmond Street.
Key problem areas subject to shallower overland flooding include:
• Properties between Myall Street and Edgar Street at the southern end of the streets;
• Properties located along the drainage channel linking Stroud Street to Richmond Street via Alexandra Street;
• Properties along the flowpath linking Mackenzie Street to Crawford Street via Harold Street, Rosewood Street, Bulahdelah Way and Meade Street;
• Properties along the flowpath linking Bulahdelah Way to Crawford Street halfway between Stuart Street and Blanch Street, as well as properties along the western side of Crawford Street between this flowpath and Stuart Street; and
• Properties at the northeastern end of Suncrest Close.
Stroud Street, Jackson Street and Markwell Road near Markwell Bridge are inundated during a 20% AEP. Apart from Stroud Street, road closures predominantly occur on secondary roads with most of the major road closures occurring for the PMF only. It is also noted that given the flashy behaviour of the catchment, flooding and road closures in the upper township catchment would be of relatively short duration, while flooding of the areas surrounding the river may last from several hours to a few days
– iv
Crown 2021 Classification: Release by consent
MHL2789
©
MHL2789 – v © Crown 2021 Classification: Release by consent Contents FOREWORD I EXECUTIVE SUMMARY II CONTENTS V 1 INTRODUCTION 1 2 BACKGROUND 2 2.1 Study area 2 2.2 History of flooding and rainfall 2 2.3 Relevant policies, legislation and guidance 8 2.3.1 National provisions 8 2.3.2 State provisions 10 2.3.3 Local provision 14 2.4 Land use 14 2.5 Demographic overview 14 3 PREVIOUS STUDIES 17 3.1 Bulahdelah Flood Appraisal, NSW Public Works Department, 1991 17 3.2 Frys Creek Flood Study, NSW Public Works Department, 1994 18 3.3 Myall River Floodplain Risk Management Study for Bulahdelah, Department of Land and Water Conservation, 2002 21 3.4 Myall River Floodplain Risk Management Plan for Bulahdelah, Department of Infrastructure, Planning and Natural Resources, 2003 23 3.5 Bulahdelah Upgrading the Pacific Highway, Parsons Brinckerhoff, 2004 23 3.6 Lower Myall River and Myall Lakes Flood Study, BMT, 2015 24 3.7 Flood Emergency Response Plan Bulahdelah Caravan Park, Cardno, 2017 26 4 DATA COLLECTION AND REVIEW 28 4.1 Water level and rainfall data 28 4.2 Site inspection 31 4.3 Topographic data 33 4.4 Aerial photography 33 4.5 Crawford River weir 33 4.6 Bridges 35 4.7 Pits and pipe network 36 4.8 Floor level and post-event survey 37 4.8.1 Post-event survey 37 4.8.2 Floor level survey 37 4.8.3 Additional ground survey 37 5 COMMUNITY CONSULTATION 38 5.1 Consultation process 38 5.2 Working group 38 5.3 Website 38 5.4 Letter and questionnaires 39 5.4.1 General approach 39 5.4.2 Questionnaire results 40 6 HYDROLOGICAL ANALYSIS 44 6.1 Model selection 44
MHL2789 – vi © Crown 2021 Classification: Release by consent 6.2 Model setup 44 6.2.1 Catchment delineation 44 6.2.2 Model parameters 44 6.2.3 ARR 2019 IFD data 51 6.2.4 ARR 2019 spatially varied IFDs 51 6.2.5 ARR 2019 temporal pattern 51 6.2.6 ARR 2019 areal temporal patterns 52 6.2.7 Areal reduction factors 52 6.3 Comparison with “At Site” and ARR 1987 data 53 6.4 Design events 54 6.5 Probable Maximum Flood event 54 6.6 Model results and critical durations 58 6.7 Discussion on Crawford and Myall Rivers flood coincidence 63 7 HYDRAULIC ANALYSIS 65 7.1 Model selection 65 7.2 Model setup 66 7.2.1 Model extent and grid size 66 7.2.2 Modelling approach 66 7.2.3 Hydraulic roughness 68 7.2.4 Boundary conditions 70 7.2.5 Blockage 73 7.2.6 Structures 73 7.2.7 Creeks and river representation 74 8 MODEL CALIBRATION AND VALIDATION 76 8.1 Methodology 76 8.2 Event selection 76 8.3 Model calibration – 1 to 4 March 2013 77 8.3.1 1-4 March 2013 event 77 8.3.2 Rainfall data 77 8.3.3 Intensity-Frequency-Duration analysis 77 8.3.4 Rainfall loss parameters 78 8.3.5 Upstream boundary condition 78 8.3.6 Downstream boundary condition 78 8.3.7 Rain radar observations 78 8.3.8 Model calibration results 79 8.4 Model validation – 21 to 22 April 2015 81 8.4.1 21-22 April 2015 event 81 8.4.2 Rainfall data 81 8.4.3 Intensity-Frequency-Duration analysis 82 8.4.4 Rainfall loss parameters 82 8.4.5 Upstream boundary condition 83 8.4.6 Downstream boundary condition 83 8.4.7 Rain radar observations 83 8.4.8 Model validation results 83 8.5 Model validation – 18 to 24 March 2021 86 8.5.1 18-24 March 2021 event 86 8.5.2 Rainfall data 86 8.5.3 Intensity-Frequency-Duration analysis 87 8.5.4 Rainfall loss parameters 88 8.5.5 Upstream boundary condition 88 8.5.6 Downstream boundary condition 88 8.5.7 Rain radar observations 88


MHL2789 – vii © Crown 2021 Classification: Release by consent 8.5.8 Model validation results 88 8.6 Discussion of Model Calibration and Validation 92 9 MODEL SENSITIVITY 93 9.1 Tailwater level sensitivity 93 9.2 Losses and roughness sensitivity analysis 93 9.3 Blockage sensitivity analysis 94 10 FLOOD MODELLING RESULTS 95 10.1 Flood modelling description 95 10.2 Flood mapping 95 10.2.1 Mapping filtering 95 10.2.2 Flood maps 95 10.3 Flood levels outputs 95 10.4 Comparison with previous study results 95 11 CONSEQUENCES ON THE COMMUNITY 99 11.1 Preamble 99 11.2 Flood behaviour 99 11.3 Key infrastructure assets 100 11.4 Road closure 101 12 POST-PROCESSING OF RESULTS 107 12.1 Preamble 107 12.2 Flood hazard 107 12.3 Flood function (hydraulic categorisation) 108 13 CONCLUSION 110 REFERENCES 112 SURVEY MARKS CHECKS 1 FLOOR LEVEL SURVEY RESULTS 1 COMMUNITY CONSULTATION COMMUNITY SURVEY FORM AND INFORMATION PACK 1 ARR 2019 DATA HUB RESULTS FOR BULAHDELAH 1 CALIBRATION DATA AND RESULTS 1 MODEL SENSITIVITY RESULTS 1 FLOOD MAPS 1 FLOOD HAZARD AND FLOOD FUNCTION MAPS 1
© Crown 2021 Classification: Release by consent
ABLES Table 2.1 Bulahdelah demographic overview based on the 2021 census. 16 Table 3.1 Frys Creek Flood study summary of water level results 19 Table 3.2 Frys Creek Flood study summary of discharge results 20 Table 3.3 Frys Creek Flood study summary of velocity results 20 Table 3.4 Summary of water level results. 22 Table 3.5 Peak flows for Myall River and tributaries. 22 Table 3.6 Proposed flood management measures. 23 Table 3.7 Peak flood levels at Bombah Points (m AHD). 25 Table 3.8 Modelled peak flood levels (m AHD) for a range of design events. 26 Table 3.9 Modelled peak flood levels (m AHD) for combined catchment and ocean derived design events. 26 Table 3.10 Flood levels in the vicinity of the Bulahdelah Caravan Park. 27 Table 4.1 Water level and rainfall stations n vicinity of the study area. 28 Table 6.1 Adopted impervious area percentage per sub-catchment 45 Table 6.2 GSDM summary for Bulahdelah Catchment 55 Table 6.3 GSAM summary for Bulahdelah Catchment 56 Table 6.4 GTSMR summary for Bulahdelah Catchment 57 Table 6.5 Critical durations for each design event 63 Table 6.6 Critical durations comparison between the Myall River and the Crawford River 64 Table 7.1 Adopted Manning’s n Hydraulic Roughness Coefficients 68 Table 7.2 Peak design levels at Bombah Point 70 Table 10.1 Summary of peak flood levels at various locations 96 Table 11.1 List of Key Infrastructure assets 100 Table 11.2 Peak depth, duration of flooding over 0.3 m and time to depth above 0.3 m at road closure location 105 Table 12.1 Hydraulic category criteria 109 FIGURES Figure 2.1 Locality map 3 Figure 2.2 Photograph provided by community 4 Figure 2.3 Stroud Street, Looking South, 8 June 2007 (courtesy of Eric Saville) 5 Figure 2.4 Stroud Street, Looking North, 8 June 2007 (courtesy of Eric Saville) 5 Figure 2.5 Jackson Street, Looking East, 8 June 2007 (courtesy of Eric Saville) 6 Figure 2.6 Jackson Street, Looking West, 21 April 2015 (courtesy of Eric Saville) 6 Figure 2.7 Stroud Street, Looking South, 21 April 2015 (courtesy of Eric Saville) 7 Figure 2.8 Extract of a newspaper article, Newcastle Sun Archives from Wednesday 20 April 1927 (https://trove.nla.gov.au/newspaper/article/125142777) 7 Figure 2.9 Extract of a newspaper article, Newcastle Sun Archives from Tuesday 26 March 1946 (https://trove.nla.gov.au/newspaper/article/158272189) 8 Figure 2.10 Land use 15 Figure 3.1 Model schematization (NSW Public Works Department, 1994) 19 Figure 4.1 Water level and rainfall stations 29 Figure 4.2 Water level data recorded at Bulahdelah Station 209460 30 Figure 4.3 Water level data recorded at Bombah Point Station 209475 30 Figure 4.4 Near-real-time rainfall data recorded at Bulahdelah Station 209460 30 Figure 4.5 Site inspection summary 32 Figure 4.6 Topographic data 34 Figure 4.7 Crawford River weir and fishway (NSW Fisheries Office of Conservation, 2003)35 Figure 5.1 Samples of the project website 39 Figure 5.2 Flooding along Lee Street (Photograph courtesy of Kevin Smith) 41 Figure 5.3 Flooding in Alexandra Street in 2020 (Photo Courtesy of Elfrieda McDean) 42
MHL2789 – viii
T
MHL2789 – ix © Crown 2021 Classification: Release by consent Figure 5.4 Full drainage channel looking downstream and upstream from Stroud Street in July 2020 (Photo Courtesy of John and Heather Lee) 42 Figure 6.1 Hydrological model catchment delineation 47 Figure 6.2 Sensitivity of flows to continuing loss for catchment upstream of Bulahdelah Bridge 48 Figure 6.3 Sensitivity of flows to initial loss for catchment upstream of Bulahdelah Bridge 49 Figure 6.4 Sensitivity of flows to Lag parameter for catchment upstream of Bulahdelah Bridge 50 Figure 6.5 Sensitivity of flows to Routing parameter for catchment upstream of Bulahdelah Bridge 50 Figure 6.6 Temporal pattern bins 52 Figure 6.7 Comparison of “At Site” IFD and 2016 IFD from BoM 53 Figure 6.8 Comparison of 1987 IFD and 2016 IFD from BoM 54 Figure 6.9 Critical temporal patterns (TP) distribution for the 1% AEP event at the township catchment (sub-catchment 76.01) 59 Figure 6.10 Critical TPs distribution for the 1% AEP event at the river catchment (subcatchment 1.31) 60 Figure 6.11 Design storm selection from 10 TPs for 1% AEP, 18-hour storm (sub-catchment 1.31) 61 Figure 6.12 TPs distribution for all durations for the 1% AEP event at the river catchment (sub-catchment 1.31) 62 Figure 7.1 TUFLOW model grid definition 67 Figure 7.2 TUFLOW model boundary conditions and Manning’s n 69 Figure 7.3 Comparisons of recorded data with tailwater level estimated using WBNM for March 2013 and March 2021 events 72 Figure 7.4 TUFLOW model showing hydraulic structures and 1D model layout 75 Figure 8.1 1-4 March 2013 Event Time-Series 77 Figure 8.2 IFD Comparison 1-4 March 2013 78 Figure 8.3 Bulahdelah and Crawford River Water Levels Calibration – 1-4 March 2013 80 Figure 8.4 21-22 April 2015 Event Time-Series 81 Figure 8.5 Cumulative Rainfall during the April 2015 event 81 Figure 8.6 IFD Comparison 21-22 April 2015 82 Figure 8.7 Bulahdelah and Crawford River Water Levels Validation – 21-22 April 2015 85 Figure 8.8 18-24 March 2021 Event Time-Series 86 Figure 8.9 Cumulative Rainfall during the March 2021 event 87 Figure 8.10 IFD Comparison 18-24 March 2021 87 Figure 8.11 Bulahdelah and Crawford River Water Levels Validation – 18-24 March 2021 90 Figure 8.12 Example of flood marks recorded following the March 2021 flood event 91 Figure 10.1 Flood level output locations 97 Figure 10.2 Comparison of 1% AEP flood levels between current and previous flood study 98 Figure 11.1 Key infrastructure locations 103 Figure 11.2 Road closure locations 104 Figure 12.1 General flood hazard vulnerability curves 107
1 Introduction
NSW Government’s Manly Hydraulics Laboratory (MHL) was engaged by MidCoast Council (Council) to undertake a review of the Floodplain Risk Management Study and Plan (FRMSP) for Bulahdelah following the NSW Government’s Flood Prone Land Policy update and with financial support from the Biodiversity, Conservation and Science group (BCS) of the NSW Department of Planning Industry and Environment (DPIE), as well as technical support from DPIE and the NSW State Emergency Services
There have been various hydrologic and hydraulic studies undertaken for the Bulahdelah catchments. The most recent study was the Myall River Floodplain Risk Management Study and Plan (DIPNR, 2003). The 2003 FRMSP reported the flood behaviour across the catchment for a range of design flood events for existing topographic and development conditions.
The objective of the present study is to review the 2003 Myall River Floodplain Risk Management Study and Plan for Bulahdelah focusing on flooding from Myall River and its tributaries as local catchment flows have already been studied in the Bulahdelah Stormwater Management Plan (Cardno, 2020)
1
MHL2789 –
© Crown 2021 Classification: Release by consent
2 Background
2.1 Study area
The focusof the present investigation isthe township of Bulahdelah and Frys Creekcatchment. The township of Bulahdelah is located approximately 70 km north-east of Newcastle, between the Pacific Highway and the Myall River near its confluence with the Crawford River.
The Myall River catchment upstream of Bulahdelah has a catchment area of approximately 370 km2 including its tributaries catchment areas of 125 km2 for the Crawford River and 18 km2 for Frys Creek. The catchment is steep upstream of Bulahdelah and flattens downstream of the township.
It is understood that the dominant flooding mechanism is the mainstream flooding from the Myall River and the Crawford River as no structures are protecting the township from floods. However, it is noted that the township can also be subject to local overland flooding. The flood behaviour has also been influenced by the construction of the new Pacific Highway in 2013. The study area is presented in Figure 2.1.
2.2 History of flooding and rainfall
Several significant historical floods were reported in 1897 and 1927. Smaller floods occurred in 1947 and 1953, and less severe floods happened in 1985 and 1987
The largest flood at Bulahdelah was reported in 1897, reaching the level of 5.5 m AHD on the upstream side of the highway bridge (at the existing Myall River Bridge) with an estimated magnitude of 100 year Average Recurrence Interval / ARI (equivalent to 1% Annual Exceedance Probability / AEP) (Public Works, 1991) The next largest reported flood occurred in 1927 reaching a levelof 5.1 m AHD at the highway bridge (at the existing Myall River Bridge) with an estimated magnitude of 50 year ARI (2% AEP). A flood level of 6.4 m AHD was reported at the confluence of the Myall and Crawford Rivers approximately 500 m upstream. A flood level of 6.5 m AHD was reported near the water supply weir in the Crawford River for both the 1897 and 1927 floods (Public Works, 1991)
A peak flood level of 3.7 m was reported at the highway bridge in October 1985 and November 1987. However, the 1985 flood was higher upstream of the bridge (Public Works, 1991) The largest events recorded by the water level gauge in Bulahdelah (installed in November 1984) are March 2021, April 2015, March 2013 and January 2016 events with the corresponding peak flood level of 4.3 m, 4.1 m, 3.9 m and 3.8 m The March 2021 flood occurred during the development of this study and MHL’s project team undertook some post-event surveys as described in Section 4.8
Some photographs of the past events have been provided by community members. The locations and orientation of the photographs are provided in Figure 2.2, and some examples are provided in Figure 2.3 to Figure 2.7.
Historical newspaper articles describing flooding at Bulahdelah have been provided in Figure 2 8 and Figure 2 9
MHL2789 – 2
Crown
Classification: Release
©
2021
by consent


N Figure2.1 Localitymap Cadastre Studyarea Legend ReportMHL2789 ReviewofBulahdelah FloodplainRisk ManagementStudy&Plan ©Crown2021/ImageSource:Google2021 MyallRiver CrawfordRiverPacificHway MyallRiver Bulahdelah Way Markwell Rd Stroud St Pacific Hway Prince St Alexandra St Myall St Crawford St LeeSt River St Edgar St MeadeSt Booloombayt St Bulahdelah Way BlanchSt ChurchSt MacKenzie St JacksonSt RichmondSt StuartSt Harold St Rosewood St FrysCreek Bombah Broadwater ©ImageSource:Nearmap2021
Photograph providedby community
Legend
Cadastre
Photographlocationand directionduringflood eventon: 8June2007 21April2015
ReportMHL2789
ReviewofBulahdelah FloodplainRisk ManagementStudy&Plan


N
Figure2.2
©Crown2021/ImageSource:Nearmap2021
Stroud St
Prince St Alexandra St Crawford St
BlanchSt LeeSt
JacksonSt
Figure2.5
Figure2.4
Figure2.3
Figure2.6
Figure2.7


MHL2789 – 5 © Crown 2021 Classification: Release by consent
Figure 2 3 Stroud Street, Looking South, 8 June 2007 (courtesy of Eric Saville)
Figure 2.4 Stroud Street, Looking North, 8 June 2007 (courtesy of Eric Saville)


MHL2789 – 6 © Crown 2021
Release by consent
Classification:
Figure 2.5 Jackson Street, Looking East, 8 June 2007 (courtesy of Eric Saville)
Figure 2.6 Jackson Street, Looking West, 21 April 2015 (courtesy of Eric Saville)


MHL2789 – 7 © Crown 2021 Classification: Release by consent
Figure 2.7 Stroud Street, Looking South, 21 April 2015 (courtesy of Eric Saville)
Figure 2.8 Extract of a newspaper article, Newcastle Sun Archives from Wednesday 20 April 1927 (https://trove.nla.gov.au/newspaper/article/125142777)
2.3 Relevant policies, legislation and guidance
2.3.1 National provisions
2.3.1.1 AustralianRainfallandRunoff,2019


Australian Rainfall and Runoff (ARR) is a national guideline document, data and software suite that is used for the estimation of design flood characteristics in Australia. This is the 4th edition of ARR after the 1st edition was released by Engineers Australia in 1958. Geoscience Australia supports ARR as part of its role to provide authoritative, independent information and advice to the Australian Government and other stakeholders to support risk mitigation and community resilience.
ARR is pivotal to the safety and sustainability of Australian infrastructure, communities and the environment. It is an important component in the provision of reliable and robust estimates of flood risk. Consistent use of ARR ensures that development does not occur in high-risk areas and that infrastructure is appropriately designed.
2.3.1.2 BuildingCodeofAustralia
The 2016 edition of the Building Code of Australia (BCA) introduced new requirements related
MHL2789 – 8 © Crown 2021 Classification: Release by consent
Figure 2.9 Extract of a newspaper article, Newcastle Sun Archives from Tuesday 26 March 1946 (https://trove.nla.gov.au/newspaper/article/158272189)
to building in Flood Hazard Areas (FHAs), which provide a minimum construction standard across Australia for specified building classifications in FHAs up to the Defined Flood Event (DFE).
The DFE is analogous to the planning flood event and is most commonly the 1% AEP flood. FHAs are defined in the BCA as encompassing land lower than the flood hazard level (FHL), which in turn is defined as ‘the flood level used to determine the height of floors in a building and represents the DFE plus the ‘freeboard’. Therefore, FHAs would typically be defined as those areas falling within the flood planning area.
Volume One, BP1.4, and Volume Two, P2.1.2 specify the Performance Requirements for the construction of buildings in FHAs. They only apply to buildings or parts of buildings of Classes 1, 2, 3, 4 (residential), 9a (health-care) and 9c (aged-care). These Performance Requirements require a building in an FHA to be designed and constructed to resist flotation, collapse and significant permanent movement resulting from flood actions during the DFE. The actions and requirements to be considered to satisfy this performance requirement include but are not limited to:
• Flood actions
• Elevation requirements
• Foundation and footing requirements
• Requirements for enclosures below the flood hazard level
• Requirements for structural connections
• Material requirements
• Requirements for utilities
• Requirements for occupant egress
The Deemed-to-Satisfy (DTS) provisions of Volume One, B1.6, and Volume Two, 3.10.3.0 require buildings in the classes described above and located in FHAs to comply with the Australian Building Code Board (ABCB)Standard for Construction of Buildings in Flood Hazard Areas 2012 (the ABCB Standard).
The ABCB Standard specifies detailed requirements for the construction of buildings to which the BCA requirements apply, including:
• Resistance in the DFE to flood actions including hydrostatic actions, hydrodynamic actions, debris actions, wave action and erosion and scour
• Floor height requirements, for example that the finished floor level of habitable rooms must be above the FHL
• The design of footing systems to prevent flotation, collapse or significant permanent movement
• The provision in any enclosures or openings to allow for automatic entry and exit of floodwater for all floods up to the FHL
• Ensuring that any attachments to the building are structurally adequate and do not reduce the structural capacity of the building during the DFE
MHL2789 – 9
© Crown 2021 Classification: Release by consent
• The use of flood-compatible structural materials below the FHL
• The siting of electrical switches above the FHL, and flood proofing of electrical conduits and cables installed below the FHL
• The design ofbalconiesetc. to allowa person in the building to be rescued byemergency services personnel, if rescue during a flood event up to the DFE is required
Building Circular BS13-004 (NSW Department of Planning and Infrastructure, 2013) summarises the scope of the BCA and how it relates to NSW planning arrangements. The scope of the ABCB Standard does not include parts of FHA that are subject to flow velocities exceeding 1.5 m/s or are subject to mudslide or landslide during periods of rainfall and runoff or are subject to storm surge or coastal wave action.
It is particularly noted that the Standard applies only up to the DFE, which typically will correspond to the level of the 1% AEP flood plus 0.5 m freeboard. The Building Circular emphasises that because of the possibility of rarer floods, the BCA provisions do not fully mitigate the risk to life from flooding.
The ABCB has also prepared an Information Handbook for the Construction of Buildings in Flood Hazard Areas. This Handbook provides additional information relating to the construction of buildings in FHA but is not mandatory or regulatory in nature.
In the NSW planning system, the BCA takes on importance for complying development under the State Environmental Planning Policy (Exempt and Complying Development Codes) 2008.
2.3.2 State provisions
2.3.2.1 EnvironmentalPlanningandAssessmentAct,1979 General
The NSW Environmental Planning and Assessment Act 1979 (EP&A Act) creates the mechanism for development assessment and determination by providing a legislative framework for development and protection of the environment from adverse impacts arising from development. The EP&A Act outlines the level of assessment required under State, regional and local planning legislation and identifies the responsible assessing authority.
Prior to development taking place in NSW a formal assessment and determination must be made of the proposed activity to ensure it complies with relevant planning controls and, according to its nature and scale, conforms with the principles of environmentally sustainable development.
Section 7.11 Development Contributions
Section 7.11 (previously Section 94) of the EP&A Act enables councils to collect contributions from developers for the provision of infrastructure that is necessary as a consequence of development. This can include roads, drainage, open space and community facilities. Each council must develop a Section 94 Contributions Plan which demonstrates a quantifiable link between the development intensification and the need for the additional infrastructure as well as a detailed costing of such infrastructure and formulae to be used to determine contributions from each type of development.
MHL2789 –
Crown 2021 Classification: Release
10 ©
by consent
Section 9.1 Directions – Direction No. 4.3 (Flood Prone Land)
NSW flood-related planning requirements for local councils are set out in Ministerial Direction No. 4.3 Flood Prone Land, issued in 2007 under the then Section 117 (now Section 9.1) of the EP&A Act. It requires councils to ensure that development of flood prone land is consistent with the NSW Government’sFlood Prone Land Policy as set out in the Floodplain Development Manual (NSW Government, 2005). It requires provisions in a Local Environmental Plan on flood prone land to be commensurate with the flood hazard of that land. In particular, a planning proposal must not contain provisions that:
• Permit development in floodway areas
• Permit development that will result in significant flood impacts to other properties
• Permit a significant increase in the development of that land
• Are likely to result in a substantially increased requirement for government spending on flood mitigation measures, infrastructure or services
• Permit development to be carried out without development consent except for the purposes of agriculture, roads or exempt development
The Direction also requires that councils must not impose flood related development controls above the residential flood planning level (FPL, typically the 1% AEP flood plus 0.5m freeboard) for residential development on land, unless a relevant planning authority provides ‘adequate justification’ for those controls to the satisfaction of the Director-General. However, it is noted that some special flood considerations LEP clause now allows for flood planning levels above 1% AEP + 0.5 m.
Section 10.7 Planning Certificates
Planning certificates are a means of disclosing information about a parcel of land. Two types of information are provided in planning certificates: information under Section 10.7(2) and information under Section 10.7(5) of the EP&A Act. (Note that previously this clause was Section 149).
A planning certificate under Section 10.7(2) discloses matters relating to the land, including whether or not the land is affected by a policy that restricts the development of land. Those policies can be based on identified hazard risks (Environmental Planning and Assessment Regulation 2000, Clause 279 and Schedule 4 Clause 7), and whether development on the land is subject to flood-related development controls (EP&A Regulation, Schedule 4 Clause 7A). If no flood-related development controls apply to the land (such as for residential development in so-called ‘low’ risk areas above the FPL, unless ‘adequate justification’ has been satisfied), information describing the flood affectation of the land would not be indicated under Section 10.7(2). A lot that is a ‘flood control lot’ under the Codes SEPP is a prescribed matter for the purpose of a certificate under section 10.7(2).
A planning certificate may also include information under Section 10.7(5). This allows a council to provide advice on other relevant matters affecting land. This can include past, current or future issues.
Inclusion of a planning certificate containing information prescribed under section 10.7(2) is a mandatory part of the property conveyancing process in NSW. The conveyancing process
MHL2789 – 11 © Crown 2021 Classification: Release by consent
does not mandate the inclusion of information under section 10.7(5) but any purchaser may request such information be provided, pending payment of a fee to the issuing council.
2.3.2.2
StateEnvironmentalPlanningPolicies(SEPPs)
SEPPs are the highest level of planning instrument and generally prevail over Local Environmental Plans.
SEPP (Housing for Seniors or People with a Disability) 2004
State Environmental Planning Policy (Housing for Seniors or People with a Disability) 2004 aims to encourage the provision of housing (including residential care facilities) that will increase the supply of residences that meet the needs of seniors or people with a disability. This is achieved by setting aside local planning controls that would prevent such development.
Clause 4(6) and Schedule 1 indicate that the policy does not apply to land identified in another environmental planning instrument as being, amongst other descriptors, a floodway or high flooding hazard.
SEPP
(Infrastructure) 2007
State Environmental Planning Policy (Infrastructure) 2007 aims to facilitate the effective delivery of infrastructure across the State by identifying development permissible without consent. SEPP (Infrastructure) 2007 allows Council to undertake stormwater and flood mitigation work without development consent.
SEPP (Exempt and
Complying Development Codes) 2008
A very important SEPP is State Environmental Planning Policy (Exempt and Complying Development Codes) 2008, which defines development which is exempt from obtaining development consent and other development which does not require development consent if it complies with certain criteria.
Clause 1.5 of this ‘Codes’ SEPP defines a ‘flood control lot’ as ‘a lot to which flood related development controls apply in respect of development for the purposes of dwelling houses, dual occupancies, multi dwelling housing or residential flat buildings (other than development for the purposes of group homes or seniors housing)’. These development controls may apply through a Local Environmental Plan (LEP) or DCP. Exempt development is not permitted on flood control lots but some complying development is permitted.
Clause 3.5 states that complying development is permitted on flood control lots where a Council or professional engineer can certify that the part of the lot proposed for development is not a flood storage area, floodway area, flow path, high hazard area or high-risk area. The Codes SEPP specifies various controls in relation to floor levels, flood compatible materials, structural stability (up to the PMF if on-site refuge is proposed), flood affectation, safe evacuation, car parking and driveways.
In addition, Clause 1.18(1)(c) of the Codes SEPP indicates that complying development must meet the relevant provisions of the Building Code of Australia.
SEPP
(Coastal Management) 2018
SEPP (Coastal Management) 2018 aims to promote an integrated and co-ordinated approach to land use planning in the coastal zone. For areas mapped as ‘coastal wetland and littoral
MHL2789 – 12 © Crown 2021 Classification: Release by consent
rainforests’ – including sizeable areas in the study area near the three lakes – development consent is required for the clearing of native vegetation, and for earthworks, construction of a levee, draining the land and environmental protection works, and for any other development. For areas mapped as ‘coastal environment areas’ – covering much of the study area –development consent must not be granted unless the consent authority has considered whether the proposed development is likely to cause an adverse impact on “the integrity and resilience of the biophysical, hydrological (surface and groundwater) and ecological environment” amongst other factors. The development must be designed, sited and managed to either avoid, minimise or mitigate adverse impacts.
2.3.2.3 NSWFloodRelatedManuals Floodplain Development Manual, 2005
The Floodplain Development Manual 2005 (the Manual) was gazetted on 6 May 2005 and relates to the development of flood liable land. It incorporates the NSW Flood Prone Land Policy, which aims to reduce the impacts of flooding and flood liability on individual owners and occupiers of flood prone property and to reduce private and public losses resulting from floods, using ecologically positive methods wherever possible. To implement this policy and achieve these objectives, the Manual espouses a merit approach for development decisions in the floodplain, taking into account social, economic, ecological and flooding considerations. The Manual confirms that responsibility for management of flood risk remains with local government. It assists councils in their management ofthe use and development of flood prone land by providing guidance in the development and implementation of local floodplain risk management plans.
At the time of preparing this report, the Floodplain Development Manual is being updated.
Guideline on Development Controls on Low Flood Risk Areas, 2007
The Guideline on Development Controls on Low Flood Risk Areas – Floodplain Development Manual (the Guideline) was issued on 31 January 2007 as part of Planning Circular PS 07003 at the same time as the Section 117 (now Section 9.1) Directive described previously. The Guideline is intended to be read as part of the Floodplain Development Manual
It stipulates that unless there are exceptional circumstances, councils should adopt the 100year flood as the flood planning level (FPL) for residential development and that ‘unless there are exceptional circumstances, councils should not impose flood related development controls on residential development on land … that is above the residential FPL’.
An adequate freeboard should then be applied to the 100-year flood level to allow for potential inaccuracies in available data and limitation of the flood models.
Flood related development controls are not defined but would include any development standards relating to flooding applying to land, thatare a matter for consideration under Section 4.15 (previously Section 79C) of the EP&A Act.
The Guideline states that councils should not include a notation for residential development on Section 10.7 (previously Section 149) certificates for land above the residential FPL if no flood related development controls apply to the land. However, the Guideline does include the reminder that councils can include ‘such other relevant factors affecting the land that the council may be aware [of]’ under Section 10.7(5) of the EP&A Act.
MHL2789 – 13 © Crown 2021 Classification: Release by consent
In proposing a case for exceptional circumstances, a council would need to demonstrate that a different FPL was required for the management of residential development due to local flood behaviour, flood history, associated flood hazards or a particular historic flood. Justification for exceptional circumstances would need to be agreed by relevant State Government departments prior to exhibition of a draft local environmental plan or a draft development control plan that proposes to introduce flood related development controls on residential development above the default FPL.
At the time of preparing this report, the Guideline is being reviewed.
2.3.3 Local provision
In NSW, local government councils are responsible for managing flood risk within their Local Government Areas (LGAs). An LEP is used to establish what land uses are permissible and/or prohibited on land within the LGA and sets out high level flood planning objectives and requirements. A Development Control Plan (DCP) sets the standards, controls and regulations that apply when carrying out development or building work on land. This section briefly describes and reviews the flood-related controls within the MidCoast policies, with a view to flood behaviour in the Bulahdelah study area.
2.4 Land use
Land-use zoning in Bulahdelah is defined in the Great Lakes Local Environmental Plan (LEP) 2014, shown in Figure 2.10 The majority of the township itself is zoned as “RU5 Village” with a small area to the southwest and an area in the middle of the township zoned as “RE1 Public Recreation”. The Pacific Highway which connectsBulahdelah to neighbouring towns is located to the southeast of the town and zoned as “SP2 Infrastructure”. Figure 2.10 shows that an area zoned as “C1 National Parks and Nature Reserves” is located to the north of the town. The majorityof the floodplain west and north of Bulahdelah is zoned as “RU2 RuralLandscape” and downstream of Bulahdelah as “C2 – Environmental Conservation” or “C3 – Environmental Management”. The vegetated and elevated areas around the ridges of the catchment and Bombah Broadwater are zoned as either “C1 – National Parks and Nature Reserves” or “RU3 – Forestry”. Myall River itself is zoned as a “W2 Recreational Waterways” along and upstream of Bulahdelah and as “W1 – Natural Waterways” downstream of the township
2.5 Demographic overview
Understanding the social characteristics of the study area can help ensure appropriate risk management practices are adopted and shape the methods used for community engagement. House tenure and age distribution data obtained from census data can indicate the community’sexperience with recent flood events,and hence an indication of community’s flood awareness. As per The Bureau of Meteorology Flood Preparedness Manual, using the population census data and other information held by councils and state agencies can help to identify the potential number and location of people in an area with special needs or requiring additional support during floods (Australian Government (Attorney – General’s Department), 2009). The relevant information has been extracted from the 2016 Census for the town of Bulahdelah (and surrounds) and tabulated in Table 2.1
Classification: Release by consent
MHL2789 – 14
© Crown 2021
Landuse


Legend
Studyarea
LandZoningCategory

C1-NationalParksand NatureReserves
C2-Environmental Conservation


C3-Environmental Management
R2-LowDensity Residential
R5-LargeLot


Residential
RE1-PublicRecreation

RU2-RuralLandscape
RU3-Forestry
RU5-Village
SP2-Infrastructure
W1-NaturalWaterways
W2-Recreational Waterways

ReportMHL2789


ReviewofBulahdelah FloodplainRisk ManagementStudyandPlan


N
Figure2.10
©Crown2023/AerialImagerySource:Google2023 ©AerialImagerySource:Nearmap2021
Source: https://www.abs.gov.au/census/find-census-data/quickstats/2021/SAL10646

466 (75.2%, either outright or with a mortgage)
Language English only is spoken at home: 1393 (90.6%) A non-English language is spoken at home: 29 (4 7%)
Classification: Release by consent
–
Crown
MHL2789
16 ©
2021
Table 2.1 Bulahdelah demographic overview based on the 2021 census. Bulahdelah Demographic Overview
Population 1538 Number of private dwellings 740 Number of single-person households 184 (29.5%) Property tenure
Rented: 123
Number of persons over the age of 75 202 (13.3%) Number of one-parent families 93 (21.6%)
Owned:
(19.8%)
3 Previous studies
3.1 Bulahdelah Flood Appraisal, NSW Public Works Department, 1991
This report was prepared for Great Lakes Shire Council, by the NSW Public Works Department (PWD) in October 1991 to assess flood behaviour for the Myall River floodplain in the vicinity of Bulahdelah (Public Works, 1991). The study area extended along the Myall River from 0.43 km downstream of the Pacific Highway bridge to about 2 km upstream of the bridge at Lee Street.
The study utilised the WBNM model with eight sub-catchments to produce the discharge hydrographs for the October 1985 and November 1987 flood events as well as 1%, 2% and 5% AEP events. WBNM hydrologic model was set using the lag parameter of C = 1.29 A onedimensional hydraulic model of MIKE 11 was established to study the flood behaviour across the study area. The Bulahdelah MIKE 11 model consisted of seven surveyed cross-sections (surveyed by the PWD in 1987 and 1988) and the Pacific Highwaybridge profile. The upstream and downstream boundaries were defined as discharge hydrographs at the confluence of the Crawford River and a stage hydrograph, respectively.
The study utilised daily rainfall and pluviography data to describe the areal and temporal distribution of rainfall No pluviograph station was located within the Myall River catchment therefore, the closest ones acquired for the study including Upper Johnson Creek, Nabiac, Maryville (Newcastle) Williamtown and Taree. Long term daily rainfall data were obtained from BoM station located at Bulahdelah Post Office and several stations located around the boundary of the catchment Further daily rainfall records were used to undertake the Flood Study from unofficial gauges located at Upper Myall (Tank Creek), Markwell (Deep Creek) and Rosenthal (Gloucester Road) No adequate details of the unofficial rainfall gauges are available. ARR 1987 methodology was used to determine the critical duration of design storm events, resulting in the critical duration of 36 hours for the 1% AEP event.
The study documented that the most information on flooding was available for 1985 and 1987 events (for further information on historical flood events see Section 2.2). Therefore, the hydraulic model was calibrated and verified using the October 1985 and November 1987 floods, respectively.
For the 1985 flood, an initial loss of 0 mm and a continuing loss of 2.5 mm/hr were adopted due to considerable rainfall prior to the event. An initial rainfall loss of 21 mm and continuing losses of 2.5 mm/hr were adopted for the 1987 flood and the design floods.
Sensitivity analysis was conducted to investigate the impacts of the tailwater conditions at the Muirs Creek confluence on the hydraulic model outcomes. The 1% AEP flood event hydrograph at the Highway Bridge was insensitive to the range of tailwater conditions. The 5% AEP flood event hydrograph at the Highway Bridge was relatively insensitive to the range of tailwater conditions, with 200 mm variation within the range of tested tailwater conditions. A single tailwater curve with a peak level of 3 m AHD was adopted for modelling the design events.
The key finds from the report are summarised below:
MHL2789 – 17 © Crown 2021 Classification: Release by consent
• A constant Manning’s roughness coefficient of 0.037 for the main channel and 0.05 for the floodplain resulted in the best outcomes.
• In 1% AEP event, a critical storm duration of 36 hours was found to produce a peak discharge of 2100, 750 and 1400 m3/s at the Bulahdelah bridge, Crawford River and upstream of Crawford River, respectively.
• It was documented that the 1897 flood event is the largest flood on record with a flood level of RL 5.5 m reported in the vicinity of the Highway Bridge.
• The simulations of 1% AEP event resulted in a flood level of approximately 50 mm higher than the 1897 event in the vicinity of the highway Bridge.
• Also, it was reported that the 1927 flood event is the second largest flood on record with a flood level of RL 5.0 m.
• The calculated flood level of a 2% AEP event resulted in a flood level of approximately 100 mm higher than the 1927 record.
The review of the Bulahdelah Flood Appraisal revealed that the WBNM and MIKE11 models utilised in the study are very limited in terms of the number of sub-catchments to represent the study area and cross-sections to represent the 1D model. Therefore, there is a need for establishing hydrologic and hydraulic models with adequate details to appropriately represent the study area
3.2 Frys Creek Flood Study, NSW Public Works Department, 1994
This report was prepared for the Great Lakes Shire Council, by the NSW Public Works Department in July 1994 to assess flood behaviour in the lower reaches of the Frys Creek (Public Works, 1994)
The study adopted and adapted the hydrological WBNM model and the one-dimensional hydraulic model of MIKE 11 developed for the completion of Bulahdelah Flood Appraisal (1991). To meet the objectives of the study, the MIKE 11 model was extended to include Frys Creek. Figure 3 1 showed the model schematization including the branches, weirs and culverts. The hydraulic model was calibrated using the recorded flood level in November 1987 event near Lee Street, Frys Creek Bridge and Markwell Road Bridge The simulated peak water level, discharge and velocity results for the 1% and 5% AEP events are tabulated in Table 3.1 to Table 3.3.
MHL2789 – 18 © Crown 2021 Classification: Release by consent

– 19 © Crown 2021
Release by consent
MHL2789
Classification:
Figure 3 1 Model schematization (NSW Public Works Department, 1994)
Branch Chainage Water Level (m AHD) 1% AEP Event 5% AEP Event Myall 10.000 9.18 8.16 Myall 10.010 9.12 8.11 Myall 10.020 9.03 8.04 Myall 10.200 8.31 7.44 Myall 11.150 6.49 5.19 Myall 11.650 6.36 5.19 Myall 12.750 6.20 5.19 Frys 10.000 7.42 7.19 Frys 10.600 6.72 6.11 Frys 11.000 6.62 5.75 Frys 11.400 6.55 5.55 Frys 11.410 6.54 5.26 Frys 11.750 6.51 5.19 Frys 12.310 6.48 5.19 Frys 12.460 6.49 5.19
Table 3 1 Frys Creek Flood study summary of water level results
– 20 © Crown 2021
MHL2789
Classification: Release by consent
Branch Chainage Discharge (m3/s) 1% AEP Event 5% AEP Event Myall 9.950 1219 839 Myall 10.005 408 387 Myall 10.015 1218 838 Myall 10.110 1217 837 Myall 10.675 1213 828 Myall 11.400 1327 878 Myall 12.200 1332 884 Frys 10.300 149 107 Frys 10.800 146 107 Frys 11.200 143 106 Frys 11.405 16 26 Frys 11.580 140 105 Frys 12.030 139 105 Frys 12.385 137 104
Table 3.2 Frys Creek Flood study summary of discharge results
Branch Chainage Velocity (m/s) 1% AEP Event 5% AEP Event Myall 10.000 1.78 1.45 Myall 10.005 1.51 2.06 Myall 10.010 2.05 1.71 Myall 10.015 2.21 1.87 Myall 10.020 2.40 2.07 Myall 10.110 2.59 2.23 Myall 10.200 2.82 2.41 Myall 10.675 2.11 2.33 Myall 11.150 1.86 2.43 Myall 11.400 1.59 1.67 Myall 11.650 1.40 1.27 Myall 12.200 1.99 1.87 Myall 12.750 3.38 3.43 Frys 10.000 1.67 1.49 Frys 10.300 1.17 1.32 Frys 10.600 0.89 1.17 Frys 10.800 0.69 0.87 Frys 11.000 0.56 0.78 Frys 11.200 0.60 0.71 Frys 11.400 0.64 0.74 Frys 11.405 1.03 2.41 Frys 11.410 0.71 1.11 Frys 11.580 0.65 0.93 Frys 11.750 0.61 0.80 Frys 12.030 0.53 0.64 Frys 12.310 0.47 0.53 Frys 12.385 0.31 0.35 Frys 12.460 0.23 0.26
Table 3.3 Frys Creek Flood study summary of velocity results
3.3 Myall River Floodplain Risk Management Study for Bulahdelah, Department of Land and Water Conservation, 2002
The Floodplain Risk Management Study Report was completed for the Great Lakes Shire Council, by the Department of Land and Water Conservation in August 2002 to assess the potential floodplain risk management measures to alleviate the flooding issues caused by mainstream flooding at Bulahdelah (Department of Land and Water Conservation, 2002) The study area covers the floodplains of the Myall River and its main tributaries including Myall River from the Markwell Road Bridge to downstream of the Pacific highway Bridge, Frys Creek from upstream of the Markwell Road Bridge to the Myall River and Crawford River from the confluence with Wild Cattle Creek to the Myall River. The study only investigated the mainstream flooding due to the Myall River and its main tributaries.
The key finds from the report are summarised below:
• The major flood events can have a significant impact on Bulahdelah including significant property damages and danger to personal safety
• A range of flood levels was observed from 5.6 m AHD to 6.1 m AHD from upstream of the Pacific Highway to Lee Street at Bulahdelah. The peak average mainstream flow velocity varied from 3.1 m/s in the vicinity of Lee Street to 1.3 m/s upstream of the confluence of the Crawford River. Peak average overbank velocities on the eastern side of the Myall River is ranging from 0.4 to 0.8 m/s. Flood levels for the 1% and 2% AEP events were similar to the 1897 and 1927 flood levels in this vicinity
• In an extreme event, the flood level is generally in the order of 1.8 m higher than the 1% AEP event.
• In the 1% AEP event, around 45 residential and 7 non-residential properties are subject to inundation above the floor level resulting in the potential flood damage of $1,700,000.
• In an extreme event, the number of residential properties subject to inundation above the floor level is likely to double.
• The main channels of Myall River, Crawford River and Frys Creek are categorised as floodway. The remaining floodplain area at Bulahdelah was categorised as flood storage and some areas as flood fringe.
• This study recommended a voluntary house raising and voluntary purchase scheme, updating the Council’s 1985 Flood Management Policy and associated development controls, installation of a flood warning system with associated emergency management planning, community education and awareness.
The study tabulated the simulated peak water level results for the 5%, 2%, 1% AEP and extreme events reported in Table 3.4 Also, peak flow for the Myall River and tributaries for the 5%, 2%, 1% AEP were presented in Table 3.5
MHL2789 – 21
Crown 2021
Release by consent
©
Classification:
Crown 2021
Chainage (km) Location description Water Level (m AHD) Extreme 1% AEP 2% AEP 5% AEP Myall River M10.00 Markwell Road Bridge 10.3 9.08 8.48 7.93 M10.20 9.5 8.41 7.84 7.30 M11.15 Frys Creek Confluence 9.0 6.57 6.10 5.60 M11.65 8.6 6.47 6.00 5.49 M12.75 Lee Street 7.9 6.08 5.62 5.16 M13.30 7.6 5.97 5.51 5.05 M13.87 7.5 5.92 5.46 4.99 M14.27 Crawford River Confluence 7.4 5.89 5.42 4.96 M14.48 7.3 5.82 5.37 4.92 M14.70 Pacific Highway Bridge 6.8 5.54 5.15 4.75 M15.19 6.8 5.55 5.15 4.74 Frys Creek F10.00 9.5 7.47 7.32 7.20 F10.60 9.5 6.72 6.32 6.15 F11.00 9.5 6.64 6.18 5.76 F11.40 Markwell Road Bridge 9.5 6.60 6.14 5.62 F11.75 9.3 6.58 6.11 5.60 F12.31 9.0 6.57 6.10 5.60 F12.46 Myall River Confluence 9.0 6.57 6.10 5.60 Crawford River C10.00 7.6 5.99 5.55 5.12 C10.70 7.4 5.96 5.50 5.05 C11.30 7.4 5.93 5.47 5.01 C12.20 7.4 5.89 5.43 4.97 C12.40 Myall river Confluence 7.4 5.89 5.42 4.96
MHL2789 – 22 ©
Classification: Release
by
consent
Table 3.4 Summary of water level results.
Catchment Peak flow (m3/s) 1% AEP 2% AEP 5% AEP Myall River upstream of Frys Creek 1219 1011 840 Frys Creek 152 127 109 Local catchment between Frys Creek and Pacific Highway 76 63 55 Crawford River 807 668 559
Table 3.5 Peak flows for Myall River and tributaries.
3.4 Myall River Floodplain Risk Management Plan for Bulahdelah, Department of Infrastructure, Planning and Natural Resources, 2003
This report was prepared for the Great Lakes Shire Council, by the Department of Infrastructure, Planning and Natural Resources in August 2003 to assess the potential floodplain risk management measures to alleviate the flooding issues at Bulahdelah (Department of Infrastructure, Planning and Natural Resources, 2003). The flood management measures recommended in this plan tabulated in Table 3.6
Table 3.6 Proposed flood management measures.
1 (Undertaken immediately)
2a (Undertaken as soon as subsided funds are available)
2b
2c
Updating the development controls and S149 certificates
Flood response plan
Flood warning system
Flood education and awareness
2d Ongoing data collection
3 (Undertaken every 5 years) Review of the Floodplain Management Plan (2003).
4 Voluntary house raising of all below 2% AEP flood to 0.5 m above the peak flood level in 1% AEP event.
5 Voluntary purchase of all below 5% AEP flood level that can’t be raised
3.5 Bulahdelah Upgrading the Pacific Highway, Parsons Brinckerhoff, 2004
This report was prepared for the Road and Traffic Authority (RTA), by Parsons Brinckerhoff in November 2004 to assess the flood impact associated with the construction of the new bridge and embankments associated with the Bulahdelah Bypass due to the highway upgrade.
The study utilised the MIKE 11 model prepared for the Myall River Floodplain Risk Management Study for Bulahdelah by the department of Land and Water Conservation. The model was based on surveyed cross-sections and calibrated against 1987 flood event by adjusting the roughness coefficient. Roughness coefficient of 0.09 and 0.06 were applied in the overbanks and in the channel in the vicinity of the bends downstream of the proposed bridge. Moreover, a steady-state one-dimensional backwater analysis software HEC-RAS was used to assess the impact of the proposed structures crossing the Myall River and floodplain.
MHL2789 – 23 © Crown 2021 Classification: Release by consent
Measure Type Priority
Measure
measure
Management
Response modification
Property modification measure
The
study investigated the impact of several bridge options on flood flows in the Myall River
The report documented the simulated water level for the adopted option including a 192 m bridge opening, approximately 204 m2 of culvert openings in the embankment of the proposed Upgrade and 23 m2 of culvert openings in the embankment of the existing highway
3.6 Lower Myall River and Myall Lakes Flood Study, BMT, 2015
This report was completed for the Great Lakes Council by BMT in June 2015 to define the existing flood behaviour in the lake and river and establish the basis for subsequent floodplain management measures (BMT, 2015).
The study documented that the lower Myall River catchment covers an area of approximately 900 km2 and is located north of Port Stephens in the Great Lakes Council Local Government Area (LGA). Myall River is the major contributor to the lake system which drains an area of approximately445 km2 and enters the lake system at the north-western side of the Broadwater. The Lake system is drained by the 28 km long Lower Myall River which exits the Broadwater at Tamboy and drains into Port Stephens at Corrie Island via Corrie Creek and Paddy Marrs Inlet.
The study utilised RAFTS-XP hydrologic model with 61 sub-catchments to produce the discharge hydrographs. A two-dimensional hydraulic model of TUFLOW was established to study the flood behaviour across the study area. The TUFLOW model was developed using a 20 m grid to represent the Lower Myall River channel and floodplain and a 50 m grid to represent the Lakes and Myall channel and floodplain. The upstream boundary was defined as flow versus time inputs at major sub-catchments inflow points and along the modelled watercourses. The downstream boundary was modelled corresponding to the tidal water level of Port Stephens.
Myall Lake system and Lower Myall River is flooded by a combination of fluvial and ocean storm events. The following historical floods and their associated peak water levels were identified by MHL (1993) and are based on PWD (1980):
• 1890s - 3.7 m AHD (Myall Lakes);
• 1927 - 2.7 to 3.2 m AHD (Myall Lakes);
• 1963 - 2.2 m AHD (Tamboy, Myall Lakes);
• March 1977 - 1.2 m AHD (Bombah Point, Myall Lakes);
• March 1978 - 1.31 m AHD (Bombah Point, Myall Lakes); and
• May 1978 - 1.3 m AHD (Bombah Point, Myall Lakes).
Inspection of the Bombah Point water level gauge from July 2001 to May 2012 indicates several other significant flood events as presented in Table 3 7
MHL2789 – 24
© Crown 2021 Classification: Release by consent
* This is an estimated value as discussed in Section 5.5.1.2 of Lower Myall River and Myall Lake Flood Study.
The model was calibrated against July 2011 flood event and validated against May 2003 and April 2008 flood events. During the Flood Study, a significant flood event (in early March 2013) occurred and was used as a validation event. In addition to the four flood events, a tidal calibration exercise was undertaken using data collected by MHL in September 2009. An initial rainfall loss of 15 mm and continuing losses of 0.5 mm/hr were adopted for May 2003, April 2008 and July 2011 floods and the design floods. For the 2013 flood, an initial loss of 0 mm and a continuing loss of 0.1 mm/hr were adopted due to considerable rainfall on the 23rd February 2013.
Lake water level at the start of the July 2011 event is approximately 0.5 m AHD with a peak lake level of 1.27 m AHD occurring on the 25th July 2011. Lake water level at the start of the event on the 25th May is 0.78 m AHD with a peak lake level of 1.4 m AHD occurring on the 29th May. Lake level at the start of the event on the 18th April 2008 is 0.25 m AHD with a peak lake level of approximately 1.45 m AHD occurring on the 26th April 2008. Lake water level at the start of the event is approximately 0.8 m AHD with a peak lake level of 1.75 m AHD occurring on the 4th March 2013. The Bulahdelah water level gauge on the Myall River just downstream of the Pacific Highway Bridge is able to provide information on catchment response and at this location, the river water level is responsive to rainfall intensity, though is also affected by a tailwater from the Lakes.
Initial water levels in the Myall Lakes system for design flood events have been derived based on an analysis of water level statistics at Bombah Point between July 2001 and April 2012. An initial lake level of 0.5 m AHD was selected (for both catchment and ocean events) in consultation with OEH and GLC and matches the lake level exceeded only 10% of the time. A range of design flood conditions including the 50%, 20%, 10%, 5%, 2%, 1%, 0.5% AEP events and an extreme event (similar to PMF) were modelled and the results of simulated peak flood levels at several locations were documented Table 3.8 and Table 3.9 presented the peak flood levels at Myall Lake and Bombah Broadwater for three scenarios including catchment derived design events, ocean derived design events and combined conditions
Classification: Release by consent
MHL2789 – 25
© Crown 2021
Date Flood Level (m AHD) Rainfall 29th May 2003 1.39 300 to 600 mm in 30 days 27th April 2008 1.45* ~ 400 mm in 20 days 16th June 2011 1.20 310 to 370 mm in 28 days 25th July 2011 1.27 ~ 245 mm in 15 days 22nd October 2004 1.0519th February 2009 1.13 -
Table 3.7 Peak flood levels at Bombah Points (m AHD).
The key finds from the report are summarised below:
• Results indicate that peak flood levels upstream of Monkey Jacket are attributed to catchment derived design flood events, while ocean derived flood events are more significant downstream of Monkey Jacket.
• Coincident ocean and catchment flood events cause a negligible increase in peak levels within the lake; however, depending on the timing of peak tides may increase peak flood levels below Kangaroo Island by up to 0.2 m.
• Impacts of climate change (including increases in rainfall intensity and sea-level rise) on flood risk along the Lower Myall were investigated. The outcomes revealed that an increase in mean sea level due to sea-level rise may pose a significant flood risk problem along the Tea Gardens peninsula, where ground elevations of only 1.5 m AHD are common. Low lying areas in Hawks Nest (with ground elevations below 2.0 m AHD) will also be affected by predicted SLR.
3.7 Flood Emergency Response Plan Bulahdelah Caravan Park, Cardno, 2017
This report was prepared by Cardno in April 2017 on behalf of Mr Gary Ekert and Mrs Kim Ekert of the proposed Bulahdelah Caravan Park This report wasprepared for the development of the Bulahdelah Caravan Park to ensure the flood risk for the visitors and staff is managed appropriately.
MHL2789 – 26 © Crown 2021 Classification: Release by consent
Design Event Catchment derived
Ocean derived
Myall Lake Bombah Broadwater Myall Lake Bombah Broadwater 50% AEP 1.22 1.22 0.5 0.5 20% AEP 1.56 1.56 0.5 0.5 10% AEP 1.78 1.77 0.5 0.5 5% AEP 1.97 1.97 0.5 0.5 2% AEP 2.21 2.21 0.5 0.5 1% AEP 2.38 2.38 0.5 0.5 0.5% AEP 2.54 2.54 0.5 0.5 Extreme event (10000 yr) 3.38 3.37 -Extreme event (3 × 100 yr) 4.86 4.85 -Extreme tide - - 0.52 0.52
Table 3.8 Modelled peak flood levels (m AHD) for a range of design events.
event
event
Design Event Myall Lake Bombah Broadwater 1% AEP Catchment and 1% AEP Ocean 2.40 2.40 1% AEP Catchment and 1% AEP Ocean (90 hour lag) 2.38 2.38 1% AEP Catchment and 5% AEP Ocean 2.40 2.40 5% AEP Catchment and 1% AEP Ocean 2.00 2.00
Table 3.9 Modelled peak flood levels (m AHD) for combined catchment and ocean derived design events
The caravan park is located in the middle of the township of Bulahdelah, 90 m upstream of the Old Pacific Highway Bridge. The Caravan Park is located on the banks of the Myall River, opposite the confluence with the Crawford River.
The study tabulated the flood levels in the vicinity of the Bulahdelah Caravan Park site based on Flood Appraisal (1991) and Myall River FRMS (2002) - see Table 3.10. Table 3.10 Flood levels in the vicinity of the Bulahdelah Caravan Park.
Hazard and hydraulic category maps revealed that most of the site lies within the high hazard area highlighting that occupation of the site poses a significant flood risk.
The study analysed the Bulahdelah Flood Appraisal outcomes on the 5% and 1% AEP water level time series at the Bulahdelah Bridge just downstream of the Caravan Park The analysis determined the average rate of 0.5 m/hr of water level rise for the 5% and 1% AEP design events Due to the insufficient data documented in the previous studies on extreme events, the study adopted an extreme rate of rising of 2 m/hr which is four times greater than the rate of rising of the 5% and 1% AEP design events
The study concluded that:
• There is sufficient time and a safe route to evacuate both the Stage 1 and 2 development of the Bulahdelah Caravan Park based on active monitoring of river water levels
• Raising of the proposed internal road connecting Stage 1 and 2 sites, to a finished level of 4.0 m AHD
• Adoption of the route east of the site through the main access onto Stroud Street, south to Bulahdelah Way and east to Meade Street was recommended.
• An evacuation procedure was recommended to be implemented based on a range of factors discussed in detail in the report.
© Crown 2021 Classification: Release by consent
MHL2789 – 27
Design event Flood Appraisal (1991) (Model chainage 5.0) Myall River FRMS (2002) (Model chainage 13.87) 5% AEP 4.79 4.99 2% AEP 5.30 5.46 1% AEP 5.87 5.92 Extreme event NA 7.50
4 Data collection and review
4.1 Water level and rainfall data
MHL manages a number of water level and near-real-time rainfall recording stations within or in the vicinity of the study area. These gauges are tabulated in Table 4.1 and their locations are illustrated in Figure 4.1. This figure also displays the locations of a number of points at which rainfall data were extracted from the radar data from TheWeatherChaser.com for the various calibration/validation events. The nearest daily rainfall monitoring locations are the gauges maintained by the Bureau of Meteorology (BoM) tabulated in Table 4.1 Recorded water level data at Bulahdelah and Bombah Point stations are presented in Figure 4.2 and Figure 4.3 Rainfall data is presented in Figure 4.4
© Crown 2021
Classification: Release by consent
MHL2789 – 28
Station Name Station Number X Y Start Date End Date Water level (MHL) Bulahdelah 209460 425442 6413407 4/10/1985 Ongoing Bombah Broadwater (WQ) (Decomm) 209475D 434902.8 6403373 9/07/1996 4/03/1998 Bombah Point 209475 434682 6403309 17/07/2001 Ongoing Markwell ERTS561104 424132.6 6417157 3/11/2003 27/11/2009 Markwell ERTS561104 424132.6 6417157 30/08/2016 Ongoing Crawford River ERTS560058 423906.1 6412806 1/06/2006 Ongoing Bulahdelah (ERTS) ERTS560040 425442 6413407 1/06/2012 Ongoing Near-real-time rainfall (MHL) Bulahdelah 209460 425442 6413407 6/08/1996 Ongoing Markwell ERTS561104 424132.6 6417157 30/08/2016 Ongoing Crawford River ERTS560058 423906.1 6412806 5/04/2019 7/05/2019 Bulahdelah (ERTS) ERTS560040 425442 6413407 10/05/2019 Ongoing Daily rainfall (BoM) Crawford River 60099 -32.4421 152.1571 2002 Ongoing Bulahdelah Post Office 60002 -32.4129 152.2079 1905 Ongoing Wootton 60065 -32.2942 152.3047 2002 Ongoing Stroud Post Office 61071 -32.4027 151.9664 1889 Ongoing Cabbage Tree Mountain 60096 -32.2583 152.1208 2002 Ongoing
Table 4.1 Water level and rainfall stations n vicinity of the study area.

N
Waterleveland rainfallstations Studyarea CatchmentBoundary Gaugingstationstypes Real-timerainfalldata Real-timewaterleveldata Dailyrainfalldata Rainfalldataextracted fromradar Legend ReportMHL2789 ReviewofBulahdelah FloodplainRisk ManagementStudyandPlan ©Crown2021/AerialImagerySource:Google
Figure4.1


MHL2789 – 30 © Crown 2021 Classification: Release by consent
Figure 4 2 Water level data recorded at Bulahdelah Station 209460
Figure 4 3 Water level data recorded at Bombah Point Station 209475
Figure 4 4 Near-real-time rainfall data recorded at Bulahdelah Station 209460
4.2 Site inspection
A site inspection was carried out by the MHL project team on 1st of October 2020. The purpose of this inspection was to gain an overall appreciation of the relevant characteristics of the area and to identify areas that either contributed to flood risk or that were subject to the greatest flood risk. The site visit was undertaken with MidCoast Council Staff. A preliminary 1% AEP flooding event was run prior to the site inspection to understand the main flow paths within the study area. A number of pipes and culverts were then inspected along the main flow paths to determine if the size of the barrels as provided within the Council’s GIS layers was correct. Figure 4.5 presents the various locations that have been inspected during the site inspection. The majority of the culverts and pipes inspected appeared to be of a correct dimension but a number of discrepancies were observed as highlighted by the ten items numbered on Figure 4.5 and these discrepancies are listed below:
• No pipes were going down River Street (item 1), Myall Street (item 2) and Edgar Street (item 3) but instead there is a small dish drain.
• The pipe across Richmond Street near Edgar Street (item 4) appeared to be 450 mm instead of 375 mm.
• A small pipe across Richmond Street near Prince Street appeared to be 375 mm instead of 300 mm and another pipe across Prince Street near Richmond Street (item 5) was found to have two 900 mm cells instead of one.
• The culvert across Richmond Street halfwaybetween Prince Street and Alexandra Street (item 6) appeared to be 2 × 1250mm × 650 mm instead of 2 × 650mm × 375 mm.
• The culvert across Bulahdelah Way near Richmond Street (item 7) appeared to be a 3 × 1250 mm × 1250 mm instead of a single 375 mm pipe.
• The culvert across Bulahdelah Way halfway between Blanch and Stuart Streets (item 8) appeared to be a 2 × 1500 mm × 1250 mm instead of a single 375 mm pipe.
• The culvert across Bulahdelah Way near Rosewood Street (item 9) appeared to be 2400 mm × 900 mm instead of 2400 mm × 1200 mm.
Discussion with a few local community members highlighted some local flooding issues:
• Along Lee Street near the recently constructed roundabout with Stroud St.
• Along Jackson Street near Alexandra Street in the recent year possibly due to vegetation growing in the flow path.
– 31
Crown 2021
Release
MHL2789
©
Classification:
by consent
Siteinspection
summary
Legend
Cadastre
Locationanddirectionof photographstakenduring siteinspection
MainFlowPaths
Pipes/CulvertsfromCouncil
ObservedDiscrepancy
ReportMHL2789
ReviewofBulahdelah
FloodplainRisk

ManagementStudy&Plan
N
Figure4.5
CrawfordRiver MyallRiver Stroud St Pacific Hway Prince St Alexandra St Myall St Crawford St LeeSt River St Edgar St MeadeSt Booloombayt St Bulahdelah Way BlanchSt ChurchSt MacKenzie St JacksonSt RichmondSt StuartSt Harold St Rosewood St ©Crown2021/ImageSource:Nearmap2021
4.3 Topographic data
Light Detection and Ranging (LiDAR) survey of the study area and its immediate surroundings was obtained for the study from ELVIS (https://elevation.fsdf.org.au/). 1 m resolution LiDAR data from the ‘Bulahdelah’ dataset (NSW Spatial Services August 2012, June 2013, January 2016 and January 2018) was used in the present study. The accuracy of the ground information obtained from LiDAR survey can be adversely affected by the nature and density of vegetation, the presence of varying terrain, the vicinity of buildings and/or the presence of water. The horizontal accuracy of the data is 0.8 m at 95% confidence interval, while the vertical accuracy is 0.3 m at 95% confidence interval The terrain topography is illustrated in Figure 4.6
Nearly several hundreds of survey marks were available from the Survey Control Information Management System (SCIMS) database developed by the NSW Government’s Spatial Services. The elevations of the survey marks extracted from the SCIMS online database were used to check the accuracy of the LiDAR data. The numerous survey marks were sorted to remove:
• Survey marks that were either damaged or not found
• Survey marks that had no elevation or only had round number value as they appeared to have been rounded to the nearest ten (e.g. 10 m, 30 m, etc.)
• One outlier with over 30 m level difference
Details of the survey marks including name, coordinates, elevation from SCIMS database, elevation measured from LiDAR data and difference in levels are provided in Appendix A
The survey marks locations and difference between SCIMS and LiDAR elevation are also illustrated in Figure 4 6 It can be noted that the survey marks with the largest differences are typically outside of the Bulahdelah township and located along steep surfaces. The LiDAR appears therefore adequate for the study.
4.4 Aerial photography
The most recent available aerial imagery was obtained from Google Earth (www.googleearth.com), captured in 2020 to observe current features within the study area. Some high resolution aerial imagery from 24 June 2020 was also available from Nearmap for the township of Bulahdelah.
4.5 Crawford River weir
A small weir is located on the Crawford River approximately 75 m upstream from the junction with the Myall River. The weir is a sheetpile structure reinforced with rock-fill and steel bracing and was constructed in 1964. The structure includes a fishway and is part of Bulahdelah water supply system. The crest of this weir is at approximately 0.75 m AHD and is visible in the LiDAR data. Photographs of the weir and fishway are provided in Figure 4.7.
–
Crown
Classification: Release
MHL2789
33 ©
2021
by consent


Figure4.6
CatchmentBoundary Studyarea Elevation(mAHD) Band1(Gray) Differencebetween surveymarkandLiDAR elevation(m) <-1.5 -1.5--1.00 -1.00--0.75 -0.75--0.5 -0.5--0.25 -0.25-0.00 0.00-0.25 0.25-0.50 0.50-0.75 0.75-1.00 1.00-1.50 >1.5 Legend ReportMHL2789 ReviewofBulahdelah FloodplainRisk ManagementStudyandPlan N ©Crown2021/ImageSource:Google2021
Topographicdata
4.6 Bridges
Council’s bridges drawings and GIS layer provided as a single point along Markwell Road, Markwell Back Road, Wootton Way and Old Pacific Highway were reviewed for completeness and quality for flood modelling purposes. The provided data includes:

• Nan Syron Bridge drawing including deck and underside levels, length, width, railing height, location and width of piers.

MHL2789 – 35 © Crown 2021 Classification: Release by consent
Figure 4 7 Crawford River weir and fishway (NSW Fisheries Office of Conservation, 2003)
• Battles Bridge drawing including deck and underside levels, length, width, railing height, location and width of piers.
• Frys Creek Bridge provided as a single point including approximate deck underside level, length, width.
• Markwell Back Road Bridge provided as a single point including approximate deck underside level, length, width.
• Wootton Way Bridge provided as a single point including approximate deck underside level, length, width.
MHL assumed the approximate deck underside level, length and width for the three doubleroad bridges along Pacific Highway based on the available topographic data and aerial photography.
4.7 Pits and pipe network
Council’s pit and pipe drawings were reviewed for completenessand quality for flood modelling purposes. The review identified some missing data required for modelling the storm-water network as follows:
• Pipe data including approximate locations and pipe sizing were available for the majority of the catchment.
• Minimum pipe size of 0.15 m was included in the hydraulic model located at the intersection of Crawford Street and Blanch Street, as well as at the intersection of Alexandra Street and Jackson Street.
• Information for several pipes was provided as a single point along Bombah Point Road, Markwell Rd, Markwell Back Rd, Suncrest Cl and Frys Creek Rd. Pipe alignment was therefore assumed and based on the available local topographic data.
• Pipesand culverts acrossPacific Highwayand Bulahdelah Way outside of the township were added to the model based on available Work-As-Executed drawings of the Bulahdelah Bypass developed by SMEC in November 2013 and from the Bulahdelah Upgrading the Pacific Highway Environmental Impact Statement Technical Paper 8 Water (RTA, 2004). A number of culverts were described as “Constructed by others” but the original dimensions from the drawing were assumed in the absence of further information. Only culverts and pipes crossing the highways were added to the model as they would have the largest impact on the flood modelling.
• Locations of pits were mostly available; however, invert level and pit sizing were not always present in the data provided.
MHL assumed a minimum cover depth of 100 mm to 700 mm for all provided pits using standard pipe grading as a guide to ensure hydraulic continuity. The inlets and outlets of the drainage system were checked to ensure that they are lining up with the available elevation data and aerial imagery (e.g. ensuring that headwalls are not located just outside of a dish drain).
All kerb-type pits were assumed to be 1800 mm wide and 200 mm high. A number of discrepancies in pipe sizes were highlighted during the site inspection as described in Section 4.2 The listed discrepancies were corrected prior to including the information into the flood model.
MHL2789 – 36 © Crown 2021 Classification: Release by consent
4.8 Floor level and post-event survey
MHL project team visited the Bulahdelah township between 30 March and 1 April 2021. This site inspection occurred after the 18-24 March large rainfall event that generated the largest water level recorded by the Bulahdelah gauge since its installation in late 1985. This site inspection had two main purposes:
• Measuring potential flood marks observed around the township
• Complete a visible survey of the floor level for the entire township of Bulahdelah
4.8.1 Post-event survey
A number of flood marks were measured during this site inspection including seven locations within Bulahdelah Township and one location upstream of Markwell Bridge. These flood marks were captured using a real-time kinematic GPS device (RTK) and are further discussed in the model calibration and validation section (Section 8.4).
4.8.2 Floor level survey
A total of 564 properties were surveyed for floor levels. The survey consisted of collecting the following information:
• Number of steps between the ground level and the floor level (assuming a 0.15 m step)
• Property type (e.g. residential, commercial, industrial, etc.)
• Construction type (e.g. slab-on-ground/low-set, high-set)
• Wall type (e.g. fibro, brick, timber, etc.)
• Number of storeys
• Photograph of the property
Results of the floor level survey are presented in Appendix B
4.8.3 Additional ground survey
During the same site visit, the project teams contacted the owner of the River Myall Holiday Resort and obtained permission to take a few survey points around the property to improve representation of the local topography into the hydraulic model since the existing LiDAR information was captured prior to the development of the property and changes in the local ground surface. These additional survey points were included into the model prior to running the design events.
MHL2789 – 37
Crown 2021
consent
©
Classification: Release by
5 Community consultation
5.1 Consultation process
Consultation provides an opportunity for various stakeholders, including the community, to collaborate in developing the Bulahdelah FRMS&P. Engaging the community throughout the process provides opportunities to both garner useful feedback and ideas regarding potential floodplain management measures, and increase community acceptance of the floodplain risk management plan.
The consultation program for the FRMS&P has included the following activities:
• Inception and progress meetings between the consultant and Council
• Meetings of the Bulahdelah Floodplain Risk Management Working Group
• Consultation with agencies and stakeholders
• Website development
• Letter and questionnaire for property owners
These activities are described at greater length below.
5.2 Working group
The Floodplain Management Advisory Committee (the Committee) was formed by Council to provide a forum that brings together the diverse expertise and community knowledge that is needed to address technical, social, economic and ecological issues concerning floodplain risk management in the study area. The committee fulfills the functions of a Floodplain Risk Management Committee as described in the Floodplain Development Manual (NSW Government, 2005).
The committee comprises representatives from:
• The community and farming industry
• Appropriate officers from Council and MidCoast Council Floodplain Management Advisory Committee, including planners and engineers
• NSW Department of Planning Industry and Environment, Biodiversity, Conservation and Science division (BCS)
• The NSWState Emergency Servicesand/or NSWPolice Force (acting in lieu of the NSW State Emergency Services due to the lack of Bulahdelah-based SES representative). It is noted that the nearest SES unit is located in Stroud. The NSW Police Force may receive assistance from the Rural Fire Service if required and are the main point of contact as they are located in town.
5.3 Website
A website was developed to provide information about the study, general flooding information, and a link to the online questionnaire Some snapshots of the project website are presented in
MHL2789 –
38 © Crown 2021 Classification: Release by consent
5.4 Letter and questionnaires
5.4.1 General approach
In November 2020, over 800 letters were distributed to all properties in Bulahdelah. The community letter alerted the residents and businesses of the online survey that was available to complete. A copy of the letter is included in Appendix C of this report.
An online survey was made available until end of January seeking community input about historic flooding and ideas about floodplain management options in the study area. The survey is included in Appendix C . A hardcopy of the survey was mailed to Bulahdelah’s residents at


MHL2789 – 39 © Crown 2021 Classification: Release by consent
5.1
Figure
Figure 5.1 Samples of the project website
the same time as the community letter.
The online survey has been using the SurveyMonkey platform.
5.4.2 Questionnaire results
A total of 59 responses were received. This represents a response rate in the order of 7%. A total of 17 responses were provided using the online questionnaire and 42 hard-copy responses were submitted. It is noted that the questionnaire was sent to all Bulahdelah residents which includes people that are in areas unlikely to be flood affected and who may be less likely to provide a response. Results of the survey are provided in Appendix C
The following key observation were made based on the community survey:
• The vast majority of respondents have a residential property (over 79.7%) 8.5% of the properties are farming/rural, 6.8% are vacant land and 3.4% are commercial.
• Over 84% of properties are owner occupied.
• Many residents have been living there for a long time (15.3% lived between 10-20 years, about 44.1% have lived there for over 20 years and 50.3% lived there for less than 5 years)
• About 50.8% of the respondent mentioned that their property was affected by flooding. It is important to note the personal interpretation of flood affectation (i.e. flooding of property vs. flooding of building).
• 25 respondents provided one or multiple example of flood events. The most commonly impacted part of the property included the ground (~41%), the garage/shed (~22%) and the access road (~19%). About 12% of the building were affected.
• Observed flood depths were typically described as over 0.3 m (~68% over 0.3 m, ~47% over 0.5 m, ~24% over 1 m and a couple of respondents mentioned depths greater than 3 m).
• Flooding durations range between less than 1 hour to several weeks with the majority (~76%) describing flooding as lasting for a number of hours up to 24 hours.
• The flood water was described primarily as having a running pace (~46%), followed by a walking pace (~34%) and then a stationary pace (~20%).
• The main sources of flooding were described as the water flowing from local drainage channel (~33%), floodwater rising from stream/river (~19%), water flowing down the roads (~19%) followed by overflow from neighbouring properties (~15%) and ponding of water on road (~11%).
• The expected response from the respondents during a future flood event would be to stay at the property (~64%), protect/raise/secure valuable and goods at risk (~24%), follow their flood management plan (~17%), evacuate early to official evacuation point (~12%) or move upstairs (~7%). About 12% of respondents were unsure of how they would react and ~7% did not specify any answer.
• The decision to evacuate or remain at the property will be made depending on if the house cannot be flooded/respondent can cope with isolation (~36%), family safety (~29%), availability of the access road (~25%), required access to medical facilities
MHL2789 – 40 © Crown 2021 Classification: Release by consent
(~20%), flood warnings (~17%), care for pets/animals (~14%) and discomfort/cost of being isolated by floodwaters (~7%).
• A number of residents provided photographs as well as other flood information. Example of photographs are provided in Figure 5.2 and Figure 5.3. Some photographs received from local residents were used for validation of the model (Appendix E).

– 41
Crown 2021
Release
consent
MHL2789
©
Classification:
by
Figure 5 2 Flooding along Lee Street (Photograph courtesy of Kevin Smith)
The main concerns and suggestions from the respondents regarding flooding included:

• Lack of drainage system maintenance and cleaning in the town (28 respondents)
• Requirement for upgraded drainage system (18 respondents)
• Channels and drainage system need to be cleared from vegetation (7 respondents)
• Impact from past development such as the Bulahdelah Bypass (3 respondents), the new

MHL2789 – 42 © Crown 2021 Classification: Release by consent
Figure 5.3 Flooding in Alexandra Street in 2020 (Photo Courtesy of Elfrieda McDean)
Figure 5.4 Full drainage channel looking downstream and upstream from Stroud Street in July 2020 (Photo Courtesy of John and Heather Lee)
caravan park (2 respondents) and local developments (2 respondents). NSW SES also noted that they attended local flash flooding in houses that had not previously been affected potentially due to some changes in local run off and drains flooding following the construction of the bypass.
• The need for kerb and gutter (2 respondents)
• Flooding from neighbouring properties (2 respondents)
• Weed control upgrade (2 respondents). A number of respondents suggested flood mitigations such as:
• Construction of a levee or filling land
• Flood zoning classification update
• Road surface upgrades
• Upgrade of the Richmond Street drain between Stroud Street and the river
• Deepening of drainage creeks
• Development control in flood affected areas such as Jackson Street
• Flood water diversion alongside Ann Street and Church Street directly to the river
• Piping of open drains
• Construction of swale or re-vegetation to slow down floodwater
• Excavation of silted Frys Creek near junction with Myall River
MHL2789 – 43 © Crown 2021 Classification: Release by consent
6 Hydrological analysis
Hydrologic modelling consists of determining the volume of water and the flows generated in a catchment based on various parameters including rainfall, catchment area, percentage of the ground that is pervious (such as grass or bare earth for example) or impervious (such as concrete or roads) and typical lag coefficient (which defines the time the flood water takes to travel through the catchment).
6.1 Model selection
The hydrological model selected for this study is WBNM (version 2017). This version of the model has been developed to include the 2016 Intensity-Frequency-Duration (IFD) diagrams that are at the basis of the ARR 2019 guideline requirements.
6.2 Model setup
6.2.1
Catchment delineation
This study utilised a WBNM hydrologic model that covers the catchment of approximately 436.8 km2 , shown on Figure 6.1. The catchment extends down to Bombah Broadwater. The catchment was divided into 213 sub-catchments, delineated based on an 8 m DEM developed from the available LiDAR information. The sub-catchments were delineated using CatchmentSIM version 3.6. This software was specifically developed to identify how subcatchments are connected and determine the surface characteristics of each sub-catchment such as area and percentage impervious.
6.2.2
Model parameters
Parameters required by the WBNM model include sub-catchment area and linkage, pervious and impervious percentage, runoff lag factor, stream routing lag factor, rainfall input, initial losses and continuing losses.
6.2.2.1 Imperviousareas
Impervious areas were derived by adopting impervious percentages for various land uses defined by Councils GIS layer for LEP zoning. A land use map is presented on Figure 2 10 Based on land use areas, a weighted average was calculated for each sub-catchment. The urbanized/residential areas were assumed to be 60% impervious, roadway corridors 100% and water bodies/basins 100% impervious while the rest was assumed as pervious surface. Table 6.1 summarises the percentage imperviousness used for each sub-catchment as per Figure 6.1
MHL2789 – 44 © Crown 2021 Classification: Release by consent
© Crown 2021
Table 6.1 Adopted impervious area percentage per sub-catchment
MHL2789 – 45
Classification: Release by consent
SubCatchment Area (ha) % Impervious SubCatchment Area (ha) % Impervious SubCatchment Area (ha) % Impervious 1.01 535.92 0.09 24.01 194.22 0.00 58.01 347.58 0.00 1.02 380.22 1.73 25.01 399.59 0.00 59.01 240.38 0.00 1.03 130.64 2.09 26.01 71.82 0.00 59.02 80.12 0.00 1.04 709.24 3.52 27.01 96.32 2.76 6.01 770.83 0.00 1.05 652.47 4.32 28.01 10.96 0.29 6.02 459.79 0.01 1.06 62.87 13.42 29.01 507.60 0.00 60.01 177.71 0.00 1.07 80.20 6.38 29.02 207.16 2.51 61.01 486.45 0.01 1.08 252.86 3.91 3.01 171.47 0.05 62.01 564.17 0.11 1.09 326.10 3.76 30.01 526.72 0.23 63.01 442.05 0.95 1.10 72.81 4.73 30.02 14.95 1.24 64.01 55.40 2.07 1.11 344.84 3.27 31.01 481.76 1.16 65.01 891.03 0.01 1.12 94.75 4.77 32.01 22.47 0.14 65.02 226.07 0.95 1.13 15.25 17.62 33.01 202.18 0.00 66.01 804.29 0.16 1.14 43.48 7.14 33.02 297.40 2.09 67.01 487.69 1.23 1.15 14.06 21.12 34.01 178.46 0.00 68.01 101.62 3.45 1.16 8.35 8.20 35.01 28.21 0.84 69.01 615.53 0.33 1.17 8.15 15.23 36.01 154.85 0.00 69.02 193.34 0.13 1.18 102.71 7.76 36.02 87.28 3.39 7.01 302.28 0.00 1.19 226.59 2.40 37.01 9.78 0.39 7.02 289.18 0.00 1.20 18.67 14.30 38.01 59.07 0.12 70.01 148.95 2.68 1.21 56.77 3.98 39.01 37.38 0.45 71.01 424.51 2.49 1.22 12.32 25.04 4.01 1468.08 1.89 72.01 44.93 0.17 1.23 17.96 24.65 40.01 744.15 0.01 73.01 408.04 0.22 1.24 20.74 31.81 40.02 496.70 2.60 74.01 65.06 4.08 1.25 30.95 13.56 40.03 13.34 24.47 74.02 71.18 43.54 1.26 31.74 16.31 40.04 79.17 5.65 74.03 5.79 35.09 1.27 41.08 12.36 40.05 14.28 11.21 74.04 14.00 7.29 1.28 93.86 8.25 40.06 38.07 5.38 75.01 41.49 50.74 1.29 65.98 26.97 41.01 596.58 1.28 76.01 105.50 54.03 1.30 10.40 27.82 42.01 165.98 0.32 77.01 74.58 0.69 1.31 4.15 61.91 43.01 111.65 5.08 77.02 39.24 2.30 1.32 8.06 38.63 44.01 72.44 3.69 77.03 13.03 10.41 1.33 23.33 30.45 45.01 134.20 1.79 78.01 83.74 4.50 1.34 12.91 19.98 45.02 33.69 3.25 79.01 12.88 10.09 1.34 12.91 19.98 45.03 52.13 2.90 79.02 22.20 4.73 1.35 51.85 14.43 46.01 104.90 3.96 79.03 9.11 5.13 1.36 24.21 20.86 47.01 149.54 0.00 8.01 156.86 0.00 1.37 23.24 24.54 47.02 549.86 0.01 80.01 12.15 10.64 1.38 21.00 17.68 47.03 84.72 6.62 81.01 9.64 44.29 1.39 188.52 4.21 47.04 23.86 9.01 82.01 157.21 1.18 1.40 92.76 8.78 47.05 62.40 1.76 82.02 31.73 2.14 1.41 13.61 17.40 47.06 86.45 2.25 82.03 16.70 11.07
– 46 © Crown 2021 Classification: Release by consent SubCatchment Area (ha) % Impervious SubCatchment Area (ha) % Impervious SubCatchment Area (ha) % Impervious 1.42 105.63 4.24 47.07 107.03 3.10 82.04 9.33 15.29 1.43 401.08 2.40 48.01 134.23 0.00 82.05 53.45 15.30 1.44 13.74 30.32 49.01 48.88 1.77 83.01 206.64 0.53 1.45 210.00 1.40 5.01 590.23 0.68 84.01 256.65 2.29 1.46 513.90 0.00 50.01 176.56 1.09 84.02 35.57 2.88 1.47 258.99 0.00 51.01 29.70 7.13 84.03 235.60 0.59 10.01 77.54 4.09 51.02 82.69 3.82 84.04 202.95 2.85 11.01 318.05 0.99 51.03 13.12 6.15 85.01 150.42 4.04 12.01 704.65 0.00 51.04 46.99 4.84 86.01 74.63 4.48 12.02 40.47 0.27 51.05 31.45 3.36 86.02 16.50 12.37 13.01 660.19 0.01 52.01 133.34 0.69 86.03 119.11 1.09 14.01 158.01 1.18 53.01 20.28 27.55 87.01 35.46 6.53 15.01 824.68 0.16 53.02 61.05 3.17 88.01 156.90 0.42 16.01 316.04 0.87 54.01 64.39 5.68 89.01 166.63 1.24 17.01 240.36 0.00 55.01 132.38 6.47 9.01 372.49 0.00 18.01 326.29 0.97 56.01 2266.12 1.64 9.02 284.17 0.02 19.01 474.81 0.00 56.02 987.67 2.68 9.03 6.57 0.78 19.02 193.56 2.64 56.03 413.62 4.27 90.01 171.97 2.13 2.01 305.47 0.97 56.04 145.96 7.31 91.01 402.27 0.06 20.01 56.30 2.08 56.05 10.14 32.20 92.01 16.77 0.99 21.01 46.41 6.34 56.06 346.55 3.62 93.01 126.69 0.70 22.01 303.75 0.00 56.07 48.15 12.69 94.01 540.17 1.32 22.02 129.39 0.00 56.08 12.19 6.20 95.01 166.93 1.83 22.03 92.06 0.00 56.09 35.26 8.19 96.01 527.83 1.98 22.04 61.91 0.00 56.10 19.30 18.41 96.02 391.94 5.35 22.05 202.30 0.05 56.11 32.34 10.85 96.03 85.44 0.28 22.06 227.60 1.05 57.01 289.93 0.00 97.01 259.07 0.03 22.07 96.60 1.93 57.02 97.47 0.00 98.01 428.14 0.16 23.01 122.30 0.00 57.03 787.18 0.01 99.01 261.84 0.00
MHL2789


Hydrologicmodel catchment delineation
ReportMHL2789
©Crown2021/ImageSource:Google2021 N
Figure6.1
2DDomain WBNMSub-Catchment Boundary Legend
ReviewofBulahdelah FloodplainRisk ManagementStudyandPlan
©ImageSource:Nearmap2021
6.2.2.2 Losses
WBNM hydrologicmodelusesinitialand continuing rainfall lossesobtained from the ARR 2019 Data Hub (http://data.arr-software.org/).
Sensitivity of the flow to continuing loss for the total catchment upstream of Bulahdelah Bridge during the April 2015 event is illustrated in Figure 6.2. It can be noted that continuing losses require to be high to generate changes in the response in flows.
Based on the recent guideline developed by NSW DPIE (Office of Environment and Heritage, 2019), in the absence of calibrated losses (i.e. calibrated to flows at a stream gauge) in the catchment or nearby, the continuing loss value provided by the ARR 2019 Data Hub is to be multiplied by a factor of 0.4. In Bulahdelah catchment, the continuing rainfall loss is therefore taken as 0.4 × 3.1 mm/hr = 1.24 mm/hr. This value was compared to the continuing loss of 0.5 mm/hr (adopted in the Lower Myall River and Myall Lake Flood Study) as well as larger continuing loss values. The 0.5 mm/hr value provided the best match in the calibration and was therefore adopted for both calibration and design runs Moreover, a continuing rainfall loss of 0 mm/hr was adopted for impervious areas for both calibration and design events.
Sensitivity of the flow to initial loss for the total catchment upstream of Bulahdelah Bridge during the April 2015 event is illustrated in Figure 6.3. Larger initial losses would reduce peak flow and slow down the catchment flow response.
The initial loss for pervious area for calibration varies due to different antecedent conditions. The probability neutral burst initial loss values for pervious areas has been adopted for the design events (see Appendix D ). Moreover, an initial loss of 1 mm was adopted for

MHL2789 – 48
Crown 2021 Classification: Release by consent
©
Figure 6 2 Sensitivity of flows to continuing loss for catchment upstream of Bulahdelah Bridge
impervious areas for both calibration and design events.
An initial loss of 0 mm and a continuing loss of 1 mm/hr were adopted for pervious areas for the PMF event as recommended in ARR 2019
6.2.2.3 Lag
WBNM recommends lag parameter values ranging between 1.3 and 1.8 with an average value of 1.6. It is also the recommended value for use on ungauged catchments for NSW (Boyd and Bodhinayake 2006). A stream lag routing Type R with a value of 1 was adopted. This is the recommended natural channel routing value.
Responses of the catchment upstream of Bulahdelah Bridge to changes in lag parameter C and routing parameter R during the April 2015 event are compared in Figure 6 4 and Figure 6 5 respectively. It is noted that both parameters have similar flow response patterns and the lag parameter C was therefore used as main calibration parameter.

It was found that a larger C parameter provided a slower response in flow with a less peaky rising limb and a flatter tailing limb of the hydrograph which is consistent with the water level response as measured at Bulahdelah.
A value of 2.5 was found to provide the best results. While this value is higher than the typical recommended values, most of the catchment is densely vegetated and a considerable portion of the catchment is very flat The riverbed is also very deep and low-lying which would significantly reduce the flow conveyance and therefore an increased lag would occur
MHL2789 – 49 © Crown 2021 Classification: Release by consent
Figure 6.3 Sensitivity of flows to initial loss for catchment upstream of Bulahdelah Bridge


MHL2789 – 50 © Crown 2021 Classification: Release by consent
Figure 6 4 Sensitivity of flows to Lag parameter for catchment upstream of Bulahdelah Bridge
Figure 6.5 Sensitivity of flows to Routing parameter for catchment upstream of Bulahdelah Bridge
6.2.3 ARR 2019 IFD data
The Australian Rainfall and Runoff (ARR) guidelines were updated in 2016, and revised in 2019, due to the availability of numerous technological developments, a significantly larger dataset since the previous edition (1987) and the development of updated methodologies. A key input to the process is information derived from rainfall gauges, and the dataset now includes a larger number of rainfall gauges, which continuously recorded rainfall (pluviometers), and a long record of storms, including additional rainfall data recorded between 1983 and 2012.
ARR 2019 recommended implementing the following features:
• Intensity, Frequency and Duration (IFD) rainfall data, pre-burst, and initial and continuing loss values across Australia;
• Critical duration derived from an ensemble assessment of 10 temporal patterns for each storm duration. The temporal pattern producing the mean level within each duration is selected. The critical duration is the duration for which the selected temporal pattern produces the maximum flood level;
• The inclusion of Areal Reduction Factors (ARFs) based on Australian data for short duration (12 hours and less), long duration (larger than 24 hours), and durations between 12 and 24 hours.
In the present study, the methodologies provided in ARR 2019 were implemented for design flood modelling, as these methodologies represent the best practice and would increase the longevity of the outputs of the Study.
6.2.4 ARR 2019 spatially varied IFDs
Design rainfalls (ARR 2019 IFDs) were obtained from the Bureau of Meteorology (BoM) for specific AEP and duration combinations across the catchment. The Data Hub metadata is presented in Appendix D
6.2.5 ARR 2019 temporal pattern
Temporal patternsdescribe how rain fallsovertime and form a component of storm hydrograph estimation. ARR 2019 has adopted a regionally specific ensemble of ten different temporal patterns for a particular design rainfall event. Given the rainfall-runoff response is catchment specific, using an ensemble of temporal patterns attempts to produce the median catchment response.
The ARR 2019 method provides patterns for 12 climatic regions across Australia, with Bulahdelah catchment falling within the Southern Semi-arid region. ARR 2019 provides patterns for each duration which are sub-divided into temporal pattern bins based on the frequency of the events. Figure 6 6 shows the categories of bins (very frequent, frequent, rare, very rare and extreme) and corresponding AEP groups. At the time of the model update, the “very rare” bin had been unavailable and was not used in this flood study; instead, temporal patterns from the “rare” bin were applied for the 1 in 200 and 1 in 500 AEP events. There are ten temporal patterns for each AEP/duration in ARR 2019 that have been utilised in this study for the 20% event to 1 in 500 AEP events.
MHL2789 – 51
© Crown 2021 Classification: Release by consent
Temporal patterns for this study were obtained from the ARR 2019 Data Hub (http://data.arrsoftware.org/). A summary of the data hub information at the catchment centroid is presented in Appendix D . The method employed to estimate the PMP utilises a single temporal pattern (Bureau of Meteorology, 2003), as is consistent with ARR 2019.
6.2.6 ARR 2019 areal temporal patterns
ARR 2019 recommends that Areal Temporal Patterns (ATP) should be considered in catchments larger than 75 km2 to account for the spatial smoothing of rainfall that occurs over larger catchments. Bulahdelah catchment covers an area of over 430 km2 which is above the threshold of considering ATPs. ATPs are applicable for storm durations including and greater than 12 hours. Hence, ATPs were applied when assessing longer durations above or equal to this threshold in the hydrologic model.
6.2.7 Areal reduction factors
ARFs are defined as an estimate of how the intensity of a design rainfall event varies over a catchment The main assumption in this estimate is that large catchments will not have a uniform depth of rainfall over the entire catchment.The ARFs were derived from the ARR 2019

MHL2789 – 52 © Crown 2021 Classification: Release by consent
Figure 6.6 Temporal pattern bins
Data Hub and applied in the WBNM models for all of the investigated design storm events. The ARF varies with AEP and duration and the resulting set of ARFs for the design storms are provided in Appendix D The ARF for the PMF has been set as 1 as per ARR 2019 recommendations.
6.3 Comparison with “At Site” and ARR 1987 data

The 2016 IFD curves from the Bureau of Meteorology were compared to the IFD created using the “At Site” rainfall gauges available in the vicinity of the study and the results are presented on Figure 6.7. The Bulahdelah Station (Station ID: 209460) had the highest sampling frequency and was used to determine the “At Site” IFD for events up to the 5% AEP. The relatively short period of record did not allow estimates of rarer events. It is noted that the 2016 and the “At Site” IFDs are typically consistent with the largest difference observed for durations of less than 1 hour.
The 2016 IFD were also compared to the 1987 IFD and the results are presented on Figure 6.8. It is observed that the 2016 IFD rainfall intensities are consistent with the 1987 IFD for frequent events and for long durations. The 2016 IFD rainfall intensities are higher than the 1987 IFD intensities for 10% AEP and rarer events particularly for shorter durations.
The 2016 IFD were adopted for this study as per ARR 2019 requirements.
MHL2789 – 53 © Crown 2021 Classification: Release by consent
Figure 6.7 Comparison of “At Site” IFD and 2016 IFD from BoM
6.4 Design events
The design events modelled in this study include:
• Frequent events – 20% AEP
• Rare events – 5% AEP and 1% AEP
• Very rare events – 1 in 200 AEP and 1 in 500 AEP
• Extreme event – Probable Maximum Flood (PMF)

The terminology of these events is defined as per the ARR 2019 guidelines presented in Figure 6.6. All events (except the PMF) use spatial and temporal patterns provided by the ARR 2019 Data Hub. The PMF uses a combination of other temporal and areal patterns as described in the following section.
6.5 Probable Maximum Flood event
The Probable Maximum Flood (PMF) is the largest flood event resulting from the Probable Maximum Precipitation (PMP). The PMP rainfall depth has been estimated using the ARR 2019 guidelines. According to the PMP method zones diagram (Bureau of Meteorology, 2003) Bulahdelah catchment fall within the GSAM-GTSMR Coastal Transition Zone. Therefore, durations of up to 6-hours have been considered for the PMP in accordance with the Generalised Short Duration Method (GSDM) derived by the Bureau of Meteorology (BoM) (Bureau of Meteorology, 2003) and durations of 24 hours or longer have been estimated using both the Generalised Southeast Australia Method (GSAM) (Bureau of Meteorology, 2006) and the Generalised Tropical Storm Method (GTSMR) (Bureau of Meteorology, 2005) Intermediary durations (i.e. 9 hr, 12 hr and 18 hr) have been estimated using all three methods and the maximum has been used for the PMF. A summary of the GSDM, GSAM and GTSMR results were provided in Table 6.2, Table 6.3 and Table 6.4, respectively
MHL2789 – 54 © Crown 2021 Classification: Release by consent
Figure 6.8 Comparison of 1987 IFD and 2016 IFD from BoM
Table 6.2 GSDM summary for Bulahdelah Catchment
MHL2789 – 55 © Crown 2021 Classification: Release by consent
LOCATION INFORMATION Catchment Name: Bulahdelah Catchment State: NSW Duration Limit: 6.0 hrs (3 – 6) hours Area: 437.15 km2 Approx. Centroid Easting 421327.998 Northing 6419612.198 Portion of Area Considered: Smooth, S: 0.00 (0.0 – 1.0) Rough, R: 1.00 (0.0 – 1.0)
ADJUSTMENT FACTOR (EAF) Mean
Adjustment
Elevation
m) 0.00 EAF: 1.00 (0.85 – 1.00) GSDM MOISTURE ADJUSTMENT FACTOR (MAF) GSDM MAF: 0.74 (0.46 – 1.19) PMP Values (mm) Duration (hours) Initial DepthSmooth (Ds) Initial DepthRough (DR) PMP Estimate = (Ds×S+DR×R)×MAF×EAF Final PMP Estimate (from envelope) 0.25 0 128.98 95 100 0.5 0 189.93 141 140 0.75 0 242.58 180 180 1 0 293.65 217 220 1.5 0 386.17 286 280 2 0 446.20 330 330 2.5 0 505.29 374 370 3 0 546.92 405 400 4 0 620.76 459 460 5 0 662.25 490 490 6 0 708.41 524 520
ELEVATION
Elevation: 127.67 m required if greater than 1500 m
for
(- 0.05 per 300 m above 1500
Table 6.3 GSAM summary for Bulahdelah Catchment
– 56 © Crown 2021 Classification: Release by consent
MHL2789
LOCATION INFORMATION Catchment Name:Bulahdelah Catchment State:NSW GSAM Zone:Coastal Area:437.15 km2 CATCHMENT FACTORS Topographical Adjustment Factor TAF:1.26 (1.0 – 2.0) Annual Moisture Adjustment Factor MAF = EPW seasonal catchment average / EPW seasonal standard Season EPW seasonal catchment averageEPW seasonal standard MAF Summer (Annual) 77.28 80.80 0.96 (0.60 – 1.05) Autumn 63.41 71.00 0.89 (0.56 – 0.91) Summer PMP values (mm) Autumn PMP values (mm) Duration (hours) Initial Depth (Dsummer) PMP Estimate (Ds×TAF×MAFs) Duration (hours) Initial Depth (Dautumn) PMP Estimate (Da×TAF×MAFa) 24 713.07 858.90 24 510.01 573.59 36 799.34 962.80 36 639.81 719.57 48 846.00 1019.00 48 755.82 850.04 72 898.96 1082.79 72 951.23 1069.82 96 945.85 1139.27 96 1021.20 1148.50 Final GSAM PMP Estimates Duration (hours) Maximum of the Seasonal Depths Preliminary PMP Estimate (nearest 10 mm) Final PMP Estimate (from envelope) 1 Where applicable, calculate GSDM depths (Bureau of Meteorology, 2003) 220 220 2 330 330 3 400 400 4 460 460 5 490 490 6 520 520 9 (no preliminary estimates available) 610 12 (no preliminary estimates available) 680 18 (no preliminary estimates available) 790 24 859 860 860 36 963 960 960 48 1019 1020 1020 72 1083 1080 1080 96 1149 1140 1140
Table 6.4 GTSMR summary for Bulahdelah Catchment
Crown 2021
Release
MHL2789 – 57 ©
Classification:
by consent
LOCATION INFORMATION Catchment Name: Bulahdelah Catchment State: NSW GTSMR Zone: Coastal CATCHMENT FACTORS Topographical Adjustment Factor TAF: 1.251 (1.0 – 2.0) Decay Amplitude Factor DAF: 0.835 (0.7 – 1.0) Annual Moisture Adjustment Factor MAFa = EPWcatchment / 120.00 EPWcatchment : 77.29 MAFa : 0.64 (0.4 – 1.1) Winter Moisture Adjustment Factor (where applicable) MAFw = EPWcatchment_winter / 82.30 EPWcatchment-river : 53.60 MAFw : 0.65 (0.4 – 1.1) PMP Values (mm) – Annual Duration (hours) Initial Depth (Da) PMP Estimate = Da×TAF×DAF×MAFa Preliminary PMP Estimate (nearest 10 mm) Final PMP Estimate (from envelope) 1 Where applicable, calculate GSDM depths (Bureau of Meteorology, 2003) 220 220 2 330 330 3 400 400 4 460 460 5 490 490 6 520 520 9 (no preliminary estimates available) 590 12 (no preliminary estimates available) 650 18 (no preliminary estimates available) 760 24 1281.74 862.497 860 860 36 1540.76 1036.792 1040 1040 48 1783.90 1200.406 1200 1200 72 2214.16 1489.933 1490 1490 96 2483.18 1670.960 1670 1670 120 2615.41 1759.933 1760 1760
The temporal patterns used to derive the probable maximum flood (PMF) should be selected from an ensemble of patterns appropriate for use with the Generalised Probable Maximum Precipitation (PMP).
At present, the best source of ensemble temporal patterns for use with short duration PMF events are those derived by Jordan et al (2005) for durations up to 6 hours. The procedure suggested to derive the design temporal distribution of GSAM and GTSMR patterns for duration of 24 hours or longer were described in the revised edition of Australian Rainfall and Runoff, Book IV, ARR (Nathan and Weinmann, 1999) using the Average Variability Method (AVM) of Pilgrim et al., (1969) (Bureau of Meteorology, 2006) and (Bureau of Meteorology, 2005). The GSDM, GSAM and GTSMR patterns were used for intermediary durations (i.e. 9 hr, 12 hr and 18 hr). The Jordan et al. (2005) patterns were derived specifically from storms associated with thunderstorm or deeply convective events while the GSDM, GSAM and GTSMR patterns are defined in the associated guidelines The ellipse approach from the GSDM was applied to define the areal pattern for the shorter duration events.
These patterns were therefore adopted in this study and applied to the calculated PMP rainfall depth. The critical pattern was determined as per the typical ARR 2019 guidelines applied to the other design events.
6.6 Model results and critical durations
For each design AEP event, 23 different durations were modelled ranging from 10 minutes to 168 hours, except for the PMF which had twenty durations ranging from 15 minutes to 120 hours. Within each duration, 10 specific rainfall events were modelled (as recommended in ARR 2019) which varied the rainfall temporal pattern, though not the magnitude, over that period. This led to 230 individually modelled rainfall events per design event which were then analysed to pick the one event to use as design rainfall.
Critical durations were selected based on the methodology described in ARR 2019. This methodology consists of selecting, for each duration, the rainfall temporal pattern that is the closest to the average flow obtained from the 10 specific patterns provided in the ARR 2019 database. This provides an automated approach that can then be adjusted for consistency in durations between the various events.
Figure 6 9 and Figure 6 10 present box-plots for the 1% AEP for both the river catchment (sub-catchment 1.31) and for the township based on the local sub-catchment (sub-catchment
76.01) Critical durations and temporal pattern (from ARR 2019 Data Hub) based on the hydrologic model for each event are presented in Table 6.5. The design storm for each AEP is the rainfall event which results in the median flow for the critical duration (Figure 6.11). The selection of the critical duration for the overall Myall and Crawford Rivers catchments was based on the peak flow at Bulahdelah Bridge and an example is presented in Figure 6.12 for the 1%AEP event.
MHL2789 – 58 © Crown 2021 Classification: Release by consent

© Crown 2021 MHL2789 – 59
Figure 6.9 Critical temporal patterns (TP) distribution for the 1% AEP event at the township catchment (sub-catchment 76.01)

© Crown 2021 MHL2789 – 60
Figure 6.10 Critical TPs distribution for the 1% AEP event at the river catchment (sub-catchment 1.31)

© Crown 2021 MHL2789 – 61
Figure 6.11 Design storm selection from 10 TPs for 1% AEP, 18-hour storm (sub-catchment 1.31)

© Crown 2021 MHL2789 – 62
Figure 6.12 TPs distribution for all durations for the 1% AEP event at the river catchment (sub-catchment 1.31)
Table 6.5 Critical durations for each design event
* Figure 6.10 shows that pattern 112 is the critical duration. This pattern was compared to pattern 114 and the difference in flow is negligible and therefore, pattern 114 was used for all events to improve consistency between events and minimise the risk of having local areas being subject to lower flooding during rarer event due to change in temporal pattern.
** Temporal pattern ID from Jordan et al. (2005) rather than the data hub as recommended for PMF analysis in ARR 2019
6.7 Discussion on Crawford and Myall Rivers flood coincidence
Both the Crawford River and the Myall River catchments are compact and very close. They are therefore expected to typically be subject to similar rainfall patterns and to flood simultaneously. However, the Crawford River catchment was found to be approximately half of the Myall River catchment. This surface area difference would impact on the critical duration of each catchment and the Crawford River would most likely have a shorter critical duration than the Myall River. Application of the typical ARR 2019 approach of analysing all temporal patternsfor all durations would highlight which of the critical durations would lead to the highest flow at Bulahdelah. The temporal pattern and critical duration analysis are described in Section 6.6 The critical durations for the river catchment presented in Table 6.5 include the combined flows of the Myall River and the Crawford River.
The critical duration for the Myall River and Crawford River were then compared separately based on sub-catchments 1.29 for the Myall Riverand 56.11 for the Crawford River and results are presented in Table 6 6 This table compares both rivers’ critical durations and the peak flows from the Crawford River for the Myall River’s critical durations. It was found that both rivers have very similar critical durations. The critical duration of the Myall River only is the same as the combined rivers’ critical duration of 18 hours for most events and 6 hours for the PMF. The critical duration of the Crawford River was found to be between 12 and 24 hours with the 18-hour duration having very similar peak flows. It can also be noted that the flow from the Crawford River catchment is approximately half of the flow from the Myall River only catchment (hence a third of the combined flow at Bulahdelah). Both rivers are therefore likely to peak at the same time except for a very concentrated and localised storm cell.
© Crown 2021 MHL2789 – 63
Catchment Event Adopted Critical Duration Adopted Temporal Pattern from ARR 2019 Data Hub River 20% AEP 18 hr 114 5% AEP 18 hr 114 1% AEP 18 hr 114 1 in 200 AEP 18 hr 114* 1 in 500 AEP 18 hr 114* PMF 6 hr 3** Township 20% AEP 2 hr 4642 5% AEP 1 hr 4569 1% AEP 45 min 4528 1 in 200 AEP 45 min 4528 1 in 500 AEP 45 min 4528 PMF 1.5 hr 8**
© Crown 2021 MHL2789 – 64
Catchment Event Adopted Critical Duration Peak Flow (m3/s) Myall River Only (Critical) 20% AEP 18 hr 432.1 5% AEP 18 hr 667.5 1% AEP 18 hr 1002.4 1 in 200 AEP 18 hr 1167.9 1 in 500 AEP 18 hr 1393.0 PMF 6 hr 4350.5 Crawford River Only (Critical) 20% AEP 24 hr 233.8 5% AEP 12 hr 365.7 1% AEP 12 hr 554.2 1 in 200 AEP 12 hr 642.8 1 in 500 AEP 12 hr 763.9 PMF 6 hr 2339.2 Crawford River Only (Myall River duration for flow comparison) 20% AEP 18 hr 232.8 5% AEP 18 hr 361.3 1% AEP 18 hr 544.2 1 in 200 AEP 18 hr 635.5 1 in 500 AEP 18 hr 757.8 PMF 6 hr 2339.2
Table 6.6 Critical durations comparison between the Myall River and the Crawford River
7 Hydraulic analysis
Hydraulic modelling consists of understanding the physical properties of the flood water such as depth and velocity. This can be completed in various ways including:
- One-dimensional (1D) modelling, which consists of representing a creek or river with flood information provided at regular interval cross-sections along a stream as well as pipe systems and drainage networks
- Two-dimensional (2D) modelling, which consists of representing a floodplain as a grid with flood information provided at each cell of the grid allowing the model to define flowpaths
- Two-dimensional modelling, which can be completed as a combination of 1D and 2D models.
7.1 Model selection
TUFLOW HPC has been used for hydraulic modelling in this study to simulate flood behaviour across the study area. TUFLOW is a robust and widely accepted unsteady-state flood simulation software with combined 1Dand 2D capabilities. The use of a TUFLOWmodel allows integrated investigation of local overland flow flooding, mainstream creek flooding, foreshore flooding and tidal influences, and the inclusion of storm-water drainage infrastructure.
The GIS data layers and control files used to drive the model can be easily modified for use in the optionsassessment, including modelling the impact of mitigation measures, or assessment of development applications. MHL flood modelling processes follow guidance provided in ARR 2019.
The dynamically linked 1D/2D model requires a number of GIS data layers to represent the study area. These include:
• 1D Domain
- Pits and headwalls GIS layer;
- Pipe network GIS layer;
- Culverts GIS layer;
• 2D Domain
- 2D grid / digital elevation model (DEM);
- Topographic modifications and break lines (e.g. to incorporate channel crosssections);
- Materials layer (specifies surface roughness and infiltration);
- Rainfall on the grid;
- Layered flow constrictions layer for 2D bridges; and
- Initial water level polygons
© Crown 2021 MHL2789 – 65
7.2 Model setup
The following considerations were required to set up the TUFLOW model.
7.2.1 Model extent and grid size
Testing of various model extents showed that the TUFLOW model was significantly impacted by the representation of the storage area within the floodplain. For this reason, the TUFLOW model was therefore set up to cover the majority of the floodplain area below approximately 10 m AHD. This covers an area of approximately 89 km2 between Bombah Broadwater and approximately 5 km upstream of Bulahdelah. Given the area of this model, the Quadtree capability of TUFLOW was adopted to represent the catchment. This capability allows the use of multiple cell sizes in the model to increase resolution in areas of interest by halving the cell size a number of times. The grid definition adopted for the TUFLOW model is presented in Figure 7.1
.
A grid cell size of 3.0 m by 3.0 m was found to be suitable to represent flooding within the township of Bulahdelah and was also applied to represent embankment structures such as elevated roads (blue extent in Figure 7.1) The Quadtree capability was then used to transition to a 6 m cell size in the floodplain where rural properties are located and along the main river (yellow extent in Figure 7.1), and to 12 m for the rest ofthe catchment that ismainly composed of large vegetated areas (red extent in Figure 7.1).
The sub-grid sampling (SGS) capability of the TUFLOW model was also set to 1 m (i.e. the resolution of the available DEM). The SGS allows the use of sub-grid-scale elevation data to enhance the hydraulic accuracyof the model (byproviding an improved representation of flows in and out of each cell and the definition of the volume within each cell) while keeping reasonable run times.
This variable size grid complemented by the activation of the SGS allows an appropriate representation of the features of the local urban catchment while keeping the run time reasonable. Initial timesteps of 1.5 second for the 2D model and 0.75 second for the 1D model have been adopted as these are the recommended values for a 3 m cell size (being the smallest cell size in the model) TUFLOW HPC uses an adaptive timestep approach to maintain stability and would vary this original value as required.
7.2.2 Modelling approach
MHL applied the following modelling approach to the development of a detailed, calibrated and reliable 2D/1D TUFLOW hydraulic model for the study area:
• Extent of the study area and 2D hydraulic model was determined based on the available elevation data
• Direct rainfall method was adopted over the 2D model extent and upstream catchments were represented as inflows calculated using WBNM
• Stormwater infrastructure: All pits, pipes, culverts and bridges were modelled as described in Section 7.2.6
• Blockages: The blockage applied to the pits and pipes system has been established by following the method described in the blockage assessment form provided in ARR 2019 and ARR Project 11: Blockage of Hydraulic Structures
© Crown 2021 MHL2789 – 66

N Figure7.1 TUFLOWModel GridDefinition GridResolution 12m 6m 3m Legend ReportMHL2789 ReviewofBulahdelah FloodplainRisk ManagementStudyandPlan ©Crown2021/AerialImagerySource:Google
• Hydraulic roughness: a materials layer was delineated from Council’s cadastre, zoning and aerial photography along with site observations. Initial material categories and associated depth-varying Manning’s roughness coefficients were established for the present study
• Fences: given significant uncertainty and variation in fence type, hydraulic behaviour and permanency throughout the study area, and a lack of verification of hydraulic modelling capabilities to represent them, MHL did not specifically model fences. Rather a ‘lumped’ hydraulic roughness approach was adopted
• Thorough model calibration, validation, verification by alternative methods and quality assurance checks.
7.2.3 Hydraulic roughness
Hydraulic roughness coefficients (Manning’s n) are used to represent the resistance to flow of different surface materials. Hydraulic roughness has a major influence on flow behaviour and is one of the primary parameters in hydraulic model calibration.
Spatial variation in hydraulic roughness is represented in TUFLOW by delineating the catchment into zones of similar hydraulic properties. The hydraulic roughness zones adopted in this study have been delineated based on consideration of Council LEP zoning, cadastral data and aerial photography. Factors affecting resistance to flow were of primary importance including surface material, vegetation type and density, and the presence and density of flow obstructions such as buildings, fences and gross pollutant traps (GPTs). Manning’s ‘n’ values assigned to each zone were determined based on aerial imagery, with reference to standard values recommended by Chow (1959). As resistance to flow due to surface and form roughness varies with depth (e.g. Chow 1959, Institution of Engineers Australia 1987), variable depth-dependent hydraulic roughness values have been adopted for this study to consider the typical sizes of vegetation/obstruction (i.e. typical grass or brush height) Once obstruction is underwater, roughness reduces. Figure 7.2 and Table 7.1 summarise the Manning’s n values used in the hydraulic model. The creek/river roughness used for the TUFLOW model was increased to consider the deep pools present along the river with large variations in invert level from -2 to -11 m AHD at regular intervals along the river channel.
N.B.: The Manning’s n value is changing with depth and for example, for Open Space, the Manning’s n value is 0.075 up to a depth of 0.1m and then transition to a smaller Manning’s n of 0.04 at a depth of 0.5 m or more.
© Crown 2021 MHL2789 – 68
Material Manning’s n below each threshold Thresholds of depth variable roughness (m) Water 0.030 / 0.013 0.1 / 0.5 Residential – Medium density 0.150 / 0.075 0.1 / 0.5 Residential – high density 0.300 / 0.150 0.2 / 1.0 Open Space 0.075 / 0.040 0.1 / 0.5 Vegetation – medium density 0.120 / 0.100 0.2 / 1.0 Vegetation – high density 0.180 / 0.150 0.4 / 2.0 Roadways 0.030 / 0.020 0.04 / 0.20 Creek/River 0.043 / 0.043 0.01 / 0.10
Table 7 1 Adopted Manning’s n Hydraulic Roughness Coefficients


TUFLOWmodel Boundaryconditions andManning'sn Studyarea Creek Road Urbanisedarea Vegetation Waterbody Boundaryconditions Downstreamtailwater Upstreaminflows
assourcearea Legend ReportMHL2789 ReviewofBulahdelah FloodplainRisk ManagementStudyandPlan
Figure7.2
Upstreaminflows
7.2.4 Boundary conditions
Key boundary conditions are illustrated in Figure 7.2 and further details are provided below.
Inflows
The simulated hydrographs produced by the WBNM model for the wider catchment upstream of the TUFLOW model were input at key locations at the upstream end of the TUFLOW model as shown in Figure 7.2
Moreover, within the TUFLOW domain, the direct rainfall approach was applied to the model using the design events identified and defined in the hydrological analysis (Section 6).
Downstream boundary condition
The water level as recorded at the Bombah Point water level gauge was applied as downstream boundary condition for the calibration and validation runs.
The Bombah Point gauge data was analysed to determine appropriate downstream water levels for the design events.
Table 7.2 summarises the peak water levels in Bombah Broadwater based on the annual maximum series (AMS) probability estimation of the water levels at the Bombah Point gauge and as extracted from the 2015 Lower Myall River and Myall Lakes Flood Study It is noted that the period of record is only 20 years at the Bombah Point gauge and the analysis can be influenced by large flood events. For example, the March 2021 level at Bombah Point was much larger than the other values recorded since the installation of the AMS analysis gauge back in July 2001 and this may skew the results of the AMS results over such a short record period. The AMS analysis was therefore completed with and without this event
Table 7.2 Peak design levels at Bombah Point
at Bombah Point gauge / in Bombah
by:
* Annual Maximum Series based on 20 years of data only
** Value was interpolated based on other values provided in flood study
Based on this comparison, the 2015 study values were adopted as tailwater for this study for the following reasons:
© Crown 2021 MHL2789 – 70
Flood Event Annual Exceedance Probability Water
2015 Lower Myall River and Myall Lakes Flood Study Annual Maximum Series excluding March 2021* Annual Maximum Series including March 2021* 50% 1.22 0.81 0.86 20% 1.56 1.21 1.44 10% 1.77 1.52 1.89 5% 1.97 1.83 2.33 2% 2.21 2.24 2.91 1% 2.38 2.54 3.35 0.50% 2.54 2.85 3.80 0.20% 2.74** 3.26 4.38 0.01% 3.37 4.59 6.29
Level
Broadwater as calculated
• The 2015 study values are based on modelled levels rather than raw data analysis and noting that higher levels within the lake would be subject to the topography and increasing volume of the lakes which the AMS does not accurately consider; and
• The AMS was only completed over a 20-year period of record allowing the data to potentially be skewed by large events with return period larger than 20 years that occurred over this period.
Based on the historical water level and rainfall data measured at Bulahdelah and Bombah Point, it was noted that the flooding of Bulahdelah and Bombah Point are not independent and are likely to coincide as the Myall River catchment contributes to a significant portion of the catchment leading to Bombah Broadwater. Therefore, coinciding AEPs have been assumed for Bombah Broadwater and the Myall River (i.e. a 1% AEP design flood event for Bulahdelah was associated with a 1% AEP water level at Bombah Broadwater).
However, further analysis was completed on the timing of the peak of flooding at the Bulahdelah and Bombah Point gauges. It was found that the peak level at Bombah Point typically occurs several hours after the peak at Bulahdelah. This was considered when developing the tailwater level behaviour for each flood event.
To estimate a tailwater behaviour for the model, the following process was followed:
• the volume of the lake at 0.1 m intervals was estimated up to 3 m AHD, as well as at 4 m and 5 m AHD, based on the topographic (LiDAR) data to create a simplified “bucket” model of the lake with an outflow from the lake that was estimated based on these volumes and the recession rate observed during the largest event on record at Bombah Point (i.e. March 2021).
• The inflows calculated in the WBNM model were then inputted in this model (assuming a typical initial water level of 0.5 m AHD for design events) to determine a general shape for the rising limb of Bombah Point based on the Bulahdelah inflows.
• This general shape of the rising limb was then scaled to peak at the appropriate level at Bombah Point foreach design event (e.g. peakof 2.38 m AHD for a 1%AEP flood event). This approach was applied to the March 2013 and March 2021 calibration/validation events and the results are provided in Figure 7.3 While the full timing is not an exact match, it appears to follow a relatively similar trend, and this was considered acceptable for the purpose of defining a tailwater level at the downstream end of the TUFLOW model. This is particularly true given the relatively small influence of the tailwater level on the peak water level at Bulahdelah as discussed in Section 9.1. Therefore, this approach was applied to define the tailwater for the longer critical duration associated with the flooding of the river. The peak Bombah Broadwater values were directly used as a constant value for the shorter critical duration associated with the flooding of the township.
© Crown 2021 MHL2789 – 71


© Crown 2021 MHL2789 – 72
Figure 7.3 Comparisons of recorded data with tailwater level estimated using WBNM for March 2013 and March 2021 events
7.2.5 Blockage
Bridges and culverts are structures that allow water to flow under roads, railways or other obstruction from one side to the other. These structures can be affected by various blockage mechanisms, resulting in increased flood levels, changes to stream flow patterns, changes to erosion and deposition patterns in channels, and physical damage to the structures. Blockage of these structures is discussed in ARR 2019.
This ARR 2019 blockage procedure presented in the Blockage Assessment Form was followed. Cross-drainage structures were identified from Council GIS and included the pedestrian footbridge across Frys Creek.
Each cross drainage was assigned a “High”, “Medium” or “Low” rating for the following ARR 2019 attributes:
• Debris availability – this rating was based on aerial imagery to assess the upstream catchment and the availability of debris
• Debris mobility – this rating was defined using contours based on steepness of the source area and proximity of source area to streams.
• Debris transportability – based on stream dimension in comparison to potential debris as well as stream shape.
• Debris length L10 : ARR 2019 defines this value as:
- the average length of the longest 10% of the debris reaching the site and should preferably be estimated from sampling of typical debris loads. However, if such data is not available, it should be determined from an inspection of debris on the floor of the source area, with due allowance for snagging and reduction in size during transportation to the structure.
- In an urban area the variety of available debris can be considerable with an equal variability in L10. In the absence of a record of past debris accumulated at the structure, an L10 of at least 1.5 m should be considered as many urban debris sources produce material of at least this length such as palings, stored timber, sulo bins and shopping trolleys.
- A value of 1.5 m has been adopted for L10 for all blockage structures in the model. Based on the above approach, the majority of cross-structures have opening lower than the selected L10 and have a design blockage varying between 25% and 100% depending on the AEP ofthe event. The pedestrian bridge west of Rose Street and the culvert under David Street have a larger opening and the blockage would vary between 10% and 20% depending on the AEP of the event.
Regarding all other pits and pipes that were not identified as cross drainage structure, a 50% design blockage was adopted. This value was developed based on the design blockages described in Table 7.1 of ARR Project 11 – Blockage of Hydraulic Structures Stage 2.
7.2.6 Structures
In accordance with the available structures data and topographic data the following structures were included in the hydraulic model:
• Nan Syron Bridge was modelled at 1D elements
© Crown 2021 MHL2789 – 73
• The edge of the Bulahdelah Bypass bridge was modelled as a form loss into the 2D model while the centre of the bridge above the 1D river was not included as the deck level was well above the PMF level.
• Battles Bridge, Frys Creek Bridge and three doubled bridges along Pacific Highway were modelled as 2D elements
• Markwell Back Road Bridge and Wootton Way Bridge were modelled as 1D elements.
• The Crawford River weir was modelled in 2D based on LiDAR levels.
• All pipes and culverts within the study area were modelled as 1D elements.
Figure 7.4 illustrates the pipe network, culverts and bridges included in the hydraulic model.
7.2.7 Creeks and river representation
Following the site inspection, the upstream creeks appeared to be relatively shallow. Some information on depthsand historical cross-sectionswere made available and used to represent the various creeks and rivers. The following assumptions were made in the model:
• Several historical cross-sections of the Myall River were provided as PDF drawings from the Myall River Flood Study in May 1990 and a few cross-sections were also available from the 1991 Bulahdelah Flood Appraisal report. The various cross-sections were used to represent most of the Myall River channel between Bombah Broadwater and Bulahdelah as a 1D model.
• The upstream sections of the various creeks and the upstream end of the Myall River were assumed to be approximately 0.5 m deep and the lowest point observed from the LiDAR data was lowered by 0.5 m assuming a V-shape of the channel from the bank to the invert level.
• No cross-section of Frys Creek was available. However, an invert level was available at regular intervals along the creek (Public Works, 1994), and this level was assumed along the creek, and a V-shape channel was assumed in the upstream creeks.
• The Crawford River channel was reported to be in the order of 3 m deep (NSW Fisheries Office of Conservation, 2003). Therefore, the invert level was set at -2.5 m AHD at the upstream end of the model deepening to -2.7 m AHD at the junction with the Myall River. Based on aerial photograph and LiDAR data, the deep centre of the channel was assumed to be approximately 12 m wide and then transition to the existing bank level where LiDAR becomes representative (i.e. where no water is present).
• Some minor channels leading to ponding areas along the river were also adjusted to remove anomalies in the LiDAR data where blockage of the channels was indicated.
• The DEM at the downstream end of the Myall River, where an anabranch is located, was adjusted to include some local storage assuming a transition from -5 to -6 m AHD depths along the Myall River to a depth of -2 m AHD within the anabranch.
• The ground elevation of the caravan park directly north of the Nan Syron Bridge was updated based on the survey data collected during the project team site visit discussed in Section 4.8.3
© Crown 2021 MHL2789 – 74


HydraulicModel Structuresand1D modellayout Studyarea Culvert Pipe BridgeModelledas
Bridgemodelledas
Legend ReportMHL2789 ReviewofBulahdelah FloodplainRisk ManagementStudyandPlan N ©Crown2021/AerialImagerySource:Google2021
Figure7.4
formlossline
formlosspolygon 2DDEMadjustments
©AerialImagerySource:Nearmap2021
8 Model calibration and validation
8.1 Methodology
Model calibration is an essential step in the flood modelling process to confirm that the model can adequately simulate historical flood events. In order to carry out model calibration, it is necessary to have available suitable recorded data sets against which to evaluate model results. The selection of appropriate historical events for model calibration is, therefore, largely dependent on the availability of relevant flood data.
The most reliable recorded flood data available in the study area are the Bulahdelah and the Crawford River water level records. Although recorded depth and flow data are not available higher in the catchment, calibration against the Bulahdelah and Crawford River water level gauges would indicate that the overall model performance within the Myall River catchment is reliable, and provides confidence in the model parameters and data being adopted throughout the study area.
The Bulahdelah and Crawford River water level records, together with recorded rainfall data, therefore, act as the primary basis for model calibration, with anecdotal flood depth data collected through community consultation also utilised.
8.2 Event selection
Suitable historical calibration and validation events were determined through considering the following criteria:
• the availability of Bulahdelah and Crawford River water level and continuous rainfall data
• the historical significance of recorded rainfall;
• the influence of recorded rainfall on the Myall River water levels;
• the availability of flood depth data collected through community consultation; and
• the representation of the development in the catchment (i.e. events post-construction of the Bulahdelah Bypass were preferred).
A review of the available historical information highlighted the 1-4 March 2013 event as the most suitable event for model calibration because it was the second most significant rainfall event recorded since installation of the Bulahdelah water level gauge in 1985, it was postconstruction of the Bulahdelah Bypass, and the rainfall pattern appeared relatively consistent throughout the catchment
The 21-22 April 2015 event was selected for model validation as this was the most significant rainfall event with Bulahdelah water levels available at the commencement of the study (i.e. prior to the March 2021 event), that occurred after the construction of the Bulahdelah Bypass, and a number of photographs were provided by the community for this event.
Given that the 18-24 March 2021 flood event was the most recent event as it occurred during the development of the flood study and recorded the highest flood level captured by the Bulahdelah gauge since its installation in late 1985, this flood event was used as a secondary validation event.
© Crown 2021 MHL2789 – 76
8.3 Model calibration – 1 to 4 March 2013

8.3.1 1-4 March 2013 event
Rainfall in the study area on 1-4 March 2013 fell primarily over a duration of approximately 24 hours, with a relatively consistent rainfall intensity. This led to an elevated flood level above 3.5 m AHD in the Myall River and at Bulahdelah lasting for over a day. A time-series plot of water level and rainfall data recorded during the event is presented in Figure 8.1.
8.3.2 Rainfall data
Only the Bulahdelah continuous rainfall gauge was active within the study area on 1-4 March 2013. However, a number of neighbouring daily gauges were available around Bulahdelah including the Crawford River and The Cabbage Tree Mountain gauges. These daily gauges showed very similar total rainfall depth during the event and the Bulahdelah Rainfall pattern was therefore adopted for the entire catchment The Crawford River rain gauge was represented by scaling the total daily rainfall measured during this event at this gauge using the Bulahdelah gauge rainfall pattern
Rainfall data converted from radar data was obtained from TheWeatherChaser.com, however, a significant portion of the rainfall event was missing from the radar data and this information was therefore not usable for this event.
8.3.3 Intensity-Frequency-Duration analysis
In order to provide relative context to the intensity of the 1-4 March 2013 rainfall event, the maximum rainfall depth recorded over a given duration has been compared with design Intensity-Frequency-Duration (IFD) data for Bulahdelah, as shown in Figure 8.2.
Based on the Bulahdelah gauge, the 1-4 March 2013 event was found to represent an event equivalent to a 10-20% AEP design rainfall for durations of 30 to 36 hours
© Crown 2021 MHL2789 – 77
Figure 8.1 1-4 March 2013 Event Time-Series
8.2 IFD Comparison 1-4 March 2013

8.3.4 Rainfall loss parameters
The translation of rainfall into runoff is directly influenced by the antecedent soil moisture conditions throughout the catchment. Rainfall losses are applied in hydrologic modelling to represent the amount of rainfall that does not contribute to runoff, primarily as a result of infiltration processes. The initial loss-continuing loss approach is widely accepted and was adopted in this study.
It should be noted that the initial loss-continuing loss model has been developed for use in traditional hydrologic models, which do not consider losses associated with topographic features, for example depression storage. The direct rainfall approach used in this study applies rainfall directly to each model cell and generally results in initial losses associated with small ‘pits’ in the DEM. Research has shown that such losses can be of the same order as traditionally adopted initial loss values (Taaffe et al. 2011).
There have been regular small rainfall events prior to this event and initial losses of 0 mm were applied in the WBNM and TUFLOW model for this event. A continuing loss value of 0.5mm/hr was adopted for pervious areas as previously used in the Lower Myall River and Myall Lake Flood Study It is noted that a 2.5 mm/hr continuing loss was previously used in the past Bulahdelah flood study, however this value appeared to be underestimating the peak of the flood. No losses were applied to impervious or permanently wet areas.
8.3.5 Upstream boundary condition
The flows resulting from the WBNM for the wider catchment were applied at key locations at the upstream end of the TUFLOW model as described in Section 7.2.4.
8.3.6 Downstream boundary condition
The Bombah Point water level gauge recorded data was used as downstream boundary condition for this event.
8.3.7 Rain radar observations
Newcastle rainfall radarobservationsasobtained from TheWeatherChaser.com website which provides access to the Bureau of Meteorology rain radar archives are summarised in
© Crown 2021 MHL2789 – 78
Figure
Appendix E. This website allows the extraction of marker intensity timeseries at selected locations as illustrated in Figure E.1 and the progression of the rainfall radar at regular (1hour) intervals as shown in Figure E.4 The marker intensity timeseries present the rainfall intensity between two dates in a colour bar format. The markers were extracted at three locations: the Bulahdelah Bridge Gauge (BBG), in the Upper Myall River Catchment (UMR) and in the Upper Crawford Catchment (UCR) The three markers were aligned to compare the intensity over time at the three locations. It is noted that the Bulahdelah Bridge gauge is slightly more intense at the start of the storm and less intense at the end of the storm when compared to the Upper Crawford River catchment. The Upper Myall Catchment is not severely impacted by this storm.
8.3.8 Model calibration results
A comparison of recorded and simulated water levels at the Bulahdelah and Crawford River gauges for the 1-4 March 2013 event is shown in Figure 8.3. A strong correlation between simulated and recorded water levels has been achieved in terms of:
• Peak water levels at Bulahdelah gauge – peak flood levels show a fair agreement for this event. The modelled level at peak is within 0.08 m of the maximum recorded level.
• Peak water levels at Crawford River gauge – peak flood levels show a good agreement for this event. The modelled level at peak is within 0.03m of the maximum recorded level.
• Catchment runoff response – the relative timing of the recorded and simulated water levels also shows a strong agreement on the rising limb of the flood. The slight difference in the falling-limb may be related to the Bulahdelah temporal pattern being the only temporal pattern available and being applied for the entire catchment. This can be seen on the marker intensity timeseries in Figure E.1 in Appendix E The Bulahdelah Bridge marker shows a more intense rainfall at the start of the storm and less intense at the end of the storm in comparison to the Upper Crawford River marker. This explains the slightly peakier hydrograph and faster tailing limb, and why the modelled Crawford River gauge responds slightly faster at the start of the storm.
The results of the 1-4 March 2013 event provide confidence in the ability of the developed TUFLOW model to simulate actual catchment flood behaviour.
© Crown 2021 MHL2789 – 79


© Crown 2021 MHL2789 – 80
Figure 8 3 Bulahdelah and Crawford River Water Levels Calibration – 1-4 March 2013
8.4 Model validation – 21 to 22 April 2015
8.4.1 21-22 April 2015 event
The rainfall leading to flooding in Bulahdelah on 21-22 April 2015 fell primarily over a duration of 3 to 6 hours, leading to a relatively short spike in water level in the Myall River. A time-series plot of water level and rainfall data recorded during the event is presented in Figure 8.8.


8.4.2 Rainfall data
Only the Bulahdelah continuous rainfall gauge was active within the study area on 21-22 April 2015. However, a number of neighbouring daily gauges were available around Bulahdelah including the Crawford River, Wootton and the Cabbage Tree Mountain gauges. These three gauges were applied the same temporal pattern as Bulahdelah and used as input for the modelling to consider the spatial distribution of the rainfall event. Cumulative rainfalls recorded at these gauges for the event (based on the total daily rainfall and the Bulahdelah Rainfall gauge temporal pattern) are shown in Figure 8.9.
© Crown 2021 MHL2789 – 81
Figure 8.4 21-22 April 2015 Event Time-Series
Figure 8 5 Cumulative Rainfall during the April 2015 event
Differences are evident in the rainfall records at each site. While these differences are likely to be the result of real spatial rainfall variability, it is notable that the Crawford River gauge recorded higher totals during the validation rainfall event. The majority of recorded rainfall fell over a period of approximately 6 hours from 18:00 on 20 April 2015 to 0:00 on 21 April 2015.
Rainfall data were extracted from the radar data and obtained from TheWeatherChaser.com at 10 locations around the catchment illustrated in Figure 4 1. This data was compared to the available rainfall data captured at the various gauges around the catchment It was found that while the actual rainfall depth extracted from the radar wasmuch lower than the recorded value at the gauges within the catchment, the general temporal pattern was fairly consistent with the recorded data. Therefore, the data from the variouspoints wasused to provide a local temporal pattern, and the rainfall depth was scaled based on the Bulahdelah gauge. This rainfall data was then adopted for modelling of this validation event as it provided a better resolution of the temporal pattern over such a large catchment.
8.4.3 Intensity-Frequency-Duration analysis
In order to provide relative context to the intensity of the April 2015 rainfall event, the maximum rainfall depth recorded over a given duration has been compared with design IntensityFrequency-Duration (IFD) data for Bulahdelah, as shown in Figure 8.10

Figure 8 6 IFD Comparison 21-22 April 2015
Based on the Bulahdelah gauge, the 21-22 April 2015 event was found to represent an event equivalent to a 10 to 20% AEP design rainfall for durations of 180 to 360 minutes. It is noted however that the daily rainfall measured at Crawford River gauge was about 2.5 times the depth of rainfall as Bulahdelah recorded on the same day and the AEP of this event is, therefore, likely to be greater.
8.4.4 Rainfall loss parameters
As shown in Figure 8.9, between 100 mm and 260 mm of rain had fallen over the study area
© Crown 2021 MHL2789 – 82
in approximately 12 hours leading to the event. Considering the dry antecedent conditions and the heavily vegetated upstream catchment, a 20 mm initial loss was applied in the TUFLOW model for this event. A continuing loss value of 0.5 mm/hr was adopted for pervious areas as per the March 2013 flood event. No losses were applied to impervious or permanently wet areas (i.e. road, concrete channel, creek and estuary zones).
8.4.5 Upstream boundary condition
The flows resulting from the WBNM for the wider catchment were applied at key locations at the upstream end of the TUFLOW model as described in Section 7.2.4.
8.4.6 Downstream boundary condition
The Bombah Point water level gauge recorded data was used as downstream boundary condition for the validation event.
8.4.7 Rain radar observations
Newcastle rainfall radarobservationsasobtained from TheWeatherChaser.com website which provides access to the Bureau of Meteorology rain radar archives are summarised in Appendix E. This website allows the extraction of marker intensity timeseries at selected locations as illustrated in Figure E.2 and the progression of the rainfall radar at regular (30minute) intervals as shown in Figure E.5. The marker intensity timeseries present the rainfall intensity between two dates in a colour bar format. The markers were extracted at three locations: the Bulahdelah Bridge Gauge (BBG), in the Upper Myall River Catchment (UMR) and in the Upper Crawford Catchment (UCR). The three markers were aligned to compare the intensity over time at the three locations. It can be observed that the Bulahdelah Bridge gauge was subject to a front loaded storm while the Upper Crawford River catchment is subject to a back loaded storm.
8.4.8 Model validation results Comparison with Recorded Water Level
A comparison of recorded and simulated water levels at the Bulahdelah and Crawford River gauges for the 21-22 April 2015 event is shown in Figure 8.7. This figure also presents the tailwater boundary condition calculated at the downstream end of the model. A strong correlation between simulated and recorded water levels has been achieved in terms of:
• Peak water levels at Bulahdelah gauge – peak flood levels show a fair agreement for this event. The modelled level at peak is within 0.13 m of the maximum recorded level.
• Peak water levels at the Crawford River gauge – peak flood levels show a relatively poor agreement for this event. The modelled level at peak is about 0.33 m lower than the maximum recorded level. This difference in peak is due to the limited rainfall data available across such a large catchment aswellas limited bathymetric information along the Crawford River
• Catchment runoff response – the relative timing and behaviour of the recorded and simulated water levels as well as the overall volume also show a general agreement on both the rising limb and the falling limb of the flood for both the Bulahdelah and the Crawford River gauges
The results of the 21-22 April 2015 event therefore provide confidence in the ability of the developed TUFLOW model to simulate actual catchment flood behaviour at Bulahdelah.
© Crown 2021 MHL2789 – 83
Comparison with flood photographs of the event
A number of photographs of the April 2015 flood event were provided highlighting flooding in Bulahdelah and the results of the calibration were compared to these photographs. The comparison is provided in Table E.1 of Appendix E. The model appears to reasonably represent the flowpaths and inundation extents highlighted by the provided photographs.
© Crown 2021 MHL2789 – 84


© Crown 2021 MHL2789 – 85
Figure 8.7 Bulahdelah and Crawford River Water Levels Validation – 21-22 April 2015
8.5 Model validation – 18 to 24 March 2021
8.5.1 18-24 March 2021 event
The rainfall leading to flooding in Bulahdelah on 18-24 March 2021 fell primarily over a duration of 4 days, leading to the largest water level recorded by the Bulahdelah gauge since its installation on the Myall River in 1985. A time-series plot of water level and rainfall data recorded during the event is presented in Figure 8.8 It can be noted that the event includes two peaks: a first peak occurred in the morning of Saturday 20 March and a second peak of similar amplitude occurred in the middle of the night from Sunday to Monday 21-22 March.

Event Time-Series
N.B.:ItisnotedthatBombahPointgaugewasfloodedduringthiseventanddatabetween6pmon21/3/2021and8pm on24/03/2021wereestimatedbasedontheavailabledataandtherecordedpeaklevelof2.89mAHD
8.5.2 Rainfall data
Only the Bulahdelah and Markwell continuous rainfall gauges were active within the study area on 18-24 March 2021. However, a number of neighbouring daily gauges were available around Bulahdelah including the Crawford River and the Cabbage Tree Mountain gauges.
Rainfall data was extracted from the radar data and obtained from TheWeatherChaser.com at 10 locations around the catchment illustrated in Figure 4.1. This data was compared to the available rainfall data captured at the various gauges around the catchment. It was found that while the actual rainfall depth extracted from the radar wasmuch lower than the recorded value at the gauges within the catchment, the general temporal pattern was fairly consistent with the recorded data. Therefore, the data from the various points were used to provide a local temporalpattern and the rainfall depth wasscaledbased on the Bulahdelah gauge. This rainfall data was then adopted for modelling of this validation event as it provided a good resolution of the temporal pattern over such a large catchment.
Cumulative rainfall recorded at these gauges for the event (based on the total daily rainfall and scaling of the rainfall radar information) is shown in Figure 8.9
© Crown 2021 MHL2789 – 86
Figure 8.8 18-24 March 2021
Differences are evident in the rainfall records at each site. While these differences are likely to be the result of real spatial rainfall variability, it is notable that the Cabbage Tree Mountain gauge recorded higher totals during this rainfall event.
The majority of recorded rainfall fell between 18 March and 22 March 2021.
8.5.3
Intensity-Frequency-Duration analysis
In order to provide relative context to the intensity of the March 2021 rainfall event, the maximum rainfall depth recorded over a given duration has been compared with design Intensity-Frequency-Duration (IFD) data for Bulahdelah, as shown in Figure 8 10
Based on the Bulahdelah gauge, the 18-24 March 2021 event was found to represent an event larger than a 5% AEP design rainfall for durations of 4 to 7 days, and about 20% for the critical


© Crown 2021 MHL2789 – 87
Figure 8.9 Cumulative Rainfall during the March 2021 event
Figure 8.10 IFD Comparison 18-24 March 2021
duration of the catchment of 18 hours. It is noted however that the daily rainfall measured at the Cabbage Tree Mountain gauge was about 2.5 times the depth of rainfall as Bulahdelah recorded on the same day; the AEP of this event is,therefore, likely to be greater. Furthermore, the very long duration led to significant flooding of the Bombah Broadwater, which reached a level of 2.89 m AHD and contributed to some backwater effect at Bulahdelah.
8.5.4
Rainfall loss parameters
As shown in Figure 8.9, between 420 and 770 mm of rain had fallen over the study area in approximately 4 days leading to the event. Considering the wet antecedent conditions, a 0 mm initial loss was applied in the TUFLOW model for this event. A continuing loss value of 0.5 mm/hr was adopted for pervious areas. No losses were applied to impervious or permanently wet areas (i.e. road, concrete channel, creek and estuary zones).
8.5.5
Upstream boundary condition
The flows resulting from the WBNM for the wider catchment upstream of the TUFLOW model were applied at key locations at the upstream end of the TUFLOW model as described in Section 7.2.4
8.5.6 Downstream boundary condition
The Bombah Point water level gauge recorded data was used as downstream boundary condition for the validation event. It is noted that the Bombah Point gauge was flooded during this event and data between 6 pm on 21/3/2021 and 8 pm on 24/03/2021 were estimated based on the available data and the recorded peak level of 2.89 m AHD.
8.5.7
Rain radar observations
Newcastle rainfall radarobservationsasobtained from TheWeatherChaser.com website which provides access to the Bureau of Meteorology rain radar archives are summarised in Appendix E. This website allows the extraction of marker intensity timeseries at selected locations as illustrated in Figure E.3 and the progression of the rainfall radar at regular (2hour) interval as shown in Figure E.6. The marker intensity timeseries present the rainfall intensity between two dates in a colour bar format. The markers were extracted at three locations: Bulahdelah Bridge Gauge (BBG), in the Upper Myall River Catchment (UMR) and in the Upper Crawford Catchment (UCR). The three were aligned to compare the intensity over time at the three locations. It can be observed that some parts of the catchment are impacted at different times and the rainfall can sometimes fall on localised parts of the catchment (e.g. upstream only or downstream only)
8.5.8 Model validation results Comparison with Recorded Water Level
A comparison of recorded and simulated water levels at the Bulahdelah and Crawford River gauges for the 18-24 March 2021 event is shown in Figure 8.7. A fair correlation between simulated and recorded water levels has been achieved in terms of:
• Peak water levels at Bulahdelah gauge – peak flood levels show a fair agreement for this event. The modelled level at peak is approximately 0.08 m lower and 0.17 m higher than the recorded levels for the first and second peaks respectively
• Peak water levels at the Crawford River gauge – peak flood levels show a relatively poor agreement for this event. The modelled level at peak is about 0.27-0.30 m lower than the maximum recorded level for the two peaks This difference in peak is due to the limited
© Crown 2021 MHL2789 – 88
rainfall data available across such a large catchment as well as limited bathymetric information along the Crawford River
• Catchment runoff response – the relative timing of the recorded and simulated water levels also shows a fair agreement in the overall volume and the behaviour of the storm
The results of the 18-24 March 2021 event therefore provide further confidence in the ability of the developed TUFLOW model to simulate actual catchment flood behaviour at Bulahdelah. Comparison with flood mark levels measured following the event
A number of flood marks were collected by MHL’s project team following the flood event. The results of the calibration were compared to the levels measured during the site visit. The comparison is provided in Figure E.7 of Appendix E. The model appears to reasonably represent the peak flood levels measured around Bulahdelah with level differences ranging between 0.04 and 0.23 m There are some larger differences near Markwell Bridge with difference of about 0.35-0.44 m.It is noted that while some of the flood marks in the Bulahdelah township showed clear lines along fences highlighting the peak flood level (Figure 8.12a&b), other flood marks where estimated based on visible stains and debris and may have a lower level of accuracy (Figure 8 12c&d).
© Crown 2021 MHL2789 – 89


© Crown 2021 MHL2789 – 90
Figure 8 11 Bulahdelah and Crawford River Water Levels Validation – 18-24 March 2021


© Crown 2021 MHL2789 – 91
(a) Flood Mark ID 7
(b) Flood Mark ID 8
(c) Flood Mark ID 1
(d) Flood Mark ID 5
Figure 8.12 Example of flood marks recorded following the March 2021 flood event
8.6 Discussion of Model Calibration and Validation
Despite some differences in observed and simulated peak water levels, the developed TUFLOW flood model appears to have performed reasonably well. This is supported by good comparisons between simulated and recorded water levels for both the calibration and validation events at Bulahdelah and Crawford River water level gauges, and agreement on catchment runoff response shown by flow hydrographs computed by TUFLOW and WBNM.
Some discrepancies between simulated and recorded water levels in Crawford River appear to be related primarily to limited availability of accurate rainfall information to determine the rainfall distribution over such a large catchment area. However, the use of rain radar information allowed the model to reproduce an overall good match in shape and volume of the various flood events and reasonable results were obtained when comparing the results to available flood marks and flood photographs.
To further assess the sensitivity of the flows from the Crawford catchment, additional model runs were undertaken by increasing the 5% AEP and 1% AEP flows from the Crawford catchment by 30%. It was found that this increase in flow generated an increase in flood level of approximately 0.11 m and 0.19 m at Bulahdelah and 0.21 m and 0.23 m at the Crawford gauge for the 5% AEP and 1% AEP, respectively. This is within the 500mm freeboard used for future planning purposes
Based on the results of the calibration and validation events, the model was therefore considered appropriate for the flood modelling.
© Crown 2021 MHL2789 – 92
9 Model sensitivity
A number of factors require some sensitivity analysis prior to completing the design runs. These factors include:
• Tailwater level: impact of reduced and increased water level at Bombah Broadwater was investigated.
• Losses: impact of reduced and increased losses were investigated.
• Roughness: impact of reduced and increased losses was investigated.
• Blockage: AR&R 2019 recommends running two blockage sensitivity scenarios including double design blockage and no blockage.
Sensitivity results are provided in Appendix F
9.1 Tailwater level sensitivity
In order to analyse the influence of the tailwater level on the flood behaviour, the following scenarios were modelled:
• Scenario with a 500 mm increase in tailwater level for the 1% AEP flood event.
• Scenario with a 500 mm decrease in tailwater level for the 1% AEP flood event.
Each of these scenarios was modelled for both the 45-minute and 18-hour critical durations. The following observations can be made:
• For the 18-hour critical duration event, the tailwater level has negligible impact on the flood level at the Bulahdelah Township and only increases the flood level at the downstream end of the catchment near Bombah Broadwater.
• For the 45-minute critical duration, the short duration does not allow the river to respond significantly to the rainfall and the tailwater has therefore a more direct change in level due to the low-lying floodplain. However, the majority of the additional flooding would occur at a lower level than for the long-duration flooding and remain predominantly along the river and vegetated areas.
9.2 Losses and roughness sensitivity analysis
In order to analyse the influence of losses and roughness on the flood behaviour, the following scenarios were modelled:
• No loss scenario with neither continuing losses nor initial losses in the pervious areas for the 1% AEP flood event.
• High loss scenario with 2.5 mm/hr continuing losses and 20 mm initial losses in the pervious areas for the 1%AEP flood event.
• Low roughness scenario with roughness reduced by 20% for the 1% AEP flood events.
• High roughness scenario with roughness increased by 20% for the 1% AEP flood events.
© Crown 2021 MHL2789 – 93
Each of these scenarios was modelled for both the 45-minute and 18-hour critical durations. The following observations can be made:
• The removal of all losses would generate increases in levels in the order of up to 0.100.15 m around both the township and the river catchment.
• High losses would result in decrease in flood level by up to 0.30-0.40 m within the river catchment and up to 0.05-0.10 m in the township catchment.
• Changes in material roughness by 20% impact river levels by up to +/- 0.15-0.25 m for the 1% AEP event around the river catchment for the 18-hour duration event but has minimal impact on the flood level for the 45-minute duration event
9.3 Blockage sensitivity analysis
In order to analyse the influence of blockage on the flood behaviour, the following scenarios were modelled:
• No blockage scenario for the 1% AEP event. These scenarios assumed that all the pits and pipes were free of blockages.
• Double design blockage scenario for the 1% AEP flood event. These scenarios consider the double design blockage for the cross-drainage structures as recommended by AR&R 2019 and the severe blockage value of 100% blockage for the pits and pipes system as described in AR&R 2019 Project 11.
Based on the results of this analysis, the following observations can be made:
• The no blockage scenario for the 18-hour duration event for the 1% AEP event results in local changes in flood level in the order of up to 0.10 m. Some areas would have reduced levels directly upstream of major culverts/pipes and some other areas would have increased levels downstream of major structures. There are a number of locations where there is a significant reduction in flood levels directly upstream of Bulahdelah Way and the Bulahdelah Bypass.
• The no blockage scenario for the 45-minute duration event for the 1% AEP event results in similar outcomes as the 18-hour duration. However, the increases in flood levels in the township are slightlyexacerbated with some local increasesalong drainage channels of up to approximately 0.30 m and further reduction in flood levels upstream of the Bulahdelah Bypass upstream of the township.
• The double blockage scenario for the 1% AEP event typically results in increases of up to 0.10 m in the township catchment with some local higher increase of up to 0.20-0.40 m along some of the main drainage channels and upstream of major culverts The 45minute duration event also highlights that the flooding would be diverted from the main drainage channels should there be high blockage of the various culverts that intersect these drainage channels at regular interval.
• In general, afflux is worse in the township under shorter duration events and upstream of major culverts where the local area acts as a detention basin (e.g. upstream of the Bulahdelah Bypass) for longer durations as a greater volume of water is unable to drain from this basin
© Crown 2021 MHL2789 – 94
10 Flood modelling results
10.1Flood modelling description
The TUFLOW hydraulic model was run for six (6) flood events including the 20%, 5%, 1%, 1 in 200 AEP, 1 in 500 AEP and PMF flood events. Two durations representing the upstream and downstream critical durations as described in Table 6.5 were modelled and an envelope of these two durations was produced to represent the flooding for each event.
10.2Flood mapping
10.2.1 Mapping filtering
The flood extents were filtered to remove shallow depths areas generated by the direct rainfall methodology. The criteria used to filter these shallow depths consisted of keeping areas where:
• Depth > 0.10 m; OR
• Depth > 0.05 m AND Velocity x Depth > 0.025 m2/s; OR
• Velocity > 2 m/s
Further to these criteria, “puddles” of less than 100 m2 were also removed from the extent. These filtering criteria are based on recent studies completed along the NSW coastline such as the Coastal Lagoons Catchments Overland Flood Study for Central Coast Council and the Racecourse Creek Flood Study and Option Assessment for MidCoast Council
10.2.2 Flood maps
Flood mapping presenting the peak flood level, peak flood depth and peak flood velocity envelop of each event is provided in Appendix G
10.3Flood levels outputs
The peak design flood levels at specific locations have been summarised in Table 10.1. The specific locations are illustrated in Figure 10.1.
10.4Comparison with previous study results
The outcome of the current study was compared to the results of the previous study provided by Council. The extent of the 1% AEP of the two studies as well as a long section of the Myall River over the area were both studies overlap for the 1% AEP flood event are provided in Figure 10 2 It can be noted that the flooding level at the township in the present study is lower than the previous study by up to 0.9 m and is approximately 1.5 m higher at the downstream end of the model. This is the result of the widespread flooding and associated storage not being represented in the 1D model downstream of the Bulahdelah Township. The crosssections of the previous model were about 500 m wide while the storage area downstream of the township can reach a width of nearly 3 km. This lack of storage generates a backwater effect increasing the water level significantly. It is also noted that significant storage occurs downstream of the extent of the previous model between the downstream end of the model and Bombah Broadwater.
© Crown 2021 MHL2789 – 95
© Crown 2021 MHL2789 – 96
Reference location ID Reference location name Ground level (m AHD) Peak flood level for flood event (m AHD) 20% AEP 5% AEP 1% AEP 1 in 200 AEP 1 in 500 AEP PMF 1 Downstream Myall River Downstream -4.95 1.56 1.97 2.43 2.62 2.85 3.85 2 Downstream Floodplain 0.81 2.91 3.67 4.57 4.92 5.35 7.35 3 Bulahdelah Bypass -5.13 3.30 3.81 4.63 4.98 5.41 7.42 4 Nan Syron Bridge -8.71 3.56 4.19 4.90 5.26 5.74 8.03 5 Bulahdelah 0.41 3.59 4.29 5.05 5.44 5.95 8.39 6 Bulahdelah US Stuart St 2.69 3.64 4.29 5.05 5.44 5.96 8.41 7 Downstream Crawford River -2.65 3.76 4.44 5.15 5.51 5.99 8.40 8 Bulahdelah West 0.52 3.92 4.66 5.31 5.62 6.06 8.46 9 Crawford River near Gauge -2.52 4.09 4.74 5.39 5.71 6.14 8.46 10 Myall River and Frys Creek Confluence 0.78 4.83 5.60 6.35 6.64 6.96 9.26 11 Frys Creek US Markwell Rd 3.05 4.92 5.67 6.42 6.71 7.01 9.35 12 Myall River US Markwell Rd -0.30 5.45 6.13 6.92 7.25 7.61 9.84 13 Upper Frys Creek 4.19 6.46 6.68 6.98 7.16 7.39 9.48 14 Bulahdelah North 7.58 8.16 8.21 8.26 8.28 8.30 8.60
Table 10.1 Summary of peak flood levels at various locations


N Figure10.1 DesignEventsLevel ReportingLocations ReportMHL2789 ReviewofBulahdelah FloodplainRisk ManagementStudyandPlan ©Crown2021/AerialImagerySource:GoogleMaps2021 Studyarea 1%AEPFloodDepth(m) <=0.05 0.05-0.15 0.15-0.30 0.30-0.50 0.50-1.00 1.00-1.50 1.50-2.00 2.00-3.00 3.00-5.00 >5.00 Legend ©AerialImagerySource:Nearmap2021


© Crown 2021 MHL2789 – 98
Figure 10.2 Comparison of 1% AEP flood levels between current and previous flood study
11 Consequences on the community
11.1Preamble
The impact of flooding on the community is described in this section. The first step of understanding the impact of flooding on the community is to determine the flood behaviour within the catchment and identify key problem areas. Flood impact, road closure and flood damages can then be assessed, and more details are provided in this section.
11.2Flood behaviour
Flooding in the township catchment is ‘flashy’ in nature, with flood levels rising rapidly in response to relatively short durations of high intensity rainfall as opposed to extended periods of rainfall of lower intensity. This is confirmed by the critical duration ranging between 45 minutes and 2 hours as shown in Table 6.5. The river catchment has a slower response with a critical duration of 18 hours for all events except the PMF that has a 6-hour critical duration This was represented by the analysis of two critical durations as part of the design event modelling: a longer duration for the Myall River and a shorter duration for the flashy township catchment.
While there is some potential for rapid inundation of some properties and some roads in response to short durations of rainfall during rare events, the main flooding type in the study area is the flooding resulting from the river flooding. This flooding is slower and provides additional time to disseminate flood warnings Flood waters generally recede within hours or days after such an event
The study area contains various small drains flowing through the township that can be subject to overtopping during larger events.
Key issue areas potentially subject to deep flooding from the river include:
• Properties located west of Stroud Street and south of Jackson Street (including most properties along Jackson Street);
• Properties located in the two blocks enclosed within Prince Street, Richmond Street, Alexandra Street and Jackson Street;
• Properties east of Stroud Street and west of Crawford Street between Meade Street and Jackson Street; and
• The area around the intersection of River Street and Richmond Street
Key problem areas subject to shallower overland flooding include:
• Properties between Myall Street and Edgar Street at the southern end of the streets;
• Properties located along the drainage channel linking Stroud Street to Richmond Street via Alexandra Street;
• Properties along the flowpath linking Mackenzie Street to Crawford Street via Harold Street, Rosewood Street, Bulahdelah Way and Meade Street;
• Properties along the flowpath linking Bulahdelah Way to Crawford Street halfway
© Crown 2021 MHL2789 – 99
between Stuart Street and Blanch Street, as well as properties along the western side of Crawford Street between this flowpath and Stuart Street; and
• Properties at the northeastern end of Suncrest Close.
A number of these locations may be impacted by relatively frequent events like the 20% AEP.
11.3Key infrastructure assets
There are two main types of key infrastructure assets as presented below:
• The first type includes facilities that are occupied by emergency responders such as police stations, fire stations or SES Centres.
• The second type includes facilities with particularly vulnerable residents such as schools, childcare centres, aged care facilities and hospitals.
The locations of these key assets have been sourced from publicly available information (e.g. google map). A list of these facilities is provided in Table 11.1 along with a brief description of the flood affectation of each asset A map showing the location of these main structure is presented in Figure 11 1
Location
Police and Fire Stations
Bulahdelah Rural Fire Brigade
Bulahdelah Police Station
SES Centres
Comments on Flood Risk
The fire station is partly located within the PMF extent and access to the station is cut during PMF
Bulahdelah Police Station is outside the PMF extent but access to the station is cut during PMF.
SES There are no SES facilities located within the study area The nearest SES units are located at Stroud to the west, Forster to the east and Port Stephens to the south.
Hospital and Ambulance Stations
Bulahdelah Ambulance Station
Hospitals
The ambulance station is located within the PMF extent and access from the station may become limited during a PMF flood event.
There are no hospitals located within the study area. However, there is a nurse-led Community Health Centre known as the Bulahdelah Hospital that operates 7 am to 10.30 pm, 7 days per week. This centre is outside of the PMF extent. However, access to this venue by residents of various parts of Bulahdelah may be restricted as discussed in the following section.
Schools
St Joseph’s The school is outside of the PMF extent but access to school will be
© Crown 2021 MHL2789 – 100
Table 11 1 List of Key Infrastructure assets
Location Comments on Flood Risk
Primary School cut in such event.
Bulahdelah Central School
The school is outside of the PMF extent but access to school will be cut in such event.
Childcare Facilities and Preschools
Bulahdelah Preschool
The preschool is within the PMF extent and the property may be impacted by flood during a 1 in 200 AEP Access to the preschool would be cut during a PMF event
Aged Care Facilities and Retirement Villages
Great Lakes Nursing Home
This nursing home is partly located within the PMF extent and access to the station is cut during PMF NSW SES advised that this facility closed in 2022.
Designated Evacuation Centres
Bulahdelah Golf Club
The Bulahdelah Golf Club is used as an evacuation centre for the township of Bulahdelah. This venue is outside of the PMF extent. However, access to this venue by residents of various parts of Bulahdelah may be restricted as discussed in the following section.
11.4Road closure
An assessment of the frequency and hazard of road inundation is important for understanding the risk of vehicles becoming unstable, posing a risk to life for their drivers and passengers. It is also important for understanding evacuation risks, informing the classification of communities according to flood emergency response planning considerations. Measures to increase the flood immunityof critical roads could be considered as a resultofthis assessment.
Figure 11.2 depicts the flood events which result in road closures in the four lagoon catchments. Road closure was assumed as occurring when the depth of water over road reaches over 0.3 m, which is the depth that can start mobilising cars. Table 11.2 summarises the peak depth, duration of flooding over 0.3 m and time to depth above 0.3 m for each location presented on Figure 11.2
It can be noted from the flood mapping that a large number of locations get some water over the road very rapidly in the study area, although it may not become a significant problem every time. This is fairly common during overland flooding events.
Stroud Street, Jackson Street and Markwell Road near Markwell Bridge are inundated during a 20% AEP.
A few more roads become inundated from a 5% AEP in the township such as Stuart Street and Myall Street, as well as outside of the township such as the intersection of Frys Creek Road and Markwell Road, and a couple of locations along Bombah Point Road.
In the 1% AEP flood, several other roads become inundated at various locations around the township including Meade Street near Crawford Street, Prince Street, Alexandra Street and
© Crown 2021 MHL2789 – 101
River Street Markwell Road and Bombah Point Road become inundated closer to the township.MarkwellBackRoad, Suncrest Road and Myall Forest Road also become inundated. Crawford Street and Alexandra Street becomes cut at two locations during a 1 in 200 AEP event.
During a probable maximum flood event, numerous roads become cut around the town and major roads become inundated including Bulahdelah Way and the Pacific Highway. The above roads were considered inundated when the depth over the road exceeds 0.30 m as access would become impracticable.
© Crown 2021 MHL2789 – 102
Figure11.1


Keyinfrastructure locations

Legend
Studyarea
Extentof1%AEPflood


Keyinfrastructure
AgedCareFacilitiesand RetirementVillages
ChildcareFacilitiesand Preschools
DesignatedEvacuation Centres
FireStation
HospitalandAmbulance Stations
PoliceStation Schools
ReportMHL2789
ReviewofBulahdelah FloodplainRisk ManagementStudyandPlan
N
BulahdelahRFS Bulahdelah Ambulance Station Bulahdelah CentralSchool BulahdelahPreschool BulahdelahPoliceStation GreatLakes Nursing Home Bulahdelah Community HealthCentre
Bulahdelah
Golf
©Crown2021/AerialImagerySource:Google2021 StJoseph's PrimarySchool ©AerialImagerySource:Nearmap2021


Studyarea Extentof1%AEPflood Roadclosurefrom: 20%AEP 5%AEP 1%AEP 1in200AEP 1in500AEP PMF Legend
© Crown 2021 MHL2789 – 105
Road ID First AEP to flood Peak Depth (m) Time to Depth above 0.15 m (hr) (Long duration event / Short duration event) Duration of Flooding over 0.15 m (hr) (Long duration event / Short duration event) PMF 1 in 500 AEP 1 in 200 AEP 1% AEP 5% AEP 20% AEP PMF 1 in 500 AEP 1 in 200 AEP 1% AEP 5% AEP 20% AEP PMF 1 in 500 AEP 1 in 200 AEP 1% AEP 5% AEP 20% AEP 1 20% 6.15 3.71 3.2 2.82 2.08 1.37 0.75 / 0.00 6.00 / 0.00 8.00 / 0.00 8.50 / 0.00 11.00 / 0.00 13.50 / 0.00 29.50 / 2.58 24.50 / 2.58 22.50 / 2.58 22.00 / 2.58 19.50 / 0.00 17.00 / 0.00 2 20% 6.14 3.69 3.18 2.79 2.03 1.33 1.00 / 0.00 4.00 / 0.00 5.00 / 0.00 5.50 / 0.50 7.50 / 1.17 13.50 / 2.00 29.25 / 2.58 26.50 / 2.58 25.50 / 2.58 25.00 / 2.08 23.00 / 1.17 17.00 / 0.83 3 20% 4.87 2.53 2.17 1.85 1.09 0.54 2.00 / 0.83 7.00 / 0.00 7.50 / 0.00 8.00 / 0.00 10.50 / 0.00 13.00 / 0.00 28.25 / 1.75 23.50 / 0.00 23.00 / 0.00 22.50 / 0.00 18.00 / 0.00 13.50 / 0.00 4 5% 1.43 0.71 0.65 0.58 0.52 0.06 1.00 / 0.42 3.00 / 0.75 3.50 / 0.75 4.00 / 0.83 6.00 / 1.33 0.00 / 0.00 27.25 / 2.17 27.50 / 1.83 27.00 / 1.83 26.50 / 1.75 24.50 / 1.83 0.00 / 0.00 5 5% 4.28 1.89 1.44 1.13 0.48 0 3.00 / 1.25 10.00 / 0.00 11.00 / 0.00 11.50 / 0.00 15.00 / 0.00 0.00 / 0.00 27.25 / 1.33 20.50 / 0.00 19.50 / 0.00 18.50 / 0.00 8.00 / 0.00 0.00 / 0.00 6 5% 4.44 2.47 2.04 1.68 0.76 0 2.75 / 0.00 13.50 / 0.00 14.50 / 0.00 15.50 / 0.00 19.50 / 0.00 0.00 / 0.00 27.50 / 2.58 17.00 / 0.00 16.00 / 0.00 15.00 / 0.00 11.00 / 0.00 0.00 / 0.00 7 20% 4.46 2.45 2.03 1.67 0.77 0.27 0.50 / 0.00 2.00 / 0.50 2.50 / 0.50 3.00 / 0.58 5.00 / 0.83 7.00 / 1.50 29.75 / 2.58 28.50 / 2.08 28.00 / 2.08 27.50 / 2.00 25.50 / 2.33 15.50 / 2.67 8 5% 4.67 2.22 1.71 1.31 0.55 0 1.00 / 0.33 7.50 / 0.75 4.50 / 0.67 5.00 / 0.75 7.00 / 1.00 0.00 / 0.00 29.25 / 2.25 22.50 / 0.83 26.00 / 1.25 25.50 / 1.17 18.00 / 1.17 0.00 / 0.00 9 5% 4.5 2.09 1.64 1.32 0.64 0 3.00 / 1.00 10.00 / 0.00 10.50 / 0.00 11.50 / 0.00 14.50 / 0.00 0.00 / 0.00 27.25 / 1.58 20.50 / 0.00 20.00 / 0.00 19.00 / 0.00 10.50 / 0.00 0.00 / 0.00 10 20% 4.65 2.33 2.02 1.73 0.98 0.2 2.00 / 0.83 8.50 / 0.00 9.00 / 0.00 10.00 / 0.00 13.00 / 0.00 17.50 / 0.00 28.25 / 1.75 22.00 / 0.00 20.50 / 0.00 18.00 / 0.00 11.50 / 0.00 3.50 / 0.00 11 20% 4.63 2.29 1.99 1.7 0.95 0.19 2.00 / 0.67 8.00 / 0.00 8.50 / 0.00 9.50 / 0.00 13.00 / 0.00 18.00 / 0.00 28.25 / 1.92 22.50 / 0.00 20.50 / 0.00 18.00 / 0.00 11.00 / 0.00 2.00 / 0.00 12 1% 3.63 1.27 0.98 0.71 0.12 0 1.50 / 0.33 9.00 / 0.67 10.50 / 0.00 12.00 / 0.00 0.00 / 0.00 0.00 / 0.00 22.25 / 2.25 16.00 / 0.08 13.00 / 0.00 10.00 / 0.00 0.00 / 0.00 0.00 / 0.00 13 1% 3.59 1.44 1.04 0.71 0.05 0 2.00 / 0.75 10.50 / 0.00 11.50 / 0.00 12.50 / 0.00 0.00 / 0.00 0.00 / 0.00 12.75 / 1.83 12.50 / 0.00 10.50 / 0.00 8.50 / 0.00 0.00 / 0.00 0.00 / 0.00 14 20% 1.22 0.41 0.39 0.37 0.32 0.29 0.50 / 0.17 2.00 / 0.42 2.00 / 0.42 2.00 / 0.42 4.50 / 0.67 6.00 / 1.17 14.00 / 2.42 17.00 / 1.33 17.00 / 1.25 17.00 / 1.25 14.50 / 1.33 13.00 / 1.67 15 1% 3.76 1.49 1.15 0.79 0.14 0.07 0.75 / 0.17 11.00 / 0.42 12.00 / 0.50 13.00 / 0.50 0.00 / 1.00 0.00 / 0.00 25.00 / 2.33 15.00 / 0.50 12.00 / 0.33 9.50 / 0.33 0.00 / 0.17 0.00 / 0.00 16 5% 4.03 1.64 1.24 0.96 0.18 0 1.75 / 0.42 10.50 / 0.00 11.50 / 0.00 12.50 / 0.00 17.50 / 0.00 0.00 / 0.00 28.50 / 2.08 20.00 / 0.00 18.00 / 0.00 14.50 / 0.00 2.50 / 0.00 0.00 / 0.00 17 20% 1.73 0.45 0.42 0.38 0.29 0.2 0.75 / 0.25 7.00 / 0.50 7.50 / 0.58 8.00 / 0.58 0.00 / 1.00 0.00 / 1.67 16.50 / 2.00 7.00 / 0.92 5.00 / 0.75 2.50 / 0.75 0.00 / 0.67 0.00 / 0.67 18 1% 4.1 1.65 1.14 0.74 0.1 0.09 3.25 / 0.83 11.50 / 0.00 12.50 / 0.00 13.50 / 0.00 0.00 / 0.00 0.00 / 0.00 27.00 / 1.42 19.00 / 0.00 18.00 / 0.00 14.00 / 0.00 0.00 / 0.00 0.00 / 0.00 19 1% 3.64 1.24 0.84 0.54 0 0 3.25 / 1.67 11.50 / 0.00 13.00 / 0.00 14.00 / 0.00 0.00 / 0.00 0.00 / 0.00 27.00 / 0.92 17.00 / 0.00 12.50 / 0.00 8.50 / 0.00 0.00 / 0.00 0.00 / 0.00 20 5% 3.59 1.14 0.63 0.32 0.21 0.07 0.75 / 0.17 4.00 / 0.42 12.50 / 0.58 17.00 / 0.58 0.00 / 1.00 0.00 / 0.00 29.50 / 2.42 25.50 / 1.00 12.50 / 0.58 5.00 / 0.58 0.00 / 0.50 0.00 / 0.00 21 1% 3.28 1.27 0.84 0.49 0.12 0.1 2.25 / 0.67 15.50 / 0.00 17.50 / 0.00 19.00 / 0.00 0.00 / 0.00 0.00 / 0.00 25.00 / 0.75 15.00 / 0.00 13.00 / 0.00 11.00 / 0.00 0.00 / 0.00 0.00 / 0.00 22 1% 3.51 1.17 0.86 0.57 0 0 2.50 / 0.83 11.00 / 0.00 12.00 / 0.00 13.00 / 0.00 0.00 / 0.00 0.00 / 0.00 20.75 / 1.50 13.50 / 0.00 11.00 / 0.00 8.50 / 0.00 0.00 / 0.00 0.00 / 0.00 23 1% 3.73 1.25 0.87 0.53 0.08 0 1.50 / 0.33 11.50 / 0.75 12.50 / 0.00 14.00 / 0.00 0.00 / 0.00 0.00 / 0.00 24.00 / 2.25 14.00 / 0.08 11.00 / 0.00 7.50 / 0.00 0.00 / 0.00 0.00 / 0.00 24 20% 1 0.44 0.41 0.38 0.34 0.22 0.50 / 0.25 7.50 / 0.50 0.00 / 0.50 0.00 / 0.58 0.00 / 1.00 0.00 / 1.67 5.75 / 1.58 3.00 / 0.50 0.00 / 0.50 0.00 / 0.42 0.00 / 0.33 0.00 / 0.17 25 1% 3.56 1.11 0.61 0.21 0.11 0 0.75 / 0.33 7.50 / 0.58 15.00 / 0.75 18.00 / 0.75 0.00 / 0.00 0.00 / 0.00 29.50 / 2.25 21.00 / 0.75 10.50 / 0.25 3.50 / 0.25 0.00 / 0.00 0.00 / 0.00 26 0.5% 3.31 0.86 0.35 0 0 0 3.75 / 2.33 14.00 / 0.00 16.50 / 0.00 0.00 / 0.00 0.00 / 0.00 0.00 / 0.00 25.00 / 0.25 13.00 / 0.00 6.50 / 0.00 0.00 / 0.00 0.00 / 0.00 0.00 / 0.00 27 5% 3.54 1.09 0.58 0.26 0.16 0 0.75 / 0.25 6.50 / 0.50 14.50 / 0.58 18.00 / 0.67 0.00 / 1.17 0.00 / 0.00 29.50 / 2.33 22.00 / 0.75 11.00 / 0.50 3.50 / 0.42 0.00 / 0.17 0.00 / 0.00 28 0.5% 1.86 0.16 0.15 0.14 0.12 0 1.75 / 0.75 8.50 / 0.00 12.50 / 0.00 0.00 / 0.00 0.00 / 0.00 0.00 / 0.00 16.00 / 1.83 6.00 / 0.00 1.00 / 0.00 0.00 / 0.00 0.00 / 0.00 0.00 / 0.00 29 0.5% 1.82 0.17 0.15 0.15 0.14 0 1.25 / 0.50 7.50 / 0.83 7.50 / 1.00 8.00 / 0.00 0.00 / 0.00 0.00 / 0.00 22.25 / 1.58 6.00 / 0.33 3.50 / 0.08 1.50 / 0.00 0.00 / 0.00 0.00 / 0.00 30 PMF 1.72 0 0 0 0 0 5.00 / 0.00 0.00 / 0.00 0.00 / 0.00 0.00 / 0.00 0.00 / 0.00 0.00 / 0.00 25.25 / 0.00 0.00 / 0.00 0.00 / 0.00 0.00 / 0.00 0.00 / 0.00 0.00 / 0.00 31 5% 0.87 0.28 0.24 0.22 0.18 0.14 0.75 / 0.33 5.00 / 0.58 6.00 / 0.58 7.50 / 0.67 8.00 / 1.00 0.00 / 1.83 15.75 / 2.00 12.00 / 0.83 10.00 / 0.83 6.50 / 0.75 1.50 / 0.67 0.00 / 0.50 32 PMF 1.18 0 0 0 0 0 5.00 / 0.00 0.00 / 0.00 0.00 / 0.00 0.00 / 0.00 0.00 / 0.00 0.00 / 0.00 11.00 / 0.00 0.00 / 0.00 0.00 / 0.00 0.00 / 0.00 0.00 / 0.00 0.00 / 0.00 33 0.5% 0.48 0.19 0.17 0.14 0.11 0.09 1.25 / 0.17 0.00 / 0.58 0.00 / 0.67 0.00 / 0.00 0.00 / 0.00 0.00 / 0.00 3.75 / 1.58 0.00 / 0.33 0.00 / 0.17 0.00 / 0.00 0.00 / 0.00 0.00 / 0.00 34 5% 0.85 0.42 0.39 0.37 0.3 0 1.00 / 0.33 4.50 / 0.67 5.00 / 0.67 6.00 / 0.75 7.50 / 1.17 0.00 / 0.00 15.00 / 1.92 13.00 / 0.75 12.50 / 0.75 10.00 / 0.67 5.00 / 0.50 0.00 / 0.00 35 20% 0.48 0.28 0.26 0.25 0.23 0.15 0.50 / 0.25 7.50 / 0.50 0.00 / 0.50 0.00 / 0.58 0.00 / 1.00 0.00 / 0.00 5.75 / 1.67 2.00 / 0.58 0.00 / 0.58 0.00 / 0.42 0.00 / 0.33 0.00 / 0.00 36 1% 0.4 0.2 0.17 0.16 0.14 0.09 1.25 / 0.25 0.00 / 0.50 0.00 / 0.58 0.00 / 0.00 0.00 / 0.00 0.00 / 0.00 3.75 / 1.50 0.00 / 0.42 0.00 / 0.25 0.00 / 0.00 0.00 / 0.00 0.00 / 0.00 37 0.2% 0.35 0.18 0.14 0.13 0.12 0 1.50 / 0.25 0.00 / 0.58 0.00 / 0.00 0.00 / 0.00 0.00 / 0.00 0.00 / 0.00 3.50 / 1.42 0.00 / 0.33 0.00 / 0.00 0.00 / 0.00 0.00 / 0.00 0.00 / 0.00 38 5% 0.53 0.29 0.24 0.21 0.17 0 0.75 / 0.25 7.50 / 0.50 0.00 / 0.58 0.00 / 0.58 0.00 / 1.00 0.00 / 0.00 5.50 / 1.75 4.50 / 0.67 0.00 / 0.42 0.00 / 0.33 0.00 / 0.17 0.00 / 0.00 39 0.2% 0.66 0.15 0.14 0.13 0.1 0 1.50 / 0.33 0.00 / 0.67 0.00 / 0.00 0.00 / 0.00 0.00 / 0.00 0.00 / 0.00 8.75 / 1.25 0.00 / 0.08 0.00 / 0.00 0.00 / 0.00 0.00 / 0.00 0.00 / 0.00 40 PMF 0.31 0.07 0 0 0 0 2.00 / 0.50 0.00 / 0.00 0.00 / 0.00 0.00 / 0.00 0.00 / 0.00 0.00 / 0.00 1.25 / 0.83 0.00 / 0.00 0.00 / 0.00 0.00 / 0.00 0.00 / 0.00 0.00 / 0.00 41 0.2% 0.59 0.17 0.13 0.12 0.1 0.1 1.50 / 0.42 8.00 / 1.08 0.00 / 0.00 0.00 / 0.00 0.00 / 0.00 0.00 / 0.00 5.00 / 1.67 1.50 / 0.17 0.00 / 0.00 0.00 / 0.00 0.00 / 0.00 0.00 / 0.00 42 1% 0.39 0.18 0.17 0.15 0.13 0 1.00 / 0.33 0.00 / 0.67 0.00 / 0.67 0.00 / 0.75 0.00 / 1.17 0.00 / 0.00 5.25 / 1.75 0.00 / 0.50 0.00 / 0.50 0.00 / 0.33 0.00 / 0.17 0.00 / 0.00 43 0.2% 0.76 0.19 0.13 0.11 0.08 0.09 1.50 / 0.42 8.00 / 0.67 0.00 / 0.00 0.00 / 0.00 0.00 / 0.00 0.00 / 0.00 5.00 / 1.75 3.50 / 0.33 0.00 / 0.00 0.00 / 0.00 0.00 / 0.00 0.00 / 0.00 44 20% 1.49 0.45 0.37 0.36 0.33 0.56 0.50 / 0.17 3.50 / 0.33 3.50 / 0.42 3.50 / 0.42 5.50 / 0.67 6.00 / 1.17 6.25 / 2.17 15.00 / 1.17 15.00 / 0.92 15.00 / 0.67 12.50 / 0.67 13.50 / 2.17 45 PMF 2.22 0 0 0 0 0 2.25 / 0.58 0.00 / 0.00 0.00 / 0.00 0.00 / 0.00 0.00 / 0.00 0.00 / 0.00 16.75 / 0.92 0.00 / 0.00 0.00 / 0.00 0.00 / 0.00 0.00 / 0.00 0.00 / 0.00 46 PMF 1.41 0 0 0 0 0 5.00 / 0.00 0.00 / 0.00 0.00 / 0.00 0.00 / 0.00 0.00 / 0.00 0.00 / 0.00 10.25 / 0.00 0.00 / 0.00 0.00 / 0.00 0.00 / 0.00 0.00 / 0.00 0.00 / 0.00 47 5% 2.55 0.27 0.24 0.22 0.18 0.13 0.75 / 0.33 5.00 / 0.67 8.00 / 0.75 0.00 / 0.75 0.00 / 1.17 0.00 / 0.00 21.25 / 2.08 12.00 / 0.92 1.50 / 0.67 0.00 / 0.58 0.00 / 0.50 0.00 / 0.00 48 PMF 2.24 0.09 0.08 0.07 0.06 0 4.50 / 0.83 0.00 / 0.00 0.00 / 0.00 0.00 / 0.00 0.00 / 0.00 0.00 / 0.00 15.75 / 0.17 0.00 / 0.00 0.00 / 0.00 0.00 / 0.00 0.00 / 0.00 0.00 / 0.00 49 PMF 0.37 0.15 0.08 0.07 0 0 2.00 / 0.42 0.00 / 0.00 0.00 / 0.00 0.00 / 0.00 0.00 / 0.00 0.00 / 0.00 1.75 / 1.08 0.00 / 0.00 0.00 / 0.00 0.00 / 0.00 0.00 / 0.00 0.00 / 0.00 50 0.2% 0.37 0.17 0.13 0.11 0 0 1.50 / 0.33 0.00 / 0.67 0.00 / 0.00 0.00 / 0.00 0.00 / 0.00 0.00 / 0.00 3.50 / 1.50 0.00 / 0.17 0.00 / 0.00 0.00 / 0.00 0.00 / 0.00 0.00 / 0.00 51 PMF 0.98 0 0 0 0 0 2.50 / 1.25 0.00 / 0.00 0.00 / 0.00 0.00 / 0.00 0.00 / 0.00 0.00 / 0.00 5.25 / 1.33 0.00 / 0.00 0.00 / 0.00 0.00 / 0.00 0.00 / 0.00 0.00 / 0.00 52 PMF 0.76 0.14 0 0 0 0 1.75 / 0.42 0.00 / 0.00 0.00 / 0.00 0.00 / 0.00 0.00 / 0.00 0.00 / 0.00 2.25 / 1.00 0.00 / 0.00 0.00 / 0.00 0.00 / 0.00 0.00 / 0.00 0.00 / 0.00 53 PMF 2.28 0 0 0 0 0 3.00 / 1.83 0.00 / 0.00 0.00 / 0.00 0.00 / 0.00 0.00 / 0.00 0.00 / 0.00 10.25 / 0.75 0.00 / 0.00 0.00 / 0.00 0.00 / 0.00 0.00 / 0.00 0.00 / 0.00 54 PMF 1.33 0 0 0 0 0 3.75 / 0.00 0.00 / 0.00 0.00 / 0.00 0.00 / 0.00 0.00 / 0.00 0.00 / 0.00 6.75 / 0.00 0.00 / 0.00 0.00 / 0.00 0.00 / 0.00 0.00 / 0.00 0.00 / 0.00 55 0.5% 2.52 0.19 0.16 0.15 0.12 0 1.00 / 0.42 8.00 / 0.75 13.00 / 0.00 0.00 / 0.00 0.00 / 0.00 0.00 / 0.00 15.75 / 2.17 8.00 / 0.67 0.50 / 0.00 0.00 / 0.00 0.00 / 0.00 0.00 / 0.00 56 5% 2.59 0.23 0.2 0.19 0.15 0.11 1.00 / 0.33 7.50 / 0.67 0.00 / 0.75 0.00 / 0.83 0.00 / 0.00 0.00 / 0.00 21.75 / 2.00 10.00 / 0.83 0.00 / 0.50 0.00 / 0.42 0.00 / 0.00 0.00 / 0.00
Table 11.2 Peak depth, duration of flooding over 0.3 m and time to depth above 0.3 m at road closure location
: Durations in italic are likely to be exceeded as the depth in the model was still higher than 0.15 m at the end of the simulation.
© Crown 2021 MHL2789 – 106 Road ID First AEP to flood Peak Depth (m) Time to Depth above 0.15 m (hr) (Long duration event / Short duration event) Duration of Flooding over 0.15 m (hr) (Long duration event / Short duration event) PMF 1 in 500 AEP 1 in 200 AEP 1% AEP 5% AEP 20% AEP PMF 1 in 500 AEP 1 in 200 AEP 1% AEP 5% AEP 20% AEP PMF 1 in 500 AEP 1 in 200 AEP 1% AEP 5% AEP 20% AEP 57 PMF 0.21 0.07 0.06 0.05 0 0.06 0.00 / 0.75 0.00 / 0.00 0.00 / 0.00 0.00 / 0.00 0.00 / 0.00 0.00 / 0.00 0.00 / 0.33 0.00 / 0.00 0.00 / 0.00 0.00 / 0.00 0.00 / 0.00 0.00 / 0.00 58 PMF 0.26 0 0 0 0 0 2.25 / 0.67 0.00 / 0.00 0.00 / 0.00 0.00 / 0.00 0.00 / 0.00 0.00 / 0.00 0.50 / 0.67 0.00 / 0.00 0.00 / 0.00 0.00 / 0.00 0.00 / 0.00 0.00 / 0.00 59 PMF 0.35 0.12 0.08 0.06 0 0 2.00 / 0.42 0.00 / 0.00 0.00 / 0.00 0.00 / 0.00 0.00 / 0.00 0.00 / 0.00 1.75 / 1.00 0.00 / 0.00 0.00 / 0.00 0.00 / 0.00 0.00 / 0.00 0.00 / 0.00 60 PMF 0.31 0.08 0.07 0.06 0 0 2.00 / 0.50 0.00 / 0.00 0.00 / 0.00 0.00 / 0.00 0.00 / 0.00 0.00 / 0.00 0.75 / 0.83 0.00 / 0.00 0.00 / 0.00 0.00 / 0.00 0.00 / 0.00 0.00 / 0.00 61 PMF 0.25 0 0 0 0 0 0.00 / 0.75 0.00 / 0.00 0.00 / 0.00 0.00 / 0.00 0.00 / 0.00 0.00 / 0.00 0.00 / 0.33 0.00 / 0.00 0.00 / 0.00 0.00 / 0.00 0.00 / 0.00 0.00 / 0.00 62 PMF 0.26 0 0 0 0 0 2.25 / 0.67 0.00 / 0.00 0.00 / 0.00 0.00 / 0.00 0.00 / 0.00 0.00 / 0.00 0.25 / 0.58 0.00 / 0.00 0.00 / 0.00 0.00 / 0.00 0.00 / 0.00 0.00 / 0.00 N.B.
results
12.1Preamble
Once the flood mapping was completed for the main parameters (water level, depth and velocity), it became possible to determine the flood function, flood hazard and flood emergency response classification resulting from these data. Development of such categorisations is described in this section.
12.2Flood hazard
A starting point for the assessment of Flood Life Hazard categories is to better understand the flood hazard. National Best Practice Guidelines present a set of hazard vulnerability curves shown in Figure 12.1.This shows how flood depths, velocities and depth-velocity product affect the stability of vehicles, pedestrians and buildings.

Figure 12.1 General flood hazard vulnerability curves
Source: AIDR (2017)
The above hazard vulnerability categories have been mapped for the 1% AEP and the PMF events for the entire study area and are presented in Appendix H
– 107 © Crown 2021
Release
MHL2789
Classification:
by consent 12 Post-processing of
During a 1% AEP flood event, the extent of hazard conditions between H3 and H6 are typically concentrated along main rivers and drainage channels, while the majority of the township flooding is classified as H1 or H2 hazard category. However, some larger hazard ranging between H3 and H5 can be observed in the area west of Stroud Street between Meade Street and Jackson Street as well as between Prince Street and Alexandra Street south of Richmond Street. The Myall River generates a small secondary branch inundating the properties along the southern half of River Street, south of Richmond Street and east of Myall Street with hazard categories between H3 and H4. A large part of the floodplain is classified as H5 category. During a PMF flood event, the majority of the township would be subject to significant hazards of H3 or above category with only a few elevated areas in the northwestern corner, the southeastern corner and the northeastern corner ofthe township remaining eithernot impacted or subject to lower flooding categories (H1 and H2) Most properties located along Frys Creek and Markwell Back Road would also be subject to H3 or above hazard categories.
12.3Flood function (hydraulic categorisation)
Hydraulic categorisation is a useful tool in assessing the suitability of land use and development in flood-prone areas. The Australian Disaster Resilience Handbook (AIDR, 2017) describes the following three hydraulic categories of flood-prone land:
• Floodway / Flow Conveyance – Flow conveyance areas are defined as those areas where a significant flow of water occurs. They typically flow continuously from the upper reaches of waterways and flowpaths within the catchment to the outlet during a flood. These flows often align with naturally defined channels. Theyare areasthat, even if onlypartiallyblocked by changes in topography or development, cause a significant redistribution of flood flow or a significant increase in flood levels. They are often, but not necessarily, areas of deeper flow or areas where higher velocities occur. In the DFE, they generally extend beyond the waterway banks.
• Flood Storage – During a flood event, significant amounts of floodwater can also extend into, and be temporarily stored in, areas of the floodplain. This water flows downstream as the flood recedes. Where storage is important in attenuating downstream flood flows and levels, areas storing this water are classified as flood storage areas. Filling of flood storage areas reduces their ability to attenuate downstream flood flows and, as a result, flood flows and flood levels may increase.
• Flood Fringe – Flood-fringe areas make up the remainder of the flood extent for the particular event. It is the area where the effects on flood function are not a constraint. Developing in flood-fringe areas is unlikely to significantly alter flood behaviour, beyond the broader impact of changes to run-off because of urbanisation within the catchment. However, other flood-related constraints may exist in flood-fringe areas.
These qualitative descriptions do not prescribe specific thresholds for determining the hydraulic categories in terms of model outputs, and such definitions may vary between floodplains depending on flood behaviour and associated impacts. For the purposes of the Review of Bulahdelah FRMSP, hydraulic categories have been defined as per the criteria in Table 12 1. These criteria have recently been used on the Racecourse Creek catchment as well as other catchments in the Central Coast such as the Coastal Lagoons Catchments
© Crown 2021
Classification: Release by consent
MHL2789 – 108
Overland Flood Study completed in 2020. The floodway criterion has been selected as it provides improved continuity of flow along the various flow paths and considers areas of deeper flows. The flood storage criteria were selected as they have been commonly applied on various recent overland studies around NSW and considers areas with deep flood depth allowing storage of flood water.
Hydraulic category mapping for the 1%AEP and PMF design events ispresented in Appendix H
Table 12 1 Hydraulic category criteria
Hydraulic Category Criteria
Floodway Velocity x Depth > 0.25 m2/s
Description
Flowpaths and channels where a significant proportion of flood flows are conveyed
Flood Storage Depth > 0.5 m, Not Floodway Areas that temporarily store floodwaters and attenuate flood flows
Flood Fringe Depth < 0.5 m, Not Floodway or Flood Storage
Generally shallow, low velocity areas within the floodplain that have little influence on flood behaviour
During a 1% AEP flood event, the floodways typically remain within the main river and drainage channels A small anabranch branches off the Myall River and cuts through some properties at the southern end of River Street and western end of Richmond Street. A larger anabranch shortcuts the bend of the Myall River located at the junction with the Crawford River and flows through the western end of Jackson Street, the southern end of Prince Street and along the western side of the River Myall Holiday Resort.
The properties located west of Crawford Street between Meade Street and Jackson Street as well as between Prince Street and Alexandra Street South of Richmond Street are located within a flood storage area. During a 1% AEP flood event, the larger part of the floodplain is either classified as floodway or flood storage.
During a PMF flood event, the southwestern half of the township would be located with the floodway of the river. Properties located along drainage channels flowing through the township would also be within the floodway. A fewmore propertiesaround the township would be located within the flood storage area. Mostproperties along Frys Creekand Markwell Back Road would also be located within the floodway. During a PMF flood event, the larger part of the floodplain would be classified as floodway.
Crown
MHL2789 – 109 ©
2021
Classification: Release by consent
13 Conclusion
The flood study review has been completed to provide a detailed flooding assessment of Bulahdelah and the surrounding local catchments The previous studies, while providing relevant information that relates to the flooding of Bulahdelah, were completed prior to the creation of the latest guidelines The objective of this study is therefore to improve understanding of flood behaviour and impacts, and better inform management of flood risk in the study area. The study also provides a sound technical basis for any further flood risk management investigation in the area.
The key components of the flooding assessment included:
• Review of previous studies and available data
• Community consultation
• Hydrological analysis and modelling
• Hydraulic analysis and modelling
• Calibration and validation of the hydraulic model
• Sensitivity analysis
• Flood mapping
• Description of consequences of flooding
• Development of a draft flood study review report followed by a final report
The flood maps appended to this report are presenting the flood levels, depths and velocities for the critical duration and rainfall pattern of a full set of events including the 20%, 5%, 1%, 1 in 200, 1 in 500 AEP and PMF events and represent an envelope of the critical duration/pattern of a selected representative catchment for the Bulahdelah township and the critical duration/pattern for the Myall River. The township catchment is very reactive with very short critical durations between 45 minutes and 2 hours to reach the peak level, while the river catchment has typical critical durations ranging between 6 hours and 18 hours
Sensitivity analysis highlighted the following points:
• Tailwater conditions (including sea level rise) typically have relatively small impact on river flooding levels due to a number of natural choke points located at various locations along the Myall River raising the level much higher than the downstream level However, for smaller catchment events, that do not lead to a major response in the overall river catchment flooding, changes in Bombah Broadwater levels will propagate directly up the Myall River.
• Changes in roughness or in antecedent conditions of the catchment (wet/dry catchment leading to varying losses) could have moderate impact on river flooding and low impacts on overland flooding
• Blockages of structures can have severe impact in areas with no gravity flow that only relies on the drainage network (e.g. ponding area); maintaining the pits and pipes network is essential to avoid exacerbating the flooding in those locations. It is also
MHL2789 –
© Crown 2021 Classification: Release by consent
110
noted that no blockage can lead to small increases in flood level at the downstream end of the township.
The above results allowed the definition of the flood hazard (i.e. H1-H6 flood life hazard categories) and hydraulic categories in the Bulahdelah catchment. These have been created and mapped to inform development control planning.
Results of the model allow the identification of main flooding areas, key infrastructure assets impacted by flooding, and road closures around the catchments. Key infrastructure typically may have access issues during severe flood events rather than flooding issues, except during the PMF event.
Apart from Stroud Street, road closures predominantly occur on secondary roads with most of the major road closures occurring for the PMF only. It is also noted that given the flashy behaviour of the catchment, flooding and road closures in the upper township catchment would be of relatively short duration while flooding of the areas surrounding the river may last from several hours to a few days
© Crown 2021
Classification: Release by consent
MHL2789 – 111
References
Australian Government (Attorney – General’s Department). (2009). Flood Preparedness (Manual 20). Australian Emergency Manuals Series.
Ball, J. E. (2019). Australian Rainfall and Runoff - A guide to flood estimation. Commonwealth of Australia (Geoscience Australia).
BMT. (2015). Lower Myall River and Myall Lake Flood Study. Great Lake Shire Council.
Bureau of Meteorology. (2003). The Estimate of Probable Maximum Precipitation in Australia: Generalised Short Duration Method.
Bureau of Meteorology. (2003). The Estimation of Probable Maximum Precipitation in Australia: Generalised Short-Duration Method.
Bureau of Meteorology. (2005). Guidebook to the Estimation of Probable Maximum Precipitation Generalised Tropical Storm Method.
Bureau of Meteorology. (2006). Guidebook to the Estimation of Probable Maximum Precipitation: Generalised Southeast Australia Method.
Department of Infrastructure, Planning and Natural Resources. (2003). Myall River Floodplain Risk Management Plan for Bulahdelah. Great Lakes Council.
Department of Land and Water Conservation. (2002). Myall River Floodplain Risk Management Study for Bulahdelah. Great Lakes Council.
NSW Fisheries Office of Conservation. (2003). Monitoring changes in Crawford River fish community following replacement of an ineffective fishway with a vertical slot fishway design: Results of an eight year monitoring program.
Office of Environment and Heritage. (2019). Floodplain Risk Management Guide, Incorporatng 2016 Australian Rainfall and Runoff in Studies. Office of Environment and Heritage.
Pilgrim, D. H. (1987). Australian rainfall and runoff - A Guide to Flood Estimation. Institution of Engineers, Australia. Public Works. (1991). Bulahdelah Flood Appraisal. Great Lakes Shire Council. Public Works. (1994). Frys Creek Flood Study. Great Lakes Shire Council.
MHL2789 – 112 © Crown 2021
Classification: Release by consent
Survey marks checks

MHL2789 – A1 © Crown 2021 Classification: Release by consent
Survey Mark Easting (m) Northing (m) SCIMS Elevation (m AHD) LiDAR Elevation (m AHD) Difference (m) PM 104933 424393.017 6407263.204 29.97 31.62 -1.65 SS 40810 426351.546 6415239.968 47.42 48.91 -1.49 SS 92351 421548.6 6414395.1 13.00 14.13 -1.13 PM 104935 424558.85 6408495.755 8.96 9.89 -0.93 PM 104939 424250.532 6410142.354 5.40 6.28 -0.87 SS 68521 422887.7 6422722.1 27.00 27.73 -0.73 SS 33594 427598.266 6416583.249 17.09 17.81 -0.72 SS 15510 428451 6416263 33.15 33.86 -0.71 PM 69786 424517.762 6408245.916 12.49 13.10 -0.61 PM 7800 424218.368 6406530.426 62.57 63.10 -0.53 SS 31359 424465.835 6406460.193 85.95 86.40 -0.45 PM 84019 421322.9 6411185 12.00 12.38 -0.38 PM 151419 425041.968 6414525.029 9.42 9.75 -0.33 PM 13056 425316.526 6414348.91 3.93 4.24 -0.31 SS 14120 425013 6414636 9.33 9.64 -0.31 PM 85451 427963.629 6416396.75 26.84 27.14 -0.30 PM 7801 424707.73 6412605.429 3.89 4.18 -0.29 PM 13052 425607.556 6414303.802 9.88 10.17 -0.29 PM 13049 425678.831 6414924.636 9.10 9.39 -0.29 SS 35216 426119.222 6412544.547 10.05 10.32 -0.27 PM 104945 424052.035 6411824.842 5.93 6.18 -0.25 PM 117424 424958.65 6415027.795 7.41 7.66 -0.25 PM 13057 425354.134 6414582.641 5.49 5.72 -0.22 PM 104391 421766.7 6415656 31.00 31.22 -0.22 PM 13058 425332.522 6414949.882 14.10 14.32 -0.22 PM 13059 425023.5 6415002.235 9.62 9.82 -0.20 PM 13053 425575.837 6414102.241 4.97 5.17 -0.20 PM 13050 425646.674 6414536.315 15.29 15.49 -0.20 PM 71907 424471.907 6409411.89 4.78 4.97 -0.19 GB 1031 425836.72 6413574.021 16.55 16.73 -0.18 PM 71765 419318.816 6409854.055 21.80 21.98 -0.18 PM 117425 424883.275 6414657.012 5.43 5.60 -0.17 SS 171561 424393.902 6409841.992 7.45 7.62 -0.17 PM 13054 425537.929 6413845.984 2.14 2.31 -0.17 PM 143097 423538.926 6417044.018 9.26 9.43 -0.17 PM 81060 423989.218 6410854.847 12.10 12.26 -0.16 PM 104944 423872.127 6411608.914 6.38 6.54 -0.16 Survey Mark Easting (m) Northing (m) SCIMS Elevation (m AHD) LiDAR Elevation (m AHD) Difference (m) PM 143096 422085.994 6417269.332 21.17 21.32 -0.15 PM 61568 424247.6 6412752.3 5.00 5.15 -0.15 PM 143087 425017.274 6414161.91 3.96 4.10 -0.14 PM 143088 424956.158 6421950.818 19.70 19.84 -0.14 PM 13047 425852.096 6414265.506 11.47 11.59 -0.13 PM 85450 427391.227 6416463.839 12.65 12.77 -0.12 SS 33596 428526.885 6417748.467 116.53 116.65 -0.12 PM 69789 424163.256 6410386.096 7.34 7.46 -0.12 PM 143099 423201.717 6420735.454 21.44 21.56 -0.12 PM 104943 423833.99 6411314.774 6.62 6.74 -0.12 PM 178908 424286.871 6410027.325 7.47 7.58 -0.11 PM 68156 424441.758 6407621.545 24.21 24.32 -0.11 PM 178925 427543.166 6416551.038 16.56 16.67 -0.11 CP 93330892 425398.738 6413516.754 3.40 3.51 -0.11 PM 178918 426330.175 6413648.737 42.24 42.35 -0.11 GB 1033 425838 6413565 16.65 16.75 -0.10 PM 178912 424378.955 6412018.981 8.12 8.22 -0.10 SS 14118 425499 6413666 6.67 6.77 -0.09 PM 84026 421002.085 6412999.89 22.36 22.46 -0.09 PM 69785 424501.233 6408050.125 15.81 15.90 -0.09 PM 178909 424120.022 6410556.194 7.56 7.65 -0.09 PM 143089 425884.345 6419379.357 16.52 16.61 -0.09 PM 178911 424099.26 6411563.983 7.03 7.12 -0.09 PM 178910 423999.847 6411164.191 7.95 8.04 -0.09 PM 143098 423179.029 6418829.619 20.90 20.99 -0.08 PM 151418 425814.327 6413125.182 25.89 25.98 -0.08 SS 139584 425043.061 6414648.856 7.64 7.72 -0.08 SS 33595 428117.354 6417268.265 67.43 67.51 -0.07 PM 147726 425932.6 6416980.7 7.00 7.07 -0.07 SS 60645 427493.747 6411013.495 3.81 3.87 -0.06 PM 147727 426226.501 6416992.699 9.68 9.74 -0.06 SS 171558 424422.819 6407008.164 41.58 41.64 -0.06 PM 178913 425022.015 6412344.421 5.96 6.02 -0.06 SS 14116 425910.136 6413599.076 19.85 19.90 -0.06 PM 13048 425900.434 6414532.307 19.56 19.62 -0.05 PM 78505 425739.09 6413372.973 10.90 10.95 -0.05 PM 111310 425286.844 6416872.422 5.60 5.63 -0.03
MHL2789 – A2 © Crown 2021 Classification: Release by consent Survey Mark Easting (m) Northing (m) SCIMS Elevation (m AHD) LiDAR Elevation (m AHD) Difference (m) SS 171560 424613.031 6409107.733 7.39 7.42 -0.03 SS 5951 425487.504 6413708.905 5.21 5.25 -0.03 SS 43196 421339.718 6410113.3 13.30 13.33 -0.03 PM 178922 426663.653 6415690.001 22.51 22.54 -0.03 PM 13046 425782.557 6413810.019 12.88 12.90 -0.02 SS 139583 425375.256 6414850.476 10.86 10.88 -0.02 PM 178921 426509.364 6415207.289 46.70 46.72 -0.02 SS 31360 424155.074 6409473.434 37.11 37.12 -0.02 PM 104934 424400.416 6407464.376 26.81 26.83 -0.01 SS 139576 426009.141 6414753.281 18.31 18.32 -0.01 SS 65958 425521.297 6414844.317 7.19 7.19 0.00 PM 178919 426282.868 6414118.721 31.85 31.85 0.01 PM 178914 425614.645 6412432.326 9.02 9.01 0.01 PM 178923 426949.09 6416158.973 15.40 15.39 0.01 SS 107057 426507.378 6412453.29 22.59 22.57 0.02 PM 84018 421349.406 6411324.085 14.28 14.25 0.03 PM 178916 426352.933 6413083.99 49.75 49.72 0.03 SS 139587 425693.877 6414085.331 5.01 4.98 0.03 PM 78506 426050.038 6413345.749 27.18 27.15 0.04 SS 139585 425473 6414332.314 5.65 5.61 0.04 SS 171559 424621.605 6408562.081 11.10 11.06 0.04 SS 5950 423814.059 6411308.862 6.39 6.35 0.04 SS 139577 425952.121 6414779.25 16.41 16.37 0.04 SS 108724 425474 6413590 11.02 10.98 0.04 PM 178917 426284.017 6413383.104 42.97 42.93 0.04 SS 84194 425695.075 6413256.184 23.70 23.65 0.04 SS 139581 425746 6414287.583 8.40 8.35 0.05 PM 178915 426007.305 6412679.172 14.80 14.75 0.05 PM 173088 426353 6415325 53.00 52.95 0.05 SS 139575 426045 6414799.505 20.10 20.04 0.05 SS 107058 425061.509 6412743.883 3.00 2.94 0.06 SS 139578 425942.047 6414688.16 19.62 19.55 0.07 PM 178924 427272.692 6416376.015 13.38 13.31 0.07 SS 5953 426851.998 6415906.044 18.95 18.87 0.07 SS 139589 425612.345 6413623.817 4.62 4.54 0.08 SS 139592 425878.283 6413367.996 15.54 15.47 0.08 SS 139582 425404.538 6414944.509 14.17 14.09 0.08 SS 139586 425259.934 6414150.143 4.79 4.71 0.08 SS 139580 425490.83 6414579.811 7.24 7.16 0.08 PM 158073 426344.351 6414605.126 50.17 50.07 0.10 SS 139588 425668.214 6413827.219 6.97 6.87 0.10 SS 139579 425758.818 6414523.195 17.42 17.32 0.11 SS 5952 426089.965 6414599.869 25.52 25.41 0.11 Survey Mark Easting (m) Northing (m) SCIMS Elevation (m AHD) LiDAR Elevation (m AHD) Difference (m) SS 108725 425477 6413459 10.10 9.98 0.12 SS 17900 427653.385 6416611.712 16.50 16.38 0.12 PM 178920 426296.985 6414889.659 41.25 41.12 0.13 SS 139594 426029.383 6413560.39 23.56 23.43 0.13 TS 6015-1 426847.426 6414341.661 215.38 215.24 0.14 SS 14117 425489.394 6413554.872 11.53 11.38 0.15 SS 139591 425607.501 6413410.164 14.27 14.12 0.15 SS 63609 425303.4 6417585.4 9.00 8.85 0.15 SS 60436 428405.1 6409299.5 3.87 3.71 0.16 PM 13051 425612 6414405 13.67 13.50 0.16 SS 31361 423768.057 6411508.212 6.15 5.98 0.17 SS 17901 427611.869 6417061.414 31.55 31.36 0.19 SS 139593 426056.226 6413471.668 27.53 27.34 0.19 SS 63603 423235.2 6418331.3 16.00 15.81 0.19 SS 139595 425922.772 6413788.832 15.13 14.93 0.20 SS 205109 424852 6412670 7.00 6.80 0.20 SS 5954 428395.487 6417717.132 101.75 101.52 0.23 PM 13055 425469 6413461 9.80 9.55 0.25 SS 31362 425487.564 6413483.888 10.81 10.54 0.27 SS 45909 422941 6421938.6 41.00 40.71 0.29 CP 93330892-1 425397.562 6413513.983 3.41 3.12 0.29 PM 161569 426222.742 6414489.34 26.00 25.61 0.39 SS 60644 426886 6411842 6.30 5.91 0.40 SS 84195 426051.195 6412882.79 31.26 30.86 0.40 PM 179018 422825 6422678 29.00 28.58 0.43 PM 85452 428569.806 6416413.63 47.97 47.53 0.44 SS 136403 426547 6415416 31.00 30.52 0.48 SS 15511 427534 6416559 16.72 16.20 0.52 TS 6015-2 426844.296 6414349.721 215.82 215.19 0.63 SS 88269 428805.5 6408583.9 4.00 3.18 0.82 SS 128928 426520.478 6414931.577 108.70 107.60 1.10 SS 7714 426842 6414350 215.79 214.59 1.21 PM 84066 420745.6 6412431.8 26.00 24.60 1.40 TS 6015 426849.075 6414334.487 217.74 216.08 1.66
Distribution of differences between Survey Marks and LiDAR elevation
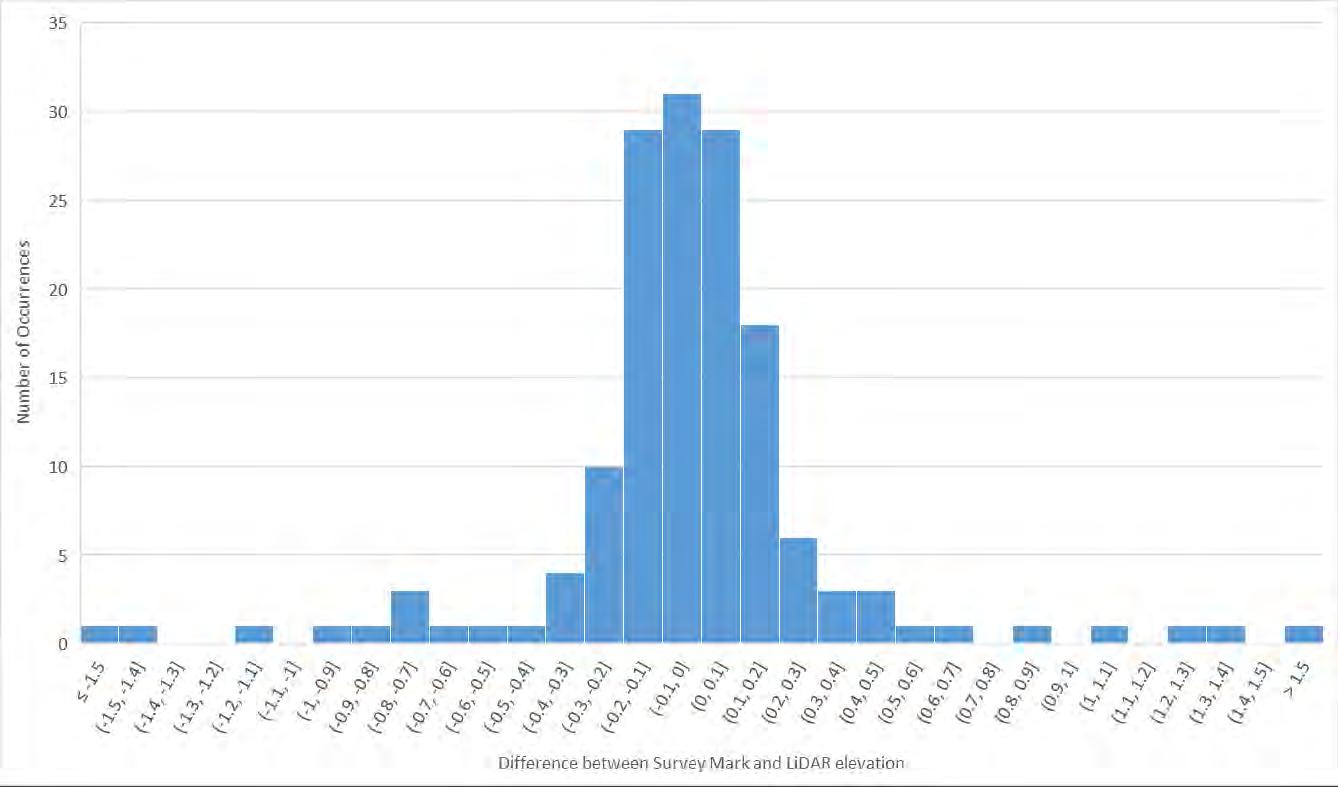
MHL2789 – A3 © Crown 2021 Classification: Release by consent
Floor level survey results

MHL2789 – B1 © Crown 2021 Classification: Release by consent
Unique ID Latitude Longitude Number of steps from ground level to floor level Property Type Construction Type Property Material Number of storeys Front door visible from road during visit? Commercial/ Industrial Building Damage Risk Category Comments 1 -32.3995845 152.202075 1 Residential Slab-on-ground/Low-set Brick 1 yes 2 -32.399861 152.201975 2 Residential High-set Fibro 1 yes 3 -32.4002251 152.201901 4 Residential Slab-on-ground/Low-set Fibro 1 yes Worst flood in 1972,owner says it was never flooded 4 -32.4003785 152.201858 9 Residential High-set Fibro 1 yes 5 -32.4005662 152.201822 5 Residential High-set Fibro 1 yes 6 -32.400787 152.201807 3 Residential Slab-on-ground/Low-set Fibro 1 yes 7 -32.4010718 152.201784 2 Residential Slab-on-ground/Low-set Brick 1 yes 8 -32.4012756 152.201782 5 Residential Slab-on-ground/Low-set Brick 1 yes 9 -32.40145 152.201673 2 Residential Slab-on-ground/Low-set Brick 2 yes 10 -32.401656 152.20164 2 Residential Slab-on-ground/Low-set Brick 1 yes 11 -32.4019821 152.201594 8 Residential High-set Fibro 1 yes 12 -32.4023094 152.201531 2 Residential Slab-on-ground/Low-set Fibro 1 yes 13 -32.402278 152.201317 5 Residential Slab-on-ground/Low-set Fibro 1 yes 14 -32.4020236 152.201396 8 Residential High-set Fibro 1 no Estimated 1.5m elevation from ground. Not Clearly visible. 15 -32.4017062 152.201443 1 Residential Slab-on-ground/Low-set Fibro 1 yes 16 -32.4024983 152.200943 0 Residential High-set Fibro 2 no 17 -32.3994529 152.203149 1 Residential Slab-on-ground/Low-set Fibro 1 yes 18 -32.400064 152.203498 3 Residential Slab-on-ground/Low-set Fibro 1 yes 19 -32.4004416 152.203412 5 Residential Slab-on-ground/Low-set Fibro 1 no 20 -32.4006823 152.203363 3 Residential Slab-on-ground/Low-set Fibro 1 yes 21 -32.4008937 152.203331 1 Residential Slab-on-ground/Low-set Brick 1 yes 22 -32.4010868 152.203271 1 Residential Slab-on-ground/Low-set Brick 1 yes 23 -32.4012311 152.203268 2 Residential Slab-on-ground/Low-set Brick 1 yes 24 -32.4015761 152.203233 1 Residential Slab-on-ground/Low-set Fibro 1 yes 25 -32.4017671 152.203194 1 Residential Slab-on-ground/Low-set Brick 1 yes 26 -32.4019544 152.20317 5 Residential Slab-on-ground/Low-set Fibro 1 yes 27 -32.4021325 152.203133 1 Residential Slab-on-ground/Low-set Brick 1 yes 28 -32.4025395 152.203147 3 Residential Slab-on-ground/Low-set Fibro 1 yes 29 -32.4022239 152.203204 3 Residential High-set Fibro 1 yes 30 -32.401829 152.203271 4 Residential Slab-on-ground/Low-set Fibro 1 yes 31 -32.4015272 152.203334 2 Residential Slab-on-ground/Low-set Fibro 1 no 32 -32.401337 152.203376 2 Residential Slab-on-ground/Low-set sandstone 1 yes 33 -32.4009767 152.203476 3 Residential Slab-on-ground/Low-set Fibro 1 yes 34 -32.4006254 152.203541 4 Residential Slab-on-ground/Low-set Brick 1 no Estimate number of steps 35 -32.4003723 152.203605 4 Residential Slab-on-ground/Low-set Fibro 1 yes 36 -32.4001178 152.20365 3 Residential Slab-on-ground/Low-set Fibro 1 yes
MHL2789 – B2 © Crown 2021 Classification: Release by consent Unique ID Latitude Longitude Number of steps from ground level to floor level Property Type Construction Type Property Material Number of storeys Front door visible from road during visit? Commercial/ Industrial Building Damage Risk Category Comments 37 -32.3998273 152.203743 2 Residential Slab-on-ground/Low-set Brick 1 yes 38 -32.4000023 152.204813 3 Residential Slab-on-ground/Low-set Fibro 2 yes 39 -32.400229 152.204702 2 Residential Slab-on-ground/Low-set Fibro 1 yes 40 -32.4006239 152.204846 1 Residential Slab-on-ground/Low-set Fibro 1 yes 41 -32.4009096 152.204812 3 Residential Slab-on-ground/Low-set Brick 1 yes 42 -32.4012747 152.204738 4 Residential Slab-on-ground/Low-set Fibro 1 yes 43 -32.4016781 152.20466 1 Residential Slab-on-ground/Low-set Brick 1 yes 44 -32.4018369 152.204641 1 Residential Slab-on-ground/Low-set Brick 1 yes 45 -32.4020764 152.204598 3 Residential Slab-on-ground/Low-set Brick 1 yes 46 -32.4022631 152.204584 2 Residential Slab-on-ground/Low-set Fibro 1 no Far from road hard to see 47 -32.4024325 152.204539 1 Residential Slab-on-ground/Low-set Fibro 1 no Looks more like a garage 48 -32.4026451 152.204489 3 Residential Slab-on-ground/Low-set Brick 1 yes 49 -32.4019867 152.204761 5 Residential Slab-on-ground/Low-set Fibro 1 yes 50 -32.4018061 152.204797 4 Residential Slab-on-ground/Low-set Fibro 1 yes 51 -32.4014825 152.204839 4 Residential Slab-on-ground/Low-set Brick 1 yes 52 -32.4012076 152.204899 3 Residential Slab-on-ground/Low-set Fibro 1 yes 53 -32.4009447 152.204929 3 Residential Slab-on-ground/Low-set Brick 1 yes 54 -32.4005251 152.205044 2 Residential Slab-on-ground/Low-set Fibro,Brick 1 yes 55 -32.4001903 152.205095 1 Residential Slab-on-ground/Low-set Fibro 1 yes 56 -32.3999663 152.205145 3 Residential Slab-on-ground/Low-set Brick 1 yes About 6 bricks 57 -32.4004647 152.206567 3 Residential Slab-on-ground/Low-set Fibro 1 yes 58 -32.4000829 152.206638 1 Residential Slab-on-ground/Low-set Brick 1 yes 59 -32.4006698 152.206527 5 Residential Slab-on-ground/Low-set Brick 1 yes 60 -32.400998 152.206453 5 Residential Slab-on-ground/Low-set Brick 1 no Front door steps are not Clearly visible. There is a ramp. 61 -32.4011996 152.206413 7 Residential Slab-on-ground/Low-set Fibro 1 yes 62 -32.4015677 152.206333 5 Residential Slab-on-ground/Low-set Fibro 1 yes 63 -32.401819 152.206303 6 Residential Slab-on-ground/Low-set Brick 1 yes 64 -32.402058 152.20623 2 Residential Slab-on-ground/Low-set Fibro 1 yes 65 -32.4021946 152.206199 2 Residential Slab-on-ground/Low-set Brick 1 yes 66 -32.4024425 152.206188 3 Residential Slab-on-ground/Low-set Fibro 1 yes 67 -32.4027012 152.206306 3 Residential Slab-on-ground/Low-set Fibro 1 yes 68 -32.4025441 152.20634 3 Residential Slab-on-ground/Low-set Fibro 1 yes 69 -32.4023717 152.206376 4 Residential Slab-on-ground/Low-set Fibro 1 yes 70 -32.4021602 152.206404 3 Residential Slab-on-ground/Low-set Brick 1 yes Resident mentioned drainage issue particularly for no 22 Prince St 71 -32.4019833 152.20645 3 Residential Slab-on-ground/Low-set Brick 1 yes 72 -32.4017478 152.206498 1 Residential Slab-on-ground/Low-set Brick 1 yes 73 -32.4013846 152.206556 4 Residential Slab-on-ground/Low-set Fibro 1 yes 74 -32.4012292 152.206587 5 Residential Slab-on-ground/Low-set Fibro 1 yes 75 -32.4011239 152.206832 1 Residential Slab-on-ground/Low-set Brick 1 yes 76 -32.4005936 152.206783 1 Residential Slab-on-ground/Low-set Brick 1 yes
MHL2789 – B3 © Crown 2021 Classification: Release by consent Unique ID Latitude Longitude Number of steps from ground level to floor level Property Type Construction Type Property Material Number of storeys Front door visible from road during visit? Commercial/ Industrial Building Damage Risk Category Comments 77 -32.4000748 152.207041 2 Residential Slab-on-ground/Low-set Fibro 1 yes 78 -32.4001206 152.207345 1 Residential Slab-on-ground/Low-set Brick 1 no Front door is not visible. 79 -32.4001288 152.207483 1 Residential Slab-on-ground/Low-set Brick 1 yes Careful dem point selection 80 -32.4001441 152.207671 1 Residential Slab-on-ground/Low-set Brick 1 yes 81 -32.4001795 152.20791 0 Residential Slab-on-ground/Low-set Brick,Fibro 2 yes 82 -32.4002207 152.208179 1 Residential Slab-on-ground/Low-set Brick 2 yes 83 -32.4009104 152.208031 2 Residential Slab-on-ground/Low-set Brick 1 yes 84 -32.4008838 152.207724 1 Residential Slab-on-ground/Low-set Brick 1 yes 85 -32.4008411 152.207489 4 Residential Slab-on-ground/Low-set Fibro 1 yes 86 -32.4008125 152.207293 7 Residential Slab-on-ground/Low-set Fibro 1 yes 87 -32.4007717 152.207119 8 Residential Slab-on-ground/Low-set Brick 1 no Front door is not visible. Estimated elevation above ground 1.5m. 88 -32.4009215 152.207162 2 Residential Slab-on-ground/Low-set Fibro 1 yes 89 -32.4009424 152.207372 0 Residential Slab-on-ground/Low-set Brick 1 yes 90 -32.4009767 152.207575 3 Residential Slab-on-ground/Low-set Brick 1 yes 91 -32.4010132 152.207848 1 Residential Slab-on-ground/Low-set Brick 1 yes 92 -32.4007748 152.207887 3 Residential Slab-on-ground/Low-set Fibro 1 yes 93 -32.4002987 152.208859 2 Residential Slab-on-ground/Low-set Brick 1 yes 94 -32.4013937 152.208176 4 Residential Slab-on-ground/Low-set Brick 1 no Estimated as ramp at front 95 -32.4016802 152.20813 2 Residential Slab-on-ground/Low-set Brick 1 yes 96 -32.4021888 152.208037 3 Residential Slab-on-ground/Low-set Brick 1 yes 97 -32.4021556 152.20802 5 Residential Slab-on-ground/Low-set Brick 1 yes 98 -32.4024315 152.207676 5 Residential Slab-on-ground/Low-set Fibro 1 yes 99 -32.4026628 152.207936 6 Residential Slab-on-ground/Low-set Fibro 1 yes 100 -32.4030728 152.207961 6 Residential Slab-on-ground/Low-set Brick 1 yes 101 -32.402312 152.207936 2 Residential Slab-on-ground/Low-set Brick 1 yes 102 -32.4024283 152.207905 2 Residential Slab-on-ground/Low-set Brick 1 yes 103 -32.4027492 152.207846 1 Residential Slab-on-ground/Low-set Brick 1 yes 104 -32.4027821 152.207829 2 Residential Slab-on-ground/Low-set Brick 1 yes 105 -32.4028897 152.207803 0 Residential Slab-on-ground/Low-set Brick 1 yes 106 -32.400371 152.209408 5 Residential High-set Fibro 1 yes 106 -32.4032116 152.207698 0 Residential Slab-on-ground/Low-set Brick 1 yes 107 -32.4000034 152.207631 4 Residential Slab-on-ground/Low-set Brick 1 yes 108 -32.4032539 152.207148 2 Residential Slab-on-ground/Low-set Brick 1 yes 109 -32.4025296 152.201977 12 Residential High-set Fibro 1 yes 110 -32.4026498 152.202476 1 Residential Slab-on-ground/Low-set Brick 1 yes 111 -32.4027045 152.202776 1 Residential Slab-on-ground/Low-set Fibro 1 no 112 -32.4033805 152.208353 1 Residential Slab-on-ground/Low-set Brick 1 yes 113 -32.4031691 152.209252 2 Residential Slab-on-ground/Low-set Fibro 1 yes 114 -32.4028389 152.20929 2 Residential Slab-on-ground/Low-set Timber 1 yes 115 -32.4026683 152.20936 1 Residential Slab-on-ground/Low-set Fibro 1 yes
MHL2789 – B4 © Crown 2021 Classification: Release by consent Unique ID Latitude Longitude Number of steps from ground level to floor level Property Type Construction Type Property Material Number of storeys Front door visible from road during visit? Commercial/ Industrial Building Damage Risk Category Comments 116 -32.4022574 152.209424 2 Residential Slab-on-ground/Low-set Fibro 1 yes 117 -32.4019545 152.209493 3 Residential Slab-on-ground/Low-set Fibro 1 yes 118 -32.4017131 152.209535 3 Residential Slab-on-ground/Low-set Fibro 1 yes 119 -32.4015748 152.209575 3 Residential Slab-on-ground/Low-set Fibro 1 yes 120 -32.4014829 152.209588 1 Residential Slab-on-ground/Low-set Brick 1 yes 121 -32.4008179 152.209742 1 Residential Slab-on-ground/Low-set Fibro 1 yes 122 -32.4006358 152.20998 1 Residential Slab-on-ground/Low-set Fibro 1 yes 123 -32.4010231 152.209833 3 Residential Slab-on-ground/Low-set Fibro 1 yes 124 -32.401101 152.2098 2 Residential Slab-on-ground/Low-set Fibro 1 yes 125 -32.4015534 152.209677 3 Residential Slab-on-ground/Low-set Brick 1 yes 126 -32.401925 152.209594 6 Residential Slab-on-ground/Low-set Fibro 1 yes 127 -32.4020096 152.209604 4 Residential Slab-on-ground/Low-set Fibro 1 yes 128 -32.4023075 152.209541 4 Residential Slab-on-ground/Low-set Fibro 1 yes 129 -32.4025178 152.209506 4 Residential Slab-on-ground/Low-set Fibro 1 yes 130 -32.4025826 152.209523 5 Residential Slab-on-ground/Low-set Fibro 1 yes 131 -32.4028778 152.209439 2 Residential Slab-on-ground/Low-set Fibro 1 no 132 -32.4029928 152.209408 7 Residential Slab-on-ground/Low-set Fibro 1 yes 133 -32.4031897 152.209404 6 Residential Slab-on-ground/Low-set Fibro 1 yes 134 -32.4032183 152.209422 4 Residential Slab-on-ground/Low-set Fibro 1 yes 135 -32.4034493 152.210431 4 Commercial Slab-on-ground/Low-set Fibro 1 yes Low From side; Hall 136 -32.4031179 152.210676 3 Residential Slab-on-ground/Low-set Fibro 1 yes 137 -32.4030423 152.210743 2 Residential Slab-on-ground/Low-set Fibro 1 yes 138 -32.4028384 152.210832 3 Residential Slab-on-ground/Low-set Fibro 1 yes 139 -32.4022426 152.21093 2 Residential Slab-on-ground/Low-set Fibro 1 yes 140 -32.4019259 152.210977 2 Residential Slab-on-ground/Low-set Fibro 1 yes 141 -32.4017243 152.210999 3 Residential Slab-on-ground/Low-set Timber 1 yes 142 -32.4017537 152.211169 3 Residential Slab-on-ground/Low-set Fibro 1 no 143 -32.4015084 152.211 2 Residential Slab-on-ground/Low-set Brick 1 yes Only one visible 144 -32.4011192 152.211136 2.5 Residential Slab-on-ground/Low-set Fibro 1 yes 145 -32.4005556 152.210852 4 Residential Slab-on-ground/Low-set Fibro 1 yes 146 -32.4005349 152.210511 2 Residential Slab-on-ground/Low-set Brick 1 yes 147 -32.4008634 152.211291 4 Residential Slab-on-ground/Low-set Fibro 1 yes 148 -32.401055 152.211248 1 Residential Slab-on-ground/Low-set Brick 1 yes 149 -32.401255 152.211207 6 Residential High-set Fibro 1 yes 150 -32.4013814 152.211177 5 Residential Slab-on-ground/Low-set Brick 1 yes 151 -32.4017024 152.211115 2 Residential Slab-on-ground/Low-set Fibro 1 yes 152 -32.4019966 152.211061 5 Residential Slab-on-ground/Low-set Fibro 1 yes 152 -32.4021576 152.211033 5 Residential Slab-on-ground/Low-set Fibro 1 yes 153 -32.4023194 152.210993 4 Residential Slab-on-ground/Low-set Fibro 1 yes 154 -32.40254 152.210951 4 Residential Slab-on-ground/Low-set Fibro 1 yes 155 -32.4028731 152.21088 4 Residential Slab-on-ground/Low-set Fibro 1 yes
MHL2789 – B5 © Crown 2021 Classification: Release by consent Unique ID Latitude Longitude Number of steps from ground level to floor level Property Type Construction Type Property Material Number of storeys Front door visible from road during visit? Commercial/ Industrial Building Damage Risk Category Comments 156 -32.4030289 152.210835 5 Residential Slab-on-ground/Low-set Fibro 1 yes 157 -32.4032284 152.210809 4 Residential Slab-on-ground/Low-set Fibro 1 yes 158 -32.403536 152.21075 4 Residential Slab-on-ground/Low-set Fibro 1 yes 159 -32.4036898 152.210144 0 Industrial Slab-on-ground/Low-set Sheetpile 1 yes Low At front 160 -32.4038149 152.211986 3 Residential Slab-on-ground/Low-set Fibro 1 no 3 from corner 161 -32.4033527 152.212201 1 Residential Slab-on-ground/Low-set Fibro 1 yes 162 -32.4028668 152.212275 2 Residential Slab-on-ground/Low-set Fibro 1 yes 163 -32.4029076 152.212285 1 Residential Slab-on-ground/Low-set Fibro 1 yes 164 -32.4024224 152.212331 4 Residential Slab-on-ground/Low-set Fibro 1 yes 165 -32.4022893 152.212389 3 Residential Slab-on-ground/Low-set Fibro 1 yes 166 -32.4020361 152.212432 1 Residential Slab-on-ground/Low-set Brick 1 yes 167 -32.4018011 152.212482 3 Residential Slab-on-ground/Low-set Fibro 1 no 168 -32.4015483 152.21257 1 Residential Slab-on-ground/Low-set Brick 1 yes 169 -32.4014683 152.212566 2.5 Residential Slab-on-ground/Low-set Brick 2 yes 170 -32.4011609 152.212643 2 Residential Slab-on-ground/Low-set Fibro 1 yes 171 -32.4007575 152.212662 2 Residential Slab-on-ground/Low-set Brick 1 yes Maybe 3 steps 172 -32.4009302 152.212687 1 Residential Slab-on-ground/Low-set Brick 1 yes On slope. 173 -32.4010416 152.212653 4 Residential Slab-on-ground/Low-set Brick 1 yes 174 -32.4011819 152.212658 1 Residential Slab-on-ground/Low-set Brick 1 yes 175 -32.4016876 152.212725 4 Residential Slab-on-ground/Low-set Brick 1 yes 176 -32.4016679 152.212985 3 Residential Slab-on-ground/Low-set Brick 1 yes 177 -32.4015916 152.213504 1.5 Residential Slab-on-ground/Low-set Brick 1 yes 178 -32.401421 152.213528 3 Residential Slab-on-ground/Low-set Brick 1 yes 179 -32.4012266 152.213538 2 Residential Slab-on-ground/Low-set Brick 1 yes 180 -32.4011029 152.213592 1 Residential Slab-on-ground/Low-set Brick 1 yes From top of mount 181 -32.4011461 152.213681 11 Residential High-set Brick 1 yes 182 -32.4013225 152.213578 2 Residential Slab-on-ground/Low-set Brick 1 yes 183 -32.401861 152.213489 1 Residential Slab-on-ground/Low-set Brick 1 yes 184 -32.4018212 152.213364 1 Residential Slab-on-ground/Low-set Brick 1 yes 185 -32.4017757 152.213166 1 Residential Slab-on-ground/Low-set Brick 1 yes 186 -32.4017741 152.213022 3 Residential Slab-on-ground/Low-set Brick 1 yes 187 -32.4017208 152.212728 0 Residential Slab-on-ground/Low-set Brick 1 yes 188 -32.4025377 152.212562 3 Residential Slab-on-ground/Low-set Brick 1 yes 189 -32.4024465 152.212998 2 Residential Slab-on-ground/Low-set Fibro 1 yes 190 -32.4025599 152.213202 2 Residential Slab-on-ground/Low-set Fibro 1 yes 191 -32.4026171 152.21325 1 Residential Slab-on-ground/Low-set Fibro 1 yes 192 -32.4027728 152.213418 3 Residential Slab-on-ground/Low-set Fibro 1 yes 193 -32.4028874 152.213501 1 Residential Slab-on-ground/Low-set Brick 1 yes 194-1 -32.4029832 152.213135 2 Commercial Slab-on-ground/Low-set Fibro 1 yes Low 194-2 -32.4030162 152.213158 2 Commercial Slab-on-ground/Low-set Fibro 1 yes Low 195 -32.4034342 152.213447 4 Residential Slab-on-ground/Low-set Fibro 1 yes
MHL2789 – B6 © Crown 2021 Classification: Release by consent Unique ID Latitude Longitude Number of steps from ground level to floor level Property Type Construction Type Property Material Number of storeys Front door visible from road during visit? Commercial/ Industrial Building Damage Risk Category Comments 196 -32.4032392 152.21441 4 Commercial Slab-on-ground/Low-set Brick 1 yes High 197 -32.4009366 152.21503 0 commercial Slab-on-ground/Low-set Fibro 1 yes Low 198 -32.3997009 152.212915 0 Industrial Slab-on-ground/Low-set Sheetpile 1 yes High 199 -32.4002109 152.210313 1 Industrial Slab-on-ground/Low-set sheetpile 1 yes Medium 200-1 -32.3994565 152.209819 1.5 Residential Slab-on-ground/Low-set Fibro 1 yes 200-2 -32.3991437 152.21053 0 Industrial Slab-on-ground/Low-set Sheetpile 1 no Medium Fenced off 201 -32.3988394 152.210536 1 Industrial Slab-on-ground/Low-set Sheetpile 1 yes Medium 202 -32.3983171 152.210666 2 Industrial Slab-on-ground/Low-set Brick 1 yes High 203 -32.3981472 152.210332 0 Industrial Slab-on-ground/Low-set Brick 1 no Medium 204 -32.398075 152.209988 0 Industrial Slab-on-ground/Low-set Sheetpile 1 no Medium 205 -32.3980878 152.209531 0 Industrial Slab-on-ground/Low-set Fibro,Sheetpile 1 yes Medium 206 -32.3983377 152.208946 0 Residential Slab-on-ground/Low-set Brick 1 yes 207 -32.3978608 152.208683 3 Residential Slab-on-ground/Low-set Brick 1 yes 208 -32.3976816 152.208418 1 Industrial Slab-on-ground/Low-set Brick 1 yes High SA Relf and Sons 209 -32.3987239 152.209438 0 Industrial Slab-on-ground/Low-set Sheetpile 1 yes High 210 -32.3990562 152.209575 2 Residential Slab-on-ground/Low-set Fibro 1 no 211 -32.3984046 152.209463 0 Industrial Slab-on-ground/Low-set Sheetpile 1 yes High 212 -32.4026787 152.213974 0 Residential Slab-on-ground/Low-set Brick 1 yes Located lower than street level 213 -32.4004286 152.211106 1 Residential Slab-on-ground/Low-set Brick 1 yes From driveway 214 -32.402715 152.201599 7 Residential Slab-on-ground/Low-set Fibro 1 yes 215 -32.4031037 152.201378 1 Residential Slab-on-ground/Low-set Fibro 1 yes 216 -32.4032656 152.202789 2 Residential Slab-on-ground/Low-set Fibro 1 yes 217 -32.4027541 152.202576 3 Residential Slab-on-ground/Low-set Fibro 1 yes 218 -32.4036489 152.203066 2 Residential Slab-on-ground/Low-set Fibro 1 no 219 -32.4046923 152.202643 2 Residential Slab-on-ground/Low-set Fibro 1 yes 220 -32.4035264 152.206128 3 Residential Slab-on-ground/Low-set Brick 1 yes 221 -32.4037601 152.206169 2 Residential Slab-on-ground/Low-set Brick 1 yes 222 -32.4040466 152.206076 3 Residential Slab-on-ground/Low-set Fibro 1 yes 223 -32.4043567 152.20592 3 Residential Slab-on-ground/Low-set Fibro 1 yes 224 -32.404509 152.205897 8 Residential Slab-on-ground/Low-set Fibro 1 yes 225 -32.4047001 152.205846 0 Residential Slab-on-ground/Low-set Brick 2 yes 226 -32.4052588 152.205775 3 Residential Slab-on-ground/Low-set Fibro 1 yes 227 -32.4058175 152.205699 16 Commercial High-set Fibro 1 yes Low 228 -32.4060753 152.205698 3 Residential Slab-on-ground/Low-set Fibro 1 yes Resident mentioned flood came ~5cm from floor level 229 -32.4069534 152.204908 0 Residential Slab-on-ground/Low-set Fibro 1 yes 231 -32.4068433 152.20544 3 Residential Slab-on-ground/Low-set Fibro 1 yes 232 -32.4071003 152.20549 2 Residential Slab-on-ground/Low-set Brick 2 yes 233 -32.4070418 152.205215 5 Commercial Slab-on-ground/Low-set Brick 1 yes Low Bulahdelah bowling Club 234 -32.407638 152.205238 5 Residential High-set Fibro 1 yes 235 -32.4076056 152.205131 4 Residential Slab-on-ground/Low-set Fibro 1 yes 236 -32.4077304 152.205219 1 Residential Slab-on-ground/Low-set Brick 2 yes
MHL2789 – B7 © Crown 2021 Classification: Release by consent Unique ID Latitude Longitude Number of steps from ground level to floor level Property Type Construction Type Property Material Number of storeys Front door visible from road during visit? Commercial/ Industrial Building Damage Risk Category Comments 237 -32.4079073 152.205483 7 Residential Slab-on-ground/Low-set Fibro 1 yes 238 -32.408074 152.205152 12 Residential High-set Fibro 1 yes 239 -32.4080943 152.205175 16 Residential Slab-on-ground/Low-set Fibro 2 yes 240 -32.4082799 152.205134 3 Residential Slab-on-ground/Low-set Fibro 1 yes 241 -32.408427 152.205296 0 Vacant Slab-on-ground/Low-set na 1 yes 242 -32.4073797 152.204313 3 Residential Slab-on-ground/Low-set Fibro 1 yes 243 -32.4077771 152.20396 2 Residential High-set Fibro 2 yes Floodmark point id 12 + 10cm 244 -32.406861 152.202959 0 Residential Slab-on-ground/Low-set Brick 2 yes 245 -32.4069323 152.202367 7 Residential High-set Fibro 1 yes 246 -32.403701 152.207631 2 Residential Slab-on-ground/Low-set Fibro 1 yes From front 247 -32.4041867 152.20757 3 Residential Slab-on-ground/Low-set Fibro 1 yes 248 -32.4042364 152.207552 1 Residential Slab-on-ground/Low-set Fibro 1 yes From front 249 -32.4047067 152.207368 1 Commercial Slab-on-ground/Low-set Fibro 1 yes Low Very old house with No roof 250 -32.4037487 152.207737 6 Residential High-set Fibro 1 yes 251 -32.4040857 152.207669 6 Residential Slab-on-ground/Low-set Fibro 1 yes 252 -32.4042646 152.207643 6 Residential Slab-on-ground/Low-set Fibro,Brick 1 yes 253 -32.4044729 152.207613 6 Residential Slab-on-ground/Low-set Brick 1 yes 12 bricks above ground 254 -32.404672 152.20759 4 Residential Slab-on-ground/Low-set Brick 1 yes 255 -32.4047782 152.207546 9 Residential Slab-on-ground/Low-set Fibro 1 yes 256 -32.4045892 152.207625 6 Residential Slab-on-ground/Low-set Brick 1 yes 257 -32.4056788 152.207278 3 Residential Slab-on-ground/Low-set Fibro 1 yes 258 -32.4059337 152.207245 0 Residential Slab-on-ground/Low-set Fibro 1 yes 259 -32.4055898 152.207616 3 Residential Slab-on-ground/Low-set Fibro 1 yes 260 -32.4059547 152.20732 5 Residential Slab-on-ground/Low-set Fibro 1 yes 261 -32.4061997 152.207274 4 Residential Slab-on-ground/Low-set Brick 1 yes 262 -32.4064836 152.207328 3 Residential Slab-on-ground/Low-set Fibro 1 yes 263 -32.4065664 152.207145 2 Residential Slab-on-ground/Low-set Fibro 1 yes 264 -32.4067852 152.207076 3 Residential Slab-on-ground/Low-set Fibro 1 yes 265 -32.4067922 152.207139 3 Residential Slab-on-ground/Low-set Fibro 1 yes 266 -32.407072 152.206983 4 Residential Slab-on-ground/Low-set Brick 1 yes 267 -32.4070269 152.207092 3 Residential Slab-on-ground/Low-set Brick 1 yes 268 -32.4075926 152.207323 2 Residential Slab-on-ground/Low-set Brick 2 yes 270 -32.4081875 152.207101 14 Residential High-set Fibro 1 yes 271 -32.4082819 152.206952 14 Residential High-set Fibro 1 yes 272 -32.4083418 152.206934 14 Residential High-set Fibro 1 no 273 -32.4039748 152.209071 2 Residential Slab-on-ground/Low-set Brick 1 yes 274 -32.4041524 152.209037 1 Residential Slab-on-ground/Low-set Fibro 1 yes 275 -32.4042656 152.208992 2 Residential Slab-on-ground/Low-set Fibro 1 yes 276 -32.404364 152.208985 1 Commercial Slab-on-ground/Low-set Brick 1 yes Medium 277 -32.4045517 152.208982 1 Residential Slab-on-ground/Low-set Fibro 1 yes 278 -32.4048195 152.208917 1 Residential Slab-on-ground/Low-set Fibro 1 yes
MHL2789 – B8 © Crown 2021 Classification: Release by consent Unique ID Latitude Longitude Number of steps from ground level to floor level Property Type Construction Type Property Material Number of storeys Front door visible from road during visit? Commercial/ Industrial Building Damage Risk Category Comments 279 -32.4050516 152.208868 0 Residential Slab-on-ground/Low-set Fibro 1 yes 280 -32.4053136 152.208765 10 Residential High-set Fibro 1 yes 281 -32.4053481 152.20873 4 Residential Slab-on-ground/Low-set Fibro 1 yes 282 -32.4037332 152.209327 3 Residential Slab-on-ground/Low-set Fibro 1 yes 283 -32.4038564 152.209267 3 Commercial Slab-on-ground/Low-set Fibro 1 yes Low 284 -32.4039729 152.209253 4 Residential Slab-on-ground/Low-set Fibro 1 yes 285 -32.4045052 152.209164 3 Commercial Slab-on-ground/Low-set Brick 1 yes Low Church 286 -32.4046986 152.209078 1 Commercial Slab-on-ground/Low-set Brick 1 yes Low 287 -32.4047985 152.209106 0 Industrial Slab-on-ground/Low-set sheetpile 1 yes Low 288 -32.4048366 152.209172 1 Residential Slab-on-ground/Low-set Brick 1 yes 289 -32.4056026 152.20896 5 Residential Slab-on-ground/Low-set Brick 1 yes 290 -32.4056214 152.208393 1 Residential Slab-on-ground/Low-set Brick 1 yes 291 -32.4056012 152.208285 1 Residential Slab-on-ground/Low-set Brick 1 yes 292 -32.4055431 152.207766 5 Residential Slab-on-ground/Low-set Brick 1 yes 293 -32.4055919 152.207993 5 Residential Slab-on-ground/Low-set Brick 1 yes 294 -32.4056446 152.208168 4 Residential Slab-on-ground/Low-set Fibro 1 no 295 -32.4057076 152.208259 3 Residential Slab-on-ground/Low-set Brick 1 yes 296 -32.4058455 152.208668 0 Commercial Slab-on-ground/Low-set Fibro 1 yes Low 297 -32.4061569 152.208577 1 Commercial Slab-on-ground/Low-set Fibro 1 yes Low Hair salon 298 -32.4062374 152.208599 0 Industrial Slab-on-ground/Low-set Fibro 1 yes Medium Bulahdelah farm and garden 299 -32.4065059 152.208585 2 Residential Slab-on-ground/Low-set Fibro 1 yes 300 -32.4066903 152.208554 3 Residential Slab-on-ground/Low-set Brick 1 yes 301 -32.4067853 152.208531 2 Residential Slab-on-ground/Low-set Fibro 1 yes 302 -32.4070403 152.208487 3 Residential Slab-on-ground/Low-set Fibro 1 yes 303 -32.4072254 152.208444 2 Residential Slab-on-ground/Low-set Fibro 1 yes 304 -32.4074428 152.208422 3 Residential Slab-on-ground/Low-set Fibro 1 yes 305 -32.4075795 152.208376 2 Commercial Slab-on-ground/Low-set Fibro 1 yes Low 306 -32.4076761 152.207947 4 Residential Slab-on-ground/Low-set Fibro 1 no 307 -32.4077186 152.207632 4 Residential Slab-on-ground/Low-set Fibro 1 yes 308 -32.4078658 152.207882 4 Residential Slab-on-ground/Low-set Fibro 1 yes Flood reached top of second step at peak in back garden 309 -32.4078997 152.208167 2 Residential Slab-on-ground/Low-set Fibro 1 yes 310 -32.4075846 152.208596 2.5 Residential Slab-on-ground/Low-set Fibro 1 yes 311 -32.4074879 152.2086 3 Commercial Slab-on-ground/Low-set Fibro 1 yes Low Scout hall 312 -32.4072763 152.208586 3 Residential Slab-on-ground/Low-set Fibro 1 yes 313 -32.4069323 152.208594 0 Residential Slab-on-ground/Low-set Brick 1 yes 314 -32.4067415 152.20868 2 Residential Slab-on-ground/Low-set Fibro 1 yes 315 -32.4064285 152.208741 4 Residential Slab-on-ground/Low-set Fibro 1 yes 316 -32.4062514 152.208774 3 Residential Slab-on-ground/Low-set Fibro 1 yes 317 -32.406003 152.208829 1 Residential Slab-on-ground/Low-set Brick 1 yes Steps from front 318 -32.4058138 152.209352 0 Residential Slab-on-ground/Low-set Brick 1 yes Unit 2
MHL2789 – B9 © Crown 2021 Classification: Release by consent Unique ID Latitude Longitude Number of steps from ground level to floor level Property Type Construction Type Property Material Number of storeys Front door visible from road during visit? Commercial/ Industrial Building Damage Risk Category Comments 319 -32.4037551 152.209838 3 Residential Slab-on-ground/Low-set Fibro 1 yes 320 -32.4039071 152.210329 2 Residential Slab-on-ground/Low-set Brick 1 yes 321 -32.4042922 152.210513 3 Residential Slab-on-ground/Low-set Fibro 1 yes 322 -32.404582 152.210393 2 Commercial Slab-on-ground/Low-set Brick 1 no Low 2 steps North East corner, aged care, other unit not visible 323 -32.4043164 152.210619 2 Residential Slab-on-ground/Low-set Fibro 1 yes 324 -32.4044976 152.210595 3 Residential Slab-on-ground/Low-set Fibro 1 yes They experienced flooding in their back yard 325 -32.4046707 152.210564 1 Residential Slab-on-ground/Low-set Fibro 1 yes 326 -32.4047806 152.210531 1 Residential Slab-on-ground/Low-set Brick 1 yes They have been flooded 327 -32.4049353 152.210502 4 Residential Slab-on-ground/Low-set Fibro 1 yes The lady mentioned they were not flooded because of the creek that goes around the property 328 -32.4061702 152.210098 2 Residential Slab-on-ground/Low-set Fibro 1 yes 329 -32.4062475 152.210153 2 Residential Slab-on-ground/Low-set Fibro 1 yes 330 -32.4060247 152.210332 4 Residential Slab-on-ground/Low-set Fibro 1 yes 331 -32.4065902 152.21009 3 Residential Slab-on-ground/Low-set Fibro 1 yes 332 -32.4067591 152.210064 2 Residential Slab-on-ground/Low-set Fibro 1 yes 333 -32.4070491 152.209975 3 Residential Slab-on-ground/Low-set Fibro 1 yes 334 -32.4072158 152.209909 9 Residential High-set Fibro 1 yes 335 -32.4074848 152.209895 7 Residential High-set Fibro 1 yes 336 -32.4076457 152.209857 5 Residential Slab-on-ground/Low-set Fibro 1 yes 337 -32.4090077 152.209593 2 Residential Slab-on-ground/Low-set Fibro 1 yes 338 -32.409381 152.20953 4 Residential Slab-on-ground/Low-set Fibro 1 yes 339 -32.4084117 152.208552 5 Residential Slab-on-ground/Low-set Fibro 1 yes 340 -32.4086158 152.208496 7 Residential Slab-on-ground/Low-set Fibro 1 yes 341 -32.4101531 152.209822 3 Residential Slab-on-ground/Low-set Fibro 1 yes 342 -32.4101817 152.210018 3 Residential Slab-on-ground/Low-set Fibro 1 yes 343 -32.4097446 152.208534 0 Commercial Slab-on-ground/Low-set sheetpile 1 yes Medium Bulahdelah Tyre and Mechanical 344 -32.4098111 152.208927 3 Residential Slab-on-ground/Low-set Fibro 1 no Estimated 345 -32.4098883 152.20892 17 Residential High-set Fibro 1 yes 346 -32.4097381 152.20961 6 Residential Slab-on-ground/Low-set Fibro 1 yes Church. Located on slope. 347 -32.4095025 152.209653 6 Residential Slab-on-ground/Low-set Fibro 1 yes 348 -32.4094416 152.209648 7 Residential High-set Fibro 1 yes 349 -32.4092412 152.209711 10 Residential Slab-on-ground/Low-set Fibro 1 no Located on slope. Building is considerably above the ground. Estimated 10 steps. 350 -32.4090828 152.209721 8 Residential Slab-on-ground/Low-set Fibro 1 yes Located on slope 351 -32.4088354 152.209781 4 Residential Slab-on-ground/Low-set Fibro 1 yes This building is located on slope as it is obvious in the photos 352 -32.4085745 152.209914 8 Residential Slab-on-ground/Low-set Fibro 1 yes 353 -32.4083479 152.209875 3 Residential Slab-on-ground/Low-set Fibro 1 yes
MHL2789 – B10 © Crown 2021 Classification: Release by consent Unique ID Latitude Longitude Number of steps from ground level to floor level Property Type Construction Type Property Material Number of storeys Front door visible from road during visit? Commercial/ Industrial Building Damage Risk Category Comments 355 -32.4077287 152.210007 0 Residential Slab-on-ground/Low-set Fibro 1 yes 356 -32.4075529 152.210035 0 Residential Slab-on-ground/Low-set Fibro 1 yes 357 -32.4073171 152.210068 3 Residential Slab-on-ground/Low-set Fibro 1 yes 358 -32.4070447 152.210128 5 Residential Slab-on-ground/Low-set Fibro 1 yes 359 -32.4066414 152.210268 2 Residential Slab-on-ground/Low-set Brick 1 yes 360 -32.4065679 152.210199 7 Residential Slab-on-ground/Low-set Fibro 1 yes 361 -32.4060601 152.210745 1 Residential Slab-on-ground/Low-set Fibro 1 yes 362 -32.4059302 152.21082 2 Residential Slab-on-ground/Low-set Brick 1 yes 363 -32.4061121 152.211063 4 Residential Slab-on-ground/Low-set Fibro 1 yes 364 -32.4058802 152.211553 2 Residential Slab-on-ground/Low-set Fibro 1 yes 365 -32.4057511 152.211608 2 Residential Slab-on-ground/Low-set Brick 1 yes Lower than the street 366 -32.4055733 152.211684 3 Residential Slab-on-ground/Low-set Fibro 1 yes 367 -32.4053675 152.211682 2 Residential Slab-on-ground/Low-set Fibro 1 yes 368 -32.4051449 152.211834 3 Residential Slab-on-ground/Low-set Fibro 1 yes 369 -32.4040524 152.211924 1 Residential Slab-on-ground/Low-set Fibro 1 yes 370 -32.4040361 152.211504 1 Residential Slab-on-ground/Low-set Fibro 1 yes 371 -32.4039476 152.211353 1 Residential Slab-on-ground/Low-set Brick 1 yes Located lower than the street 372 -32.4038708 152.210978 1.5 Residential Slab-on-ground/Low-set Fibro 1 yes 373 -32.4053623 152.211959 5 Residential Slab-on-ground/Low-set Fibro 1 yes 374 -32.4053935 152.211928 5 Commercial Slab-on-ground/Low-set Brick 1 yes Low 375 -32.4058019 152.2121 NA Commercial Slab-on-ground/Low-set Brick 1 yes Low Varying Number of Steps 376 -32.4062049 152.211504 2 Residential Slab-on-ground/Low-set Fibro 1 yes 377 -32.4066619 152.211488 2 Residential Slab-on-ground/Low-set Brick 1 yes 378 -32.4067975 152.211472 4 Residential Slab-on-ground/Low-set Fibro 1 yes 379 -32.4071581 152.211351 1 Residential Slab-on-ground/Low-set Brick 1 yes 380 -32.4073842 152.211293 0 Industrial Slab-on-ground/Low-set sheetpile 1 yes Low 381 -32.4066669 152.211731 NA Industrial Slab-on-ground/Low-set sheetpile 1 yes High Varying Number of Steps 382 -32.4084913 152.211072 5 Residential Slab-on-ground/Low-set Fibro 1 yes 383 -32.409232 152.210888 1 Commercial Slab-on-ground/Low-set Brick 1 yes Low 384 -32.4093435 152.210863 0 Commercial Slab-on-ground/Low-set Brick 1 yes Low 385 -32.4098231 152.210768 1 Commercial Slab-on-ground/Low-set Fibro 1 yes Medium 386 -32.4095088 152.211346 0 Commercial Slab-on-ground/Low-set Brick 1 yes Medium 387 -32.4100175 152.211959 NA Commercial Slab-on-ground/Low-set Fibro,Sheetpile 1 yes Medium Council Depot; Varying Number of Steps 388 -32.409425 152.212531 0 Commercial Slab-on-ground/Low-set Brick,Sheetpile 1 yes Low Fire station 389 -32.4099187 152.212712 NA Commercial Slab-on-ground/Low-set Fibro 1 yes Low RMS depot; varying number of steps 390 -32.4105531 152.213338 5 Residential Slab-on-ground/Low-set Fibro 1 yes 391 -32.4102063 152.214007 6 Residential Slab-on-ground/Low-set Timber 1 yes 392 -32.4104687 152.213941 5 Residential Slab-on-ground/Low-set Fibro 1 yes 393 -32.4100692 152.210337 4 Residential Slab-on-ground/Low-set Fibro 1 yes 394 -32.4100477 152.210095 5 Residential Slab-on-ground/Low-set Fibro 1 yes 395 -32.4027471 152.208135 1 Residential Slab-on-ground/Low-set Fibro 1 yes
MHL2789 – B11 © Crown 2021 Classification: Release by consent Unique ID Latitude Longitude Number of steps from ground level to floor level Property Type Construction Type Property Material Number of storeys Front door visible from road during visit? Commercial/ Industrial Building Damage Risk Category Comments 396 -32.4108983 152.213894 0 Residential Slab-on-ground/Low-set Brick 1 yes Top of embankment 397 -32.4112038 152.213848 4 Residential Slab-on-ground/Low-set Fibro 1 yes 398 -32.4113999 152.21384 6 Residential Slab-on-ground/Low-set Fibro 1 yes 399 -32.4115697 152.213755 1 Residential Slab-on-ground/Low-set Brick 1 yes 400 -32.411981 152.213634 6 Residential Slab-on-ground/Low-set Fibro 1 yes 401 -32.4125086 152.21367 4 Residential Slab-on-ground/Low-set Fibro 1 yes 402 -32.4125352 152.213986 5 Residential Slab-on-ground/Low-set Fibro 1 yes 403 -32.4125548 152.214254 4 Residential Slab-on-ground/Low-set Fibro 1 yes 404 -32.4126092 152.214434 3 Residential Slab-on-ground/Low-set Fibro 1 yes 405 -32.4126292 152.214617 1 Residential Slab-on-ground/Low-set Fibro 1 yes 406 -32.4127167 152.214442 7 Residential Slab-on-ground/Low-set Fibro 1 yes 7 steps from Meade Street and 1 step from back on Scott Street. 407 -32.4126845 152.214258 6 Residential Slab-on-ground/Low-set Fibro 1 yes 408 -32.4123585 152.213106 4 Residential Slab-on-ground/Low-set Fibro 1 yes 409 -32.4117436 152.213502 2 Residential Slab-on-ground/Low-set Brick 1 yes From centre 410 -32.4111293 152.21346 2 Residential Slab-on-ground/Low-set Brick 1 yes From front 411 -32.4110584 152.213638 3 Residential Slab-on-ground/Low-set Brick 1 yes 412 -32.4107273 152.212282 4 Residential Slab-on-ground/Low-set Brick 1 yes 413 -32.4109862 152.212253 5 Residential Slab-on-ground/Low-set Fibro 1 no Front door is not visible due to existence of fence 414 -32.411533 152.212171 3 Residential Slab-on-ground/Low-set Fibro 1 yes 415 -32.4116818 152.21217 4 Residential Slab-on-ground/Low-set Brick 1 yes 416 -32.4122601 152.212213 2 Residential Slab-on-ground/Low-set Fibro 1 yes 417 -32.4123692 152.212463 3 Residential Slab-on-ground/Low-set Fibro 1 yes 418 -32.4123447 152.212693 4 Commercial Slab-on-ground/Low-set Fibro 1 yes Low Ambulance station. Back building is 0 419 -32.4124885 152.212249 0 Commercial Slab-on-ground/Low-set Brick,Fibro 1 yes Low Bulahdelah Central School 420 -32.4122991 152.211864 NA Commercial Slab-on-ground/Low-set NA 1 yes Low Varying Number of Steps 421 -32.4117525 152.211968 3 Residential Slab-on-ground/Low-set Fibro 1 yes 421-2 -32.4117169 152.211952 3 Residential Slab-on-ground/Low-set Fibro 1 yes 422 -32.4115774 152.212022 2 Residential Slab-on-ground/Low-set Fibro 1 yes 423 -32.4114095 152.212031 1 Residential Slab-on-ground/Low-set Fibro 1 yes 424 -32.4112552 152.212085 3 Residential Slab-on-ground/Low-set Fibro 1 yes 425 -32.4110019 152.212117 1 Residential Slab-on-ground/Low-set Fibro 1 yes 426 -32.4108642 152.212138 2.5 Residential Slab-on-ground/Low-set Brick 1 yes 427 -32.4105388 152.212223 14 Residential High-set Fibro 1 yes 428 -32.4103301 152.211269 3 Residential Slab-on-ground/Low-set Fibro 1 yes 429 -32.4106735 152.210918 2 Residential Slab-on-ground/Low-set Fibro 1 no 430 -32.4107984 152.2109 1 Residential Slab-on-ground/Low-set Fibro 1 yes 431 -32.4109317 152.210867 4 Residential Slab-on-ground/Low-set Fibro 1 yes 432 -32.4111472 152.210872 4 Residential Slab-on-ground/Low-set Fibro 1 yes 433 -32.4112926 152.210842 5 Residential Slab-on-ground/Low-set Fibro 1 yes 434 -32.4114948 152.210777 7 Residential Slab-on-ground/Low-set Fibro 1 yes
MHL2789 – B12 © Crown 2021 Classification: Release by consent Unique ID Latitude Longitude Number of steps from ground level to floor level Property Type Construction Type Property Material Number of storeys Front door visible from road during visit? Commercial/ Industrial Building Damage Risk Category Comments 435 -32.4121025 152.210776 5 Residential High-set Fibro 1 yes 436 -32.412113 152.211062 3 Residential Slab-on-ground/Low-set Timber 1 yes 437 -32.4121577 152.21144 0 Residential Slab-on-ground/Low-set Fibro,Brick 2 yes 438 -32.4121907 152.211607 5 Residential Slab-on-ground/Low-set Fibro 1 no Front door and the number steps are not visible 439 -32.4123232 152.211312 3.5 Commercial Slab-on-ground/Low-set Brick 1 yes Low Police station. From front 440 -32.4122833 152.210831 6 Residential Slab-on-ground/Low-set Brick 1 no 441 -32.4102292 152.210372 3 Residential Slab-on-ground/Low-set Fibro 1 yes 442 -32.4102442 152.210557 3 Residential Slab-on-ground/Low-set Fibro 1 yes 443 -32.4106713 152.210676 2 Residential Slab-on-ground/Low-set Fibro 1 yes 444 -32.410791 152.210642 1 Residential Slab-on-ground/Low-set Fibro 1 yes 445 -32.4109354 152.210583 1.5 Residential Slab-on-ground/Low-set Brick 1 yes 446 -32.4111086 152.210534 3 Residential Slab-on-ground/Low-set Fibro 1 yes 447 -32.4112312 152.210552 1.5 Residential Slab-on-ground/Low-set Fibro 1 yes 448 -32.4114808 152.210516 2.5 Residential Slab-on-ground/Low-set Fibro 1 yes From northeast corner 449 -32.411666 152.210479 4 Residential Slab-on-ground/Low-set Fibro 1 yes 450 -32.4121698 152.210314 1.5 Commercial Slab-on-ground/Low-set Fibro 1 yes Low Robyn cafe 451 -32.4121026 152.210047 2 Residential Slab-on-ground/Low-set Fibro 1 no 452 -32.4119674 152.210226 5 Residential Slab-on-ground/Low-set Brick 1 no 453 -32.4119179 152.209965 7 Residential Slab-on-ground/Low-set Brick 1 yes 454-1 -32.4118266 152.209597 10 Commercial Slab-on-ground/Low-set Fibro 1 yes Low Bulahdelah school of art 454-2 -32.4115838 152.209236 9 Commercial Slab-on-ground/Low-set Fibro 1 yes Low Bulahdelah school of art 456 -32.4114899 152.209264 9 Commercial Slab-on-ground/Low-set Brick 1 yes Low Yoga studio, men shed 457 -32.4110509 152.209371 6 Residential Slab-on-ground/Low-set Fibro 1 yes 458 -32.4108085 152.209402 6 Residential Slab-on-ground/Low-set Fibro 1 yes 459 -32.4106988 152.209434 5 Residential Slab-on-ground/Low-set Fibro 1 yes 460 -32.4104824 152.209449 10 Residential High-set Fibro,Brick 1 yes 461 -32.4103475 152.209561 1 Residential Slab-on-ground/Low-set Fibro 1 yes 462 -32.4100719 152.209117 4 Residential Slab-on-ground/Low-set Fibro,Brick 1 yes 463 -32.4104331 152.209258 1 Residential Slab-on-ground/Low-set Brick 1 yes 464 -32.4106171 152.209219 3 Residential Slab-on-ground/Low-set Brick 1 yes 465 -32.4107564 152.209193 3 Residential Slab-on-ground/Low-set Fibro 1 yes 466 -32.410972 152.209152 3 Residential Slab-on-ground/Low-set Fibro 1 yes 467 -32.4117073 152.208613 3 Commercial Slab-on-ground/Low-set Fibro 1 yes Low Country Women’s Association 468 -32.4115022 152.207906 2 Residential Slab-on-ground/Low-set Fibro 1 yes 469 -32.4114707 152.207824 3 Residential Slab-on-ground/Low-set Fibro 1 yes 470 -32.4111224 152.207895 17 Residential High-set Fibro 1 no Estimated 472 -32.4115283 152.207551 6 Residential Slab-on-ground/Low-set Fibro 1 yes Church 473 -32.4117852 152.20746 0 Commercial Slab-on-ground/Low-set Brick 1 yes Low Rural transaction centre/Library 474 -32.4118693 152.207479 1 Residential Slab-on-ground/Low-set Fibro 1 yes
MHL2789 – B13 © Crown 2021 Classification: Release by consent Unique ID Latitude Longitude Number of steps from ground level to floor level Property Type Construction Type Property Material Number of storeys Front door visible from road during visit? Commercial/ Industrial Building Damage Risk Category Comments 475 -32.4119436 152.207477 0 Commercial Slab-on-ground/Low-set Brick 2 yes Medium Salty Lane, Fishing and Leisure 476 -32.4119741 152.207507 1 Commercial Slab-on-ground/Low-set Brick 2 yes Medium Bulahdelah Bakery 477 -32.4120526 152.207504 0 Commercial Slab-on-ground/Low-set Brick 2 yes Medium Barry Bros. Butchery 478 -32.4122477 152.207469 0 Commercial Slab-on-ground/Low-set Brick 1 yes High Bulahdelah Pharmacy, long shade in front of the building. 478 -32.4120741 152.207506 0 Commercial Slab-on-ground/Low-set Brick 1 yes High Pharmacy 479 -32.4121327 152.207481 1 Commercial Slab-on-ground/Low-set Brick 1 yes Low Cafe. Long shade above. 481 -32.4122887 152.207429 2 Residential Slab-on-ground/Low-set Fibro 1 no 482 -32.4123565 152.207427 1 Commercial Slab-on-ground/Low-set Brick 1 yes Low Hair Beauty Studio 483 -32.4125107 152.207358 1 Commercial Slab-on-ground/Low-set Brick 1 yes Medium Newsagent, awning 484 -32.4125354 152.207353 0 Commercial Slab-on-ground/Low-set Brick 2 yes High Bottle shop 485 -32.4126702 152.207362 1 Commercial Slab-on-ground/Low-set Brick 2 yes Low Plough inn hotel 486 -32.4119182 152.20773 2 Commercial Slab-on-ground/Low-set Brick,Fibro 1 yes Low 2 from top, 6 from side, real estate 487 -32.4119993 152.207703 1 Commercial Slab-on-ground/Low-set Brick 1 yes Low Education and learning support, 1 or 0 steps 488 -32.4121888 152.207689 1.5 Commercial Slab-on-ground/Low-set Brick 1 yes Low Real estate, awning 489 -32.4122496 152.207658 2 Residential Slab-on-ground/Low-set Brick 1 yes Café, awning 490 -32.4125298 152.207702 1 Commercial Slab-on-ground/Low-set Fibro 1 yes Low Cafe 491 -32.4125728 152.207605 0 Commercial Slab-on-ground/Low-set Brick 1 yes High IGA, awning 492 -32.4128041 152.207614 2 Residential Slab-on-ground/Low-set Fibro 1 yes Post office 493 -32.4129542 152.207565 3 Commercial Slab-on-ground/Low-set Brick 1 yes Medium Oliver's, awning 494 -32.4129309 152.208126 5 Commercial Slab-on-ground/Low-set Brick 1 yes Medium Bulahdelah telephone exchange, 5 steps from side street 495 -32.4131108 152.208314 3 Residential High-set Fibro 1 yes 496 -32.4128467 152.208813 5 Residential Slab-on-ground/Low-set Fibro 1 yes 497 -32.4126424 152.208838 6 Residential Slab-on-ground/Low-set Fibro 1 yes 498 -32.41249 152.208869 8 Residential Slab-on-ground/Low-set Fibro 1 yes 499 -32.4123025 152.20892 2 Residential Slab-on-ground/Low-set Fibro 1 yes 500 -32.41269 152.209138 0 Commercial Slab-on-ground/Low-set Fibro 1 yes Low Visitor centre, 0 from kerb 501 -32.4124109 152.210116 1 Commercial Slab-on-ground/Low-set Brick 1 yes Low Mount view motel 502 -32.4139023 152.208057 0 Residential Slab-on-ground/Low-set Fibro 1 yes 503 -32.4138341 152.20827 1 Residential Slab-on-ground/Low-set Brick 2 yes 504 -32.4136637 152.208673 4 Residential Slab-on-ground/Low-set Sheetpile 1 yes The building at the corner is 5 steps above ground 505 -32.4135123 152.208739 0 Residential High-set Brick 2 no 506 -32.4134066 152.208739 0 Commercial Slab-on-ground/Low-set Sheetpile 1 yes Low 507 -32.4135425 152.209001 0 Commercial Slab-on-ground/Low-set Sheetpile 1 yes Medium 508 -32.4137055 152.208811 0 Commercial Slab-on-ground/Low-set Brick 2 yes Medium
MHL2789 – B14 © Crown 2021 Classification: Release by consent Unique ID Latitude Longitude Number of steps from ground level to floor level Property Type Construction Type Property Material Number of storeys Front door visible from road during visit? Commercial/ Industrial Building Damage Risk Category Comments 509 -32.4132521 152.210236 3 Residential Slab-on-ground/Low-set Fibro 1 yes 510 -32.4133954 152.210198 3 Residential Slab-on-ground/Low-set Fibro 1 yes 511 -32.4136873 152.210189 2 Residential Slab-on-ground/Low-set Fibro 1 yes 512 -32.4139402 152.210051 4 Residential Slab-on-ground/Low-set Fibro 1 yes 513 -32.413908 152.210366 0 Commercial Slab-on-ground/Low-set Fibro 1 yes Low 515 -32.4133625 152.213701 4 Residential Slab-on-ground/Low-set Fibro 1 yes 516 -32.4141189 152.213573 0 Industrial Slab-on-ground/Low-set Fibro 1 yes Low 517 -32.4148522 152.214157 0 Residential Slab-on-ground/Low-set Fibro 1 yes From top 518 -32.4146798 152.213534 2 Residential Slab-on-ground/Low-set Fibro 1 yes 519 -32.4146941 152.2133 3 Residential Slab-on-ground/Low-set Fibro 1 yes No flooding 520 -32.4156458 152.21412 4 Residential Slab-on-ground/Low-set Fibro 2 yes 521 -32.4158365 152.214181 0 Residential Slab-on-ground/Low-set Brick 1 yes From Top of hill at driveway 522 -32.4154291 152.212907 4 Residential Slab-on-ground/Low-set Fibro 1 yes The building in the back is about 1 step above ground 523 -32.4150627 152.212831 2 Residential Slab-on-ground/Low-set Fibro 1 no Too far from Rd 524 -32.4151652 152.212773 1 Residential Slab-on-ground/Low-set Fibro 1 yes 525 -32.4152187 152.21282 3 Residential Slab-on-ground/Low-set Fibro 1 yes From the front 526 -32.4154297 152.212827 0 Residential Slab-on-ground/Low-set Brick 1 yes From top of slope (first floor) 527 -32.416302 152.212624 3 Residential Slab-on-ground/Low-set Brick 1 yes 528 -32.4168508 152.212659 11 Residential High-set Brick 2 yes Water is flowing underneath this property and popping up the cracks of the ground floor 529 -32.4171957 152.212162 0 Residential Slab-on-ground/Low-set Fibro 1 yes 530 -32.4163919 152.211355 1 Residential Slab-on-ground/Low-set Fibro 1 yes 531 -32.4161745 152.211361 2 Residential Slab-on-ground/Low-set Fibro 1 yes From front 532 -32.4158434 152.211453 2 Residential Slab-on-ground/Low-set Fibro 1 yes 533 -32.4155827 152.211475 5 Residential Slab-on-ground/Low-set Brick 1 yes 534 -32.4152544 152.211513 3 Residential Slab-on-ground/Low-set Brick 1 yes 535 -32.4148808 152.211597 2 Residential Slab-on-ground/Low-set Brick 1 yes 536 -32.4146141 152.211684 4 Residential Slab-on-ground/Low-set Fibro 1 yes 537 -32.4145132 152.212171 1 Residential Slab-on-ground/Low-set Brick 1 yes 538 -32.4146591 152.212535 1 Residential Slab-on-ground/Low-set Brick 1 yes 539 -32.4144236 152.211265 2 Residential Slab-on-ground/Low-set Brick 2 yes 540 -32.4144169 152.211155 3 Residential Slab-on-ground/Low-set Fibro 1 yes 541 -32.4143508 152.210965 5.5 Residential Slab-on-ground/Low-set Brick 1 yes 542 -32.4143021 152.210964 Residential Slab-on-ground/Low-set Fibro,Sheetpile 1 yes Varying Number of Steps 542 -32.4143311 152.210723 0 Residential Slab-on-ground/Low-set Fibro 1 yes 2 steps above ground at the front door and zero steps at the side door 544 -32.4146498 152.210127 3 Residential Slab-on-ground/Low-set Fibro 1 yes 545 -32.4149167 152.210039 0 Residential Slab-on-ground/Low-set Fibro 1 yes
MHL2789 – B15 © Crown 2021 Classification: Release by consent Unique ID Latitude Longitude Number of steps from ground level to floor level Property Type Construction Type Property Material Number of storeys Front door visible from road during visit? Commercial/ Industrial Building Damage Risk Category Comments 546 -32.4151044 152.210047 0 Residential Slab-on-ground/Low-set Fibro,Brick 2 yes 546 -32.4154747 152.210122 0 Residential Slab-on-ground/Low-set Brick 2 yes 547 -32.4151014 152.210034 3 Residential Slab-on-ground/Low-set Fibro 1 yes 549 -32.4151966 152.211411 5 Residential Slab-on-ground/Low-set Fibro 1 yes 550 -32.4154272 152.211367 3 Residential Slab-on-ground/Low-set Brick 1 yes 551 -32.4155895 152.211304 5 Residential Slab-on-ground/Low-set Brick 1 yes 552 -32.4157423 152.211266 5 Residential Slab-on-ground/Low-set Fibro 2 yes 553 -32.4159515 152.211188 5 Residential Slab-on-ground/Low-set Fibro 1 yes Careful with slope 554 -32.4164292 152.209442 0 Industrial Slab-on-ground/Low-set Sheetpile 1 yes Low 555 -32.4158808 152.209773 0 Residential Slab-on-ground/Low-set Fibro 1 yes 556 -32.4155941 152.209753 6 Residential Slab-on-ground/Low-set Brick 1 yes 557 -32.4148915 152.209451 0 Residential Slab-on-ground/Low-set Brick 1 yes 558 -32.4143572 152.209048 2 Commercial Slab-on-ground/Low-set Brick 1 yes Low Courthouse museum 559 -32.4150267 152.208432 Residential Slab-on-ground/Low-set Brick 1 yes Varying Number of Steps 560 -32.4150712 152.20846 0 Residential Slab-on-ground/Low-set Brick 1 yes From top of hill 561 -32.4151985 152.208479 0 Residential High-set Timber 1 yes 0 from top of hill 562 -32.4175863 152.212782 0 Residential Slab-on-ground/Low-set Brick 1 yes 563 -32.4182712 152.212439 0 Residential Slab-on-ground/Low-set Brick 1 yes 564 -32.4160033 152.20845 2.5 Residential Slab-on-ground/Low-set Brick 1 yes 565 -32.4004878 152.210283 1 Residential Slab-on-ground/Low-set Sheetpile 1 yes 566 -32.4049731 152.210183 0 Commercial Slab-on-ground/Low-set Brick 1 yes Low 567 -32.4050473 152.210292 0 Commercial Slab-on-ground/Low-set Brick 1 yes Low Aged care 568 -32.3930779 152.221321 3 Commercial Slab-on-ground/Low-set Brick 1 yes Low Golf Club 569 -32.4110022 152.20657 5 Commercial Slab-on-ground/Low-set Fibro 1 yes Low 570 -32.3832493 152.208082 0 Industrial Slab-on-ground/Low-set Fibro 1 yes Low 571 -32.3813067 152.212056 10 Residential Slab-on-ground/Low-set Fibro 1 yes Top of the hill 572 -32.3809271 152.211419 5 Residential Slab-on-ground/Low-set Fibro 1 yes 573 -32.3817519 152.213414 1 Residential Slab-on-ground/Low-set Brick 1 yes 574 -32.3816203 152.212662 5 Residential Slab-on-ground/Low-set Fibro 1 yes 575 -32.3816569 152.214713 3 Residential Slab-on-ground/Low-set Fibro 1 yes 576 -32.3817676 152.213907 5 Residential Slab-on-ground/Low-set Fibro 1 yes 577 -32.3815721 152.215314 2 Residential Slab-on-ground/Low-set Brick 1 yes 578 -32.3816979 152.214502 5 Residential Slab-on-ground/Low-set Fibro 1 yes 579 -32.3772467 152.206003 1 Residential Slab-on-ground/Low-set Fibro 1 yes 580 -32.3783595 152.205989 1 Residential Slab-on-ground/Low-set Brick 1 yes 581 -32.3751065 152.206216 4 Residential Slab-on-ground/Low-set Brick 1 yes 582 -32.3764304 152.206019 3 Residential Slab-on-ground/Low-set Fibro 1 yes 583 -32.3818529 152.196391 2 Residential Slab-on-ground/Low-set Brick 1 yes 584 -32.3823353 152.196374 3 Residential Slab-on-ground/Low-set Fibro 1 yes 585 -32.3815132 152.215797 4 Residential Slab-on-ground/Low-set Fibro 1 yes 586 -32.3815291 152.215656 4 Residential Slab-on-ground/Low-set Fibro 1 yes
MHL2789 – B16 © Crown 2021 Classification: Release by consent Unique ID Latitude Longitude Number of steps from ground level to floor level Property Type Construction Type Property Material Number of storeys Front door visible from road during visit? Commercial/ Industrial Building Damage Risk Category Comments 587 -32.3785109 152.207217 1 Residential Slab-on-ground/Low-set Brick 1 yes Alley view 588 -32.3811485 152.211673 2 Residential High-set NA 1 yes 2 steps at the top 589 -32.3797276 152.210098 1 Residential Slab-on-ground/Low-set Sheetpile 1 yes 590 -32.3791058 152.207739 1 Residential Slab-on-ground/Low-set Brick 1 yes 591 -32.3814905 152.205763 0 Residential Slab-on-ground/Low-set Fibro 1 yes 592 -32.3826793 152.204726 3 Residential Slab-on-ground/Low-set Fibro 1 yes 593 -32.4284731 152.224907 4 Residential Slab-on-ground/Low-set Fibro 1 yes 594 -32.4223877 152.215343 4 Residential Slab-on-ground/Low-set Fibro 1 yes 595 -32.383364 152.209836 1 Residential Slab-on-ground/Low-set Brick 1 yes 596 -32.3832831 152.20848 3 Residential Slab-on-ground/Low-set Brick 1 yes 597 -32.3823468 152.194827 1 Residential Slab-on-ground/Low-set Fibro 1 yes 598 -32.3823387 152.202115 1 Residential Slab-on-ground/Low-set Brick 1 yes 599 -32.3958137 152.207801 3 Residential Slab-on-ground/Low-set Fibro 1 yes 600 -32.4344034 152.228019 10 Residential High-set Brick 1 yes 601 -32.431286 152.227892 5 Residential Slab-on-ground/Low-set Fibro 1 yes 602 -32.4289191 152.222715 4 Residential Slab-on-ground/Low-set Fibro 1 yes
Community Consultation Community Survey Form and Information Pack

MHL2789 – C1 © Crown 2021 Classification: Release by consent

MHL2789 – C2 © Crown 2021 Classification: Release by consent Community newsletter


MHL2789 – C3 © Crown 2021 Classification: Release by consent Community questionnaire
Community questionnaire results summary
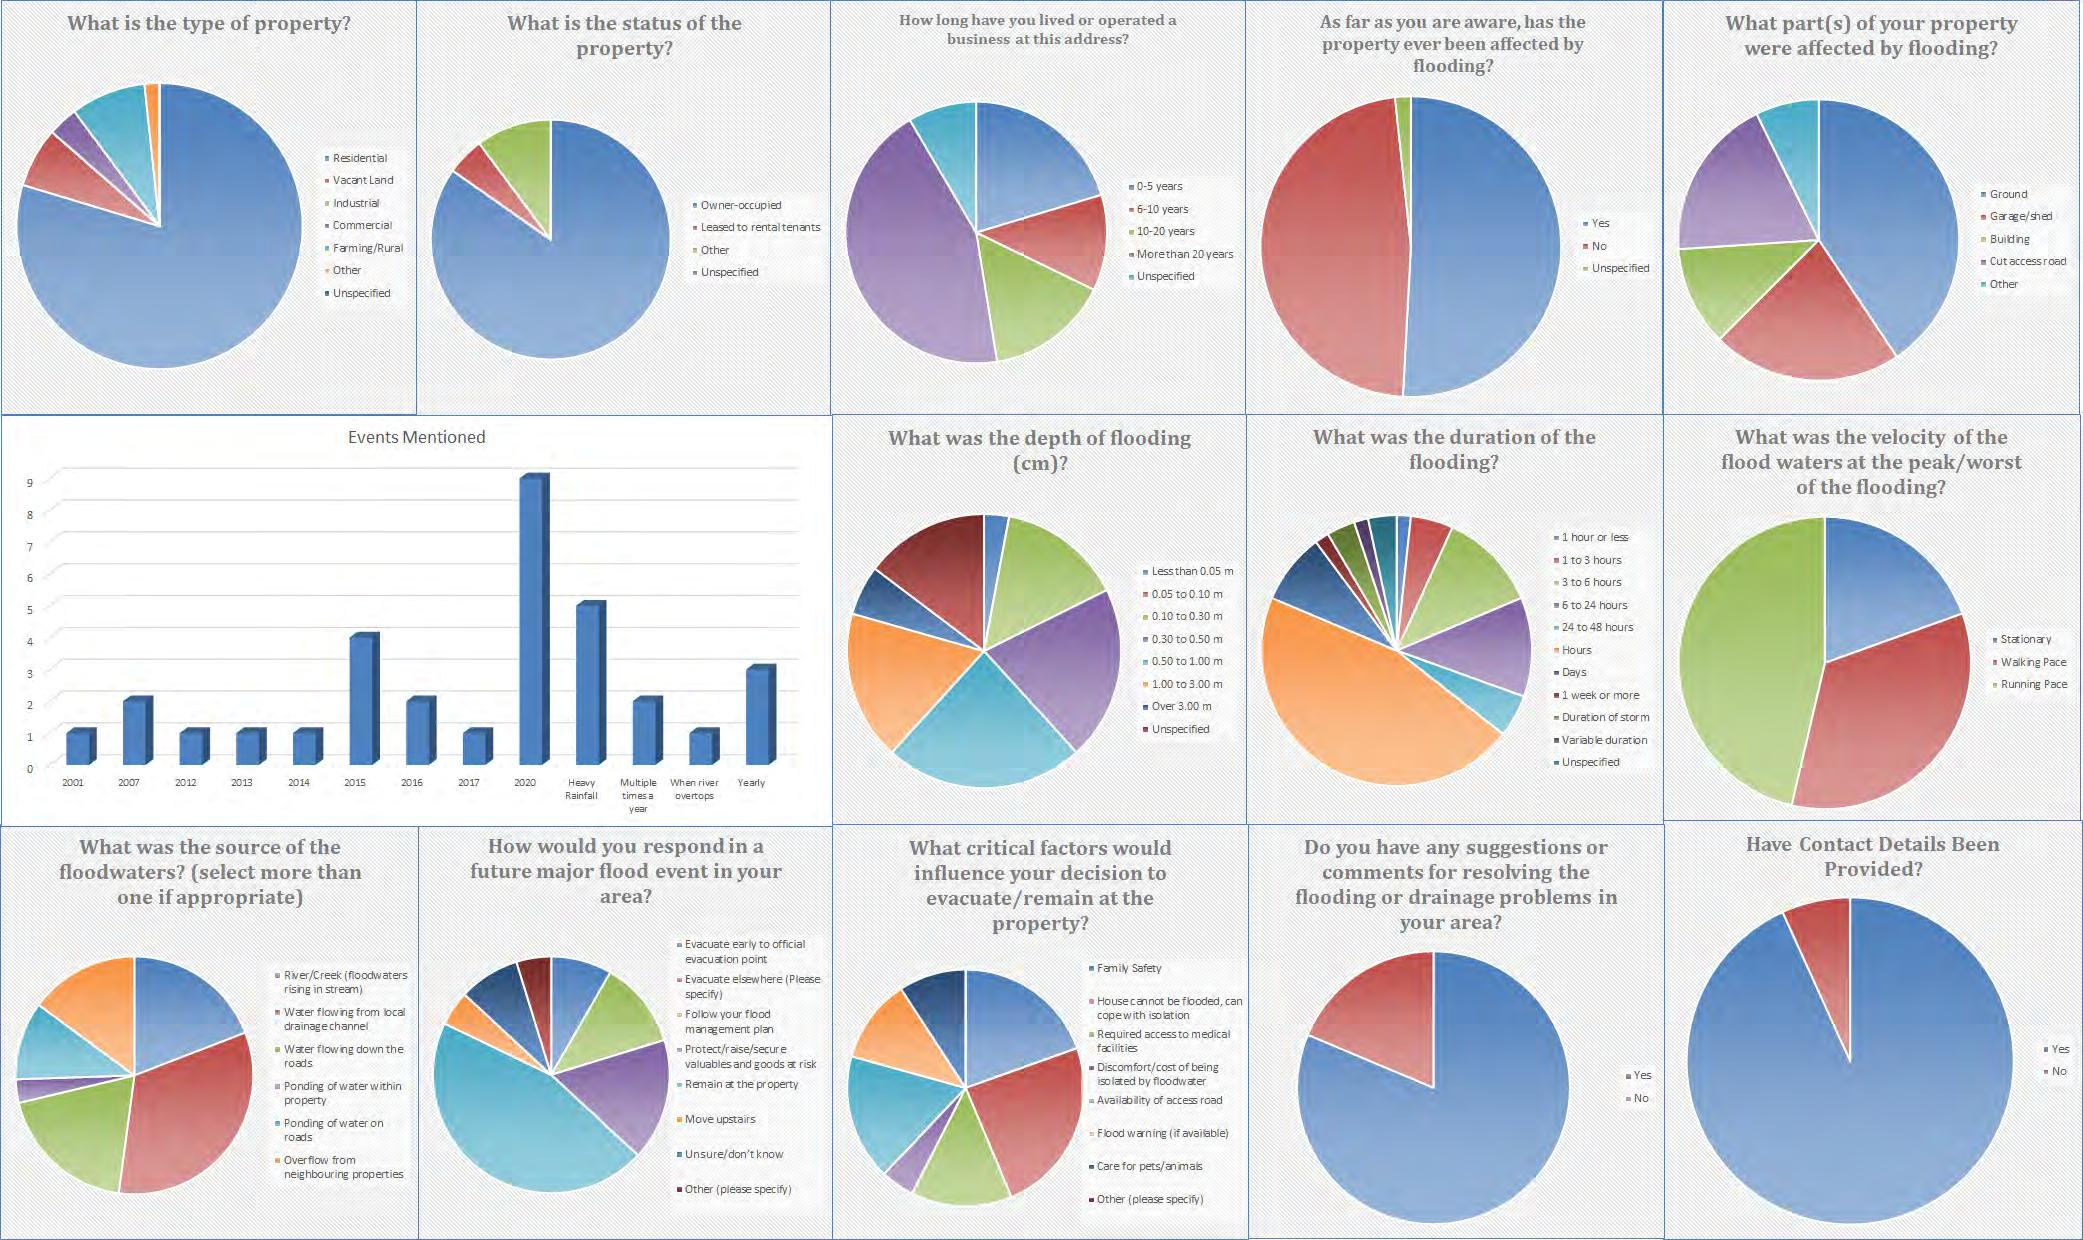
MHL2789 – C4 © Crown 2021 Classification: Release by consent
Key concerns and comments from the community questionnaires
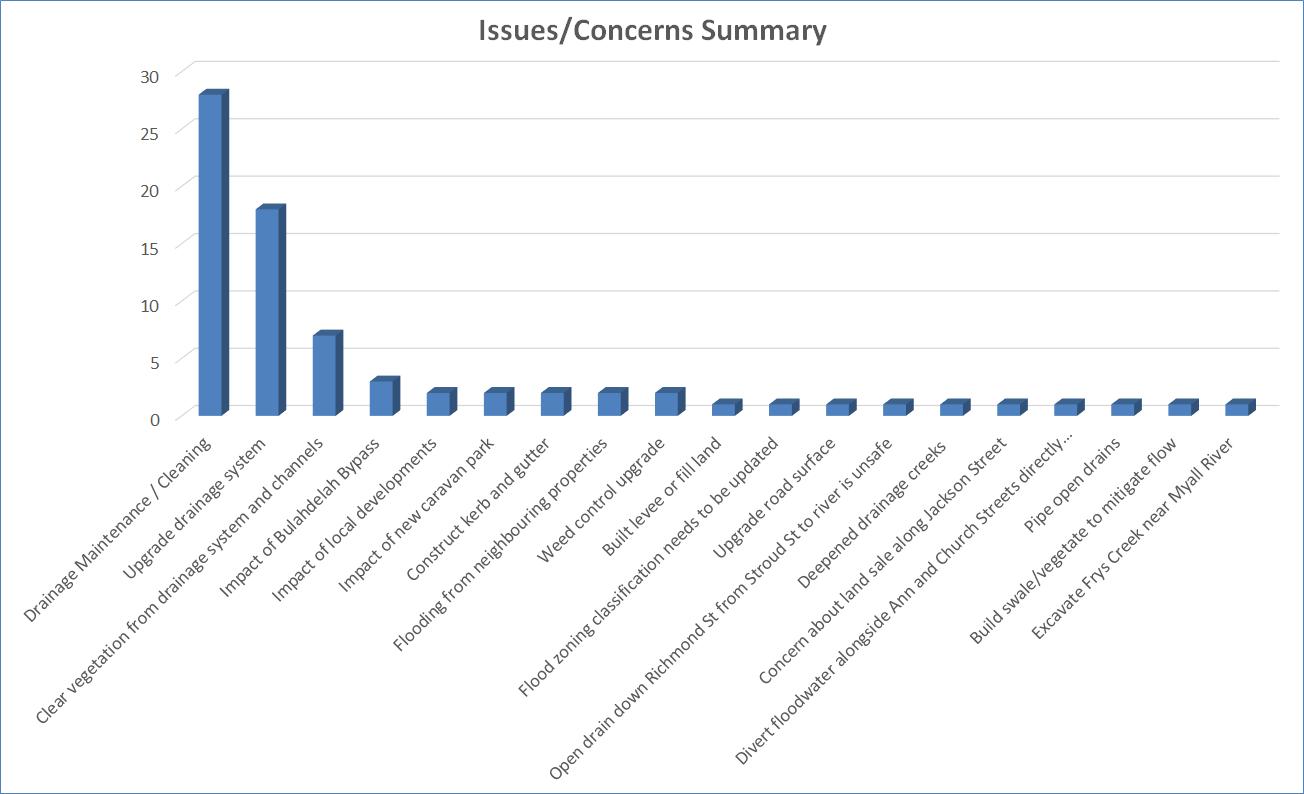
MHL2789 – C5 © Crown 2021 Classification: Release by consent
ARR 2019 Data Hub Results for Bulahdelah
Results - ARR Data Hub
[STARTTXT]
Input Data Information
[INPUTDATA]
Latitude,-32.351400
Longitude,152.160000
[END_INPUTDATA]
River Region [RIVREG]
Division,South East Coast (NSW)
River Number,9
River Name,Karuah River
[RIVREG_META]
Time Accessed,30 November 2020 02:14PM
Version,2016_v1
[END_RIVREG]
ARF Parameters [LONGARF]
Zone,SE Coast
a,0.06
b,0.361
c,0.0
d,0.317
e,8.11e-05
f,0.651
[LONGARF_META]
Time Accessed,30 November 2020 02:14PM
Version,2016_v1
[END_LONGARF]
Storm Losses [LOSSES]
ID,18945.0
Storm Initial Losses (mm),45.0
Storm Continuing Losses (mm/h),3.1
[LOSSES_META]
Time Accessed,30 November 2020 02:14PM
Version,2016_v1
[END_LOSSES]

Temporal Patterns [TP]
code,ECsouth
Label,East Coast South
[TP_META]
Time Accessed,30 November 2020 02:14PM
Version,2016_v2
[END_TP]
Areal Temporal Patterns [ATP]
code,ECsouth arealabel,East Coast South [ATP_META]
Time Accessed,30 November 2020 02:14PM
Version,2016_v2
MHL2789 – D1 © Crown 2021 Classification: Release by consent
g,0.0 h,0.0 i,0.0
(0.002),0.6 (0.002),0.8 (0.003),4.6 (0.013),7.5 (0.019)
4320 (72.0),0.0 (0.000),0.0 (0.000),0.0 (0.000),0.0 (0.000),1.8 (0.004),3.2 (0.007)
[PREBURST_META]
Time Accessed,30 November 2020 02:14PM
Version,2018_v1
Note,Preburst interpolation methods for catchment wide preburst has been slightly altered. Point values remain unchanged.
[END_PREBURST]
10% Preburst Depths
[PREBURST10]
min (h)\AEP(%),50,20,10,5,2,1
60 (1.0),0.0 (0.000),0.0 (0.000),0.0 (0.000),0.0 (0.000),0.0 (0.000),0.0 (0.000)
90 (1.5),0.0 (0.000),0.0 (0.000),0.0 (0.000),0.0 (0.000),0.0 (0.000),0.0 (0.000)
120 (2.0),0.0 (0.000),0.0 (0.000),0.0 (0.000),0.0 (0.000),0.0 (0.000),0.0 (0.000)
180 (3.0),0.0 (0.000),0.0 (0.000),0.0 (0.000),0.0 (0.000),0.0 (0.000),0.0 (0.000)
360 (6.0),0.0 (0.000),0.0 (0.000),0.0 (0.000),0.0 (0.000),0.0 (0.000),0.0 (0.000)
720 (12.0),0.0 (0.000),0.0 (0.000),0.0 (0.000),0.0 (0.000),0.0 (0.000),0.0 (0.000)
1080 (18.0),0.0 (0.000),0.0 (0.000),0.0 (0.000),0.0 (0.000),0.0 (0.000),0.0 (0.000)
1440 (24.0),0.0 (0.000),0.0 (0.000),0.0 (0.000),0.0 (0.000),0.0 (0.000),0.0 (0.000)
2160 (36.0),0.0 (0.000),0.0 (0.000),0.0 (0.000),0.0 (0.000),0.0 (0.000),0.0 (0.000)
2880 (48.0),0.0 (0.000),0.0 (0.000),0.0 (0.000),0.0 (0.000),0.0 (0.000),0.0 (0.000)
4320 (72.0),0.0 (0.000),0.0 (0.000),0.0 (0.000),0.0 (0.000),0.0 (0.000),0.0 (0.000)
[PREBURST10_META]
Time Accessed,30 November 2020 02:14PM
Version,2018_v1
Note,Preburst interpolation methods for catchment wide preburst has been slightly altered. Point values remain unchanged.
[END_PREBURST10]
25% Preburst Depths [PREBURST25]
min (h)\AEP(%),50,20,10,5,2,1
60 (1.0),0.0 (0.000),0.0 (0.000),0.0
Time Accessed,30 November 2020 02:14PM
Version,2018_v1
Note,Preburst interpolation methods for catchment wide preburst has been slightly altered. Point values remain unchanged.
[END_PREBURST25]
75% Preburst Depths [PREBURST75]
MHL2789 – D2 © Crown 2021 Classification: Release by consent [END_ATP] Median Preburst Depths and Ratios [PREBURST] min (h)\AEP(%),50,20,10,5,2,1 60 (1.0),3.5 (0.115),5.3 (0.121),6.5 (0.121),7.7 (0.120),3.3 (0.042),0.0 (0.000) 90 (1.5),2.0 (0.057),2.8 (0.056),3.4 (0.054),3.9 (0.052),4.7 (0.052),5.3 (0.051) 120 (2.0),1.7 (0.043),3.6 (0.065),4.9 (0.072),6.2 (0.076),5.4 (0.055),4.9 (0.043) 180 (3.0),2.7 (0.060),6.9 (0.107),9.7 (0.123),12.3 (0.132),10.1 (0.089),8.5 (0.065) 360 (6.0),8.2 (0.136),19.1 (0.225),26.3 (0.256),33.2 (0.274),31.0 (0.211),29.4 (0.175) 720 (12.0),15.1 (0.183),21.9 (0.192),26.5 (0.192),30.8 (0.190),26.7 (0.136),23.7 (0.106) 1080 (18.0),8.4 (0.084),14.2 (0.103),18.0 (0.109),21.7 (0.112),27.7 (0.119),32.3 (0.121) 1440 (24.0),1.8 (0.016),6.9 (0.044),10.2 (0.055),13.4 (0.061),21.6 (0.081),27.8 (0.092) 2160 (36.0),0.8 (0.006),5.5 (0.029),8.6 (0.038),11.5 (0.044),16.7 (0.053),20.6 (0.057) 2880 (48.0),0.0 (0.000),0.3
(0.000),0.0 (0.000),0.0 (0.000),0.0 (0.000) 90 (1.5),0.0 (0.000),0.0 (0.000),0.0 (0.000),0.0 (0.000),0.0 (0.000),0.0 (0.000) 120 (2.0),0.0 (0.000),0.0 (0.000),0.0 (0.000),0.0 (0.000),0.0 (0.000),0.0 (0.000) 180 (3.0),0.0 (0.000),0.0 (0.000),0.0 (0.000),0.0 (0.000),0.0 (0.000),0.0 (0.000) 360 (6.0),0.1 (0.001),0.6 (0.007),0.9 (0.009),1.2 (0.010),0.5 (0.004),0.0 (0.000) 720 (12.0),0.3 (0.004),0.4 (0.004),0.5 (0.004),0.6 (0.003),0.2 (0.001),0.0 (0.000) 1080 (18.0),0.2 (0.002),0.2 (0.002),0.2 (0.001),0.2 (0.001),1.6 (0.007),2.7 (0.010) 1440 (24.0),0.0 (0.000),0.0 (0.000),0.0 (0.000),0.0 (0.000),0.7 (0.003),1.2 (0.004) 2160 (36.0),0.0 (0.000),0.0 (0.000),0.0 (0.000),0.0 (0.000),0.0 (0.000),0.0 (0.000) 2880 (48.0),0.0 (0.000),0.0 (0.000),0.0 (0.000),0.0 (0.000),0.0 (0.000),0.0 (0.000) 4320 (72.0),0.0 (0.000),0.0 (0.000),0.0 (0.000),0.0 (0.000),0.0 (0.000),0.0 (0.000) [PREBURST25_META]
Note,Preburst interpolation methods for catchment wide preburst has been slightly altered. Point values remain unchanged.
[PREBURST90_META]
Time Accessed,30 November 2020 02:14PM
Version,2018_v1
Note,Preburst interpolation methods for catchment wide preburst has been slightly altered. Point values remain unchanged.
[END_PREBURST90]
Interim Climate Change Factors [CCF]
,RCP 4.5,RCP6,RCP 8.5
2030,0.869 (4.3%),0.783 (3.9%),0.983 (4.9%)
2040,1.057 (5.3%),1.014 (5.1%),1.349 (6.8%)
2050,1.272 (6.4%),1.236 (6.2%),1.773 (9.0%)
2060,1.488 (7.5%),1.458 (7.4%),2.237 (11.5%)
2070,1.676 (8.5%),1.691 (8.6%),2.722 (14.2%)
2080,1.810 (9.2%),1.944 (9.9%),3.209 (16.9%)
2090,1.862 (9.5%),2.227 (11.5%),3.679 (19.7%)
[CCF_META]
Time Accessed,30 November 2020 02:14PM
Version,2019_v1
Note,ARR recommends the use of RCP4.5 and RCP 8.5 values. These have been updated to the values that can be found on the climate change in Australia website.
[END_CCF]
Probability Neutral Burst Initial Loss
[BURSTIL]
min (h)\AEP(%),50.0,20.0,10.0,5.0,2.0,1.0
60 (1.0),29.3,15.7,14.1,13.7,14.2,12.3
90 (1.5),30.9,18.5,17.6,17.3,14.4,8.8
120 (2.0),27.8,16.9,15.8,16.1,15.0,11.7
180 (3.0),30.2,18.9,16.1,14.8,12.8,9.2
360 (6.0),24.0,16.4,15.4,13.0,11.5,6.1
720 (12.0),25.1,18.4,16.7,16.6,16.9,9.5
MHL2789 – D3 © Crown 2021 Classification: Release by consent min (h)\AEP(%),50,20,10,5,2,1 60 (1.0),22.9 (0.743),29.6 (0.670),34.0 (0.631),38.3 (0.597),32.5 (0.415),28.2 (0.313) 90 (1.5),19.6 (0.553),25.1 (0.495),28.8 (0.465),32.3 (0.439),56.1 (0.625),74.0 (0.717) 120 (2.0),39.9 (1.019),42.9 (0.767),44.9 (0.658),46.8 (0.577),48.9 (0.495),50.6 (0.445) 180 (3.0),19.4 (0.425),39.9 (0.618),53.6 (0.681),66.7 (0.715),81.7 (0.719),93.0 (0.713) 360 (6.0),40.1 (0.664),60.0 (0.707),73.1 (0.713),85.8 (0.709),110.8 (0.753),129.6 (0.770) 720 (12.0),44.8 (0.543),55.2 (0.482),62.1 (0.451),68.8 (0.425),74.2 (0.378),78.2 (0.349) 1080 (18.0),32.3 (0.325),44.9 (0.326),53.2 (0.322),61.2 (0.317),75.1 (0.321),85.5 (0.320) 1440 (24.0),17.5 (0.155),35.8 (0.229),47.9 (0.255),59.5 (0.272),67.3 (0.253),73.2 (0.241) 2160 (36.0),13.1 (0.097),28.2 (0.151),38.2 (0.171),47.8 (0.184),55.8 (0.177),61.8 (0.171) 2880 (48.0),6.3 (0.042),12.1 (0.058),16.0 (0.064),19.7 (0.068),39.8 (0.112),54.8 (0.135) 4320 (72.0),0.3 (0.002),4.1 (0.017),6.6 (0.023),9.0 (0.027),27.5 (0.068),41.4 (0.089) [PREBURST75_META] Time Accessed,30 November 2020 02:14PM Version,2018_v1
[END_PREBURST75]
Preburst Depths [PREBURST90] min (h)\AEP(%),50,20,10,5,2,1 60 (1.0),77.2 (2.501),106.4 (2.408),125.8 (2.331),144.3 (2.253),154.9 (1.978),162.8 (1.810) 90 (1.5),73.5 (2.074),72.7 (1.433),72.1 (1.165),71.6 (0.973),140.3 (1.562),191.9 (1.860) 120 (2.0),67.8 (1.730),92.3 (1.649),108.5 (1.590),124.1 (1.531),128.3 (1.297),131.5 (1.158) 180 (3.0),56.7 (1.245),105.6 (1.633),138.0 (1.754),169.1 (1.814),181.9 (1.600),191.5 (1.468) 360 (6.0),72.0 (1.194),103.9 (1.226),125.1 (1.219),145.3 (1.201),174.0 (1.183),195.6 (1.161) 720 (12.0),70.5 (0.854),97.8 (0.853),115.9 (0.841),133.2 (0.824),145.2 (0.741),154.1 (0.688) 1080 (18.0),66.9 (0.672),92.2 (0.670),109.0 (0.660),125.1 (0.648),143.4 (0.613),157.1 (0.588) 1440 (24.0),48.4 (0.427),83.8 (0.535),107.1 (0.571),129.6 (0.591),127.3 (0.479),125.6 (0.414) 2160 (36.0),51.9 (0.385),78.5 (0.421),96.0 (0.431),112.9 (0.434),115.9 (0.367),118.2 (0.328) 2880 (48.0),25.2 (0.168),46.0 (0.221),59.8 (0.240),73.0 (0.250),89.6 (0.253),102.1 (0.252) 4320 (72.0),9.8 (0.057),19.3 (0.081),25.5 (0.089),31.5 (0.094),58.1 (0.143),78.1 (0.168)
90%
1080 (18.0),29.1,21.8,20.4,19.5,18.4,8.9
1440 (24.0),34.8,24.9,23.3,22.0,22.7,8.0
2160 (36.0),36.9,27.2,26.5,24.3,25.3,9.4
2880 (48.0),42.5,33.9,33.1,33.7,26.1,10.6
4320 (72.0),47.2,40.6,39.4,42.8,33.7,18.2
[BURSTIL_META]
Time Accessed,30 November 2020 02:14PM
Version,2018_v1
Note,As this point is in NSW the advice provided on losses and pre-burst on the <a href="./nsw_specific">NSW Specific Tab of the ARR Data Hub</a> is to be considered. In NSW losses are derived considering a hierarchy of approaches depending on the available loss information. Probability neutral burst initial loss values for NSW are to be used in place of the standard initial loss and pre-burst as per the losses hierarchy.
[END_BURSTIL]Transformational Pre-burst Rainfall
[PREBURST_TRANS]
min (h)\AEP(%),50.0,20.0,10.0,5.0,2.0,1.0
60 (1.0),16.1,29.7,31.3,31.7,31.2,33.1
© Crown 2021
90 (1.5),14.5,26.9,27.8,28.1,31.0,36.6
120 (2.0),17.6,28.5,29.6,29.3,30.4,33.7
180 (3.0),15.2,26.5,29.3,30.6,32.6,36.2
360 (6.0),21.4,29.0,30.0,32.4,33.9,39.3
720 (12.0),20.3,27.0,28.7,28.8,28.5,35.9
1080 (18.0),16.3,23.6,25.0,25.9,27.0,36.5
1440 (24.0),10.6,20.5,22.1,23.4,22.7,37.4
2160 (36.0),8.5,18.2,18.9,21.1,20.1,36.0
2880 (48.0),2.9,11.5,12.3,11.7,19.3,34.8
4320 (72.0),0.0,4.8,6.0,2.6,11.7,27.2
[PREBURST_TRANS_META]
The tranformational pre-burst is intended for software suppliers in the NSW area and is simply the Initial Loss - Burst Initial Loss. It is not appropriate to use these values if considering a calibrated initial loss.
[END_PREBURST_TRANS]
[ENDTXT]
MHL2789 – D4
Classification: Release by consent
Calibration data and results

MHL2789 – E1 © Crown 2021 Classification: Release by consent
Marker intensity timeseries between 4pm on 28-02-2013 and 12am on 02-03-2013 at:


Upper Myall River Catchment (32.192°S, 152.118°E) – UMR
Marker intensity timeseries between 6pm on 20-04-2015 and 6am on 21-04-2015 at:
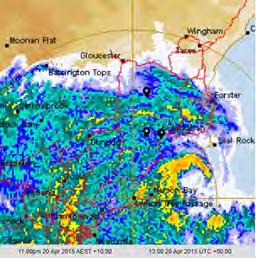
Upper Myall Catchment (32.192°S, 152.118°E) – UMC
Bulahdelah Bridge Gauge (32.413°S, 152.209°E) – BBG
Bulahdelah Bridge Gauge (32.413°S, 152.209°E) – BBG
Upper Crawford River Catchment (32.391°S, 152.128°E) – UCR
Upper Crawford River Catchment (32.391°S, 152.128°E) – UCR
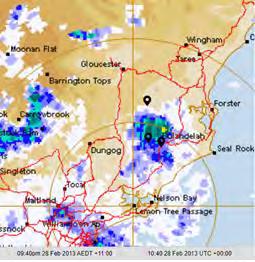
MHL2789 – E2 © Crown 2021 Classification: Release by consent
Figure E.1 Rainfall intensity summary at key location for March 2013
UMR UMR
Figure E.2 Rainfall intensity summary at key location for April 2015 storm
UCR UCR BBG BBG
Marker intensity timeseries between 12am on 18-03-2021 and 12am on 25-03-2021 at:


Upper Myall River Catchment (32.192°S, 152.118°E) – UMR
Bulahdelah Bridge Gauge (32.413°S, 152.209°E) – BBG
Upper Crawford River Catchment (32.391°S, 152.128°E) – UCR
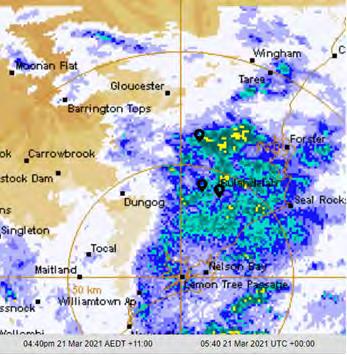
MHL2789 – E2 © Crown 2021 Classification: Release by consent
Figure E.3 Rainfall intensity summary at key location for March 2021
UMR
UCR BBG
Radar data unavailable between 10.30 pm on 28-02-2013 and 1.30 pm on 01-03-2013
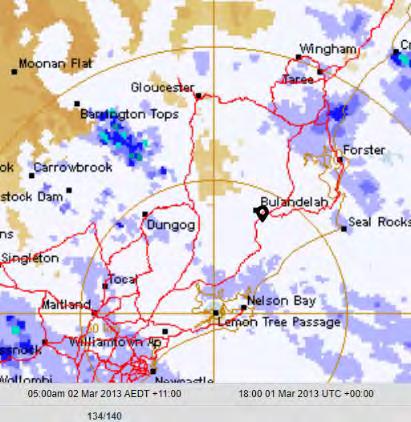
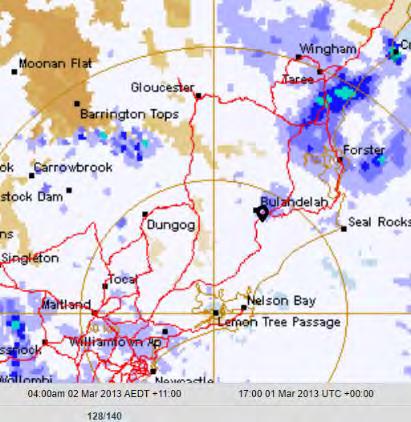
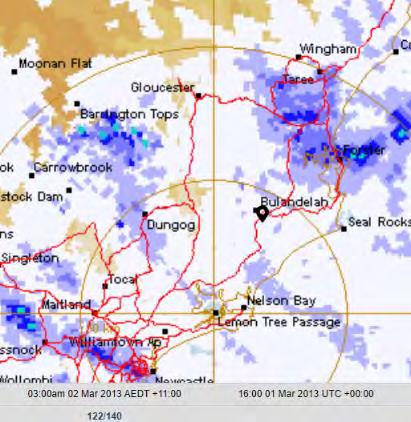
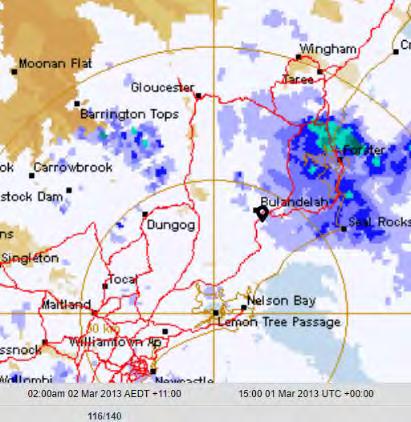
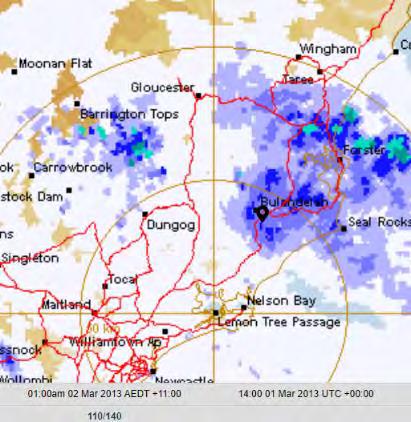
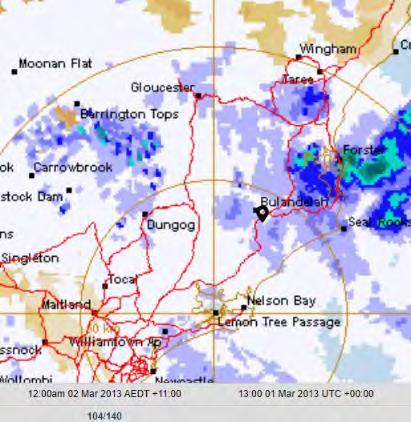
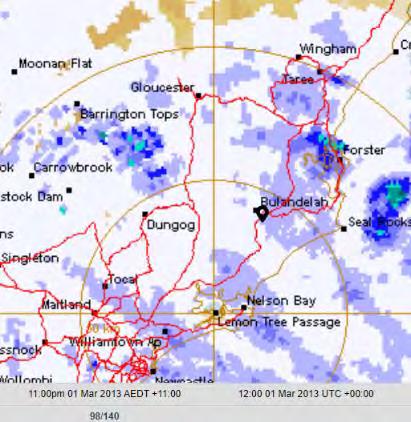
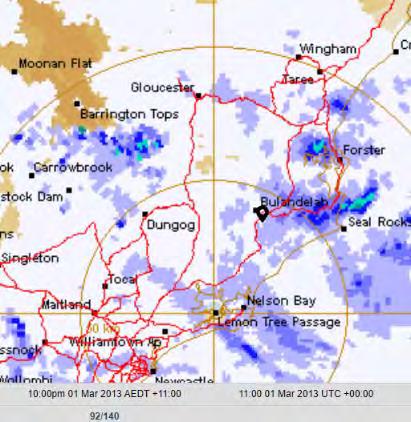
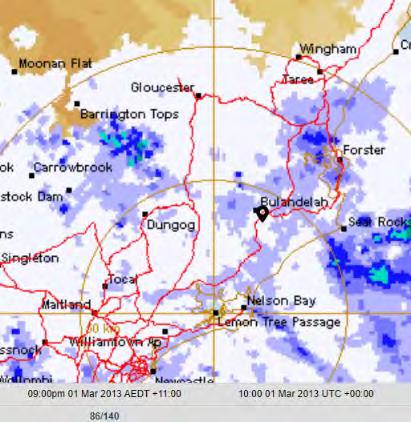
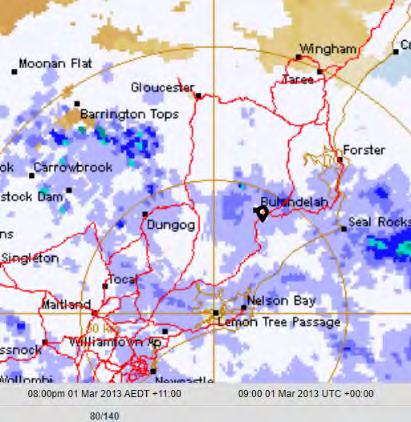
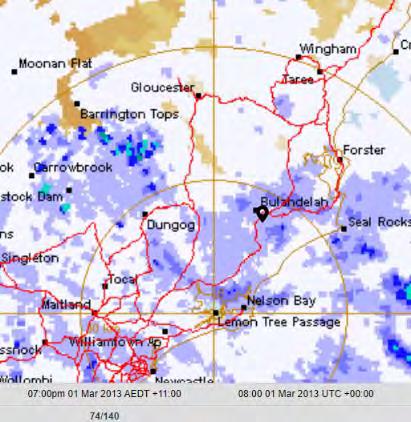
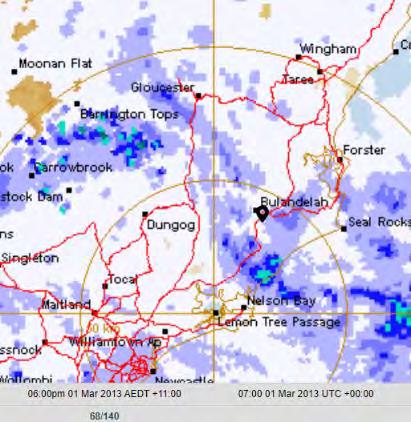
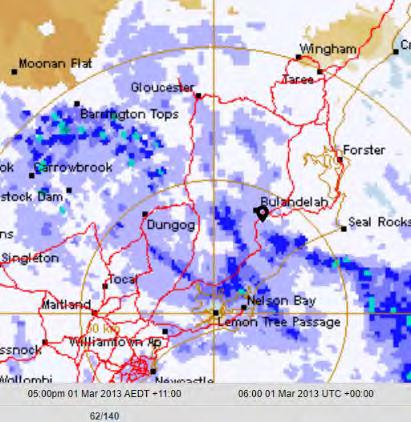
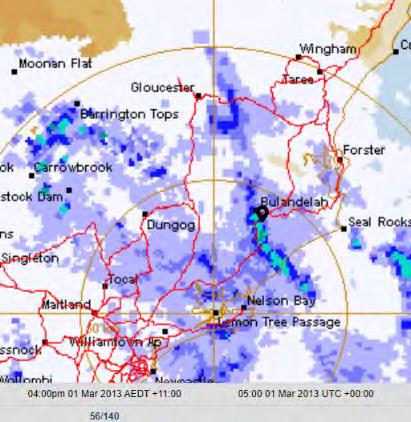
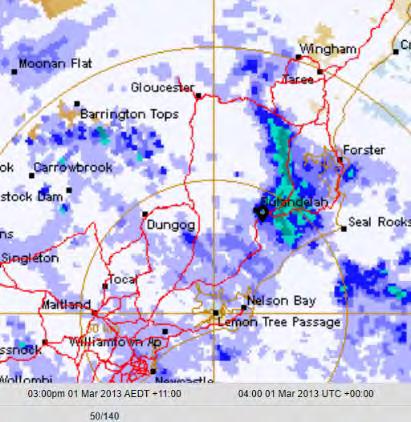
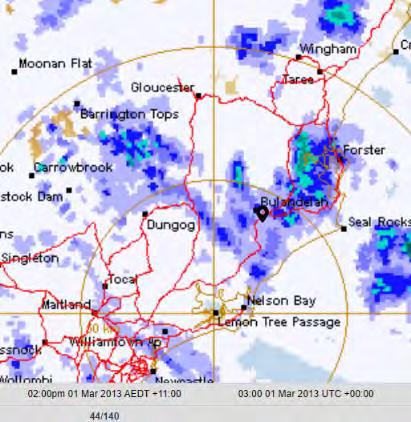
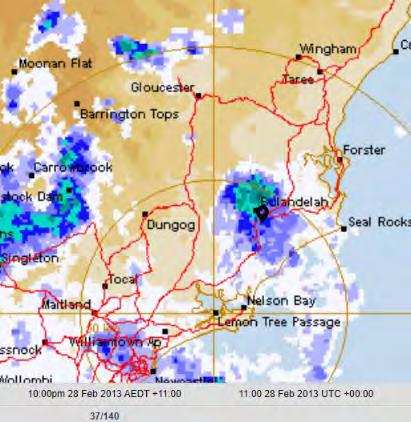
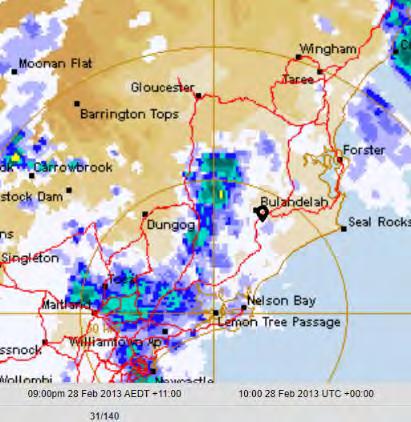
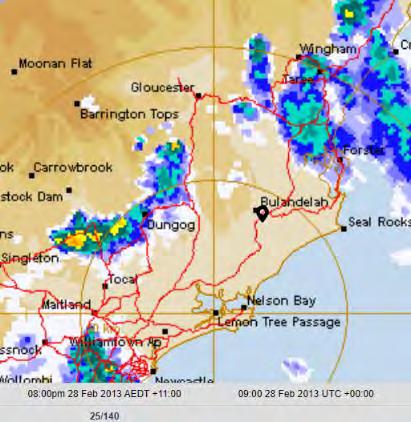
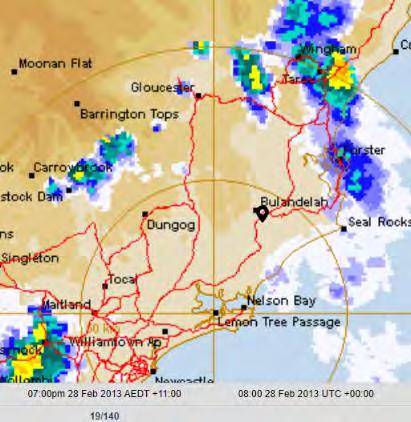
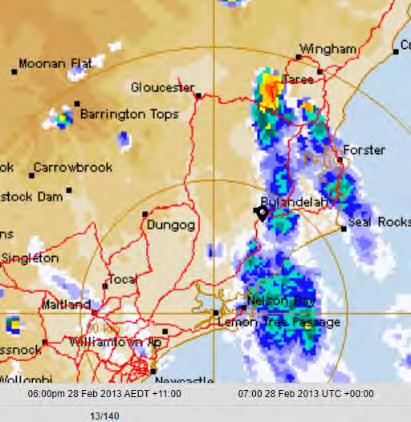
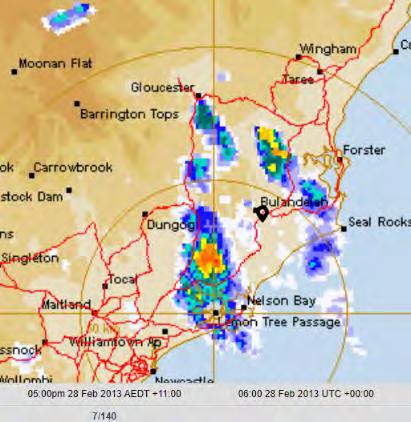
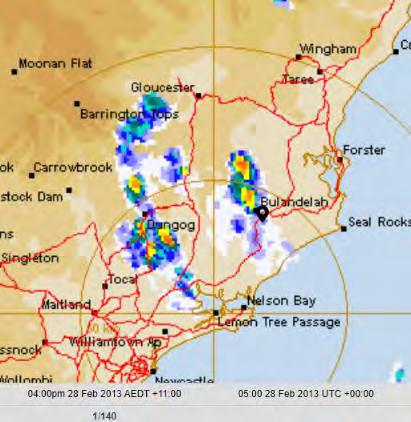
– E3 © Crown 2021 Classification: Release by consent
MHL2789
Figure E 4 – Rain radar at 1-hour interval between 4pm on 28-02-2013 and 10pm on 02-03-2013 from TheWeatherChaser.com website
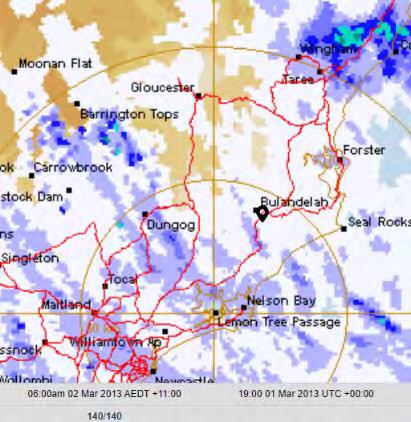
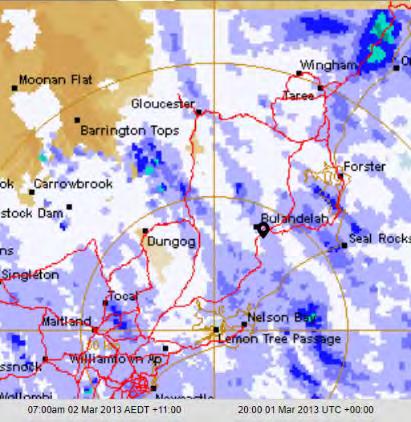
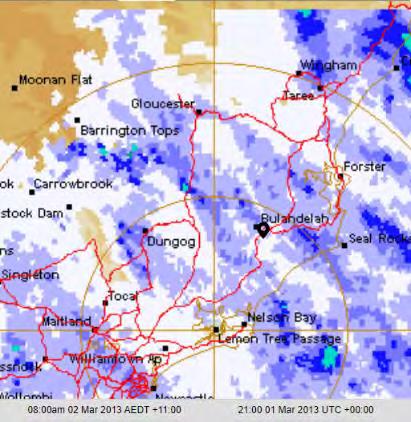
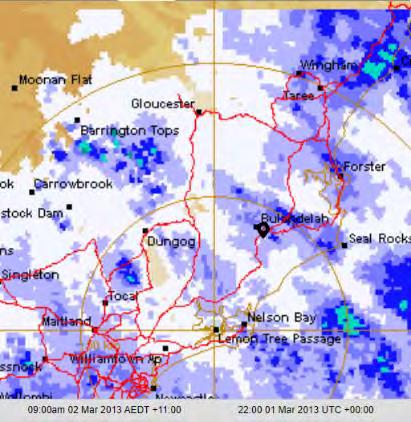
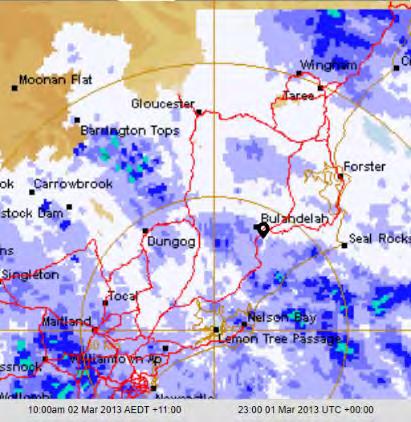
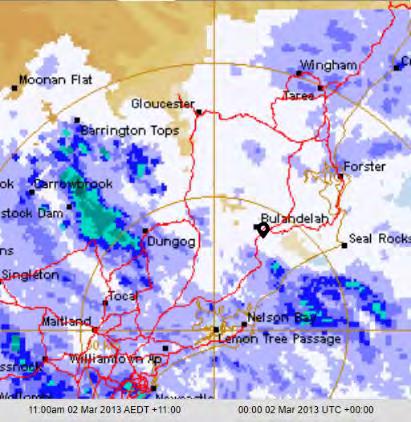
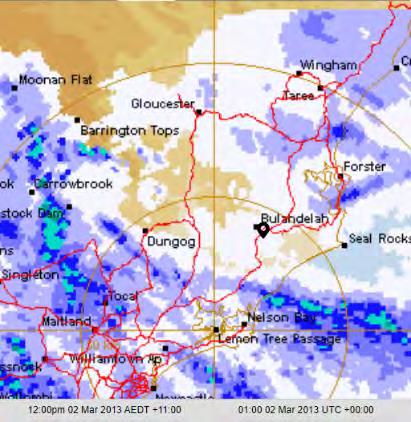
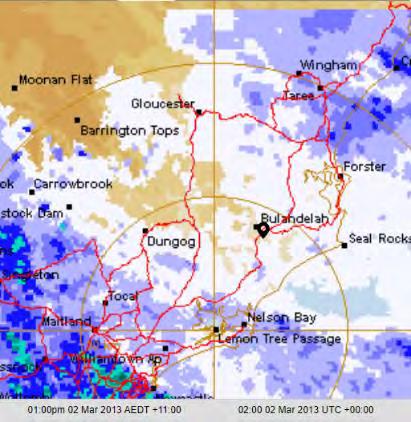
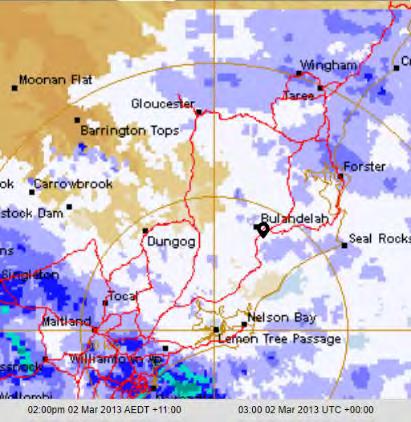
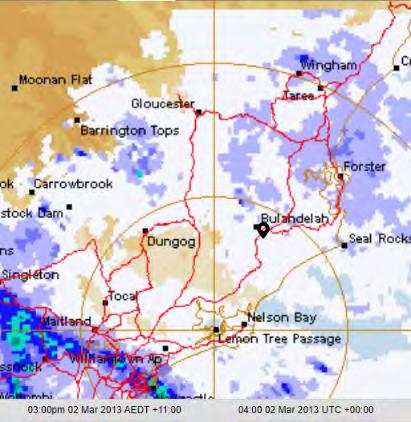
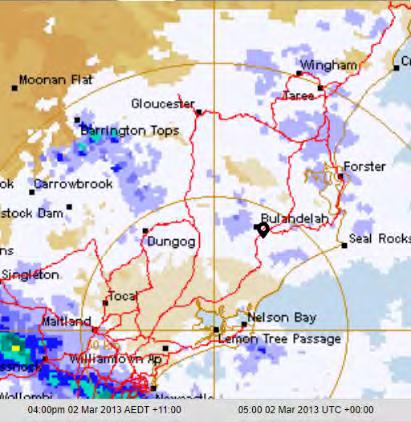
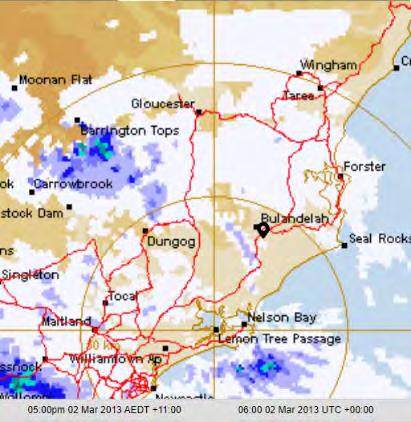
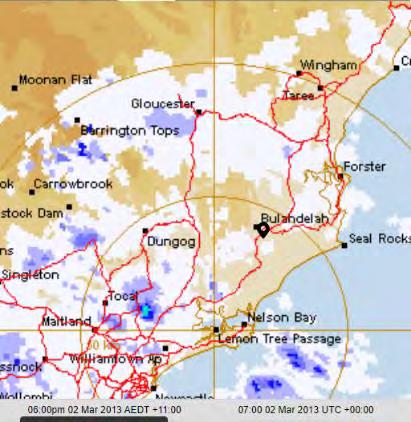
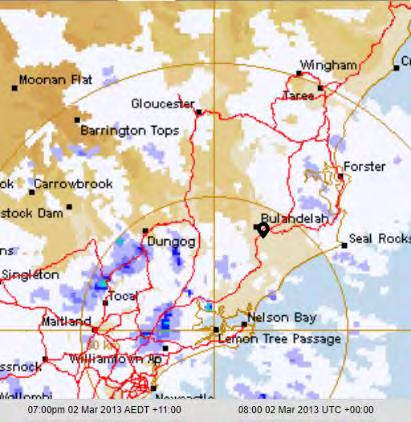
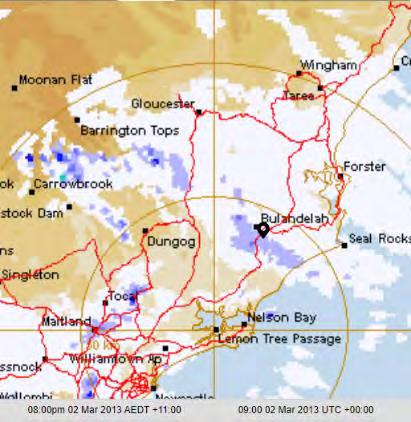
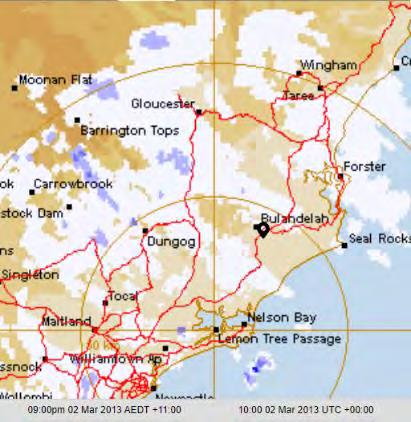
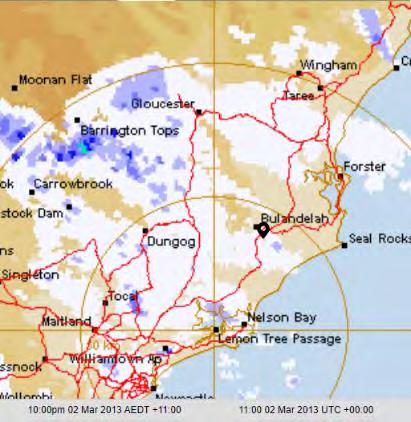
MHL2789 – E4 © Crown 2021 Classification: Release by consent
Figure E.4 – Newcastle rain radar at 1-hour interval between 4pm on 28-02-2013 and 10pm on 02-03-2013 from TheWeatherChaser.com website (continued)
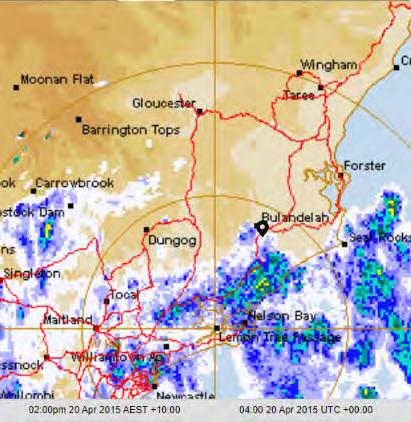
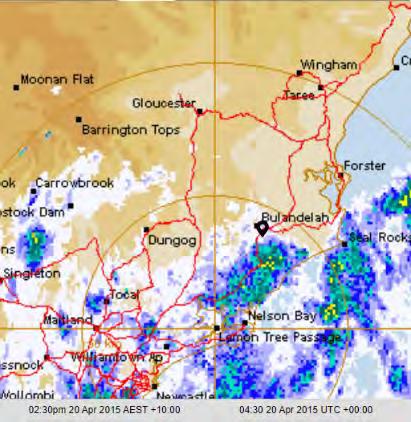
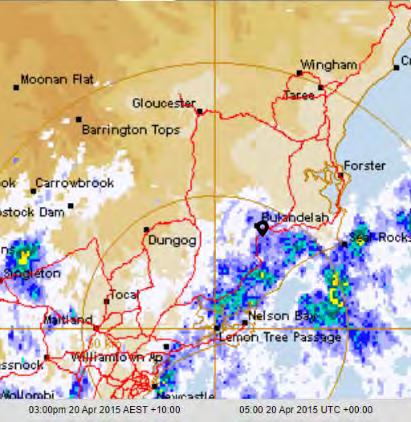
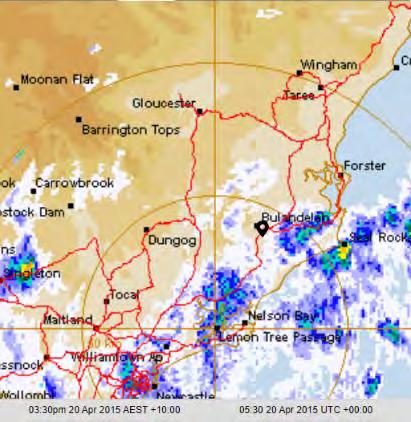
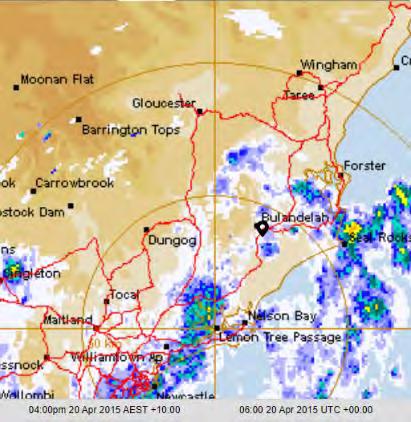
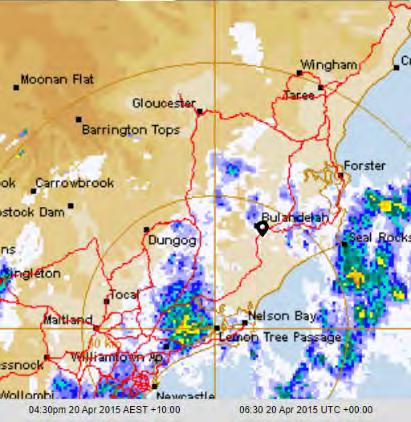
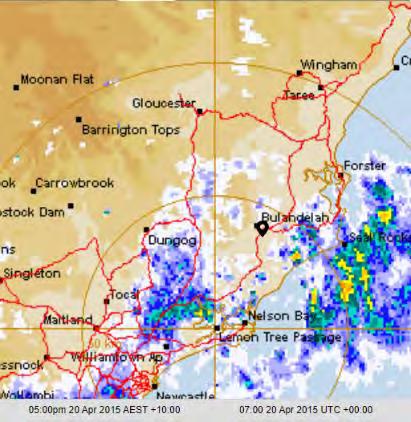
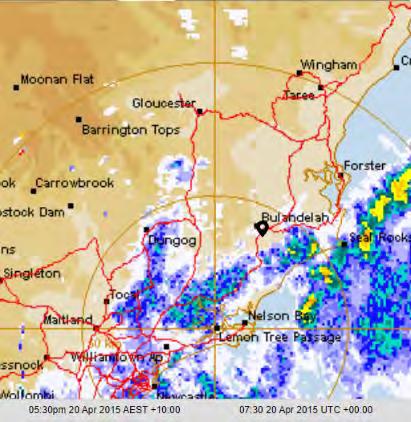
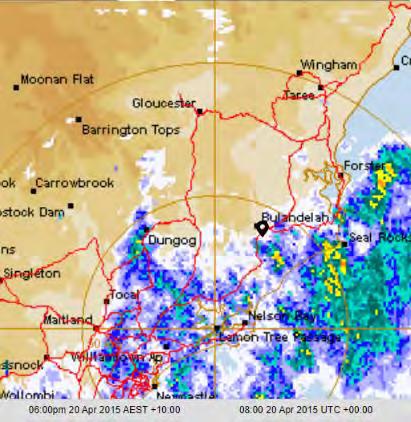
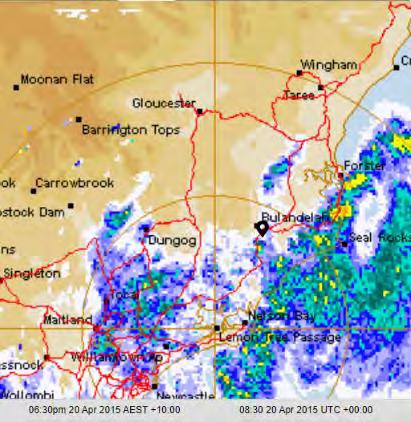

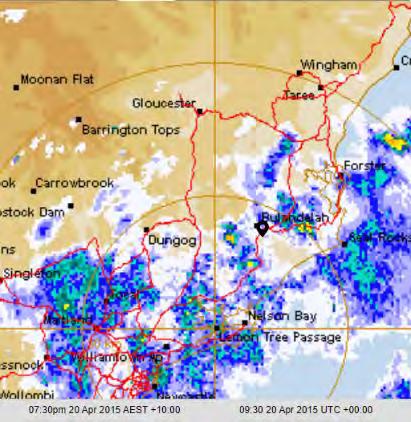
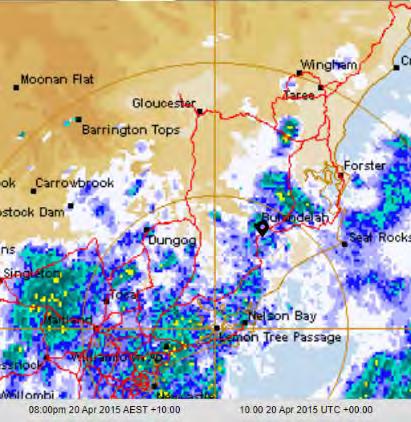
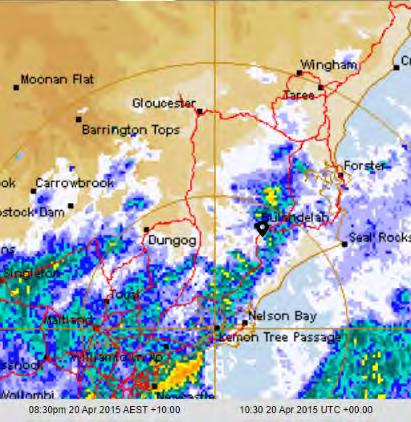
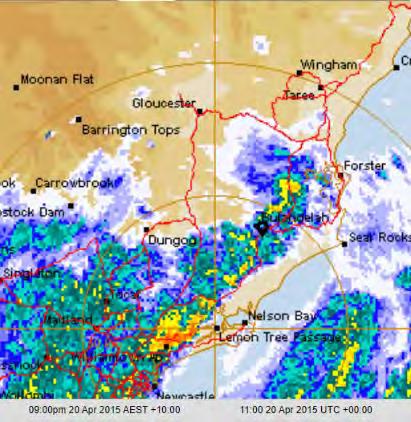
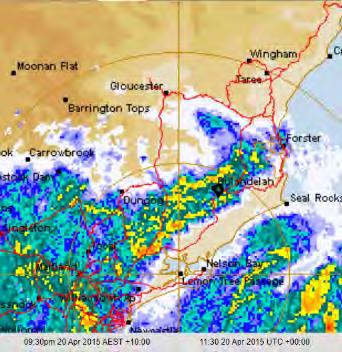
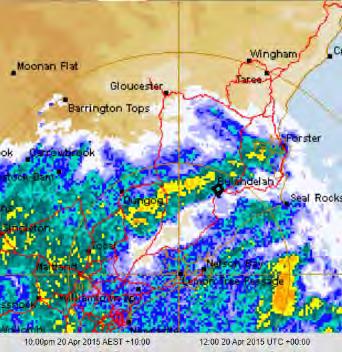
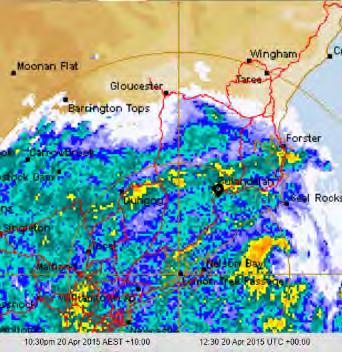
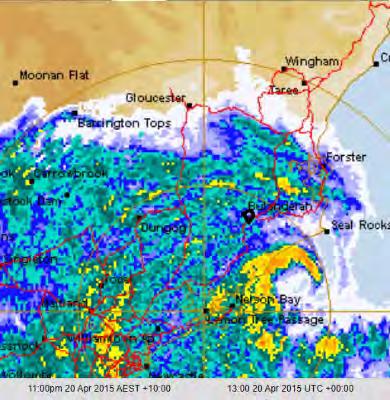
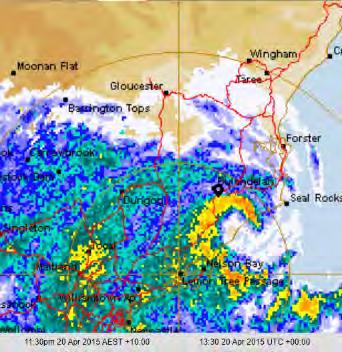
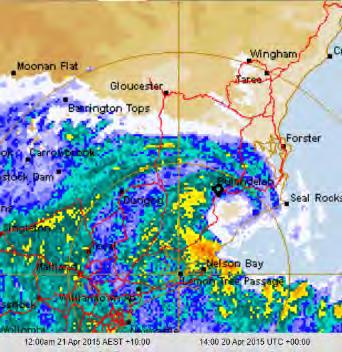
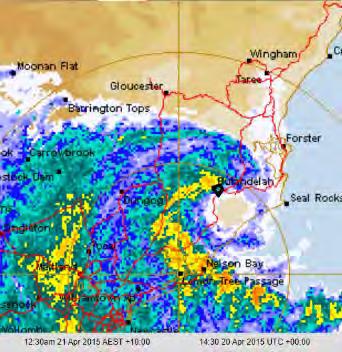
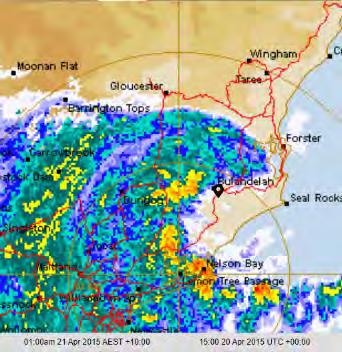
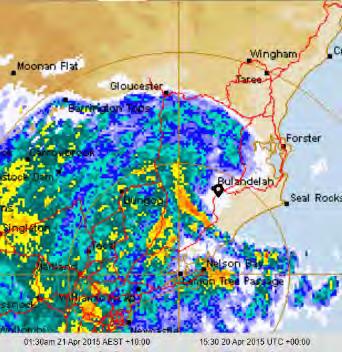
MHL2789 – E5 © Crown 2021 Classification: Release by consent
Figure E 5 – Newcastle rain radar at 30-minute interval between 2pm on 20-04-2015 and 5.30pm on 21-04-2015 from TheWeatherChaser.com website
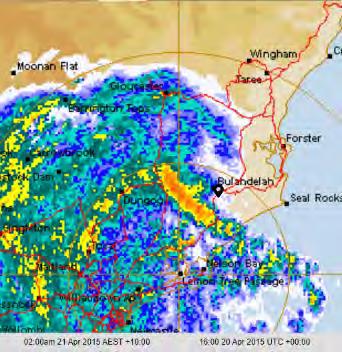
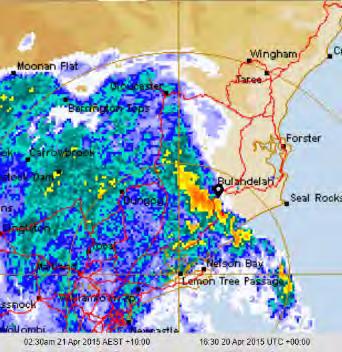
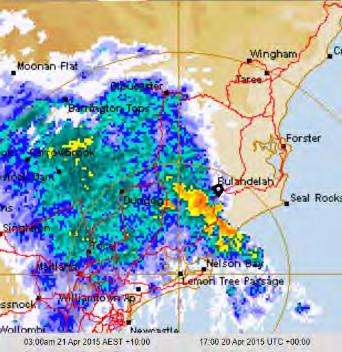
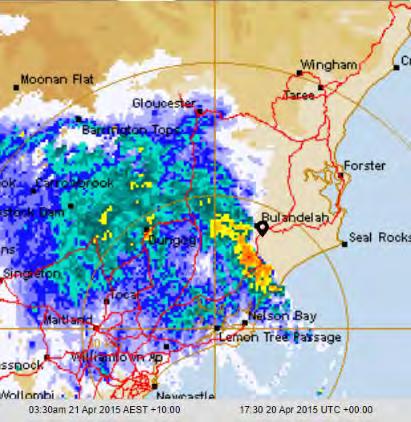
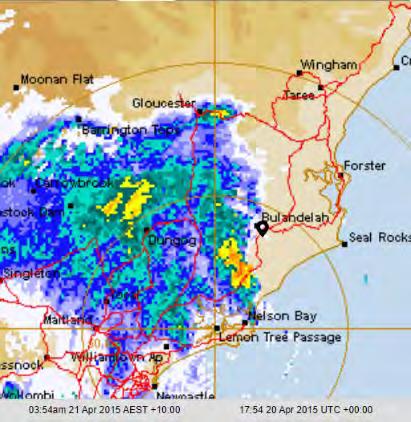
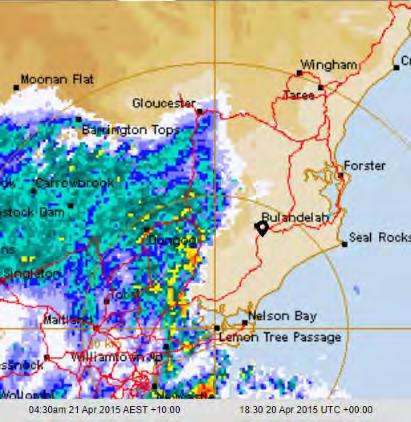
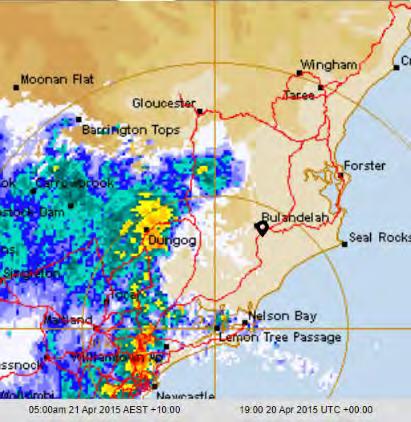
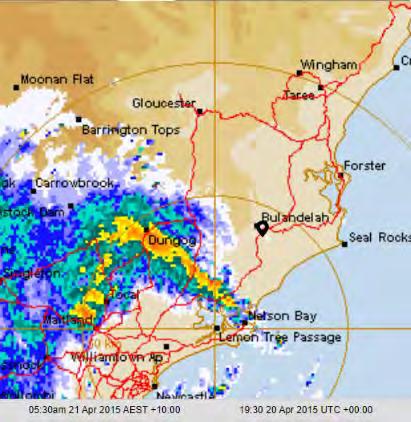
MHL2789 – E6 © Crown 2021 Classification: Release by consent
Figure E.5 – Newcastle rain radar at 30-minute interval between 2pm on 20-04-2015 and 5.30pm on 21-04-2015 from TheWeatherChaser.com website (continued)
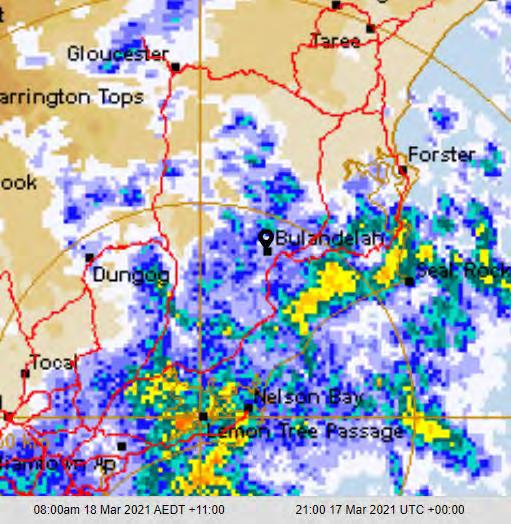
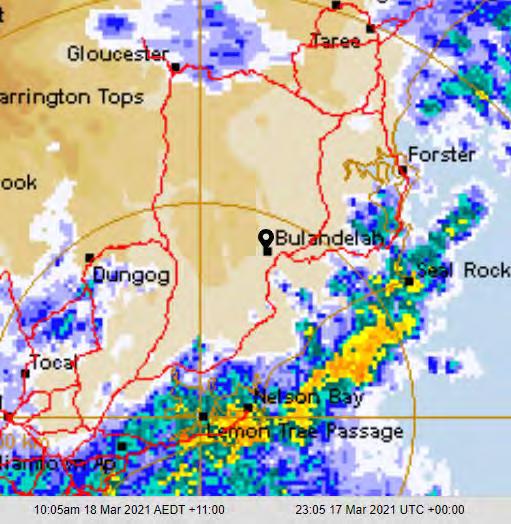
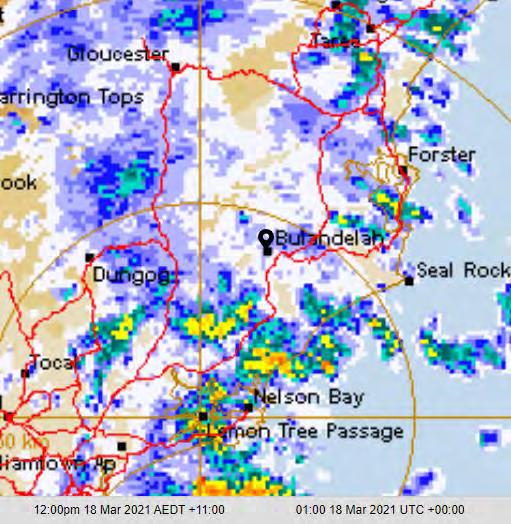
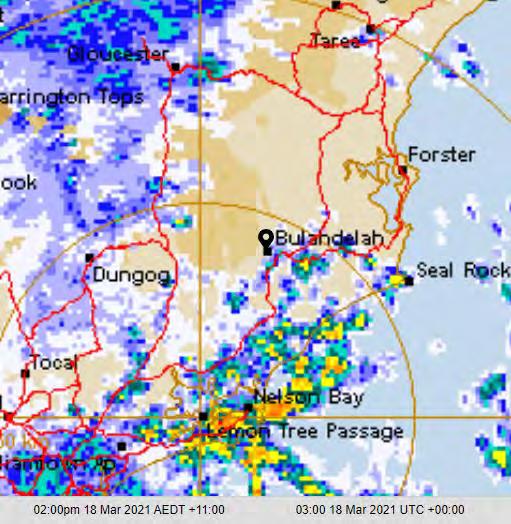
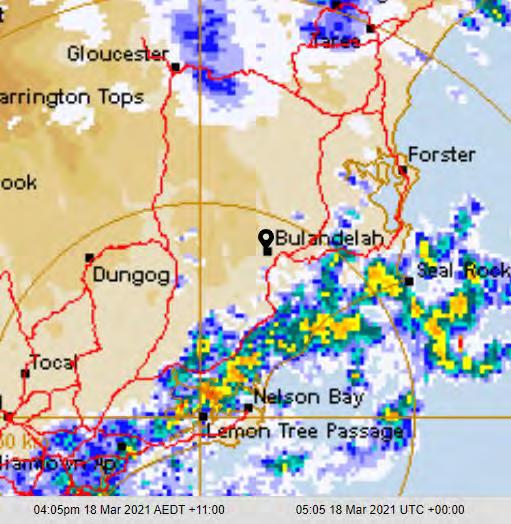
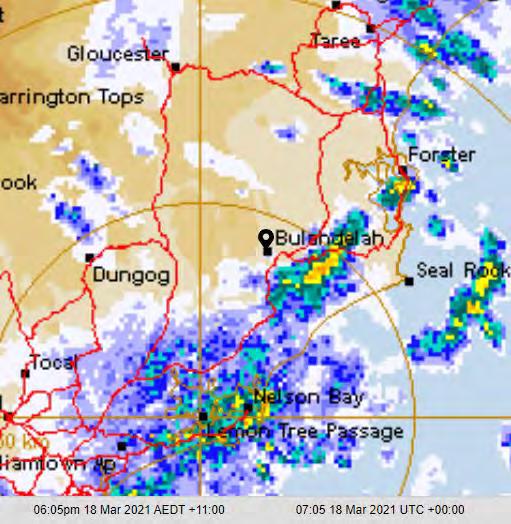
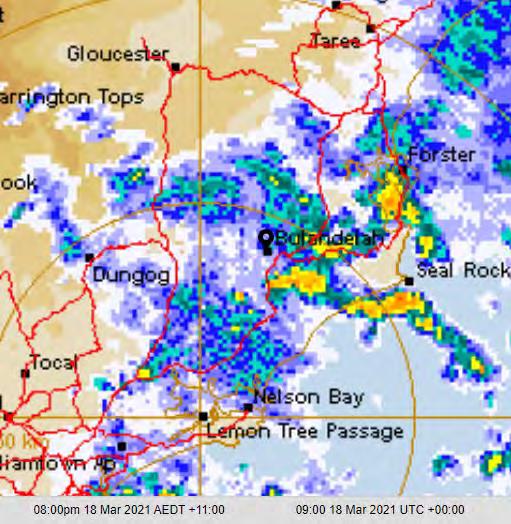
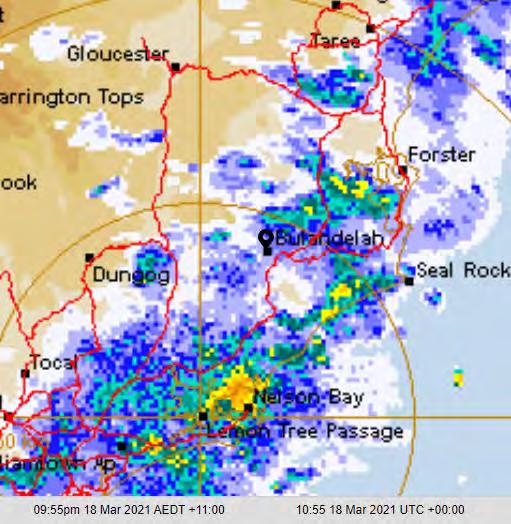
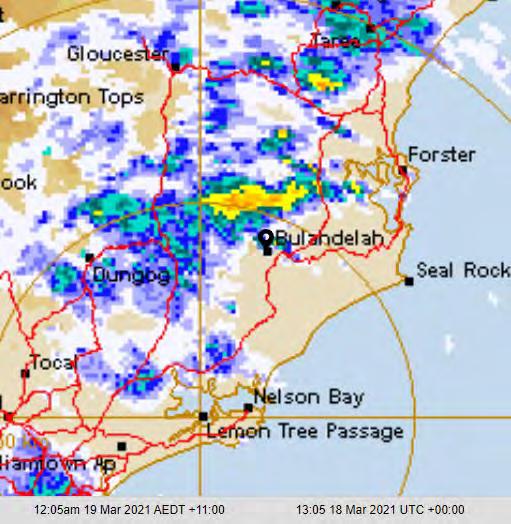
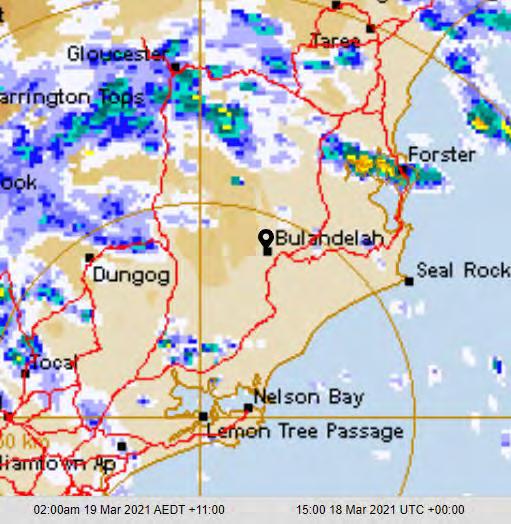
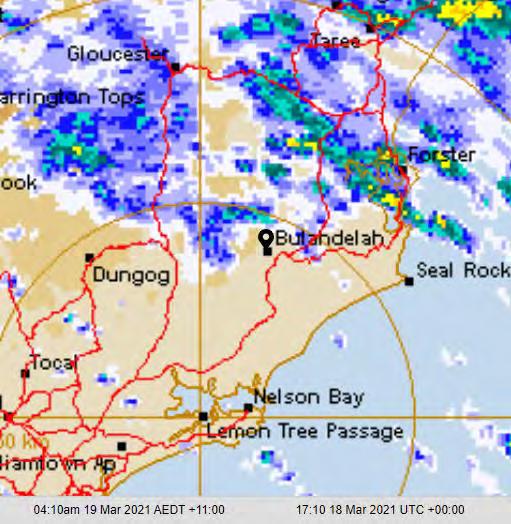
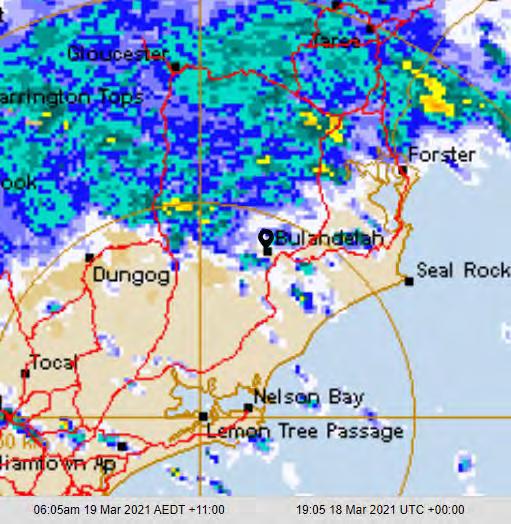

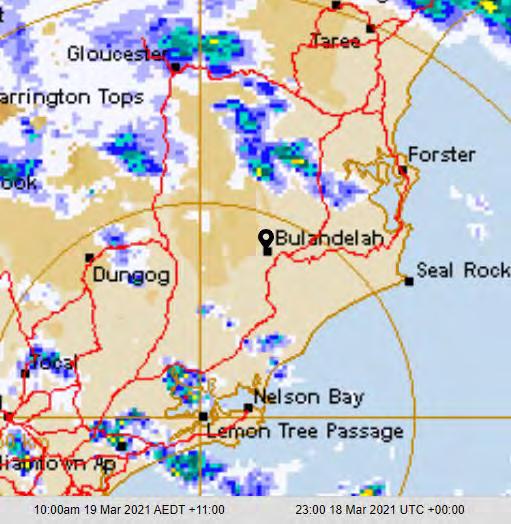
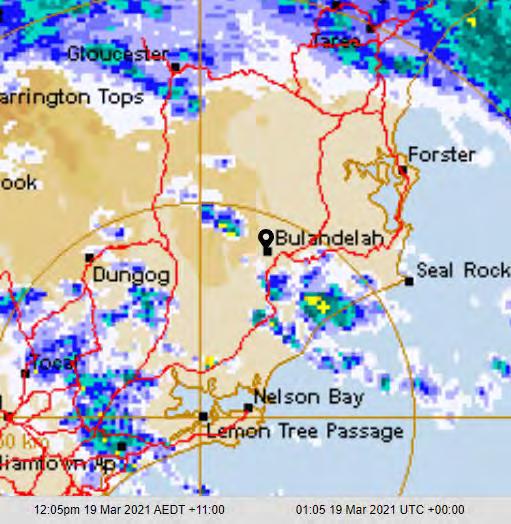
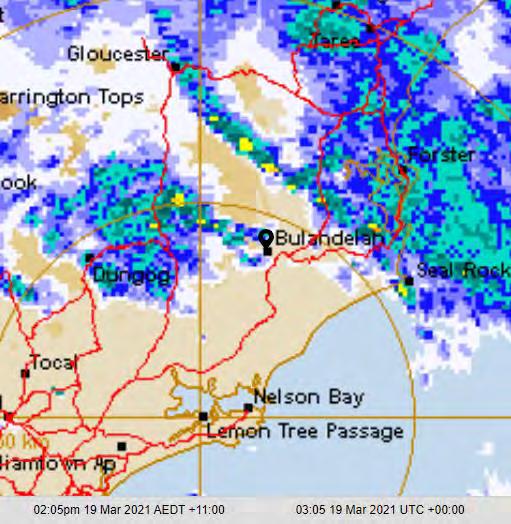
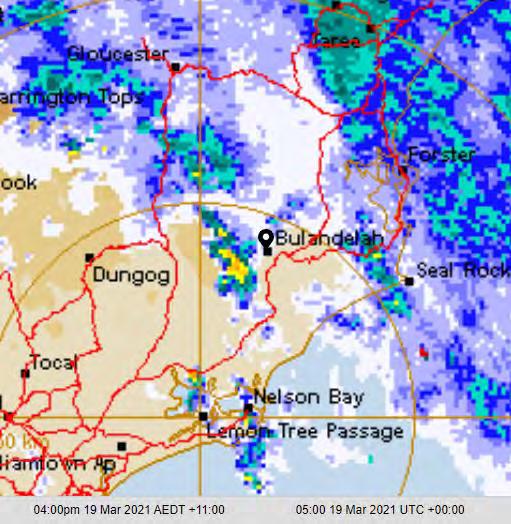
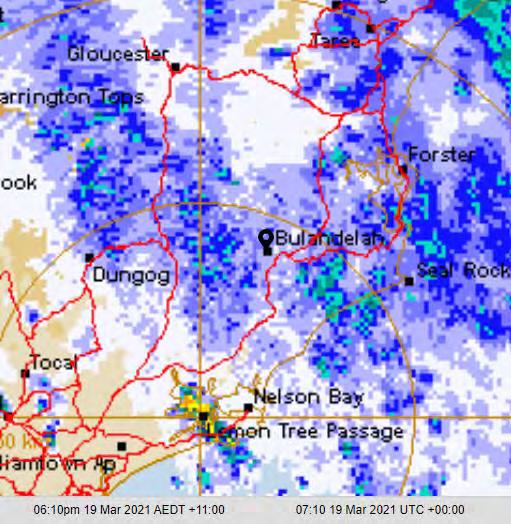
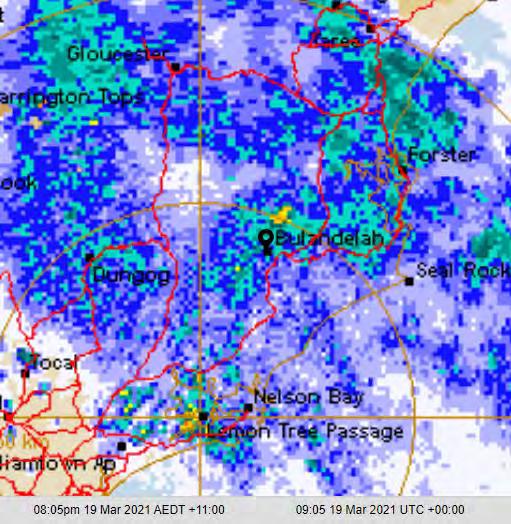
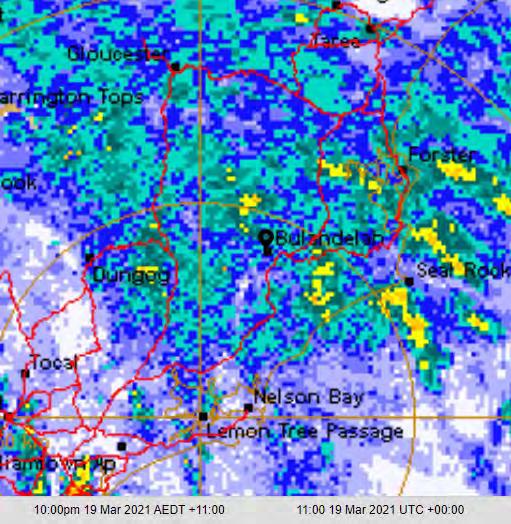
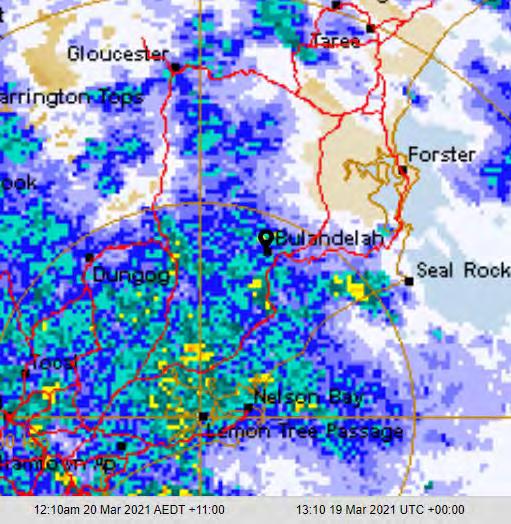
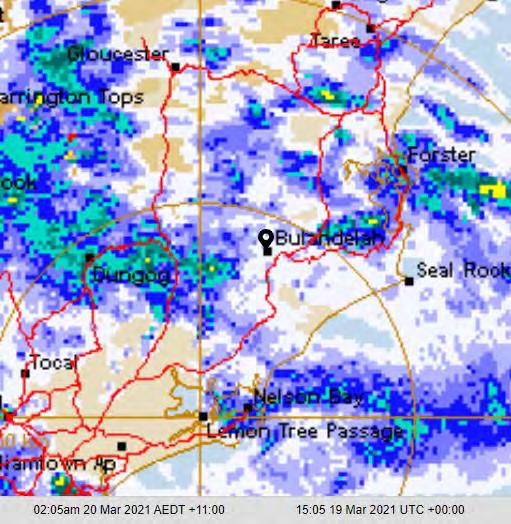
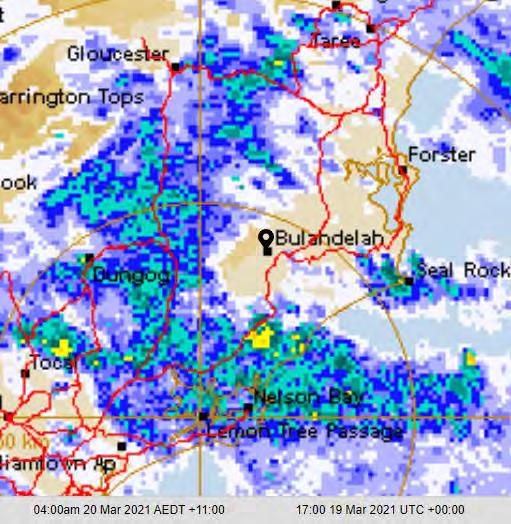
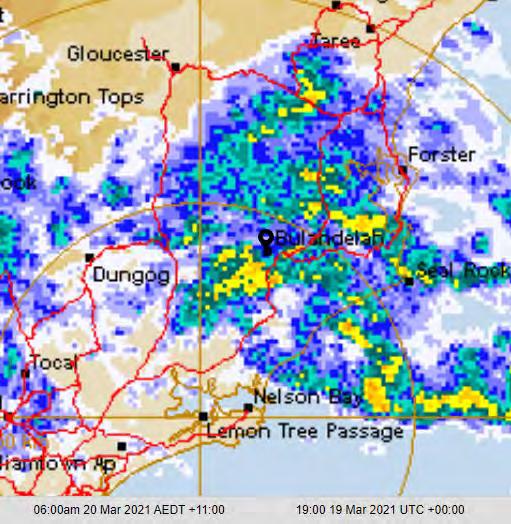
MHL2789 – E7 © Crown 2021 Classification: Release by consent
Figure E.6 – Newcastle rain radar at 2-hour interval between 8pm on 18-03-2021 and 6.00pm on 22-03-2021 from TheWeatherChaser.com website
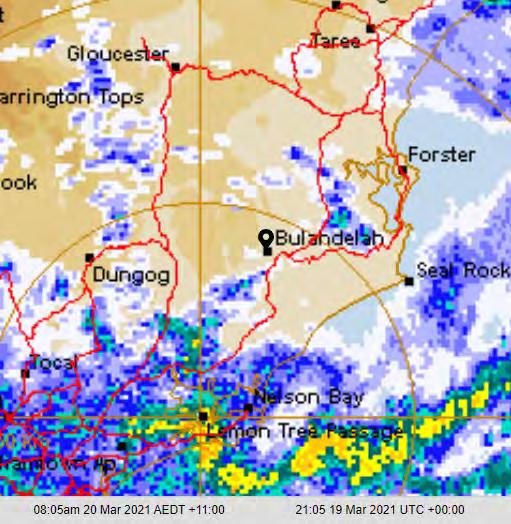
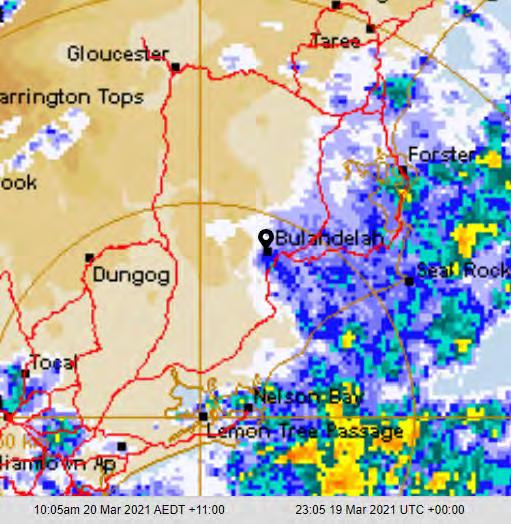
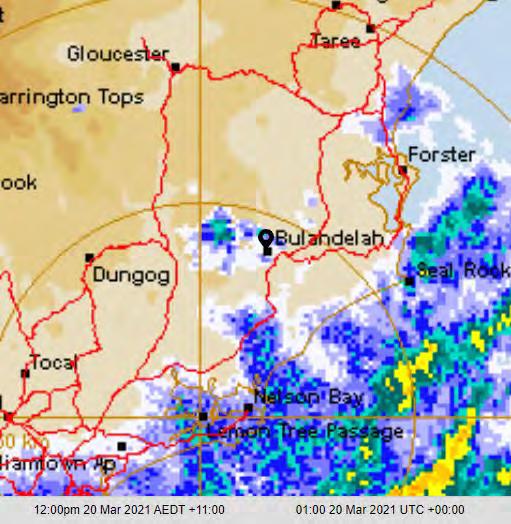
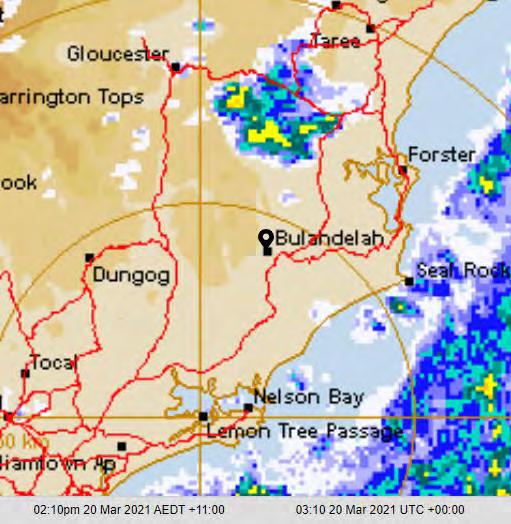
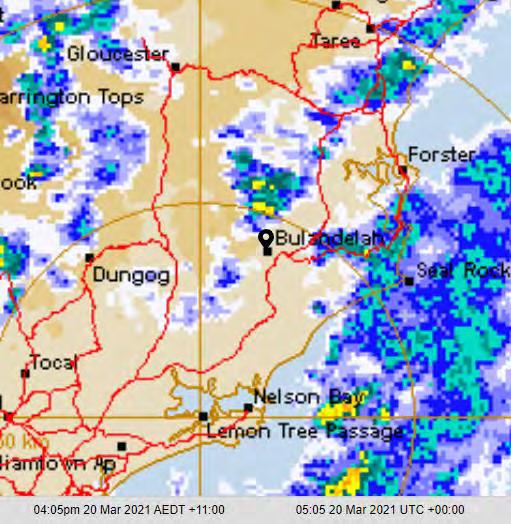
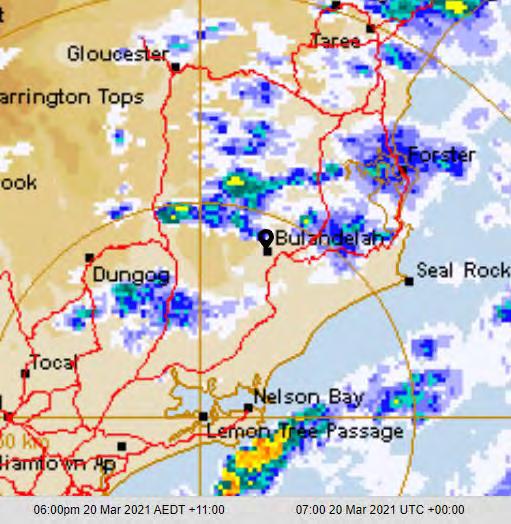
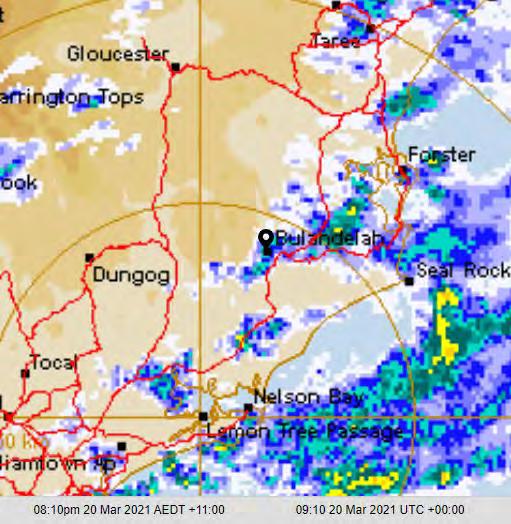
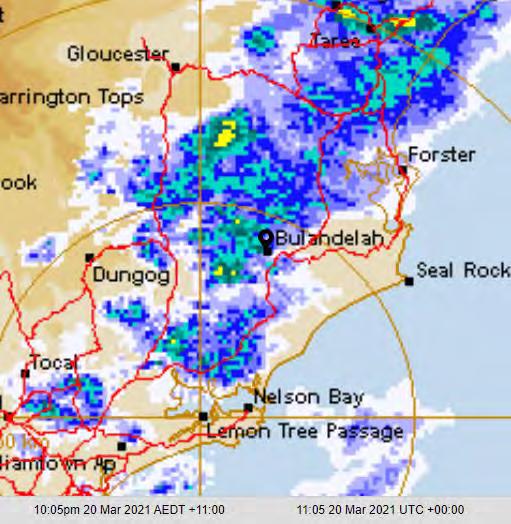
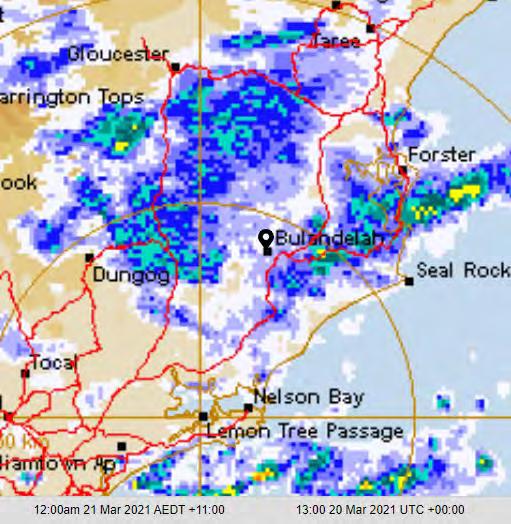
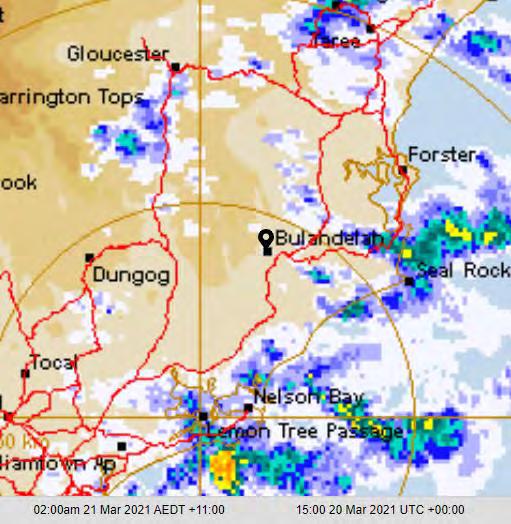
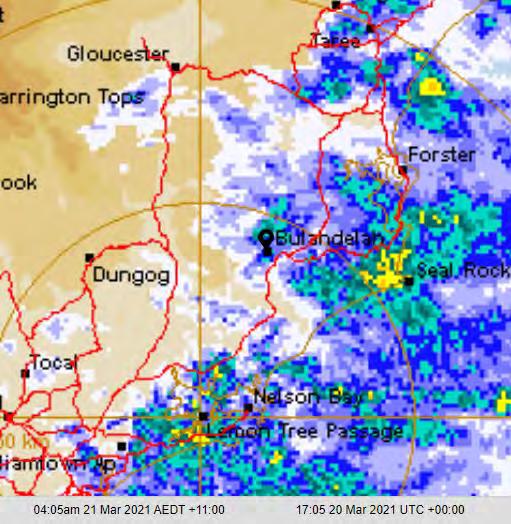
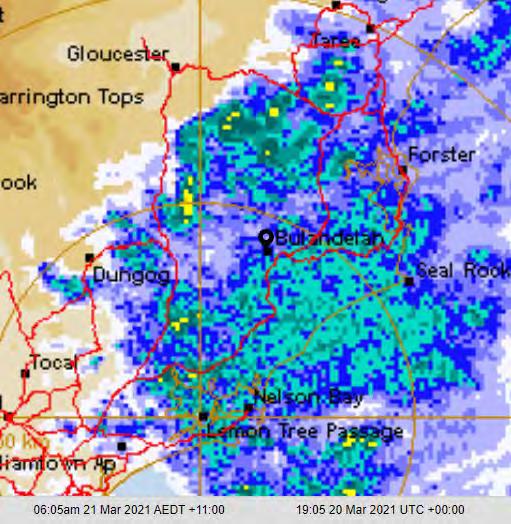
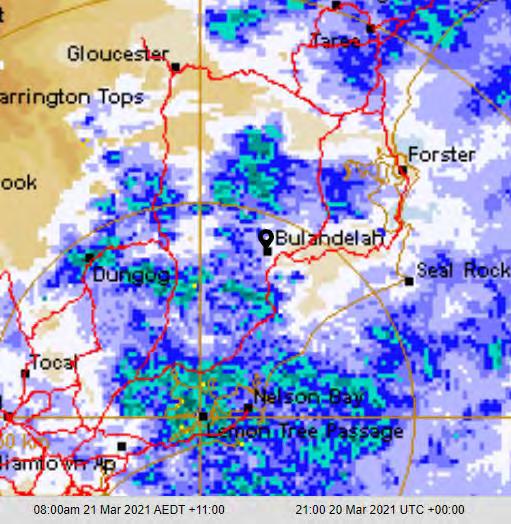
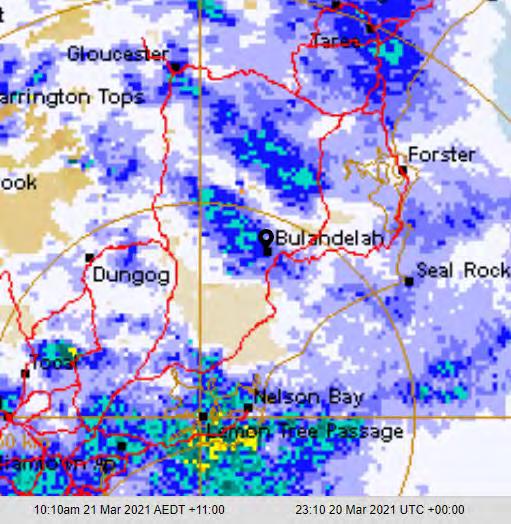
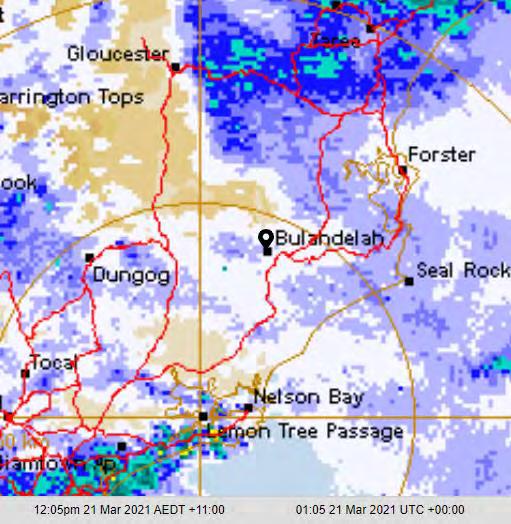
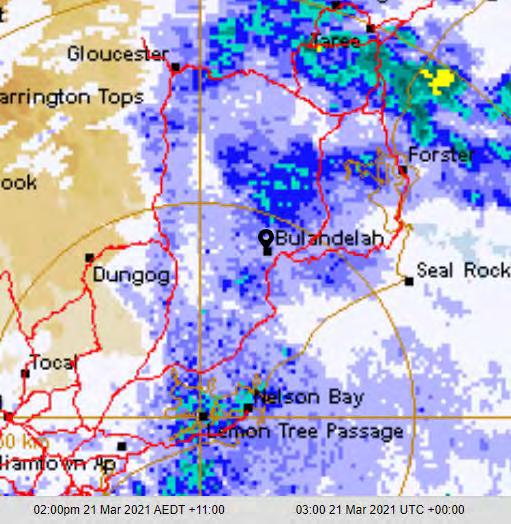
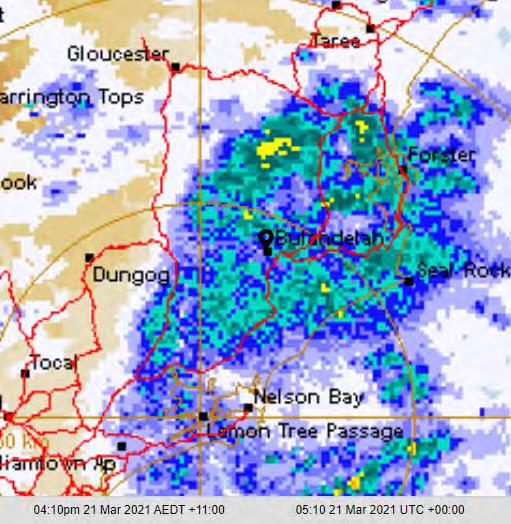
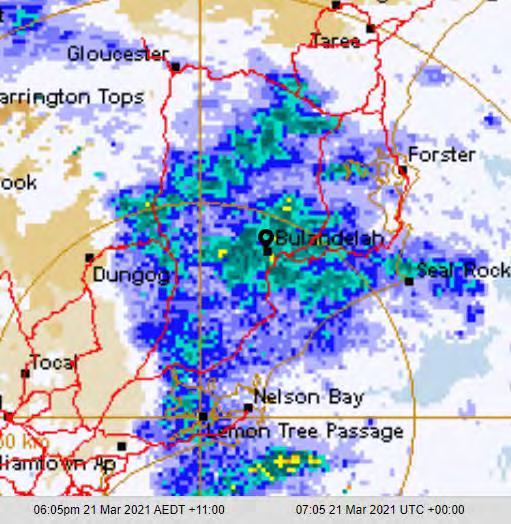
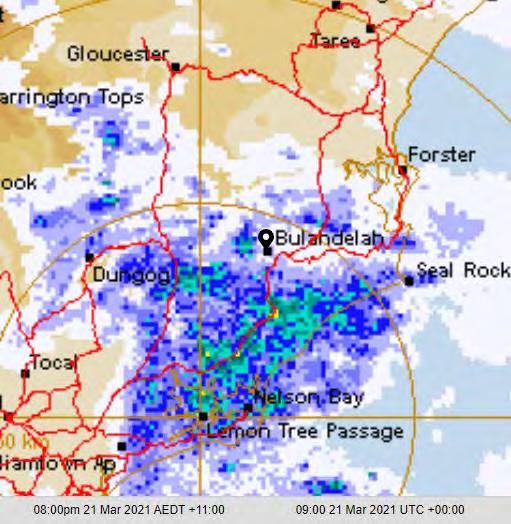
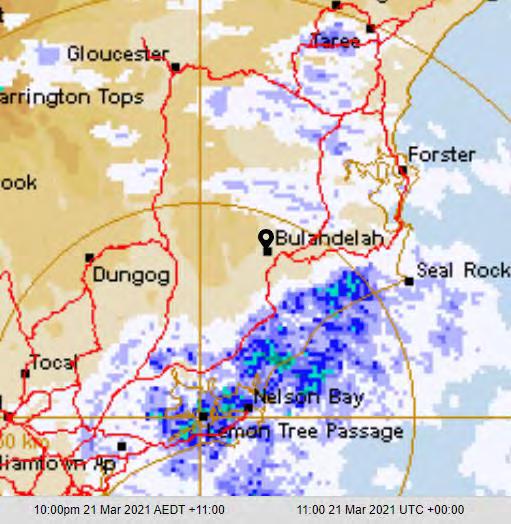
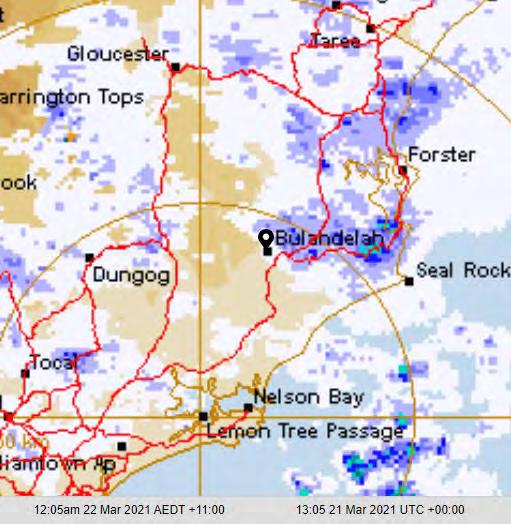
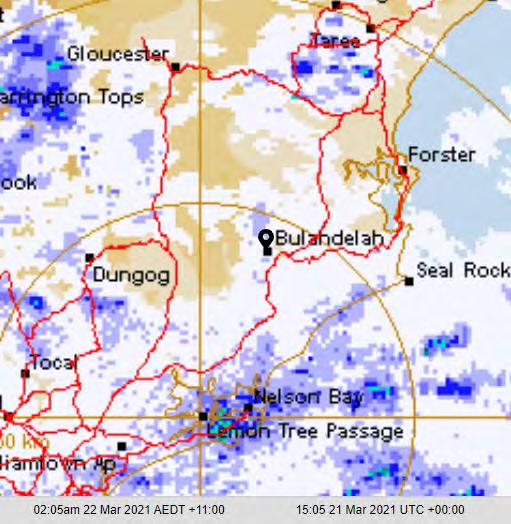
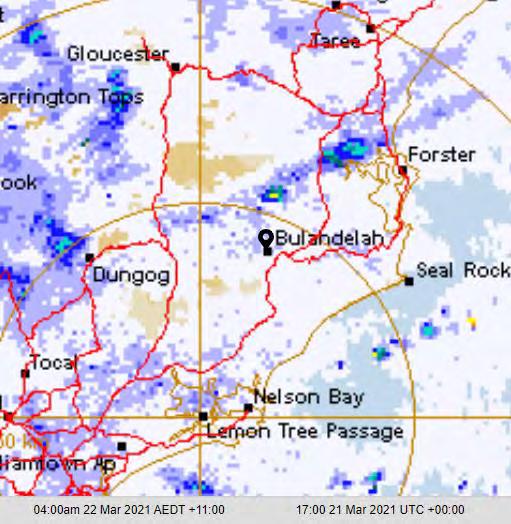
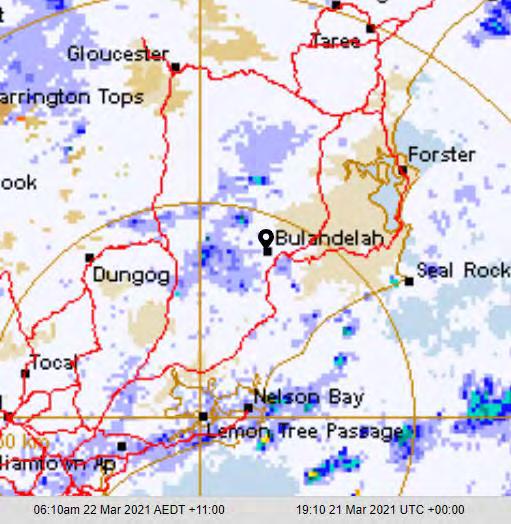
MHL2789 – E8 © Crown 2021 Classification: Release by consent
Figure E.6 – Newcastle rain radar at 2-hour interval between 8pm on 18-03-2021 and 6.00pm on 22-03-2021 from TheWeatherChaser.com website (continued)
Comments:
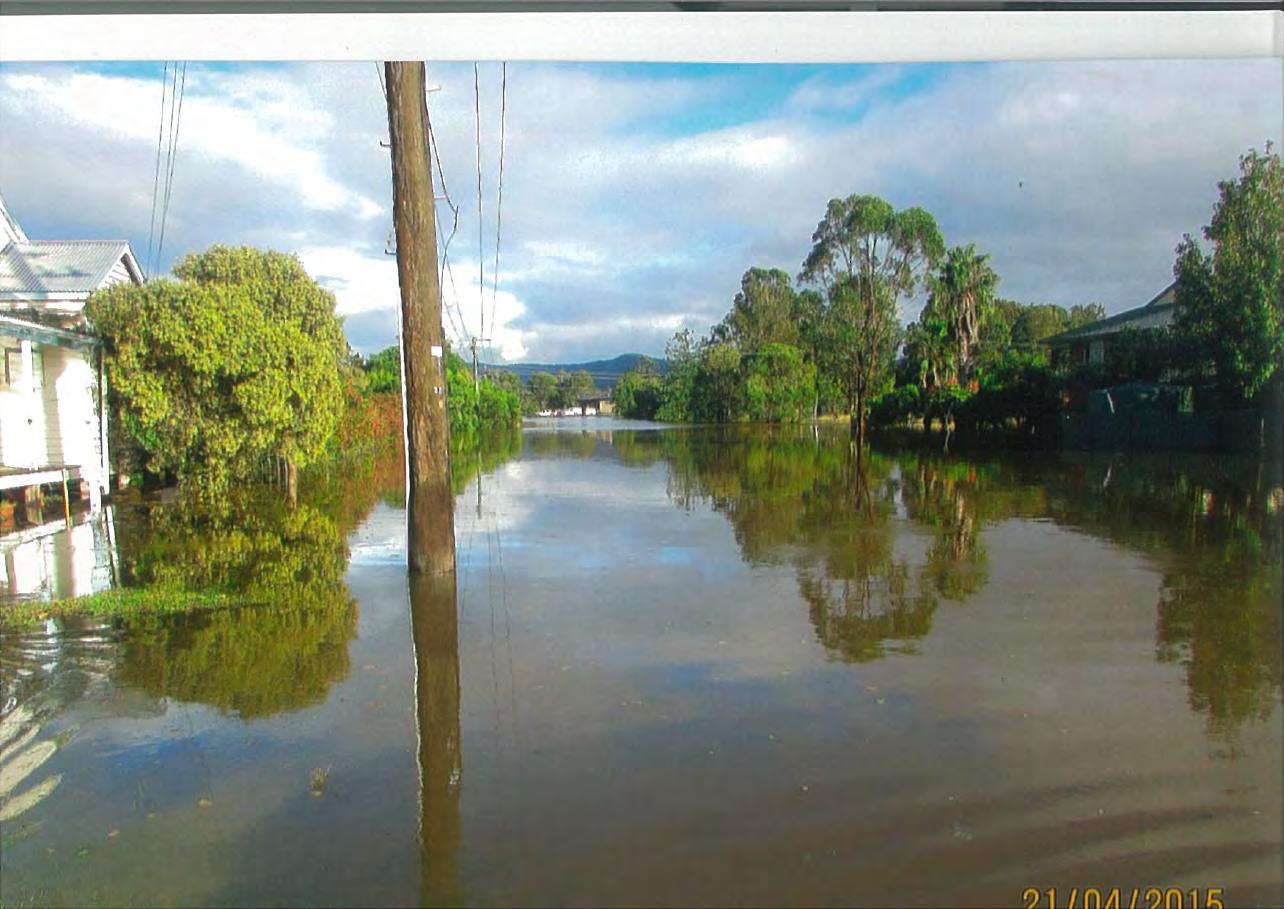
Calibration Result
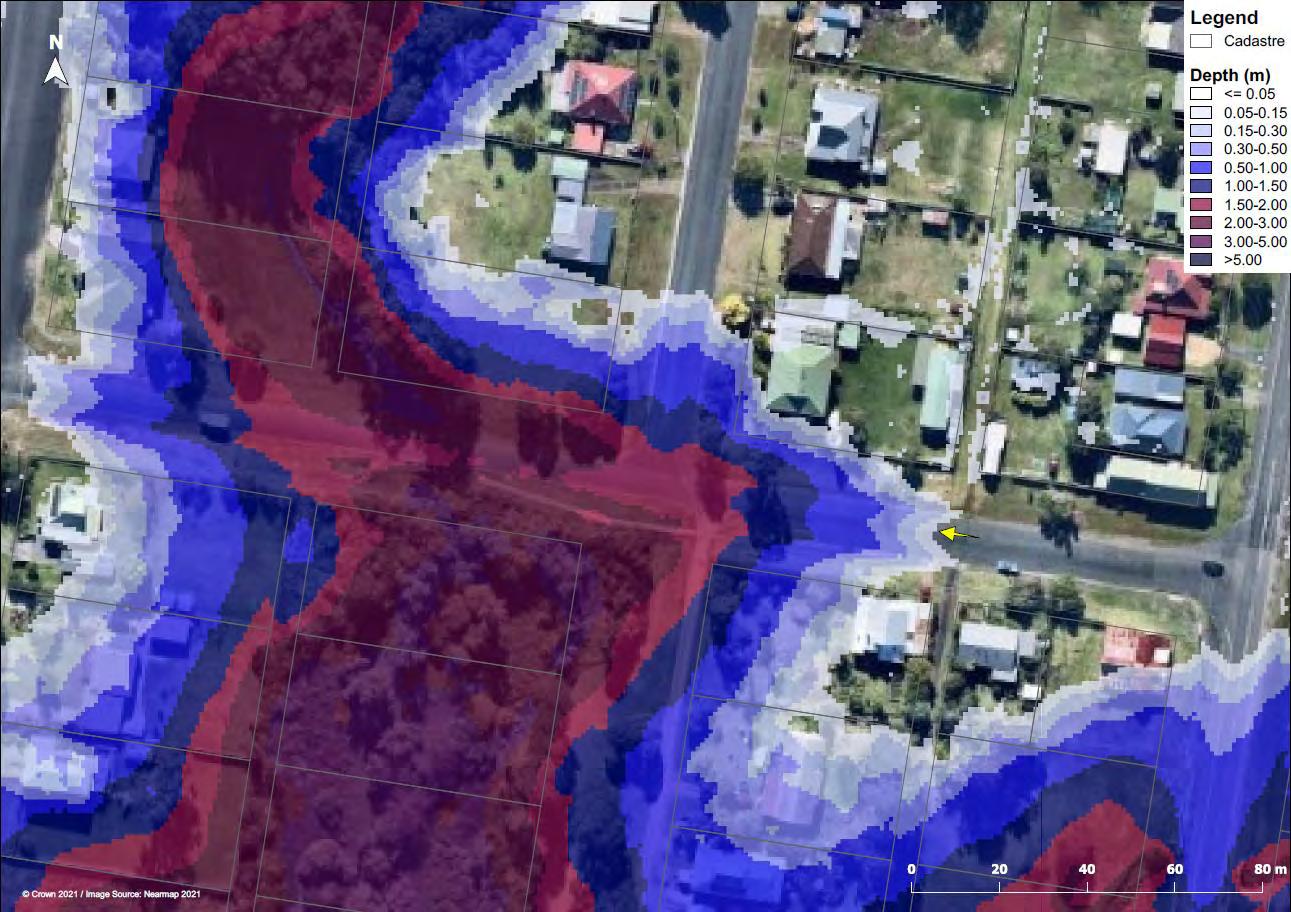
MHL2789 – E9 © Crown 2021 Classification: Release by consent
Table E.1 April 2015 validation event photographs and model results comparison (photographs courtesy of Eric Saville; aerial source: Nearmap 2021)
Jackson Street looking west near intersection with Alexandra Street showing deep flood water across roadway.
Comments: Jackson Street looking west near intersection with Alexandra Street showing edge of flooding.
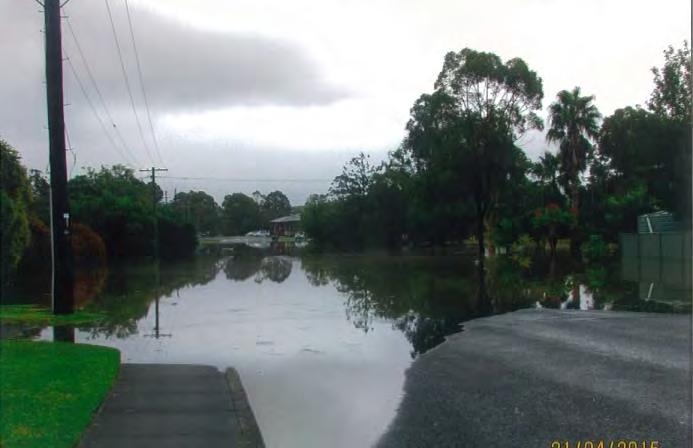

MHL2789 – E10 © Crown 2021 Classification: Release by consent Supplied Image Calibration Result
Comments:
Looking east across Stroud Street from Jackson Street showing flowpath between Stroud Street and Crawford Street
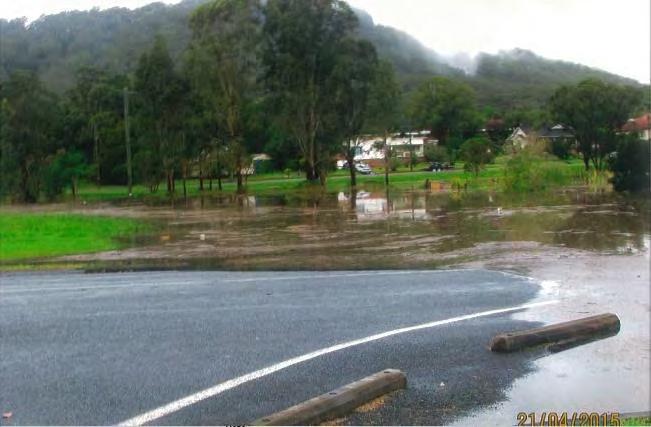
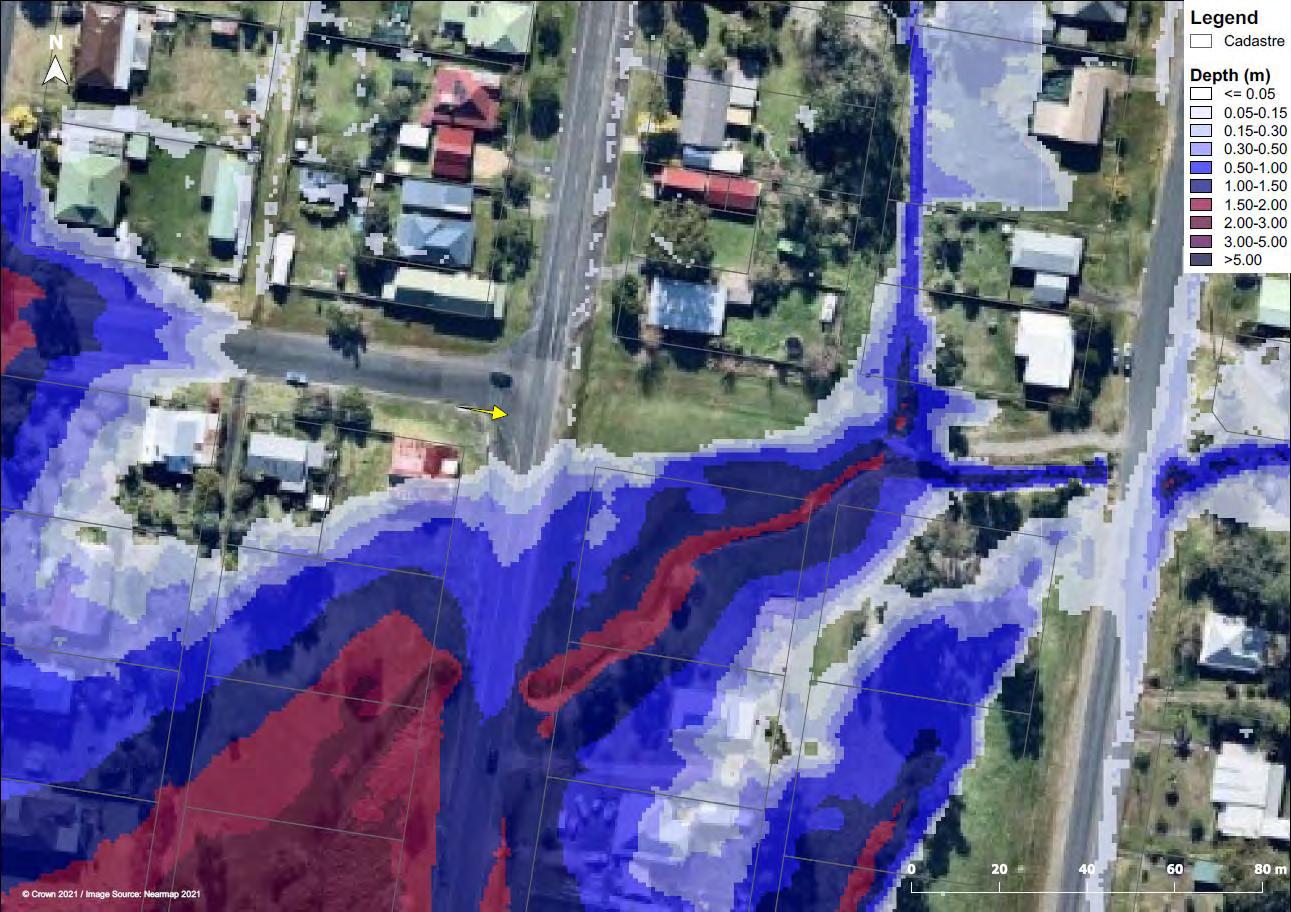
MHL2789 – E11 © Crown 2021 Classification: Release by consent Supplied Image Calibration Result
Comments:
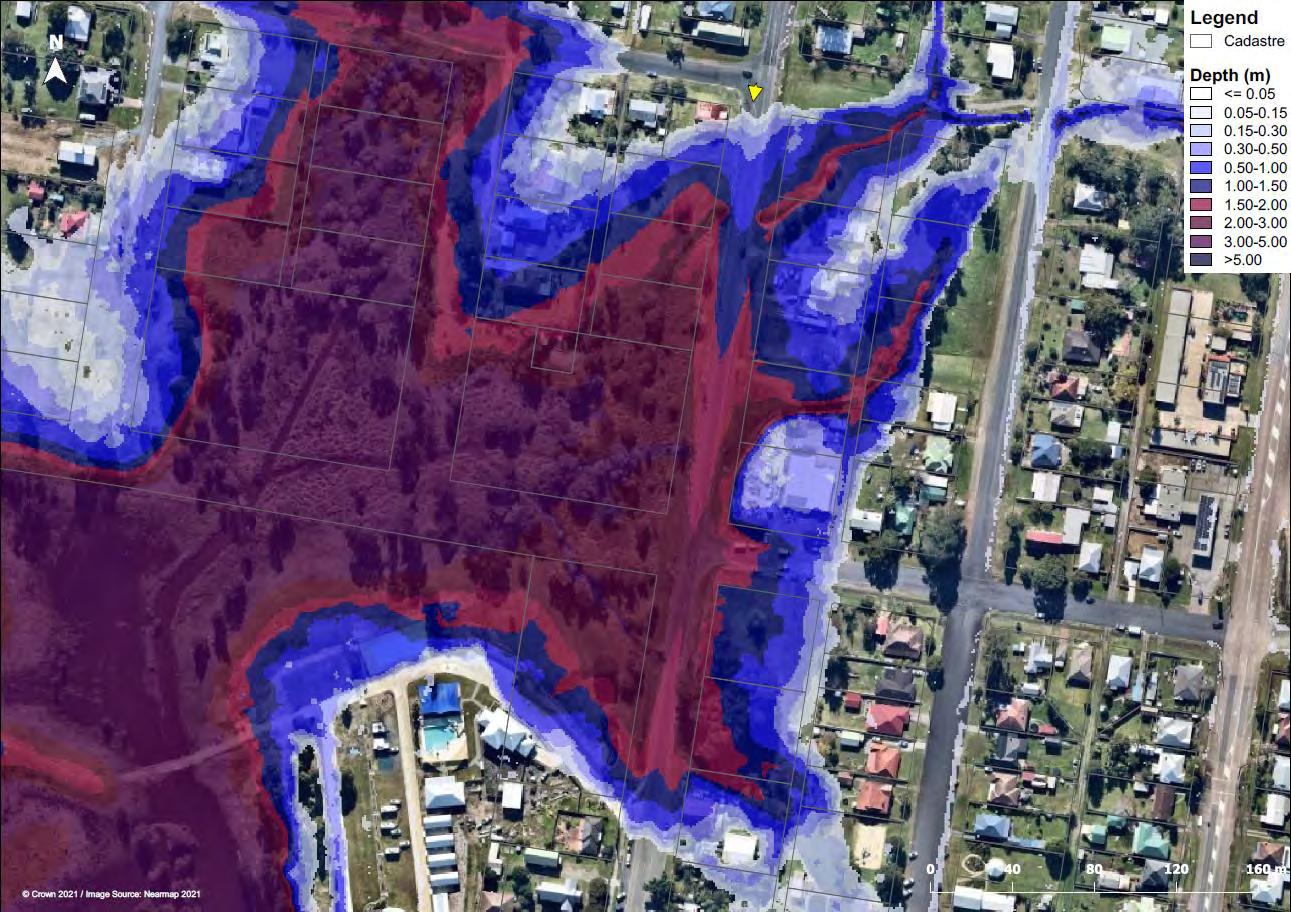
Looking south down Stroud Street from Jackson Street showing extent of deep flooding across Stroud Street
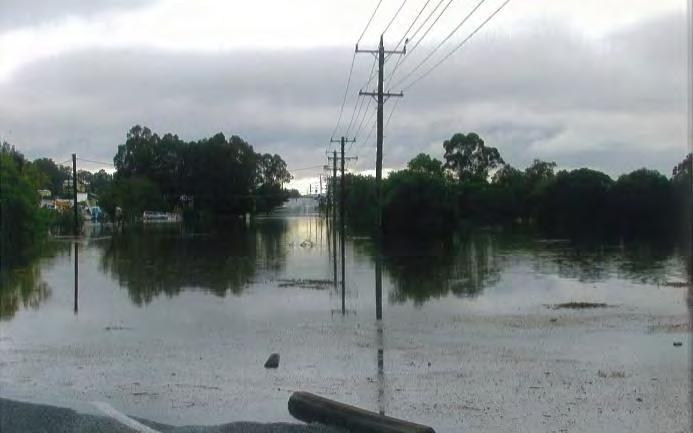
MHL2789 – E12 © Crown 2021 Classification: Release by consent Supplied Image Calibration Result
Comments:
Looking east on property along Jackson Street showing extent of flooding at the back of properties.
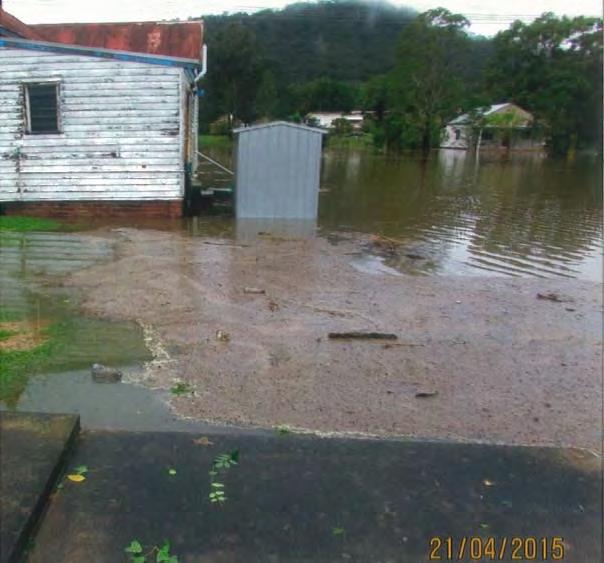
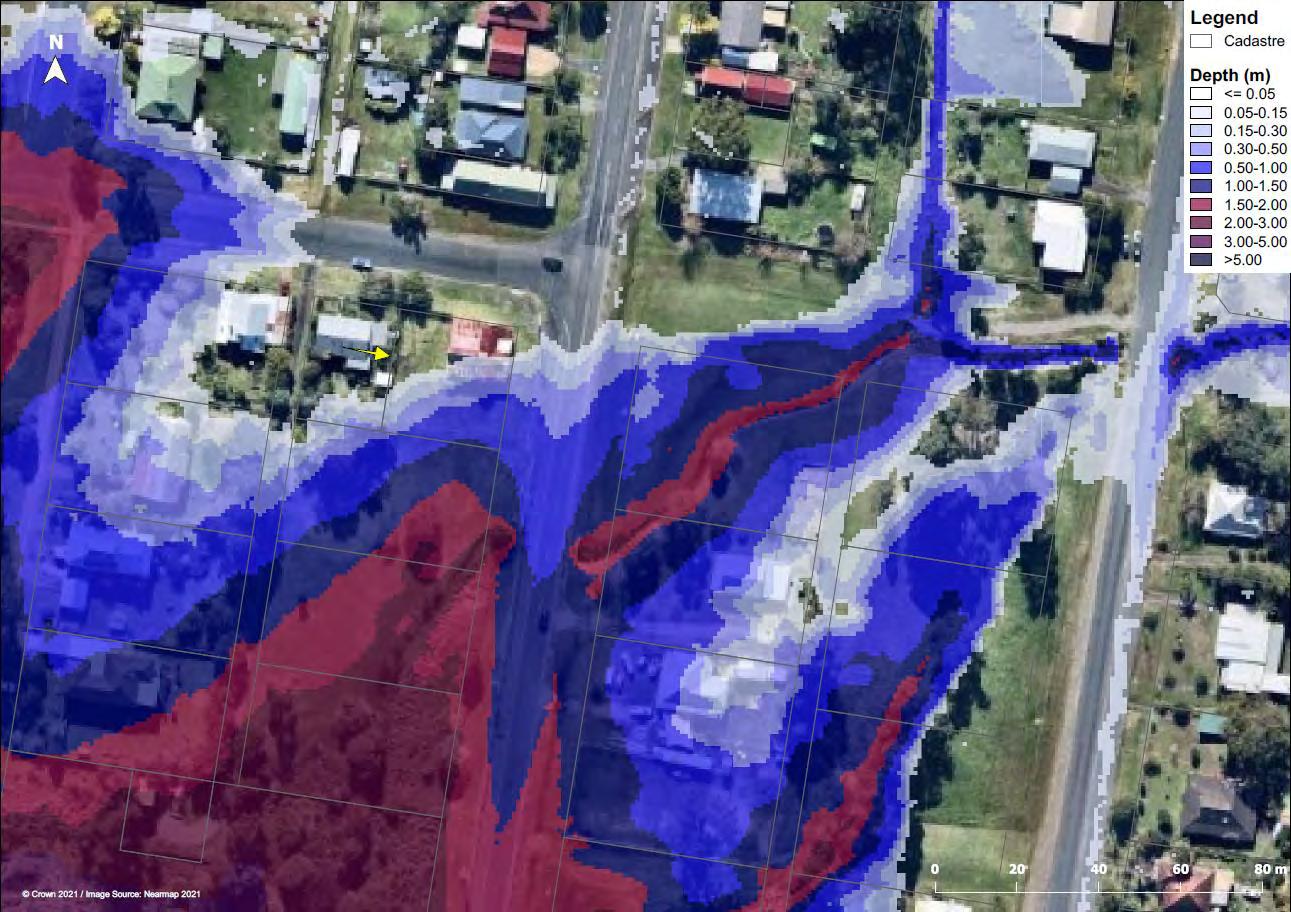
MHL2789 – E13 © Crown 2021 Classification: Release by consent Supplied Image Calibration Result
Comments:
Looking south onto open area flooding west of Stroud Street
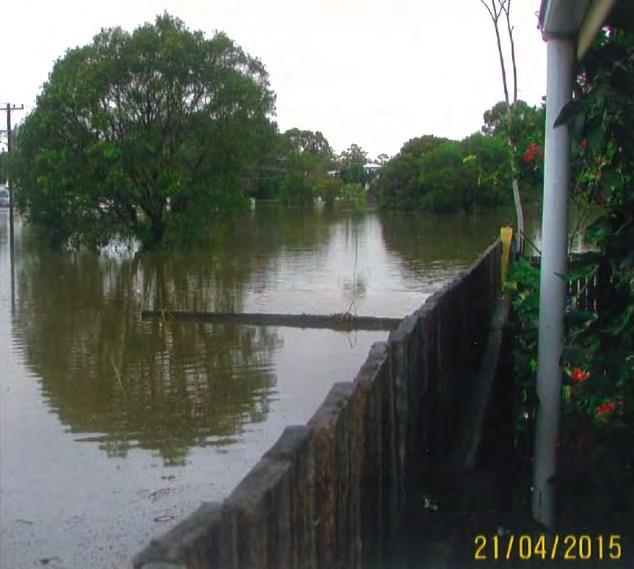
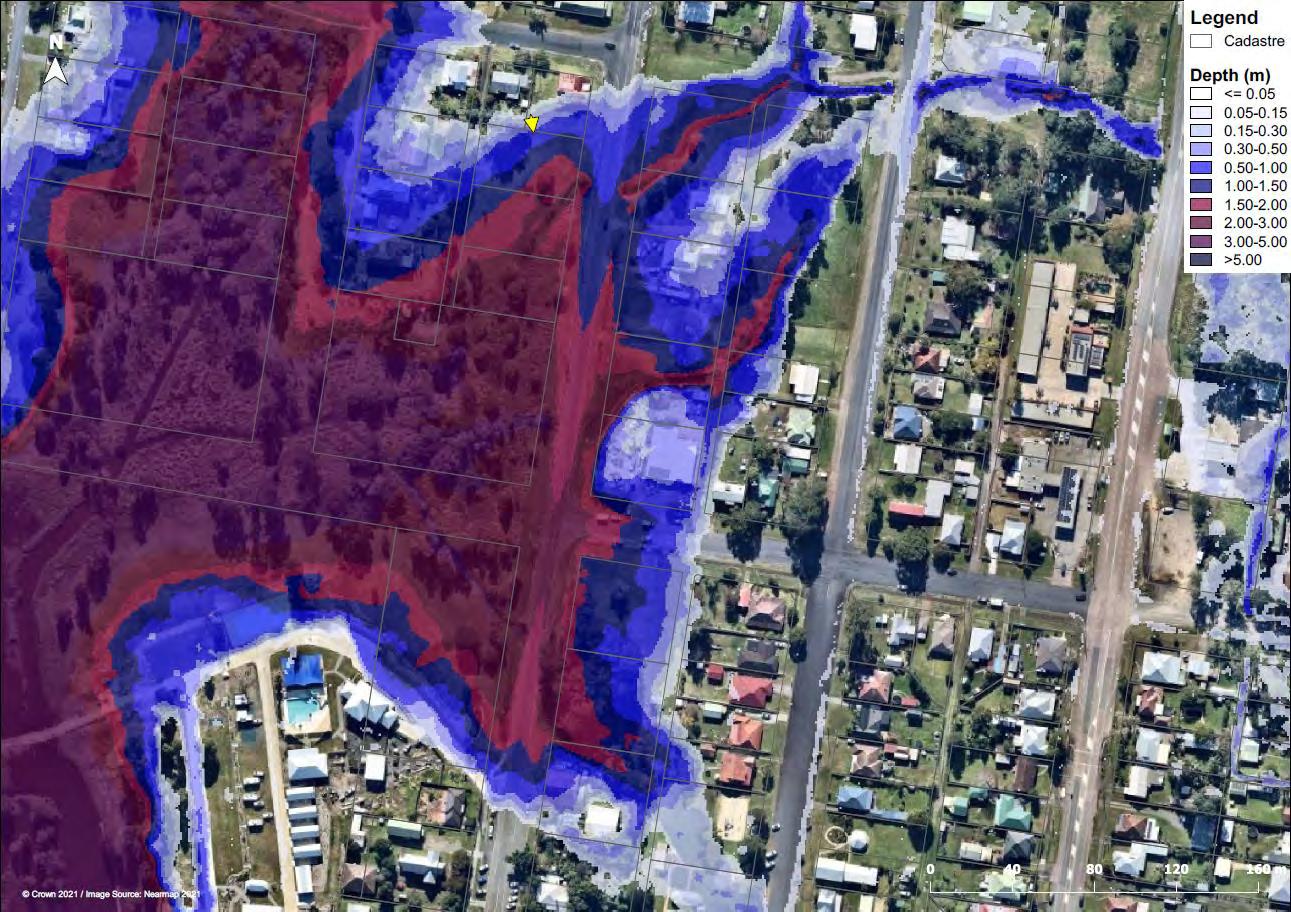
MHL2789 – E14 © Crown 2021 Classification: Release by consent Supplied Image Calibration Result
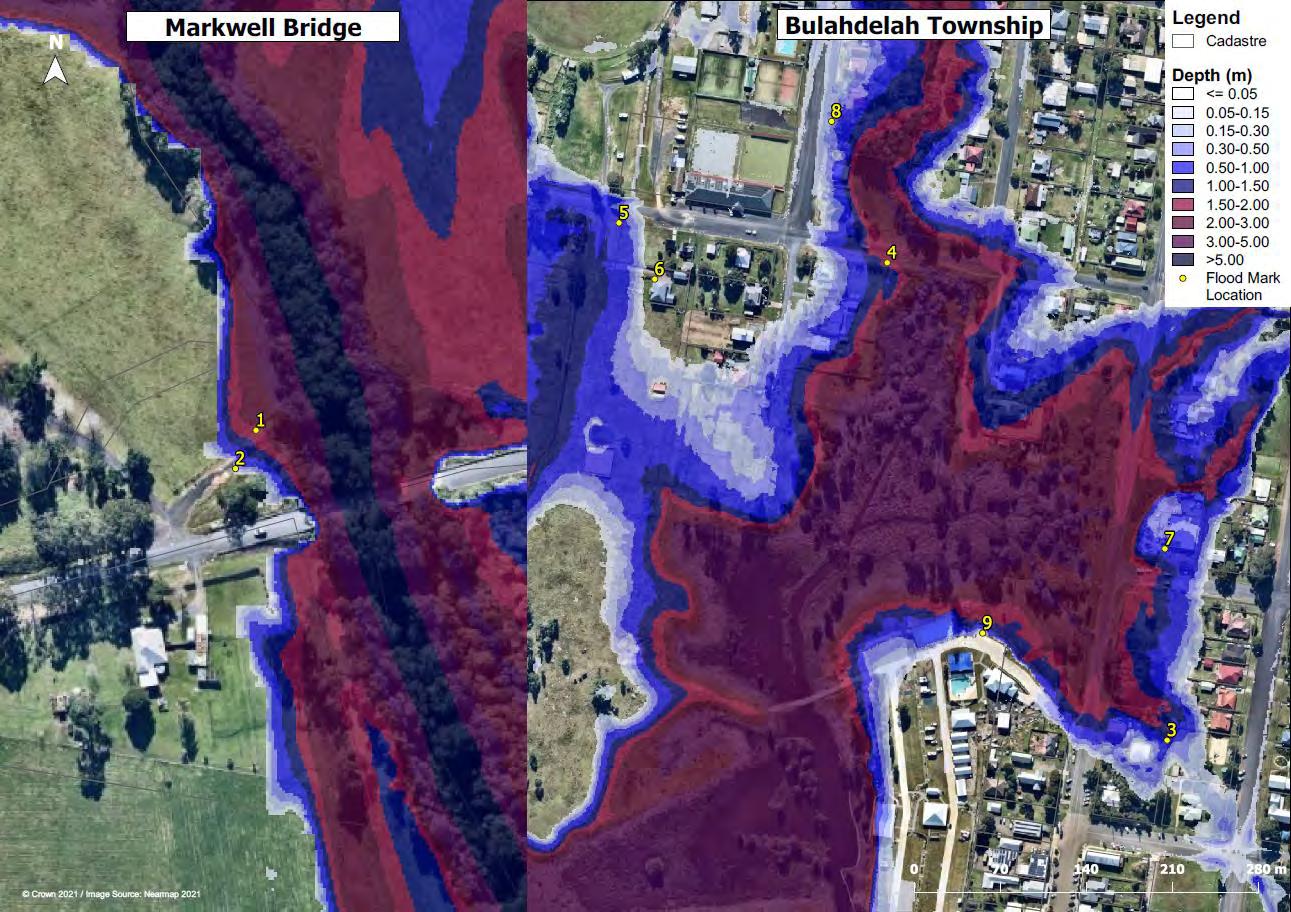
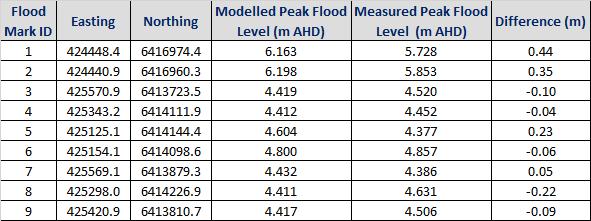
MHL2789 – E15 © Crown 2021 Classification: Release by consent
Figure E.7 March 2021 validation event flood marks measurements and model results comparison
Model sensitivity results

MHL2789 – F1 © Crown 2021 Classification: Release by consent


N FigureF.1 Modelsensitivity 18-hourduration 1%AEPfloodevent withtailwaterlevel reducedby500mm ReportMHL2789 ReviewofBulahdelah FloodplainRisk ManagementStudyandPlan ©Crown2021/AerialImagerySource:GoogleMaps2021 Studyarea Afflux(m) <-0.50 -0.50to-0.20 -0.20to-0.10 -0.10to-0.05 -0.05to-0.02 -0.02to-0.01 -0.01to0.01 0.01to0.02 0.02to0.05 0.05to0.10 0.10to0.20 0.20to0.50 >0.50 Waswetnowdry Wasdrynowwet Legend ©AerialImagerySource:Nearmap2021

N FigureF.2 Modelsensitivity 18-hourduration 1%AEPfloodevent withtailwaterlevel increasedby500mm ReportMHL2789 ReviewofBulahdelah FloodplainRisk ManagementStudyandPlan ©Crown2021/AerialImagerySource:GoogleMaps2021 Studyarea Afflux(m) <-0.50 -0.50to-0.20 -0.20to-0.10 -0.10to-0.05 -0.05to-0.02 -0.02to-0.01 -0.01to0.01 0.01to0.02 0.02to0.05 0.05to0.10 0.10to0.20 0.20to0.50 >0.50 Waswetnowdry Wasdrynowwet Legend ©AerialImagerySource:Nearmap2021
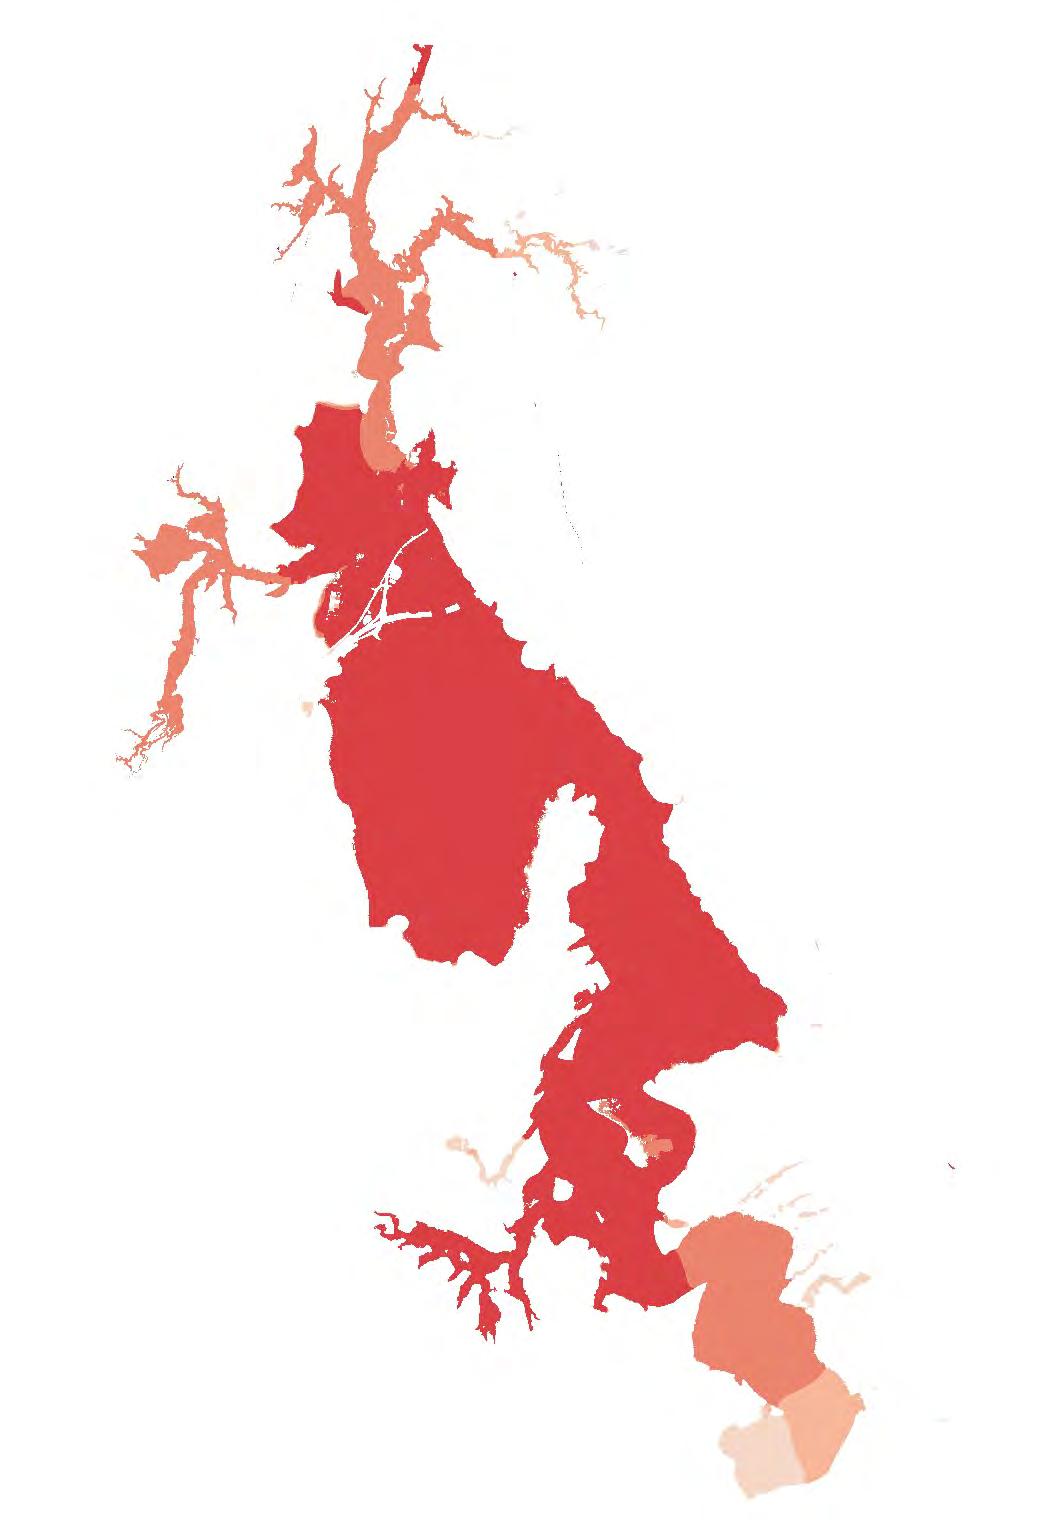

N FigureF.3 Modelsensitivity 18-hourduration 1%AEPfloodevent withnolosses ReportMHL2789 ReviewofBulahdelah FloodplainRisk ManagementStudyandPlan ©Crown2021/AerialImagerySource:GoogleMaps2021 Studyarea Afflux(m) <-0.50 -0.50to-0.20 -0.20to-0.10 -0.10to-0.05 -0.05to-0.02 -0.02to-0.01 -0.01to0.01 0.01to0.02 0.02to0.05 0.05to0.10 0.10to0.20 0.20to0.50 >0.50 Waswetnowdry Wasdrynowwet Legend ©AerialImagerySource:Nearmap2021
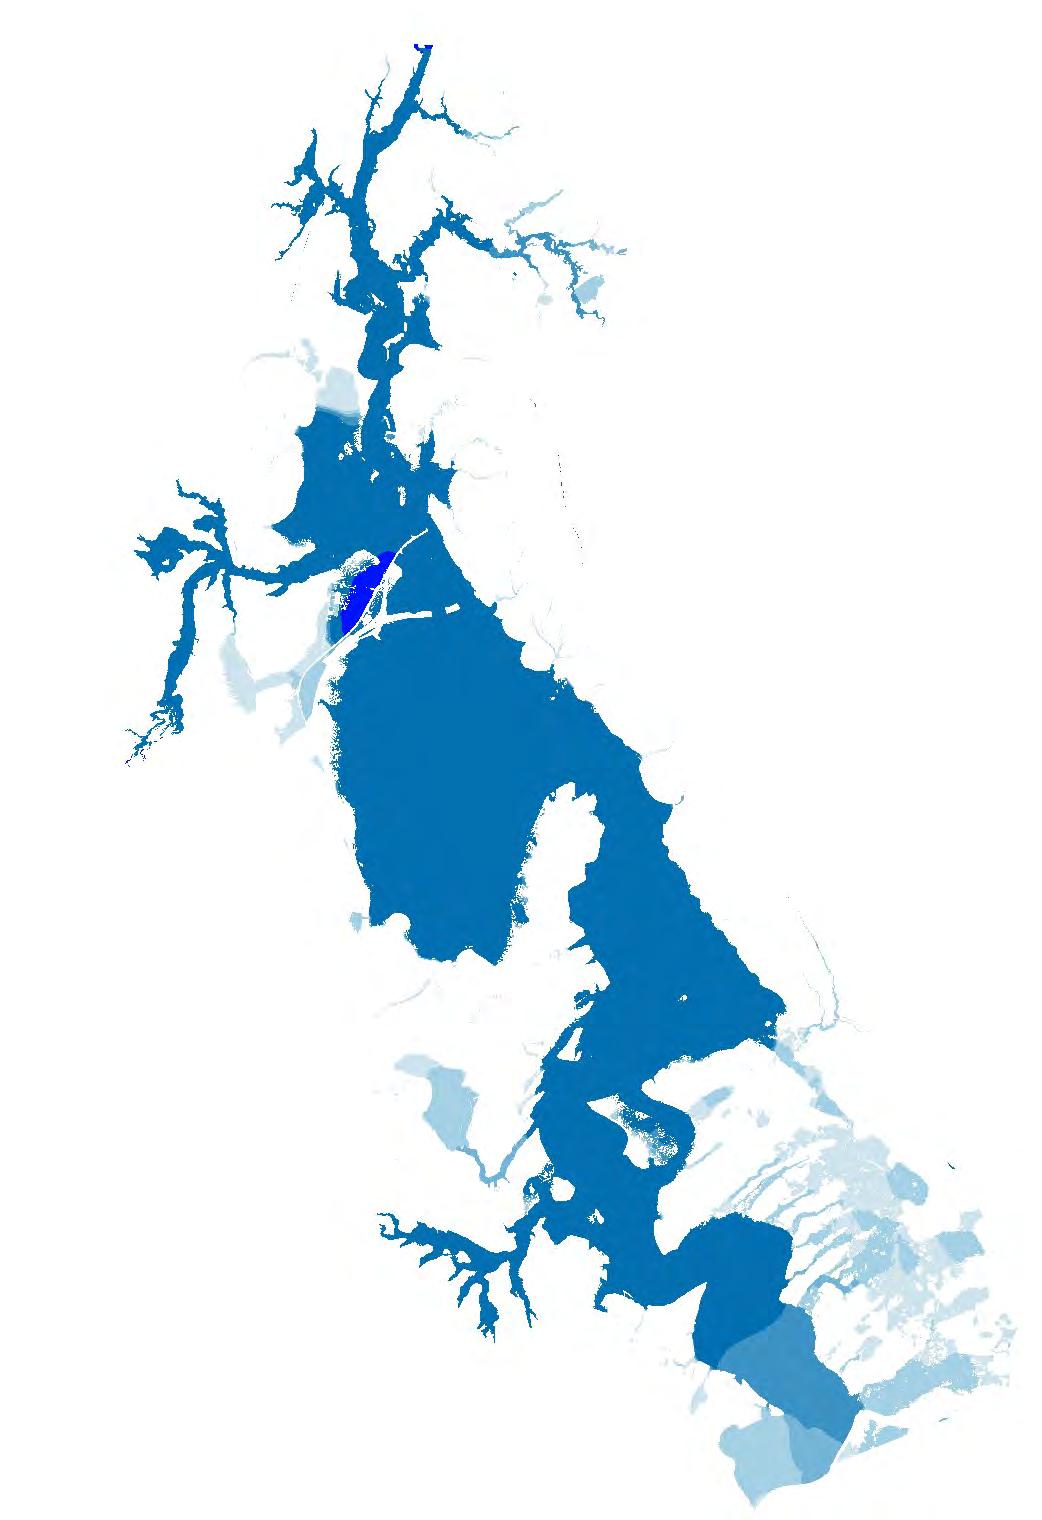

N FigureF.4 Modelsensitivity 18-hourduration 1%AEPfloodevent withhighlosses ReportMHL2789 ReviewofBulahdelah FloodplainRisk ManagementStudyandPlan ©Crown2021/AerialImagerySource:GoogleMaps2021 Studyarea Afflux(m) <-0.50 -0.50to-0.20 -0.20to-0.10 -0.10to-0.05 -0.05to-0.02 -0.02to-0.01 -0.01to0.01 0.01to0.02 0.02to0.05 0.05to0.10 0.10to0.20 0.20to0.50 >0.50 Waswetnowdry Wasdrynowwet Legend ©AerialImagerySource:Nearmap2021

N FigureF.5 Modelsensitivity 18-hourduration 1%AEPfloodevent withroughness decreasedby20% ReportMHL2789 ReviewofBulahdelah FloodplainRisk ManagementStudyandPlan ©Crown2021/AerialImagerySource:GoogleMaps2021 Studyarea Afflux(m) <-0.50 -0.50to-0.20 -0.20to-0.10 -0.10to-0.05 -0.05to-0.02 -0.02to-0.01 -0.01to0.01 0.01to0.02 0.02to0.05 0.05to0.10 0.10to0.20 0.20to0.50 >0.50 Waswetnowdry Wasdrynowwet Legend ©AerialImagerySource:Nearmap2021
N FigureF.6 Modelsensitivity 18-hourduration 1%AEPfloodevent withroughness increasedby20% ReportMHL2789 ReviewofBulahdelah FloodplainRisk ManagementStudyandPlan ©Crown2021/AerialImagerySource:GoogleMaps2021 Studyarea Afflux(m) <-0.50 -0.50to-0.20 -0.20to-0.10 -0.10to-0.05 -0.05to-0.02 -0.02to-0.01 -0.01to0.01 0.01to0.02 0.02to0.05 0.05to0.10 0.10to0.20 0.20to0.50 >0.50 Waswetnowdry Wasdrynowwet Legend ©AerialImagerySource:Nearmap2021

N FigureF.7 Modelsensitivity 18-hourduration 1%AEPfloodevent withnoblockage ReportMHL2789 ReviewofBulahdelah FloodplainRisk ManagementStudyandPlan ©Crown2021/AerialImagerySource:GoogleMaps2021 Studyarea Afflux(m) <-0.50 -0.50to-0.20 -0.20to-0.10 -0.10to-0.05 -0.05to-0.02 -0.02to-0.01 -0.01to0.01 0.01to0.02 0.02to0.05 0.05to0.10 0.10to0.20 0.20to0.50 >0.50 Waswetnowdry Wasdrynowwet Legend ©AerialImagerySource:Nearmap2021

N FigureF.8 Modelsensitivity 18-hourduration 1%AEPfloodevent withdoubledesign blockage ReportMHL2789 ReviewofBulahdelah FloodplainRisk ManagementStudyandPlan ©Crown2021/AerialImagerySource:GoogleMaps2021 Studyarea Afflux(m) <-0.50 -0.50to-0.20 -0.20to-0.10 -0.10to-0.05 -0.05to-0.02 -0.02to-0.01 -0.01to0.01 0.01to0.02 0.02to0.05 0.05to0.10 0.10to0.20 0.20to0.50 >0.50 Waswetnowdry Wasdrynowwet Legend ©AerialImagerySource:Nearmap2021

N FigureF.9 Modelsensitivity 45-minuteduration 1%AEPfloodevent withtailwaterlevel reducedby500mm ReportMHL2789 ReviewofBulahdelah FloodplainRisk ManagementStudyandPlan ©Crown2021/AerialImagerySource:GoogleMaps2021 Studyarea Afflux(m) <-0.50 -0.50to-0.20 -0.20to-0.10 -0.10to-0.05 -0.05to-0.02 -0.02to-0.01 -0.01to0.01 0.01to0.02 0.02to0.05 0.05to0.10 0.10to0.20 0.20to0.50 >0.50 Waswetnowdry Wasdrynowwet Legend ©AerialImagerySource:Nearmap2021

N FigureF.10 Modelsensitivity 45-minuteduration 1%AEPfloodevent withtailwaterlevel increasedby500mm ReportMHL2789 ReviewofBulahdelah FloodplainRisk ManagementStudyandPlan ©Crown2021/AerialImagerySource:GoogleMaps2021 Studyarea Afflux(m) <-0.50 -0.50to-0.20 -0.20to-0.10 -0.10to-0.05 -0.05to-0.02 -0.02to-0.01 -0.01to0.01 0.01to0.02 0.02to0.05 0.05to0.10 0.10to0.20 0.20to0.50 >0.50 Waswetnowdry Wasdrynowwet Legend ©AerialImagerySource:Nearmap2021


N FigureF.11 Modelsensitivity 45-minuteduration 1%AEPfloodevent withnolosses ReportMHL2789 ReviewofBulahdelah FloodplainRisk ManagementStudyandPlan ©Crown2021/AerialImagerySource:GoogleMaps2021 Studyarea Afflux(m) <-0.50 -0.50to-0.20 -0.20to-0.10 -0.10to-0.05 -0.05to-0.02 -0.02to-0.01 -0.01to0.01 0.01to0.02 0.02to0.05 0.05to0.10 0.10to0.20 0.20to0.50 >0.50 Waswetnowdry Wasdrynowwet Legend ©AerialImagerySource:Nearmap2021

N FigureF.12 Modelsensitivity 45-minuteduration 1%AEPfloodevent withhighlosses ReportMHL2789 ReviewofBulahdelah FloodplainRisk ManagementStudyandPlan ©Crown2021/AerialImagerySource:GoogleMaps2021 Studyarea Afflux(m) <-0.50 -0.50to-0.20 -0.20to-0.10 -0.10to-0.05 -0.05to-0.02 -0.02to-0.01 -0.01to0.01 0.01to0.02 0.02to0.05 0.05to0.10 0.10to0.20 0.20to0.50 >0.50 Waswetnowdry Wasdrynowwet Legend ©AerialImagerySource:Nearmap2021
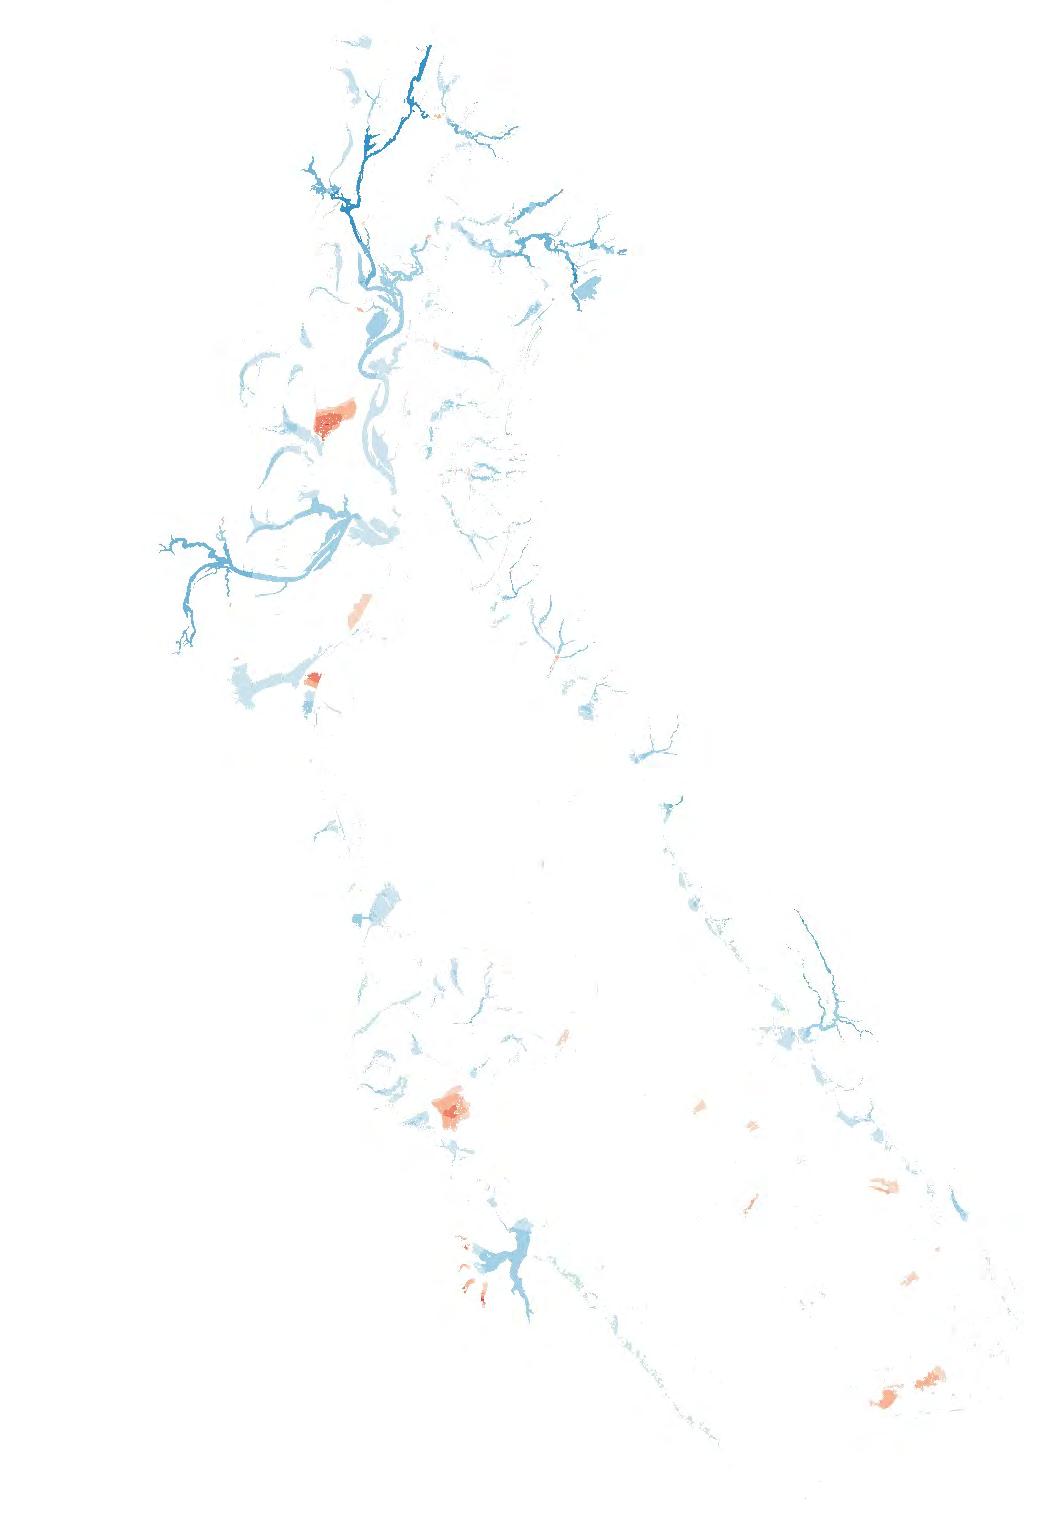
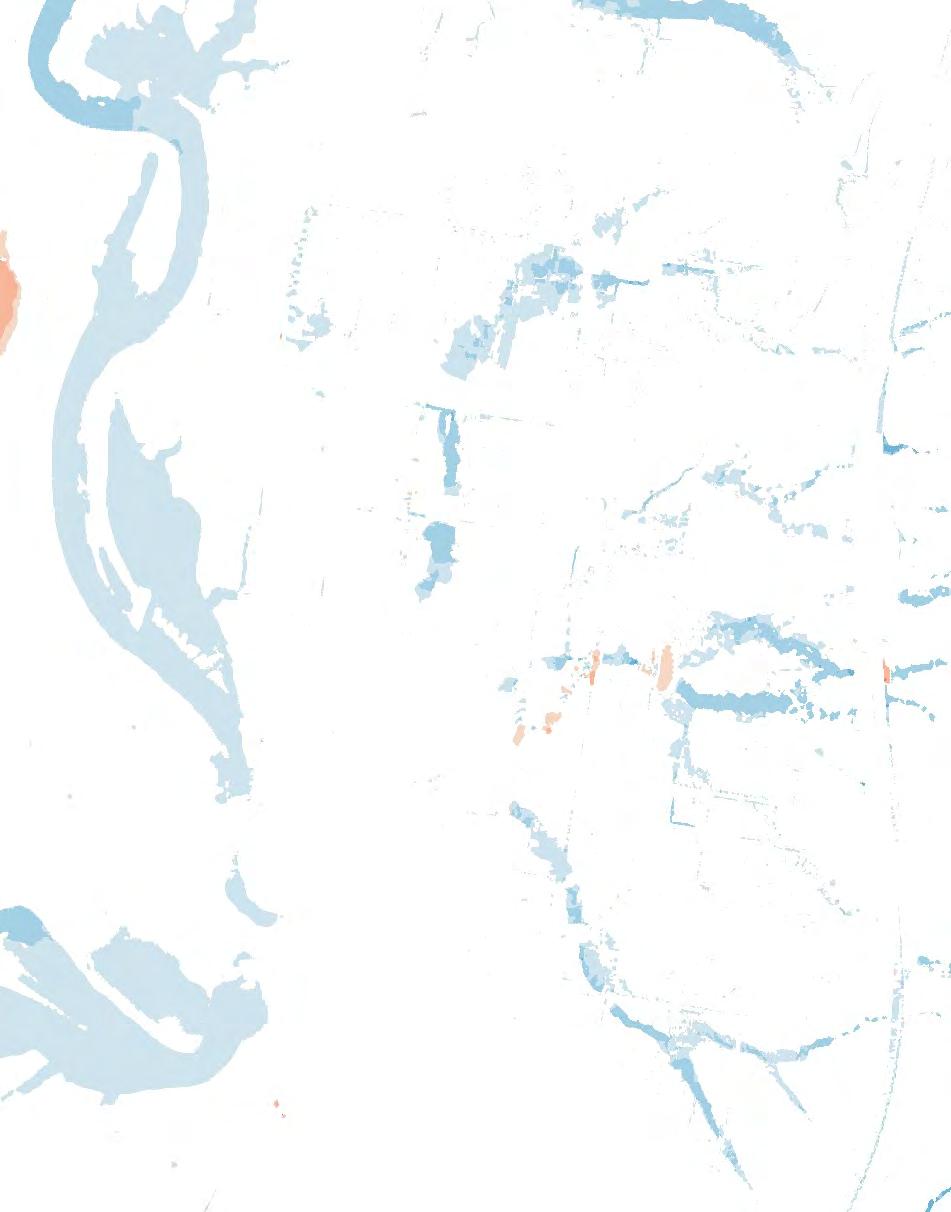
N FigureF.13 Modelsensitivity 45-minuteduration 1%AEPfloodevent withroughness decreasedby20% ReportMHL2789 ReviewofBulahdelah FloodplainRisk ManagementStudyandPlan ©Crown2021/AerialImagerySource:GoogleMaps2021 Studyarea Afflux(m) <-0.50 -0.50to-0.20 -0.20to-0.10 -0.10to-0.05 -0.05to-0.02 -0.02to-0.01 -0.01to0.01 0.01to0.02 0.02to0.05 0.05to0.10 0.10to0.20 0.20to0.50 >0.50 Waswetnowdry Wasdrynowwet Legend ©AerialImagerySource:Nearmap2021
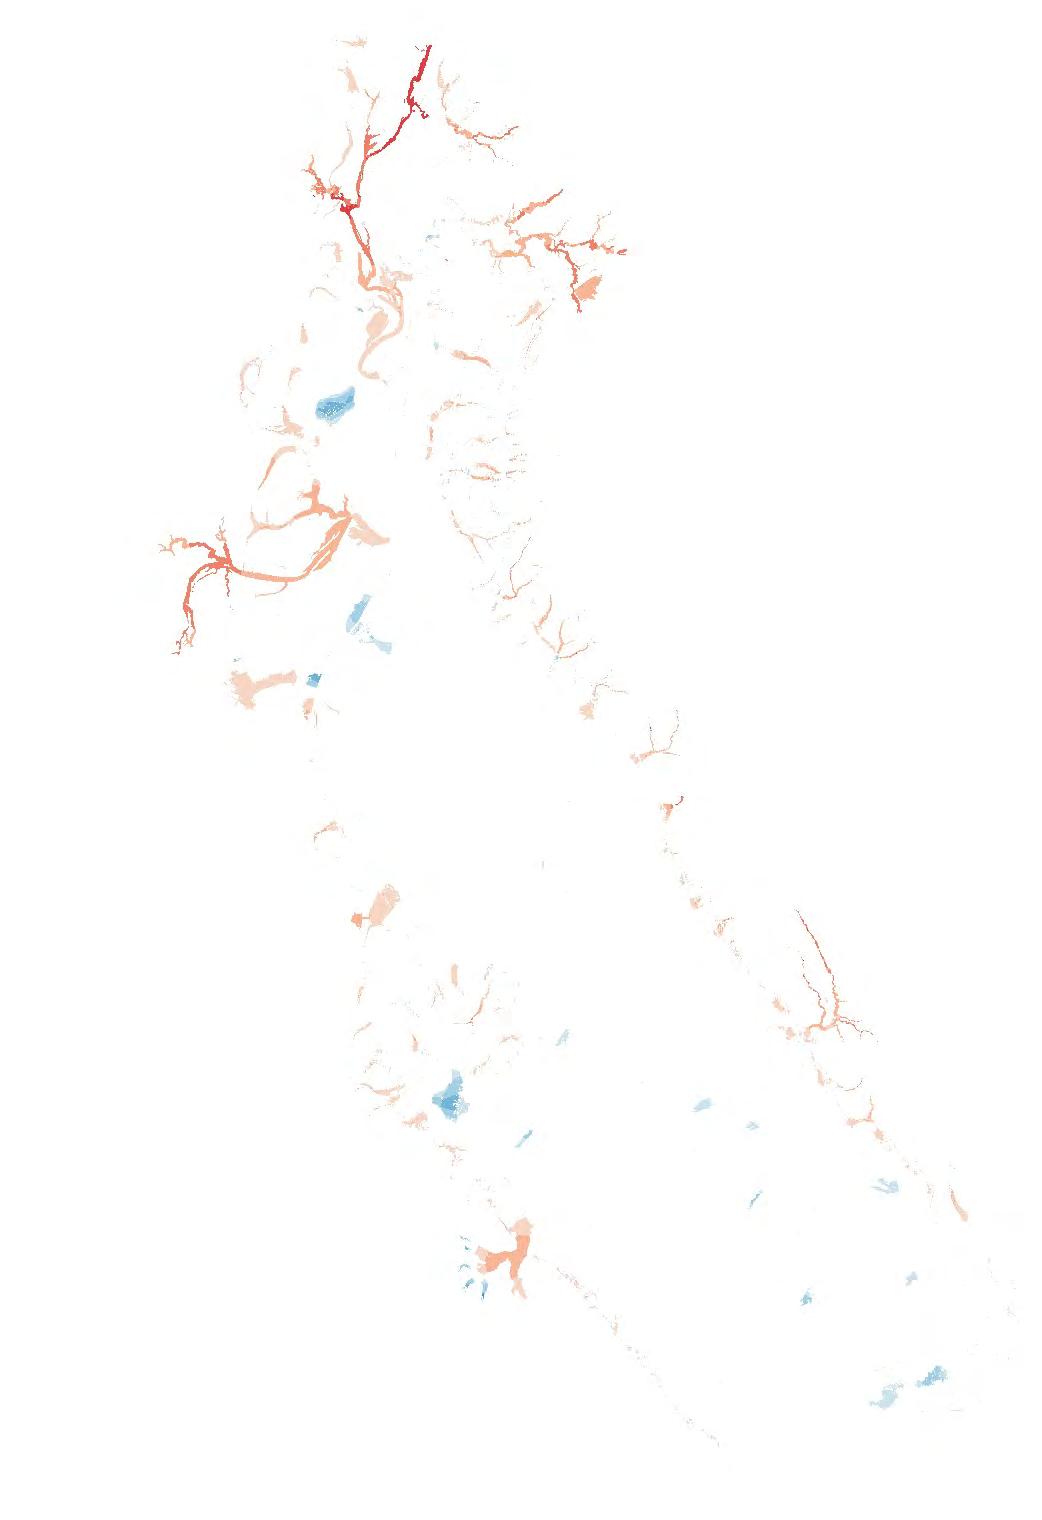

N FigureF.14 Modelsensitivity 45-minuteduration 1%AEPfloodevent withroughness increasedby20% ReportMHL2789 ReviewofBulahdelah FloodplainRisk ManagementStudyandPlan ©Crown2021/AerialImagerySource:GoogleMaps2021 Studyarea Afflux(m) <-0.50 -0.50to-0.20 -0.20to-0.10 -0.10to-0.05 -0.05to-0.02 -0.02to-0.01 -0.01to0.01 0.01to0.02 0.02to0.05 0.05to0.10 0.10to0.20 0.20to0.50 >0.50 Waswetnowdry Wasdrynowwet Legend ©AerialImagerySource:Nearmap2021
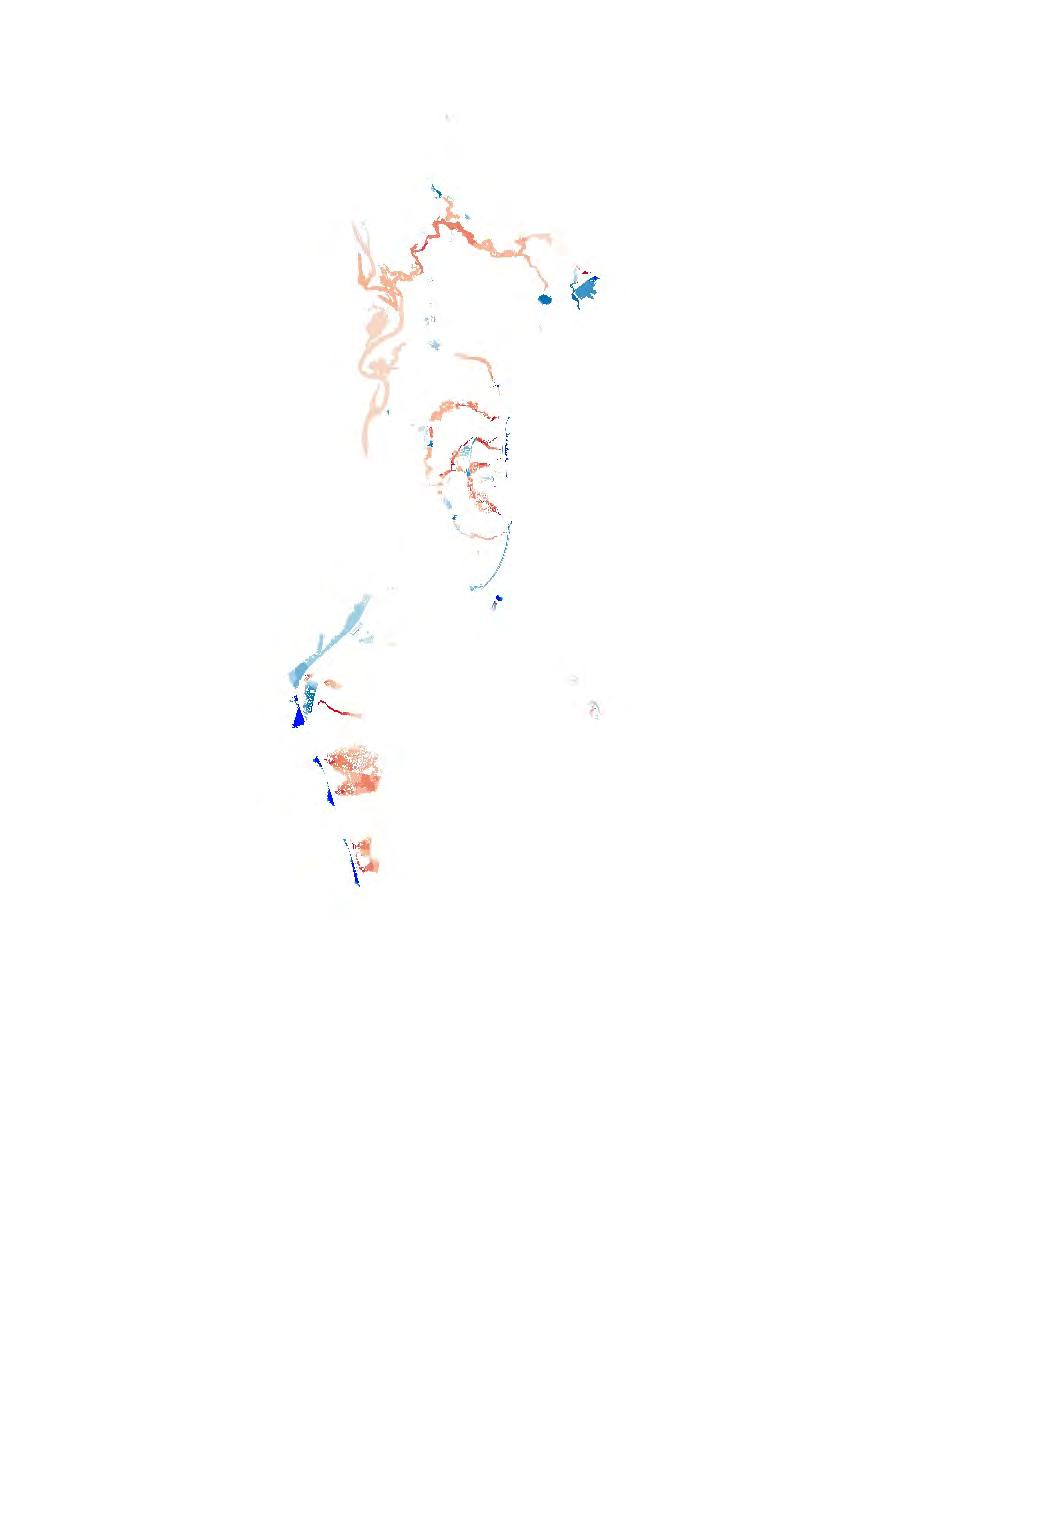
N FigureF.15 Modelsensitivity 45-minuteduration 1%AEPfloodevent withnoblockage ReportMHL2789 ReviewofBulahdelah FloodplainRisk ManagementStudyandPlan ©Crown2021/AerialImagerySource:GoogleMaps2021 Studyarea Afflux(m) <-0.50 -0.50to-0.20 -0.20to-0.10 -0.10to-0.05 -0.05to-0.02 -0.02to-0.01 -0.01to0.01 0.01to0.02 0.02to0.05 0.05to0.10 0.10to0.20 0.20to0.50 >0.50 Waswetnowdry Wasdrynowwet Legend ©AerialImagerySource:Nearmap2021

N FigureF.16 Modelsensitivity 45-minuteduration 1%AEPfloodevent withdoubledesign blockage ReportMHL2789 ReviewofBulahdelah FloodplainRisk ManagementStudyandPlan ©Crown2021/AerialImagerySource:GoogleMaps2021 Studyarea Afflux(m) <-0.50 -0.50to-0.20 -0.20to-0.10 -0.10to-0.05 -0.05to-0.02 -0.02to-0.01 -0.01to0.01 0.01to0.02 0.02to0.05 0.05to0.10 0.10to0.20 0.20to0.50 >0.50 Waswetnowdry Wasdrynowwet Legend ©AerialImagerySource:Nearmap2021
Flood maps

MHL2789 – G1 © Crown 2021 Classification: Release by consent
N FigureG.1.1 20%AEPfloodevent peakwaterlevel ReportMHL2789 ReviewofBulahdelah FloodplainRisk ManagementStudyandPlan ©Crown2021/AerialImagerySource:GoogleMaps2021 Studyarea 1mcontour 5mcontour FloodLevel(mAHD) Legend <=1.6 1.6-1.8 1.8-2.0 2.0-2.2 2.2-2.4 2.4-2.6 2.6-2.8 2.8-3.0 3.0-3.2 3.2-3.4 3.4-3.6 3.6-3.8 3.8-4.0 4-5 5-6 6-7 7-8 8-9 9-10 10-12 12-14 14-16 16-18 18-20 25-30 30-40 40-50 >50 ©AerialImagerySource:Nearmap2021

N FigureG.1.2 5%AEPfloodevent peakwaterlevel ReportMHL2789 ReviewofBulahdelah FloodplainRisk ManagementStudyandPlan ©Crown2021/AerialImagerySource:GoogleMaps2021 Studyarea 1mcontour 5mcontour FloodLevel(mAHD) Legend <=1.6 1.6-1.8 1.8-2.0 2.0-2.2 2.2-2.4 2.4-2.6 2.6-2.8 2.8-3.0 3.0-3.2 3.2-3.4 3.4-3.6 3.6-3.8 3.8-4.0 4-5 5-6 6-7 7-8 8-9 9-10 10-12 12-14 14-16 16-18 18-20 25-30 30-40 40-50 >50 ©AerialImagerySource:Nearmap2021

N FigureG.1.3 1%AEPfloodevent peakwaterlevel ReportMHL2789 ReviewofBulahdelah FloodplainRisk ManagementStudyandPlan ©Crown2021/AerialImagerySource:GoogleMaps2021 Studyarea 1mcontour 5mcontour FloodLevel(mAHD) Legend <=1.6 1.6-1.8 1.8-2.0 2.0-2.2 2.2-2.4 2.4-2.6 2.6-2.8 2.8-3.0 3.0-3.2 3.2-3.4 3.4-3.6 3.6-3.8 3.8-4.0 4-5 5-6 6-7 7-8 8-9 9-10 10-12 12-14 14-16 16-18 18-20 25-30 30-40 40-50 >50 ©AerialImagerySource:Nearmap2021

N FigureG.1.4 1in200AEPflood eventpeakwater level ReportMHL2789 ReviewofBulahdelah FloodplainRisk ManagementStudyandPlan ©Crown2021/AerialImagerySource:GoogleMaps2021 Studyarea 1mcontour 5mcontour FloodLevel(mAHD) Legend <=1.6 1.6-1.8 1.8-2.0 2.0-2.2 2.2-2.4 2.4-2.6 2.6-2.8 2.8-3.0 3.0-3.2 3.2-3.4 3.4-3.6 3.6-3.8 3.8-4.0 4-5 5-6 6-7 7-8 8-9 9-10 10-12 12-14 14-16 16-18 18-20 25-30 30-40 40-50 >50 ©AerialImagerySource:Nearmap2021
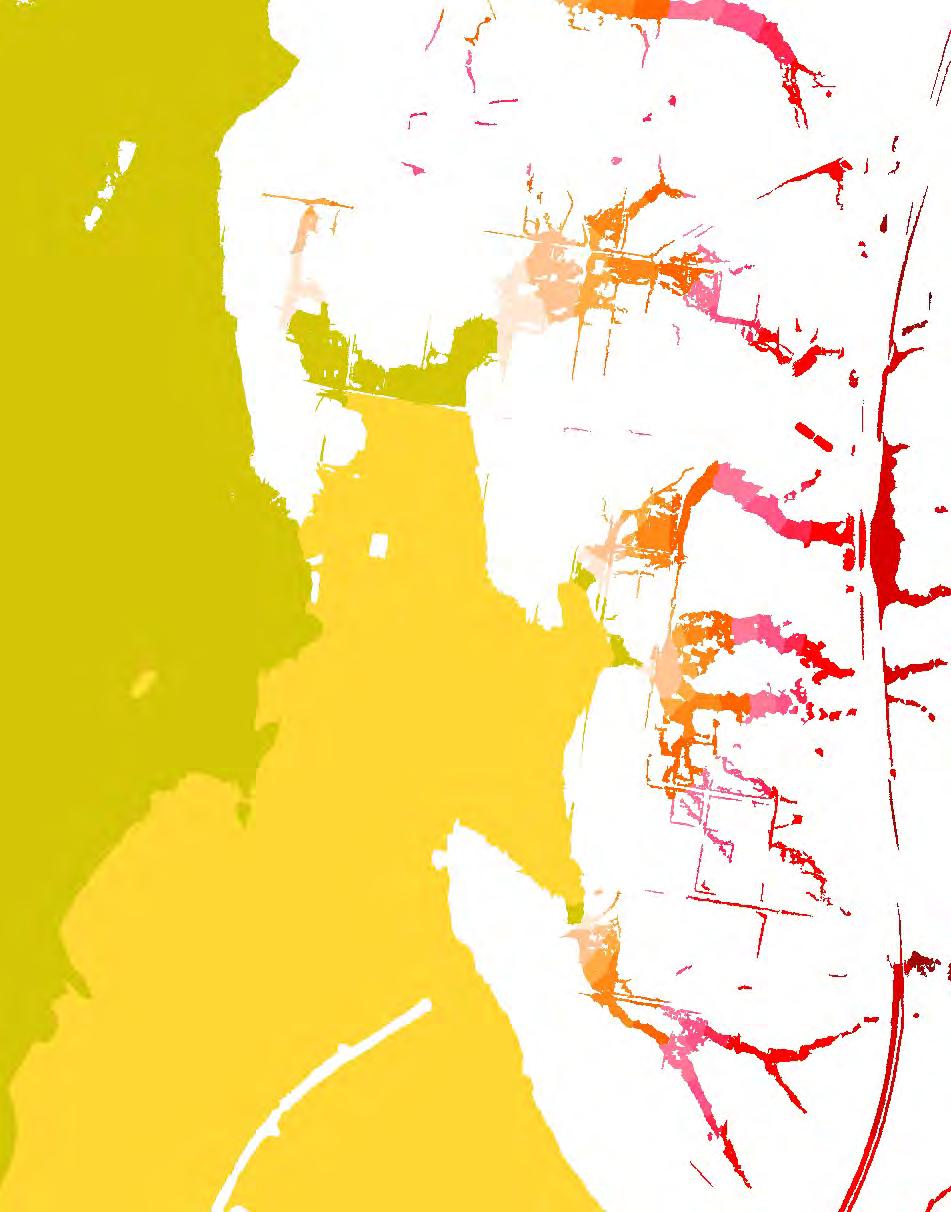
N FigureG.1.5 1in500AEPflood eventpeakwater level ReportMHL2789 ReviewofBulahdelah FloodplainRisk ManagementStudyandPlan ©Crown2021/AerialImagerySource:GoogleMaps2021 Studyarea 1mcontour 5mcontour FloodLevel(mAHD) Legend <=1.6 1.6-1.8 1.8-2.0 2.0-2.2 2.2-2.4 2.4-2.6 2.6-2.8 2.8-3.0 3.0-3.2 3.2-3.4 3.4-3.6 3.6-3.8 3.8-4.0 4-5 5-6 6-7 7-8 8-9 9-10 10-12 12-14 14-16 16-18 18-20 25-30 30-40 40-50 >50 ©AerialImagerySource:Nearmap2021
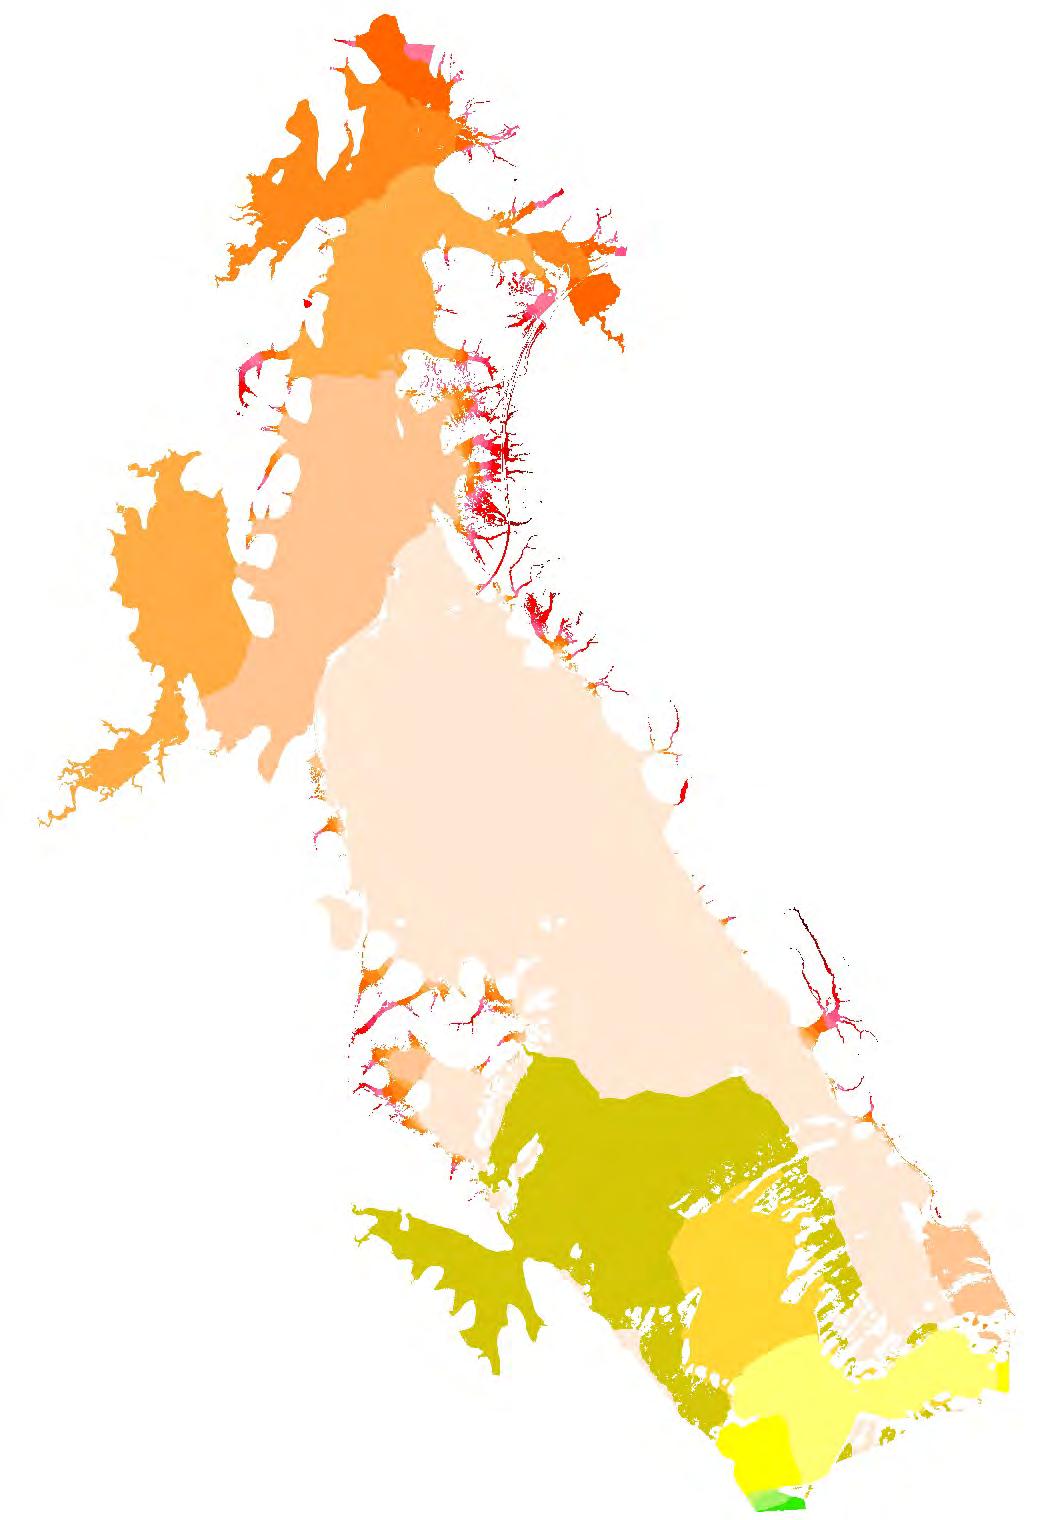

N FigureG.1.6 Probablemaximum floodeventpeak waterlevel ReportMHL2789 ReviewofBulahdelah FloodplainRisk ManagementStudyandPlan ©Crown2021/AerialImagerySource:GoogleMaps2021 Studyarea 1mcontour 5mcontour FloodLevel(mAHD) Legend <=1.6 1.6-1.8 1.8-2.0 2.0-2.2 2.2-2.4 2.4-2.6 2.6-2.8 2.8-3.0 3.0-3.2 3.2-3.4 3.4-3.6 3.6-3.8 3.8-4.0 4-5 5-6 6-7 7-8 8-9 9-10 10-12 12-14 14-16 16-18 18-20 25-30 30-40 40-50 >50 ©AerialImagerySource:Nearmap2021
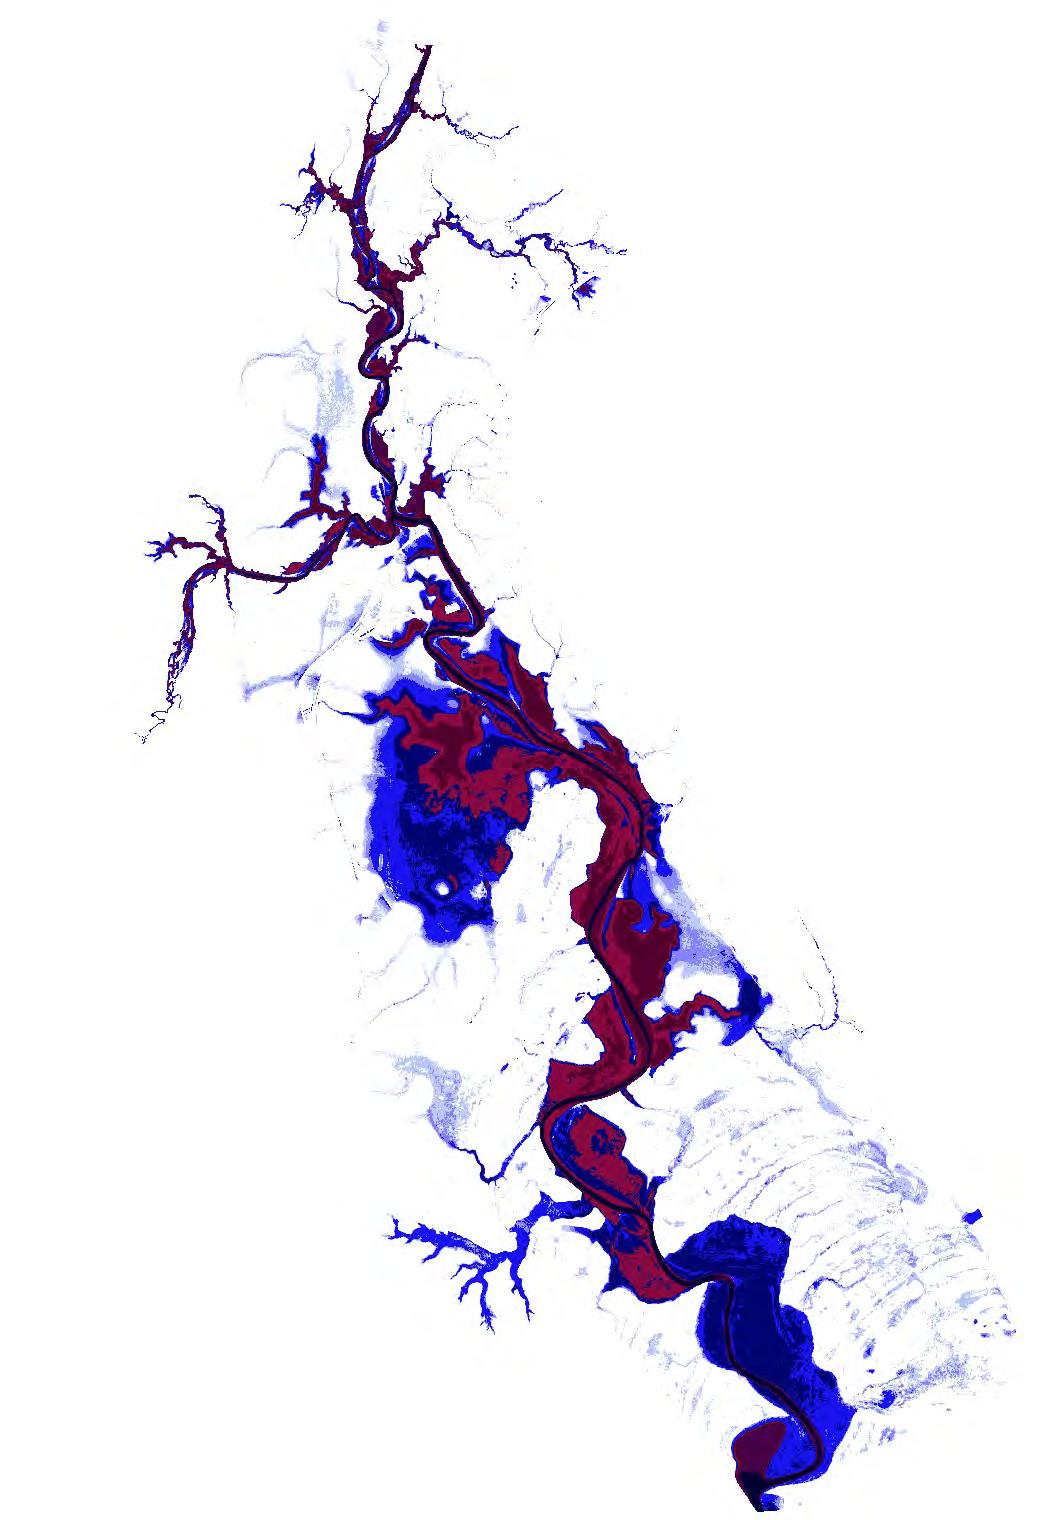
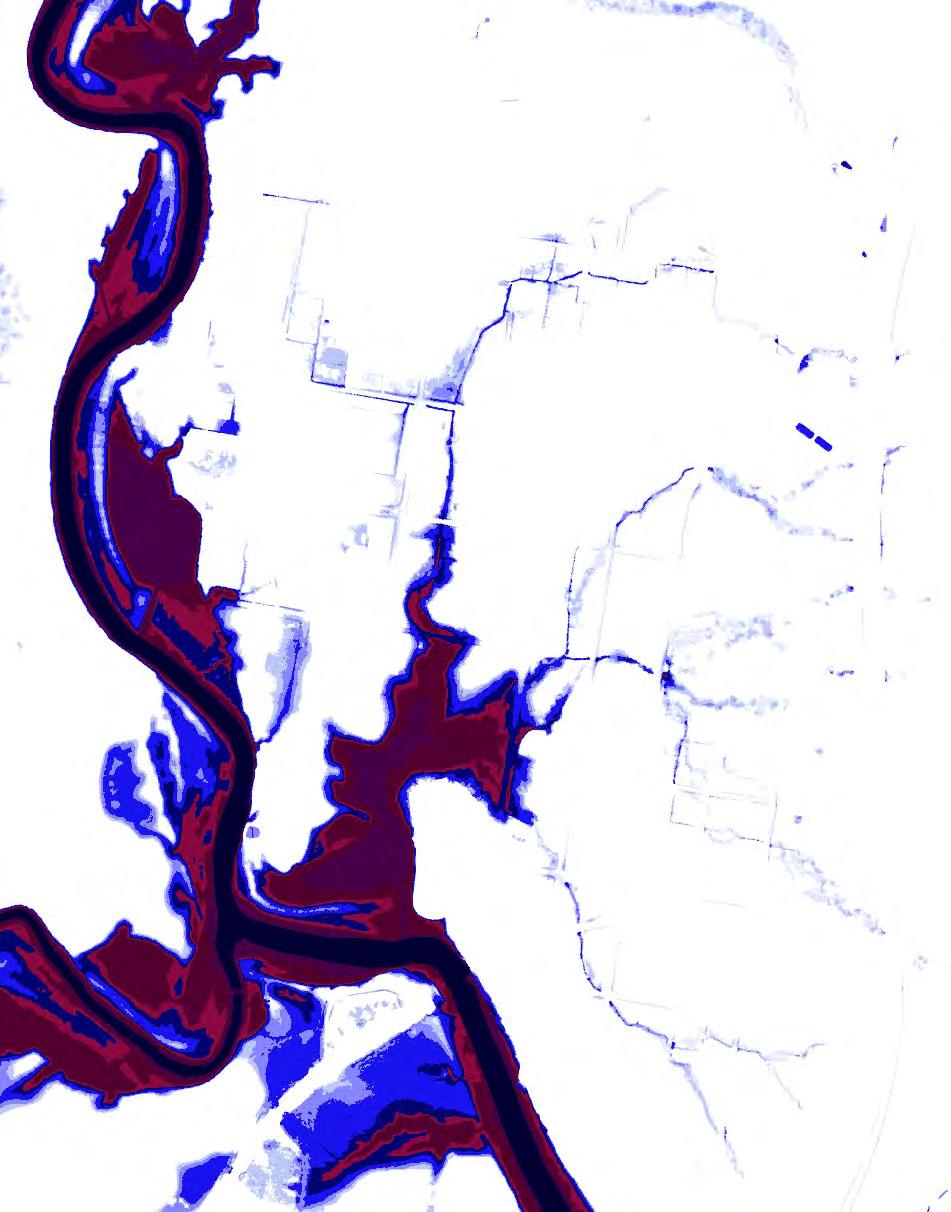
N FigureG.2.1 20%AEPfloodevent peakdepth ReportMHL2789 ReviewofBulahdelah FloodplainRisk ManagementStudyandPlan ©Crown2021/AerialImagerySource:GoogleMaps2021 Studyarea Depth(m) <=0.05 0.05-0.15 0.15-0.30 0.30-0.50 0.50-1.00 1.00-1.50 1.50-2.00 2.00-3.00 3.00-5.00 >5.00 Legend ©AerialImagerySource:Nearmap2021
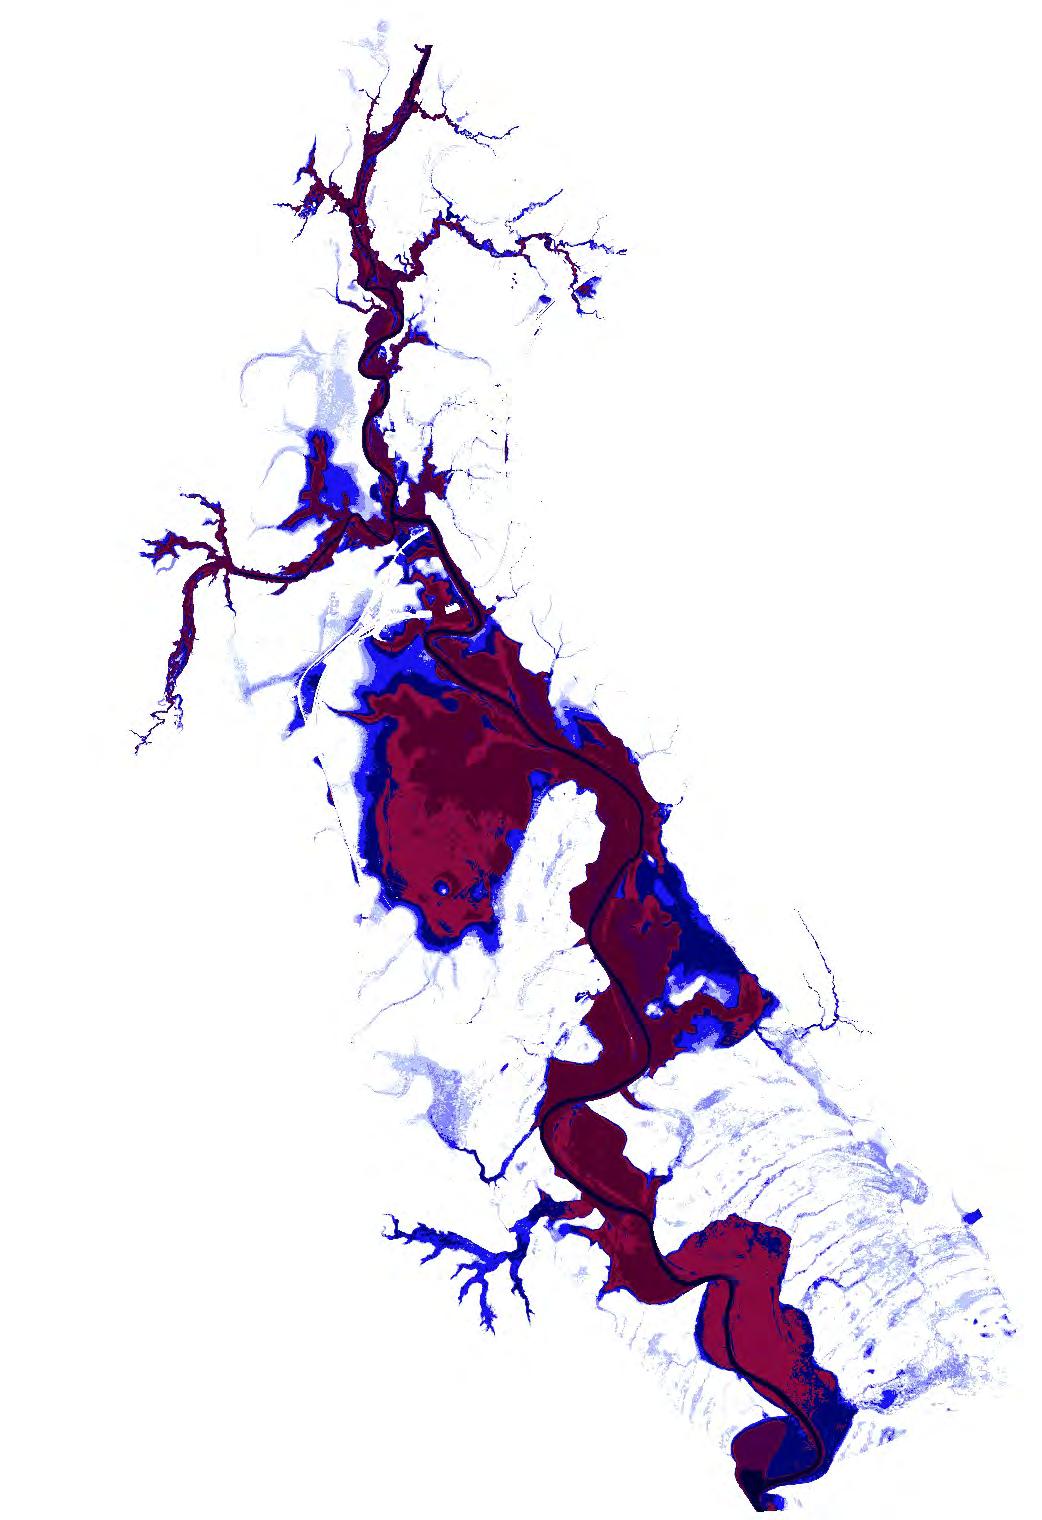
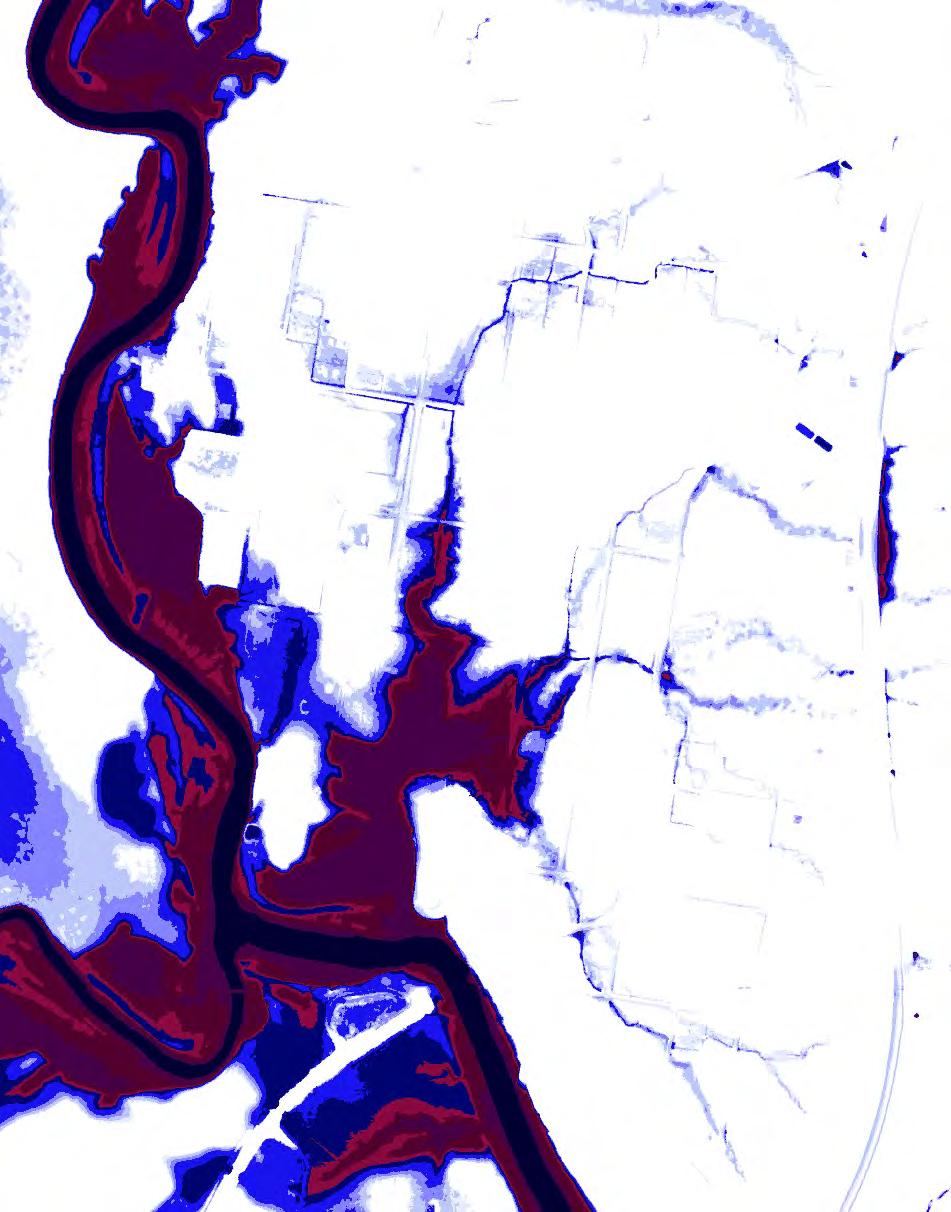
N FigureG.2.2 5%AEPfloodevent peakdepth ReportMHL2789 ReviewofBulahdelah FloodplainRisk ManagementStudyandPlan ©Crown2021/AerialImagerySource:GoogleMaps2021 Studyarea Depth(m) <=0.05 0.05-0.15 0.15-0.30 0.30-0.50 0.50-1.00 1.00-1.50 1.50-2.00 2.00-3.00 3.00-5.00 >5.00 Legend ©AerialImagerySource:Nearmap2021
N FigureG.2.3 1%AEPfloodevent peakdepth ReportMHL2789 ReviewofBulahdelah FloodplainRisk ManagementStudyandPlan ©Crown2021/AerialImagerySource:GoogleMaps2021 Studyarea Depth(m) <=0.05 0.05-0.15 0.15-0.30 0.30-0.50 0.50-1.00 1.00-1.50 1.50-2.00 2.00-3.00 3.00-5.00 >5.00 Legend ©AerialImagerySource:Nearmap2021

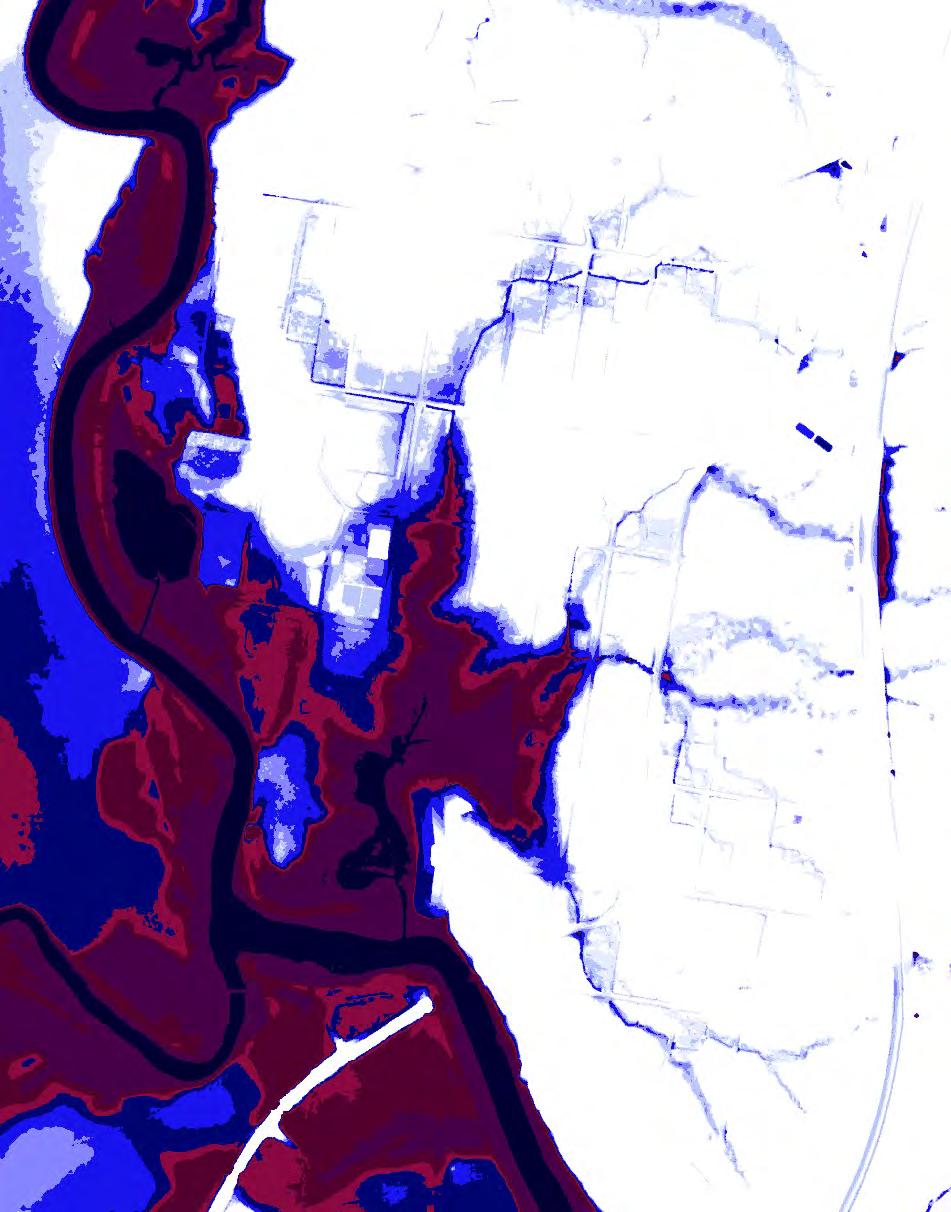
N FigureG.2.4 1in200AEPflood eventpeakdepth ReportMHL2789 ReviewofBulahdelah FloodplainRisk ManagementStudyandPlan ©Crown2021/AerialImagerySource:GoogleMaps2021 Studyarea Depth(m) <=0.05 0.05-0.15 0.15-0.30 0.30-0.50 0.50-1.00 1.00-1.50 1.50-2.00 2.00-3.00 3.00-5.00 >5.00 Legend ©AerialImagerySource:Nearmap2021
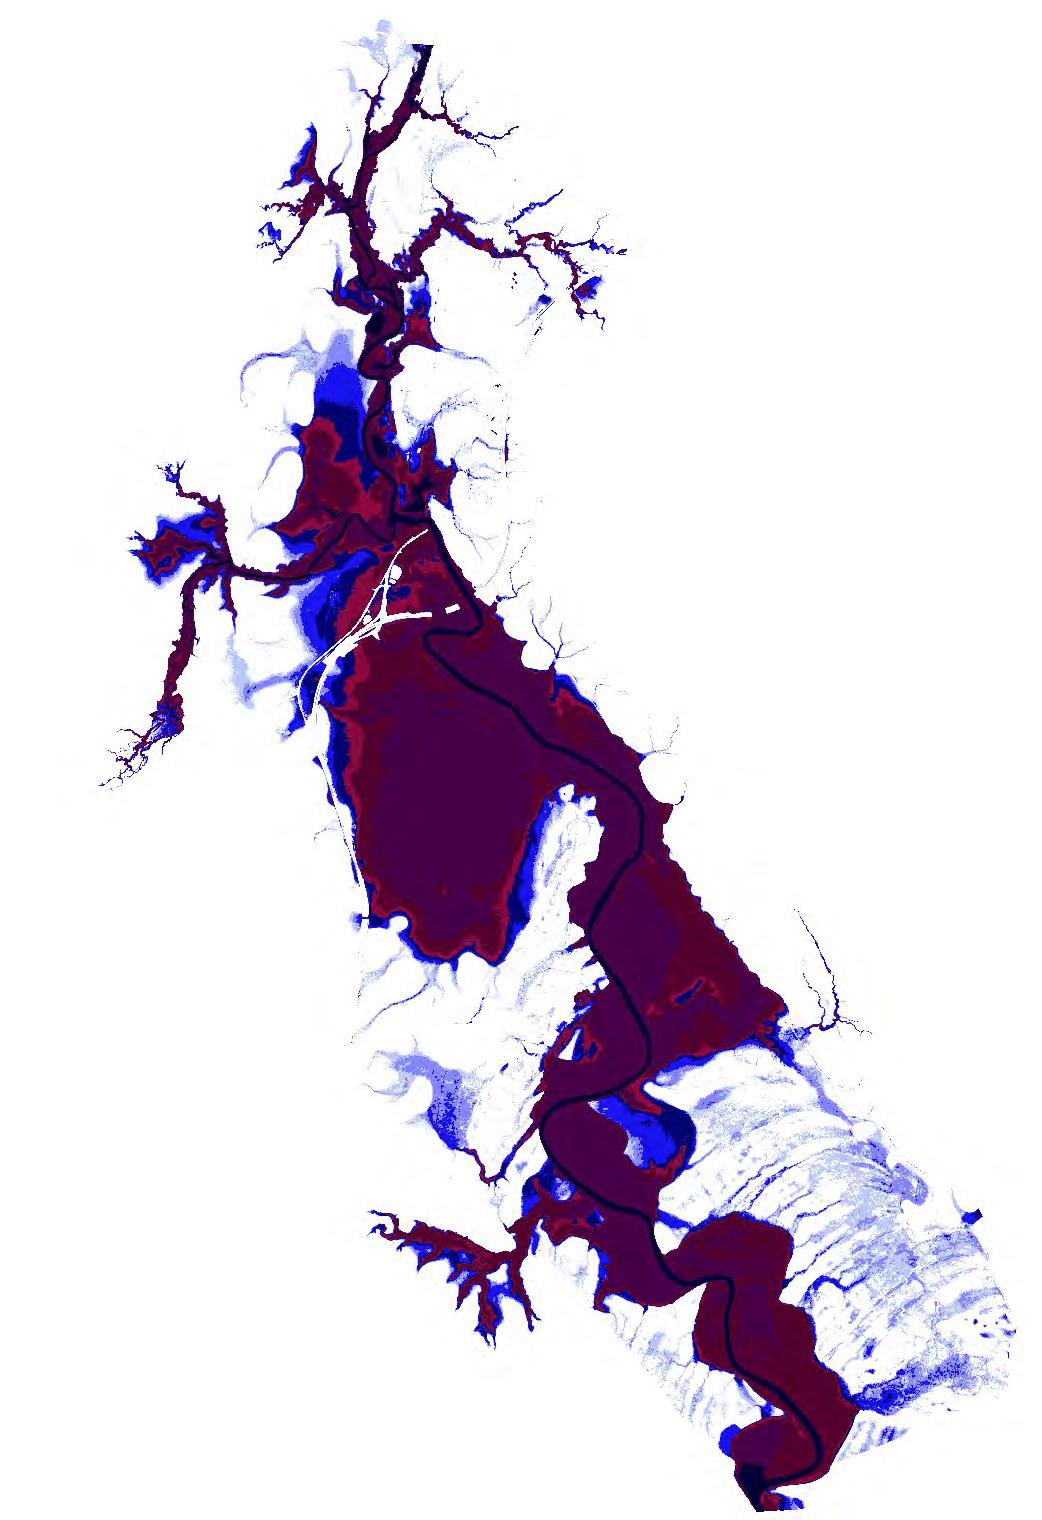
N FigureG.2.5 1in500AEPflood eventpeakdepth ReportMHL2789 ReviewofBulahdelah FloodplainRisk ManagementStudyandPlan ©Crown2021/AerialImagerySource:GoogleMaps2021 Studyarea Depth(m) <=0.05 0.05-0.15 0.15-0.30 0.30-0.50 0.50-1.00 1.00-1.50 1.50-2.00 2.00-3.00 3.00-5.00 >5.00 Legend ©AerialImagerySource:Nearmap2021
N FigureG.2.6 Probablemaximum floodeventpeak depth ReportMHL2789 ReviewofBulahdelah FloodplainRisk ManagementStudyandPlan ©Crown2021/AerialImagerySource:GoogleMaps2021 Studyarea Depth(m) <=0.05 0.05-0.15 0.15-0.30 0.30-0.50 0.50-1.00 1.00-1.50 1.50-2.00 2.00-3.00 3.00-5.00 >5.00 Legend ©AerialImagerySource:Nearmap2021
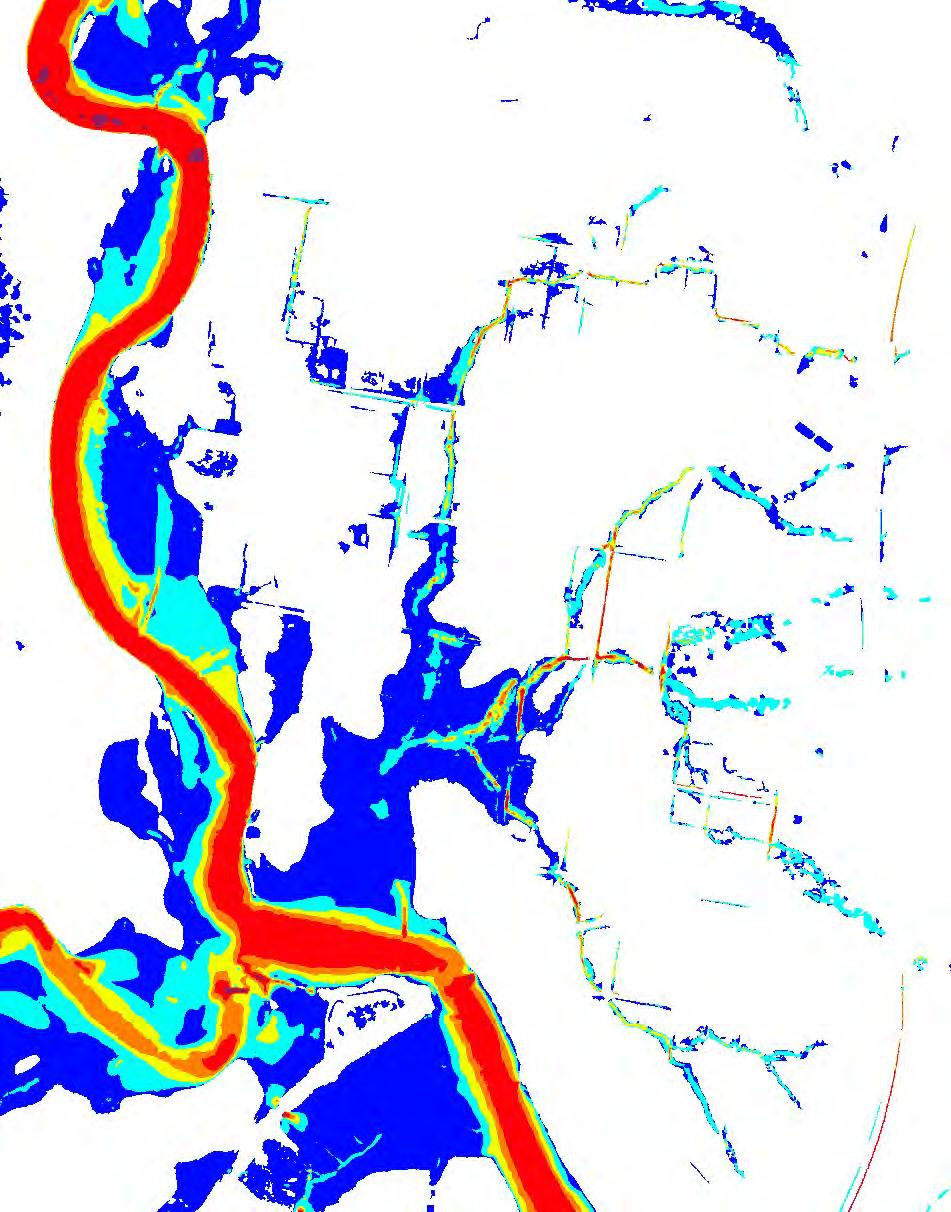
N FigureG.3.1 20%AEPfloodevent peakflowvelocity ReportMHL2789 ReviewofBulahdelah FloodplainRisk ManagementStudyandPlan ©Crown2021/AerialImagerySource:GoogleMaps2021 Studyarea Velocity(m/s) 0.00-0.25 0.25-0.50 0.50-0.75 0.75-1.00 1.00-1.50 >1.50 Legend ©AerialImagerySource:Nearmap2021
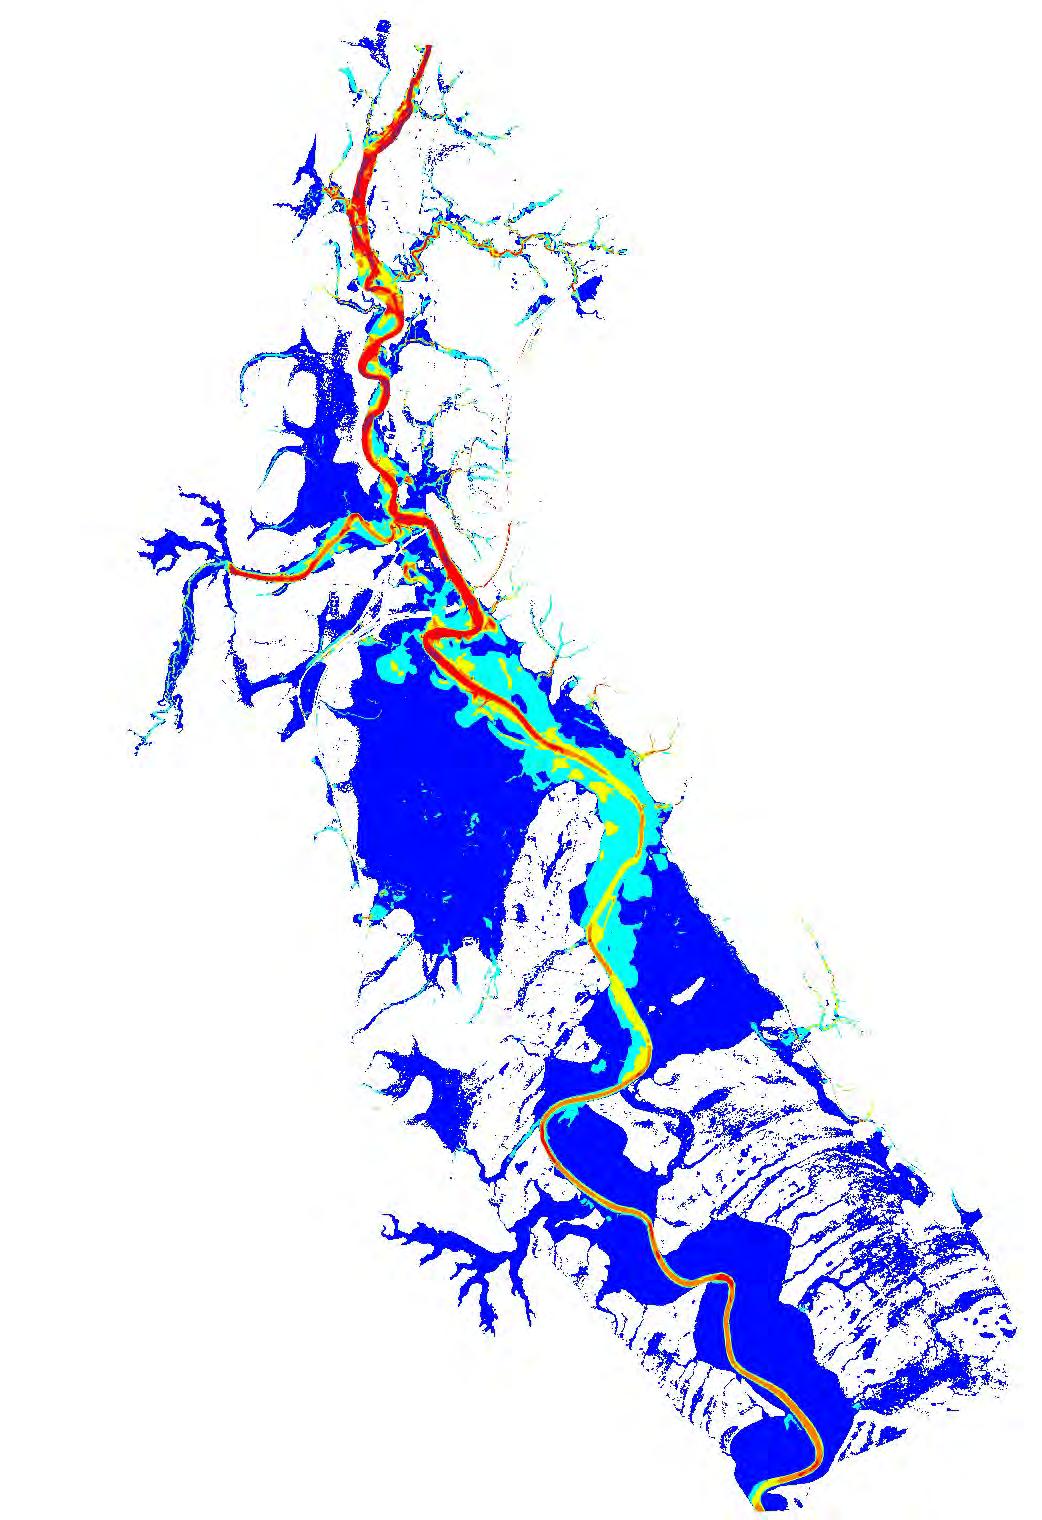
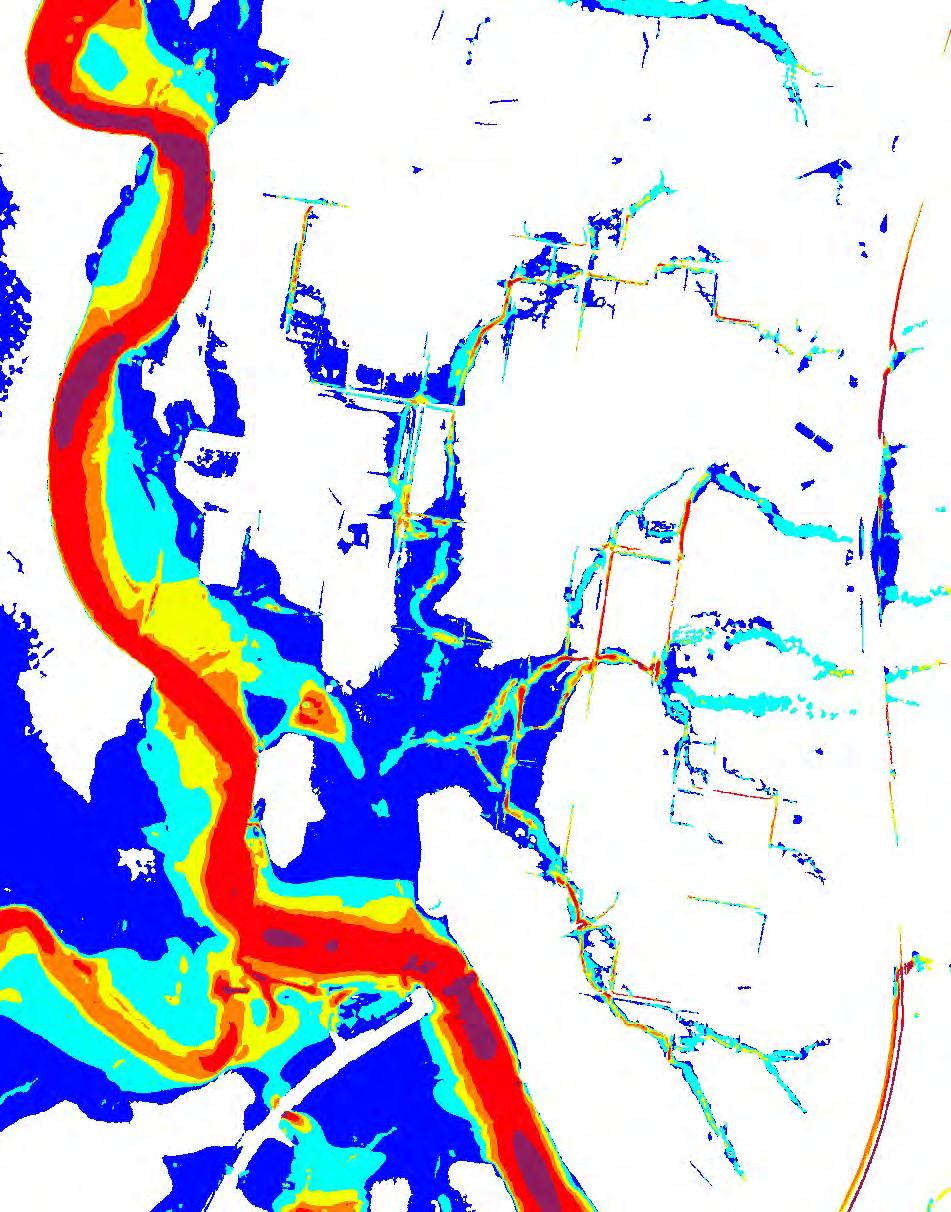
N FigureG.3.2 5%AEPfloodevent peakflowvelocity ReportMHL2789 ReviewofBulahdelah FloodplainRisk ManagementStudyandPlan ©Crown2021/AerialImagerySource:GoogleMaps2021 Studyarea Velocity(m/s) 0.00-0.25 0.25-0.50 0.50-0.75 0.75-1.00 1.00-1.50 >1.50 Legend ©AerialImagerySource:Nearmap2021
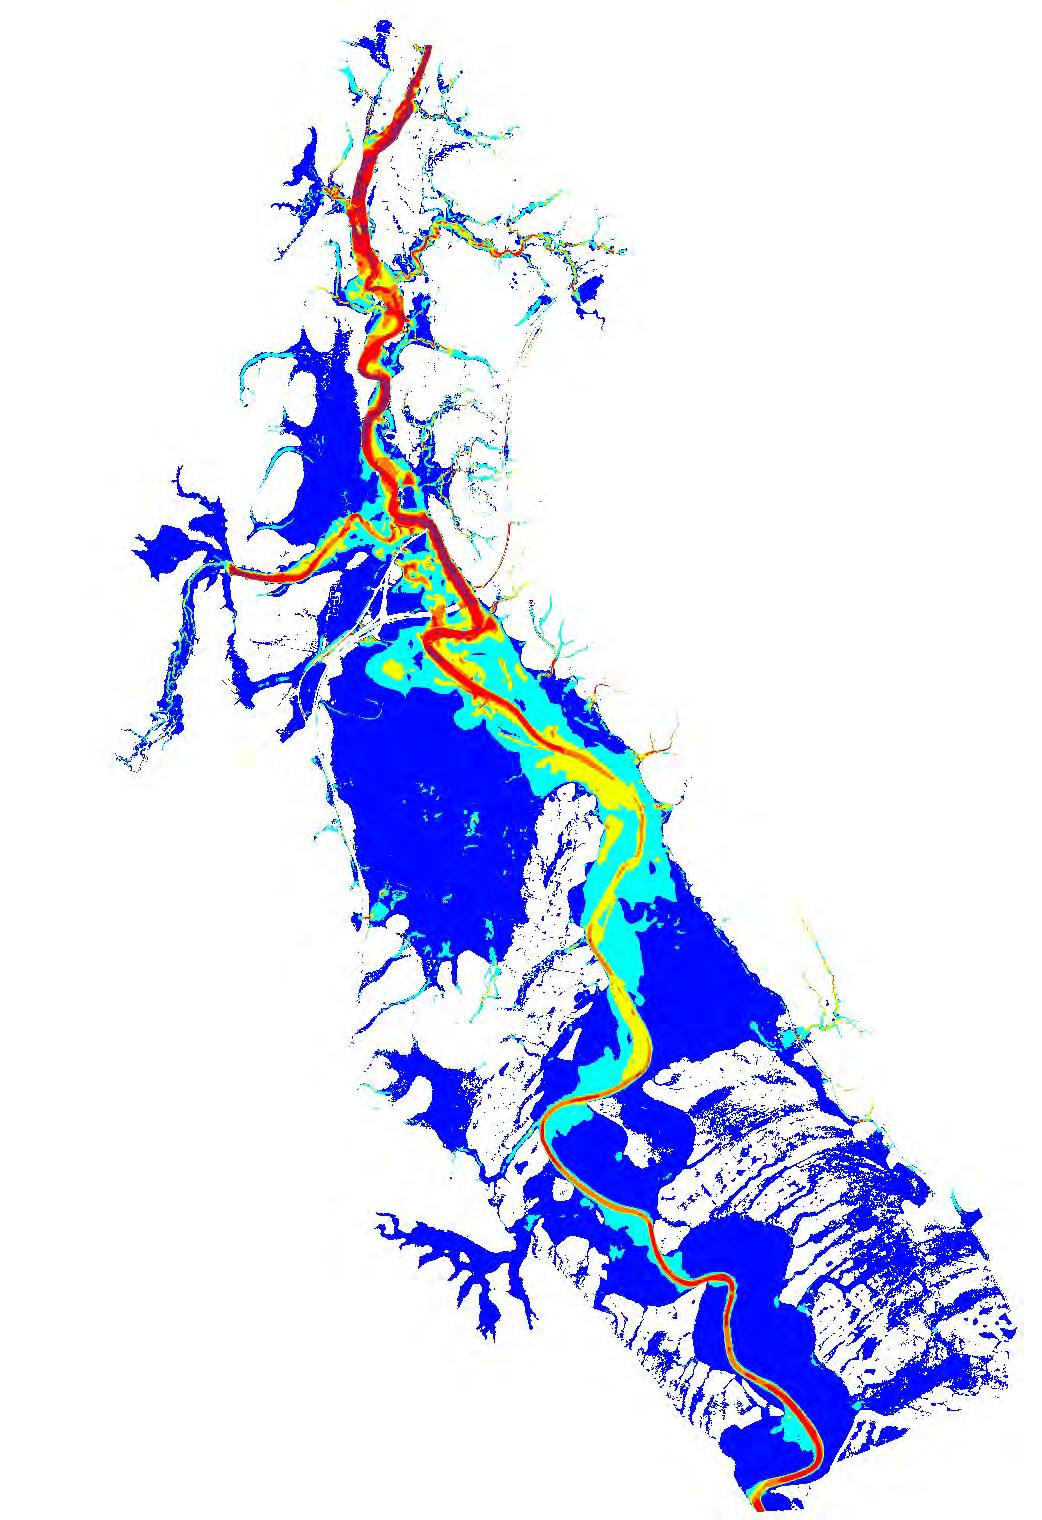
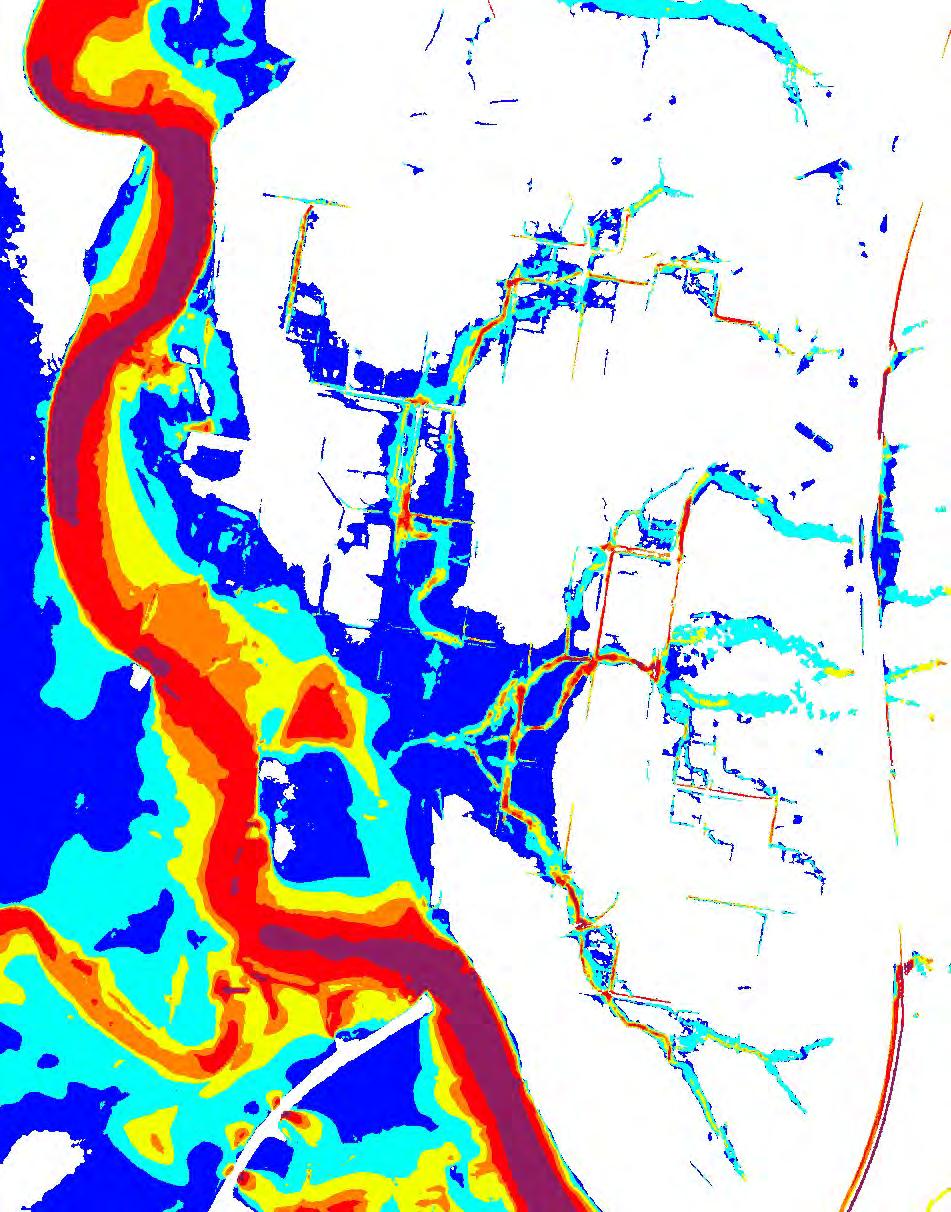
N FigureG.3.3 1%AEPfloodevent peakflowvelocity ReportMHL2789 ReviewofBulahdelah FloodplainRisk ManagementStudyandPlan ©Crown2021/AerialImagerySource:GoogleMaps2021 Studyarea Velocity(m/s) 0.00-0.25 0.25-0.50 0.50-0.75 0.75-1.00 1.00-1.50 >1.50 Legend ©AerialImagerySource:Nearmap2021

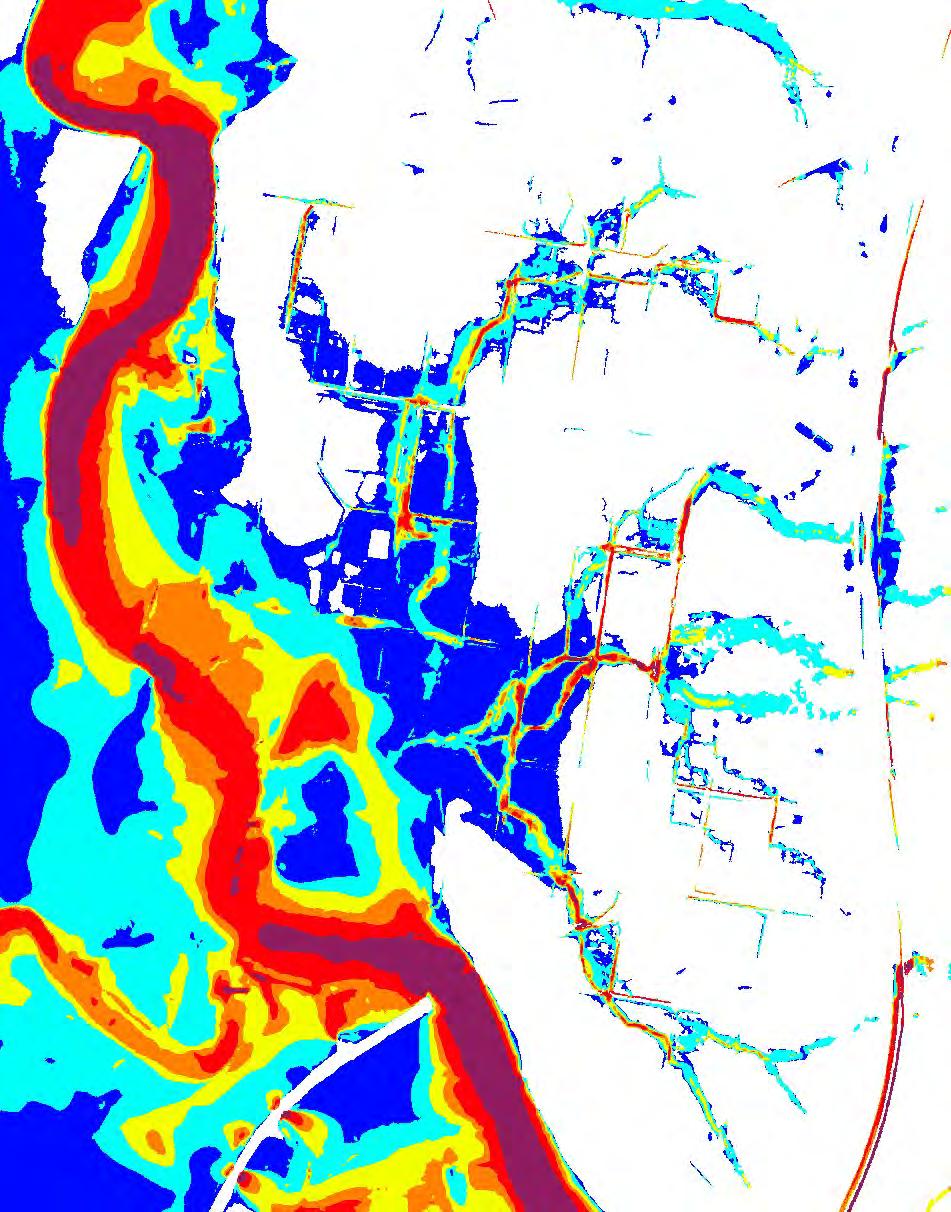
N FigureG.3.4 1in200AEPflood eventpeakflow velocity ReportMHL2789 ReviewofBulahdelah FloodplainRisk ManagementStudyandPlan ©Crown2021/AerialImagerySource:GoogleMaps2021 Studyarea Velocity(m/s) 0.00-0.25 0.25-0.50 0.50-0.75 0.75-1.00 1.00-1.50 >1.50 Legend ©AerialImagerySource:Nearmap2021
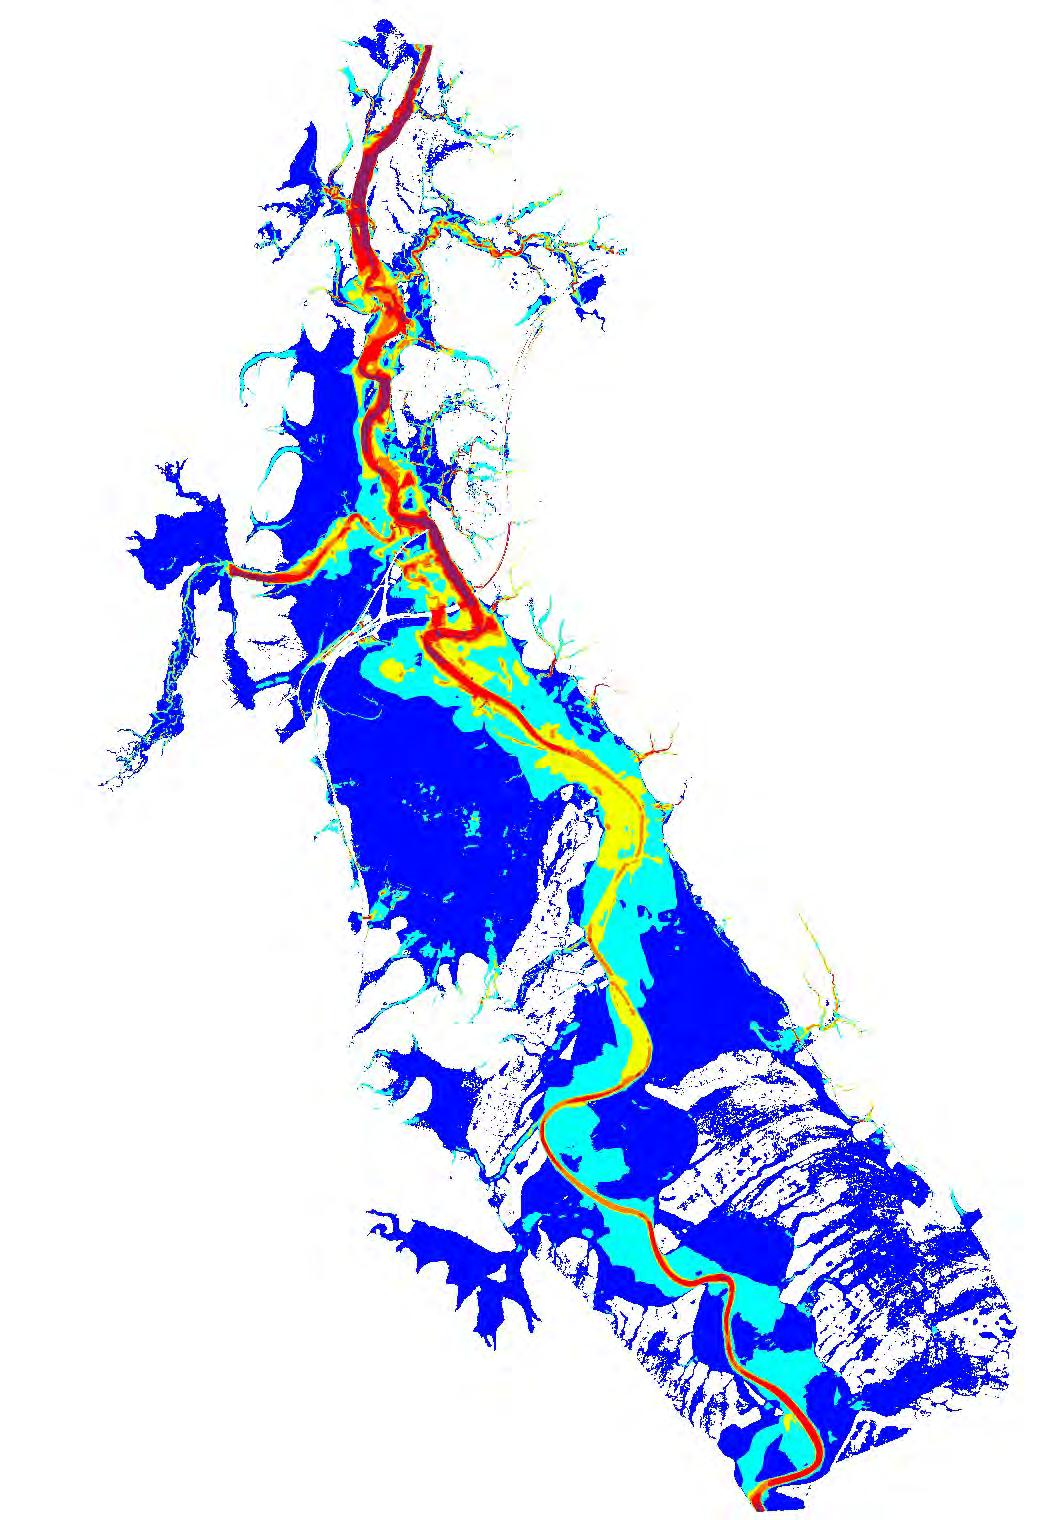
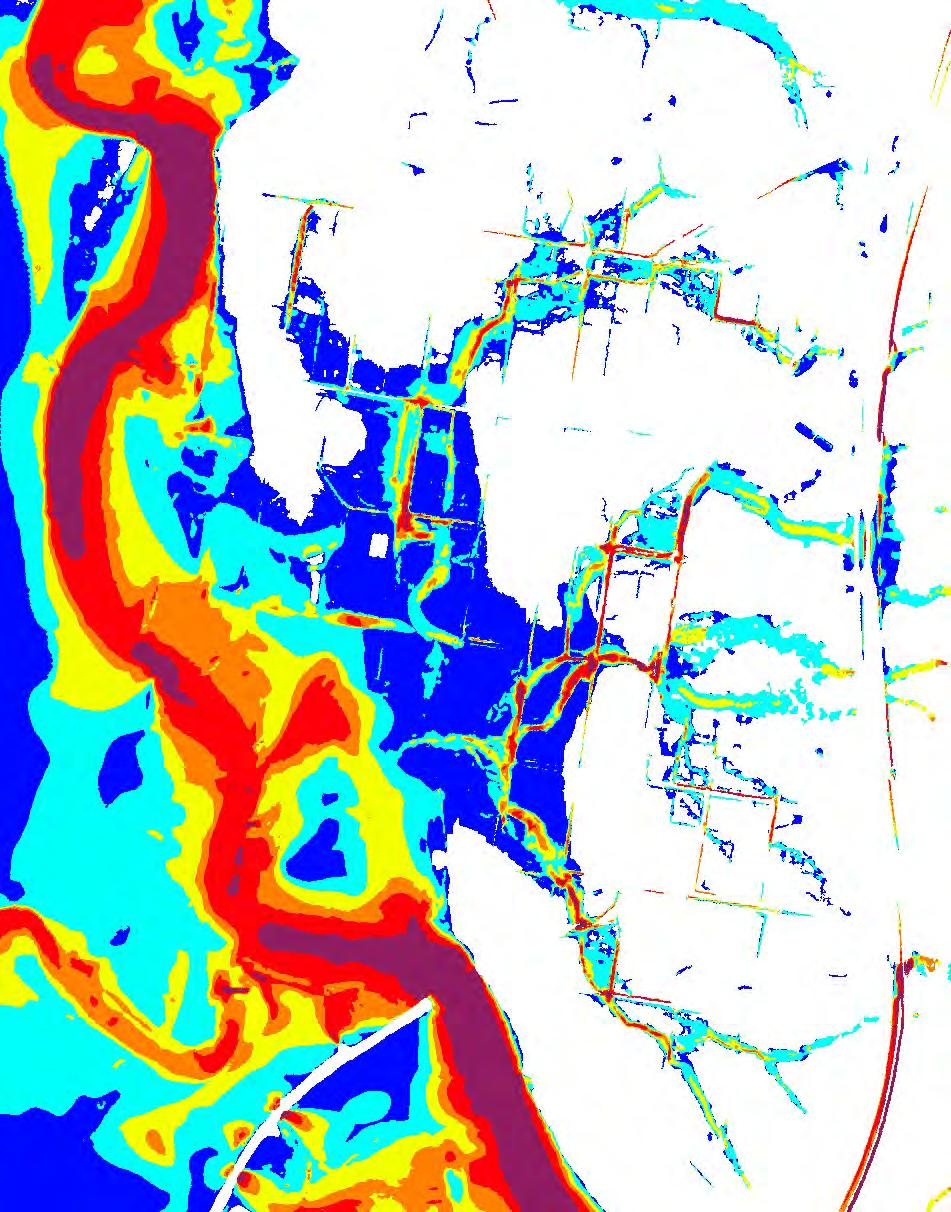
N FigureG.3.5 1in500AEPflood eventpeakflow velocity ReportMHL2789 ReviewofBulahdelah FloodplainRisk ManagementStudyandPlan ©Crown2021/AerialImagerySource:GoogleMaps2021 Studyarea Velocity(m/s) 0.00-0.25 0.25-0.50 0.50-0.75 0.75-1.00 1.00-1.50 >1.50 Legend ©AerialImagerySource:Nearmap2021
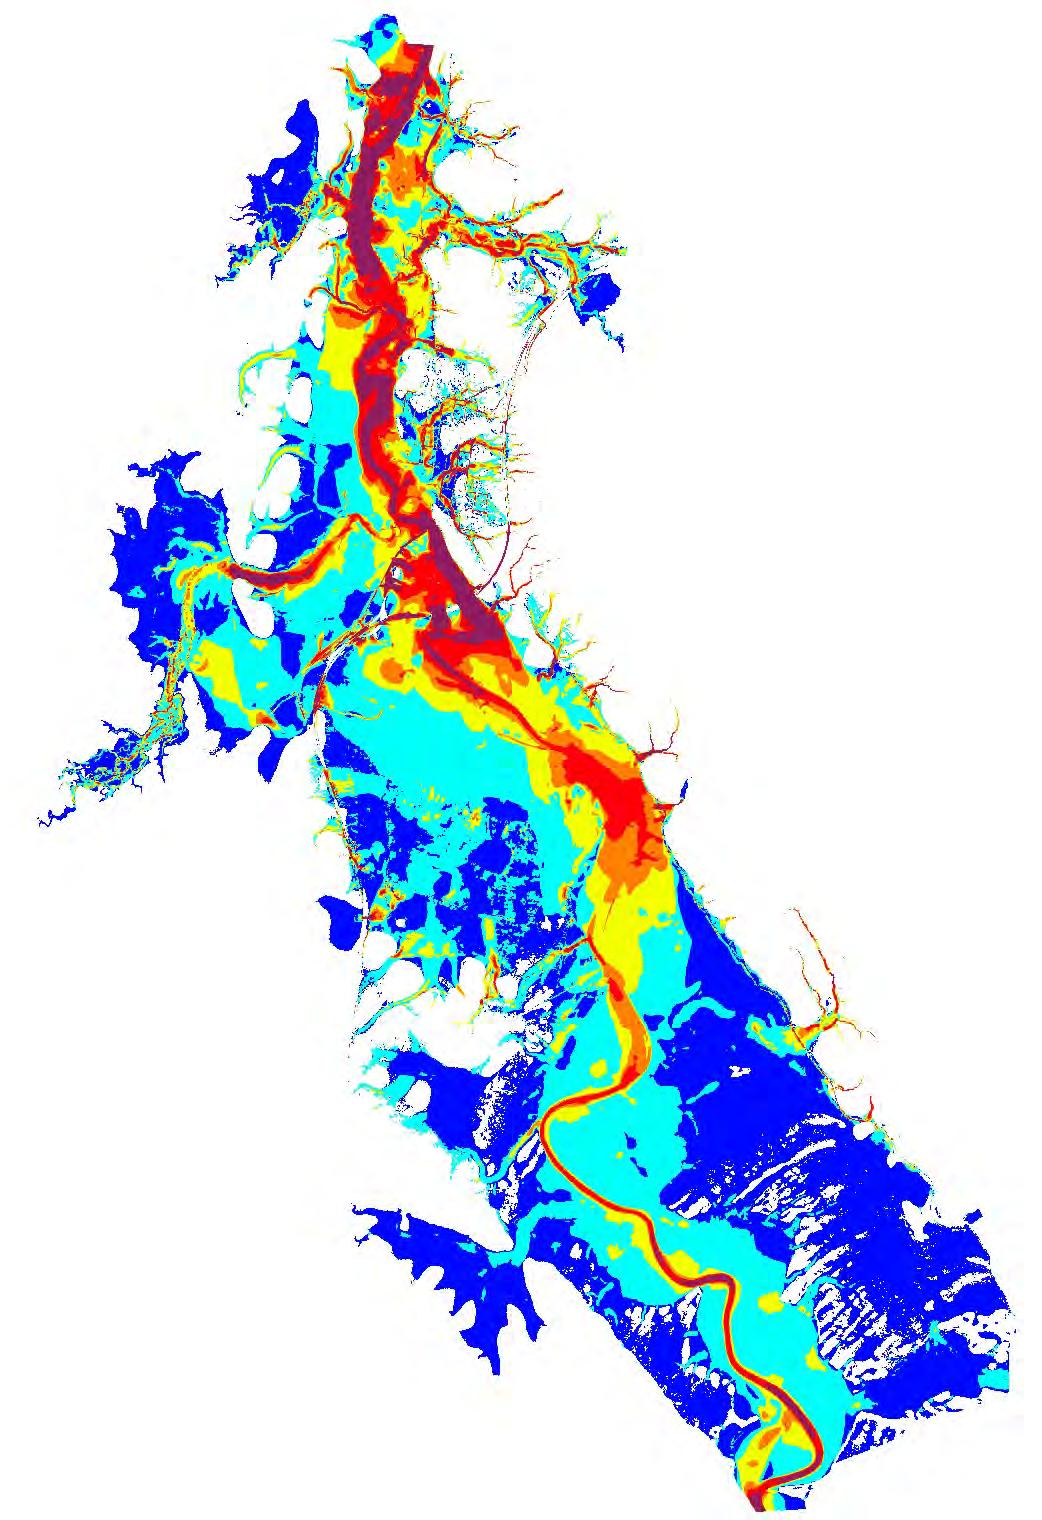
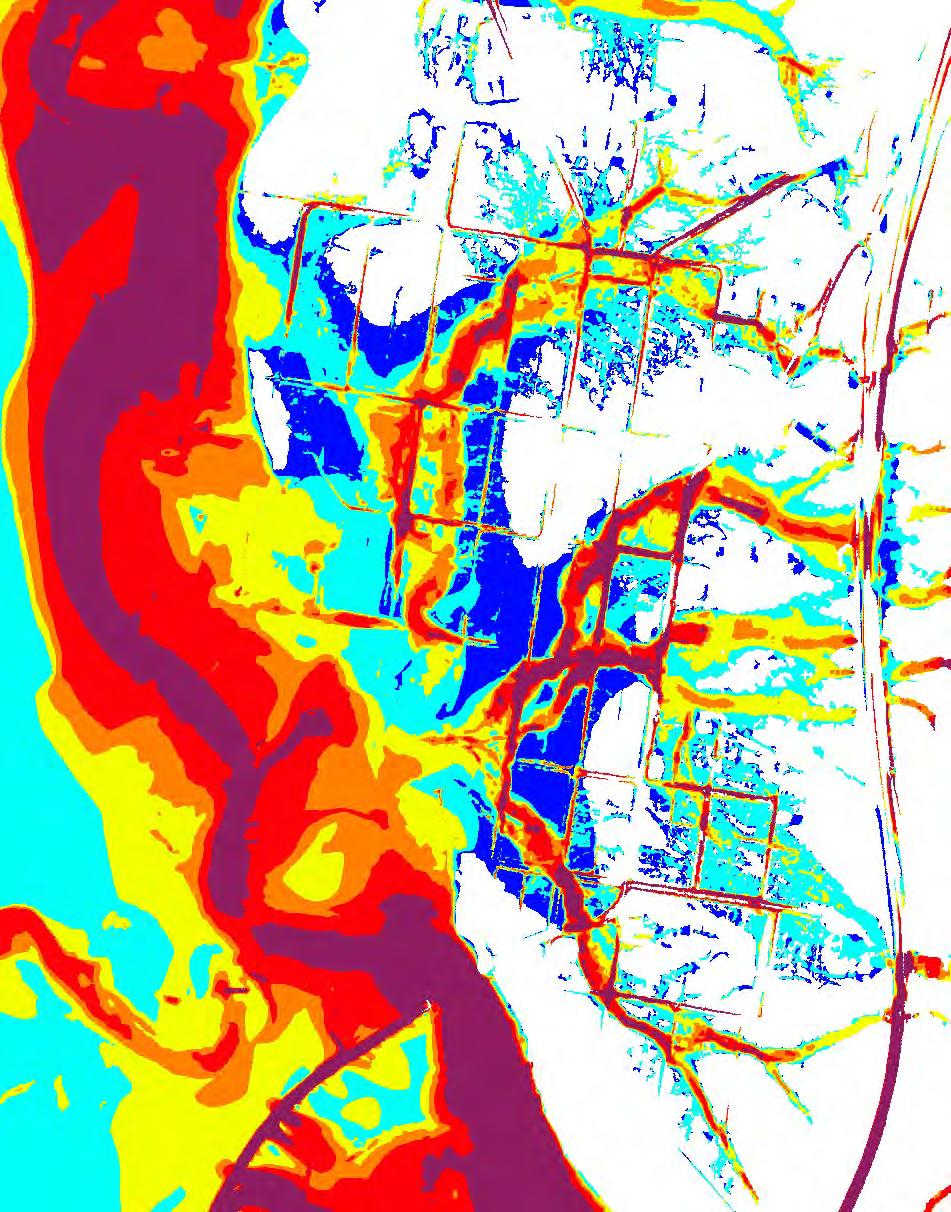
N FigureG.3.6 Probablemaximum floodeventpeakflow velocity ReportMHL2789 ReviewofBulahdelah FloodplainRisk ManagementStudyandPlan ©Crown2021/AerialImagerySource:GoogleMaps2021 Studyarea Velocity(m/s) 0.00-0.25 0.25-0.50 0.50-0.75 0.75-1.00 1.00-1.50 >1.50 Legend ©AerialImagerySource:Nearmap2021
Flood hazard and flood function maps

MHL2789 – H1 © Crown 2021 Classification: Release by consent
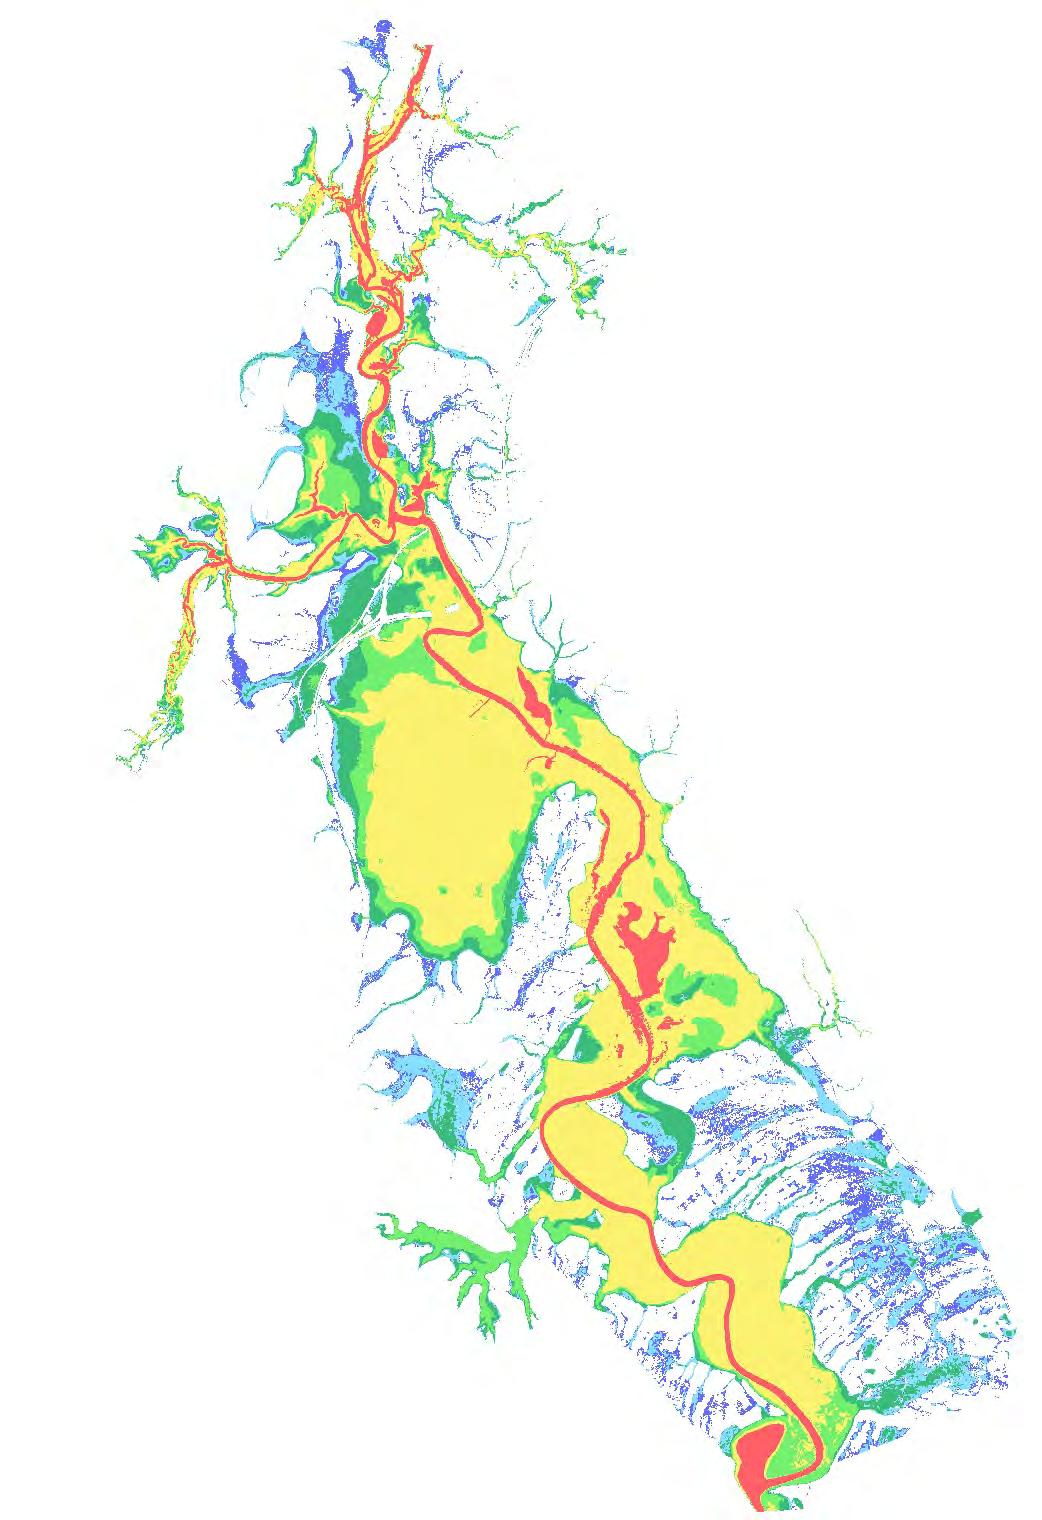
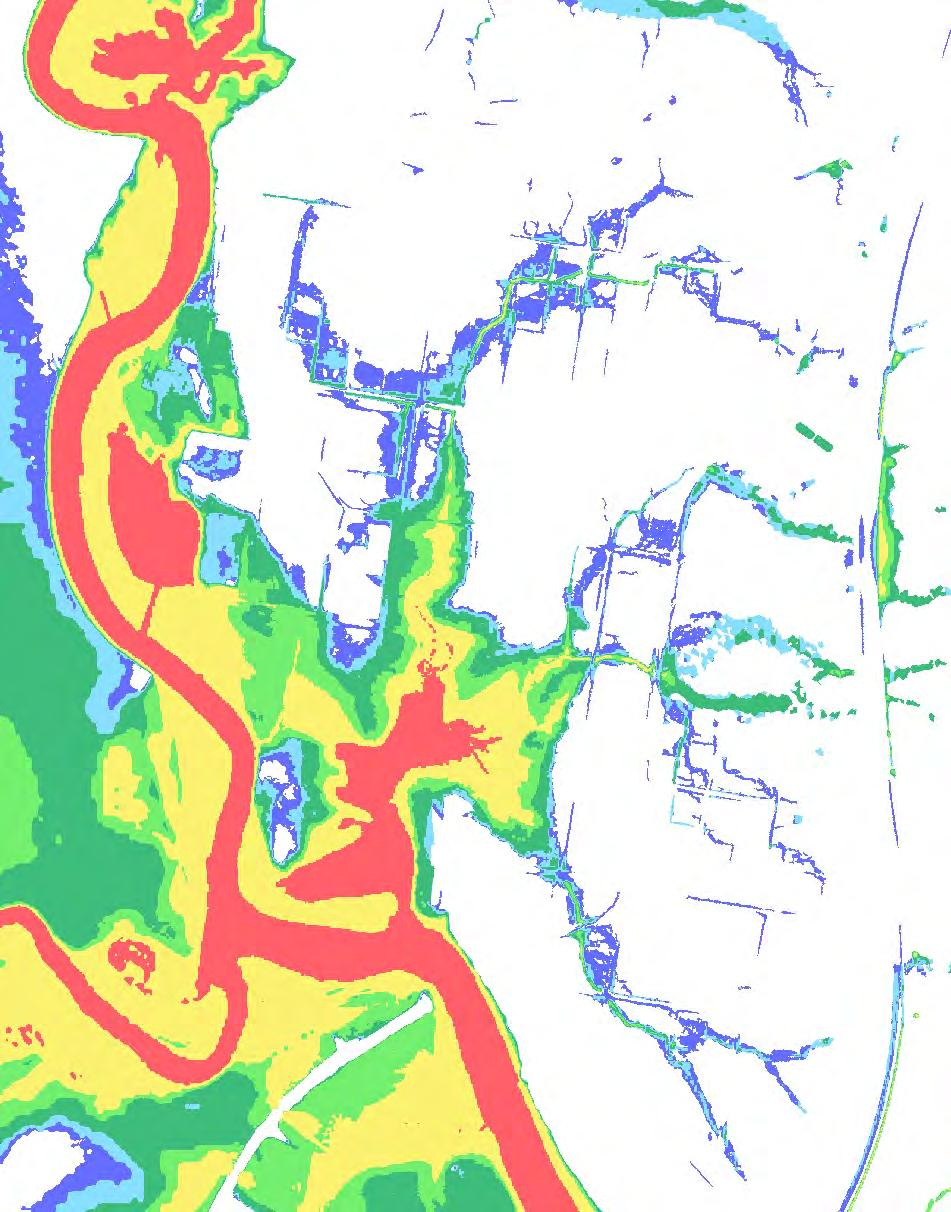
N FigureH.1.1 1%AEPfloodevent peakfloodhazard ReportMHL2789 ReviewofBulahdelah FloodplainRisk ManagementStudyandPlan ©Crown2021/AerialImagerySource:GoogleMaps2021 Studyarea FloodHazard Vulnerability Classification H1 H2 H3 H4 H5 H6 Legend ©AerialImagerySource:Nearmap2021
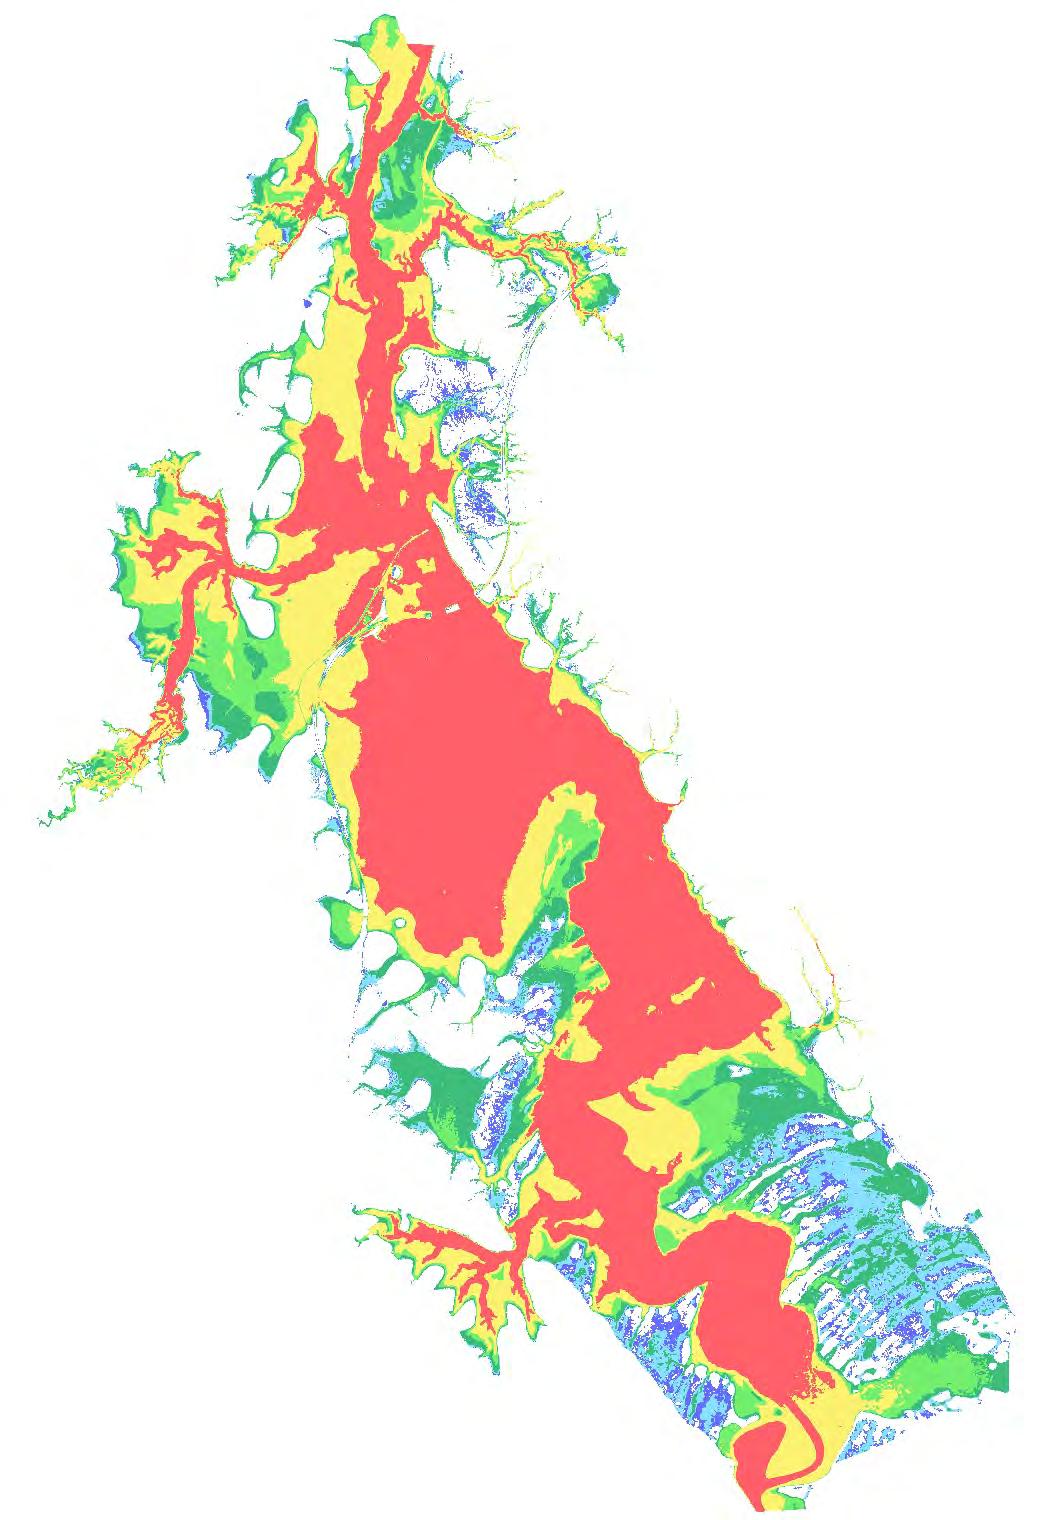
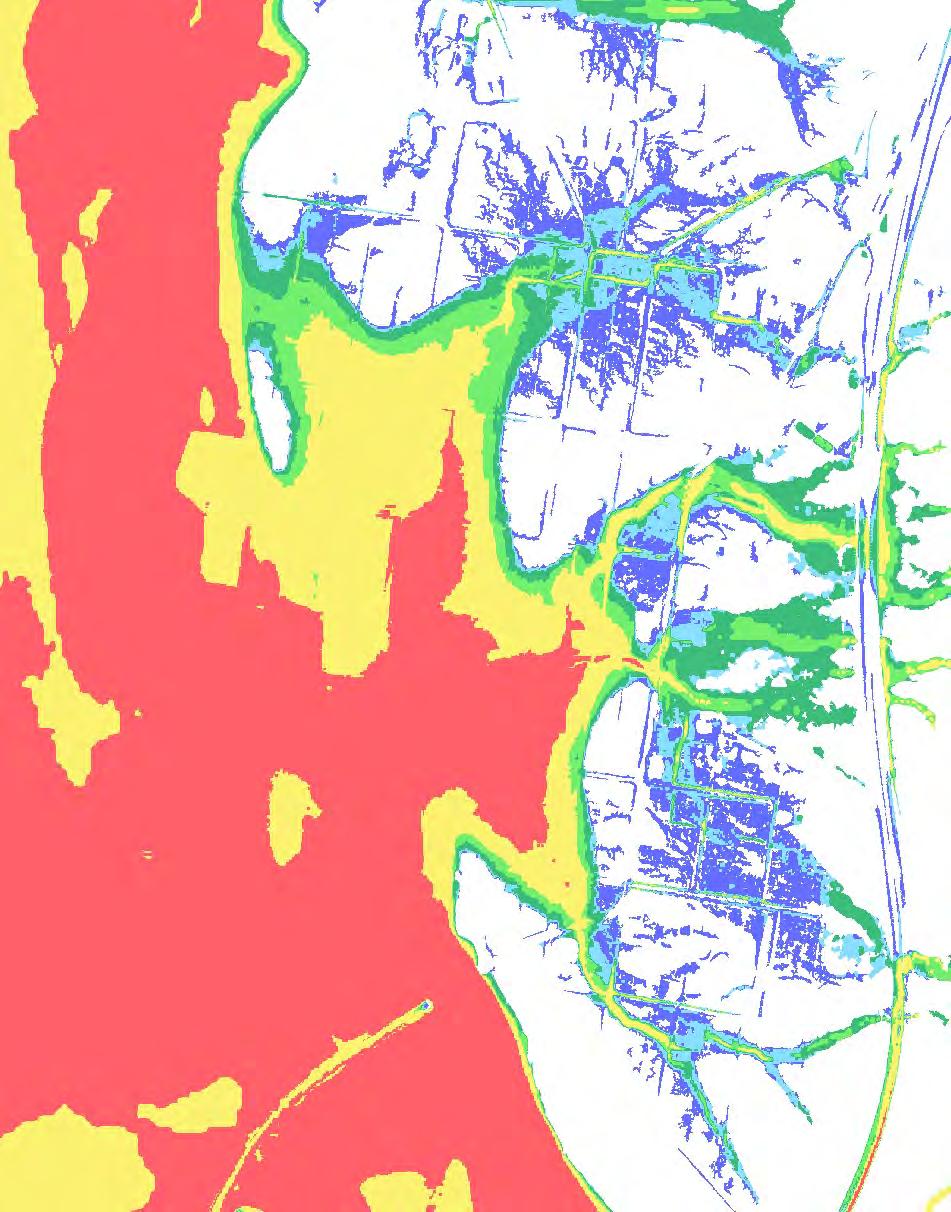
N FigureH.1.2 Probablemaximum floodeventpeak floodhazard ReportMHL2789 ReviewofBulahdelah FloodplainRisk ManagementStudyandPlan ©Crown2021/AerialImagerySource:GoogleMaps2021 Studyarea FloodHazard Vulnerability Classification H1 H2 H3 H4 H5 H6 Legend ©AerialImagerySource:Nearmap2021
N FigureH.2.1 1%AEPfloodevent hydrauliccategory ReportMHL2789 ReviewofBulahdelah FloodplainRisk ManagementStudyandPlan ©Crown2021/AerialImagerySource:GoogleMaps2021 Studyarea Hydrauliccategory FloodFringe FloodStorage Floodway Legend ©AerialImagerySource:Nearmap2021
N FigureH.2.2 Probablemaximum floodeventhydraulic category ReportMHL2789 ReviewofBulahdelah FloodplainRisk ManagementStudyandPlan ©Crown2021/AerialImagerySource:GoogleMaps2021 Studyarea Hydrauliccategory FloodFringe FloodStorage Floodway Legend ©AerialImagerySource:Nearmap2021
110B King Street
Manly Vale NSW 2093

© Crown 2021

