
SURVEYING SPATIAL September 2022 #109 Magazine SPATIAL DATA FOR INTEGRATEDMANAGEMENTMARINE GIS & VIRTUAL REALITY DIGITAL TWINS –A TOOL FOR ENVIRONMENT


Enhance perspectiveyour


With technological advances occurring at a rapid pace, spatial applications are increasingly being
The spatial sector in particular has gone from strength to strength in recent years and was well represented at this year’s conference by its members and the numerous presentationsfirst-rateduringtheevent.
• EDITORIAL
Also from the Digital Twin Summit, S+SNZ President Kat Salm presents some of the key challenges, consid erations and recommendations for developing a digital twin project strategy.Discovery Marine hydrographic surveyor Hayes Ballantyne shares his experiences of hydrographic survey ing in Auckland’s Waitakere Ranges. And direct from this year’s S+SNZ conference in Rotorua, we take a look at the winners of this year’s Professional Excellence Awards presented at the GSI Partners Awards Dinner, recognising our members’ outstanding service to the industry in New Zealand. •
SURVEYING+SPATIAL • Issue 109 September 2022 1
The future of the spatial industry is looking bright and everyday appli cations such as location mapping are continuing to grow and assist people to make informed decisions, and make information easier to access.
Focus on Spatial Survey
This year, S+SNZ Spatial Stream representative Jasmin Callosa-Tarr shared her inspirational story of how she became a GIS professional starting out from her university days in the Philippines, working for an environmental NGO, working in South-East Asia and Southern Africa, to arriving in New Zealand and her current role as Jacobs New Zealand’s geospatial team leader.
+ Spatial NZ’s annual conference in Rotorua last month delivered many excellent presentations and workshops, and networking opportunities aplenty for members.Thespatial sector in particular has gone from strength to strength in recent years and was well repre sented at this year’s conference by its members and the numerous first-rate presentations during the event.
For many female professionals, one of the highlights of the conference was the Women in Spatial lunch, which provides a networking space and opportunity for members to share professional experiences as women within the industry.
Jasmin is a true advocate for industry mentoring and supporting female role models in GIS as well as supporting students and sharing knowledge and skills across the spatial industry. If you would like to connect with the Women in Spatial group, email spatialwomen@gmail. com for more information.

used across a wide range of industries including
change.mentalenvironpositiveeffectingresourcandplanningassisttwinshowaWorkshopClimatetheWillsChallies,Newsupportingsion-makingcanintegratedLINZ,industries.rangefeaturechangetoandassistnity,portantthatrisespatialcontinuesspatialmanyanddisastermentalengineering,telecommunications,urbanandenvironplanning,transportation,management,pestcontrolbanking,tonamejustafew,andorganisationsaredevelopingcapabilityin-house.Asthescopeofspatialtechnologytogrow,demandforskilledprofessionalswillcontinuetowithexcitingcareeropportunitieswillcontributetoshapingimpolicydecisionsatacommunationalandglobalpolicylevel,withfutureresourceallocationshelpcommunitiesfindsolutionsurgentsituationssuchasclimateandpandemicresponses.InthisspringeditionofS+S,weaspatialthemewithawideoftopicsfromacrossthespatialFromToitūTeWhenua/RachelGabaraexploreshowspatialdatasystemsimprovethequalityanddeciprocessesforagenciesmarinemanagementinZealand.FromtheDigitalTwinSummit,RoseJuliaHamilton,MauriceandparticipantsofEnvironmentandResiliencetakelookatdigitalcanwithto
SURVEYING+SPATIAL ISSUE 109 SEPTEMBER 2022 A publication of Survey and Spatial New Zealand, Tātai Whenua. ISSN 2382-1604 www.surveyspatialnz.org EDITOR Rachel Harris surveyingspatial@gmail.com All rights reserved. Abstracts and brief quotations may be made, providing reference is credited to Surveying +Spatial. Complete papers or large extracts of text may not be printed or reproduced without the permission of the Correspondenceeditor. relating to literary items in Surveying+Spatial may be addressed to the editor. Papers, articles and letters to the editor, suitable for publication, are welcome. Papers published in Surveying+Spatial are not refereed. All correspondence relating to business aspects, including subscriptions, should be addressed to: The Chief Executive Survey and Spatial New Zealand PO Box WebFax:Phone:NewWellingtonLambton5304Quay6140Zealand044711774044711907address: www.surveyspatialnz.org Email: admin@surveyspatialnz.org Distributed free to members of S+SNZ. Published in March, June, September and December by S+SNZ. DESIGN & PRINT MANAGEMENT KPMDesign –info@kpm.co.nzwww.kpmdesign.co.nz TO ADVERTISE Email: admin@surveyspatialnz.org or contact Jan Lawrence +64 4 471 1774 New Zealand Sur vey and Spatial TĀTAI WHENUA 1 Editorial Rachel Harris 4 Using ManagementMarineIntegratedtoSpatialMarineDataSupport Rachel Gabara 9 2022 Awards 11 Digital Twins for Resilience&EnvironmentClimate Rose Challies 15 9 Tips for Digital Twin Success Kat Salm 19 GIS and Virtual Reality Mark Altaweel 20 Challenges for the Early Year Survey Graduate Frankie Robb 4 22 Contents SEPTEMBER 2022 19


22 Satellite MarketplaceServices Steve Critchlow 27 DAM:HydrographicSurveyingintheWaitakeres Hayes Ballantyne 31 Seminar: HydrographyWorldDay Jayden Ball, Hugo Collins, Frankie Robb and Emily Tidey 37 Transitioning to New Landonline –Survey Nick Stillwell 38 Risk of CadastralUnlicensedSurveys Surveyor-General 39 Legal Column 40 Mr Surveyor Bogle Don McKay 42 News 46 HappeningsUniversity Dr Paul Denys 9 27 SURVEYING+SPATIAL • Issue 109 September 2022 3


• SPATIAL 4 SURVEYING+SPATIAL • Issue 109 September 2022
USING MARINE SPATIAL DATA TO SUPPORT INTEGRATED MARINE MANAGEMENT
Rachel Gabara, Group Manager Hydrography Location Information, Toitū Te Whenua/LINZ
Aotearoa’s unique marine environment is high in biodiversity but is under immense pressure from human and environmental impacts. Good marine management has never been more critical. Geospatial information can support informed, evidence-based decision-making so we can preserve the health of marine and coastal ecosystems.Lastyear,four
Government agencies secured funding through Te Tari Taiwhenua (DIA) Digital Government Partnership Innovation fund for a project to use spatial data to support integrated marine management.

Better access to marine spatial data will support a sustainable blue economy.

The project brings together Toitū Te Whenua LINZ, Te Arawhiti, the Department of Conservation (DOC) and the Ministry for Primary Industries (MPI). Together, the agencies will use a proof of concept to test the value of a cloud-based datamesh infrastructure in connecting existing data platforms, tools and systems from various agencies. The project is also working with iwi to develop a te ao Māori view on marine data governance and data sovereignty.
Connecting agency data
SURVEYING+SPATIAL • Issue 109 September 2022 5
Organisations collect, manage and produce marine geo spatial data for individual and even divergent purposes.

The responsibilities, interests, and decision-making powers for managing New Zealand’s marine environment belong to a wide and diverse range of central and local govern ment agencies with overlapping mandates and spatially nested jurisdictional responsibilities.

The marine management system has become fragmented, with limited connections between each organisation’s tools and data. This inhibits timely, holistic, or responsive decision-making.Theinnovation funding allowed the four agencies to leverage new technologies and test the concept of an in tegrated marine spatial data system. The proof of concept will provide a better understanding of how feasible it is to create a cross-government marine spatial system. It will help us assess associated risks, costs, and benefits.
2. The datamesh storage system allows for data to be uploaded and stored directly in the datamesh cloud, if required. The preference is that data remains with the source provider.
DOC has explored how the datamesh technology can assist in standardising coastal planning, specifically the process of mapping Key Ecological Areas (KEA). KEA represent the most important sites for biodiversity conservation, regionally and nationally.
The gateway query engine carries out several functions including spatial and temporal subsetting, and selection by attribute. It has a high-performance caching layer which optimises the internal access of data, improving access speed, and reducing load on external downstream data services.
There are three key components to the datamesh. Each work together to provide a unified service:
The datamesh
6 SURVEYING+SPATIAL • Issue 109 September 2022
The cloud-based technology connects data platforms and systems from various providers, allowing data stored and managed by different organisations to be searched and discovered from one interface. The technology includes format conversion tools to deal with data variability, connecting data (based on location) without requiring standardised metadata.

Mapping marine key ecological areas
The participating agencies are applying this datamesh to use case scenarios relevant to their work. Each agency worked with Oceanum to connect their data/portals to the datamesh, test the accessibility and interoperability to external data required, and integrate appropriate analysis tools.
We have selected an existing cloud-based datamesh system to use for the proof of concept. New Zealand-based company Oceanum originally developed this datamesh to share large oceanographic data models.
3. The datamesh gateway is the access point for all data on the datamesh. All data is accessed through the datamesh APIs. The gateway takes a user request for data and authenticates, authorises, executes the request query, and delivers the data in the specified format.
Our approach
Marine management use cases
1. The registry: All data sources are entered in a reg istry, which stores metadata including: a unique ID, connection details, storage location, spatial geome try, temporal extent, tags or key words.
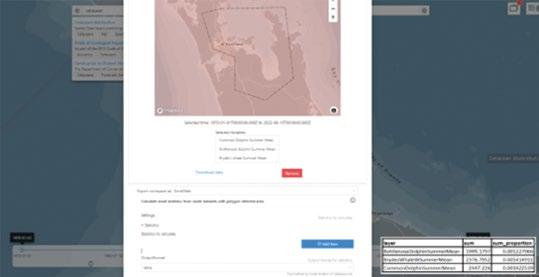
MPI zonal statistics tool calculating proportional statistics for the distribution of multiple vulnerable cetacean species in an area of interest, using the datamesh.
The datamesh has been used to create an online KEA analytical tool that runs analyses on large and numerous datasets located on several online portals and accessed directly from their source servers via the datamesh; the users do not need to download any data. Users can interactively run the analyses with different settings and export output KEA. The datamesh has enabled an innovative accessible tool to bring consistency and transparency in how KEA are mapped by regional councils and other users.
DOC’s KEA analytical tool enabled by the datamesh.
MPI has used the datamesh to spatially display and manage fisheries impacts across multiple New Zealand protected species (e.g. seabirds and marine mammals). In the past, fisheries risk has been managed one species at a time, and usually only at the national scale.


The datamesh technology, in combination with the customised zonal statistics tool, has enabled evaluation of fisheries impacts across species simultaneously and at different spatial scales to inform local and regional planning processes, while aligning with national objectives.
GOALS FOR MARINEINTEGRATEDANSPATIALSYSTEM Improving the quality of marine Creating(accessingagreementtrust,Improvingdecisions managementpublicconfidence,andindecisions Enablingagenciestorespondtonewenvironmentalissuesfaster Increasedefficiencyandconnectingtodata) Reducedduplicationofdatacollectionandgeneration Stimulatinginnovationthroughdatareuse amoreconsistentandcompetitiveprocessforexternalresearchproviders Improvingtheprioritisationindatacollectioninvestments,newresearchdesign,andcapabilitybuilding. SURVEYING+SPATIAL • Issue 109 September 2022 7
Using spatial data to manage risks to protected species
Next steps
Marine and coastal customary rights
3. Technology can support a more holistic approach to marine management by assessing pressures simultaneously, and running analysis over multi ple datasets instantaneously.
LINZ: Supporting Emergency Response
The datamesh was used to create of a common oper ating picture for consistent situational awareness across the various organisations involved in maritime emergency response.
•
6. Visualisation of connected data through the user interface was limited – enabling users to visualise data would create efficiencies by removing the need to export data into a secondary visualisation application.
Interim findings
2. Technology can support effective and efficient con nection and interoperability of spatial data man aged in various formats, on multiple platforms, by different organisations from a single user interface. However, the proof of concept struggled to integrate large raster datasets with some tools.
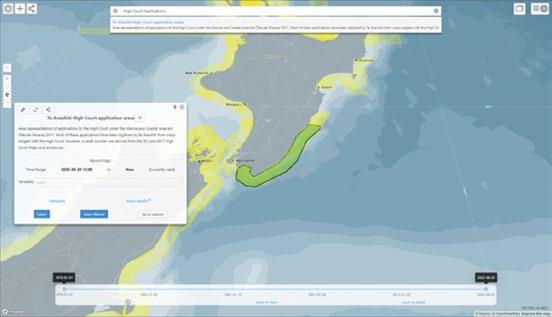
Geospatial data and information plays an important role in this process. The datamesh has enabled Te Arawhiti to integrate relevant marine data from other organisations with far greater efficiency. Application areas can also be shared via the datamesh providing greater transparency of the application locations for a wider audience.

Te Arawhiti has used the datamesh to support administra tion of the Marine and Coastal Area (Takutai Moana) Act 2011, which provides for a legislative regime to recognise Māori customary rights around the coast of Aotearoa.
While the project is still under way, our interim findings from the proof of concept suggest:
4. Technology can enable the integration of spatial data through spatial location, reduc ing the burden for data providers to conform to strict metadata standards. However, non-stan dardised metadata creates challenges for users searching and querying data as they need to know what they are looking for.
LINZ is using the datamesh to integrate data from multiple sources and create a common operating picture.
5. The proof of concept’s user interface displayed spatial extents of connected data –however, the large volumes of data create an overly busy map window. Grouping data into themes/ types and being able to turn on or off data of interest would improve the spatial display and usability.
For more information about the Enabling Integrated Marine Management project, please email Hydro@LINZ.govt.nz
1. An integrated spatial data system can improve ma rine management decision-making quality, consis tency and transparency.
8 SURVEYING+SPATIAL • Issue 109 September 2022
LINZ’s use case tested how the datamesh technology could support timely sharing and integration of data during a maritime incident – in this case, an oil spill scenario.
7. Technology can support improved access to gov ernment decision-making tools, supporting greater consistency, improving transparency and encouraging innovation – however, some proprietary software and tools are challenging to integrate.
Te Arawhiti is using the datamesh to display Customary Right Application areas, and search for supporting information.
Te Arawhiti is often required to provide evidence and information for the courts and/or the responsible minister in support of iwi/hapū/whānau applications.
We will report on findings and recommended next steps once the te ao Māori perspective on marine data governance and data sovereignty is complete (likely late 2023).
he awards evening, a blacktie event sponsored by GSI Partners and held at the glam orous Rydges Hotel Rotorua. This was our second celebration of members’ outstanding service to the industry under the refreshed award pro gramme introduced in 2021. Judging by the standard of the nominations the format is very popular with S+SNZ members.Thejudging panel was presented with an impressive array of entries and after much discussion and deliberation decided on the following well-deserved award recipients.
Each Steam chose their award recipient who was then put forward for the Premier Award, judged by the AwardsCadastralPanel.Stream member Andrew Blackman is this year’s winner of

and development of GIS solutions for our various industry verticals.
For Outstanding Service to the Land Development and Urban Design Industry, Colin McElwain of the Land Development & Urban Design Stream was recognised his contribution to land development and urban design in the Hutt Valley and Wellington
SURVEYING+SPATIAL • Issue 109 September 2022 9

The winners!
• 2022 AWARDS
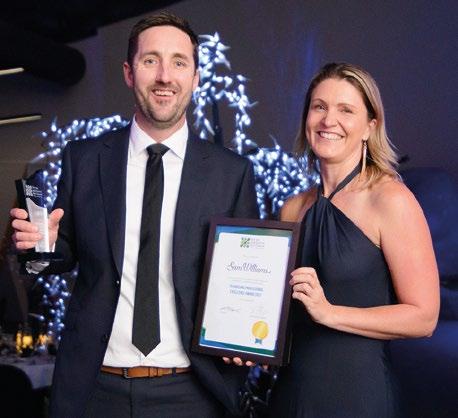
The award for Outstanding Service to the IndustrySpatial was pre sented to Spatial Stream member Sam Williamson who has been a passionate teamwhereatSolutionsSamsionalgeospatialaccomplishedandprofessince2014.iscurrentlyGISManagerFultonHoganheleadstheinthedesign


Well-deserved recipient Andrew Blackman and President, Kat Salm
S+SNZ Stream Awards
the McRae Supreme Award and the Professional Excellence in Cadastral He is a highly motivated, collegial and accomplished cadastral surveyor who, over many years of professional work has made a significant contribution to his profession, particularly in the area of cadastral surveying.

Region for more than 30 years. Sam Williams of the Engineering Stream was the well-deserved recip ient of both the Outstanding service to the Engineering Surveying industry and the Technicians Professional Excellence Award. Sam’s incredible survey efforts, using a full array of modern survey technologies, allowed him to inform engineers, constructors, designers, stake holders and hun dreds of staff on multi-billion-dollar projects.ThePositioning and Measurement Stream’s recipient for Professional Excellence in the Positioning and Measurement industry was Michael Pinkerton of Aurecon for his signi ficant contribution to the profession over many years using his enormous depth of knowledge in the area of spatial data capture, geodetic and positional control, along with contemporary techniques in process ing and delivery. These skills have has benefitted many across NZ and Australian Aurecon teams and their clients.Thefinal stream award went to James Van der Pauw for Outstanding Service to the Hydrography Industry Jame’s endless supply of positivity to every project he undertakes and his ability to manage all elements of a complex hydrographic project,
The second exam award is the Maurice Crompton-Smith Memorial Award. for the best set of projects for a Certificate of Competency. This year, we have the winner from the October 2021 Professional Exams and the winner for the 2022 Professional Exams –Katie Anson and Jessica Smyth. This award to be awarded to Katie and Jessica at the Survey and Spatial NZ AGM in November. Congratulations and well done to all the award winners. •
Celebrating the best in cadastral sur vey datasets were Alexander Liggett for DP 519637, Tony Nikkel for DP515021 and Simon Reid for the City Rail Link Tunnel Surveys.
paper of sufficient merit on a subject of professional or technical interest to members of the profession of survey ing. The second Fulton Bequest, B.2 Class went to Devon Allen for a paper or thesis of sufficient merit on some aspect of surveying.
Cassie Hardie of Aurecon, Tauranga received this award. She is a key member of a multi-disciplinary team which includes planners, geotechnical and civil engineers and one of the leading geospatial surveyors, having taken the lead on numerous drone surveys and laser scans. In the years since 2017 she has established her place and is now highly regarded by internal and external clients, contrac tors and council representatives.
Examination Awards
BequestFulton Two BequestFultonAwards
2022 Cadastral Survey of the Year Award
10 SURVEYING+SPATIAL • Issue 109 September 2022
Cassie Hardie, Bogle Young Professional of the Year

This award recognises the best land development engineering candi dates in the Professional Entrance Examinations as part of the process of qualifying to be a Licensed Cadastral Surveyor. Cassandra Hardie and Mitchell Holyoake are both recipients for 2022.
Bogle AwardofProfessionalYoungtheyear
were awarded on the night. These were A1 Class to Mick Strack for a
Maurice Crompton Smith Award
including bringing together a team of surveyors, support staff, vessel IndustryHydrographicsurveyorsamongstclientultimatelystakeholderscrew,andtheplacehimthebestinthetoday.
Percy Dyett Award
Two times winner Sam Williams with President, Kat Salm
holistic viewpoint – we are the earth, the earth is us, so how can we nurture our connectedness and restore us and our planet. Or perhaps a combination of all of these?
What role do they play for the environment & climate resilience?
• SPATIAL SURVEYING+SPATIAL • Issue 109 September 2022 11
It was noted throughout the sum mit by those who have already carried out digital twins that context is critical and a big-picture view is necessary for the value of digital twins to be fully realised. Amber Craig from Tumu Labs emphasised the need to get to the root cause, to look holistically, and the role of te ao Māori to ensure there is genuine kaitiakitanga of approach es, stories and data. She profoundly reminded everyone – when you’re taking insights from data, whose insights are they? Her deep dive into the real role of technology and not assuming that it will be the solution to social and environmental issues was enlightening and help set the scene for the discussion to come.
DIGITAL TWINS DIGITAL TWINS
Rose Challies, with contributions from Julia Hamilton (Digital Innovation at Wellington City Council), Maurice Wills (Geospatial Technical Lead, Environment Canterbury) and insights from participants of the Digital Twin Summit – Environment and Climate Resilience Workshop.
Digital twins can be best described as a virtual model designed to accurately reflect a physical object. It can be a powerful tool for efficiencies and effectiveness in industry but how can it help address current and future challenges in our environment? At the Aotearoa NZ Digital Twin Summit 2022 attendees got to the critical issues on opportunities and challenges in reality.
Digital twins are becoming widely known for their array of benefits across industries, including construction, manufactur ing, aerospace engineering, transport systems and city planning. The list is increasing as technology enables more efficient models to be built and connected to increasing amounts of data. But the world is facing unprece dented decline in ecosystems, major disruptions in biospheres and human disconnect from their very source of survival, the earth – how can digital twins contribute to this in a genuinely positiveDigitalway?twins are led by the need or request. There are huge environ mental losses happening now and this will only worsen so need is high. But how are we looking at this? Are we looking at it from a perspective of mitigation or adaptation – there is no hope so ‘let’s build to survive’ point of view. Or from a position of driving change – seeking out catalysts for change and implementing to reinvigorate our earth. Or from a
Getting people on the same page was a key theme throughout the summit. Big-picture thinkers and leaders, both environmental and
Enable storytelling of the past, present and future – critical to informed decision-making and inspired action
a key role in identifying and showing change in our behaviour. Digital twins as a tool for storytelling, enabling joined up leadership and cross-sector implementation, and environmen tally sound tech (how they’re built and operated) were just a few of the suggested ways that this value could be
Generate income and funds from data for social and environmen tal change
Provide a competitive edge for business through shared data sharing and analysis
§ Is data influencingdisproportionatelythebigpicture?
Enable open source access and rigour to information (let’s kick greenwashing and eco-propa ganda in the bin!)
§ Is the data relevant to the over all intended impact?
independent critique of data, e.g. answering:
Digitalrealised.twins can:
Bring together and analyse meth ods/behaviours that are effective
We heard in the summit from case studies in Victoria, Australia, where government investment, central and regional, helped to drive aligned and integrated digital twin planning. With rapid environmental degradation combined with fast-growing urban developments happening in Aotearoa, there was a resounding ‘yes’ by attendees that it is absolutely the right time for significant invest ment here as well.
§ Who is influencing the analysis and for what ends?
Enable and encourage citizen science and community participa tion in the contribution of data.
The insight provided at the summit also included challenges into joined-up work and implementation,
Put scientific data into human and environmental context
Given that the majority of environmental degradation and rapid biodiversity decline is due to human behaviour, namely, the vast over-consumption of earth’s natural resources, there is considerable opportunity for digital twins to play
§ Is the data showing symptoms or the root cause?
At the summit there was no short age of expert insight and experience on key priorities and learnings required for the full realisation of dig ital twins’ value to the environment. No one was assuming digital twins on their own were the answer but there was big support for digital twins to play an important and critical role to both mitigating and creating change for our urban and rural landscapes.
12 SURVEYING+SPATIAL • Issue 109 September 2022
Enable collective analysis that shows the effectiveness of change interventions
Provide visual representations to enable insightful debate into what is effective
Show regional and national com mitments to change
Digital twins as a tool for environmental change
Digital Twins as a Tool for the Environment. Infographic by Terra Nova Foundation www.terranova.foundation

Enable opportunities for the
digital, coming together to ensure the most effective, progressive (future of our earth progressive) and efficient plans are put in place quickly were deemed essential. However, this is not a popular place for funding and investment, which can drive people to skip this crucial step. This in turn can easily kick off vast amounts of money being invested in ‘innovative’ digital ‘solutions’ that don’t really know the problems they’re trying to solve (currently seen worldwide with climate interventions that are only dealing with the symptom of carbon, not the root cause of it, i.e. our insatiable greed and consumption).
Ensuring data is shareable and can mesh, including decentralis ing to enable integration
Resourcing big-picture planning that is cross sector, environmental and digital, geographic, cultur al, holistic, future focused and informed by past and present
balancing ownership and com mercial interest with open source, kotahitanga or collective benefit, and kaitiakitanga or concepts of guard ianship. Here are some fundamental challenges raised:
So what do we need to do? What are the critical areas for digital twins and the environment?
Ensure you have change-led vision and planning and trans parent, expert, independent governance of it
Building enough infrastructure, including upskilling and teaching a new generation of enviro-digi tal minds
Establish a big-picture view –how the digital twin contributes to environmental change
Awareness of data control by individuals within organisations.
Watching for accumulations of data assets and controlling influences, and managing these before they get out of hand Addressing significant gaps in environmental data, including accurate spatial environmental datasets e.g. coastal erosion, flood protection, land use, wet lands, agriculture and forestry, soil quality, water quantity and Digitalquality.twins have been around for a while and in recent years their potential to drive innovation and action for change has become much more widely known. However, the infrastructure to support digital twins (and its governance) is still catching up. It’s all well and good saying we need open source everything but how is this managed, who is responsible for it and how can it be protected?
Clarity on ownership and custodi anship as it exists currently
Finding and bringing together data that is already there Metadata and the reality of data lineage – it is not always straight-forward
Building trusted places for data
Knowing what is needed for change – what are the catalysts for major environmental change?
Bringing together aligned organ isations to drive the digital twin/s
Determining the geographic boundaries or areas of focus –regional, national? Something else?
Deciding who the governors of the trusted data are
Know what you need to know – be clear on what the main needs are (root cause). Agree to only develop digital twins and related tools that are effective to addressing those needs and be accountable to this Ensure there is infrastructure and clear guardianship of open
SURVEYING+SPATIAL • Issue 109 September 2022 13
Bigger impacts require digital twins linking together, which is unlikely to be neat and tidy
Key challenges for effective digital twins for the environment
The need for, and critical role of, regulation of data and data standards in digital twins
Understanding the context is complex and dynamic but also filled with pockets of inertia (local, regional, international contexts)
How the digital twins themselves are funded, particularly when there are few funding options available
Knowing the resource cost of a digital twin – how does it com pare to the overall benefit to the Givenenvironment.thelucrative nature of environmental data, how does one protect the data assets, yet make it open and accessible? And we had an impassioned call from one participant – “it all starts with the
Knowing what data we need (for the above), where we can get it and how we can get it?
Here is a starter for 10 inspired by the summit participants:
data” i.e. if we can’t use it, share it, integrate it, analyse it effectively then all impacts are compromised. Other data challenges raised at the summit included:
Knowing the audience – who is the digital twin for? Communi ties, the environment, compa nies, politicians? And who is likely to have the most influence over its design and implementation?
Summit participants raised a number of infrastructure and governance issues, including:
How to do holistic data models that are meaningful Being upfront and honest about ‘rubbish’ data e.g. data amnesty Ensuring small but critical chang es e.g. data clauses in contracts to enable data sharing
Being aware and knowing the commercial benefits and com petitive advantage data can have when building and implement ing
Empowering engineers to collaborate and scale their IP to communities
If you are interested in driving forward environmental change through digital twins and/or related tools and technology in Aotearoa New Zealand, please get in touch with Rose Challies
Do everything you can to ensure data integration can happen seamlessly, driving initiatives that
ital twins are a combined effort from start to finish
likely contribute to the rapid decline in ecosystems; however, if they are grounded and led by environmental change, they could have profound effects for our future.
Understand the connectivity of humans in their own ecosys tem – ‘Ko au te awa, ko te awa ko au’ I am the river, the river is me – honour the power and spirit of our earth in who we are and what we’re trying to achieve.
Never has it been so urgent for action to be taken to change the way we interact with this planet. And digital twins can be a key contributor to showing us the way if led by environmental change and are resourced, planned and imple mented well.
For fund/resource holders –commit significant resource to strategic digital twins from an early stage, to avoid commercial or other interests driving devel opment – or big inefficiencies from unnecessary data collection and analysis
•
Start with small, catalyst digital twins but with a plan to join up and align multiple twins for large scale environmental change
source data, with protected use and assets
Finally, with mother earth being the context for everything that happens, the need for environmental action is utterly critical. Economic, social and cultural needs are all affected by the
14 SURVEYING+SPATIAL • Issue 109 September 2022


Fully evaluate the overall value of the technology used and contrast to its costs on the environment

Take time to consider how to maximise the value of your solution to make sense of complexity
• SPATIAL SURVEYING+SPATIAL • Issue 109 September 2022 15
Digital twins are not ‘simple’. As digital representations of complex physical systems, they are in themselves complex. Digital twins are an ecosystem in their own right – bringing together different sources of information, models, perspectives, uses, and outcomes, they require diverse and holistic thinking to support success. There is a lot to learn and do, and a lot to cover. There is also a need to think beyond traditional boundaries to understand how things connect and influence
Kat Salm
Tips SuccessDigitalforTwin
At
digital twin journeys.
The outcome of the session is an outline of challenges, enablers and considerations with key takeaways that offer considered insight into getting to the roadmap phase.
ROADMAPSTRATEGYFROMTO

the Smart Cities Council Aotearoa New Zealand Digital Twin Summit, held on July 7, 2022, in Wellington, attendees from across the digital twin ecosystem came together for talks and work shops – one of which dove into the issue of moving from strategy to roadmap. In the session, championed by Kat Salm, President, Survey + Spa tial New Zealand, and co-facilitated by Nick Pickering and Michael Healy, more than 25 participants discussed some of the enablers, challenges and questions they had around implementing digital twins for their organisations and clients.
Identifying the vision and strategy for a digital twin project is nothing short of inspiring. Moving from strategy however,thataimplementationtowardstocreatefunctionaldigitaltwinmeetsprojectgoals,isnoteasy.
From those who did not yet have a strategy through to those at various stages of implementing digital twins for their own organisations or enabling digital twin solutions within the wider framework, all participants were at different stages of their
Identify digital twin values in a language that is relatable Workshop participants stressed the importance of making digital twins easy to understand – to demystify the concept and explain the ‘why’. This involves being clear on your definition as well as the practical uses. It is also vital to be able to clearly communicate and explain the value case for your digital twin to an executive management team that makes funding decisions, and how it aligns with your broader digital strategy.Whenbuilding a business case, it is important to get stakeholders involved to ensure you are clearly defining the problems and use cases. It is also wise to consider how to pitch without over-pitching: what matters to your audience? Will ‘tech talk’ appeal or turn them off? Having some key sponsors of your business case across the business and at an executive level can help get your proposal across the line.
Remember that you’re delivering a technical solution that requires the buy-in of people
Understand data requirements – for capture, maintenance and management
As data often comes from disparate sources, and can be of varying quality, this is not a small challenge. Having suitable, connected data models to support integration between different types of data is also important.
end users can provide useful feedback on the types of decisions that a digital twin can inform.
As with any digital roadmap, a pivotal factor is the culture of the contributors and end users. Success requires buy-in and support, so as well as the technical solution there also needs to be a change process put in place to encourage awareness and adoption. The concept of a digital twin, and its value can be foreign to many.
A key challenge is access to data. Accessing initial data to establish a digital twin is the first hurdle, but for a twin to remain viable, there needs to be a flow of data to constantly maintain the currency of the twin.
Whilst we can’t always deliver outcomes for the ‘unimaginable future’ now, laying good foundations and ‘thinking big, starting small’ can kickstart the journey. Examples of use cases might be using digital twins to give district plans meaning and engaging communities, as well as using digital twins to support asset management.
Starting development with demonstrable value-generating use cases as the target is key There is a great deal of value that can be derived from digital twin, but this value needs to be clearly identified and communicated for the imple mentation to deliver real change and meaningful impact. It is often easiest to identify where a digital twin can add value through business need use cases, and then develop digital twins to address those needs directly. This is where digital twins can demonstrate their impact on decision making and be activated to deliver outcomes.
The technical challenges that you will encounter in establishing a useful digital twin can be overwhelming.
Getting access to skilled people to help develop the digital twin is not easy, retaining knowledge is vital and ensuring true stakeholder buy-in – that’s what truly gets a digital twin project
Whilst we can’t always deliver outcomes for the ‘unimaginable future’ now, laying good foundations and ‘thinking big, starting small’ can kickstart the journey.
16 SURVEYING+SPATIAL • Issue 109 September 2022
Theremoving.isalotto be said for learning from others wherever possible to support upskilling. There are a variety of different skills required to build a functional digital twin, but also a variety of stakeholders who can contribute to the design and out comes. For example, surveyors and engineers can be useful in supporting data acquisition and modelling, and
other things. For example, to be truly useful, a digital twin to support resilience outcomes would need to exist beyond a council boundary as disasters are rarely contained within the extents of human-defined boundaries. This complexity can be bewildering for those looking to implement a digital twin.
Focus on priority problems to solve
While technology continues to ad vance, there are core challenges that are raised time and again, including one at the heart of many – data.
To ensure ROI and not just build a digital twin for technology’s sake, there needs to be a clear, purpose-driven plan for delivering outcomes. The general consensus was that going straight to designing technical solutions was not the way to approach implementing a digital twin. Workshop participants recommended considering holding ideation workshops at the start of the process to identify real pain points
Develop a change management plan
Thanks to the contributing partici pants of the workshop, including facilitators: Kat Salm (HG/FrontierSI), Nick Pickering (University of Waikato), and Michael Healy (Christchurch City Council); and participants: Trish Baird (Selwyn District Council); Stacey Young (Marlborough District Council), Brenda Pottinger (Marlborough District Council), Ryan McVeigh (WSP NZ), Asem Zabin (GHD Digital), Elijah Creene (Aurecon), Todd Davis (Abley), Sarah Oehlrich (Western Bay District Council), Duncan Blair (Invercargill City Council), Pax Austin (Wellington City Council), Mairead de Roiste (Victoria University), Martina Maroney (Infrastructure NZ), Aiden McGillicuddy (Contact Energy), Kaitlin Pickett (Hoffcon), Anne Harper (Koordinates), Shelley Minnell (Waka Kotahi), Simon Allen (Waka Kotahi), Omid Khazaeian (Eagle Technology), Ben Judge (Company X), Julian Butson (Ignite Architects), Kevin Dunne (Transpow er), Gavin Cotterill (PCSG). •
SURVEYING+SPATIAL • Issue 109 September 2022 17
Engage executive support and identify your sponsors/champions at exec and management levels. To do this, you need to become good at messaging – storytelling to your au dience – and ensuring your business case is fit for purpose and addresses organisational challenges that will garner executive support. This goes a long way to enabling the process and helping to gain funding.
and prioritise effort based on ‘bang for buck’. They suggested developing a long list and then ‘heat mapping’ that list to refine down to a shortlist of problems to solve. Your focus should be on high priorities and objectives, i.e. highest impact at lowest cost.
Robust change management is vital to the success of your digital twin. Without a culture that understands and engages with the digital twin, it will rapidly become an expensive dead-end. Again, this relies on engagement with stakeholders across the journey and messaging that speaks to them in their language. Co-design is a way to actively engage stakeholders in the journey. Culture can make or break your digital twin, so think carefully about how you will engage and communicate from design through to operations.
Participants
The workshop participants all agreed that a digital twin is an ecosystem and is likely to be beyond any one organisation to do alone in terms of resource, capability and cost. Most agreed that partnering and collaborating was the path to success. Suggestions were to bolster capability and capacity by engaging with third-party help, and sharing knowledge, capability and tools with others. It was agreed that we already have a powerful ecosystem of consul tants, internal and local talent, and capability at national and regional levels, so the question was how we best leverage that knowledge. It was also suggested that organisations review their capability and find their skill niche, and then build the ecosystem around that by partnering. Local government organisations need to look at commonalities and share IP and information where they can so they can leverage and build rather than duplicating effort.
Leverage collaboration to build your ecosystem
Engage executive support
Undeniably, the item this group aligned on most was that this was just the start of what should be a continued conversation. We need to keep encouraging fora and engage ment to generate momentum and support organisations on the journey from strategy to implementation.
There is a great deal of benefit to be gained by collaborating and sharing experiences and lessons learnt to enable our digital twin capability in New Zealand. Follow the Smart Cities Council’s Digital Twin Hub for more. For details and session recordings, head to www.smartcitiescouncil.com


While many VRGIS platforms and applications have focused on urban data, other applications of VRGIS have been in the area of education, including in the teaching of geography,
such as XEarth have incorporated 3D building model data, residents information, real-time and historical traffic data into their platform, allowing for a powerful understanding of city data where everything from current traffic patterns to up-to-date residential information, where the data are applied within a human-computer interaction framework.3 Applications with complex data demand have become a major challenge for VRGIS, particularly as these appli cation have incorporated spatial query functions so that desired more quickly process complex data and not just simply look at high volume data. Such approaches allow faster processing of data, allowing for visual and query information to appear more quickly even in more typical desktop environments. In effect, data has become complex in structure and not just in volume, where VR platforms are particularly well made for visualizing such complex information in their appropriate dimensions.4

One area of focus is in creating VR applications that provide realistic visualizations of traffic data, where its utility for traffic management is noted. The integration of real-time data and VR allows traffic management to more easily look at varied layers of transport, while also gaining ability to forecast patterns based on historical or expected patterns. Applying it within web technologies also allows easier sharing of data, where managers and those using transport can readily access needed data.2 Applications
irtual reality (VR) has been integrated with GIS for some time, with academic and industry develop ment ongoing since the 1990s. What is different now is data integration and powerful platforms no longer require specialized workstations or high-performance computing. From Esri’s CityEngine to more specialized software such as GeoScope, VR, or what has been called VRGIS, has now moved into area such as utility in Big Data applications, VR within mobile devices, and allowing users to more easily create sophisticated VR visualizations with out programming.1
VRGIS and Teaching
Mark Altaweel, Republished from GIS Lounge
(continued page 30) • SPATIAL SURVEYING+SPATIAL • Issue 109 September 2022 19
GIS AND VIRTUAL REALITY
Using Virtual Reality and GIS in Urban Planning
ESSAY
The Challenges for the Early Year Survey Graduate in a Rapidly Evolving Market
First and foremost, it is important to recognise the history of the surveyor’s role. In the past, it is well known that owning land came hand in hand with status. This led to an over consumption of our resources, particularly closer to urban epicen tres. This relationship with the land, meant that, typically, a surveyor spent most of their time subdividing land and defining boundaries, ultimately aiding in building urban environ ments. This routine work typically came with routine methodology and equipment. The surveyors used the theodolite or total station, and recent times included the GPS. Despite some minor adjustments in the tools, the jobs and methods remained mostly the same. Our predecessors, and earlier graduates, have become used to this routine work, and with it, the methods and equipment.
surveyor are far more extensive than those of the past, proving the rapid evolution of our industry. This is not simply due to technological advance ments though, arguably it is brought about as a matter of necessity due to our changing environment. As climate change starts to have a more tangible effect on our environment, we are starting to see people change their relationships with the land. Societies perception of land as a commodity is changing, there is an urge from the wider public to monitor and protect our land as a resource for future use. This can be seen in the Resource Management Act 1991, which restricts the ability for subdivisions and developments to take place, in some instances. Since then, there has been a change in the type of surveying taking place, we no longer complete simple, two lot subdivisions daily. Instead, surveyors are challenged with things like building upwards rather than outwards and using survey equipment to monitor the environment rather than alter it. These new challenges often require new equipment, for example, along the coast of New Zealand there are many disconnections between the surveyed position of the coastal boundary, and the physical position of it. LINZ is currently working on a project which uses InSAR and GNSS Spatial Extent technology to rapidly observe the position of the coastal boundary, improving the accuracy of our cadastre. As graduate surveyors, it is highly likely that we will have to process and understand this data. This
Frankie Robb
Throughout history, the survey or’s role has been shaped by our societies desire to show status through ownership of private proper ty. It is only recently that a shift is be ing seen away from this, and toward the sustainable management of our resources. As graduate surveyors, we do not have the luxury of an extensive survey knowledge base to build off as this shift takes place. This highlights the challenge as an early year grad uate of surveying, to learn not only what our predecessors already know, but also the methods and technology which is new to the industry.
It is well known that the technology and tools available to the modern
As already mentioned, graduate surveyors lack the existing knowledge base which their predecessors have.
In summary, the rapidly evolving market, which is land surveying, creates challenges for the graduating class. On the other hand, challenges are what keep life interesting, and this is especially true when it comes to a surveyor’s career. For many in the survey industry, the dynamic environment, and role, is what appealed. The change which is shaping the surveying industry is one which is being born from a necessary shift in society. As land becomes a resource rather than a commodity, it is likely that the role of the surveyor will continue to change. It is up to the graduate surveyors to maintain, encourage, and even facilitate this change. SCHOLARSHIP
• • KAIR Ū RI COMMUNITY TRUST

20 SURVEYING+SPATIAL • Issue 109 September 2022
Francesca presenting her winning essay at the Rotorua conference in August.

In the past, this lack of experience has been made up for while working, it was the duty of the graduate to learn on the job, wearing hypothetical training wheels for a few years. The rate at which our industry is changing, means not only the pace of learning but the breadth of learning is chang ing. A day in the life of a graduate surveyor, is not what it would have been 50, let alone 20, years ago. In saying this, as a graduate surveyor, who is still in an academic frame of mind, learning, and encouraging change should not be a difficult task.
should prove that, as our environ ment, and our relationship with said environment, continues to evolve, so too does the role of the surveyor.
gsi.nz


Steve Critchlow, Group Managing Director.
• SPATIAL 22 SURVEYING+SPATIAL • Issue 109 September 2022
SATELLITE SERVICES
many geospatial experts, satellite technology has been a source of great frustration over the years, seeing so much poten tial there, but knowing that all that potential probably couldn’t be fully realised until next-generation optics (and supporting technology) came on stream.Added to this frustration was the knowledge that if you didn’t have serious in-house expertise, as well as
Satellite technology comes of age with the New Zealand Satellite Services Marketplace.

For
the required (and expensive) hard ware/software, then any real-world business applications were largely out of reach for most organisations. Quite simply, these limitations meant it just wasn’t ready for mainstream use and, subsequently, satellite imagery technology was never really adopted at the scale that it was initially predicted it would be. It was ‘cool’ technology and it was obvious the potential applications
frequency of imagery capture/ revisits
SURVEYING+SPATIAL • Issue 109 September 2022 23
telecommunications, planning and development, environmental, national security, or insurance.
for its use were massive – but only if/when the technology was a little more advanced, affordable and accessible.Well,that time has arrived and geospatial practitioners should be aware that satellite imagery services have categorically come of age. Indeed, almost every industry sector will benefit from satellite imagery and its derived data, whether it is agriculture, energy, fisheries,
historical archives of imagery data
Here is a list of just some of the considerations and variables that might inform the selection of next-generation satellite services for New Zealand requirements: imagery resolution the volume of imagery and data captured

optical multispectral data hyperspectral imagery
Synthetic Aperture Radar (SAR) data
SERVICES MARKETPLACE
However, with this new maturity comes a degree of complexity when it comes to understanding what these next generation capabilities can offer.
If the range of service options appears a little overwhelming at first, that’sThisunderstandable.ispreciselywhy Critchlow Geospatial has designed and created the New Zealand Satellite Service Marketplace to be the one-stop shop for satellite imagery, data and services for the whole country.
Through careful study and analysis, Critchlow Geospatial has curated a preferred selection of vendor partners to bring the power of fit-for-purpose next-generation satellite imagery and data to New Zealand customers.
Add to that, the element of remote monitoring, it can go a long way to support organisations’ emissions reduction targets.
dailyresolutioneverywhere:changedetection and multispectral/hyperspectralmonitoring and Synthetic Aperture Radar (SAR) capabilities
3. SynthetichyperspectralMultispectral/andAperture Radar (SAR) capabilities

identify as driving new use cases for industries and organisa tions
affordability
Now that machine learning and artificial intelligence can also be applied to the imagery for feature extraction for things like vehicle detection, vegetation type, or roof types, the resolution issue is simply no longer valid.
satellite tasking capability (and time frames to the task)
The New Zealand Satellite Service Marketplace technology partners are: Maxar Capella Space SI Imaging
mature subscription offerings (e.g. self-service portal options)
Satellogic Head Aerospace SpaceWill NTT Data
This kind of easy access and on-demand intelligence is ideal for assessing risk, monitoring land use, and planning infrastructure and development.Inaddition,the New Zealand Satel lite Service Marketplace can provide users with ready access to vast satellite imagery archives that can provide a unique historical context of change with what is essentially a ‘digital time machine’.
2. Daily change detection and monitoring
EachPixxelofthese partners offers something unique that Critchlow Geospatial see as having an import ant application for New Zealand purposes generally (and specifically). However, there are three key components of this next-generation technology that Critchlow Geospatial
Satellite imagery services most likely failed to take off until now because of a resolution deficiency. Today this is categorically not the case, with Critchlow Geospatial partners like Maxar providing native 30cm resolution and derived (using a proprietary processing algorithm) 15cm high-definition imagery

24 SURVEYING+SPATIAL • Issue 109 September 2022
Different materials reflect and absorb light differently and at different wavelengths, which is essentially how we see colour – multispectral imagery just takes this to the next level.Multispectral imaging works by capturing image data within specific wavelength ranges from across the electromagnetic spectrum. This can include frequencies such as infrared and ultra-violet – these are wavelengths beyond the visible light range for humans and this allows for the extraction of information that the human eye would be unable to capture.Withmultispectral imagery, it is possible to differentiate materials
1. Resolution
streamlined satellite tasking number of specialised satellite constellations
When you combine the level of resolution (and processing) now available with the capability for new imagery to be captured daily, then you have an incredibly powerful tool for understanding and anticipating the changes (both human-created and natural) in New Zealand’s continuously evolving environment.
In addition, by procuring services through the New Zealand Satellite Service Marketplace not only do customers benefit from a carefully curated one-stop shop designed specifically for New Zealand applications, they also benefit from expert local advice in tailoring these next-generation satellite services to meet their specific business or application
Hyperspectral imagery is next level again and enables segmentation and classification of land and aquatic features to a very granular level (but of course like anything to do with satellite imagery – also at scale).
•
For example, hyperspectral imagery can actually identify and quantify molecular absorption, inferring biological and chemical processes, and has been used in this capacity to monitor the application of pesticides for quality control and optimum dose coverage.Soessentially, while multispectral imagery can be used to identify land surface features, materials, and landscape patterns, hyperspectral imagery can allow for the identifica tion and characterisation of (among other uses): vegetation health man-made or natural materials mineral deposits soil moisture levels
Credit: Capella-Radar-3, Synthetic Radar imagery of Whakaari/White Island, New Zealand, 24 June 2021, 10pm NZT

Unique and innovative tools like the interactive Satellite Imagery Comparison tool will also help users to match their specific business needs with the services available.
Whateverneeds.theapplication or use case may be, the New Zealand Satellite Service Marketplace has a wealth of information and resources for anyone looking to discover how next-gen satellite services can help them innovate, improve productivity, and reduce costs, and importantly, emissions.Interested businesses and individu als should visit: marketplaceproducts/satellite-serviceshttps://www.critchlow.co.nz/
by what is known as their ‘spectral reflectance signatures’. These unique ‘fingerprints’ enable identification of materials, for example, the spectral signature for oil can help detect and ascertain the area of oil spills at sea.
Synthetic Aperture Radar offers a different perspective again with its unique ability to penetrate atmospheric conditions, where it can provide near real-time visibility in cloud (or smoke) covered areas, both day and Collectively,night. the technology partners that have been selected for the New Zealand Satellite Service Marketplace provide New Zealand businesses and organisations with access to the right mix of services to meet the country’s unique require ments – no matter what sector or industry they might operate in.
For the primary industries, multi spectral and hyperspectral imagery will prove invaluable in the ‘at-scale visualisation’ of plant development, land use, and land cover charac terisation. Clearly, the applications for environmental protection and
emergency response are also huge, particularly when you consider the ability of this type of imagery to determine plant health and stress.
ARTEC 3D Scanners GEOSLAM 3D Scanners SOUTH GALAXY G1+ GNSS Training | Repair |Technical Support | Affordable Solutions | GNSS from $ 7,900+GST Phone 6 4 -7-262 2110 info@surveysolutions.co.nz www.surveysolutions.co.nz SURVEYING+SPATIAL • Issue 109 September 2022 25


5. Good recruiters focus on long-term relationships, bad recruiters on one-night stands
3. Good recruiters keep you updated
5 differences between a good recruiter — and a cowboy...
Mark Fisher 021 347 mark@eighty4recruitment.com445

Here are 5 tell-tale signs to help you discern a kick-ass recruiter from a drop-kick...
1. Good recruiters will meet you face to face
2. Good recruiters have in-depth knowledge of the industry

Clever recruiters have deep insights of the companies they represent so they’ll meet you In real life to get an understanding of your personality. This will help them decide whether you’ll be a good cultural fit for a business or not, which contributes massively to how much you’ll enjoy working at your new company.
If you find yourself desperately emailing your recruiter, pleading for progress, move on. A good recruiter will happily (but metaphorically) hold your hand through the process — they won’t leave you feeling needy, like a bad recruiter will.
The best recruiters usually work with a specific industry and have in-depth knowledge of that industry. Amateur recruiters “dabble” in multiple industries. Good recruiters have built exceptional relationships with the decision-makers in their chosen industry and have access to those jobs that don’t even get advertised — often the best roles...
4. Good recruiters respect your career goals
If you’re ever involved in a conversation where the recruiter’s trying to persuade you to accept a role that you’re not really interested in and it makes you feel undervalued, despite you being clear about what you want? Hang up as soon as you can.
Bad recruiters dump your CV into the recruitment pipeline and only contact you if there’s good news. Maybe they hate to be the bearers of bad news, or maybe they’re just emotionless pimps. Either way, it’s no good for a candidate or a business. A good recruiter walks the extra mile to ensure their clients and candidates achieve what they want.
EIGHTY4 ONLY HAS RECRUITERS OF THE GOOD SORT. We have multiple job opportunities NZ-wide. Contact us now for a confidential chat and FREE salary check. Sean Buck 027 587 sean@eighty4recruitment.com5726 CONTACT:
Marine Ltd (DML) was contracted to complete a mul tibeam echosounder (MBES) and mobile laser scanner (MLS) survey of three of Watercare’s reservoirs within the Waitakere Regional Park to the west of Auckland. The out come of the mapping was to provide Watercare with a volume curve at 1mm intervals for each reservoir, and to provide a baseline data set from which to monitor sedimentation in the reservoirs. Early reconnaissance
SURVEYING+SPATIAL • Issue 109 September 2022 27
For Watercare, which manages Auckland’s drinking water, understanding the volume of water contained within its reservoirs is of critical importance. Some of the dams were constructed well over 100 years ago and while the surveyors of the day surely gave it their all, technological advancements now allow us to map reservoirs in greater detail, and thus calculate volumes with a much higher degree of accuracy.
DAM!
Hayes Ballantyne (Hayes@dmlsurveys.co.nz)
HYDROGRAPHIC SURVEYING IN THE WAITAKERE RANGES
Discovery
Figure 3: PIPER approaching the Upper Nihotupu Dam.

Ltd was subcontracted to accurately survey the dam structure and spillway level using a total station and terrestrial laser scanner. At the Upper Nihotupu Dam, Woods was able to provide additional survey data in the upper reaches where PIPER could not safely operate.


28 SURVEYING+SPATIAL • Issue 109 September 2022
siderable amount of survey Tetris and computer cable spaghetti occurred to get everything to fit on PIPER.
Using a helicopter to transport a vessel was a first for DML and this resulted in a series of new challenges to overcome. We opted to use one of our smaller vessels, PIPER, a 4.4m Fish City alloy vessel operated under MNZ MOSS. PIPER required a visit to our local marine fabricator/engineer to have four lifting lugs installed to facilitate the lift. When queried on the strength of the lugs and his welds, the engineer confidently informed us “the vessel will break in half before the lugs come off” – this comment was not quite as comforting as I think he intended!PIPERhad not been mobilised with a full MBES system before and for the first time was equipped with a R2Sonic 2022 MBES and Velodyne Puck VLP 16 MLS. An Applanix PosMV system was used to supply position and motion information to both the MBES and MLS. A laptop running QPS Qinsy acquisition software was used to quality control all incoming data in
The survey spread added a substan tial amount of weight to the vessel, a trip to the local refuse weigh station showed that (less the weight of the trailer) we were only 50kg shy of the 800kg maximum lift of the Airbus B2 SquirrelWoodshelicopter.andPartners Consultants
real time and to ensure all data was being re corded required.andequipmentberdueMBESarelargerTraditionallycorrectly.vesselsusedforsurveystothenumofsensors,computersAcon
Figure 1: The location of the surveyed dams in the Waitakere Regional Park.

missions established that while the Waitakere Dam had a small (yet challenging) boat ramp, the Upper Huia and Upper Nihotupu dam had no practical boat ramps and limited vehicle access to the dam face. The maximum depth and clarity of the water within the dams meant that a bathymetric LiDAR system would not be effective, so the next best solution was to use a helicopter to lift our survey vessel into the dams.
As the date of the survey ap proached, the weather conspired
against us and the helicopter lift was pushed back a week; this did give us the opportunity to survey the Waitakere Dam using the small boat ramp. This was essentially used as a full shake-down of all the survey equipment and systems, with the fall back of simply being able to pull the boat back onto the trailer should something go wrong (a luxury we would not have at the other two dams). Fortunately, there were no survey system issues at Waitakere, however as expected, we faced some challenges launching and recovering the vessel from the steep and narrow boat ramp. A few choice words were uttered as we struggled to get PIPER back on the trailer in fading light, and all agreed we would just use the helicopter should there be a next time.The weather cleared the following week and we prepared to survey the remaining dams. Watercare’s depot at the Lower Nihotupu dam was used as a staging post and where the initial lift would take place. PIPER would be flown from the depot to survey the Upper Huia Dam and left in the dam overnight. The next day it would be taken from Upper Huia to survey Upper Nihotupu and also left there overnight. Finally, with all surveying
Figure 2: PIPER at the Waitakere Dam.
It was a very odd sight to see a boat flying over the Waitakere Ranges to be dunked into the dams like a giant tea bag. The team at Heletranz were incredibly professional and managed to place PIPER right next to the bank for retrieval. The Heletranz team showed great interest in the job, which was far from their usual fare of lifting spa pools, air-conditioning units or ferrying people to Waiheke Island.With PIPER successfully deployed in the dams, the surveying could begin. An RTK base station was set up on existing dam survey control. MBES data was first acquired starting at the deeper and easier to navigate sections, gradually progressing closer to the shallower shoreline. The MBES was physically rotated 30° away from nadir to focus on covering the bank more effectively. Unfortunately, the dam levels had decreased significantly since the reconnaissance
Data post-processing was conduct ed in QPS Qimera MBES processing software where the acquired point cloud data could be reviewed and
SURVEYING+SPATIAL • Issue 109 September 2022 29

and checks completed, the vessel would be lifted back to the depot. The rugged nature of the surrounding hills of the Waitakere Ranges meant that although each flight would only take around six minutes, driving the work ute full of shore-based equipment be tween the dams could take upwards of 50 minutes. A team of at least three people at both ends were required to ensure that PIPER was lifted and landed safely.
Figure 4: MBES and MLS data at the Upper Huia

cleaned. Sediment, weeds and even fish (eels in this case) can cause erroneous soundings that have to be removed to generate an accurate model of the dam. The MLS data was also processed and cleaned in Qimera with vegetation and unnecessary structures above the maximum water line of the dam removed. Woods sup plied a ground thinned LiDAR dataset that was added where required to the final data surface. Individual datasets were then combined to create one complete surface of the dam. Watercare required volumes calculated at each millimetre level of the dam. Upper Nihotupu was the deepest with 39.7m from the dam crest to the deepest point, followed by Upper Huia (30.1m) and Waitakere (19.1m).DMLhad previously conducted a survey of the Upper Nihotupu and Waitakere Dams in 1999 using a single beam echo sounder (SBES). SBES relies on a repeating single ping of sound projected at nadir to record a transect of water depths. The beam footprint of a typical SBES system is often around 10° which equates to a roughly 4.8m footprint at 20m water depth. By comparison, a single ping from a MBES system projects a wide swath of sound (in this case 3 x water depth) which is split into 1° beam footprints and digitised into hundreds
5: SBES beam width effect.

Dam.Figure
missions, exposing submerged trees and stumps that had to be avoided withMLScare.was conducted upon com pletion of the MBES operations. The MBES was raised out of the water to allow the vessel to navigate safely into shore and maximise coverage and accuracy. The low water level also exposed large mud banks, which presented an excellent target for the MLS.All lifts were conducted without a hitch and the pilot was even game to try to land the vessel directly onto the trailer when finished (we thought the risk to the survey gear was too high and opted to land it on the ground then winch it onto the trailer).
2. For more on using and an example of VRGIS for traffic analysis, see: Li, X., Lv, Z., Wang, W., Zhang, B., et al. (2016) WebVRGIS based traffic analysis and visualization system Advances in Engineering Software. [Online] 93, 1–8. Available from: doi:10.1016/j.
4. An example spatial query approach to VRGIS is given in this paper: Wang, W., Lv, Z., Li, X., Xu, W., et al. (2017) Spatial query based virtual reality GIS analysis platform Neurocomputing. [Online] Available from: doi:10.1016/j.neucom.2016.06.099 [Accessed: 21 August
of water depths from a single ping to create a detailed 3d point cloud of the

example application of immersive and interactive VRGIS in teaching geography can be read here: Lv, Z. & Li, X. (2016) Virtual Reality Assistant Technology for Learning Primary Geography In: Zhiguo Gong, Dickson K. W. Chiu, & Di Zou (eds.). Current Developments in Web Based Learning. [Online]. Cham, Springer International Publishing. pp. 31–40.
30 SURVEYING+SPATIAL • Issue 109 September 2022
seabed.Alimitation of SBES in this envi ronment is that it utilises the range (depth) of the first return from a pulse of sound, which can result in considerable horizontal positioning errors when surveying steep banks, as shown in Figure 5 . Figure 6 demon
cellent cooperation and coordination between all teams involved. From managing the weather, equipment, and remote survey areas, adaptivity and resourcefulness were key. It was incredibly rewarding to conduct such an exciting and unique survey and to contribute to the complex task of managing Auckland’s drinking water reservoirs. •
where the integration of HMD glasses allow users to create immersive and interactive experiences while conduction complex spatial analyses. The user, in this case, can apply touch-less interaction to manipulate a given 3D scene.5 Other applications of VRGIS have been to understand complex data. In climate modeling, where numerous vari ables make understanding weather phenomena for given regions an often very complex tax, VRGIS platforms have been considered a way to more easily to visualize complex scientific data in given spatial regions. In applications, the layering of data in a 3D environment allows users to query and look at other relevant information that may indicate a clearer understanding of factors affecting climate.6
•
The current challenge is to make light and small technol ogies where VR applications can still be utilized to their full extent while access live and large amounts of data. While there has been progress in this area, bandwidth and data limitations often mean that mobile devices cannot easily display complex, 3D data visuals as easily as many desktop platforms.7
5. The2017].
strates how SBES (in blue) struggles to the define the steep banks of a dam while the MBES (in red) provides a much more accurate model of the dam and reservoir and shows how much valuable information was gained for Watercare by conducting theThesurvey.successful completion of this project was due in no small part to ex

6. An discussion of weather and climate data with VR in application with GIS can be found here: Helbig, C., Bauer, H.-S., Rink, K., Wulfmeyer, V., et al. (2014) Concept and workflow for 3D visualization of atmospheric data in a virtual reality environment for analytical approaches Environmental Earth Sciences. [Online] 72 (10), 3767–3780.
Figure 6: Cross-section showing MBES v SBES.
3. Foradvengsoft.2015.11.003.moreonXEarth,see: Li, X., Lv, Z., Hu, J., Zhang, B., et al. (2015) XEarth: A 3D GIS platform for managing massive city information. In: [Online]. June 2015 IEEE. pp. 1–6. Available from: doi:10.1109/CIVEMSA.2015.7158625 [Accessed: 21 August 2017].
REFERENCES:
(continued from page 19)
1. For a general background to VR in GIS, see: Peter F. Fisher & D. Unwin (eds.) (2002) Virtual reality in geography. London ; New York, Taylor & Francis.
7. For more on the challenges of VR, see: Mekni, M., and Lemieux, A., 2014, “Augmented reality: Applications, challenges and future trends”, In Proceedings of the 13th International Conference on Applied Computer and Applied Computational Science (ACA-COS ‘14), volume 20 of Recent Advances in Computer Engineering Series, pp. 205-215.
Undersea volcano mapping –Kevin Mackay, NIWA
Students sponsored to attend the day, seated from left: Chester Rosie, Frankie Robb, Jayden Ball and Hugo Collins, with S+SNZ HPS chair Stuart Caie, left, and NZR AHS chair Kevin Smith, right.

WORLD HYDROGRAPHY DAY
This year, the Hydrography Professional Stream (HPS) of S+SNZ and the New Zealand Region (NZR) of the Australasian Hydrographic Society (AHS) jointly hosted the World Hydrography Day seminar in Wellington, on July 8. The seminar hosted 54 attendees including four students who were sponsored to attend and present or report back. We heard a variety of presentations and there was also a group panel at the end of the seminar, discussing opportunities and barriers for student employment within the industry. An outline of the presentations follows. For more information, they can be viewed on the AHS website (ahs.asn.au).
SURVEYING+SPATIAL • Issue 109 September 2022 31
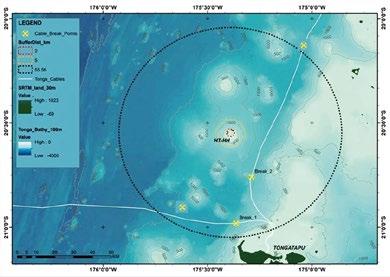
Map of the seafloor surrounding Hunga Tonga-Hunga Ha’apai showing found cable breaks (Kevin Mackay, NIWA).
Jayden Ball, Hugo Collins, Frankie Robb and Emily Tidey
Kevin showcased work by NIWA in aid of recovery after the Tongan eruption. This work entailed extensive mapping of the seafloor surrounding the volcano, Hunga Tonga-Hunga Ha’apai. The eruption, which occurred in December last year, was the largest eruption since Krakatoa and had massive effects on Tonga.
Seminar
The work began with a planning phase, using historical bathymetric data to better understand the topography of the seafloor and target the areas to survey. Two sections of broken submarine cables were identified as high priority areas as these would need to be fixed in order to restore vital communications infrastructure to Tonga. As a result of this work it was determined that the earthquake affected more than 8000km2 of sea floor and deposited 7km2 of new material. The project is ongoing, with an uncrewed vessel now being deployed to properly survey over the maxima of the volcanoes.
In 2021, LINZ was approached by Antarctica New Zealand to obtain new bathymetric data around Pram Point for the purpose of bringing in a large ship to aid in the Scott Base rebuild. The new base is to be prefabricated and shipped to Antarctica, so as to require minimal construction once on the ice. The project used the Icefin, a new ROV/AUV being designed to run exploratory missions on other planets.Thelargest problem when sounding under ice is how to position your instrument, with the Icefin using an inertial navigation system (INS). The project encountered multiple challenges in the form of pressure ridges, data issues, conversion errors and INS drift. Whilst the project did supply interesting data, it did not meet charting standards. In order to meet these requirements, Brad suggested navigation must be improved with either the use of an
Sea turtle eating plastic mistaken for food (The Times/ Alamy).

Image of the new 78m Armada vessel being launched in Vietnam (Dave Field, Ocean Infinity).

Mapping the Plastic – Simon Ironside, FIG Commission 4 Working Group 4.3
By 2050 it is estimated that there will be more plastic in the ocean than fish. Mapping the volume of plastic is becoming increasingly important in effectively tackling the issue. Our current estimations of plastic volume are based on empirical modelling or beach surveys. However, these techniques do not provide an accurate representation, especially for plastic build-up in areas far offshore. Simon outlined how remote sensing can be used in modelling plastic observed in the water column with some examples of training data.
Flowchart outlining the process undertaken to perform image classification (Simon Ironside, FIG Commission 4).

Online link: dead-turtle-6dt7mdpgswww.thetimes.co.uk/article/plastic-found-in-every-
32 SURVEYING+SPATIAL • Issue 109 September 2022
An algorithm was created using deep learning to accommodate for low training data. The algorithm focused on the accuracy of the data over various spatial resolutions. After intensive testing, the algorithm was able to detect plastic bottles down to an area of 1cm2. It is hoped that the model will continue to develop and play a fundamental role in helping the world tackle and remedy the growing problem.
The Armada fleet –Dave Field, Ocean Infinity
Dave outlined the exciting new tools that Ocean Infinity is employing to complete hydrographic surveys. The Armada fleet uses innovative, remotely operated technology to complete tasks in a safer and more efficient way. Dave covered the immense number of robotic vessels already at sea, but pointed out the uniquely vast size of the Armada fleet, which has a variety of vessel sizes to enable flexibility. He said that, from September, these vessels will be coming out about every two months.
Seafloor mapping under the ice –Brad Cooper, LINZ
The Armada fleet has been specifically designed for efficiency, safety and the environment. One of the key ben efits of the uncrewed fleet is the ability to lose only assets, rather than people, with Dave highlighting the importance of human lives above all other assets. Dave inspired the room to look forward to the future of this industry.
Maximising the value of hydrographic data

Additionally, pre-Covid, Banks Peninsula serviced a number of cruise ships whose anchors caused a significant amount of damage to the sea floor. This has had a direct effect on the local Hector dolphins.
The presentation continued with the Navy’s response to the Tongan volcano eruption in 2021, in which it played a vital role in completing rapid environmental assessments via the use of new portable MBES instruments. This allowed supplies and aid to be efficiently and effectively brought to shore.
Results of the hydrographic surveys performed by the RNZN in response to the eruption of Hunga Tonga-Hunga Ha’apai (Paul Trudgian, RNZN).
Bradley Cooper presenting an update on LINZ’s hydrographic contribution to the Scott Base rebuild.
ultra-short baseline (USBL) or through conventional survey methods with an ice breaker.
Kate presented her recent work on the HS69 survey of the Stewart Island and Bluff area. Her presentation outlined the methodology of shift rotation. Each crew member would complete a two-week stint on the boat, with stag gered changes so there was a one-week overlap between crew members. At any given time, there were three DML surveyors and three other crew members on the vessel. While working on location, large data was one of the difficulties faced, particularly between the collection and processing PCs – this was likely due to the fact they were collecting around 1GB of data per minute. Along with the survey methodology, Kate also spent time explaining some of the adventures they enjoyed on board; these included seeing a wide variety of wildlife and the opportunities to explore remote islands in the area.
SURVEYING+SPATIAL • Issue 109 September 2022 33
Paul updated attendees on recent work the Navy has undertaken in the Southwest Pacific, beginning with work in Fiji in 2020. This included deploying a MATT (Mutual Assistance Training Team), which worked directly with the Fijian military forces in training hydrographic surveyors for the Fijian Navy.
Canterbury’s Banks Peninsula is home to many locals, fish ing boats and tourism ventures. It has a variety of marine environments as well as two marine reserves. In order to help ECAN, LINZ and the Department of Conservation protect the environment, accurate hydrographic data is needed; one example Monique mentioned was the need to understand how rocky reefs are changing over time.
Naval hydrography in the Southwest Pacific – Paul Trudgian, RNZN
– Monique Ladds on behalf of ECAN
This project involves a ‘partnership approach’, with the aim of becoming a community-wide project. Other aspects of the project include habitat surveys and restoration, with the final project being shared among groups afterwards. Hopefully, with the new data, the Banks Peninsula’s coastlines and shallow waters can be better managed for all people and ecosystems to enjoy.

Stewart Island/Rakiura and Bluff Hydrographic Survey – Kate Downes, DML

The RNZN intends to increase its survey capability in the future with the addition of a new vessel to the fleet, continued use of portable MBES instruments and the introduction and use of autonomous systems.
Establishing benchmarks near Christmas Village to establish survey control (Kate Downes, DML).
Watercare reservoirs survey programme –Hayes Ballantyne, DML
Combined dataset illustrating reservoir volume (Hayes Ballantyne, DML).
Using GIS in planning hydrographic jobs –Chester Rosie, University of Otago

Student Chester Rosie presented work he had undertaken for a Special Topic paper with Te Kura Kairūri/the School of Surveying. His project aimed to investigate the use of GIS for hydrographic survey planning. His goal was to create a

Access to safe water is at the forefront of modern societal problems. New Zealand has a growing population and increased urbanisation so spatial data on New Zealand’s water sources are becoming increasingly critical. This applies especially in Auckland.
Results of largest polygon searching function when performed on an area just off the Otago Peninsula (Chester Rosie, Otago University).
Helicopter flies off after dropping the vessel into the reservoirs (Hayes Ballantyne, DML).

DML was tasked with undertaking a hydrographic survey of Auckland’s dams in the Waitakere Ranges. This involved combing MBES and mobile laser scanning with terrestrial surveying to create a 3D model to deduce the water volumes. Being in the heart of the ranges, access proved difficult. With no infrastructure to transport the boat in directly, the vessel had to be ‘dropped in’ by helicopter.
function which would optimise the time spent planning for surveys, particularly in terms of the order and position of run-lines. He focused on a GIS feature that would analyse the largest possible rectangle in an area. The goal of having the largest rectangle was to find the most efficient run-lines. Although Chester covered some of the current limitations of his investigation, it was clear that, with further time and discussion).joinedthishavedaypresentedonebeingthestudentsrepresentingdidthis.potentialthereresources,issignificantforChesteragreatjobtheattendingseminar,theonlywhoformallyonthe(therestofuscompletedwrite-upandinthefinal
Littorally Joining Land and Sea (JLAS) –Jennifer Coppola, LINZ
Jennifer provided an update on the continued LINZ JLAS project to determine the best methods and practices for integrating hydrographic and terrestrial vertical datums. This project began with an investigation in 2017 and comprised a literature review and assessment of the current tide model.
Hayes explained the planning undertaken to minimise the helicopter’s flight time, and thus keep costs down and eliminate wasted time. Because of sounding technology improvements, DML found that the reservoirs had a larger volume than that calculated in a survey in 1999.
34 SURVEYING+SPATIAL • Issue 109 September 2022
The development phase focused on creating a new national tide model, which was work carried out primarily by NIWA. This work required additional tide stations to be constructed to provide a more complete dataset. The implementation phase now takes this new tide model and incorporates all the various tide layers into an online calculator. The various associated offset grids between all the LVD, chart datums and terrestrial datums will be published as traditional offset grids. Ongoing work aims to incorporate new data on an annual basis and, looking forward, this data should help aid responses to tsunamis and the threats of sea-level rise.
SURVEYING+SPATIAL • Issue 109 September 2022 35
The day wrapped up with the AHS AGM where we recognised AHS award winners Kevin Smith, for service as NZ Region chair and Awards chair, Pip Davies for service as NZ Region secretary, and Rhys Davies, for career achieve ment (training), and we also farewelled Gary Chisholm, who is stepping down from the NZ Region executive after a spectacular 20-plus years’ work for the society. •
With inevitable sea-level rise and increased erosion, coast al property poses significant complications around the world. However, the global trend still shows an increasing proportion of people moving to coastline settlements. This is illustrated in none other than Australia in which more than 80% of the population lives by the coastline (mostly along the eastern coastline).
Q & A discussion: “How can we as an industry provide work experience and potential pathways to employment?”
Daniel outlined how digital data is in increasing demand among both the private sector and territorial governments, and how quality is important for decision making.
Improved low-altitude LiDAR with four band cameras is crucial for providing more than just bathymetric depths.
Information about areas of sedimentation and the health of vegetation further enhances the spatial analysis performed by the devices. Additionally, with higher flying capabilities, LiDAR aircrafts have a three to four-fold increase in efficiency.

Sustainability through innovation in hydrography – Daniel Kruimel, AAM/ Woolpert

Diagram of increased LiDAR being captured by higher flying vessels (Daniel Kruimel AAM/Woolpert).
The final aspect of the day was an open group discussion. Both student and professional attendees participated in the session led by Dave Field on behalf of industry, Stuart Caie for the profession and Emily Tidey representing tertiary institutions and students generally. This discussion focused on what was currently preventing students from gaining work experience in the hydrographic industry, such as timeframes, pay or travel requirements, ‘competition’ with land surveying opportunities and the need for industry contacts.
The discussion helped to identify that the summer period between November and February was realistically the main time students would be available for work. In addition, it was realised by the industry that further advertising needed to be done to help reach a larger audience of students.

It was extremely beneficial to have this discussion, be cause there was a direct line of communication between the students in the room and the hiring professionals. It is hoped this discussion will help encourage summer employment opportunities for future students.
Group discussion about student work experience.
Jennifer Coppola presenting an Update on the LINZ JLAS project.

TRANSITIONING TO NEW LANDONLINE – SURVEY

To make sure we get it right for our customers, we’ve taken the following steps to ensure the transition is as seamless as possible.
now 2022 and we’re rolling out the first phases of the New Landon line – Survey application.
An improved user experience means customers who use Legacy Landonline can learn how to use the new application by watching a 5-minute video.
While I was engaging with surveyors back in 2018, a clear theme emerged around transition. Memories of a hard transition to Landonline when it was first launched in 2000 led to calls for the transition to New Landonline needing to be easier and less disruptive to businesses.
Supporting firms to take the approach that’s right for them
Nick Stillwell, Lead Consultant Surveyor, Toitū Te Whenua Land Information New Zealand

SURVEYING+SPATIAL • Issue 109 September 2022 37
In this article, I’ll focus on the first two points: phased rollout and transitioning at your pace.
Improved support means you can take a self-service approach to working through issues – on line support will be just one click away.
Phase 1: Pilot
It’s
Survey firms self-nominate if they want to use the new application in (continued page 48)
Phases for rolling out New Landonline – Survey

A phased rollout will initially enable surveyors to move back wards and forwards between New Landonline – Survey and Legacy Landonline, as the two systems are integrated. In other words, you can work on the same transaction in both systems.
Firms decide how and when they start using the new appli cation to ensure the transition approach works for them.
“Outside of the profession, this might be dismissed as harmless, but under the Act, any attempt by an unlicensed person to mark a boundary would be considered to be undertaking a cadastral survey illegally.” •
“Anyone convicted of undertaking an unlicensed survey could be fined up to $1000.”
The defendant argued that as he had never lodged the surveys (and never intended to), he could not have conducted an unauthorised survey. The court did not accept the argument and he was found guilty, fined and ordered to pay a percentage of the Board’s legal costs.
Mr Haanen says it’s unlikely such an extreme case would happen here, but there is a need for better awareness about who can undertake a cadastral survey.“Itisimportant people are aware that cadastral survey work must be undertaken by a licensed surveyor. The exception is where survey technicians may carry out work under the direction of a licensed cadastral surveyor,” Mr Haanen says.
NZ Manufactured Plastic Boundary Pegs & Inground RFID/NFC iMark Pegs NEW DRILL AUGER AVAILABLE: To speed up placing our strengthened and improved peg into hard surface conditions PHONE: +64 21369804 ORDER ONLINE: www.surpeg.com EMAIL: gregar@surpeg.com .

38 SURVEYING+SPATIAL • Issue 109 September 2022
Surveyor-General Anselm Haanen . . under the Act, any attempt by an unlicensed person to mark a boundary would be considered to be undertaking a cadastral survey illegally.
The

one acting under their direction.”
Mr Haanen says licensed surveyors or their staff who have concerns about irregular survey work, should raise them with his office. “I’d like them to contact us as soon as possible,” he says.
Australian case highlights risk of unlicensed cadastral surveys
“Section 47(1) of the Act requires a cadastral survey to be conducted by a licensed cadastral surveyor or some

Australian case of a man convicted for performing cadas tral surveys without a licence is unlikely to be replicated here, but is a timely reminder of New Zealand requirements, says Surveyor-General Anselm Haanen.

In February, the Perth Magistrates Court convicted an unlicensed surveyor who had been operating for more than 40 years. He was found guilty of six criminal charges brought against him by the Land Surveyors Licensing Board of Western Australia.
To date no one has been prose cuted, but under s57 of the Cadastral Survey Act 2002 it is an offence for somebody without a licence to undertake a cadastral survey.
the minimum number of mem bers required to set up a society is reduced from 15 to 10 members. More importantly, an ongoing minimum number of members is required to maintain the society.
The Incorporated Societies Act 1908 (“1908 Act”) has been replaced. After governing incor porated societies for more than 100 years, there is now new legislation that takes into account modern devel opments and increased complexities in the sector.
In the property development context, consideration needs to be given to the size of the project and number of dwellings.
new sanctions and offences for non-compliance or breach of the 2022 Act.

Please contact Stephanie Harris or Nicole Warner for more informa tion. •
SURVEYING+SPATIAL • Issue 109 September 2022 39
new governance and operational matters concerning committee structures and the mode, method and timing of meetings
This is not an exhaustive list of the changes, and each society will have unique requirements to ensure compliance with the 2022 Act.
The Incorporated Societies Act 2022 (“2022 Act”) came into force on April 5, 2022. Associated regulations are pending and various provisions in this legislation will come into effect at different times that are yet to be announced. New societies will soon need to be incorporated in accordance with the provisions of the 2022 Act. For existing incorporated societies, there is a transitional period before they are required to enter into the new regime.
• LEGAL COLUMN
cations to ensure the requirements of the 2022 Act areKeymet.changes to the 1908 Act include:
Glaister Ennor is well placed to assist you navigate this new regime. We can advise you on the limitations and advantages and practical considerations (having regard to your goals) when establishing a new incorporated society or considering the re-registration process.
New SocietiesIncorporatedAct2022
On re-registration under the 2022 Act, existing incorporated societies will be required to file a constitution that is compliant with the 2022 Act. In some cases, this will require an extensive review of the current constitution and adoption of modifi
codifying officers’ duties resulting in officers having duties akin to those of company directors
All existing incorporated societies will be required to re-register under the 2022 Act. The deadline for re-registration will be the later of December 1, 2025, and the date that is two years and six months after the commencement of certain transitional provisions contained in the 2022 Act. Until that time, existing incorporated societies continue to be subject to the 1908 Act (unless they re-register under the 2022 Act before the expiry of the transitional period).
a person must consent to be a member of a society. Being the registered owner of land does not automatically make a person a member.
members have no rights to the assets of the society. Upon re moval or liquidation of a society, surplus assets (after all costs, debts, etc. have been paid) must go to a not-for-profit entity (as opposed to the 1908 Act where surplus assets could be disposed of in accordance with the consti tution of the society). This means surplus assets cannot be distrib uted to the members (unless the member, or members, is a notfor-profit entity). Again, in the property development context, careful consideration needs to be given to the appropriateness of utilising a society under the 2022 Act given the nature of the assets concerned.
new information dissemination rules to allow for greater finan cial transparency and account ability of officers
new criteria and disqualification factors for officers of the society; and
Stephanie Harris and Nicole Warner –Glaister Ennor
The publication of the new Archie Bogle book has been provisionally entitled as ‘Mr Surveyor Bogle, CBE, FNZIS – Surveyor of the Century’. It includes a reprint of Archie’s partial 1975 autobiogra phy Links in the Chain written in his
AHB observing triangulation exam time 1905


40 SURVEYING+SPATIAL • Issue 109 September 2022
MR. BOGLE,SURVEYOR
Don McKay
Living “off the land”
• BOOKS
cbe , fnzis ofSurveyortheCentury
The book itself will be a quality product that will make an impressive coffee or reception table display with a hard cover, good-sized font and 50 or so coloured photos many of which show details of bush surveying and related stories of 100 years ago. The price of the book has not yet been set but it will be extremely reasonable and will also be available in eBook. It will undoubtedly become a collector’s item and a treasured addition to any surveyor’s library. Due for distribution early next year, please look out for further details in Institute communications over the coming months.

•
Archibald Hugh Bogle needs no in troduction to older Institute members – he was undoubtedly one of the best known and charismatic New Zealand surveyors of the 20th century. His service to the New Zealand Institute of Surveyors and the surveying profes sion remains unparalleled. Accolades such as ‘Doyen of the Profession’, ‘The Great Totara’ were heaped upon him. However, most of the younger mem bers of the Institute will know little of this quite remarkable man. Graduates of the Survey School in particular should hold him in high regard, as with John Mackie, they practically single-handedly founded the school after more than 30 years endeavour. Of course, his story will be unknown
On site
by the majority of non-surveyors, but he was also, undoubtedly, a great New Zealander. It is anticipated that the publication of this book will help rectify this deficiency.

Makingimprovisationyourown SURVEYING+SPATIAL • Issue 109 September 2022 41
This book project is a result of a partnership between the Kairuri Trust, Survey +Spatial NZ and a self-appoint ed committee of surveyors (Gordon Andreassend, Andrew Blackman and Don McKay), together with Diana Goodman, Archie’s granddaughter. The Trust has provided financial assistance and S+S both financial and administrative assistance. All proceeds go to the Trust.
inimitable, humorous and easy to read style. A second section has been added giving a short biography of his life and achievements. The third section includes a series of anecdotes and writings by or about Archie, illus trating his wit and wisdom and some previously unpublished.
42 SURVEYING+SPATIAL • Issue 109 September 2022
All three have recently been involved in nautical charting surveys for LINZ and are now building their portfolio of work and in-charge experience with the aim of becoming certified at Level 1 (CPHS1). For more information on Hydrographic Certification, see tified/hydrographic-surveyor/certification-levelshttps://sssi.org.au/get-cer
On July 8, the Australasian Hydrographic Society (AHS) NZ Region and the Hydro Stream hosted a seminar at Miramar Golf Club. More than 50 delegates attended a full day, with 11 presentations from across the profession from Government, industry, academia, science and Defence. Those attending included the Australian Hydrographer with members of the Australian Hydrographic Office, and the New Zealand National Hydrographer.
CongratulationsCommended.toHayesBallantyne,

Kate Downes and Rian Mayhead (left to right above) who were recently certified at Level 2 (CHPS2) by the Australasian Hydro graphic Surveyors Certification Panel (AHSCP). The AHSCP is jointly sponsored by S+SNZ in NZ and SSSI in Australia and undertakes the professional assessment and certification of hydrographic surveyors in Australasia.

Jimmy Van der Pauw Rhys Davies with Kevin Smith, AHS NZR Chair
HYDROGRAPHIC STREAM UPDATE
The award recognises Rhys’ keenness to develop his professional career by taking on challenging projects and stepping up to take on leading roles. Rhys has dealt with and adapted to the ever-changing technology landscape,
• NEWS
He has demonstrated sustained excellence in his work and is to be commended for his dedication and commit ment to his career progression and achievements to date. He is passionate about his work and is a great ambassador for the profession. And finally, Stuart Caie, the stream Chair, was among a number of Kiwis to receive a gong at the Asia Pacific Spatial Excellence Awards, receiving Professional of the Year, Highly
The day included a discussion on how the hydrographic industry/profession can provide work experience and potential career pathways for students. Four students from the University of Otago’s School of Surveying were sponsored to attend. A report from one of those attending is included in this edition of the magazine.
In June, Toitū Te Whenua LINZ worked with Napier Port to successfully develop a next generation high-density Electronic Navigational Chart, or hdENC, to support the port’s multimillion dollar ‘6 Wharf’ development and, as a result, New Zealand’s first official hdENC was launched
A great time was had by all at the 2022 Conference in Rotorua. Congratulations to Jimmy Van der Pauw who was awarded the stream’s Outstanding Hydrographic Surveyor Award. Another stream member, Rhys Davies, was the recipient of the AHS Award of Merit – Career Achievement, which he received at the AHS/S+SNZ day seminar in July.

from acquisition to data processing and data management, and in 2020 attained Certified Professional Hydrographic Surveyor Level 1 (CPHS1) from the Australasian Hydro graphic Surveyor Certification Panel (AHSCP).

A stand-out was the presentation on NIWA’s recent project to map the seafloor around the Hunga Tonga-Hun ga Ha’apai volcano following its eruption in January 2022.

LINZ’s Joining Land and Sea (JLAS) project has moved to the development and implementation phases where the new national tidal model, produced by NIWA, is being tied to approximately 200 coastal link sites – a location along the coast that connects the land datum (NZVD2016) to a number of vertical datums such as MHWS, MSL and LAT.
Preliminaryconcentration.datashowsthat the water column is still recovering, and some airborne ash is yet to completely settle on the seafloor. There is also evidence that the volcano may still be erupting, with a dense ash layer found in the upper water column near the volcano.
The voyage leader, NIWA marine geologist Kevin Mackay, says that he was completely taken aback by what they first saw.“With an explosion that violent – the biggest ever record ed – you would expect that the whole volcano would have been obliterated, but it wasn’t. While the volcano ap peared intact, the seafloor showed some dramatic effects from the eruption. There is fine sandy mud and deep ash ripples as far as 50 kilometres away from the volcano, with gouged valleys and huge piles of sediment.”
New findings from the record-breaking Tongan volcanic eruption are “surprising and unexpected”, say scientists from New Zealand’s National Institute for Water and Atmospheric Research (NIWA).
NIWA research vessel Tangaroa with the peaks of the Hunga Tonga–Hunga Ha’apai volcano in the background.
NIWA scientists recorded up to seven cubic kilometres of displaced material – the equivalent of 5 Wellington Harbours or 3 million Olympic-sized swimming pools – but there is likely more yet to be seen. Tonga’s domestic internet cable that was broken and cut off communication is buried under 30 metres of ash and sediment.
(Credit: NIWA-Nippon Foundation TESMaP/Rebekah Parsons-King).
NIWA biogeochemist Dr Sarah Seabrook says the persistence of ash they saw in the water column has a myriad of impacts on the ocean ecosystem.
in June 2022. The hdENC enables mariners to navigate their vessels safely and efficiently in confined waters with minimal under-keel clearance.
The research is also supported by The Nippon Founda tion-GEBCO Seabed 2030 Project which aims to map the world’s ocean floor by 2030. NIWA mapped 22,000 square kilometres of the surrounding seafloor, which showed
NIWA also tested the water column for physical and chemical characteristics, including temperature, nutrients, and oxygen
SURVEYING+SPATIAL • Issue 109 September 2022 43
The team also studied impacts on the ecosystem. The volcano is devoid of biology, but remarkably there are features as close as 15 kilometres away that still have abundant and diverse populations of fish and other animals. Scientists speculate that they escaped impact by being out of the eruption flow’s pathway, or far enough away to avoid thick ash fall.
changes covering an area of 8,000 square kilometres.
The tidal model comprises 3.5 million nodes (32,000 previously) and has a resolution between 100m and 1km. Separation models for each datum (i.e. NZVD2016 – LAT), which will include accuracy information, will be published on the LINZ Data Service and embedded in the online JLAS coordinate converter tool.
TONGA ERUPTION DISCOVERIES DEFY EXPECTATIONS
NIWA’s research vessel, RV Tangaroa, has returned from a month-long expedition as part of the Nippon Foun dation-funded Tonga Eruption Seabed Mapping Project (TESMaP), where scientists were studying the effects of January’s eruption of Hunga Tonga–Hunga Ha’apai (HT –HH).Due to the power of the explosion, researchers expected to find dramatic changes to the volcano, but instead found it largely intact.

NIWA marine biologist Dr Malcolm Clark says that having healthy life close by is a positive sign.“Although the seafloor on the volcano is largely barren, surrounding seamounts have pockets of normal biodiversity, such as corals, sponges, starfish, and mussels, indicating the resilience of such marine ecosystems and giving some hope for recovery. More work needs to be done before we can be confident of how the ecosystem will respond, but these surviving animal communities indicate what kind of life may repopulate HT-HH. The sites sampled during the voyage give us a baseline for monitoring recovery in the future.”
NIWA
“We, along with other nations on the Pacific Ring of Fire, know only too well how at mercy we are to nature. By studying an unprecedented event like this in such detail, we will gain invalu able knowledge and experience so we can recover quickly and be prepared for the next time something like this happens.”
Since Survey + Spatial first did a Technology Spotlight feature on Critchlow Geospatial’s SwitchMyFleet solution in
Scientists also collected hundreds of samples during their mission, including seabed cores, various corals and 250 kilograms of rock, some of which were newly formed from the eruption.
The second part of the TESMaP mission will see the calde ra mapped by an uncrewed surface vessel (USV), which was built by SEA-KIT International and is currently being transported from the UK. The caldera was unable to be surveyed during NIWA’s voyage because of safety reasons.
“In the immediate aftermath of an eruption, volcanic ash fertilises microscopic ocean algae thanks to the ash’s concentration of nutrients and trace metals - in this case, there was a bloom of life so big that we could see it from space.“However, the unexpected persistence of the ash in the water column is creating prolonged impacts. For example, spikes in volcanic ash were coupled to the appearance of oxygen minimum zones – where oxygen levels in the water are at their lowest - which could have implications for important services provided by the ocean, such as food production and carbon sequestration.”
The TESMaP project provides a unique opportunity to study the effects of an undersea volcano, which has huge implications for nations and ecosystems that live near these natural wonders.
CEO of SEA-KIT Mr Ben Simpson says their vessel will fill in the final pieces of the puzzle.
Tonga’s Deputy Secretary for Lands and Natural Resour ces Taaniela Kula says this work is vital for the recovery of Tonga.“The eruption sent shockwaves around the world, but the effects were felt most keenly in Tonga. It was a miracle to lose so few lives (God rest their souls), but our streets, crops, air, and waters were devastated.
“The eruption of Tonga’s underwater volcano is not ‘fire on the opposite shore’ but is also of great relevance to us living in Japan. We enjoy the ocean’s rich blessings but are faced with the risk of natural disasters that come with being an island nation on the Pacific Rim.
“This project is being conducted in the hope that understanding the effects of the volcanic eruption will contribute to the recovery of Tonga, where the sea is an important resource, and to the disaster preparedness of many countries, including Japan.”
The mission has also given important insight into the fate of the broken domestic internet cable, with strong indications that this will need to be fully replaced.
44 SURVEYING+SPATIAL • Issue 109 September 2022
The Nippon Foundation’s Executive Director Mitsuyuki Unno mirrored Mr Kula’s words.
Steve Critchlow, Group Managing Director
“Our USV Maxlimer will map the current shape of the caldera and measure environmental conditions of the water above it, which are things we don’t yet know. Maxlimer will be controlled remotely from Essex in the UK, which is 16,000km away! The unmanned vessel will also use an innovative winch and sensor deployment capability to map any new volcanic activity. This is a truly global effort to get the full picture of a globally significant event, and we’re delighted to play our part in it”.
Fisheries are a vital part of Tonga’s economy and subsis tence, with species such as snapper and tuna being key to the region. There has been a reduction in some of Tonga’s fleet, with many boats damaged in the tsunami which followed the eruption. Rebuilding the fleet is the highest priority and it will be a while before it is fully understood how fisheries have been impacted.
The unmanned part of the research mission to study the caldera is expected to be completed in mid-July.
NEW ZEALAND-DEVELOPED SPATIAL TECHNOLOGY WINS BIG ON THE INTERNATIONAL STAGE
Critchlow Geospatial’s SwitchMyFleet wins the SIBA|GITA Award for Technical Excellence at the 2022 Asia-Pacific Spatial Excellence Awards

Graphic: NIWA / Nava Fedaeff
Antarctica is experiencing stunning skyscapes like those recently seen in New Zealand, thanks to the afterglow effect from the Tongan volcano.

specifically for transport sector businesses needing to switch their commercial vehicle fleet to electric power, SwitchMyFleet combines the physics of moving vehicles, geospatial data, and complex route optimisation algorithms into an easy-to-use tool that balances time, distance and energy use.
Photo: Stuart Shaw/Fly On The Wall Images
Clearly a huge success story for all involved. Richard Briggs, EECA’s Transport Portfolio Manager, had this to say on learning about Critchlow Geospatial’s latest award:
You can checkout SwitchMyFleet for yourself and build your own business case for EV transition at: https://www. critchlow.co.nz/products/switchmyfleet
(continued page 48)
Scientists working in Antarctica have captured breath-taking photos of the skies above the icy continent, including these mesmerising shots taken by Antarctica New Zealand science technician Stuart Shaw, who is stationed at Scott Base for the winter.
SURVEYING+SPATIAL • Issue 109 September 2022 45
NIWA
NIWAworld.forecaster
2021, the Critchlow team was named global winner of the Location-Based Services category for SwitchMyFleet at the internationally acclaimed Geospatial World Innovation Awards held in Amsterdam, the Nether lands.Most recently, Critchlow Geospatial was named as winner of the SIBA|GITA Award for Technical Excellence for SwitchMyFleet at the 2022 Asia-Pacific Spatial Excellence Awards.Created
June 2021, Critchlow has gone on to win two big interna tional awards, as well as take out the Technical Excellence category at the 2021 New Zealand Spatial Excellence Awards.InOctober
“Usually in mid-winter, Antarctica is nearly continuously dark, except for a slight ‘nautical twilight’ at around midday which means the horizon is faintly visible in good conditions. But this year, we were presented with quite a show, which had most of the station personnel grabbing jackets and running outside with their cameras to look at the awesome colours. Believe it or not, I haven’t edited these shots either, they are pretty much as we saw it. It’s incredible,” said Mr Shaw.
He was prompted to share the images after seeing a story from NIWA about unusually pink skies in New Zealand, caused by remnant aerosols in the stratosphere from January’s Tongan volcanic eruption, which made him realise that he was seeing the same effect at the bottom of the
Nava Fedaeff says that satellite lidar (laser radar) data shows an abundance of aerosols in the

It uses authoritative New Zealand address and road network data from NationalMap and the user’s own real-world fleet configuration and route inputs to calculate the metrics businesses need to build their case to transition.
All the international plaudits and recognition come as little surprise when you consider that it is a world-first innovation. Before SwitchMyFleet, there simply wasn’t any tool available that would assist transport operators to confidently build a business case to switch their fleets to EVs.SwitchMyFleet was developed with co-funding from the New Zealand government through the Low Emission Vehicles Contestable Fund administered by the Energy Efficiency and Conservation Authority (EECA).
“It’s a real pleasure to comment on another momentous win for Critchlow Geospatial. The transport sector provides the single largest opportunity to improve New Zealand’s energy productivity and reduce energy-related emissions. It’s tools such as SwitchMyFleet that will enable this sector to more quickly and confidently transition from ICE to electric vehicles, so that they can realise cost savings, reduce their greenhouse gas emissions and help accelerate the decarbonisation of New Zealand.”
From Hut Point looking north towards McMurdo Station, ‘Vince’s Cross’ in foreground
TONGA VOLCANO “AFTERGLOW” CAUSES DAZZLING SKIES IN ANTARCTICA
Emily Tidey has been using hydro graphic technologies, including high-resolution multichannel seismic lines and multibeam bathymetry, to investigate the subsurface features of the sub-Antarctic Auckland Islands to piece together the erosive and depositional history of the island group, which contributes to global reconstructions of climate change.
46 SURVEYING+SPATIAL • Issue 109 September 2022

for multi-constellation (MGNSS) using single frequency, mass-market, low-cost smartphones. The paper bit. ly/Odolinski2018 describes low-cost smartphone RTK positioning with GPS, BDS, Galileo, and QZSS. A new ambiguity resolution strategy (bit.ly/ Odolinski2020) outperforms tradition al approaches and a dual frequency low-cost RTK solution preformed nearly as well as a traditional survey gradeFurtherreceiver.smartphone research using dual frequencies, in collaboration with RMIT, University Melbourne, FrontierSI and funded by Geoscience Australia, found that a significant effect on the phone’s RTK positioning performance was dependent on whether the phone was held upright or lying down. The work also demon strated a near 100% availability of cm-level RTK positioning precisions over a short baseline. Mass-market smartphones, tracking multiple
GNSS positioning
Most
• UNIVERSITY HAPPENINGS
Dr Paul Denys
Robert Odolinski has developed pre cise cm-level positioning algorithms

Robert is a Visiting Researcher at Google working on GNSS positioning applications.
readers are familiar with the teaching programme at the School of Surveying. But I expect readers are less likely to be familiar with the range of research projects undertaken by staff: current interests include Property rights and water boundaries (M Strack), Remote sensing and photogrammetry to detect and monitor environmental change (P Sirguey); Geospatial tools to study natural hazard (A Miller); Antarctic sea ice (G Leonard); Spatial analy sis: Impact of SLR on property, Active transport to School (T Moore); Antarctic glacier ice (C Hulbe). Rather than try to describe all research, this article will concentrate on current geodesy and positioning research. Current research in other topics will be highlighted in future Survey + Spatial issues.

GNSS constellations and frequencies, have the potential to rival expensive geodetic grade GNSS receivers (bit. ly/Yong2021). In bit.ly/Yong2022, the best integer equivariant (BIE) estimator was shown to give better positioning precisions than that of the integer least squares (ILS) estimator that is commonly used in most RTK software.Thisyear,
Hydrographic surveying
Inshore (bit.ly/Glimer2021) and offshore seismic mapping combined with sediment cores and bathymetry revealed an extensive system of sediment-filled valleys that extend offshore to depths that exceed the glacial low-stand sea level (bit.ly/ Perkins2019a). Another paper (bit. ly/Tidey2019) considers the use of Auckland Island chart data to support scientific research. Legacy chart data are used to complement modern surveys, showing that looking beyond the printed chart to hydrographic fairsheets, as well as ancillary data collected as part of a charting survey, has scientific value.
Of recent media interest is the NZSeaRise project that provides nationwide coastal vertical land motion (VLM). It shows that VLM can be significant in some parts of the country and potentially of a larger magnitude than current day SLR. It also shows the variable nature of VLM. A contribution to this project has been the an update of tide gauge estimated SLR rates in bit.ly/ Denys2020, which applies corrections for VLM caused by slow slip events (Wellington), coseismic displacement (Lyttelton; Dunedin), solid earth deformation due to Southern Alps ice loss over the past century and localised subsidence measured using precise levelling. •
Earth deformation
SURVEYING+SPATIAL • Issue 109 September 2022 47
UTM grid bearings, corrected for meridian convergence to be true az imuths could then be compared with voyage destinations and stars and constellations at significant historical epochs. This proved adequate for eliminating certain possibilities and narrowing the field without incurring much time and expense. Michaela Thomson’s honours thesis tested several scenarios in the Perpetual Guardian Planetarium at the Otago Museum.Latitude and azimuth determi nation were crucial for Polynesian navigators, supplemented by observational techniques to effec tively make bigger targets to aim for. Although longitude could only be determined by dead reckoning, both latitude and azimuth made extensive use of stars, which alter gradually over the centuries due to precession (the movement in the Earth’s axis of spin).Knowledge about the effects of precession can assist scholars in weighting one voyaging date higher than another, or in providing possible reasons why voyages took place in a certain era if navigation methods depended on particular star configurations that were favourable in that era. A graph of the change in declination per century as a function of right ascension is developed in bit.ly/Goodwin2017a, in order to understand the influence of preces sion on different methods of latitude and azimuth determination, and to
Together with Robert Odolinksi, low-cost multi-frequency GNSS has been used in the marine environment for accurate positioning and tide measurements. They show the potential of this technology for improving total uncertainty calcula tions undertaken by hydrographers, engineers and scientists in the marine realm. Low-cost equipment in marine applications raises the possibility that more measurements can be taken, leading to improvements in monitor ing, modelling and understanding the marine environment.
Archaeoastronomy
the length of extended baselines, and a line was fitted. Its azimuth was checked by logging coordinates while walking the length of the baseline. This orientation and a mean baseline origin were then held fixed, and the standing stones positioned using a least squares trilateration network.
deduce when and where significant star configurations occurred.
Paul Denys contributed to the GNSS measured earthquake deformation of the multi-discipline response of the complex multi-fault rupture during the 2016 Mw 7.8 Kaikōura earthquake (bit.ly/Hamling2017). This also gave rise to quantifying the corresponding (co-seismic) subsidence and sub sequent (post-seismic) uplift of the Kapiti–Wellington coastline and its implication for coastal property (bit. ly/Bell2019a, bit.ly/Denys2019).
David Goodwin has developed an inexpensive survey method using portable equipment to rapidly and single-handedly survey topographical features where the relative positions of objects and the azimuths between the objects are important (bit.ly/ Goodwin2018). An archaeoastronomy example tests for possible signif icance in the placing of standing stones at the Taputapuātea and Hauviri marae, on Ra’iātea, French Polynesia. Multiple GPS observations were observed at the ends and along
A longer-term student project has quantified the precision and accuracy of NZGD2000 (bit.ly/Deny sPearson2022). Since 2014, 300-level students have been processing GNSS data from PositioNZ sites throughout the country. This shows the changing levels of site reliability, especially after the Kaikōura 2016 earthquake and the ongoing effect of post-seismic deformation in central New Zealand.
the early stages of development.
stratosphere between 15–24km above Antarctica, which weren’t present before the eruption.
We’ve been in touch with all the New Zealand survey firms to understand preferences for transitioning to the newSomeapplication.firmswant to get involved early and test the new application, while others prefer to wait until the new application is more mature, and some have told us they’ll transition when they Regardlessmust.ofwhen you transition, we’ll work with you to ensure the transition is as easy as possible, and that you’re well supported.
“Stratospheric aerosols can circulate the globe for months after a volcanic eruption, scattering and bending light as the sun dips or rises below the horizon, creating a glow in the sky with hues of pink, blue, purple, and violet. These volcanic twilights are known as “afterglows”, with the colour and intensity dependent on the amount of haze and cloudiness along the path of light reaching the stratosphere,” said Ms
Phase 3: Decommissioning Legacy Landonline capture
Transition at your pace
users will have access to compre hensive support material – it’ll be just one click away.
If you’d like to get early access to our new application, please email us at engagement@linz.govt.nz and we’ll be in touch to get you onboard. •
When all the capture functionality has been fully migrated to the new application, it’ll be decommissioned in Legacy Landonline. We currently expect this to happen in late 2023 at the earliest.
Phase 2: Making the new application available to all surveyors
(continued from page 37)
(continued from page 45)
attach supporting documents. However, if any issues were encountered in the new application, users can switch to Legacy Landonline to continue – avoiding their work being impacted.
“These photographs capture the awe it inspires, and how connected our planet is. Antarctica is some 5000km from New Zealand, some 7000km from Tonga, but we share our skies.
well as sea salt are also likely to be in the mix.
“What happens in Antarctica affects us at home, and the other way around too. Much of the science that we support aims to understand those dynamics in the atmosphere, oceans, and ecosystems, and to help better understand the connectivity between Antarctica, New Zealand, and the wider world.” •
48 SURVEYING+SPATIAL • Issue 109 September 2022
We’ll continue to add capture func tionality to the new application, make improvements, and resolve issues to ensure the new system is robust and fit-for-purpose for survey capture.
“Nature never fails to put on a show in Antarctica, and it can be beautiful or destructive”, says Antarctica New Zealand’s Chief Science Advisor Jordy Hendrikx.
TheFedaeff.aerosols are mostly sulphate particles, but as this was an undersea eruption, water vapour droplets as
As the diagram below shows, pilot users can undertake survey capture in the new application, including: import survey pre-validate edit marks/vectors/parcels/lines prepare schedule/memorandum survey report TA certifications
The pilot started in August 2021 to ensure: those who wanted to get involved early could do so, enabling them to influence the direction of the application the application was tested using real world scenarios to flush out issues firms could increase their knowl edge of the new application, making it easier to migrate the rest of their users later.
This phase gives customers the opportunity to start using New Landonline – Survey, with Legacy Landonline available as a fallback option if they need to do something they aren’t yet familiar with in the newAdditionalapplication.functionality available in Phase 2 includes: all capture functionality
In the meantime, Legacy Landon line will continue to be used for plan generation, sign/submitting, and approving surveys.
critical bugs and performance issues will have been resolved
When all the functionality is fully transitioned, Legacy Landonline will be decommissioned. It’s at this point that we’ll start adding some of the more future-thinking functionality that surveyors have asked for.
Get involved
New Zealand’s AUTHORISED TOPCON DEALER Call 0800 TOPCON Introducing a constellation of technology so remarkable, the first thing they’ll change are your expectations.


