Urban Informality



Urban Ecological Planning 1st semester #2
AAR4525 Urban Informality
Faculty of Architecture and Design
Department of Architecture and Planning Norwegian University of Science and Technology 2020-2021
Beketa Abdulwehab, Elham Abdollahzadeh, Puspa Tiwari, Suzie Shrestha

This report is the result of a semester’s work conducted by students of a 2-year International Master of Sci ence Program in Urban Ecological Planning (UEP) at the Faculty of Architecture and Design at the Norwegian University of Science and Technology (NTNU) in Trondheim, Norway.
While the traditions of UEP fieldworks date back to the 1980s, this year’s project work is much different than everything we have done before. Most of the previous one-semester UEP fieldworks were performed together by the entire class in one or two cities simultaneously in Nepal, India, Uganda and/or Norway and with a maximum of three case neighbourhoods in each city.
The sudden outbreak of the COVID-19 pandemic in early 2020 made international mobility close to impos sible and ethnographic fieldwork very difficult. We have spent a lot of time discussing adjustments and changes to replicate teaching this semester in such a way that the students get the best learning experi ence possible and resemble what their forerunners had experienced in previous fieldworks.
Most of the 18 students who finished this challenging semester had to stay in their hometowns located in Bangladesh, China, Ethiopia, Ghana, India, Iran, Nepal and Norway. They were divided into four groups of four or five, where every student was from a different country. Each of them chose their own local case study area close to where they live. Examples of the chosen spaces are road stretches, intersections, parks, public squares and markets. All the communication between students and their supervisors took place digitally.
While it is unfortunate that the students could not travel together, their diverse backgrounds and all the corona-related adjustments allowed us to expand the number of case cities from one or two (as in previous fieldworks) to a total of 13 cities on three continents!
In their project work, students practiced what we call the “Urban Ecological Planning” approach, which fo cuses on integrated area-based (as opposed to sectorial) situational analysis and proposal making using par ticipatory and strategic planning methods. All students performed regular site visits and engaged with local
communities and stakeholders, as much as the COVID-19 protocols allowed. Social distancing and other locally-imposed restrictions forced many of the students to look for and test new ways of collecting field data, for example using mobile applications and social networks. This has been a great learning experience for both the students and teachers.
Through a combination of fieldwork and remote methods, students gained an in-depth understanding of the local contexts, which allowed them to identify opportunities and challenges in their corresponding areas. This kind of in-depth understanding would be impossible to achieve by applying more traditional technocratic and purely quantitative planning methods. In some cases, students rediscovered places they knew very well from a new perspective, and realized how complex urban development can be. Others made strategic partnerships, which will hopefully lead to implementing some of the ideas they developed.
For us in the teaching team it was the first experience of supervising multiple fieldworks without physical interaction with the students. While it was difficult at the beginning, we found good ways to work together and exchange knowledge. This practice of working closely, but from a distance, seems like a very relevant and important ability in the post-COVID19 future.
Each of the four student groups was responsible for developing their own report, with four or five case study chapters (one per student). This report sums up the work of the group working in Negele Borana (Ethiopia), Sari (Iran), Trondheim (Norway), and Kathmandu (Nepal). We hope you enjoy reading this docu ment as much as we enjoyed supervising students in their work!
Marcin Sliwa, Cinthia Stecchini, Riny Sharma and Rolee Aranya
Fieldwork Supervisors, NTNU, Department of Architecture and Planning


The Digital Autumn semester of 2020 would not have been possible without the diligent preparation of NTNU, the Norwegian university of science and technology. We would like to thank all NTNU staff and particularly the department of Urban Ecological Planning for such a great job in the realization of this semester course in the new normal situation. Coming down to the urban informality project course, first and foremost, our deep est gratitude goes to our supervisor Riny Sharma for the continued guidance and assistance she gave us during fieldwork. She also tried hard to motivate and build a team spirit within the group so that we feel togetherness though we are at different locations and time zones.
Secondly, many thanks to all the teaching staff of UEP for their effort in serious lecture and valuable comments during the presentation and all projects mentors Marcin Sliwa, Cinthia Stecchini, and Rolee Aranya, for their extra support throughout the project.
We are indebted to the municipality and stakeholders of the four action areas for their cooperation in the fieldwork from transect walk up to final intervention stages and willingness to give information we need. Above all the trust they had in us that otherwise would be impossible to reach on this final proposal report. Lastly, we are very proud to be NTNU international masters students of the year 2020 who conducted fieldwork during a pandemic for the first time in the history of NTNU university. This golden chance would not have been possible without the help of Almighty God then our family who helped us for this success.
BC: Before Christ
BTA:Bruttoareal (Gross Area)
HCB:Hollow Concrete Block

IRNA: Iran News Agency
PLA: Participatory Learning and Action.
SiT: Student Association in Trondheim
UEP: Urban Ecological Planning
UNESCO:United Nations Educational, Scientific and Cultural Organization
WC: Water Closet
This paper is a filed project report done in a very unique situation of the covid-19 pandemic which probably is the first unique moment in the his tory of NTNU academics work. An intensive fieldwork has been done in dividually under the new normal situation of the world to study the urban informality that exists in our respective area. Hence, In this report, there are four field work reports which are from Ethiopia, Iran, Nepal, and Norway on the Derg-tera public market, a neighborhood central park in Sari, Patan Durbar square and Moholt studentby village public square respectively that have been done through serious digital lectures and supervisions for about 9 consecutive weeks. Table 1 below shows a comparative fieldwork cities of the case studies which helps to have a sense of how these cities are in one glance.
The main broad structure of the case studies in this report are the context of the case study site , methods used throughout the fieldwork period which is also discussed under methodology approach below, situational analysis of the study area , problem statement and strategic intervention. Finally, each case study ends with reflections written by another research er from a group member.
Negele, Ethiopia
Sari, Iran
founded in 1917
It is inhabited by more than 57,000 people
Lalitpur, Nepal
Trondheim, Norway
established in 1919 inhabited by more than 300,000 residents oldest city of Nepal inhbited by around 470,000 people served as a capital of Norway during Viking King
Inhabited by population of about 200,000
Location located at about 590 km south of the capital Addis Ababa located in the north of Iran
located in the cen tral Nepal
lying on the south shore of Trondheim fjord at the mouth of River Nidelva
Role of the city serves as a capital town of the east Guji zone & Center for trade serves as a national tourist attraction serves as a tourist attraction serves as a leading center for innovation and technologies

The study site is the Public space located in the north of Moholt Student village, Trondheim , Norway
The study area is a municipal ity owned local market within the Derg-Tera Market in Negele Borana, Ethiopia
Beketa Abdulwehab from Ethiopia with the background in Architecture.

 Puspa Tiwari from Nepal with the background in Architecture
The study area is the Patan Durbar Square, an ancient royal palace that lies in the heart of Lalitpur district in Nepal.


The study area covers the public green space of a resi dential neighborhood in Sari, located in the north of Iran.
 Elham Abdollahzadeh from Iran with the background in Urban Design.
Suzie Shrestha from Nepal with the background in Architecture.
Demographics
Collecting journals, articles, newspaper,
Listing down users, institutions, organizations in volved with the study area


Mapping Power-Interest Diagram
Analysing the Physical, Social, Environmental attributes of the area
observations, interviews, online surveys and desk research

Proposing
final proposal
Spatial and non-spatial intervention
Presenting it to the locals, institutional, organization and government bodies and taking their feedbacks
Listing out all the problems and finding the major problem or connecting the problems
Through observations, interviews, online surveys and Situational Analysis



All the four case studies in this report are about informality and the effect of the pandemic in different contexts such as Market, Neighbor hood, and public squares. The case study sites are selected near to the researcher’s residence where the informality is at play due to the out break of Pandemic. Although the sites are not new for researchers, it is evident that the small site selected which we always pass through or by turned out a site full of stories to tell us about informality and effects of the pandemic. Hence, the report starts with location and a brief history of the site which then The situation of the site has been studied through different participatory learning action methods. This study enables the researchers to understand more about aspects of the site like Physical, social, environmental and economic. The problem statement comes next in this report which elaborates more about the need assessment made and how the need is prioritized. It is a bridge which connects the context of the site with the strategic intervention. Then based on the prioritized problem, strategic intervention is developed through the aid of some PLA methods and strategies where the researcher proposes spatial and non-spatial interventions. Each case study ends with a Reflection from a fellow researcher within the group, but the report wrapped up by a group Reflection, Finally, which shows the insight gained as a group regarding the informality, and effect of pandemic and lesson learning throughout this semester’s fieldwork.
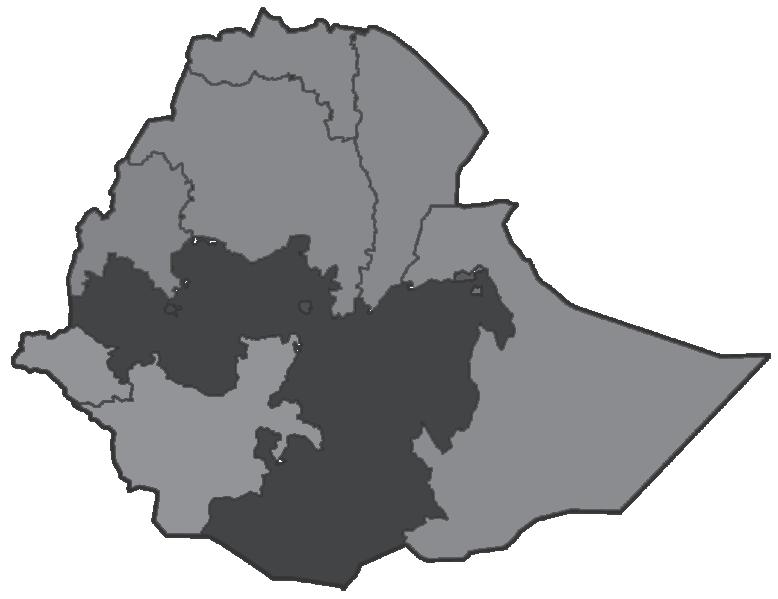
Ethiopia in figure 2, with capital Addis Abeba is a landlocked country on the horn of Africa which shares borders with Eritrea to the north, Djibouti to the northeast, Somalia to the east, Kenya to the south, South Sudan to the west and Sudan to the northwest.
It is the largest and most populous landlocked country in the horn of Africa. Ethiopia is an ethnically diverse nation with the basis of linguistic differences. With about 100 ethnolinguistic groups, the four largest of which are the Oromo, Amhara, Somali and Tigrayans. It is also a home for some of the oldest skeletal evidence for anatomically modern humans and is one of the only two nations that preserved their sovereignty from long-term colonization during the late–19th-century Scramble for Africa. Ethiopia has been a home for the African Union and the United Nations Economic Commission for Africa headquarters offices in Addis Ababa since 2002. (Assefa, 2019)
From the five climatic zones that Ethiopia has, defined by altitude and temperature, Negele is characterized by a hot semi-arid climate, falls under the warm to a hot climate.
The zone is characteristic by mean annual temperatures from 18 °C to 27 °C. (Zewdie, 2011, p 32)
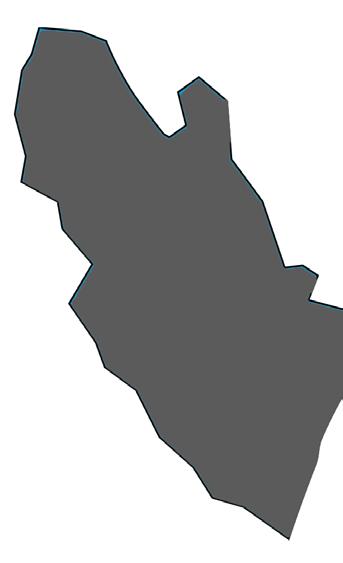
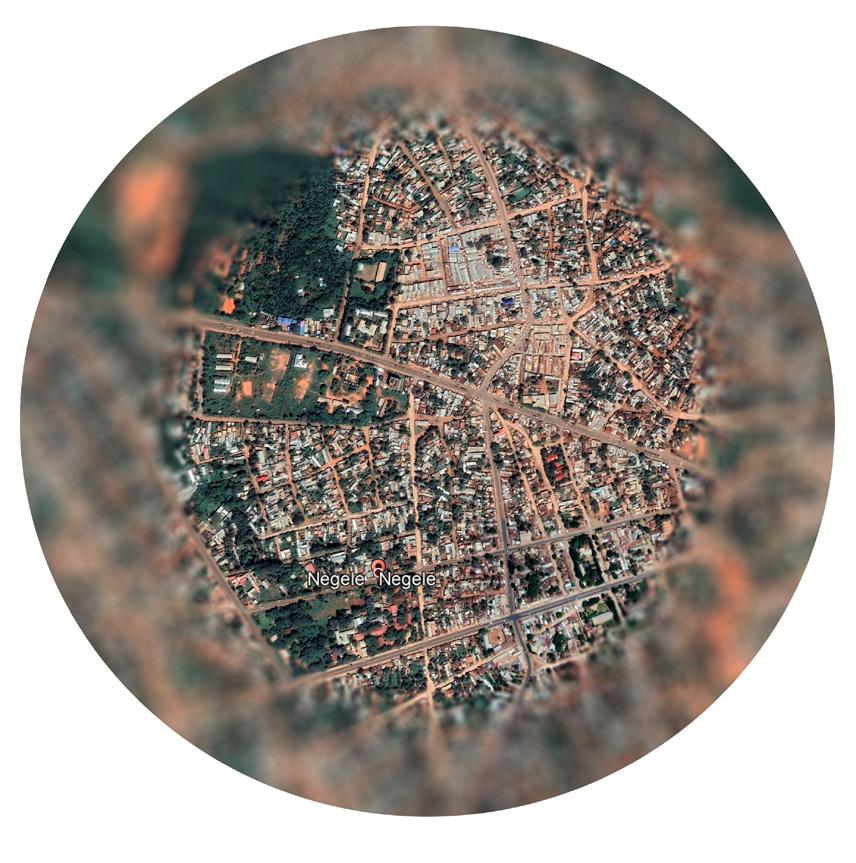
Negele Borana which is illustrated in figure 4 is a town found at about 590 km from Capi tal Addis Abeba in southern Ethiopia. It is the capital town of the eastern Guji Zone of the Oromia Region.
According to official figures from the Ethi opian Central Statistics Agency, the Nege le town urban population is projected to 49,385, of whom 25,497 were men and 23,888 were women in 2014. The projection is more than a half from 35,264 in 2007 to 56,897 in 2017 (Abebe, 2013)
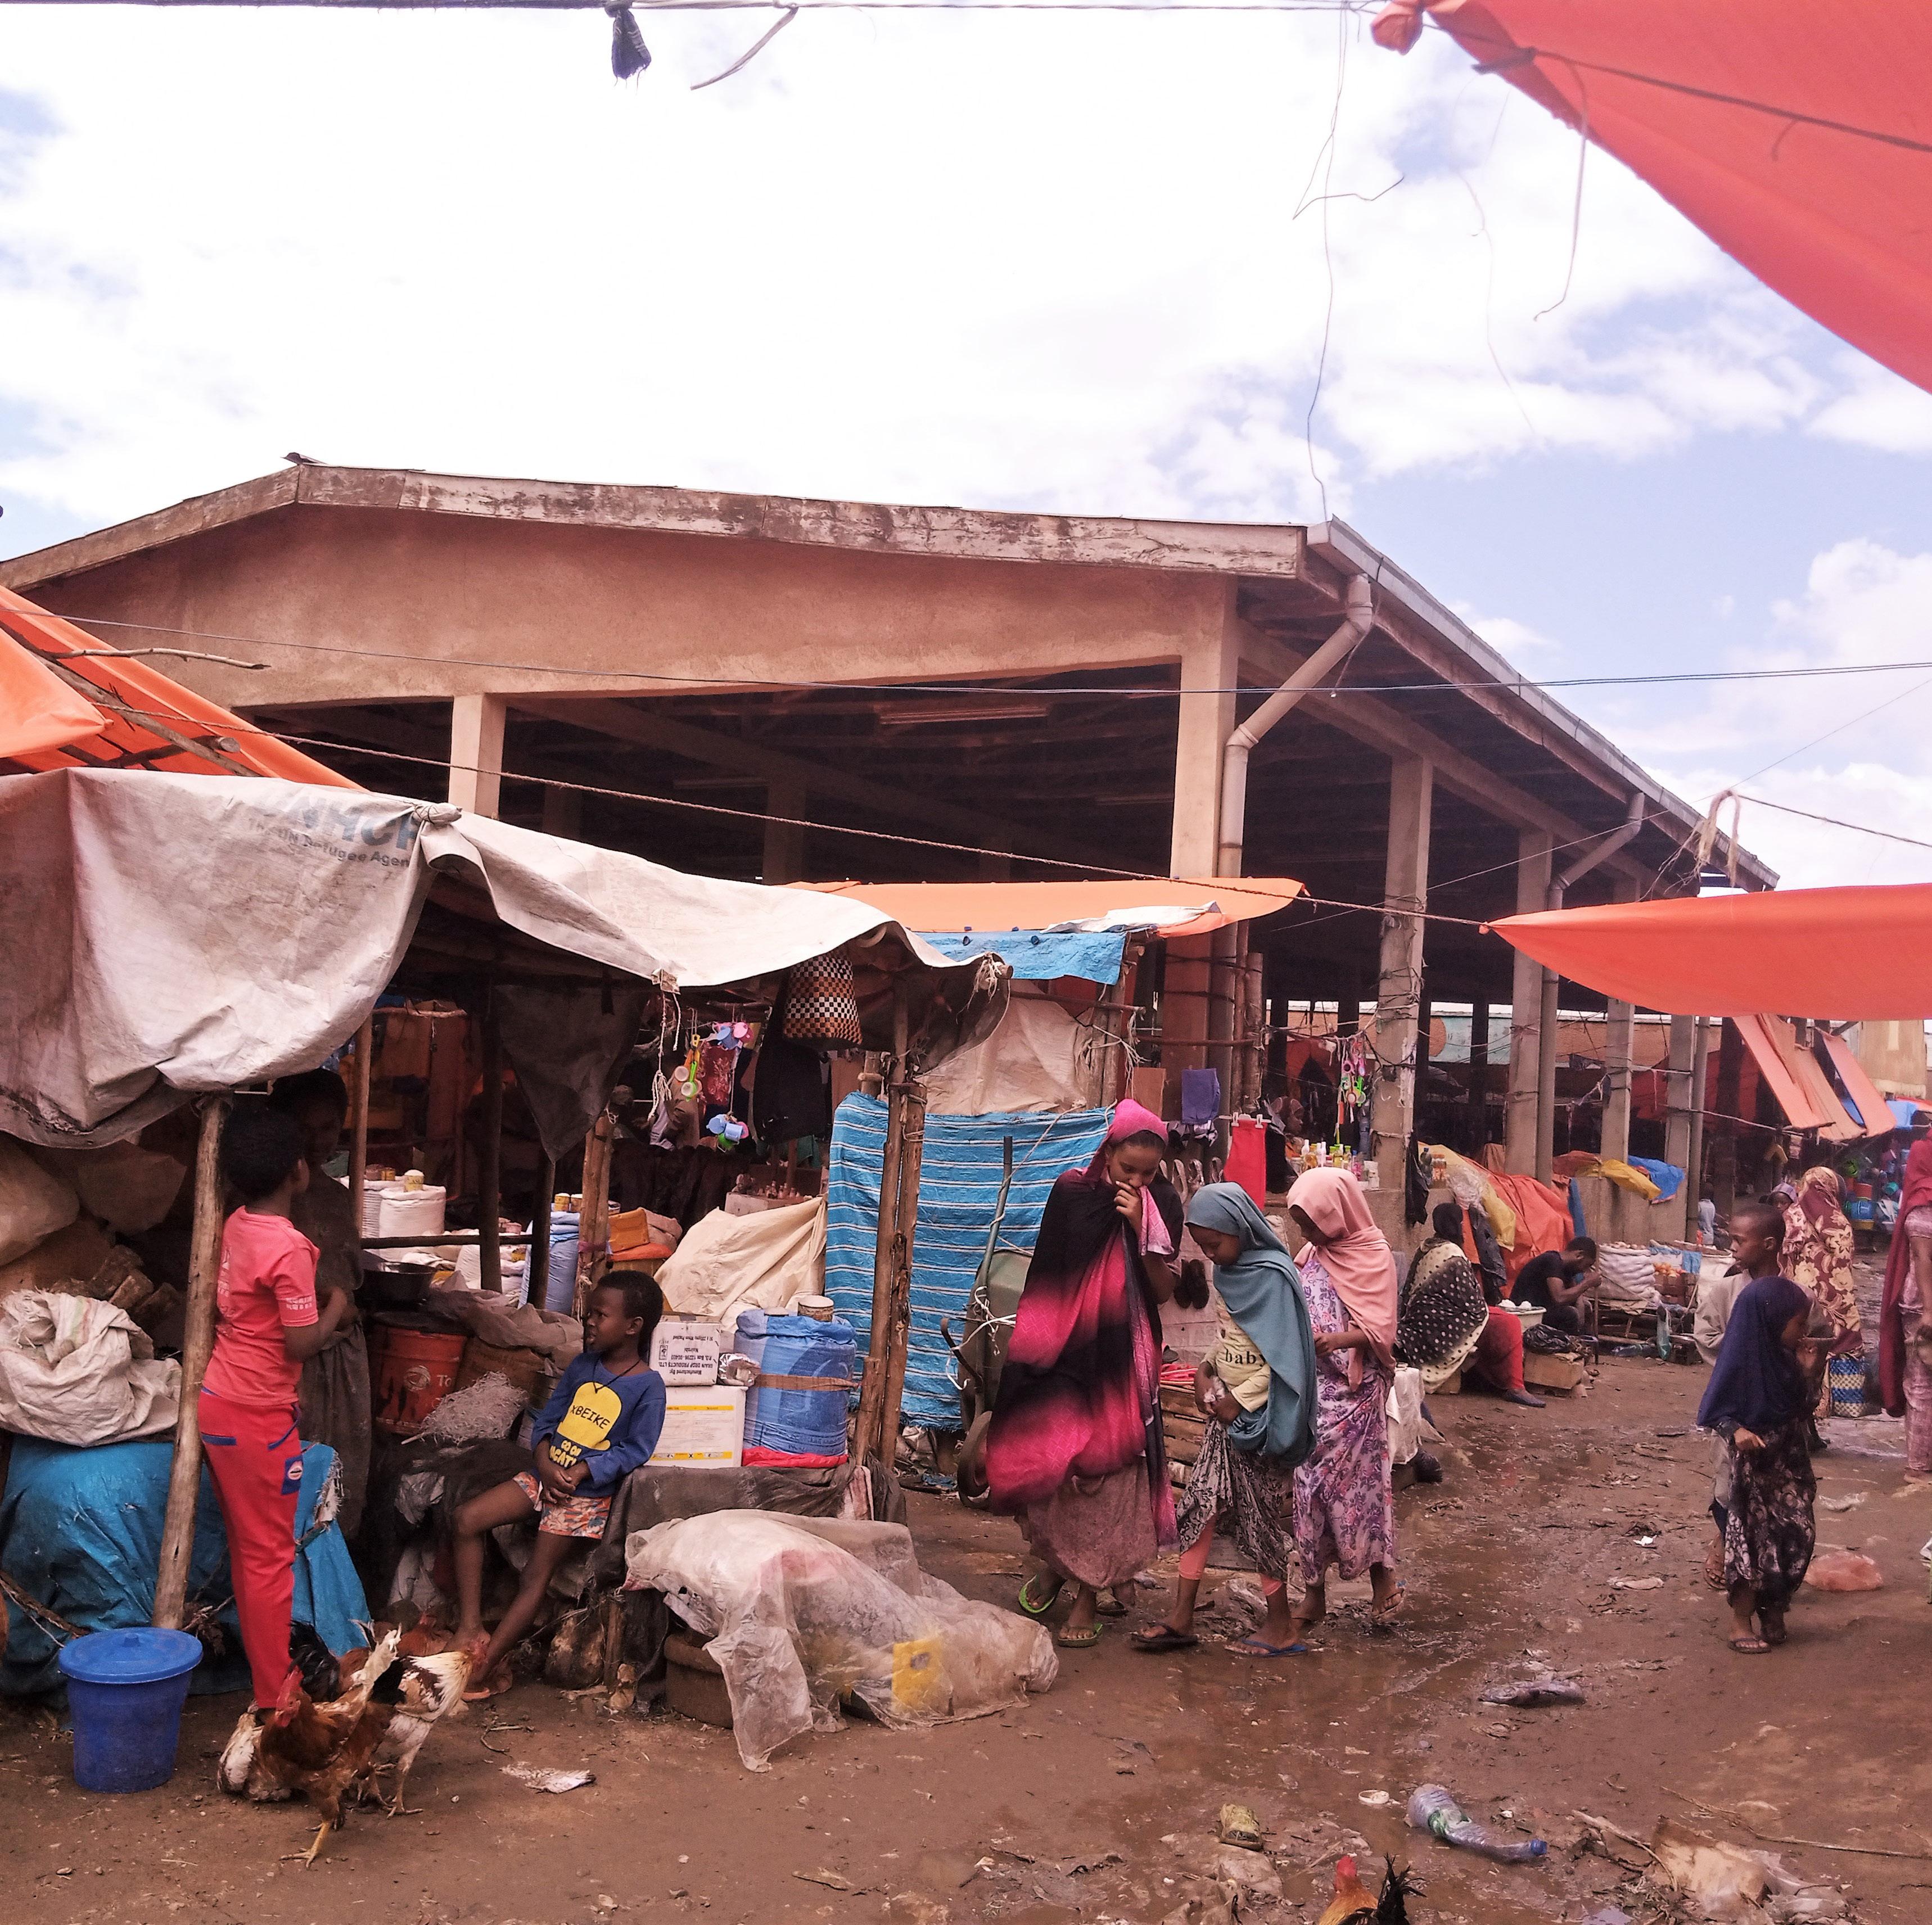
The site figure 5 is said to have got the name ‘Derg-tera’ because the Derg military used to sell weapons and other materials in this site after the fall of the Derg-regime which ruled Ethiopia from 1974 to 1987. It is the biggest market in the town and the zone where people from all neighbourhoods and outside town come to buy various products. It plays a significant role in providing services
for the residents of the town and the surrounding pastoralist community. Along with legal commodi ty exchange, other various commodities smuggled from Somalia and Kenya is also evident. The overall market exists on about 18,000 square meter area at the heart of the town. This big market consists of formal business prem ises such-as shops which are divided into stalls and lockups, semi-closed market hall, and informal street vendors.
Zone
(Source: Google Earth)
(Source: Google Earth, edited by author)
The study focuses on assessing the relationship be tween the low-income business community and their space to find out various aspects of informality and needs of a marginalized low-income business commu nity.
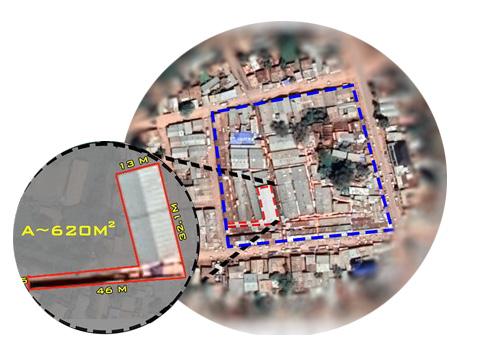
The spatial scope focuses on about 620 m2 area as shown on figure 3 which consists of a semi-closed mar ket hall which is found to the western end of this market and its southern immediate adjacent street that is oc cupied by vendors. The rationale behind the selected site
The site is selected first because it is a congested place where several low-income communities do their busi ness in a market hall which makes the site a potential space to study the implication it might have regarding the pandemic. Secondly, the disadvantaged or margin alized vendors are also seen on adjacent streets do ing their business under a very deteriorating condition hence, it is a nice spot to study formal-informality con tinuum. The result could also be transferable since there are many scattered marginalized low-income commu nities found in different locations within the big market and its vicinity. Above all, the high interest of the mu nicipality for this project as the site is owned by them.
Negele town was founded in 1917 due to the establishment of the military garrison centre in the south-east parts of the town. The oth er main historical events are shown in figure 6 (Ministry of Urban Development and Construction, n.d)
(Image Source: Google earth, year 2012)
Establishment of the Military garri son center. Negele Town was founded. Establishment of market
According to many informants, the Derg -Tera market merchants have experienced three times the loss of their merchandise due to fire. How ever, the third fire hazard happened about 10 years ago. The cause of the fire is still unknown and remains a mystery until today but some
Italian invasion and subsequent occupa tion of the country Foundation of Nur Masjid
1917 1925 1937
1936-1941
click
Establishment of Kidanemihret church
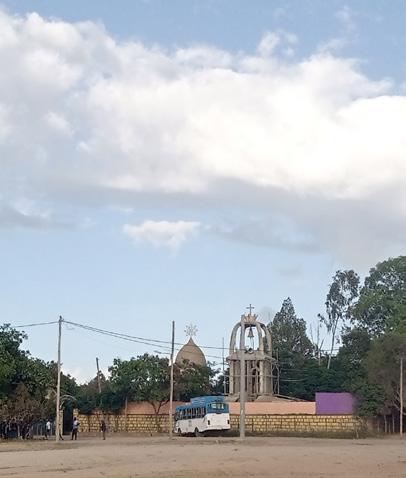
Establishments of the Negele Medical hospital
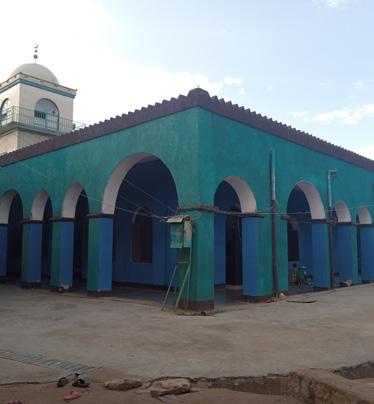
of my study area street vendors suspect that some government agents had intentionally set fire to the market to evacuate them and give the property to some other rich people. This incident played its role in changing the overall market structure from small hut and tarp and wooden structure to HCB wall lockups and semi-closed
market hall. On the other hand, it has facilitated segregation of rich who can build their shops and poor who cannot afford and end up in a municipality-owned market hall. Some of them are still doing their business on the street because the hall could only accommodate about 140 vendors.
Moving of Borana Awraja from Mega to Negele town Got municipal status
The town got first masterplan
1965 1958 Since 2003
Settling of retired people
Negele remained as the capital town of the newly established Guji zone
Residential Commercial Mixed use Bus Station Stadium Warehouse
Figure 7: Land use Map (source: Negele land administration office, edited by author)
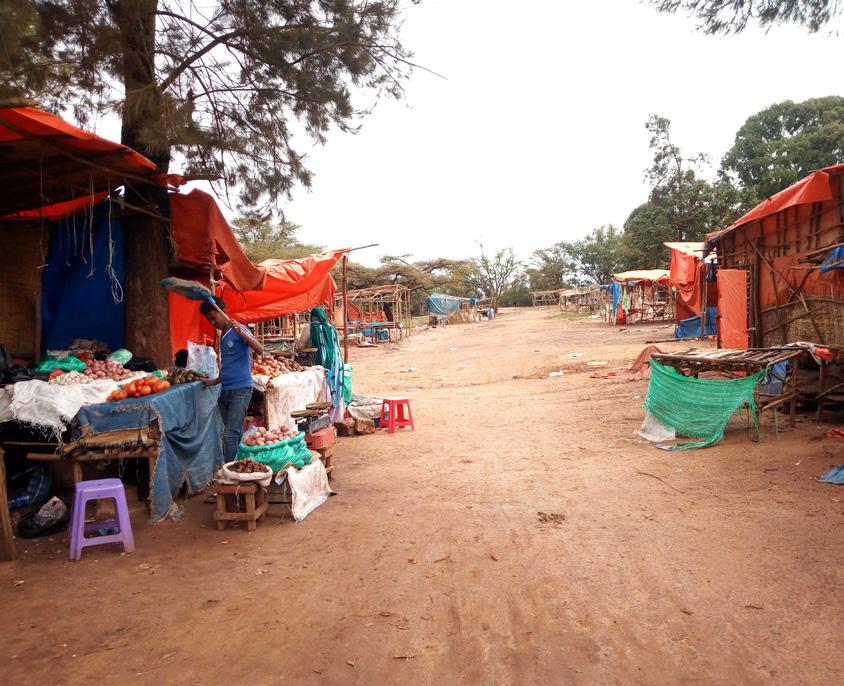
Figure 8: temporarily relocated market due to COVID-19, author’s click
The figure 7 land use map is adopted from the newly revised Negele town re vised structural plan. The football field illustrated above on the upper left side with a dashed circle was the temporary relocation site for street vendors from the Derg-tera market as a measurement to cope with COVID-19 situation. The market was there at the beginning of
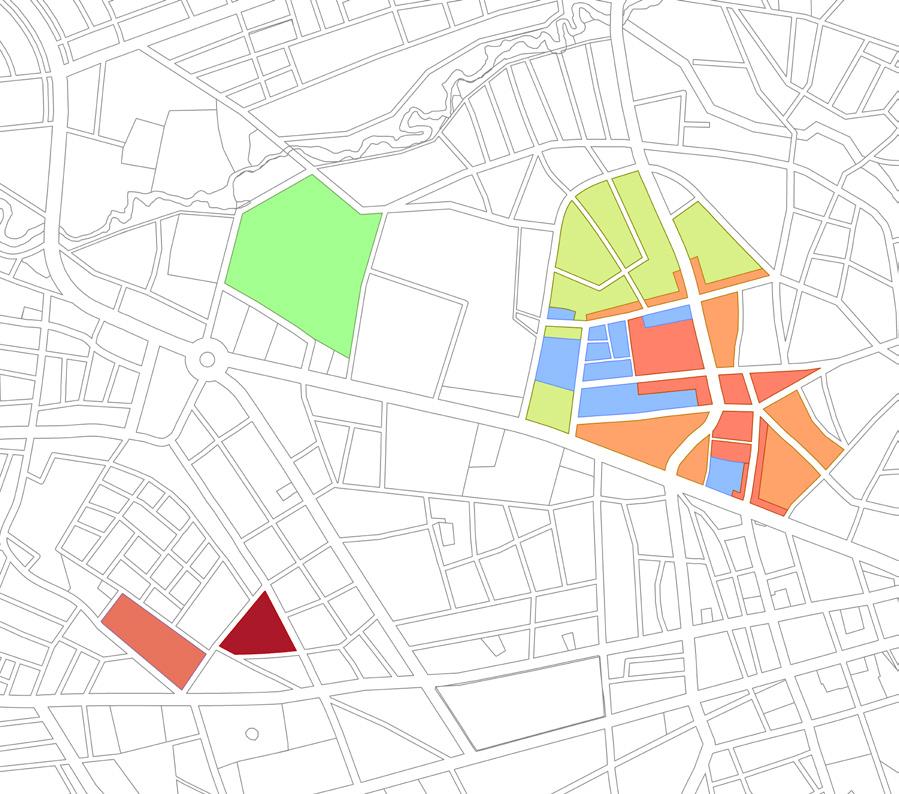
the pandemic situation for about two months as shown in figure 8 but now almost all have returned to the cen tral Derg-tera market. The bottom left commercial area next to the bus sta tion is a permanent commercial building built by the municipality to decentralize the market but it does not start function yet.
“The cities have the capability of providing something for everybody, only because, and only when, they are created by everybody “(Jacob, 1961, p. 238)
In a selected site where different types of vendors and tailors exist, it is evident that they could behave differently within the site based on their activities and nature of their work. To study the different and complex behaviour and to gain an in-depth understanding of this com munity’s situation, participatory methods should be exercised.
Here rough observation to see what kind of business activities there are and their relation to ad jacent activities have been conducted with a young male tailor for about 10 minutes. The action area and its immediate vicinity have also been wandered.
Based on Transect walk findings, This obser vation is made to intentionally find out answers to course-related questions like What kind of informality exists in the selected market? How spatial and infrastructure efficiency looks in relation to social mobility and how do people behave in this space? And data is recorded in a form of writing, sketches and pictures on dif ferent times of a day (morning and afternoon) and days of a week (market-day and other days).
“Any person, group, or organization that can place a claim on the organization’s at tention, resources or output, or is affected by that output” (Bryson, 1995 as cited in Bryson 2004). Based on this definition, stakeholders are identified and stake holder mapping has been developed and changed over the four-quadrant interest and powerful influence of the stakehold er have been analyzed overtime during the fieldwork as indicated in the follow ing figure 9.
“And when poor people are aware that the researcher has travelled from afar specifically to speak with them, not just those of higher so cial status in their communities, it can add to their sense of self-es teem” (Scheyvens and Leslie, 2000 as cited in Scheyvens et al, 2003). Consequently, the same is true that the low-income women vendors in the action area were content with the attention they got from the researcher because they were de prived of the right of being heard before. Therefore, a One to one un structured interview has been made to know what is not visible and to uncover the different perception of the users regarding the site.

Group discussion has been made with a group of the same type of vendors separately and with a group of different types of ven dors. In this case, a discussion with a group of poultry and egg vendors, tailors and cereal ven dors have created a significant environment where each of them collectively expressed their common issues and the relation ships they have with the site. It gives new insight that cannot be got in an interview because the interview result tends to be personal perception and individ ual issues while in the group it is easier to get the common issue which will be convenient to ad dress them in the intervention
It is one of the PLA methods in the need assessment stage where stakeholders are given a chance to choose the most relevant problem. Thus, in the action area’s fieldwork need assessment, a problem which is greater or critical has been selected from the problem raised by stakeholders at previous stages. This method helped in narrowing down to more overlapped prob lems to prioritize the solutions in short term and long term plans based on its urgency. Additionally, the sequence of what should be first and so on are sorted out to mitigate the possible challenges to be faced and accomplish the proposal within the intended time without compromising the quality.
“Co-design quite literally means ‘col laborative design’.” (Burkett, 2012). Here the stakeholders are actively engaged in the design process and challenge to have been collectively solved. It is the stage where mutual understanding consolidated further on the overall intervention and its implementation.
In the fieldwork of Co-design with stakeholders, it has been separately consulted with municipality heads and vendors at their convenient time on the possible solutions and what should be done. The co-de sign was made with the municipality head at his office which took about 1 hour. The same workshop has been made with stakeholders at the site spending about 3 hours in the late afternoon when they are more or less free.
For the realization of this project, a monitoring and evaluating body or organization who contributes technical support, manage the project processes are identified. Hence municipality engineers and construction and supervision offices are given this role while vendors’ representatives regularly follow up the progress.
As this fieldwork project is made in a world’s unique pan demic situation, there were limitations to gather a large group of people for discussion. Some people were asking for a discussion of all vendors at one place on the solution during co-design which was not possible to do under na tional corona regulations. I was also limited in using online methods of gathering information because the people are not developed in utilizing digital technology for this pur pose. The other challenges were the scepticism of street vendors during the interview when approached at the be ginning. Hence, building trust was a long but rewarding pro cess in terms of participation by people Thus the outcome discovered in this paper is limited to what I managed to complete within this short time through the best of my ability and knowledge. However, the valuable immense knowledge I got regarding the participatory methods in research and digital participatory approach during pandemic which helps me to apply in the next research.
There are two types of building based on age. Majority of the buildings in the area are old buildings while the others are newly constructed within recent years. most buildings in and around the action area are single story as seen in figure 10 although a few of build ing with two to three story is being developed at the vicinity of the study site. The town does not have building height regulations yet.

Figure 10: Existing building topology of the action area and its surrounding , author’s click

As seen in figure 12, the action area is surround ed by a warehouse, mill, and other commer cial activities. Since the market is found at the centre of the city and many potentials could help low-income business communities in the action area to boost their income through cooperation with the surrounding related ac tivities mentioned above. For instance, tailors work closely with adjacent cloth shops which

are found north and west part of the action area while cereal vendors are more dependent on the cereal warehouse which is found in the west part because the vendors are benefited from their daily profit of the cereal taken as loan from them. This shows how the area is suitable for a start-up business for low-income communities and get strong financially over time.
Residential Zone
Commercial Zone Warehouse
Mixed use zone
Action Area
Figure 12: action area and its vicinity land use Map (source: Negele land administration office, edited by author)
Figure 13: Existing road access around the site (Source: Google Earth, edited by author)
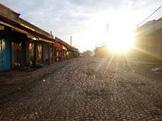
There are three types of the road approaching the site as shown in figure 13. The dark grey One is asphalt road having 25m width including both sides pedestrian walkway. But as we approach the site from the south, people mostly walk on asphalt with vehicles because the roadside pe destrians are overtaken by street vendors. The second type of road is cobblestone road, which is hatched with yellowish colour in figure 13, hav ing 15 to 10 m widths which are accessed by people, vehicles and carts. The cobbled stone

Figure 14: Existing cobblestone road above and asphalt road below, author’s click
road adjacent to the market is the busiest and crowded one due to the presence of rapid movement and street vendors overtaking the space. The third one and relatively free is gravel (natural) road. It has less traffic due to its occur rence in warehouse areas which is less active. This road has about 10 m in width. It is dusty in summer and muddy in winter.

As it has been demonstrated in figure 15, the circulation within the Derg-tera market is gravel lane having a width ranging from 2 m-5m.

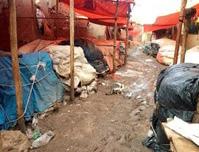

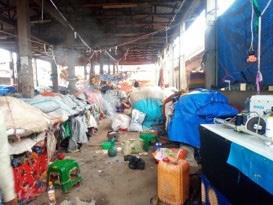
The semi-closed market hall is made from the reinforced concrete structure on an area of about 338 square meters. It has a length of 26 m by 13 m floor area. The hall is occupied by 140 lower-income vendors and tailors who are relatively arranged evenly leaving the two major aisles for circulation and two blurry secondary aisles on each long side of the major aisle. This secondary aisle is unclear because some ven dors put their stuff, which narrows the aisle and hinders people to move through.

As the area is a public market, a variety of ethnic, religious and gender is seen within the site. The age variety is there from young tailors in their fifteenth up to poultry and egg vendors in their eightieth. The site is wide ly accepted as a low-income zone where low-income customers are the major source of revenue for the site.

Customer movement starts at around 9 AM and goes up to 6 pm. Although movement density varies throughout a day and days of a week, morning and the two market days (Tuesday and Saturday) are denser. Custom ers and vendors use the two 2 m wide major crossing aisle as entry to and circulation in the hall.
One of the two things which draw my atten tion from Tailors' side is that Jerry can serve as both sitting objects for their customer by putting on the adjacent aisle and container which narrows the circulation spaces while electric wires are irresponsibly tied without proper caution which is dangerous and could cause a fire.
When we come to the study area where there is people who could not afford to build their own shop and still cannot afford renting pri vate shops, we can see three broad category of vendors which might be caused from lack of accessibility (i,e. problem of being visited by customer due to their position), depriva tion of legal stalls and lacking attention. They are people who brought out their merchan dise to the adjacent street to seek the at tention of customers leaving their stalls in the market hall behind.
• People who are left on the street and denied attention from municipality,
• People who do their business in the hall
There is also a single business group who sells chicken and egg. Based on interviews made with them, they said they are seven in num bers of which 2 are old men and others are female.
Finding out the above activity category with
• Legal markeing Space
• Floods during rainy season
• Storage space
• Accessibility
• Insufficiency of space
From those who are adjacent to street
• Insufficiency of space
• Toilet
• Tap water
• Absence of open Land
• Budget
Figure 22: vendors who sell on southern adjescent street
Figure 23 : vendors who own stall in the hall but sell goods on eastern adjescent street
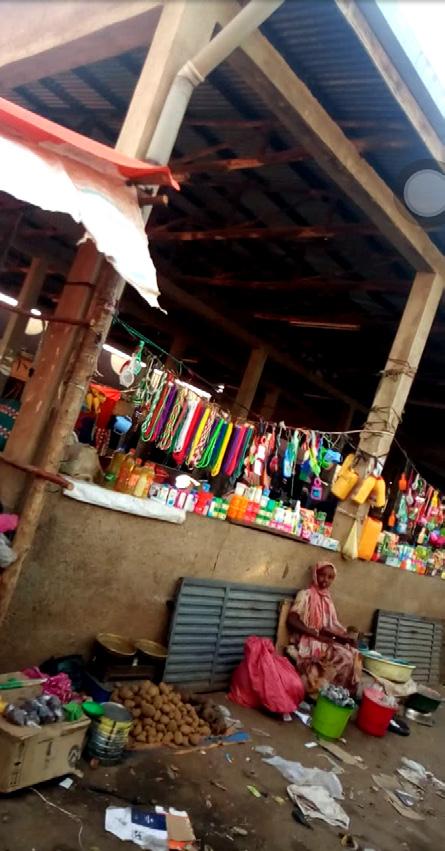
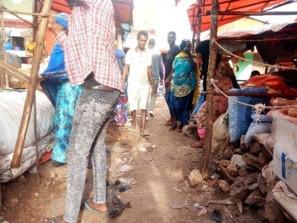
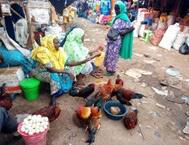
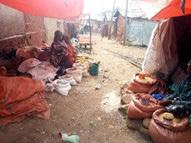
in a small area could help to assess deep into the needs of each type of merchants and to know the common problem which they all agree upon. It also has a significant role in managing the different needs and bringing them to the common platform where no one cannot be left behind.
Through group discussion and interviews made separately, the following problems have been raised. Then using prioritization methods the final problem statement has been identified. The hexagons show the list of problems from each stakeholders while the prioritized problems for each are bold ed. Figure 20, 21, 22, 23 and 24 show the existing condition of the vendors.
Legal Marketing space that is equally acces sible and can accommodate their merchandize within the study area.
In this stage, the main goal of the proposal will be outlined and strategies to meet the main goal will be designed which will help us to reach into the intended comprehensive and objective proposal.
The main goal of the proposal is to achieve a legal equitable marketing space which can address sanitation problems as well. The first move toward the proposal was to find a solu tion for the road. As already indicated on situational analysis that the Negele structural plan with this lane is flexible to be closed if needed but with discussion made with a surveyor, he said that “it is possible to close but we need to at least keep if we can’t widen it for circulation purpose.”
The street is wide at eastern part having about 610 cm while it gets narrow in the west part. Therefore I planned a 3m lane for circulation and the rest is allocated for vendors as shown in figure 28. This and other space allocation is based on the following Anthropometry shown in figure 26.
Figure 26: a standard dimensions of man (source: Neufert & Ernst, 2000)


As shown in figure 29 vertical increment is proposed since horizontal expansion is not possible due to the absence of open land. Thus Tailors are chosen to be moved to the upper floor due to the nature of their work which needs less visibility and that customers intentionally visit them to get service while in the other vendors customers buy things as they pass by. Hence, one young tailor said when asked what he feels about this idea “if all tailors are moved to the upper floor, it will not be a problem for us to be on the upper floor”. The poultry and chicken vendors will be slightly shifted to the first row of the gravel road next to the market hall from the south as indicated on figure 27 from the main entrance to the site street. They are provided 1.5 m2 each having a poultry cage and raised display counter and box. The household commodity vendors and cereal vendors are also placed next to poultry and chicken vendors in the west part on the side of the street they used to vend on as shown in figure 30 They all are given 2.25 m2 each with raised stall, which could be used as storage, and display shelf.


The vendors who used to be under the semiclosed market hall are rearranged and given about 2.25 m2 space which could alleviate the insufficiency of space problem as a result of free space due to vertical increment. A raised stall which could be used as storage has also been provided and display shelf and with the semi-physical demarcation of border amongst them as indicated in figure 31. Toilet has been denied by vendors for fear of bad odour but as indicated on the problem statement nearby shop owners and tailors need it. Therefore it is shown in figure 30 that 2 WC each for men and women are provided on the periphery of the action area on the lower slope which is good for west management.

This method has been used in the intervention stages where financial and human assets for the implementation of the project are discussed with the stakeholders. Each stakeholder agreed to contribute with what they can.
The municipality should draft a local regulation that space should be used as a transitional mar keting place where low-income vendors will use the space until they become financially strong. Then they will be relocated to other places. In this way, we can manage the future needs and make the market sustainable.
Derg-Tara Market is providing financial resources for lower income families and more specifically for women of this area. Therefore the problems they are dealing with can not be denied or ignored. The main issues have been investigated and discussed with vendors and tailors in detail. But it is important that the feasibility of the proposed interventions has been discussed with the municipality as well. different kinds of informality were identified and the new proposed construction not only tries to renovate the previous market and solves physical issues such as sanitation problems, but also answers the problems in a formal and legal manner. Other than the problems street vendors are dealing with, the problems they may cause for local residents are also discussed in this report in case study 2 and 4. The street market in Sari (Iran)
I believe this is not an end to this study and the plan to improve the Derg-Tera market can further continue and the municipality can consider it as a solution to other informal markets with the same problem.
The city of Sari with more than 300,000 residents is located in the north of Iran, surrounded by Cas pian Sea on the north, and Alborz mountains and Caspian forests on the south which makes the region a national tourist attraction as seen in figure 32.The diverse nature and Mediterranean climate has made the city a national tourist attraction. Sari is the capital city of northern province Mazandaran and it is governed by three main municipalities. All three mayors are appointed by the city council and city council members are elected by the citizens.
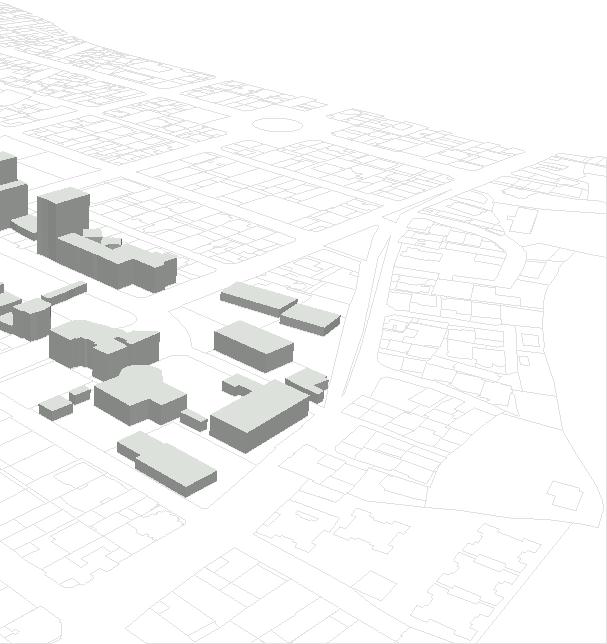
The fieldwork site is a public green space and its adjacent streets in the center of a residential neighborhood in east of Sari and encompasses an area of 20,000 square me ters. The neighborhood is bounded by “Ta jan” river on its east side and “Darab” boule vard on its south side. Municipality of district one is in charge of this neighborhood. The public green space has an area of 4563 square meters and was constructed in 2002 by the municipality.


This residential neighborhood has developed within recent years and its central public green space has the potential to attract more population, while a large brownfield in the neighborhood has de creased the livelihood of this area by causing people to feel unsafe. In addition, the variation in land uses and activities in the area makes it more interesting to study.

Figure 37: Land use map
The landuse map (Figure 37) was generated based on fieldwork observations. Other than residential and com mercial landuses, and infrastructure services, there are vacant lots in the area. The large empty lot is expected to be a shopping mall based on real estate agencies in the neighborhood.

Archaeologists have found evidence of human habitat in the area of Sari city that belongs to Mesolithic era (Ramezani, 2013). Although, the exact date of founding of the city is not clear. The first municipality of Sari was established in 1919. (Sari Master plan, 2015)
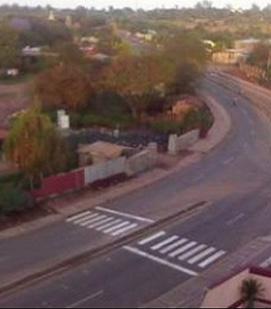
The Study area is located in a not well-reputed district of the city. The infamy is rooted in the history of that place which used to contain a prison (Figure 38) in the vicinity of the city. As the city expanded, the prison which was located inside the boundaries was razed to the ground about eight years ago (Figure 39).

Based on an interview with an old resident of the area, she does not care about labeling her neigh borhood as “Zendan” that literally means “Prison Neighborhood”. In fact, none of the residents use the new official name of the neighborhood. She believes after all new constructions in the sur rounding area housing price has increased and titling the district as prison does not evoke any de grading feelings due to the rise in property prices. Although, the identity of this area is intertwined with the history of the neighborhood.

At the first stage collecting data occurred through methods such as re viewing existing records and studies, observations, taking pictures and videos, sampling (due to the lack of time and current social restrictions), and reviewing diaries based on observing people’s be havior. The observations are accompa nied by pictures, and maps to mark ac tivities, gatherings, and sitting spots. The open greenspace was observed during midday, evening, and midnight, both on workdays and weekends. Both qualita tive and quantitative techniques were applied; as Scheyvens notes: there is no reason indicating that methods cannot be mixed, and one shouldn’t fall into the trap of being qualitative or quantitative (Scheyvens et al., 2003, p28).
During the next step face-to-face inter views helped to provide data that were impossible to gather by observation such as activities that occur within other


times of the year. Older dwellers could provide information about the history of the neighborhood and the problems they were dealing with within recent
years.
Also an online questionnaire was de signed to gather more detailed information. The questions were mainly polls, or needed short answers, so it was possi ble to draw out quantitative results from the data. A few questions were added and asked the attendees to describe the neighborhood and talk about the prob lems and history of this area. Unfortu nately only 12 people filled in the ques tionnaire which is not enough to make any logical conclusion based on it.
Participatory methods in its common form was im possible due to the Covid-19 situation. Although, online survey and interview could fill the gap of participation to a limited extent.

All the detected users,
and
are listed
the stakeholder
below:
Figure

In this chapter different aspects of the area are discussed.
Physical aspects of the fieldwork area including both natural and man-made are explored in this section.
The climate of the city is characterized by hot-summer Mediterranean climate, and wetcold winter. Summer months average tempera tures is 24.6 °C, and the average temperature of winter months is 7.7 °C. The region with the average of more than 87 rainy days receives a total amount of 700 mm rainfall annually (Sari master plan, 2015) .
Most buildings in the area are new-build apart ments, since this part of the city has developed within recent years.
Most apartments are three story or lower as seen in figure 42, although a few of new-build constructions ignored height restriction laws. The reason might be the increase in real estate prices.
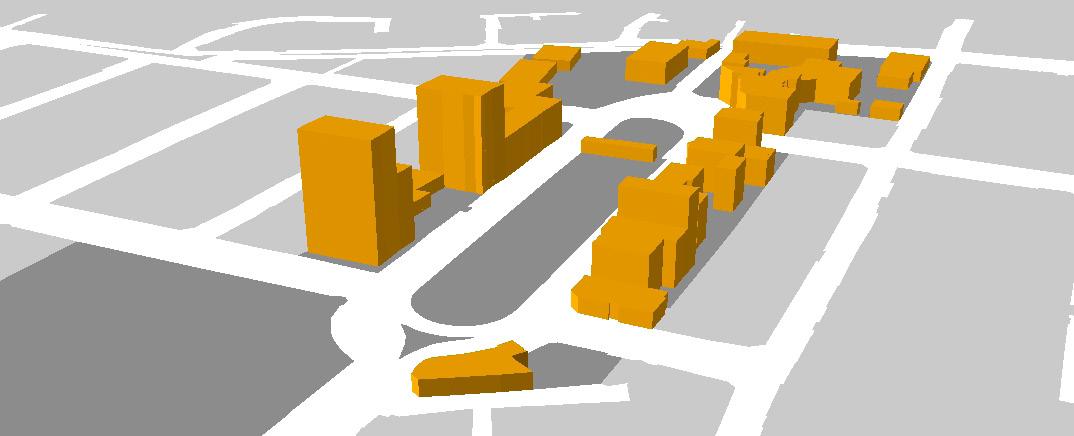
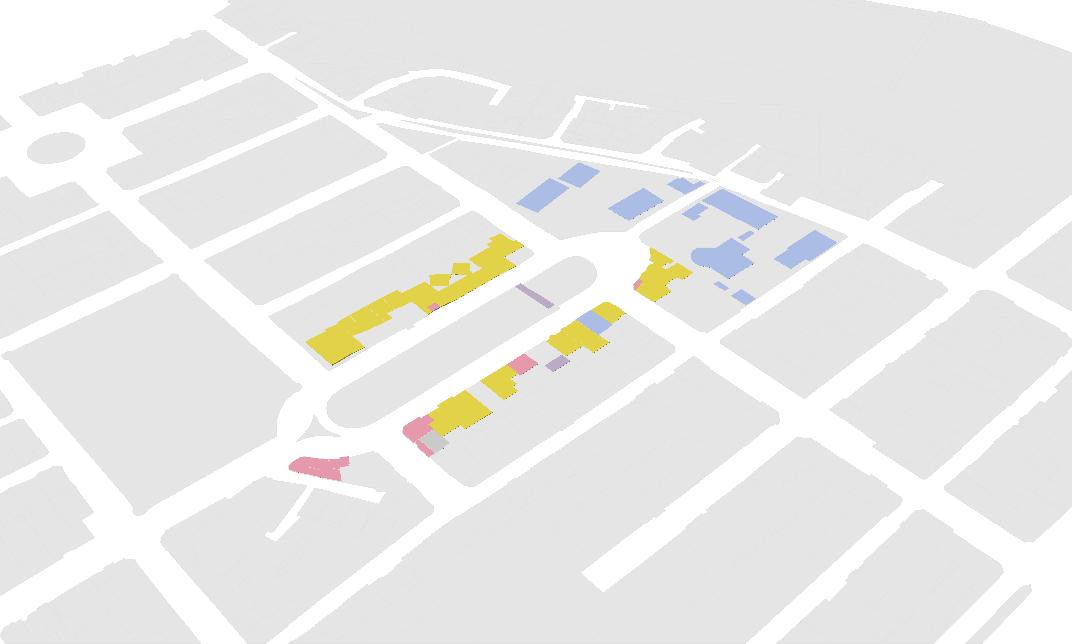
The area is a residential neighborhood, so most activities are related to daily family needs. Commercial blocks are a supermarket, bakery, barbershop, restaurant, café, and a real estate agency. A high school, a secondary school and an art institute for young children are educational institutes available for both locals and families from adjacent neighborhoods (Fig ure 43). Based on interviews, all families with children are satisfied with the distance from schools, although other residents are com plaining about loud noises, and car traffic with in rush hours. This study is mainly focused on activities that occur in the park as the most crowded part of this area. More detailed de scription of mentioned activities is provided in the social activities section.
Unfortunately, there is no bus station in the vicinity, although a taxi station is accessible within walking distance. Based on the ques tionnaire most residents travel by private vehi cle, and refuse to use taxi services due to the Covid-19 situation.
Supermarket Restaurant Café Bakery
Barbershop
Stationary store
All residents have access to clean water, san itation, gas, electricity, and internet services. They claimed they experienced power outag es within peak hours of energy use during the hottest days of last summer.
Secondary school Art institute for young children Education
The most obvious activities in the park are people gatherings. As William Whyte (2001, p.19)as serts, what attracts people most is other people. In addition, an observation to put in would be that people are attracted to people of the same category generally.
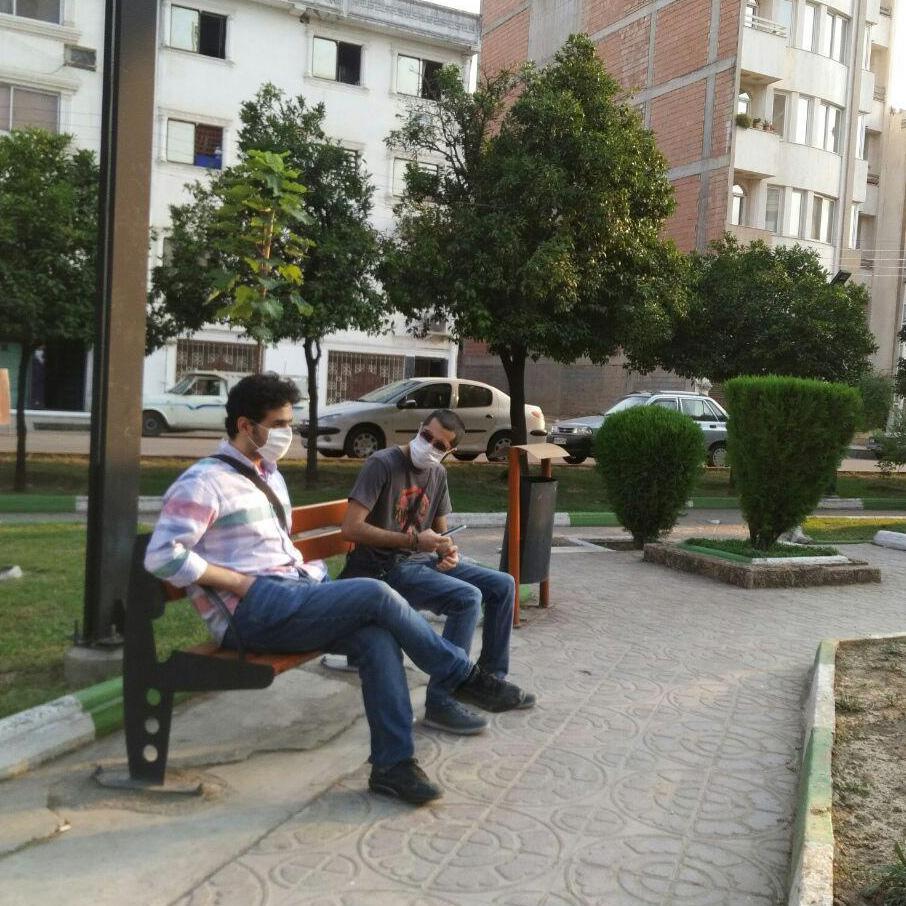
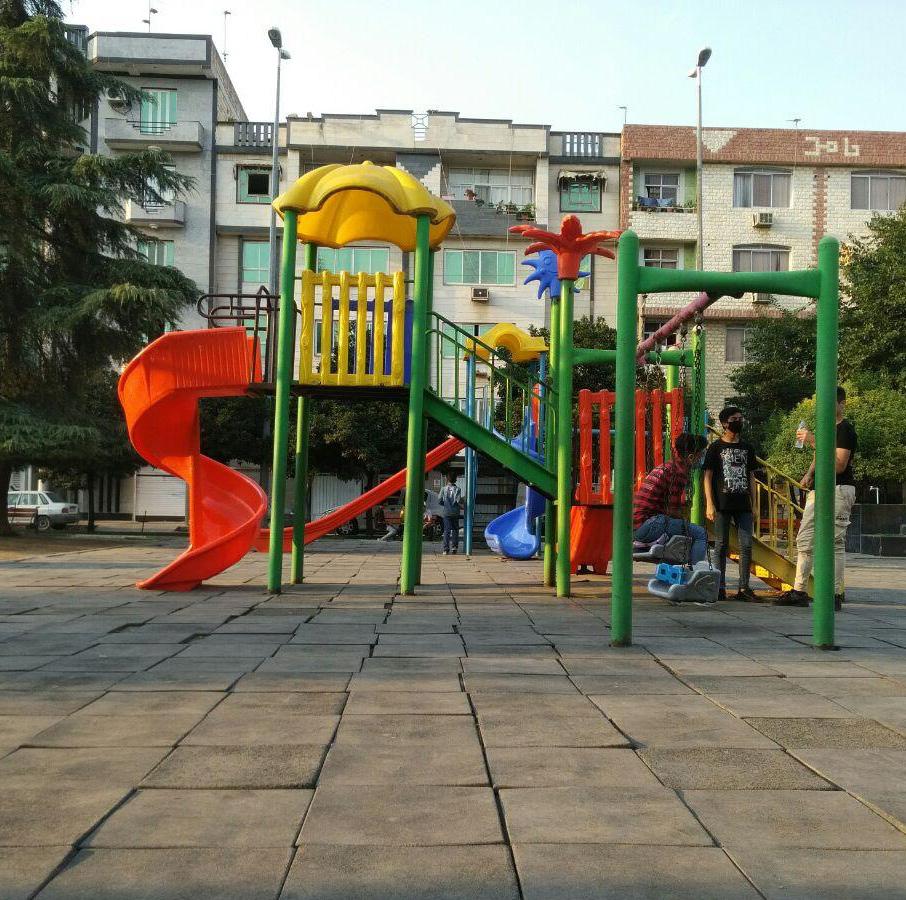
To clarify this point, according to the obser vations, families tend to sit close together in the east side of the park, while young adults’ meetings mainly happen in the west side. Young couples mostly sit on the benches around the fountain in the center part of the park. This pattern probably comes out of the fact that the children play ground as shown in figure 44 is located on the east side which explains families gathering place. Another convincing ex planation would be more lighting in the east side. This leaves the west side darker at nights, and a favorable place for young adults to feel free talking, and particularly to do ac tivities such as smoking or drinking, which would be deemed as unlawful activities by others as it is illegal in Iran. These groups of people are more inclined to stay at this place
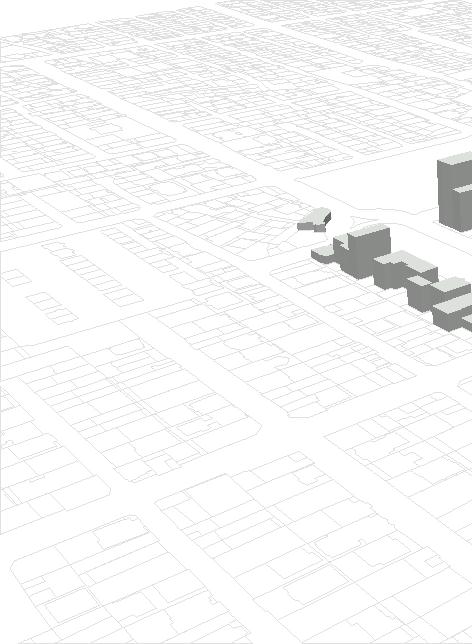
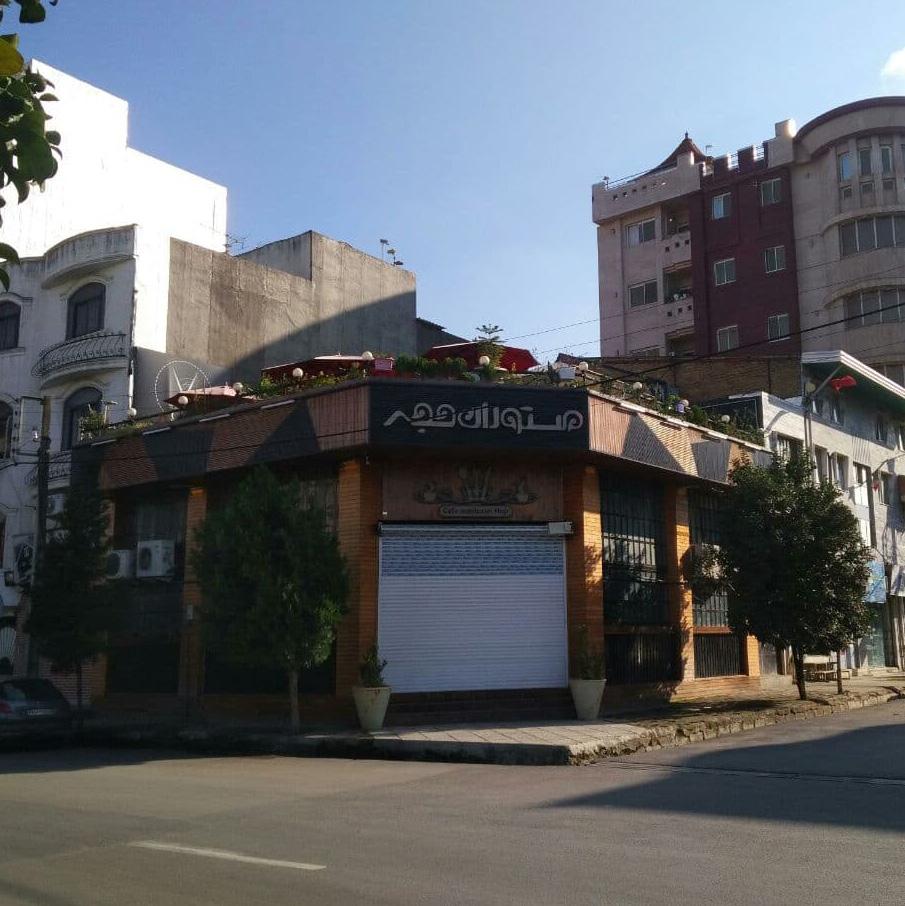
The restaurant which is closed due
to the Covid-19 situation
The Wednesday market
after midnight, compared to families who leave there before midnight, and elderlies who are mostly seen in this place during the daytime. The fast foods and cafés in the neighborhood are open, but People are not allowed to sit inside, and only take-out foods are available. It all adds up to more people eating and drinking in the public green space.
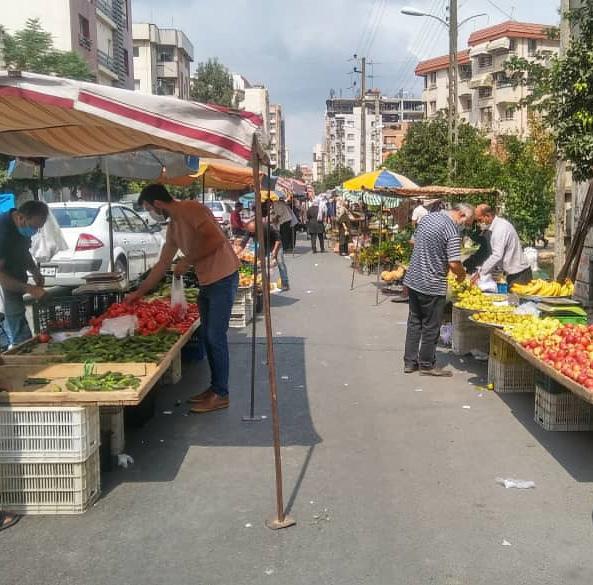
There is a weekly market recurring every Wednesday where lo cal sellers and farmers from suburban areas sell fresh fruits and vegetables. The Wednesdays market (Figure 44) takes place in the street adjoining to the park. Although locals complain about the vege tables leftovers remaining on the street after the event, they are the main shop pers of the market, and they benefit from it the most. Another issue caused by this market is the vendors blocking vehicle traffic.
Figure 44: Different activities in the neighborhood (Pictures and map by author)
Based on interviews and the online questionnaire most residents find this neighborhood safe, although some of the users of the green space believed that the park is not safe for women and children at night. As a female researcher and user of the park, I avoided visiting the area alone during night hours. The park was fairly peaceful within interview days. The only turbulence ob served was a fight involving a group of teenage boys because of using inappropriate language, which ended in a few minutes with local young boys’ intervention.
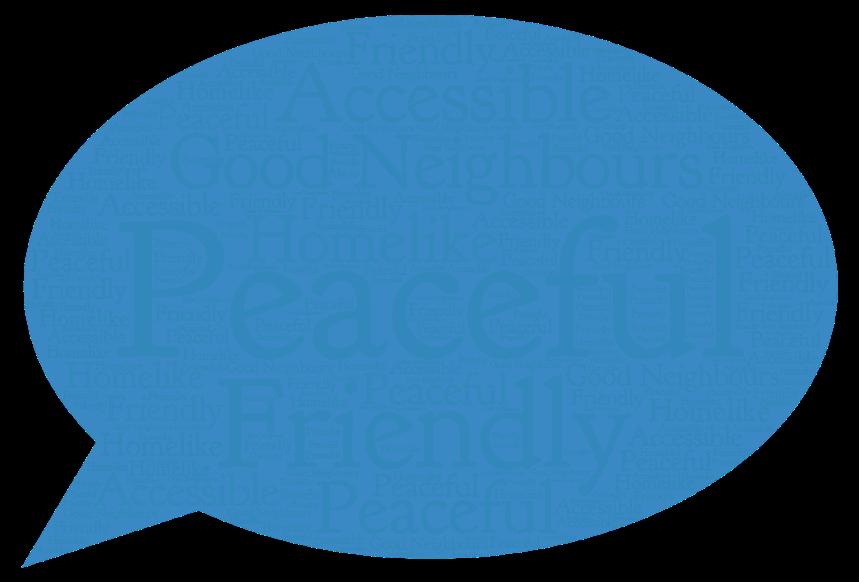
Figure 45: How do you describe your neighborhood?
As people are bearing up with severe econom ic recession due to diplomatic sanctions in Iran, the poverty threshold has fallen dramatically. In addition, the covid-19 situation has added up to the decrease in people’s purchasing power. This might explain the reason why people who were interviewed were reluctant to answer any questions regarding their financial status.
Based on an interview with the real estate agen cy owner, the property price has increased dramatically within recent years. People do not tend to sell properties since they are trying to save their money value, as Iran’s currency value has fallen to its lowest level, ever.
The most serious situation that should be considered now is the Covid-19 breakout. Citizens have started to adapt to the Corona situation. Obviously, it is not possible to keep people in isolation for a long time. Local residents started to use the park again, and consequences might be tragic without any preventive plans. Therefore, more reasonably practicable solutions should be applied. However, people took initiatives to decrease the risk of spreading the virus. As an example, since restaurants and Cafes are re-opening in this area, they still prevent people from getting inside, and people use the open green space to sit and enjoy their food by maintaining social distancing. Other disastrous situations to prevent in this area to mention:
• The neighborhood is close to a river (almost 200 meters), and therefore, is at risk of flooding. The floodings within recent years mainly damaged structures up to around 80 meters of the river as can be seen in figure 46 (A). Although, the streets in the area were swamped due to the heavy rain.
• The whole city is built close to an active fault zone as mentioned in the 2015 Sari master plan, and the buildings lack appropriate construction standards.
• There is an unsafe large vacant land (B in Figure 46) by the adjoining street that increases the crime rate based on interviews and online surveys.

The data sources and supporting documen tation to identify problems were gathered within observation and interviews. The list of problems needed to be narrowed down based on their significance for residents and users of the study area. Participatory meth ods were not possible due to the Covid-19 situation. So, the online questionnaire was designed in order to analyse users’ opinions. The questionnaire attendees were asked to rank the issues and add to the list of issues based on the problems they have experi enced in the neighborhood.
The issues extracted from the gathered data mainly involve feeling unsafe, inequali ty, place identity, and problems caused by vendors and educational institutes which are categorized into social and physical issues.
Social issues might have their roots in physi cal, economical, and other sorts of problems. But they mainly involve problems society or individuals are facing that affect people’s be havior within the society.
Although some of the residents explained that they are not bothered by the history of the neighborhood, most of them stated in the questionnaire that they are not proud of their neighborhood history.
Within the interviews residents mentioned that people avoid using the new name of the neighborhood, despite the fact that the mu nicipality has changed the new name on urban wayfinding signages and maps, and there is no prison in the city since eight years ago.
Female users are far less than male users of the park, specifically during night. (based on the ob servations nearly 3/4 of the population using the space are male). As it was stated by women in interviews they do not feel safe at night which indicates the importance of Gender equity.

Inadequate street lighting, and urban furniture leaves the west side of the green space almost useless most of the time. Moreover, darkness adds up to feeling unsafe.
Unsafe large vacant land that causes people to feel unsafe and leaves the adjoining streets almost always empty. People prefer to use the other side of the street to avoid walking along the walls of vacant block.
•
Issues caused by vendors:
Vendors are blocking car traffic on Wednesdays market.
• They leave the street with vegetable leftovers after the event.
Figure 48: Identifying physical issues (source: Author)

Some residents complain about noise pollution and traf fic congestion within rush hours caused by schools.
Lack of a public transportation system causes difficulty for residents and other users to access this area, since there is only one taxi station in the neighborhood.

The goals are extracted from problem statements and defined to be a solution to the problems. The strategies and principles are set to achieve the main goals as will be introduced within this chapter.
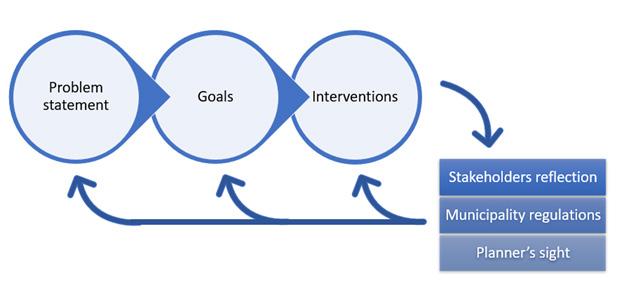
What are Interventions trying to aim based on identified problems?
Equity: based on the obser vation women and girls tend to leave the green space before night hours, although crime rate in the area is low. The main goal to address this issue would be designing a space that provides gender equity and fair access for all different groups of users.
Safety: Within the observations I located the areas that were sparsely crowded during days and almost empty at nights. Some of these places were the same unsafe areas spotted by local residents in the surveys and interviews. The interventions to achieve this goal might smooth the way to achieve equity as well. As long as people feel safe in the neighborhood, the area attracts more population and the crowd itself adds up to the feeling of safety.
A more refined Place iden
tity: Redeeming the iden tity of the neighborhood is something residents are trying to do automatically. Although creating a more vibrant neighborhood will be helpful to enhance the char acter of this place.
The spatial proposal mainly suggests developing a range of new infrastructure and adding urban furniture particularly in the open green space. The streets adjacent to the large vacant block were not entirely studied within the project. But these streets directly affect the neighborhood and cause dwellers to feel unsafe. So, a few interventions along these two streets are suggested to enhance the safety of the neighborhood.
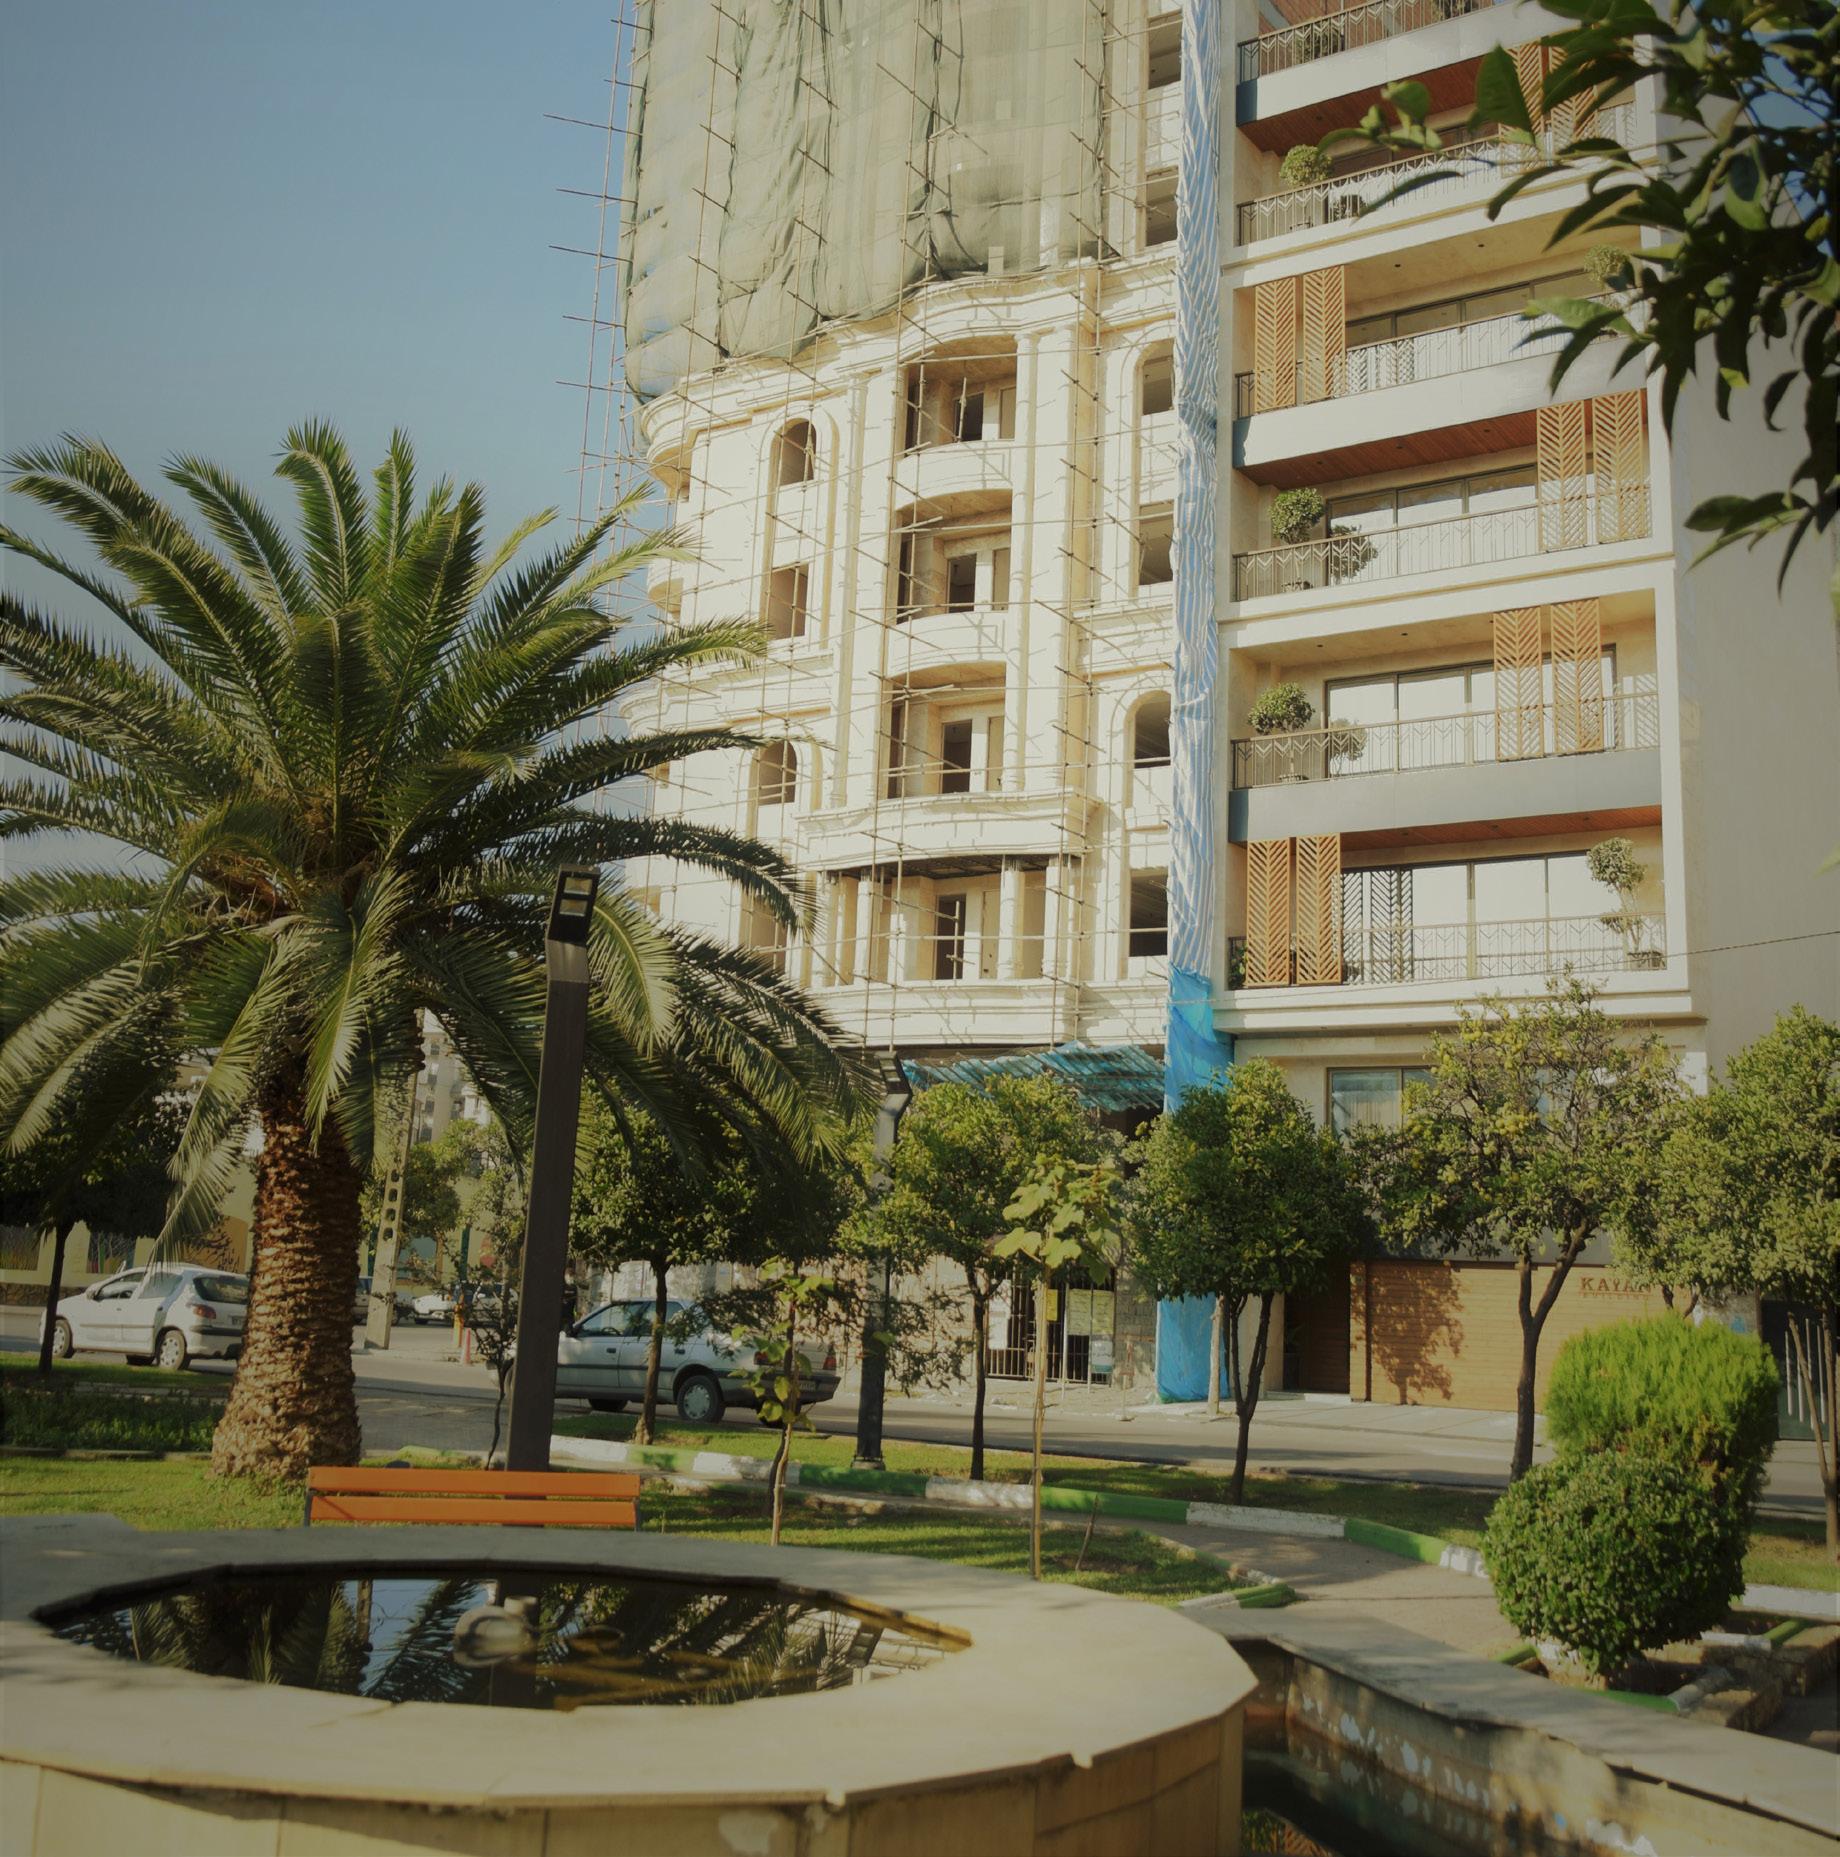
Urban furniture
Adding creative urban furniture, lightings, shading, and plants to provide various experiences for all groups of people. It also increases the number of women using the the public spaces more during night hours.
• increasing street lightings

• Adding benches and sitting places in the west part of the green space
• Providing shelters for sitting places to keep the users during rainy days
• Adding benches in the street sidewalks
• Adding lightings in the street sidewalks
• Designing a bus/taxi station
• Planting trees along the sidewalks of adjoining vacant blocks (Salman and Saba street) to en hance environmental quality.
• Choosing native trees that provide shade
• Promoting public transport
Destructing the wall and Building a fence to enable pedestrians to observe inside the vacant area. It decreases the crime rate inside the block since it be comes more visible and provides a more pleasant walk for pedestrians.
• Preserving the existing green spaces
• Saving open spaces and brown fields
• Promoting cultural features in architecture and designing landscapes
• Practices to improve cultural awareness
• Controlling Building height
• Stricter building height limit regulations
The municipality plans to construct a shopping mall in the vacant block in the future. Since the construction start date is not decided, it is im portant to keep this lot safe and clear by not leaving it unused.
The Park has become a central hub for the diverse activities attracting the num ber of people of different generations. The method that has been used for the fieldwork such as informal conversation has been a successful tool to gather the information not only in the case of Sari but also in my study area. This first helped to build the trust of the people and then gain some underlying problem of the area such as identity issue which cannot be achieved through questionaries and survey. Among all the problems, safety was the immediate issue especially for women and pedestrian that needs to be intervened which is a risk factor to increase the crime and illegal activities in the area. The proposed physical inter vention such as adding street light, urban furniture, making transparent fence not only can make the area safe but also can bring a lot of people together in a common space to share their time. These small changes in the area can make a big impact in solving the some major and minor issues of the area.
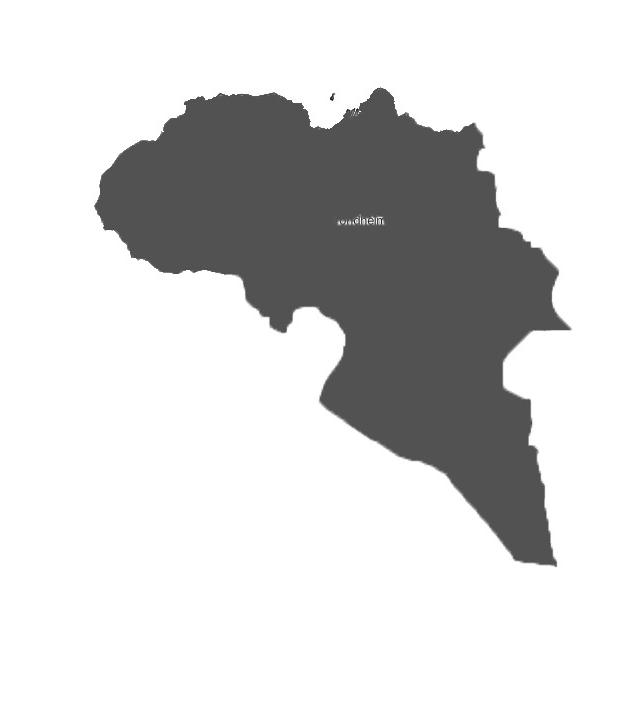
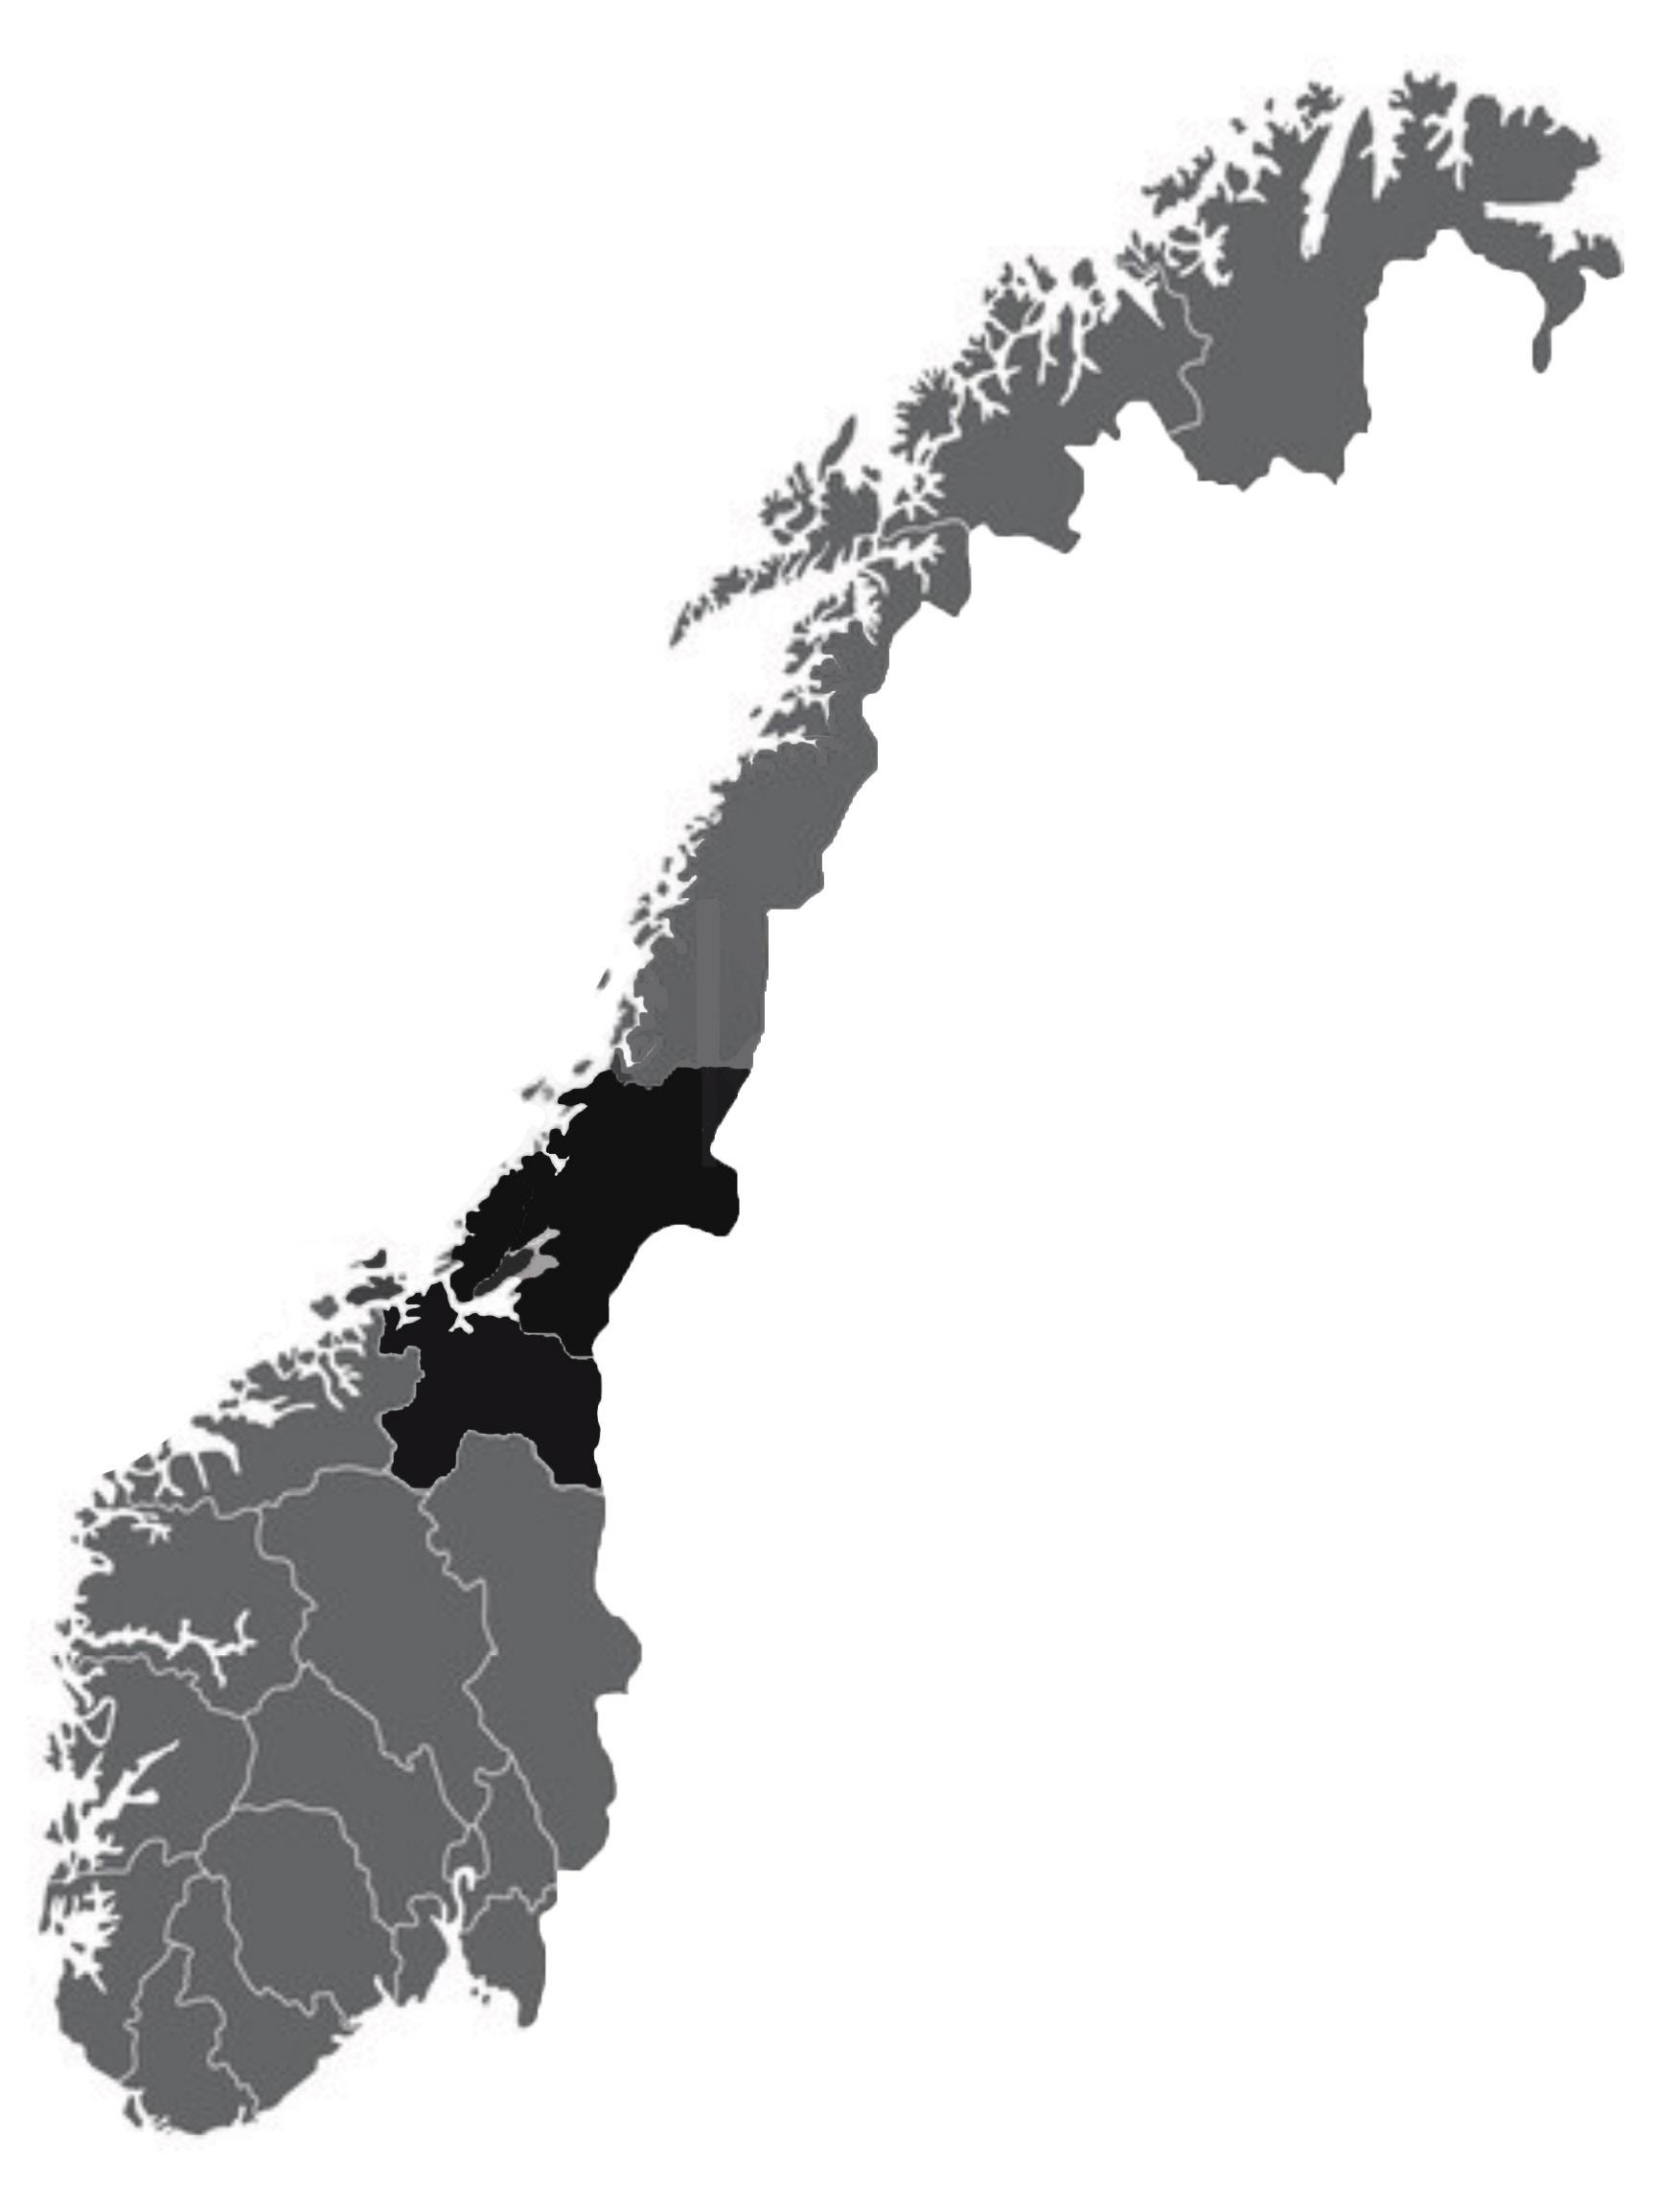
Trondheim is the oldest and among the major cities in Norway. It is scenic city and municipality in Trondelag, lying on the south shore of Trondheim fjord at the mouth of River Nidelva (Trondheim.no). It served as a capital of Norway during Viking King until 1217. It is the fourth-largest urban area of Norway after Oslo, Bergen and Stavanger and third most populous municipality with the population of 205,332 as on 01/01/2020. (Statistics, 2020)
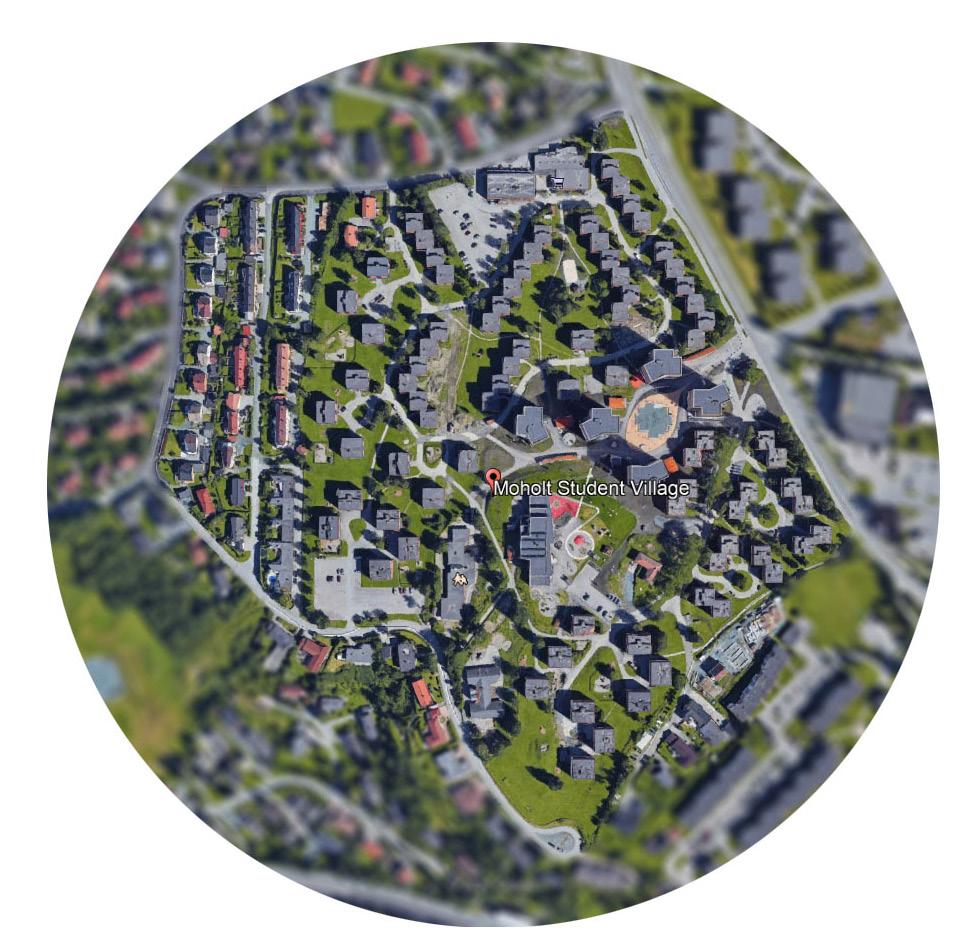
Moholt student town in figure (53) is the town for the Local and international students lies approx. 4km southeast of Trondheim city centre. It was built in the period 1963-70 and is the largest student town of its kind in Trondheim with approx. 2200 students and around 1300 housing units, divided into small blocks (Moholt Student Village Masterplan).
The whole area is approx. 145,000 m2 and has total BTA of approx. 63,000 m2 (Moholt 50 | 50) The existing buildings mainly consist of three-story brick buildings with dormi tories and apartments.
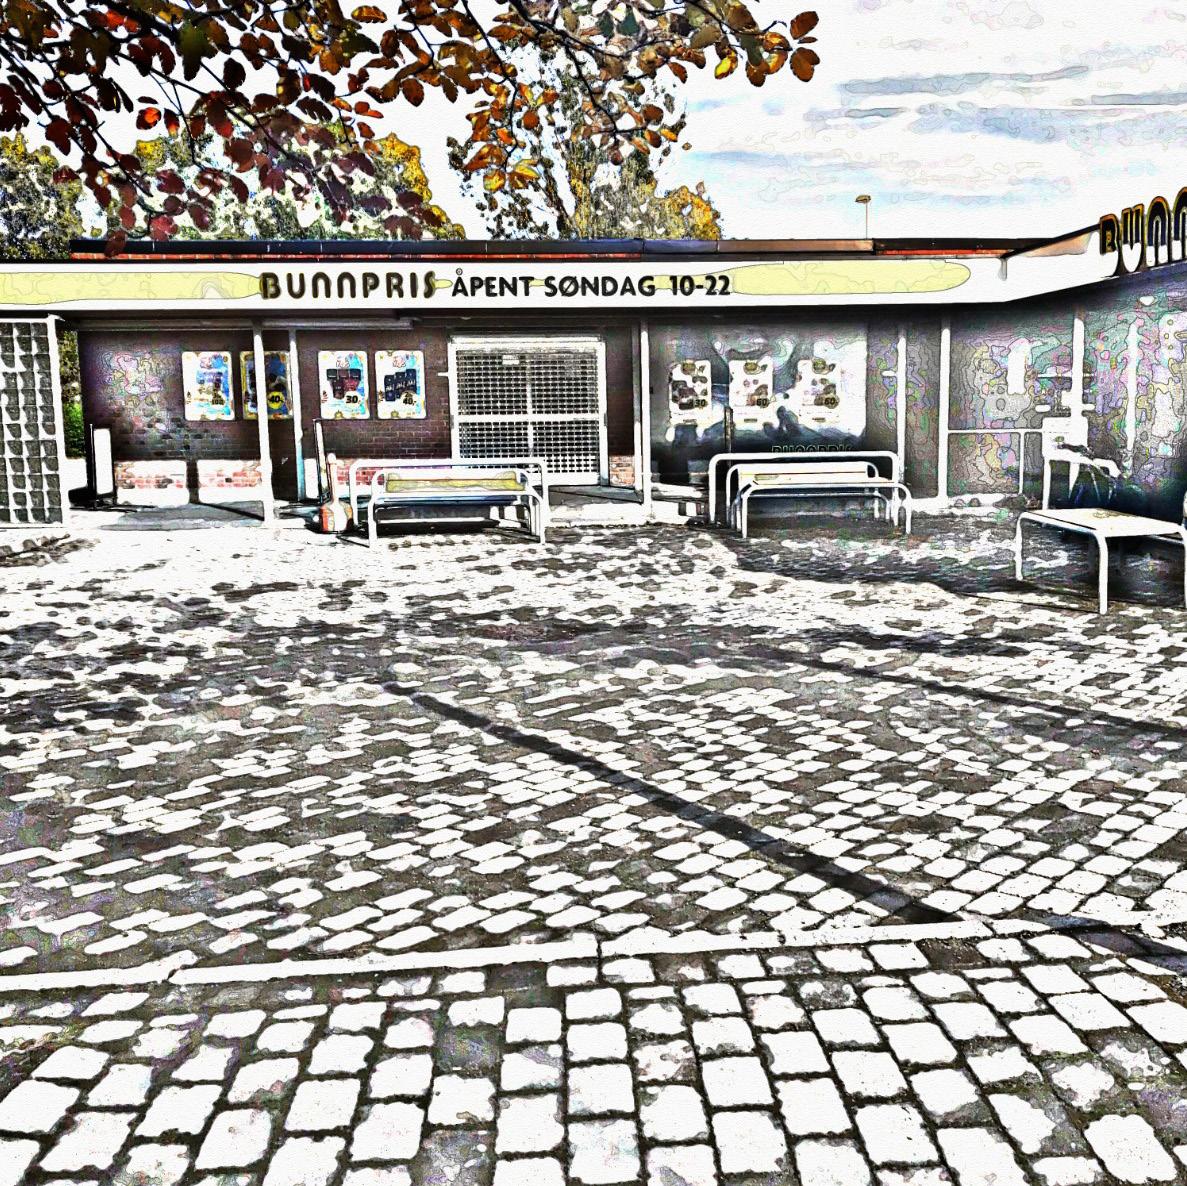
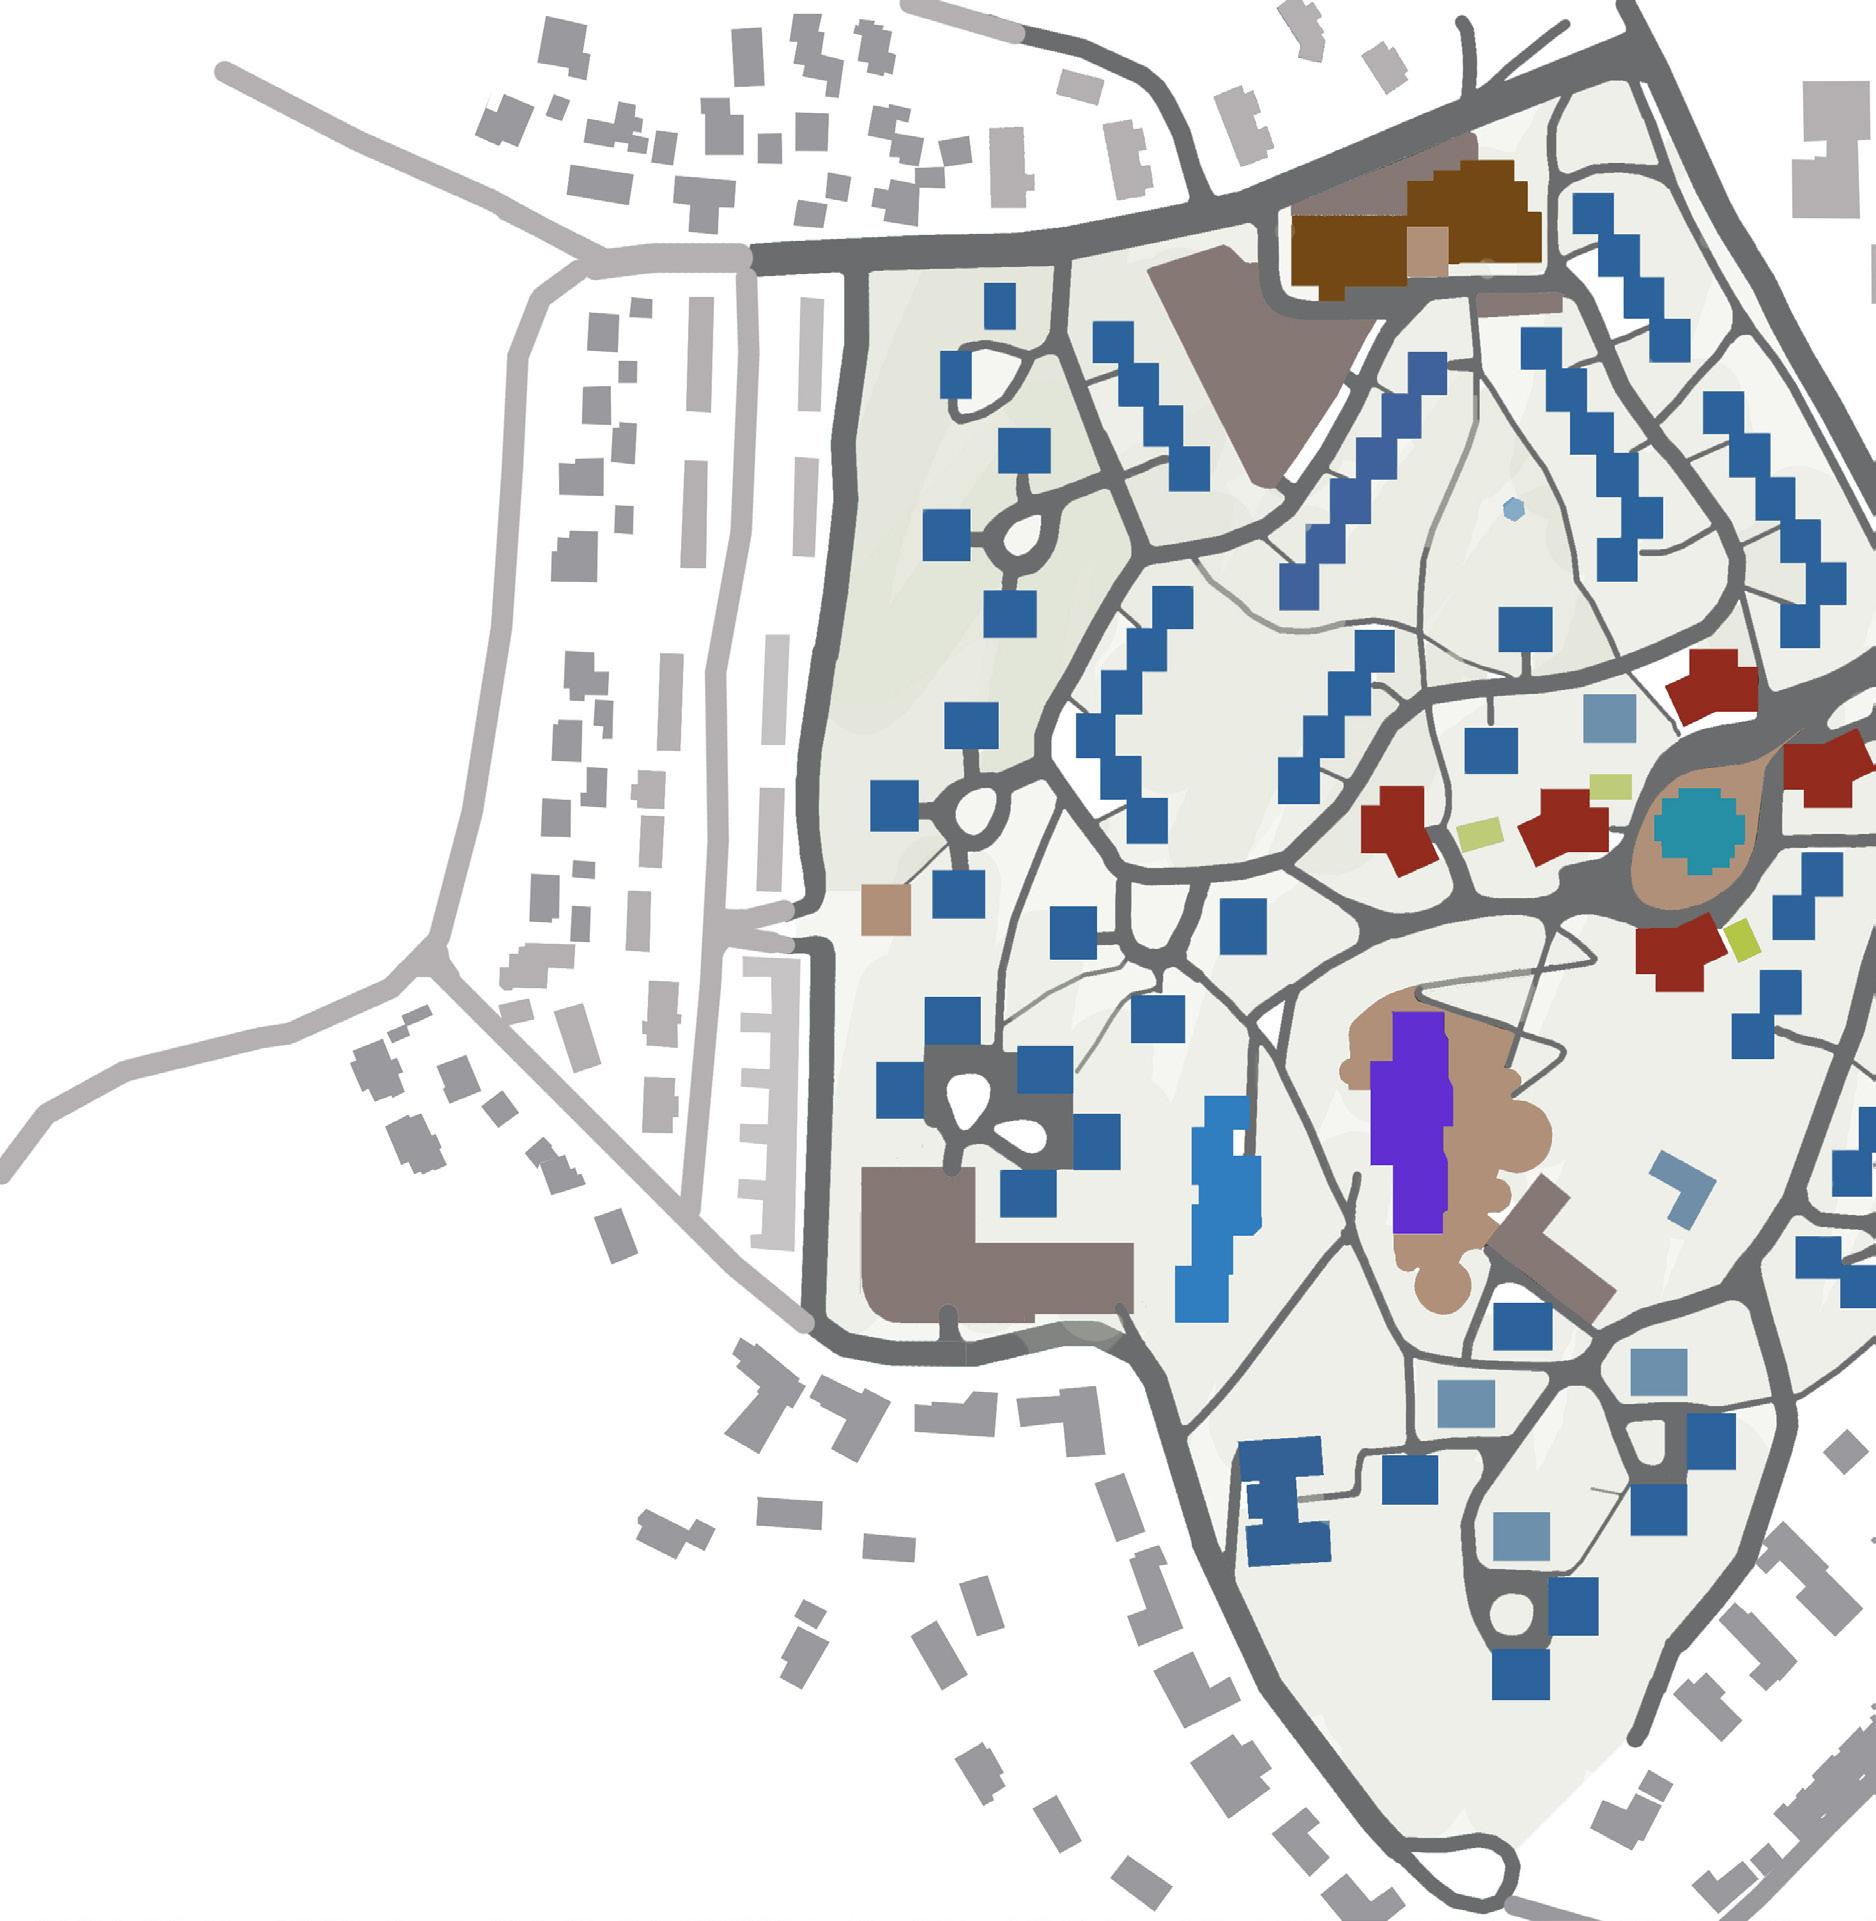
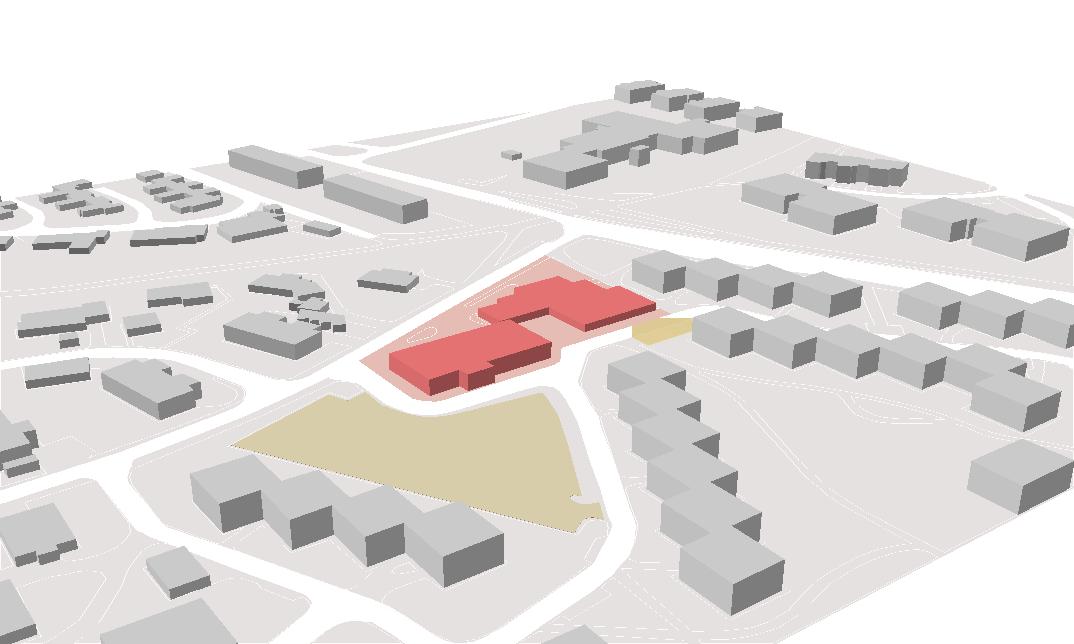
The entire Moholt Village is the huge area so the specific part in it was chosen for the study which is the public square the red shaded part in the figure 54 lying in the north of the village and its surroundings. This area has some significant features like the grocery store, community health centre and community parking. Bunnpris is the grocery store which is in the vicinity where nearby residents and Moholt students come for shopping. The site also has Pizzabakern, a pizza bakery store and SiT Helse, a SiT health Center.
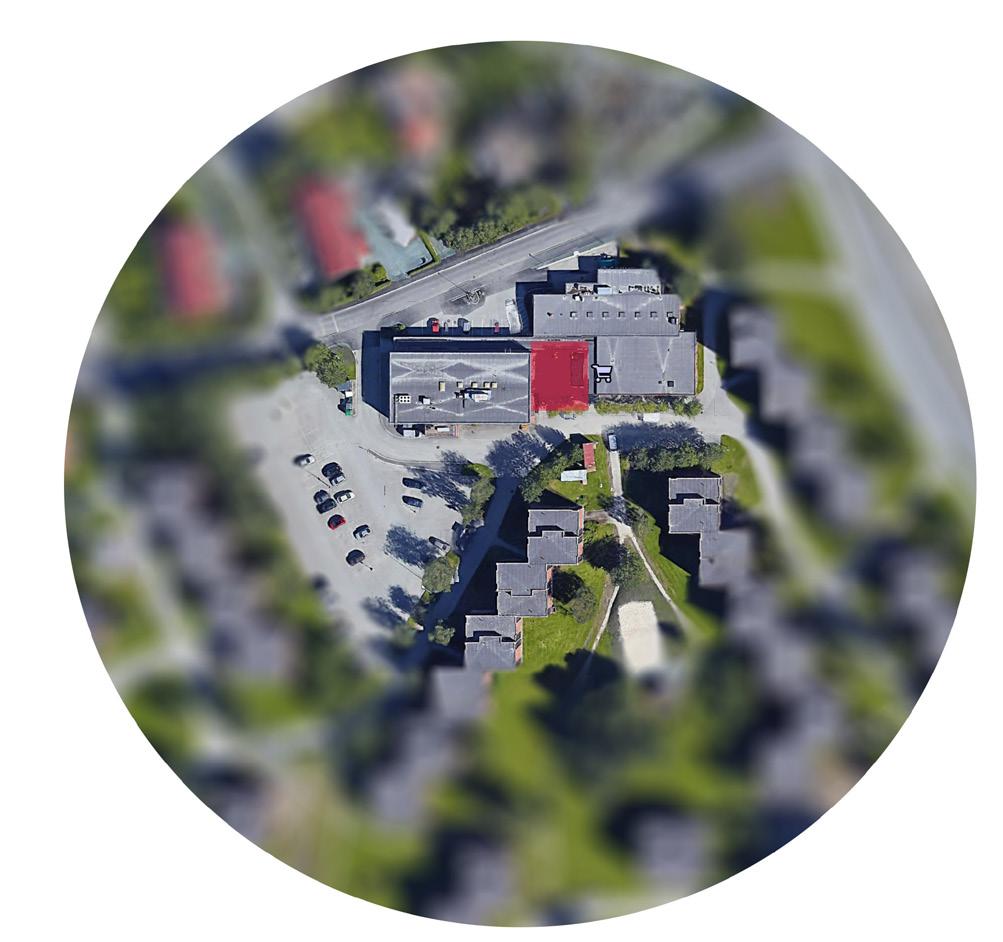
The main reason for selecting this public space for the fieldwork is because the site seems to be underdeveloped in comparison to other nearby public space. Though the area is in a prominent location and has a lot of potentials to develop, it has now become a dead space with low quality of the environment. It feels like the area does not invite people to sit and share the time. The other reason for the site selection is getting to know the views of many people from diverse culture. The area lies in the Moholt student village which has local and international students from different countries and cultures living in harmony in the same environment. So, through the fieldwork, it provides an opportunity to meet and interact with people from different background.
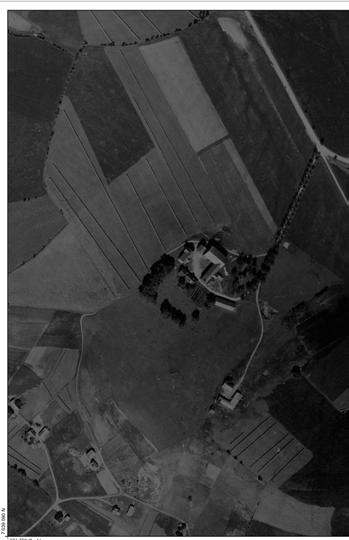
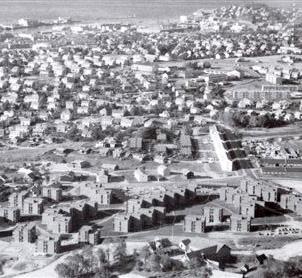
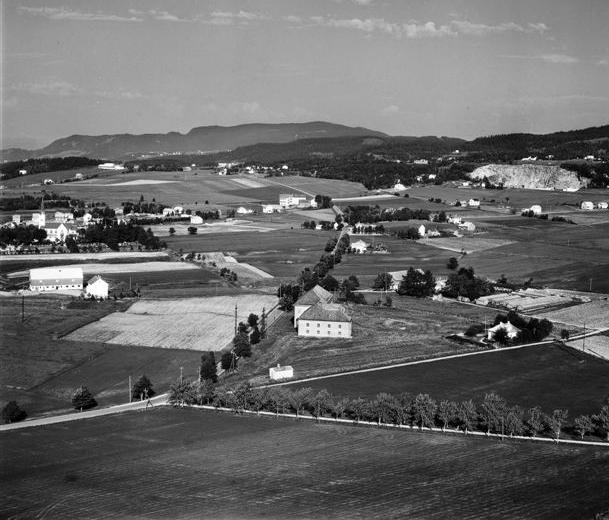
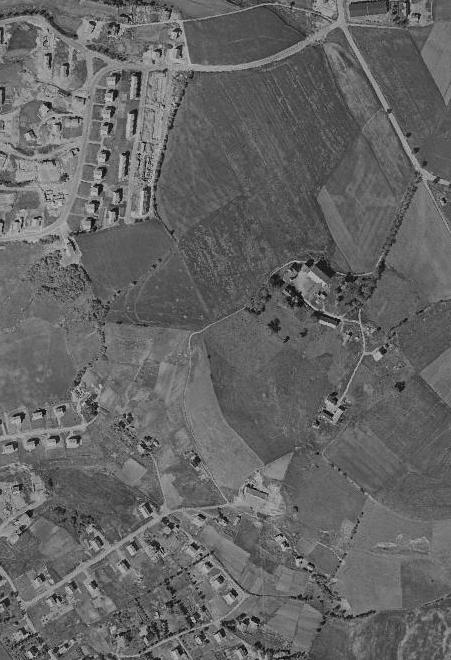
Moholt student village used to be a farm which after World War II was subdivided resi dential plots. There were few changes done in the area over the years in which the main include the parking lot at its centre, later transformed to make student towers as a part of a larger masterplan.
Moholt Vestre, a farm in the former Strinda Municipality
Construction of Moholt Student Village in Moholt Vestre
The property subdivided into residential plots after World War II
Historical
1963-2070
1968
Moholt Student Village in 1968
Student
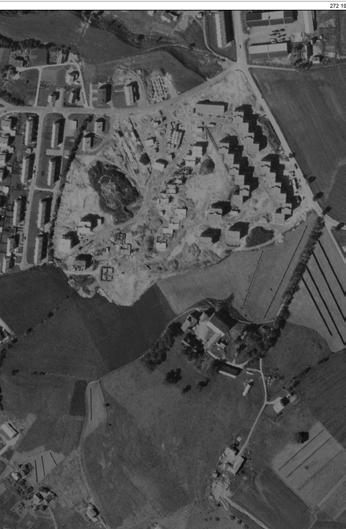
Moholt Student Village with large and central park ing
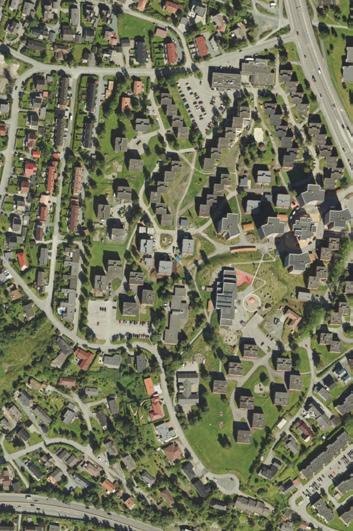
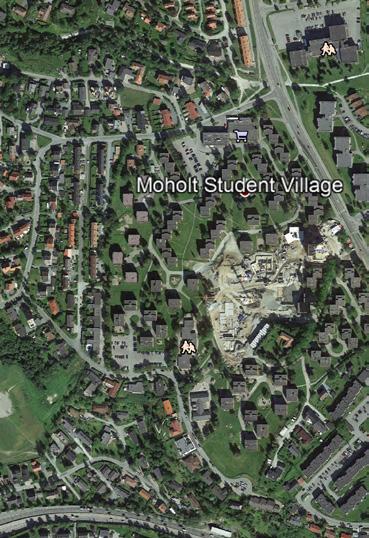
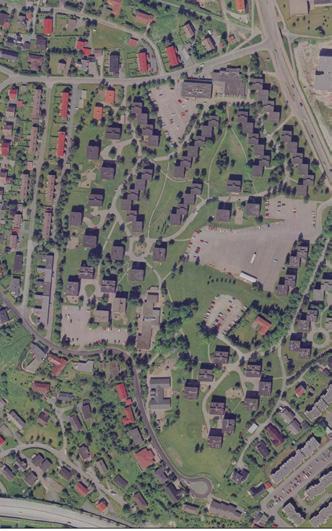
Source: (Ilic, 2013)
The farm was sold to Student association in Trondheim (Sit) and new development of city was initiated to create a new heart for student village.
1999 Since 2016
Moholt Student Village with three student towers.
Map Source: (Norge i bilder, Google Earth) History and figure 55 and 57 source: (Bratberg and Arntzen, 1996), (Osnes and Strinda bygdebokkomité, 1939)

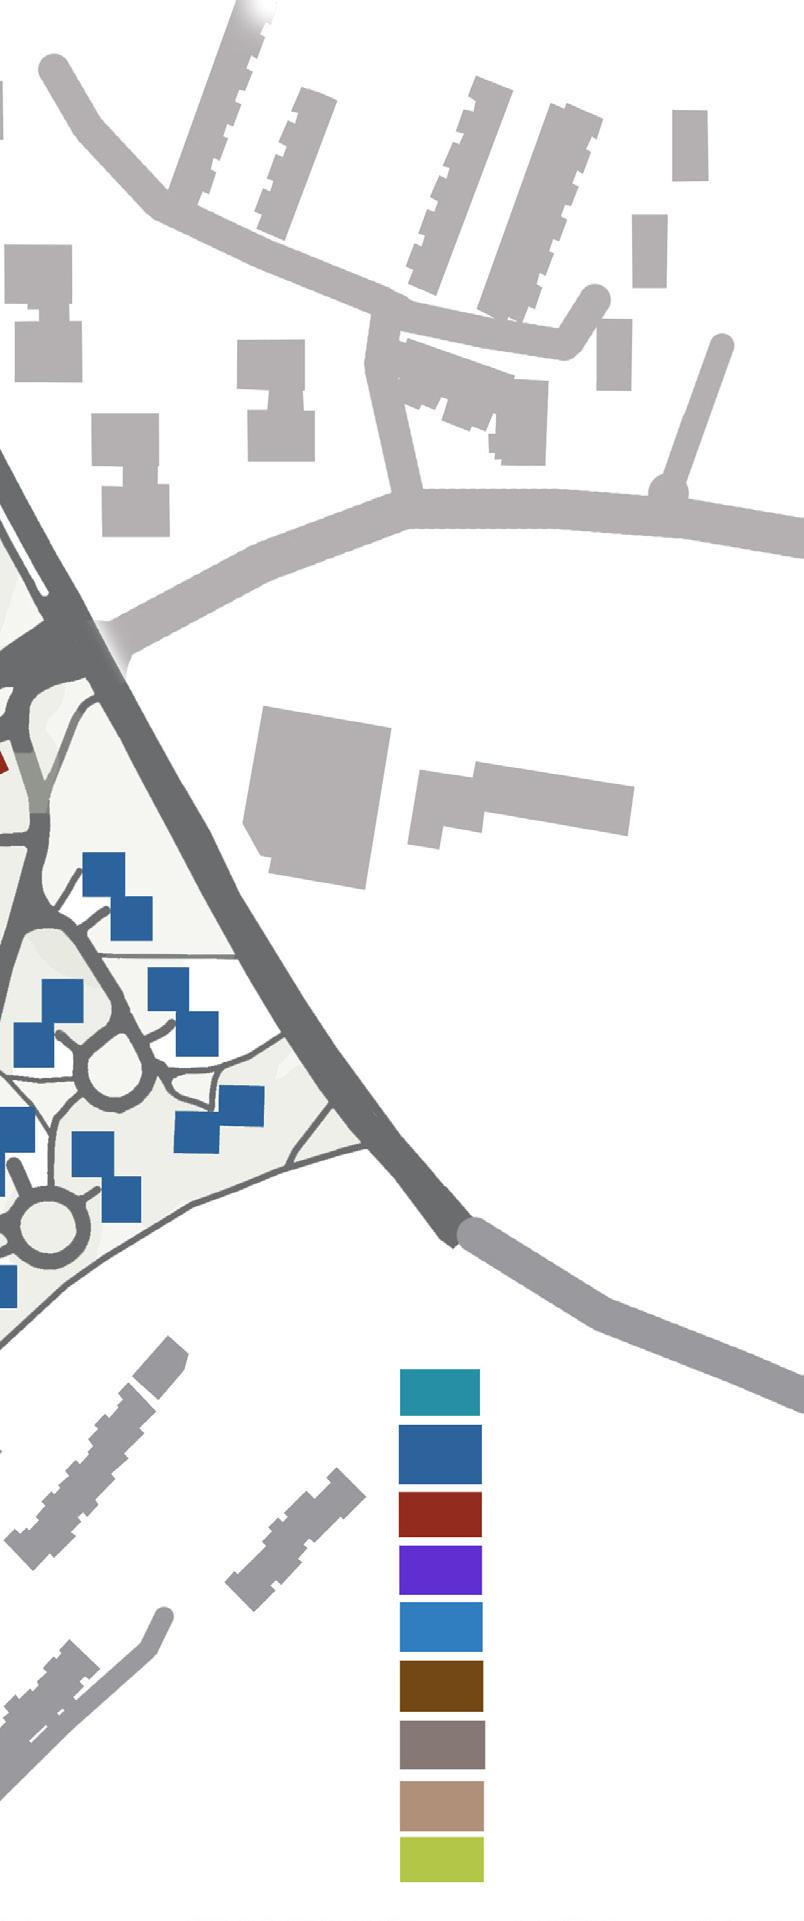
At present, along with student dormitories and apartments, the area consists of Kindergar ten, city library/activity house, services functions such as medical centre, fitness centre, grocery stores, parking lots which offer for the large multi cultural environment. as shown in figure 59. The figure 60 shows the study area with the existing features in the area.
Figure 59: Landuse Map of Moholt Student Village (Source: Google map edited by author)
Library Housing Unit
Mixed Use Housing
Kindergarten
Restore Groceries
Car Parking

Open Area
Bike Parking
Green Space
Local residents
Existing Parking lots in the vicinity
The main study area: Public square
Existing structures that bound the public square
Moholt Student Village’s residents
Figure 60: Landuse Map of Study area
(Source: Trondheim Kommune, edited by author)
To study the users of the area and their activities, the observational method was used in which people’s movement was observed and mapped at a different time in both weekdays and weekends. From the observation, it was found that the stu dents from the Moholt Student Village and the local residents mostly used the public space for the necessary activities such as going and returning from the uni versity and commercial purposes. Children were found strolling with family and friends or sitting and eating in the benches usually in the afternoon after their school is over. During weekends, family and children were the primary users of the space. Also, the flow of people and the usage of space are directly affected by the weather condition, a greater number of people can be seen on a sunny day than in the rainy or cloudy

In an early phase of fieldwork, different stakeholders were identified who will affect or be affected by the outcomes, and plotted Power-Interest diagram, which shows their interest and power in the fieldwork. The diagram was later modified with the most influential and interest group in the project. Local residents, Family, Students, SiT Organiza tion which are the most affected group showed their high interest throughout the process.
In the daytime, people were usually in a hurry to take classes or go to work, they did not show any interest to participate. So, I chose to interview people in the evening after they return from classes and work and during the weekends. I got to interview students, residents, bike users, customers, and passers. The Interview with the locals and students was done informally like a conversation to know the more about the space and its problems. While I prepared questionaries to interview SiT organization and Pizzabakeren during the problem statement and intervention phase.

The interviews were limited to the certain number of people so to engage the more people and gather more information about the space, an online survey was created which includes sets of questionaries related to their activities, safety, accessibility and comfort. This help to identify the set of the problems in the area and gave idea on a possible intervention that can be adopted. The survey also had some questions related to COVID-19 to know if pandemic had affected their activities or use of the space.
This step in the fieldwork involved gath ering online information and documenting it. I at first, gathered all the articles, news and journals which later was studied in de tail and summarized the findings. Historical maps and satellite images were collected from the website norgeibilder.no and Goo gle Earth while the detailed maps and mu nicipality regulations were obtained from the Trondheim Kommune website.

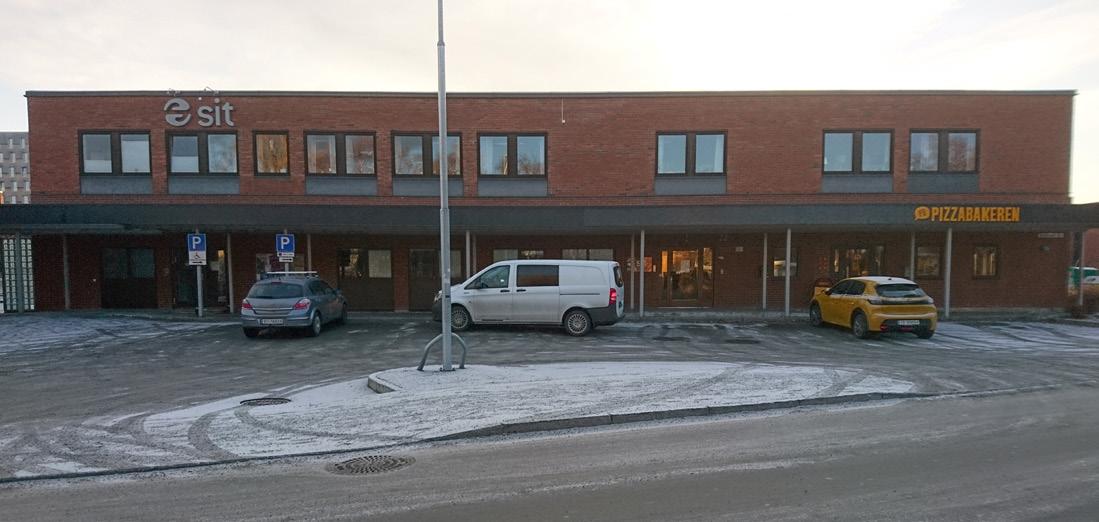

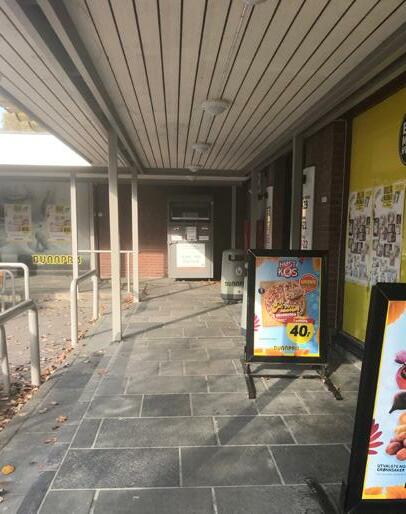
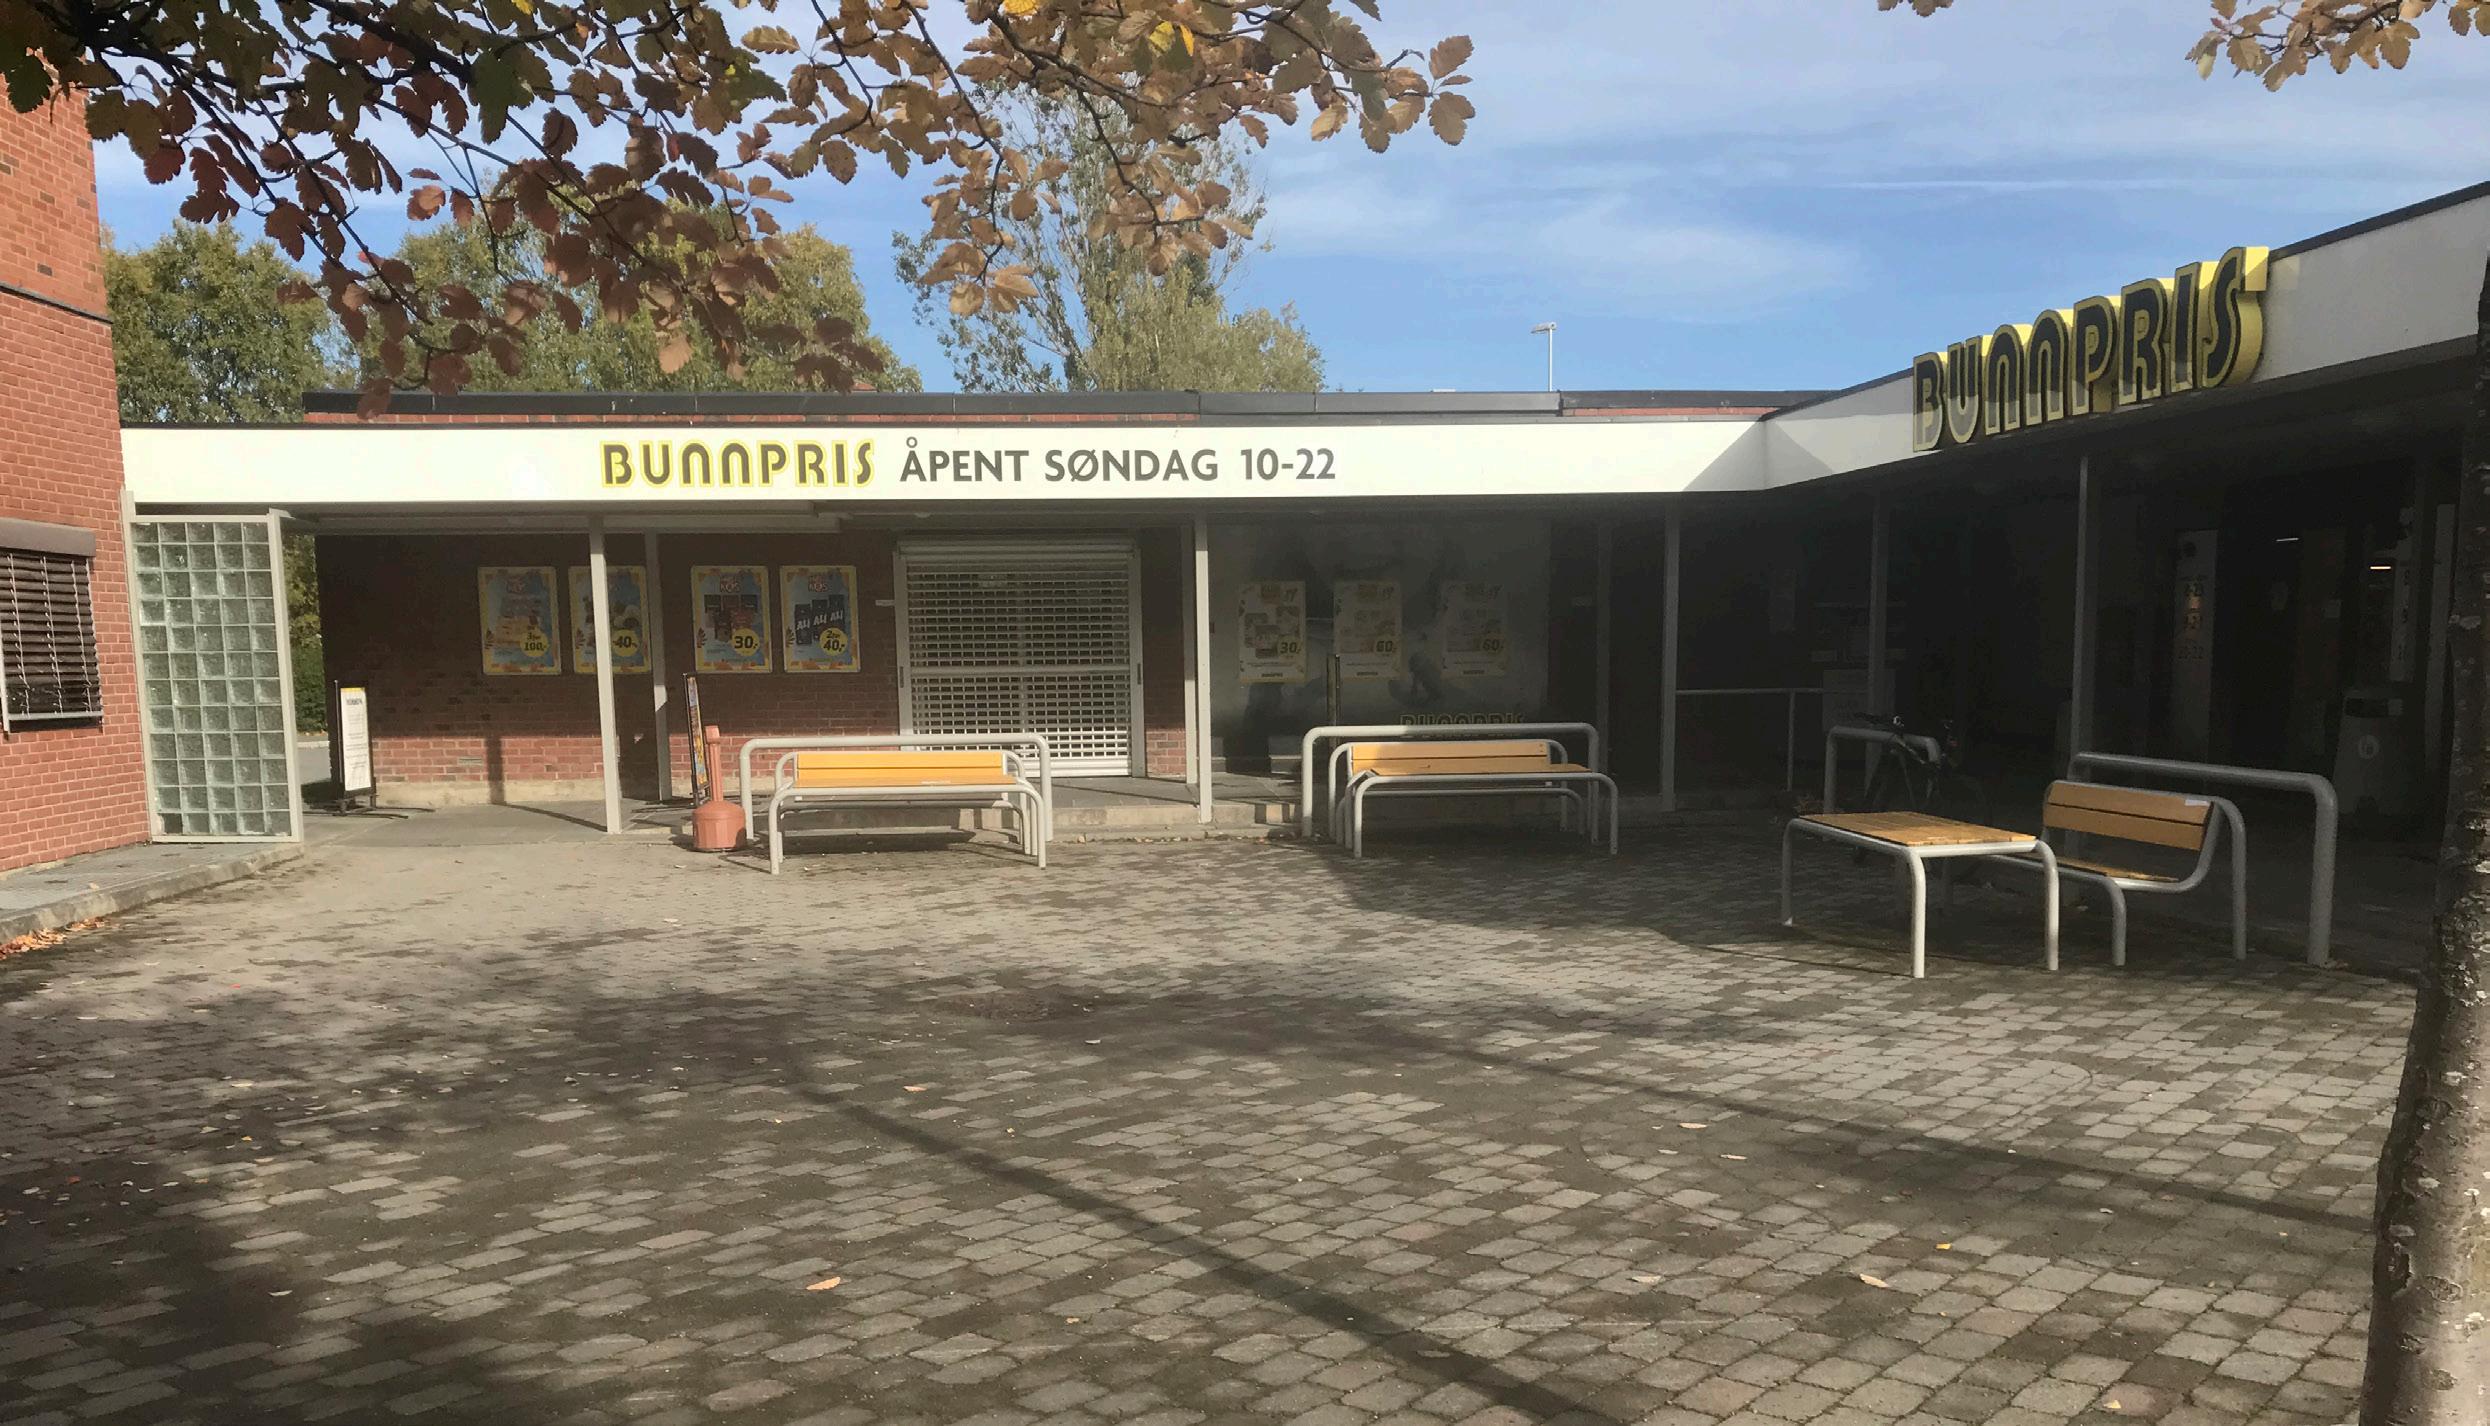
The area has commercial, institutional, and park ing lots. The west side of the area has Sit Helse and Pizzabakern figure (64) and east with Bunnpris figure (65). All the blocks are connected with a semi-open walkway figure (66) which form a plaza at the centre. The entrance to the plaza is from the south and North-west figure (63)
Entrance from North-west Entrance form south
Figure 63: Existing entrances and surroundings (Map Source: Trondheim Kommune, edited by author)
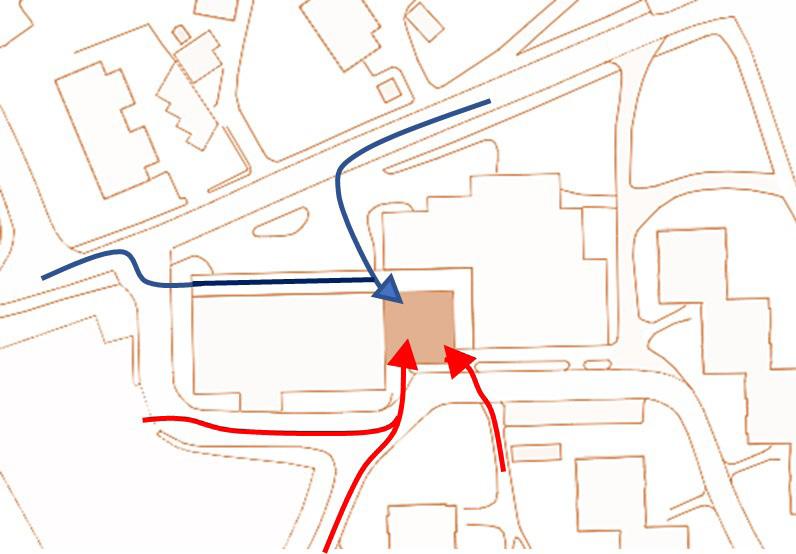
Figure 64: SiT Health Center on left and Pizzabakeren on right, author’s click
Figure 65: Bunnpris with study site, author’s click
Figure 66: Semi-open walkway, author’s click
The site is accessible for all the users, bike, car and pedestrian. The main road is within 100m distance, and the local bus station is within 200m distance from the space fig ure (67). The ramp in the site has made easy access to bike users, strollers, and disabled people. But within the vicinity, there is no Ze bra crossing in the secondary road.
Main Road
Secondary Road
Pedestrian/ cycle
Bus Stops
Figure 67: Road, network and Transportation linked with the site (source: Trondheim Kommune, edited by author)
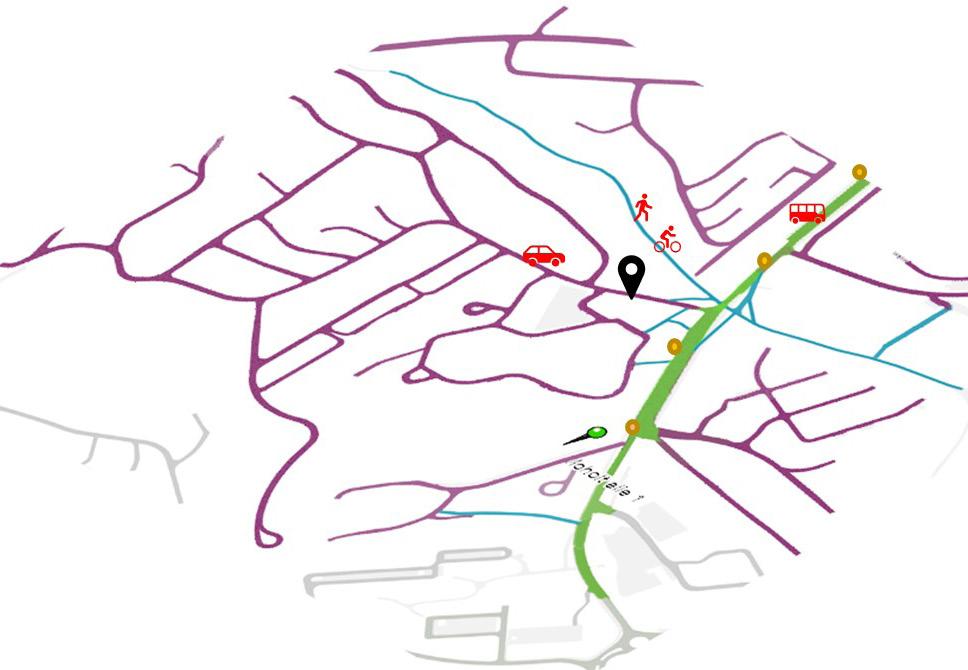
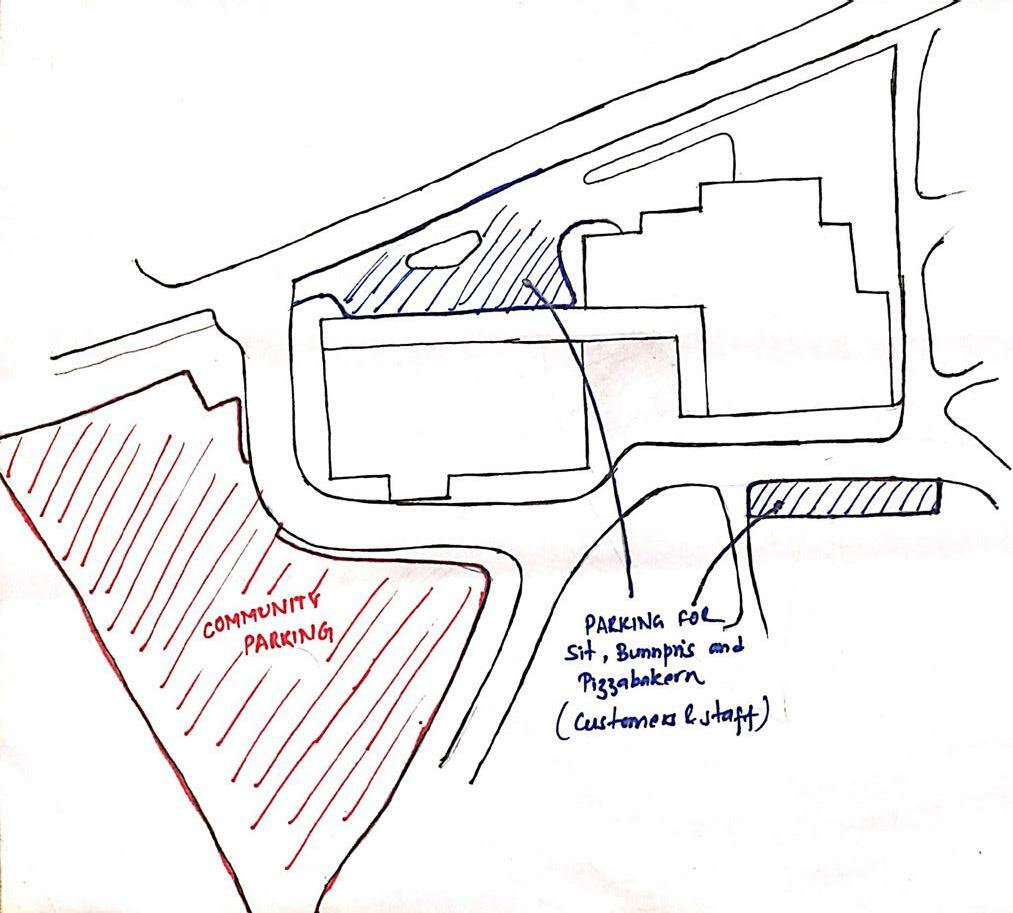
Figure 68: Map showing car parkings in the vicini ty, by author
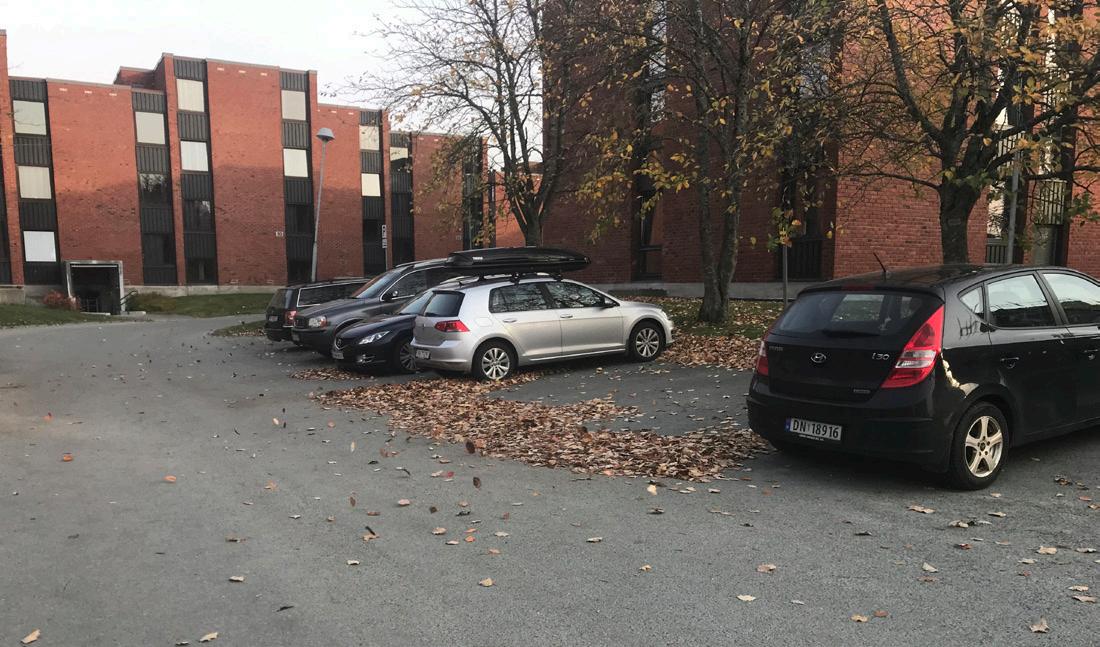
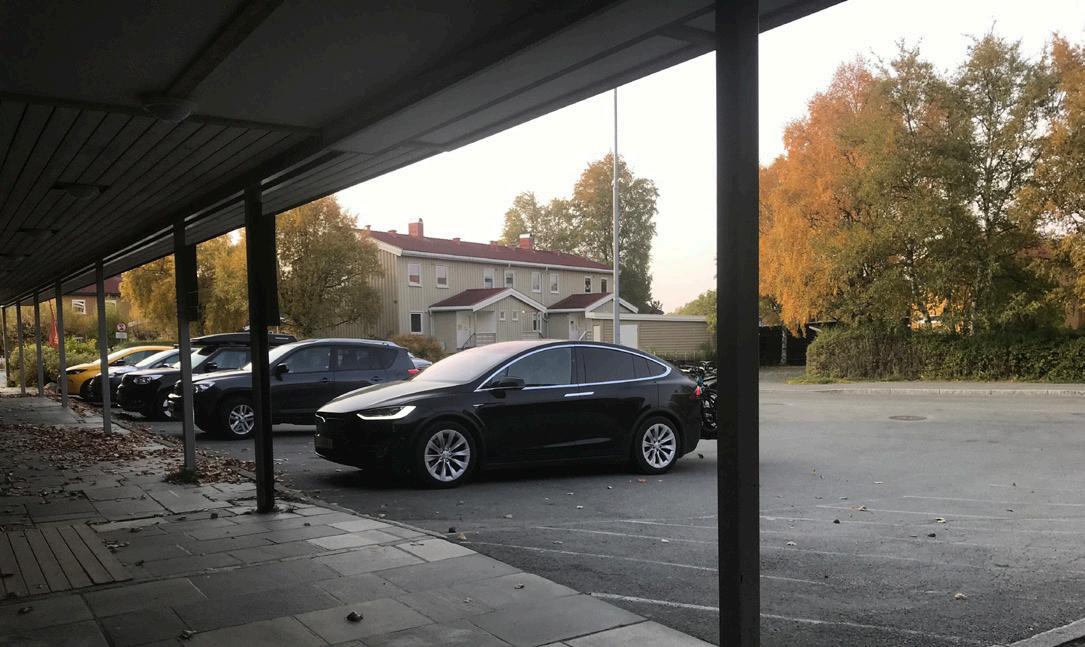
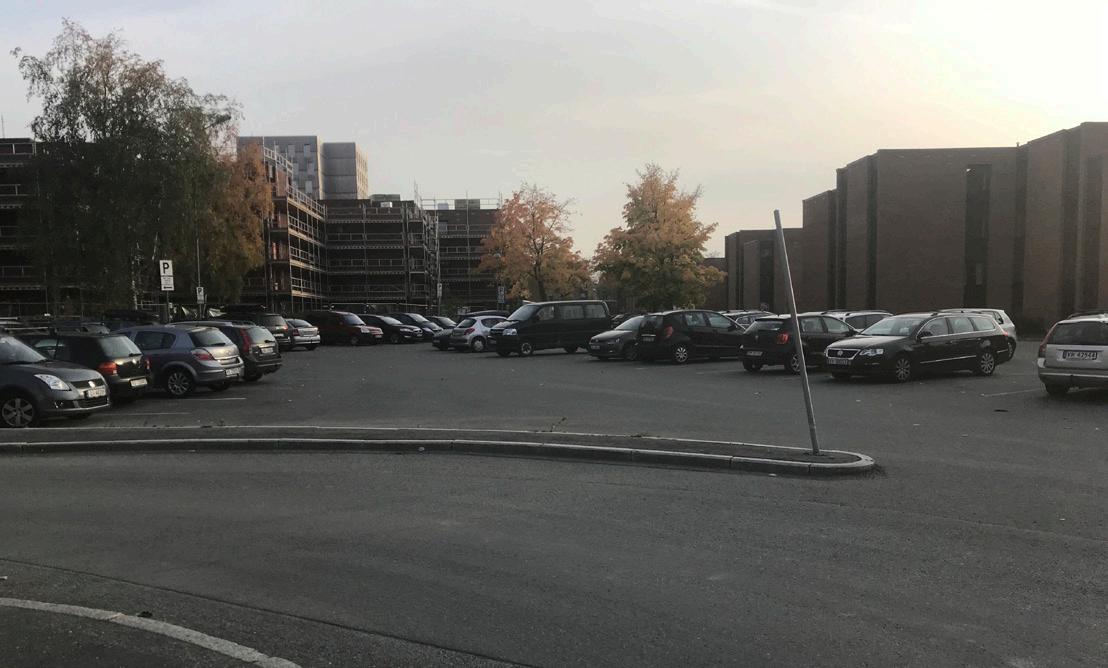
The site has three car parking areas; one for the community parking figure (69)., others are for the Pizzabakeren, Sit Helse figure (70). and Bunnpris fig ure (71). The community parking lot, for the Moholt village’s student, is almost entirely occupied all the time. The re maining lots are used by the costumers for short period.
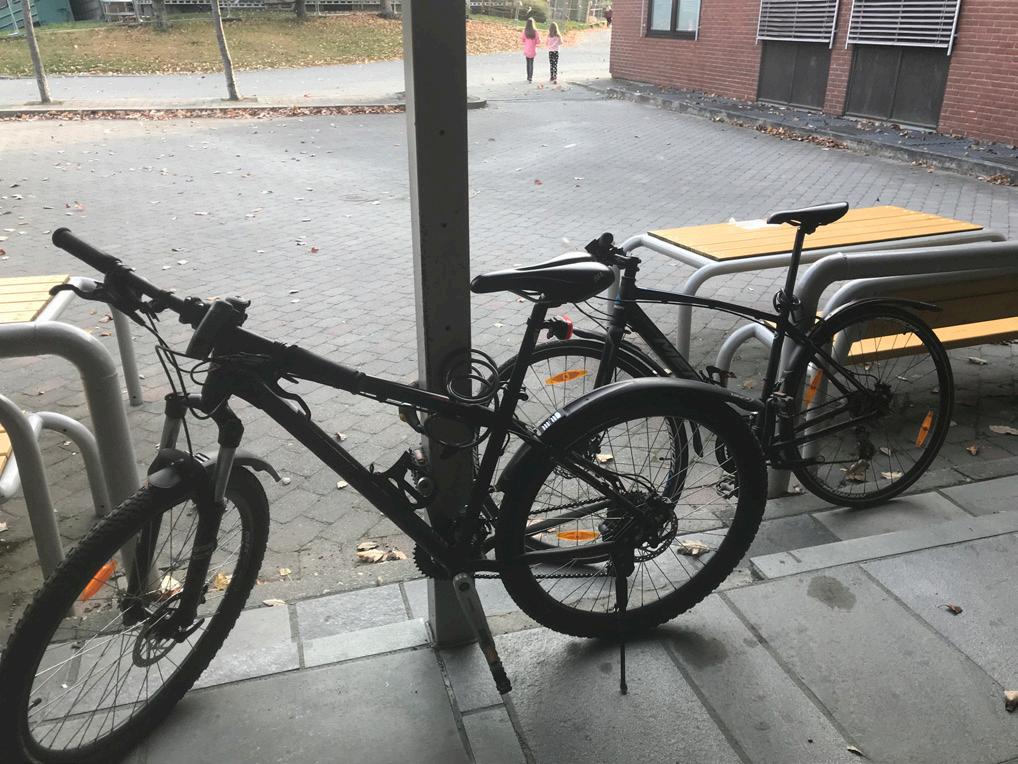
hough the bikers highly use the area, there is no proper designated space for bike parking (One located at the opposite corner of the area is rare ly used). Some people park their bike in the tree, other in the metal frame, posts as in figure (72), while some just leave their bike unlocked.
The primary activities in the study area are,
Regular users in the park are students, customers, bikers, children, family and elder people. Students from the Moholt village are daily passers and locals often come to buy in the grocery store. Chil dren and youth come with their friend to buy from Pizzabakeren or Bunnpris and eat in the plaza. Some come with their family where one goes to buy in the shop and others wait outside to look after their children.
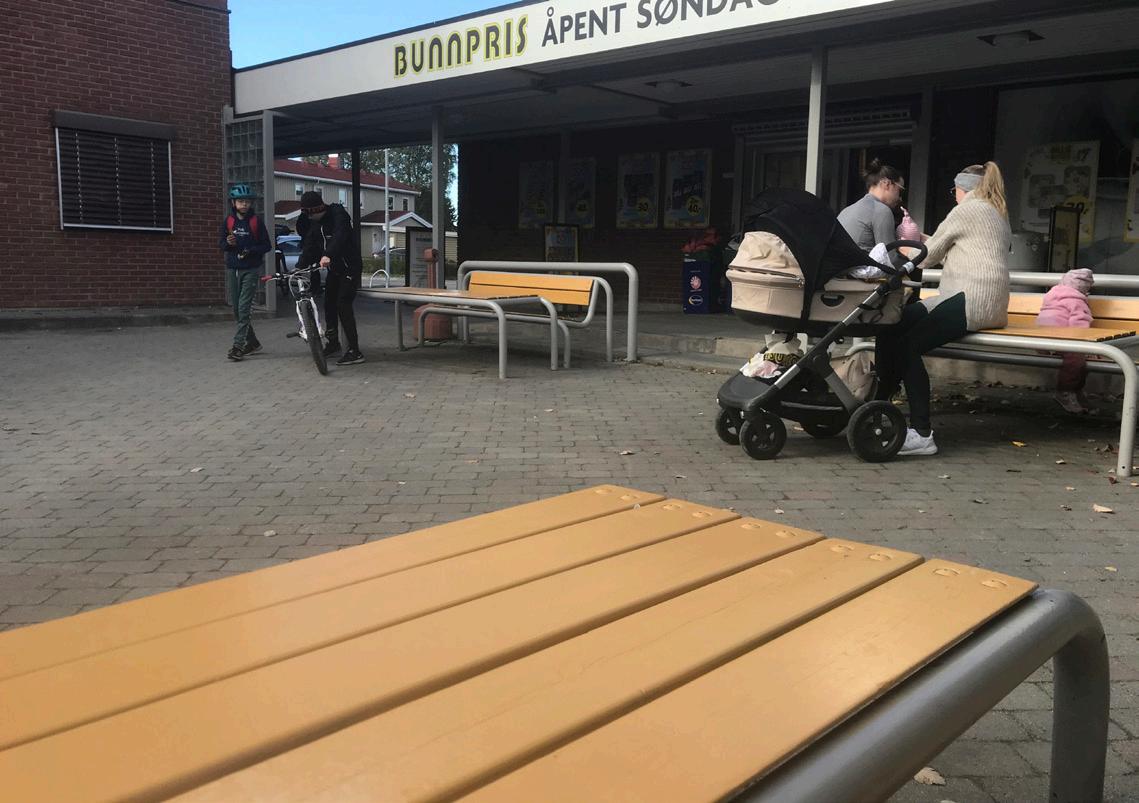

‘This dimension looks at peoples’ perception and how they feel, which can have a great impact on their wellbeing and the time they spend in a public space.’ (Habitat, 2020). The site has semi-open walkway connecting the two buildings which provide shade from sun and rain and a certain feeling of the enclosure as in fig (74). People are mostly attracted by the benches in the space fig (73). ‘I like benches in the space the most. I can buy from the Bunnpris, relax, eat and enjoy the sun,’ said one of the interviewees.
‘Well-designed public spaces with adequate green coverage and water management can have a great impact on air quality and reducing noise pollution as well as reducing heat and temperature.’(UN Habitat, 2020) . The site entirely has a hard surface with few trees on the south and no green space as in figure (74).
In the rainy day, the surface seems slippery, and some part is flooded with water, so many people escape or try to escape the route at that time. ‘The environment is very boring’, says one of the interviewees and other says ‘there are only dried leaves all the area, it will have been better if there were some green spaces around.’
The data gathered from online surveys, interviews and observations helped to identify the problems of the area. Many interviewed and surveyed people described the study area as a landmark, having good connectivity, and easy reference point to meet people. But at the present, they only use the space for activities in figure (75). The main reason for less involvement of people to the area is due to poor quality of space. Most of the people like benches in the space but complained of them being un comfortable. Except for a few trees, there is not much greenery in the area. The pavement is mediocre, and the bike parking is in an inappropriate location. This all makes the area unattractive and dead that does not invite the people to spend quality of time in the plaza.
Passing through
Commercial
Figure 75: Major activities of people in the space (from online surveys and interviews)
The other issue found from the online survey and observation is excessive parking lots in the area. As mentioned in situation analysis, the area has three parking lots at present which has made the area underused and aesthetically unpleasant. Among all, the parking on the northwest side of the square figure (76) is located at the front of the building on the main entrance. This is the common and integrating space for the Moholt and local communities. One of the users of the space is children who often cross the path by walking or cycling. But lack of designated space for the pedestri an and cyclist has made the area unsafe for them. The car occupying the maximum area has made this space dead with no greens in the area. The space is often vacant, usually during the weekend figure (77). The lack of zebra crossing within the vicinity has made it more unsafe for people.


The last stage of the fieldwork was prepar ing the intervention for the problems based on the observations, interviews, and online surveys. The plaza is proposed to design as a meeting space for the people of Mo holt Student village and local residents of the site.
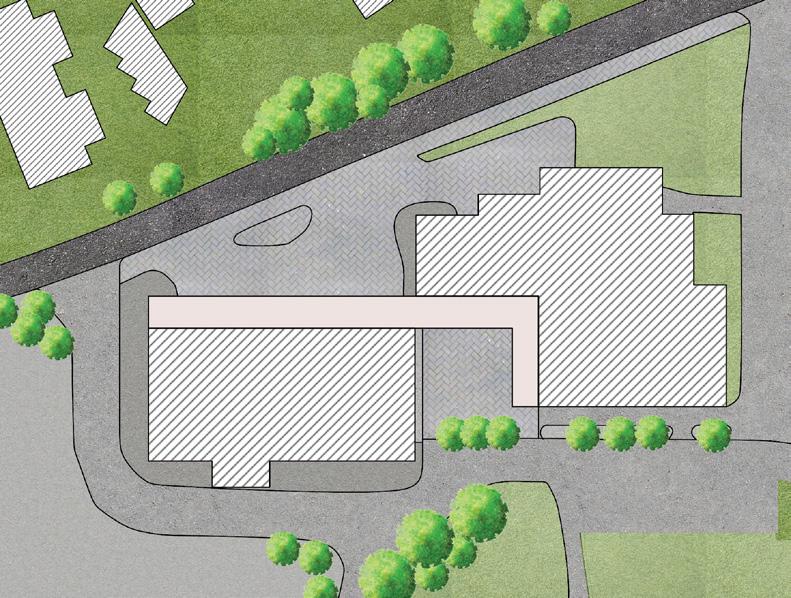
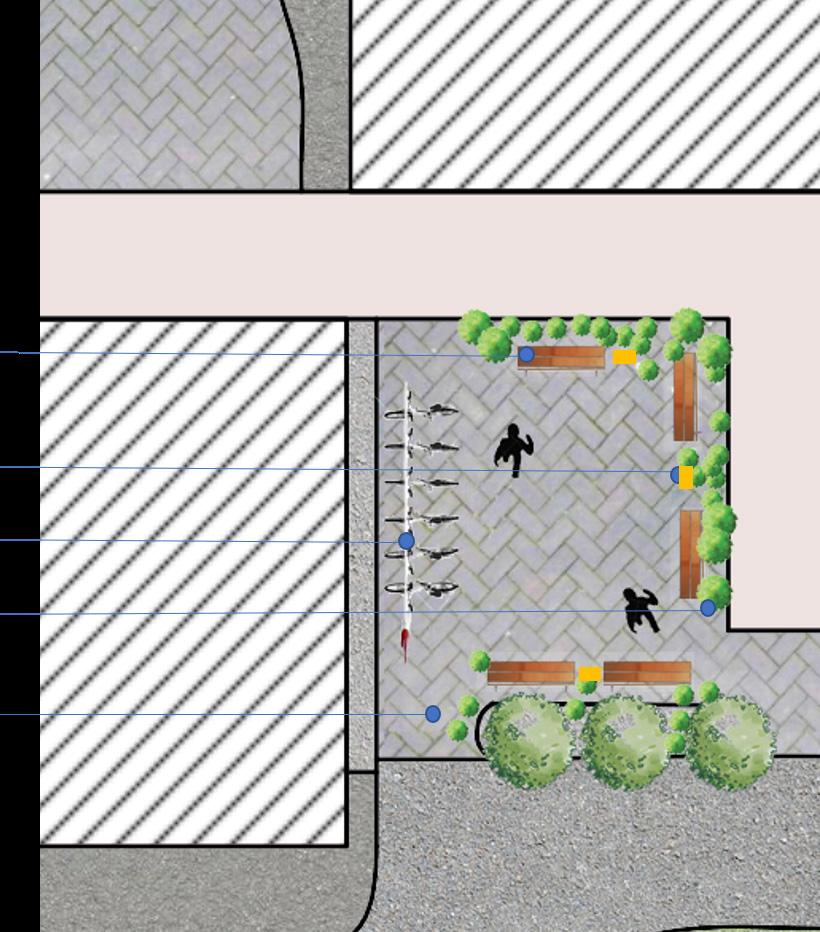
The plaza recently has been used main ly for commercial activities and necessary actions. Many respondents from the online survey said that the space is in a promi nent location, that makes it more accessible for people to gather and meet but it lacks social activities at the moment. Hence, the short-term proposal includes the improve ment of the quality of plaza to make it more attractive that invite people to share time.
Bike parking
Adding green
Improving the pavement
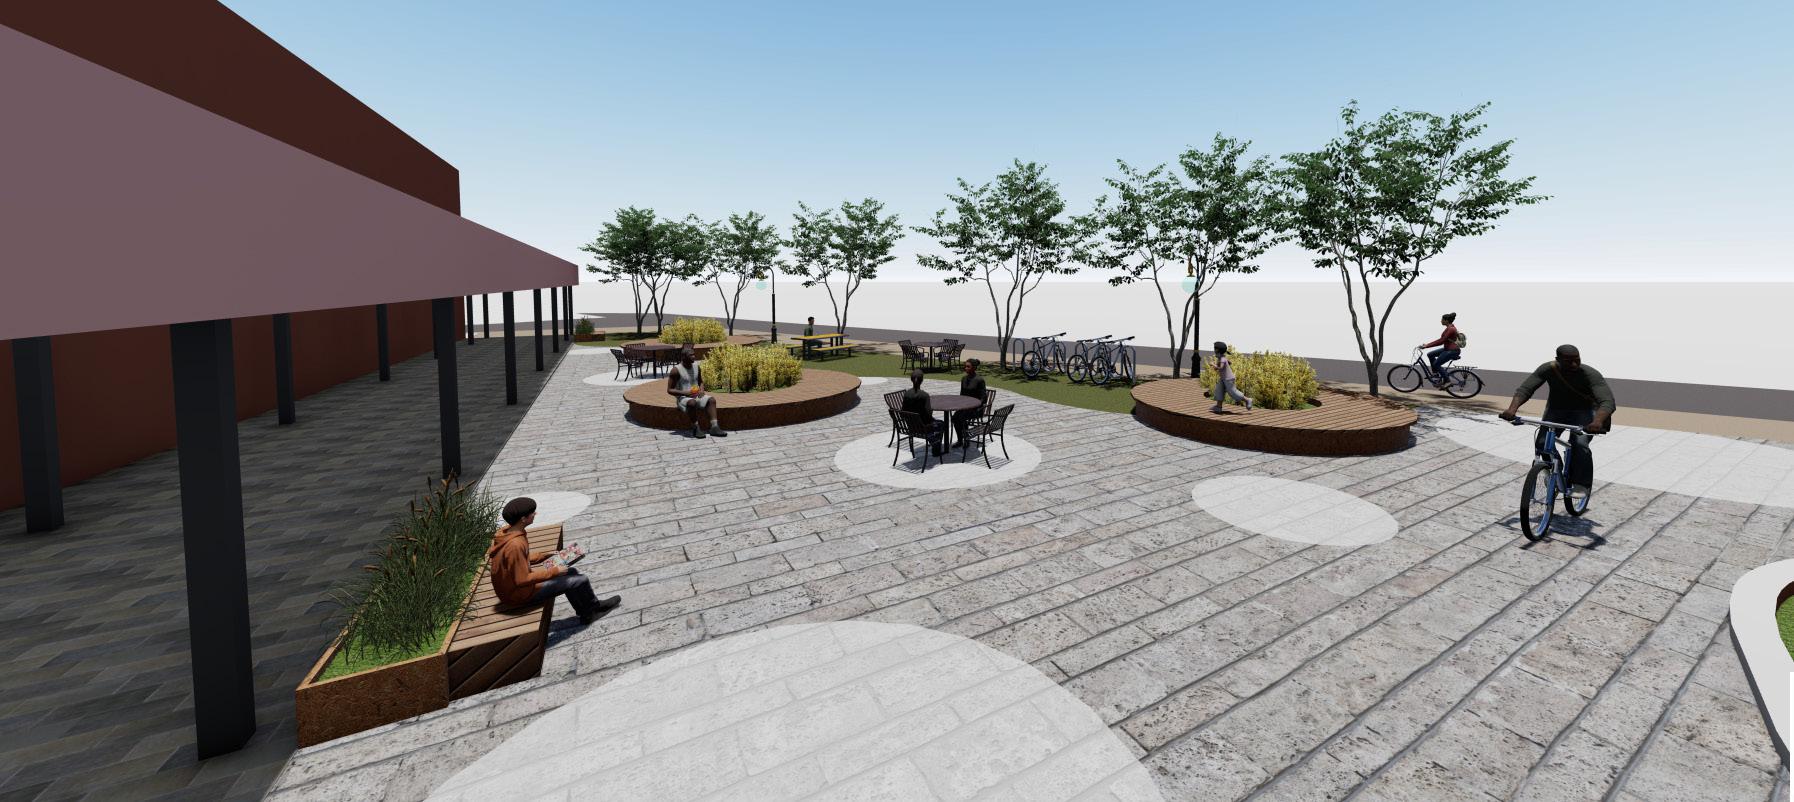
The figure (78) illustrates the conceptual plan showing different elements that can be introduced in the space to make it more attractive. It is observed that many users find difficulty in parking their bikes as the space does not have any designed space for bike parking, for which the bike parking was proposed in the area. The positive comments by people about the square was seating spaces. So, adding multi-level seating spaces provide a resting place for women, family and older people and play for children. The en vironment is viewed as a dull and boring space. To improve the interaction of people with the space, adding greener in the space and improving the pavement.
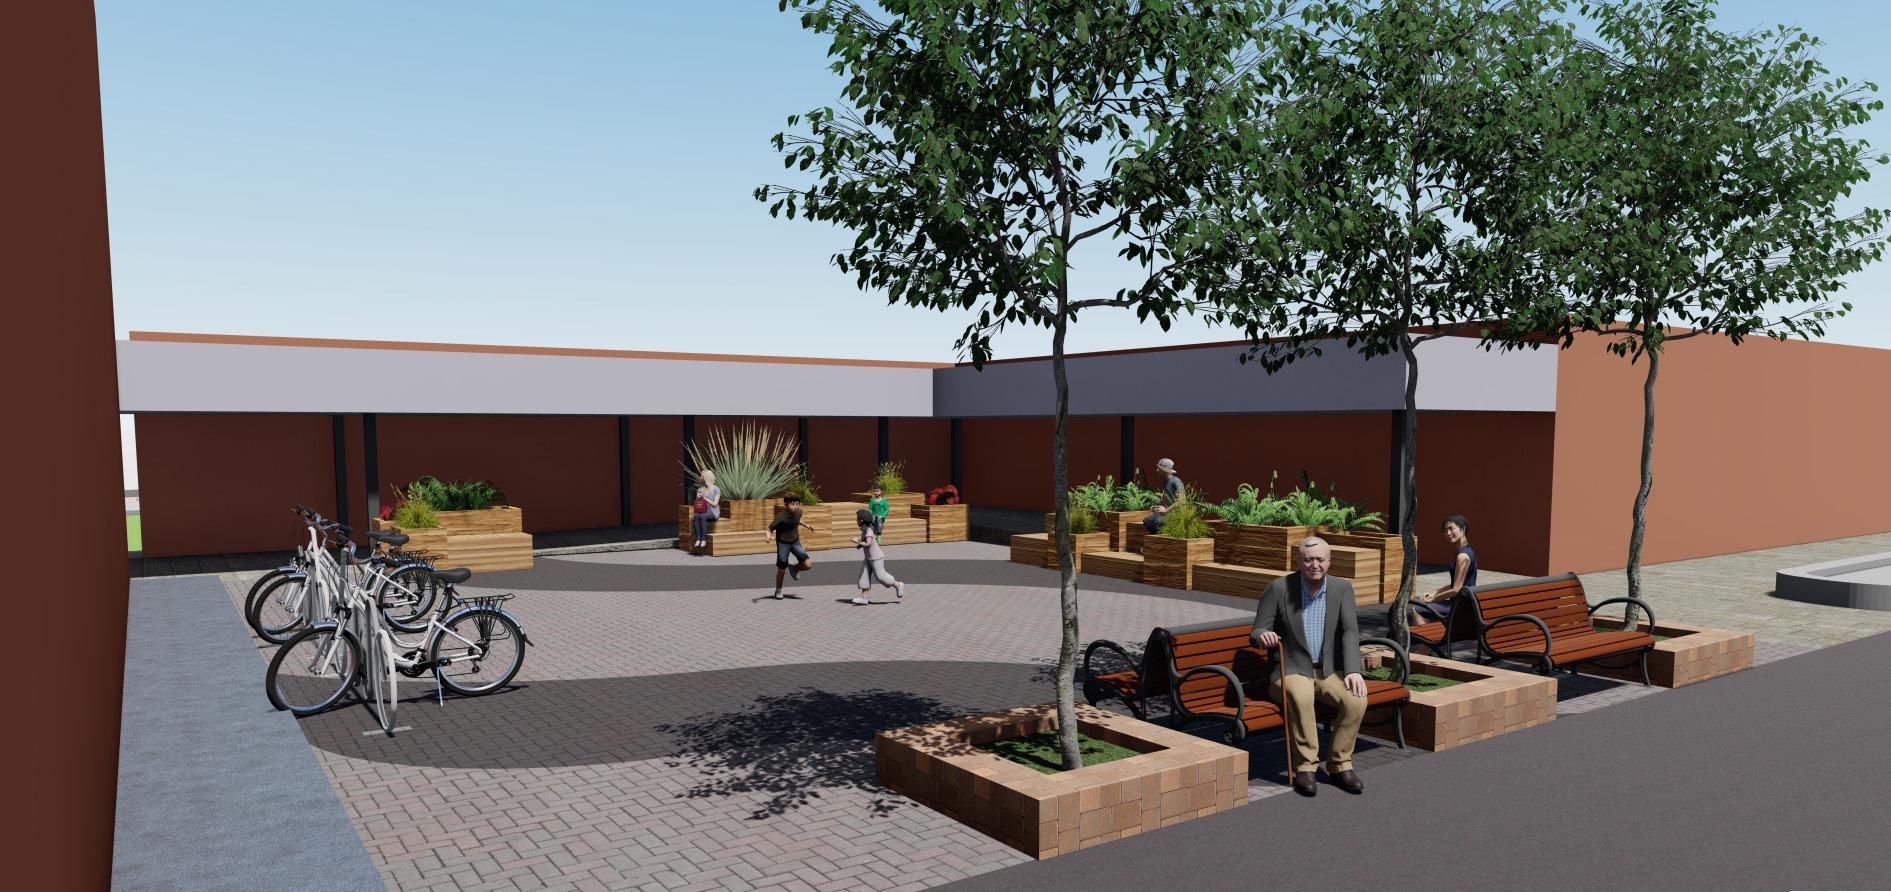
The recent pandemic has made us focus more on creating resilient and flexible public space. So, the centre of the square is left vacant and unstructured for multipurpose activ ities such as a small cultural programme, existing market, an extension for the community health centre, etc. It not only allows flexibility but does not disturb the existing people’s movement in the space.

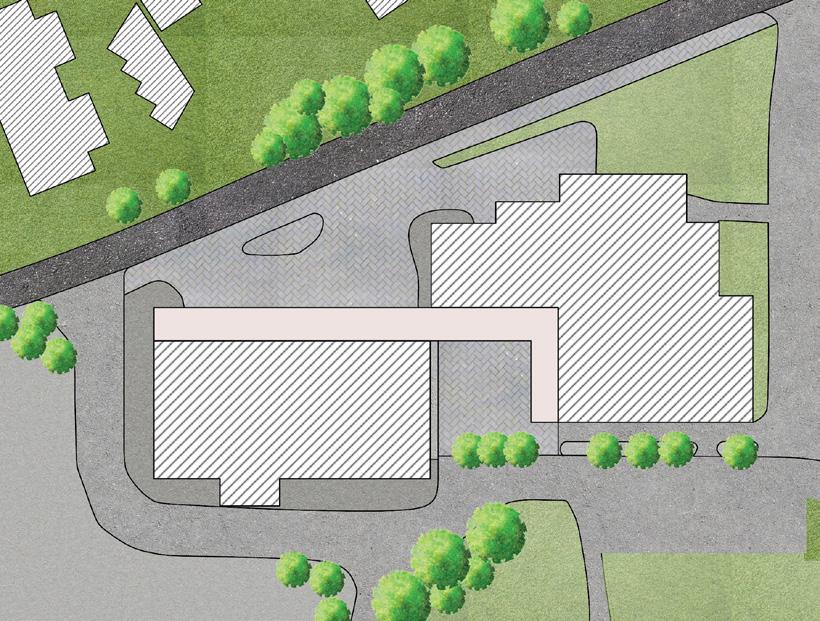
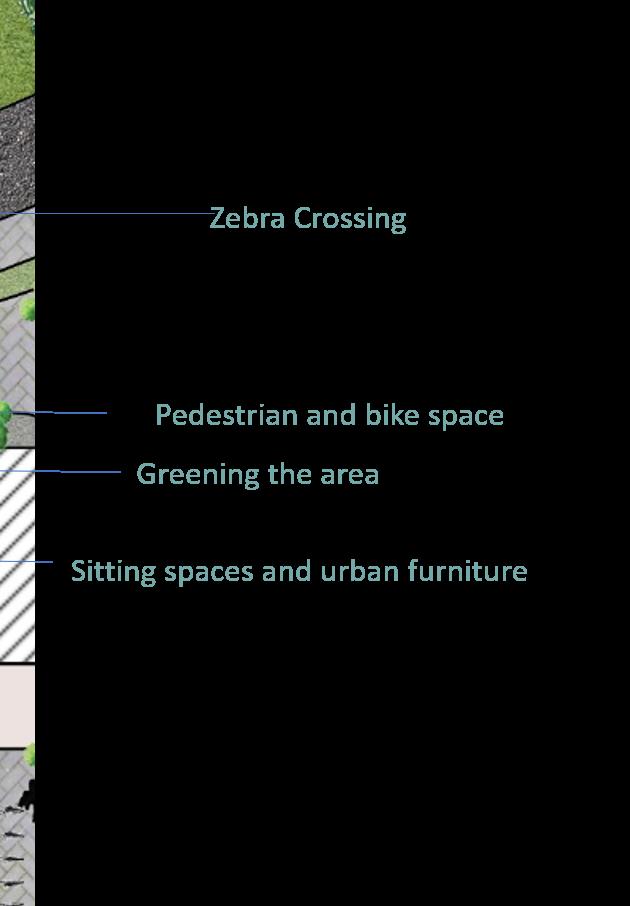
The area is surrounded by surface car parking on its three sides and thus, creating an un safe environment, especially for the children for walking and cycling. So for long term in tervention, converting the north parking lot which lies on the entrance to the plaza into community space is proposed that prior itized the public realm over cars. The park ing lot now has remained unused most of the time and covered a large area (but only fits nine vehicles at a time). Creating community space in the parking lot, integrate the two or more communities (Moholt students and local residents) in the single area reducing the gap between different genders, age and cultures. The more number of people can engage in the public space with facilitating them for safe walking, cycling and children playing.
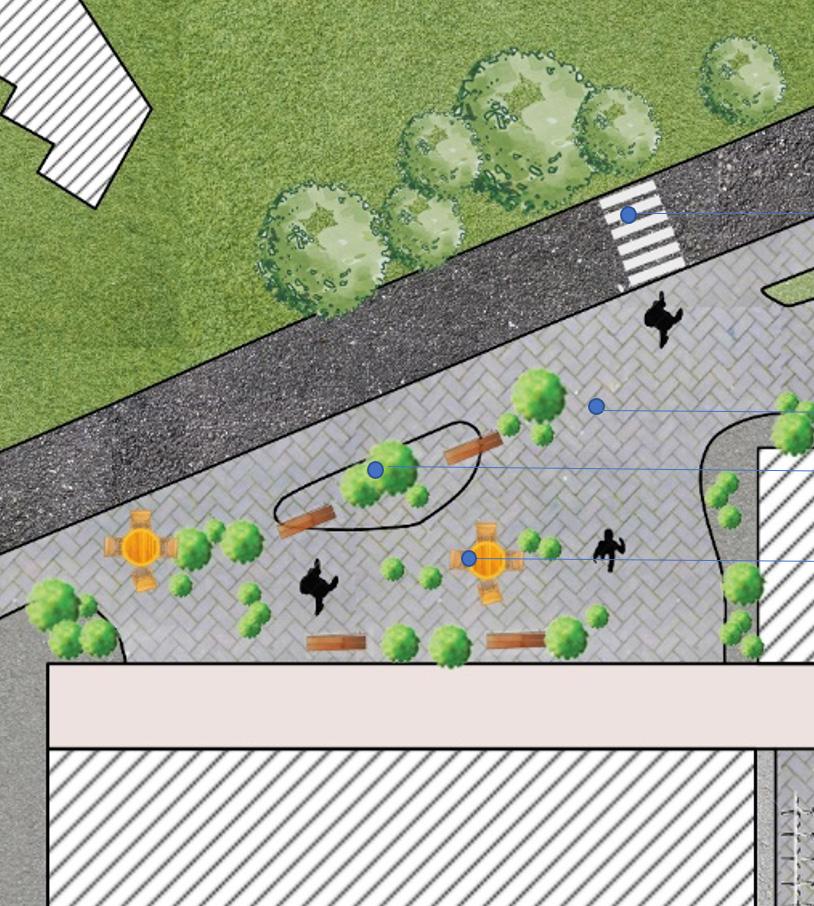
The figure (80) shows the conceptual plan of place making the dead parking lot into space for the commu nity. The proposal includes the mix-use activities, seat ing spaces, green environment that is accessible for all the users. The area shall also reduce the overcrowding of the small square, thus allowing more people to inter act in the space
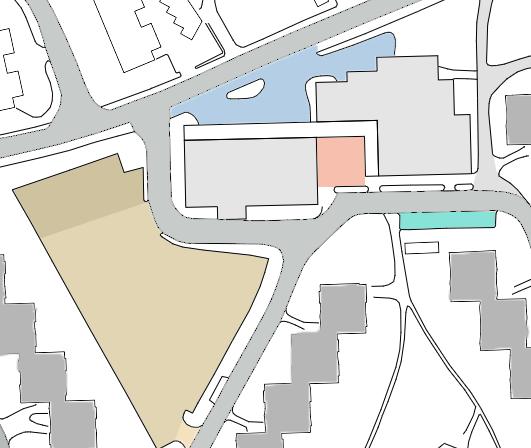
Shared parking spaces for the Moholt students, customers, and visitors to the area. ‘Shared parking is a land use/development strategy that optimizes parking capac ity by allowing complementary land uses to share spaces, rather than producing separate spaces for separate uses’(Shared Parking, 2014). The community parking covers approx. 2500 m2 of the area which is providing parking services to the Moholt village residents. for the intervention to implement, for the Moholt residents can register their parking space along with the hour they will need it. When the space is free, the customers and visitors can use the area on free or by paying per hour during peak hours.
convert parking into public space
Shared parking space Parking for Customers of Bunnpris and Pizzabakeren
Figure 82: Non- spatial Intervention for parking issue (Map Source: Trondheim Kommune edited by researcher)
The study site is an interesting area surrounded by groceries stores, community health centre and community parking. The method of studying the area by gath ering the information first, and then using other various methods to analyze the space is a good technique for the better understanding of the area. Proposing a green space with vegetation, benches and well placed bike parking for a short term intervention and then replacing the underutilized car parking with a commu nity space is a smart move to enhancing urban design. I think that the pedestrian friendly design is a sensible approach for providing high-quality spaces for pedestrians and bicyclists in the unsafe environment. Hence, I found that the design intervention not only improves the safety of the pedestrian but also makes the space livable, efficient and productive.
Reflectction By Suzie
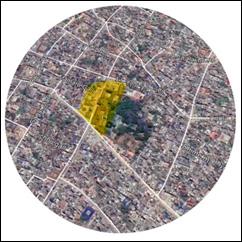
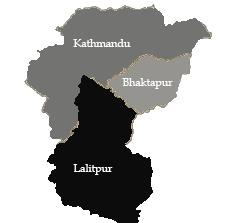
Kathmandu is the capital and the largest city of Nepal which is situated 1,425 meters above sea level and has a population of around one million (Kathmandu Popu lation 2020, 2020). Kathmandu is divided into three districts Kathmandu, Bhaktapur, and Lalitpur (fig 84).
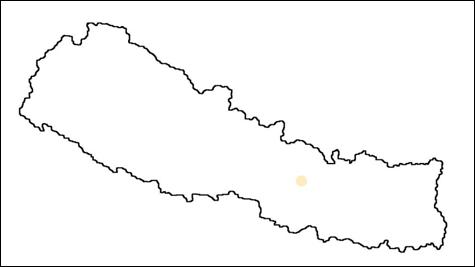
Around eight kilometers to the south of the Kath mandu valley on a plateau across the Bagmati River lies Lalitpur also known as Patan. It covers an area of 350 sq. Km has a population of 468,132 among which 51.5% are male and 48.5% are female (Lalitpur (District, Nepal)-Population Statics, Charts, Map and Location, 2020) . A significant portion of its population is en gaged in various trades, especially in cotton industries and traditional handicrafts.
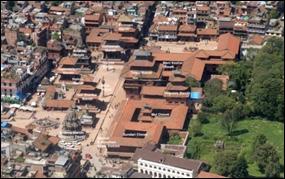
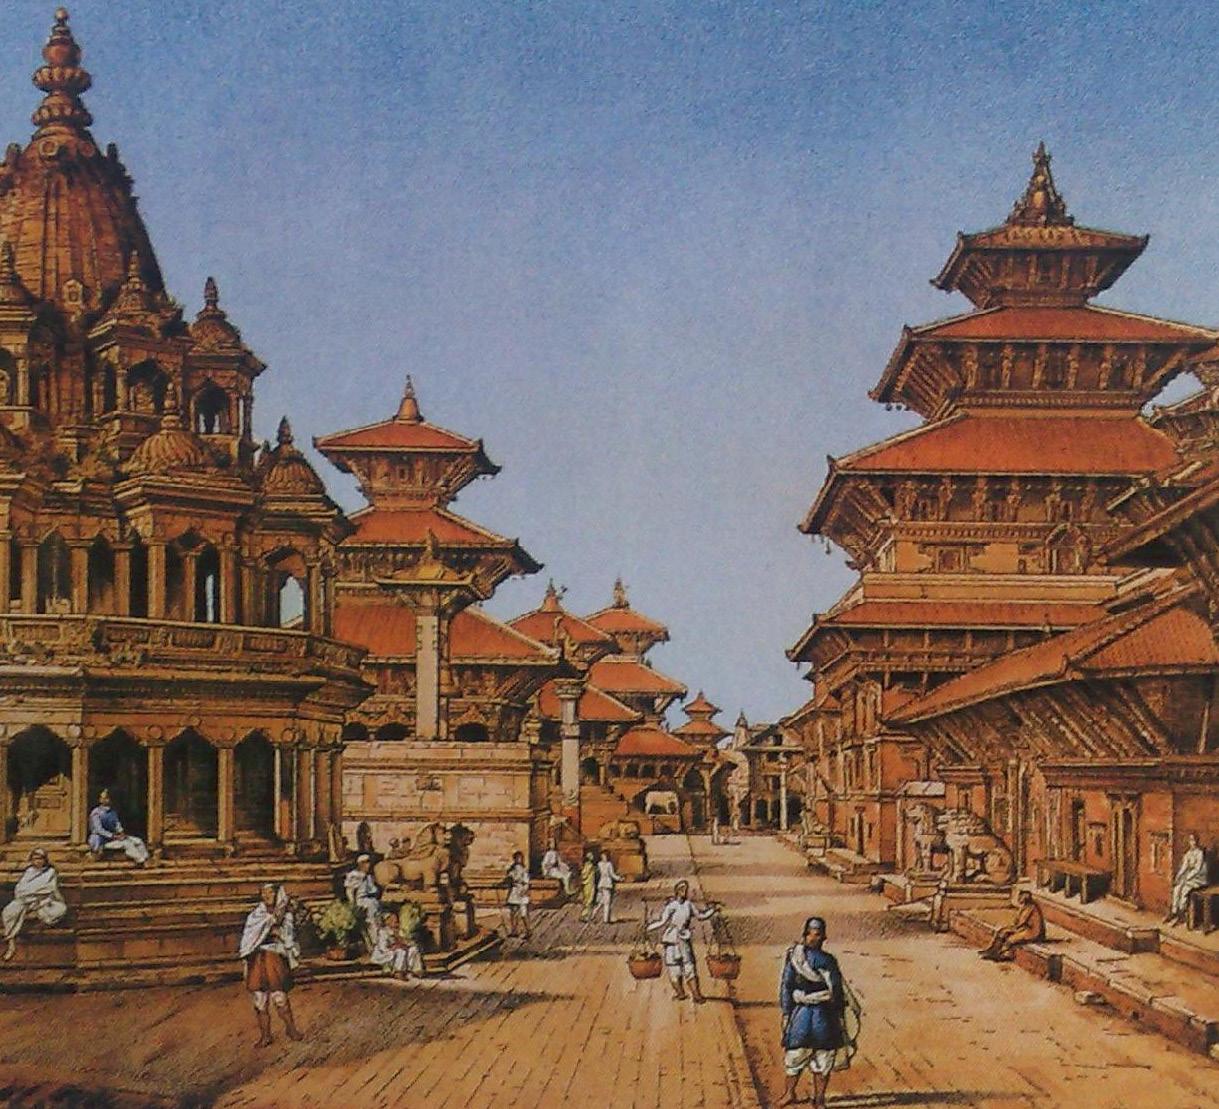
The study site “Patan Durbar Square” is situated in the heart of Lalitpur district which is one of the oldest cit ies of Nepal (Patan darbar square, 2020). It is the most important monumental center of the city that has been recognized by UNESCO as a World Heritage Site. The square is the major tourist attraction and landmark of the area.
It is an ancient royal palace which consists of temples, a fountain, open courtyards, a museum, a water spout, and many more. The square also houses excellent cafes and restaurants, parking, a tourist information center, a school around it. Unique craftsmanship, exquisite cravings, and beautiful display of ancient Newari architecture are found in different structures of the square, interlocking art, and religion which express both Hindu and Buddhist iconography. Rationale behind the selected site:

Patan is one of the oldest cities of Nepal which has historical importance. The people residing in the area are the original inhabitants of the Kathmandu valley known as Newars whose cul ture, tradition, and built environment are quite different from other groups of Nepal.

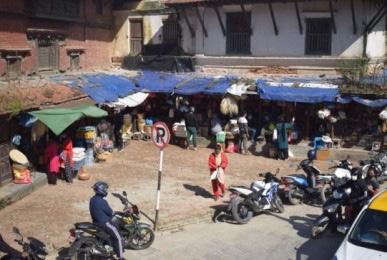
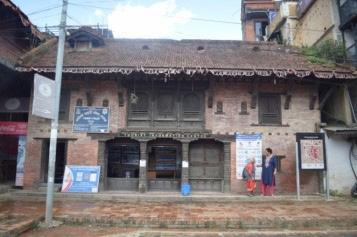
The square is a meeting spot for people. Peo ple from different age groups visit the square. However, there are some problems in the area related to the characteristics of public space that needs investigation and consideration. Thus, the area is chosen for the fieldwork.
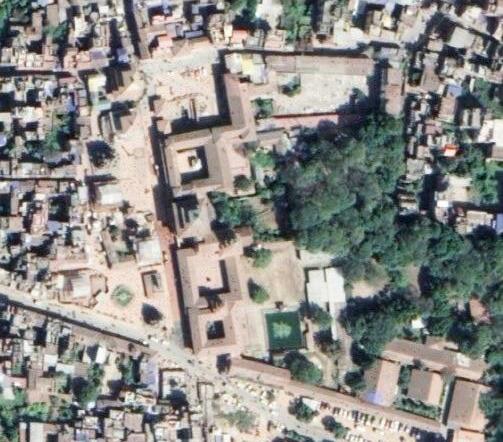
Patan was founded during the third century BC by the Kirat dynasty and was later expanded in the sixth century (Art and culture). The location of Patan Durbar Square lies at an ancient cross road. Most of the current architecture is from the 17th century (Traditional Arts).
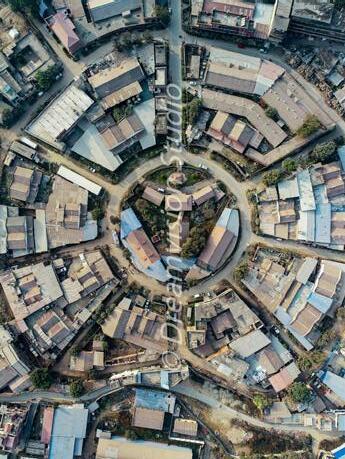
Figure 91: History line (Chitrakar, R., 2006
Building Height was less than three storey
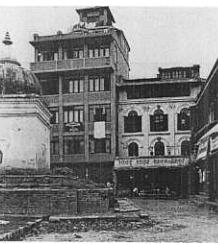
1963
Establishment of Patan Industrial Estate
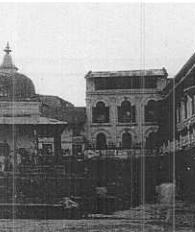
1968 1978
People started adding the story in their residential building to accomodate large families and improve the living condition
History
2006
The square was constructed by the religious devotions of the kings, queens, princes, princesses, and ministers to satisfy the gods (Traditional Arts). After the damage of the structures in the square, they were reconstructed in the fashion of that time.
Figure 94: History line (Source: Patan Museum)
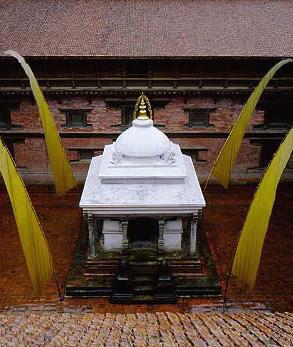
Figure 95: History line (Source: Upadhya R., 2015)
Patan Durbar
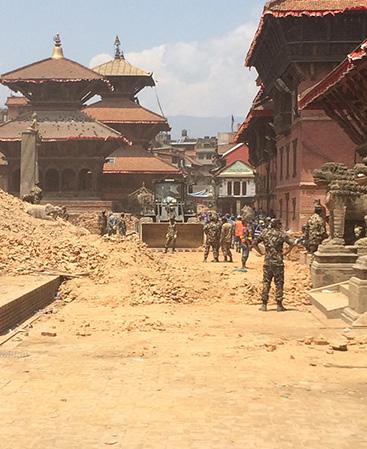
inaugurated and opened to public
Square was completely devastated in 7.7 magitude Earthquake.
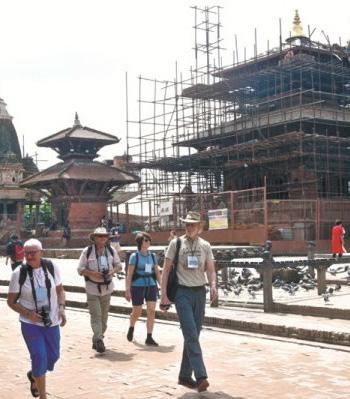
Renovation work going on
Figure 96: History line (Source: Kafle L., 2019)
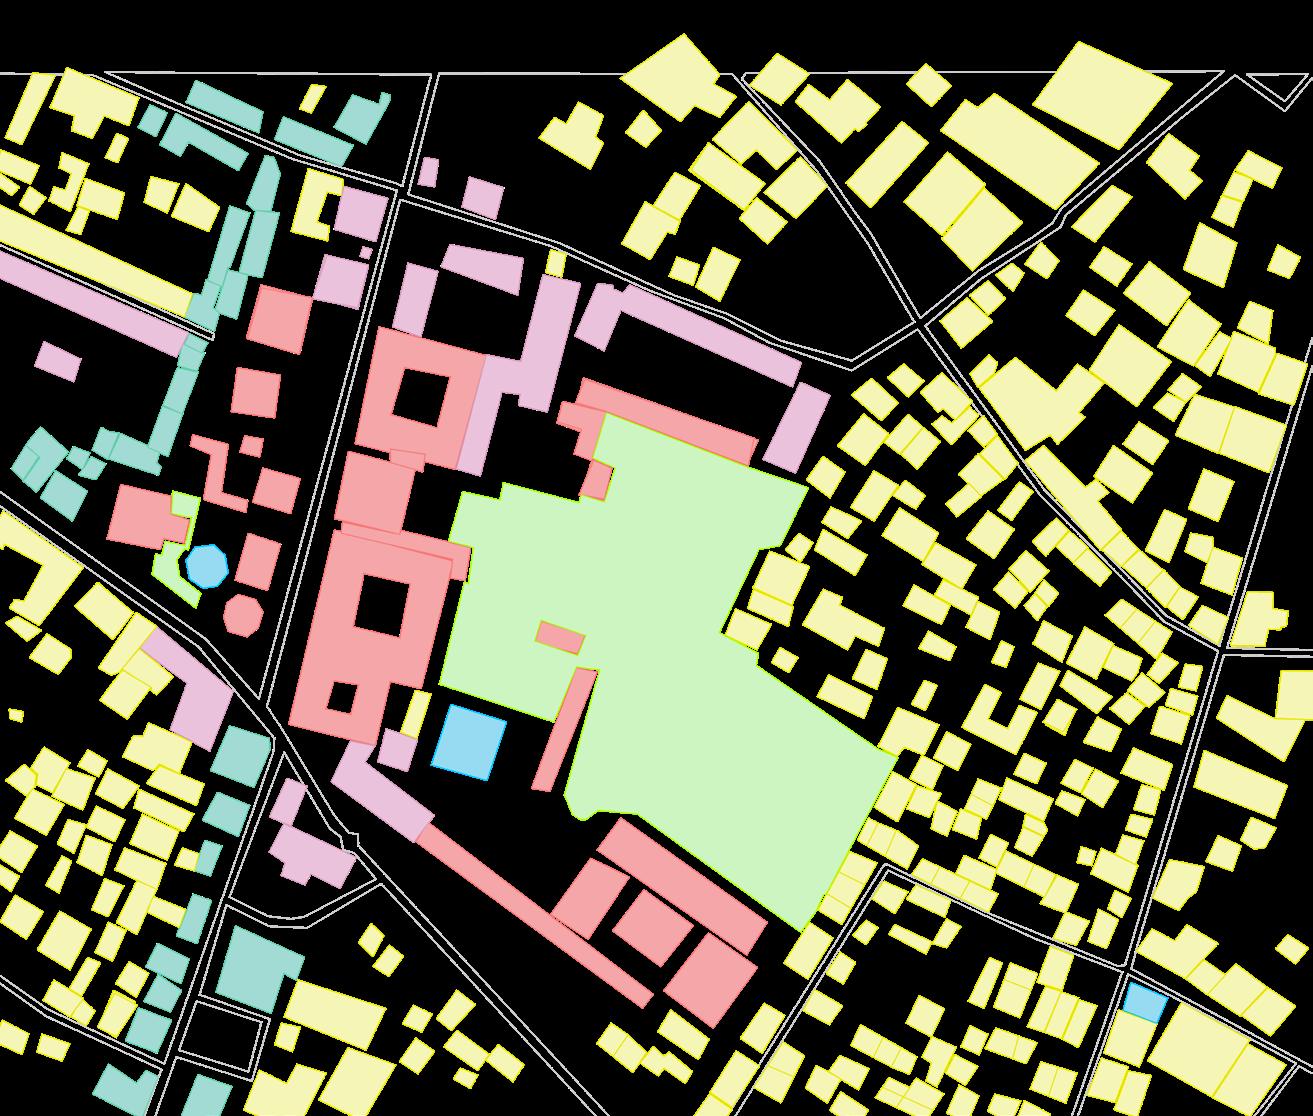
Patan Durbar Square is a public area which is surrounded by residential buildings but the street front residential buildings along the square are used for commercial purposes. However, some of the residences have mixed uses of land where the ground floor is used for commercial purpose and the rest of the floors is used for residential purpose. The site also consists of a institutional building. The higher caste people immediately surround the square whereas in the periphery reside the lower caste. The study area spreads over approximately 5933 Sq. M.

The methods that are used in the fieldwork are according to the changing regulations due to the Covid-19 situation in the Kathmandu valley. Both qualitative and quantitative aspects were inves tigated.
During the initial phase of fieldwork, the city was under lockdown so it was not easy to visit the site frequently. However, the study site was visited three times a day (morning, afternoon, and evening) on weekends and weekdays to observe the environment of the area without consult ing the people. A system of direct obser vation was used, to evaluate the physi cal activity level (sedentary, walking, and vigorous) and user characteristics (gender and age group). In the same way, the pat tern of the routes followed by the users was observed.
Transect walks were conducted especially early in the morning on the roads and paths to meet up the local trash pickers and infor mal vendors. Similarly, observations were done while walking, and questions were asked to the related person. The observations were also captured in the form of drawings, photos, videos, and notes. The observation helped in providing basic questions for the interview.
With the ease in the Covid-19 regulations, interviews were taken while maintaining social distancing. Firstly, the local people and the visitors in the square were informally interviewed in which the questionnaire was not prepared. Then, different stakeholders were interviewed through which some insights about the problems of the area were gained. Finally, a formal interview was conducted in which a set of questionnaires was prepared for the interview with the deputy mayor and engineers of the local municipality as well as the museum officer. Through the interview, I found out about the different ongoing as well as future projects in the area. Fur thermore, due to thte increasing number of Covid-19 cases in the valley, phone interviews were frequently conducted.
After the increasing number of Covid-19 cases, the government implemented the second lockdown in the valley with even strict regulation for circulation. So I had to limit myself for the online survey. A list of grading questionnaires with certain points and scale grading from 1 to 5 were prepared. These questions were forwarded through various social media to different people who visited the square. This method helped to find out the major problems in the area.
Figure 98: Power-Intrest diagram (Source: Author)

Different stakeholders of the study area were identified. A stakeholders mapping was done to analyze the power and interest of the stakeholders who affect or are affect ed by the outcomes.
The structures of the square are made up of local materials such as timber, jhingati tiles (oldest type of roofing tiles), stone, and brick (fig 99). The prominent built structures, especially the tem ples, have an imposing mass that quite often comes out of the urban skyline to dominate the entire city (Chitrakar, 2006). A landmark is thus created which not only offers a place with visual excite ment but also makes it more legible (Chitrakar, 2006). Some of the most magnificent structures are located in the square in the form of temples.
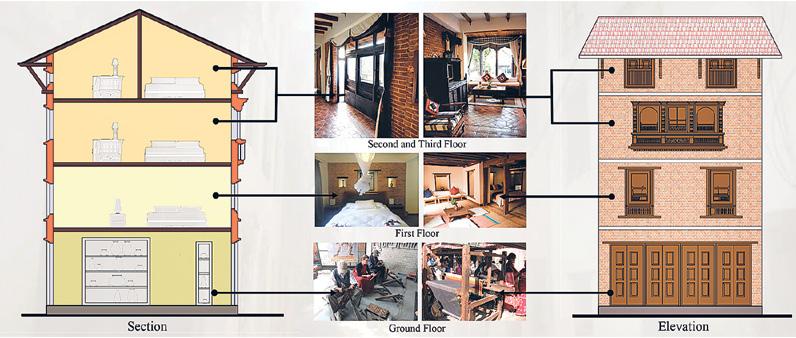
The houses near the square are three or more sto rey typical Newari houses that have a common courtyard (fig 100). These houses were built with bricks, timber, mud mortar and consists of a single room on each floor (fig 101). The houses are en tered by a small passage that leads to the court yard which is surrounded by the other houses. So this courtyard is used by the residents for the feast, as a playground, meeting spot, and many more. The low rise built structures of residential and other public buildings are human in scale and proportionate to the urban spaces they create (Chitrakar, 2006).
Figure 100: Newari house with courtyard (Source: Gautam S.,2018) (Gautam S., 2018)
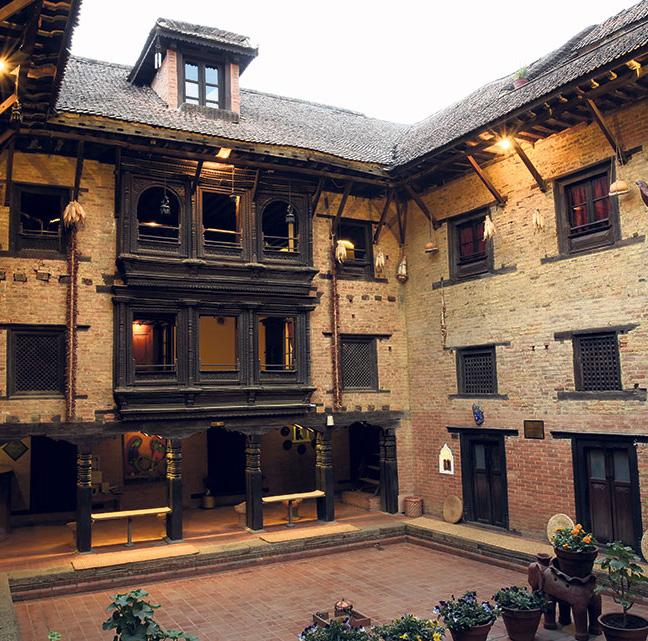
Figure 101: typical newari house (Source: Shilpakar, A., 2016)
The main entry road (Mangal bazar road) is connected to the ring road in the east and Pulchowk marg (road) in the west (fig 102) The ring road and Pulchowk marg is within 800m distance from the square. The site is accessible for all the users; bike, car, and pedestrian.
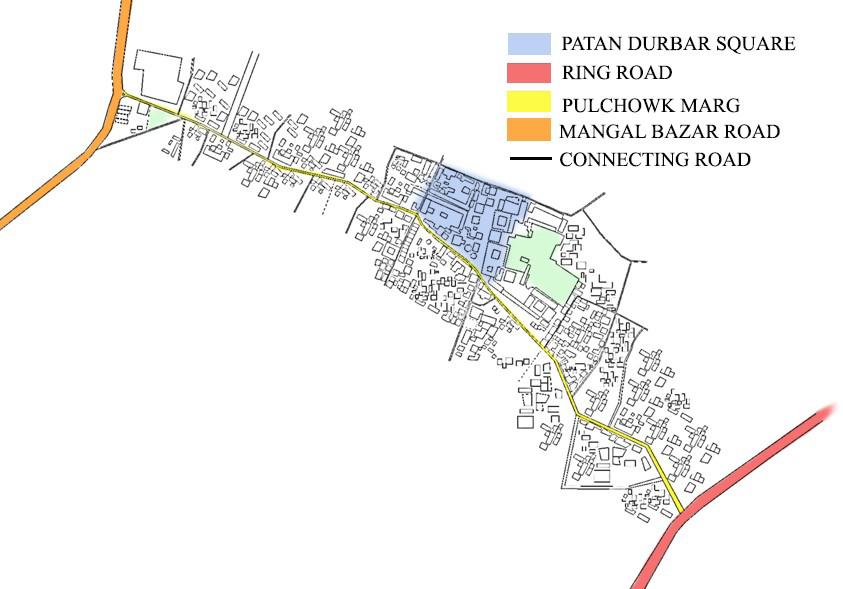
Figure 102: Road accessibility in Patan Durbar Square (Source: Google map edited by Author)
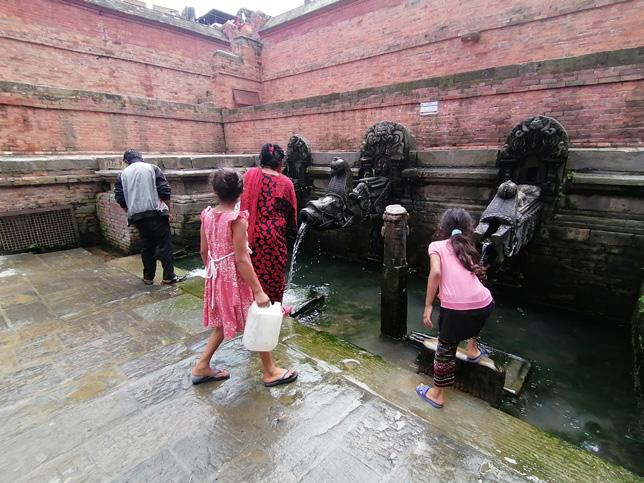
A water spout is also present in the square where water is avail able except for the drier season (fig 103). Most of the people in the area use tap water. In the same way, there is a presence of a well (an excavation created in the ground to access water) in different households. The electricity in the area is provided by the Nepal Electricity Authority.
Figure 103: Water spout in Patan Durbar Square (Source: Author)
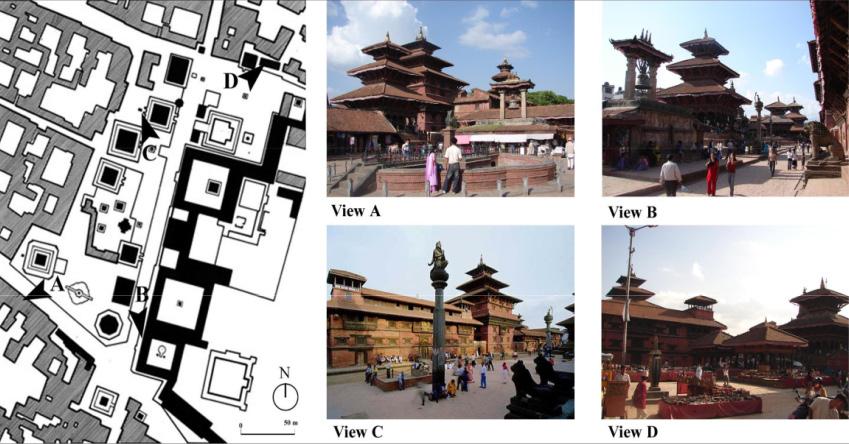
The planning of the durbar square is formal and geo metric (Tiwari, 1988). However, the spaces within the square are irregular in shape which is in strong contrast with the built structures which are strictly regular with symmetry in both plan and elevation (Chitrakar, 2006).
The layout of the square is such that the main street is stretched along the north-south direction with tem ples and royal palace placed on either side (fig 104). A richly decorated series of palace buildings and royal temples form a straight edge on the eastern part of the square (fig 105). Located on the western side of the street are loosely and informally placed temples facing the palace buildings and the elevated platforms where different festivals are conducted (Chitrakar, 2006).
Figure 104: Spatial analysis of Patan Durbar Square (Source: Chitrakar R., 2006)
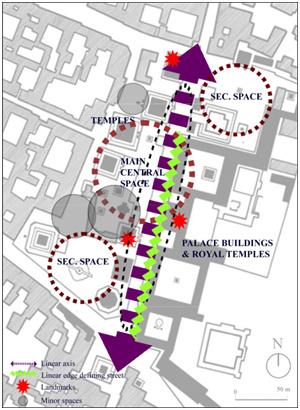
Various sized pockets of open spaces or courtyards can be seen in the square. The largest space (court yard) in the middle of the square is the most signifi cant pocket, both physically and culturally (Chitrakar, 2006). The other two secondary spaces in the northeast (existing parking) and south-west directions are transitional to the main space (fig 104).
Figure 105: Elevation of eastern side of Patan Durbar Square (Source: Patan Museum Report)

The study area is a public space that has lots of people and activities. People, especially the local elderly visit the square every day. The square is like a meeting spot for them. People of different age groups whether it be small children playing in the open court to the youngsters sipping coffee and elderly gossiping with their friends, all types of people can be found in the square. The square is always full of people and different activ ities are going on regard less of the time of the day. There are many formal and informal vendors present in the square. But due to the Covid-19, the density of people has decreased in the square.
A tourist information center present in the square (fig.106) This center is specially pro vided for the local and international tourists visiting the square. Few policemen are pres ent in the center who investigates the crime and problems of tourists.
Figure 106: Tourist information center (Source: Author)
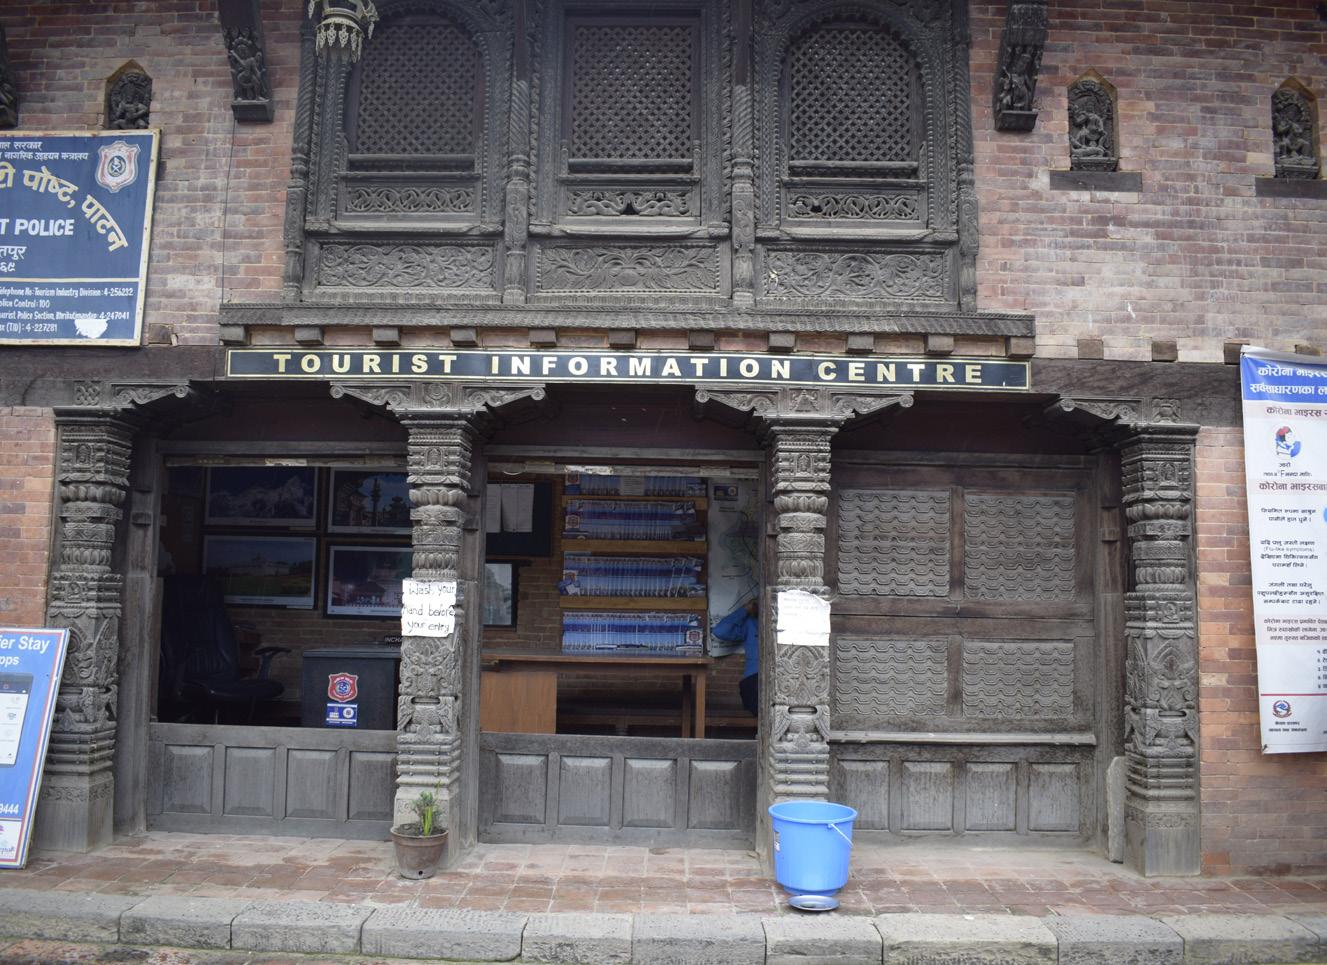
Historically, the area was organized by the caste system, social stratification, and occupation creating distinct and separate communities. Hence, the square which is an ancient royal palace is immediately surrounded by families of higher caste group and the land value of the surroundings is high (Chitrakar, 2006)
The museum inside the durbar square promotes tourism through its excellent collections of Nepalese cultures, met alwork, history, art, the architecture supports local busi nesses and helps local communities to revive old and lost traditions. The local craftsmen and artists benefit from the museum because it is providing exposure through quali ty displays. Besides, it is educating students, tourists, and visitors and has become a matter of pride to local com munities.

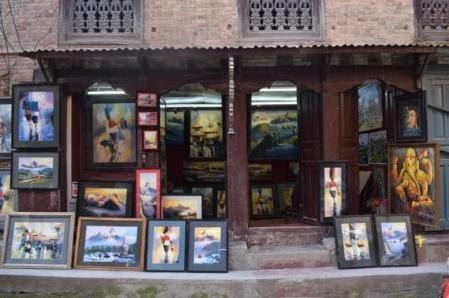 Figure 107: A painting shop near Patan Durbar Square (Source: Author)
Figure 108 : Patan Durbar Square (Source: Patan Durbar Square)
Considering all the facts which were found out after the interviews, survey, and observations, several issues were discovered in the area. Below are some of the problems identified after acting in the fieldwork.
Based on an interview with the local people, there is a scarcity of water in the area. The locals de pend on the wells or nearby water spout for the water. However, some of these sources of water dry in the drier seasons so the people in the area buy water from the water tanks.
Parking is another problem in the area, es pecially for four-wheelers. There is no space separated for parking for four-wheelers. Due to the insufficient parking space in the area, people are often seen parking on the roadside.

The existing old drainage system does not have the capacity for the rapidly growing population. Unmanaged drainage and overflowing sewage are the major problems faced by the people in this area. According to a local resident, during the monsoon season, the streets near the square get flooded with knee-deep water (Locals of Patan worried about sewage backflow during mon soon, 2020). The locals are facing traffic snarls due to the unmanaged sewage drains and water clogged streets.


Patan, a traditional town was never planned to ac commodate motorized vehicles. The narrow street is insufficient for the rapid population growth which causes traffic congestion, increased travel time, increased accidents, and pollution. The narrow road consists of potholes. According to the shopkeepers in the square, the amount of dust that enters the shop has increased so much that they must clean their shops every hour and must always cover their face while they remain in their shops. The visitors as well as the locals face difficulties while visiting the durbar square due to the traffic congestion. Based on an interview with a tourist guide, the tourist gets irritated and frustrat ed due to the traffic, noise and air pollution. Similar ly, the polluted air also damages the structures of the square. Some of the causes of the traffic con gestion are the Absence of coordination between government agencies, limited road space, lack of pedestrian-friendly roads, unsystematic and inade quate parking system, and ineffective punishment.

Based on the feedback and information collected through research with different stakeholders, traffic congestion is the major problem in the area. This proposal focuses on reducing traffic con gestion through spatial and non-spatial intervention.
Spatial Intervention
People are often seen parking on the road side due to the lack of parking space which cause the traffic congestion in the area. A parking space is proposed near the square to mitigate the traffic congestion in Patan Durbar Square.
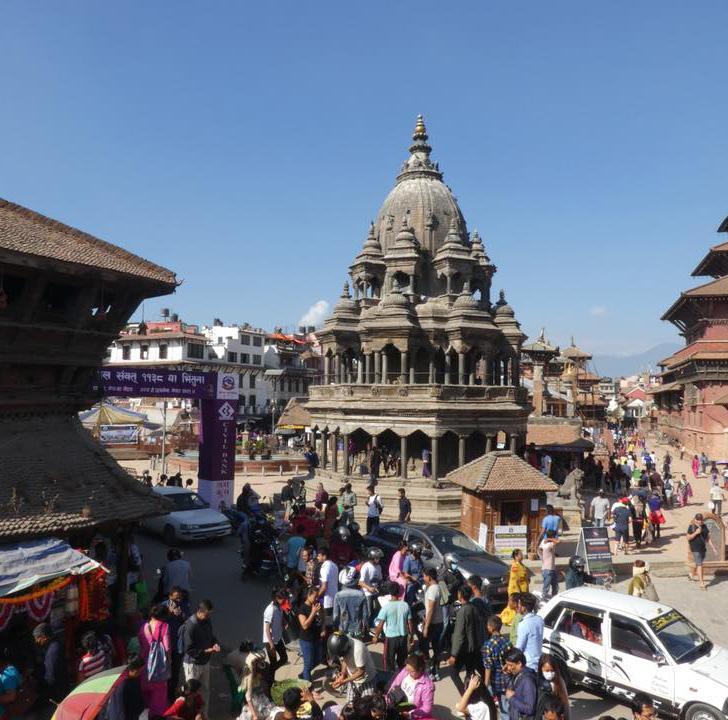
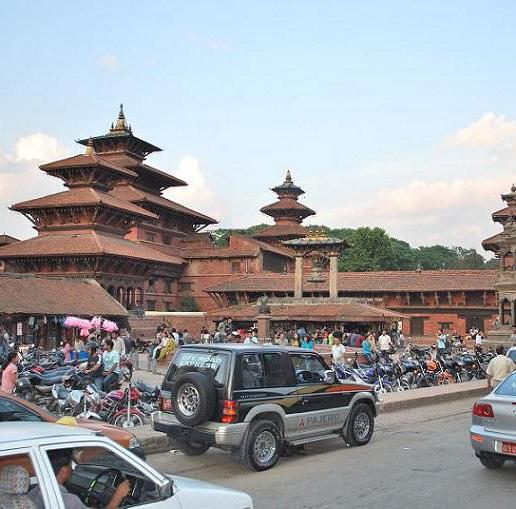
Change in the traffic policy by designing alternative routes for four-wheeler helps to reduce the traffic in the narrow road.
If the movements of vehicles are restricted in the area ex cept for the two-wheelers, the traffic congestion would be minimized at a significant amount. Since the road is nar row, the four-wheelers are difficult to pass through. Thus, for the four-wheelers, an alternative route is proposed (fig 116). And the road is accessible only for the two-wheelers. However, the large vehicles or the four-wheelers will be made accessible during a certain period which is before 8 am and after 8 pm.
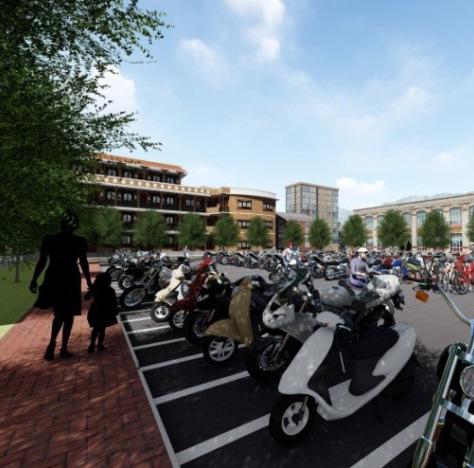
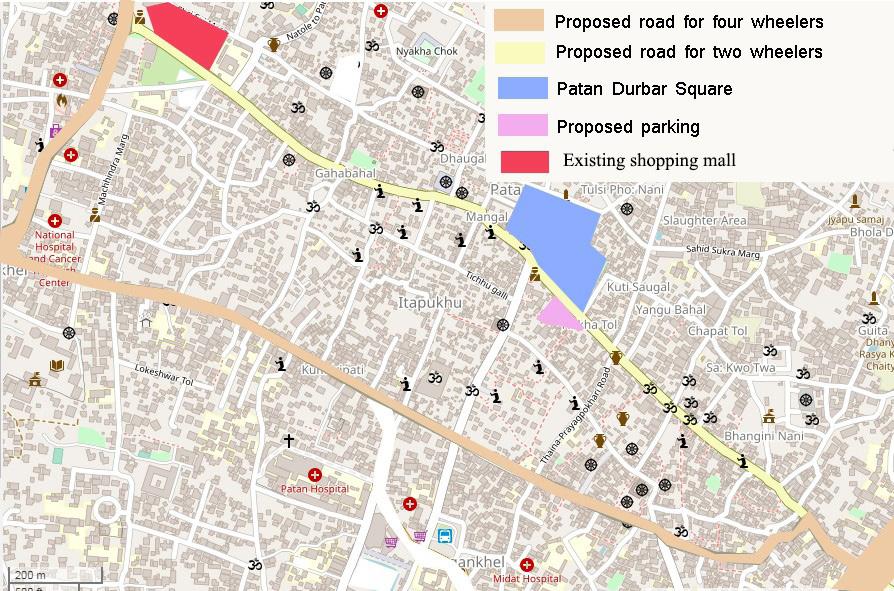
In this way, the traffic congestion will be minimized and at the same time, the movements for the four-wheelers like the loading and unloading of the goods in the shops, water tanks, etc can be done in the allocated time. However, the locals who own four-wheelers will be given an entry pass for their convenience to access the premises. Thus, if this rule is applicable and the four-wheelers are not al lowed to enter the area, the problem of gridlock will be remarkably reduced causing a decrease in pol lution, accidents, and travel time. Furthermore, an area is proposed for the parking of two-wheelers in the south direction of the square which helps in eliminating the roadside parking hence reducing traffic congestion (fig 117). Based on the feedbacks from the users of the square, these interventions not only reduce traffic but helps in enhancing the beauty of the square.
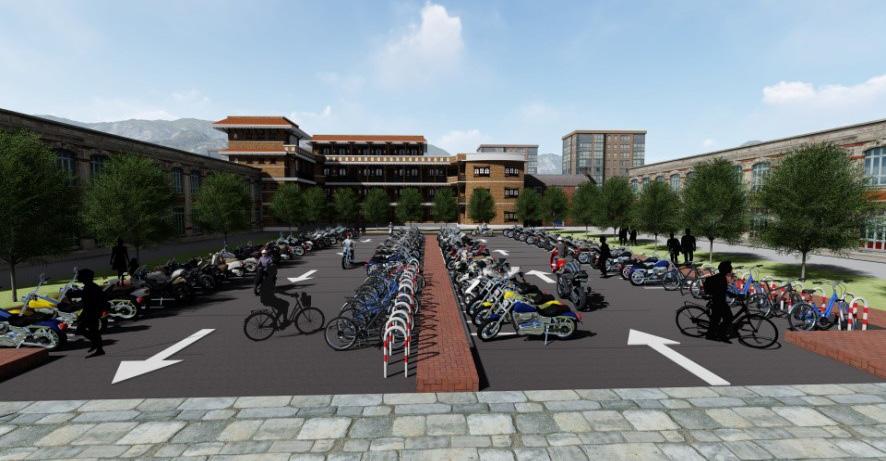
Similarly, due to the reduced number of vehicular movements, the amount of dust particles also reduc es, causing relief to the shopkeepers in the area. The parking of the private four-wheelers can be done in the underground parking of a shopping mall which lies approximately about 800m ahead of Patan Durbar Square (fig 115). Visitors or tourists should cover a walking distance of about 800km to reach the square and on the way; they can enjoy the different monuments, temples and many more.
Figure 117: Proposed parking for two-wheelers
(Source: Author)
According to the interview with the mu nicipality engineers, the only way to tack le the traffic congestion in Patan Durbar Square is by making the area vehicle free. The area can be made a vehicle-free area in the future. In time to come, the road can also be constructed as a bicycle lane to de-motivate the use of petrol-run vehi cles.
This proposal is an attempt to make itself an eco-friendly city. So by enforcing the rule of the cycle lanes in the area, safe cy cling is assured as the city is unsafe for cyclists. This also encourages and mo tivates the people to cycle and inhabit a healthy lifestyle. In this way, in a long run, the heritage site will be peaceful and free from noise and air pollution. As well as traffic congestion will be substantially reduced.
Decrease in traffic snarls
in air and noise pollution
travel time
environment
Figure 118: Intervention Chart
Patan durbar Square, an old urban settlement, creates a favorable environment to see the different aspects of urban activities in cer tain places. Firstly, The methods used to analyze the space has a good potential to dig-out the different activities and needs which are similar methods with my case except the part of group discus sion and co-design due to Covid -19. However, it is worth appre ciating to do an online survey in order to fill the data gap created due to the pandemic which I could not do due to communities’ awareness of digital social media usage for such purpose. Secondly, Reducing traffic jams as a Short term intervention and proposing a regulation for a vehicular free street in the long term is a timely and wise way-out for a site historically valuable. Hence, Detecting the major challenges which if intervened could alleviate the other small problems indirectly is a well advised method which can be taken as a lesson in the future similar task.
By and large, conducting research in a culturally rich and unique traditions space with various economic activities in a place like the Patan Durbar Square in Nepal is absolutely rewarding. Reflection by Beketa

This project was a new experience for us as a group of UEP students.
At the beginning, It seemed almost impossible to achieve the urban in formality project course in which intense teamwork is needed to learn from each other apart from an advanced understanding of critical issues in complex urban environments through close interaction with local com munities. Hence ‘the core purpose of the course is to explore core skills on community based fieldwork, research and practice and to build critical self-awareness of the role of the urban practitioner in challenging environ ments’ as stated on course content, we have experienced an extra chal lenge in Pandemic situation which, we think, gave us an immense insight and ability to face challenges. We have finally made the impossible at the beginning possible however an evitable challenge. First, There are no previously done reports in a similar pandemic situation which could help us as a guide . Second, difficulties we faced due to the limits caused by new pandemic regulations, the heterogeneity of our case studies and their background, online teamwork while living in different time zones. last but not the least, the almost two months fieldwork is not enough to deeply understand the complexity of the urban problems
Within the UEP program, several methods were introduced and discussed which were a tremendous help to have a more comprehensive analysis of the fieldwork. However, some of these methods were not designed to be used in a pandemic situation.
During the preliminary stages, the data was gathered by observation mainly and it did not involve social interactions. But as the face-to-face interviews started, using participatory methods became increasingly important. A noteworthy example would be that we all experienced situa tions, when stakeholders’ interest contradicts, and sometimes reaching consensus about an issue among residents appeared to be impossible. Participatory methods are helpful in this case to involve opposing groups, so they can discuss the issues, and be aware of each other’s problems.
Unfortunately, due to the Covid-19 situation, most participatory methods could not be applied easily. When we first started working on the prob lem statement, we identified a list of issues and we needed to narrow them down. While trying to prioritize different issues to identify main problems, there were uncertainties whether the stakeholders agree on how the problems were ranked based on their importance. In some cas es, the overlapping issues have been picked from different stakeholders in order to find the common problem that every stakeholder benefits from if intervened. Due to different corona regulations regarding social gathering based on the effect of pandemic pertaining to the four case study countries , some group members managed to do a group of four
community engagements while others could not because of lockdowns and tightened restrictions.however, We tried other alternatives, such as interviews and online surveys to recognize issues from the stakeholders’ of point of view. we found it helpful if all stakeholders could participate in this process in groups.
We tried to find out how working as a group can help us to think outside the box. A clear example of this would be receiving different impressions from team members from different backgrounds. We learned that some thing that appears obvious to the writer might seem confusing to oth ers. It is really important to understand where more elaboration is needed on the statements and every person might interpret them inaccurately if enough clarification is not provided. Even though there are similarities be tween the issues each case study might have, the solution to every issue is different in a distinct context.
After finding out the major problem in the specific area through need as sessment on each case study area , the group members developed strat egies for the intervention through which the prioritized problem can be solved. We got a valuable insight that categorizing the intervention into short term and long term is a strategy which could help urban planners to conquer the problems by dividing. one one hand , it helps to realistically plan what can be achieved in a short period of time to alleviate the issues of the community which in this way creativity becomes an inescapable option.
On the other hand, the decision made during this process is sometimes challenged by individual or institutional interest. For instance, when one facility is recommended to be moved to somewhere else or when certain activity is banned due to its negative effect in the long run, individuals with high interest could be against the proposal while other majority marginalized or low -income community agrees. Therefore, we learned that each and every stakeholders, who affects or can be affected by the proj ect, should be identified and revised when necessary and creating aware ness with stakeholders so that they develop a common interest rather than individual interest is necessary for the success of the proposal. In this process also, Both spatial and non-spatial interventions were carried out.
All in all, apart from the lessons learned and challenges faced during field work, we have had a good team spirit regardless of where we are and the group members helped each other at any needed moment which facili tates sharing an experience.
Abebe, A., 2013, ‘Federal Democratic Republic of Ethiopia Central Statistical Agency, Population Pro jection of Ethiopia for All Regions At Wereda Level from 2014 – 2017’, pp.17-106.Available at: https:// www.academia.edu/30252151/Federal_Democratic_Republic_of_Ethiopia_Central_Statistical_Agen cy_Population_Projection_of_Ethiopia_for_All_Regions_At_Wereda_Level_from_2014_2017 (Accessed: 30 September 2020)
‘Adarsha Kanya Campus’ (2019) KAHA6 Nepali Business Directory. Available at: https://kaha6.com/ company/adarsha-kanya-campus/ (Accessed: 6 December 2020).
Art and Culture: The Fascinating History of Patan, The Oldest City in Nepal (no date) holidify. Available at: /pages/history-of-patan-3574.html (Accessed: 7 December 2020).
Assefa, M., 2019, Ethiopia | History, Capital, Map, Population, & Facts | Britannica. Available at: https://www.britannica.com/place/Ethiopia (Accessed: 30 September 2020)
Bryson, J., 2004, ‘what to do when stakeholders matter: A guide to stakeholder identification and analysis techniques’, p4.Available at: https://www.researchgate.net/publication/228940014 (Accessed: 30 September 2020)
Burkett, I. (2012) ‘An introduction to Co-design’, p4.Available at: https://ntnu.blackboard.com/we bapps/blackboard/execute/content/file?cmd=view&content_id=_1096483_1&course_id=_21599_1 (Accessed: 06 November 2020)
Bratberg, T. T. V. and Arntzen, J. G. (1996) Trondheim byleksikon, Film. Oslo: Kunnskapsforl. Avail able at: https://urn.nb.no/URN:NBN:no-nb_digibok_2008080104041 (Accessed: 5 December 2020).
Chitrakar, R., 2006. A Study Of Historic Urban Squares Of Kathmandu Valley: Defining ContempoaryPublic Open Space Design.
Citypopulation.de. 2020. Lalitpur (District, Nepal) - Population Statistics, Charts, Map And Location. [online] Available at: <https://www.citypopulation.de/php/nepal-admin.php?adm2id=25t
Gautam S. (2018) ‘Preserving our History - myRepublica - The New York Times Partner, Latest news of Nepal in English, Latest News Articles’, my Republica. Available at: https://myrepublica.nagariknet work.com/news/36821/ (Accessed: 6 December 2020).
Hidden Gems of Patan (no date) Hotel Shanker, Lazimpat, Kathmandu 44600, Nepal. Available at: https://www.shankerhotel.com.np/blog/2014/10/27/hidden-gems-of-patan (Accessed: 6 December 2020).
Jacobs, J., 1961, The DEATH and LIFE of GREAT AMERICAN CITIES, 1st edn.,New York, Random House.
Ilic, V. (2013) Moholt. Available at: https://www.flickr.com/photos/95491266@N07/8709071333/ (Ac cessed: 5 December 2020).
Kafle L. (2019) ‘Lalitpur Metropolis bracing for VNY 2020’. Available at: https://risingnepaldaily.com/ detour/lalitpur-metropolis-bracing-for-vny-2020 (Accessed: 7 December 2020). Kathmandupost.com. 2020. Locals Of Patan Worried About Sewage Backflow During Monsoon. [on line] Available at: <https://kathmandupost.com/lalitpur/2019/07/09/locals-of-patan-worried-aboutsewage-backflow-during-monsoon
KMC, LMC fail to ease parking woes (2018) The Himalayan Times. Available at: https://thehimalayantimes.com/kathmandu/kmc-lmc-fail-to-ease-parking-woes/ (Accessed: 6 December 2020).
Kulimha Roof top duplex near Patan Durbar Square - Apartment in Patan (no date). Available at: https://cosynepal.lodgify.com/en/1936450/kulimha-roof-top-duplex-near-patan-durbar-square (Ac cessed: 6 December 2020).
Mazand Tarh Architecture and planning firm (2015), Sari master plan
Ministry of Urban Development and Construction (no date), Negele-Borena city administration. Avail able at: http://www.mudc.gov.et/web/negele-borena/home (Accessed: 20 September 2020.
Neufert, P. & Ernst, 2000, Architects’ Data, Third edition, vol. b, Blackwell Science Ltd, Great Britain.
Moholt 50 | 50 (no date). Available at: https://www.arkitektur.no/moholt-5050?tid=158202 (Accessed: 30 November 2020).
Moholt Student Village Masterplan (no date) MDH Arkitekter. Available at: https://mdh.no/project/ moholt-student-village/ (Accessed: 30 November 2020).
Nepaltibettrekking.com. 2020. Patan Darbar Square. [online] Available at: <https://www.nepaltibettrek king.com/cultural-around-patan-city-lalitpur.html> Tiwari, S., 1988. Tiered Temples Of Nepal.
Norge i bilder (no date). Available at: https://www.norgeibilder.no/ (Accessed: 30 November 2020).
Ojha A. (2020) ‘Lalitpur locals call officials out on dusty, pothole-riddled road’, The Kathamandu Post. Available at: https://kathmandupost.com/lalitpur/2020/03/04/lalitpur-locals-call-officials-out-on-dustypothole-riddled-road (Accessed: 6 December 2020).
Osnes, H. and Strinda bygdebokkomité (1939) Strinda bygdebok: med illustrasjoner og karter. 1, Strin da bygdebok. Trondheim: Trondheim] : Bygdebokkomitéen, 1939-1971. Available at: https://urn.nb.no/ URN:NBN:no-nb_digibok_2010062806153 (Accessed: 5 December 2020).
Patan durbar square (no date) BIG SKY TREKS. Available at: https://bigskytreks.weebly.com/patandurbar-square-tour.html (Accessed: 6 December 2020).
Patan Durbar Square to be declared no vehicle zone - Tourism Mail (2018). Available at: https://www. tourismmail.com/patan-durbar-square-to-be-declared-no-vehicle-zone (Accessed: 6 December 2020).
Patan Museum: Overview of courtyard (no date). Available at: https://www.asianart.com/associations/ patan-museum/a3.html (Accessed: 7 December 2020).
Ramezani, Ali. (2013). The history of Mazandaran. Sari: Shelfin pablications.
Sacred Urban Space (1997), Patan Museum Report, Patan Museum Board, Patan.
Shared Parking (2014) Institute for Transportation and Development Policy. Available at: https://www. itdp.org/2014/12/12/shared-parking/ (Accessed: 3 December 2020).
Scheyvens, R., Scheyvens, H. & E. Murray, W. (2003) Working with Marginalised, Vulnerable or Privileged Groups, in Scheyvens,R.& Storey,D.(ed.) Development Fieldwork. London England EC2A 4PU United Kingdom: SAGE Publications Ltd, p 25
Scheyvens, Regina, & Storey, Donovan. (2003). Development Fieldwork. London: SAGE Publications
Shilpakar, A. (2016) ‘It takes a village’, The Kathmandu Post. Available at: https://kathmandupost.com/ miscellaneous/2016/01/30/it-takes-a-village (Accessed: 6 December 2020).
Statistics (2020) ssb.no. Available at: https://www.ssb.no/en/befolkning/nokkeltall/population (Ac cessed: 30 November 2020).
‘The Kathmandu Valley’s Patan’ (2018) Ramblin’ Boy, 10 August. Available at: https://albinger. me/2018/08/10/the-kathmandu-valleys-patan-may-2018-part-1-durbar-square/ (Accessed: 4 December 2020).
Traditional Arts (no date) Spiny Babbler Museum. Available at: https://web.archive.org/ web/20090822001622/http://www.spinybabbler.org/art_complex/display_art_complexes.php?id=patan.htm (Accessed: 6 December 2020).
Trondheim kommune (no date) Trondheim kommune. Available at: https://www.trondheim.kommune. no/ (Accessed: 5 December 2020).
Trondheim.no (no date). Available at: https://www.trondheim.no/en (Accessed: 30 November 2020).
UN Habitat (2020) ‘Public Space Site-Specific Assessment: Guidelines to Achieve Quality
Public Spaces at Neighbourhood Level | UN-Habitat’. Available at: https://unhabitat.org/public-space-site-specific-assessment-guidelines-to-achieve-quality-public-spaces-at-neighbourhood (Ac cessed: 1 December 2020).
Upadhya R. (2015) Time is Running Out for Nepal Earthquake Survivors. Available at: https://blogs. worldbank.org/endpovertyinsouthasia/time-running-out-nepal-earthquake-survivors (Accessed: 7 December 2020).
Whyte, W. (2001). The social life of small urban spaces. New York: Project for Public Spaces.
Worldpopulationreview.com. 2020. Kathmandu Population 2020 (Demographics, Maps, Graphs). [on line] Available at: <https://worldpopulationreview.com/world-cities/kathmandu-population>
Zewdie,G.(2011) HYDROGEOLOGICAL AND HYDROCHEMICAL MAPS OF NEGELE NB 3711.first edition- Czech Republic
