


Volume 23, Number 5, September 2022 Open Access at WestJEM.com ISSN 1936-900X West A Peer-Reviewed, International Professional Journal Western Journal of Emergency Medicine VOLUME 23, NUMBER 5, September 2022 PAGES 600-793 Western Journal of Emergency Medicine: Integrating Emergency Care with Population Health Indexed in MEDLINE Contents continued on page iii Endemic Infections 600 Racial and Ethnic Disparities in Hospitalization and Clinical Outcomes Among Patients with COVID-19 F Serrano, EJ Blutinger, C Vargas-Torres, S Bilal, C Counts, M Straight, MP Lin 613 Can Urinalysis and Past Medical History of Kidney Stones Predict Urine Antibiotic Resistance? M Mohseni, EC Craver, MG Heckman, JM Sheele 618 More Accessible COVID-19 Treatment Through Monoclonal Antibody Infusion in the Emergency Department SW Heinert, J McCoy, P Ohman Strickland, R Riggs, R Eisenstein 623 Prospective Case-control Study of Contact Tracing Speed for Emergency Department-based Contact Tracers SC Weaver, SS Byrne, H Bruce, OL Vargas, TE Robey 628 Evaluation of an Emergency Department Influenza Vaccination Program: Uptake Factors and Opportunities C Parrish, CA Phares, T Fredrickson, JB Lynch, LK Whiteside, HC Duber Health Equity 633 Horizontal Violence Toward Emergency Medicine Residents: Gender as a Risk Factor AA Jacobson, JE Colleti, NP Raukar 637 Discharge Navigator: Implementation and Cross-Sectional Evaluation of a Digital Decision Tool for Social Resources upon Emergency Department Discharge M Grade, N Stark, D Emanuels, A Lu, J Doshi, S Leung, C Peabody 644 Race and Other Disparate Demographic Variables Identified Among Emergency Department Boarders RC Ruffo, EF Shufflebarger, JS Booth, LA Walter

ACOEP stands with all emergency physicians and providers on the front line. We thank you for your tireless work and effort. www.acoep.org
Western Journal of Emergency Medicine:
Integrating Emergency Care with Population Health
Indexed
Andrew W. Phillips, MD, Associate Editor
DHR Health-Edinburg, Texas
Edward Michelson, MD, Associate Editor
Texas Tech University- El Paso, Texas
Dan Mayer, MD, Associate Editor
Retired from Albany Medical College- Niskayuna, New York
Wendy Macias-Konstantopoulos, MD, MPH, Associate Editor Massachusetts General Hospital- Boston, Massachusetts
Gayle Galletta, MD, Associate Editor
University of Massachusetts Medical SchoolWorcester, Massachusetts
Yanina Purim-Shem-Tov, MD, MS, Associate Editor
Rush University Medical Center-Chicago, Illinois
Resident Editors
AAEM/RSA
John J. Campo, MD Harbor-University of California, Los Angeles Medical Center
Tehreem Rehman, MD Advocate Christ Medical Center
ACOEP
Justina Truong, DO Kingman Regional Medical Center
Section Editors
Behavioral Emergencies
Leslie Zun, MD, MBA Chicago Medical School
Marc L. Martel, MD Hennepin County Medical Center Cardiac Care
Fred A. Severyn, MD University of Colorado School of Medicine
Sam S. Torbati, MD Cedars-Sinai Medical Center
Clinical Practice Cortlyn W. Brown, MD Carolinas Medical Center
Casey Clements, MD, PhD Mayo Clinic
Patrick Meloy, MD Emory University
Nicholas Pettit, DO, PhD Indiana University
David Thompson, MD University of California, San Francisco
Kenneth S. Whitlow, DO Kaweah Delta Medical Center
Critical Care
Christopher “Kit” Tainter, MD University of California, San Diego
Gabriel Wardi, MD University of California, San Diego
Joseph Shiber, MD University of Florida-College of Medicine
Matt Prekker MD, MPH Hennepin County Medical Center
David Page, MD University of Alabama
Erik Melnychuk, MD Geisinger Health
Mark I. Langdorf, MD, MHPE, Editor-in-Chief
University of California, Irvine School of MedicineIrvine, California
Shahram Lotfipour, MD, MPH, Managing Editor
University of California, Irvine School of MedicineIrvine, California


Michael Gottlieb, MD, Associate Editor
Rush Medical Center-Chicago, Illinois
Niels K. Rathlev, MD, Associate Editor
Tufts University School of Medicine-Boston, Massachusetts
Rick A. McPheeters, DO, Associate Editor
Kern Medical- Bakersfield, California
Shadi Lahham, MD, MS, Deputy Editor
Kaiser Permanente- Irvine, California
Susan R. Wilcox, MD, Associate Editor
Massachusetts General Hospital- Boston, Massachusetts
Elizabeth Burner, MD, MPH, Associate Editor
University of Southern California- Los Angeles, California
Patrick Joseph Maher, MD, MS, Associate Editor
Ichan School of Medicine at Mount Sinai- New York, New York
Donna Mendez, MD, EdD, Associate Editor
University of Texas-Houston/McGovern Medical School- Houston Texas
Danya Khoujah, MBBS, Associate Editor
University of Maryland School of Medicine- Baltimore, MarylandGentry Wilkerson, MD, Associate Editor University of Maryland
Quincy Tran, MD, PhD University of Maryland
Disaster Medicine Christopher Kang, MD Madigan Army Medical Center Education
Danya Khoujah, MBBS University of Maryland School of Medicine
Jeffrey Druck, MD University of Colorado
John Burkhardt, MD, MA University of Michigan Medical School
Michael Epter, DO Maricopa Medical Center
ED Administration, Quality, Safety David C. Lee, MD Northshore University Hospital
Gary Johnson, MD Upstate Medical University
Brian J. Yun, MD, MBA, MPH Harvard Medical School
Laura Walker, MD Mayo Clinic
León D. Sánchez, MD, MPH Beth Israel Deaconess Medical Center
William Fernandez, MD, MPH University of Texas Health-San Antonio
Emergency Medical Services Daniel Joseph, MD Yale University
Joshua B. Gaither, MD University of Arizona, Tuscon
Julian Mapp University of Texas, San Antonio
Shira A. Schlesinger, MD, MPH Harbor-UCLA Medical Center
Geriatrics
Cameron Gettel, MD Yale School of Medicine
Stephen Meldon, MD Cleveland Clinic
Luna Ragsdale, MD, MPH Duke University
Health Equity
Emily C. Manchanda, MD, MPH Boston University School of Medicine
Mandy J. Hill, DrPH, MPH UT Health McGovern Medical School
Infectious Disease
Elissa Schechter-Perkins, MD, MPH Boston University School of Medicine
Ioannis Koutroulis, MD, MBA, PhD George Washington University School of Medicine and Health Sciences
Kevin Lunney, MD, MHS, PhD University of Maryland School of Medicine
Robert Derlet, MD Founding Editor, California Journal of Emergency Medicine University of California, Davis Stephen Liang, MD, MPHS Washington University School of Medicine Injury Prevention Mark Faul, PhD, MA Centers for Disease Control and Prevention Wirachin Hoonpongsimanont, MD, MSBATS Eisenhower Medical Center
International Medicine Heather A.. Brown, MD, MPH Prisma Health Richland
Taylor Burkholder, MD, MPH Keck School of Medicine of USC
Christopher Greene, MD, MPH University of Alabama
Chris Mills, MD, MPH Santa Clara Valley Medical Center
Shada Rouhani, MD Brigham and Women’s Hospital
Legal Medicine
Melanie S. Heniff, MD, JD Indiana University School of Medicine Greg P. Moore, MD, JD Madigan Army Medical Center Statistics and Methodology
Shu B. Chan MD, MS Resurrection Medical Center
Stormy M. Morales Monks, PhD, MPH Texas Tech Health Science University
Soheil Saadat, MD, MPH, PhD University of California, Irvine
James A. Meltzer, MD, MS Albert Einstein College of Medicine Musculoskeletal Juan F. Acosta DO, MS Pacific Northwest University
Rick Lucarelli, MD Medical City Dallas Hospital
William D. Whetstone, MD University of California, San Francisco
Neurosciences
Antonio Siniscalchi, MD
Annunziata Hospital, Cosenza, Italy
Pediatric Emergency Medicine
Paul Walsh, MD, MSc University of California, Davis
Muhammad Waseem, MD
Lincoln Medical & Mental Health Center
Cristina M. Zeretzke-Bien, MD University of Florida
Public Health
Jacob Manteuffel, MD Henry Ford Hospital
John Ashurst, DO Lehigh Valley Health Network
Tony Zitek, MD Kendall Regional Medical Center
Trevor Mills, MD, MPH Northern California VA Health Care
Erik S. Anderson, MD
Alameda Health System-Highland Hospital Technology in Emergency Medicine Nikhil Goyal, MD Henry Ford Hospital
Phillips Perera, MD Stanford University Medical Center
Trauma Pierre Borczuk, MD Massachusetts General Hospital/Havard Medical School
Toxicology
Brandon Wills, DO, MS Virginia Commonwealth University
Jeffrey R. Suchard, MD University of California, Irvine
Ultrasound
J. Matthew Fields, MD
Thomas Jefferson University
Shane Summers, MD Brooke Army Medical Center
Robert R. Ehrman
Wayne State University
Ryan C. Gibbons, MD Temple Health
Available in MEDLINE, PubMed, PubMed Central, CINAHL, SCOPUS, Google Scholar, eScholarship, Melvyl, DOAJ, EBSCO, EMBASE, Medscape, HINARI, and MDLinx Emergency Med. Members of OASPA.

Editorial and Publishing Office: WestJEM/Depatment of Emergency Medicine, UC Irvine Health, 3800 W. Chapman Ave. Suite 3200, Orange, CA 92868, USA Office: 1-714-456-6389; Email: Editor@westjem.org
 Official Journal of the California Chapter of the American College of Emergency Physicians, the America College of Osteopathic Emergency Physicians, and the California Chapter of the American Academy of Emergency Medicine
Volume 23, no. 5: September 2022 i Western Journal of Emergency Medicine
in MEDLINE, PubMed, and Clarivate Web of Science, Science Citation Index Expanded
Western Journal of Emergency Medicine: Integrating Emergency Care with Population Health
Indexed in MEDLINE, PubMed, and Clarivate Web of Science, Science Citation Index Expanded
Editorial Board
Amin A. Kazzi, MD, MAAEM
The American University of Beirut, Beirut, Lebanon
Anwar Al-Awadhi, MD Mubarak Al-Kabeer Hospital, Jabriya, Kuwait
Arif A. Cevik, MD
United Arab Emirates University College of Medicine and Health Sciences, Al Ain, United Arab Emirates
Abhinandan A.Desai, MD University of Bombay Grant Medical College, Bombay, India
Bandr Mzahim, MD King Fahad Medical City, Riyadh, Saudi Arabia
Brent King, MD, MMM University of Texas, Houston
Christopher E. San Miguel, MD Ohio State University Wexner Medical Center
Daniel J. Dire, MD University of Texas Health Sciences Center San Antonio
David F.M. Brown, MD Massachusetts General Hospital/ Harvard Medical School
Douglas Ander, MD Emory University
Edward Michelson, MD Texas Tech University
Edward Panacek, MD, MPH University of South Alabama
Francesco Della Corte, MD Azienda Ospedaliera Universitaria “Maggiore della Carità,” Novara, Italy
Francis Counselman, MD Eastern Virginia Medical School
Gayle Galleta, MD
Sørlandet Sykehus HF, Akershus Universitetssykehus, Lorenskog, Norway
Hjalti Björnsson, MD Icelandic Society of Emergency Medicine
Jacob (Kobi) Peleg, PhD, MPH Tel-Aviv University, Tel-Aviv, Israel
Jaqueline Le, MD Desert Regional Medical Center Jeffrey Love, MD The George Washington University School of Medicine and Health Sciences
Jonathan Olshaker, MD Boston University
Katsuhiro Kanemaru, MD University of Miyazaki Hospital, Miyazaki, Japan
Kenneth V. Iserson, MD, MBA University of Arizona, Tucson
Khrongwong Musikatavorn, MD King Chulalongkorn Memorial Hospital, Chulalongkorn University, Bangkok, Thailand
Leslie Zun, MD, MBA Chicago Medical School
Linda S. Murphy, MLIS University of California, Irvine School of Medicine Librarian
Nadeem Qureshi, MD St. Louis University, USA Emirates Society of Emergency Medicine, United Arab Emirates
Niels K. Rathlev, MD Tufts University School of Medicine
Pablo Aguilera Fuenzalida, MD Pontificia Universidad Catolica de Chile, Región Metropolitana, Chile
Peter A. Bell, DO, MBA Baptist Health Sciences University
Peter Sokolove, MD University of California, San Francisco
Rachel A. Lindor, MD, JD Mayo Clinic
Robert M. Rodriguez, MD University of California, San Francisco
Robert Suter, DO, MHA UT Southwestern Medical Center
Robert W. Derlet, MD University of California, Davis
Rosidah Ibrahim, MD Hospital Serdang, Selangor, Malaysia
Samuel J. Stratton, MD, MPH Orange County, CA, EMS Agency
Scott Rudkin, MD, MBA University of California, Irvine
Scott Zeller, MD University of California, Riverside
Steven H. Lim, MD
Changi General Hospital, Simei, Singapore
Terry Mulligan, DO, MPH, FIFEM ACEP Ambassador to the Netherlands Society of Emergency Physicians
Vijay Gautam, MBBS University of London, London, England
Wirachin Hoonpongsimanont, MD, MSBATS
Siriraj Hospital, Mahidol University, Bangkok, Thailand
Editorial StaffAdvisory Board
Elena Lopez-Gusman, JD California ACEP American College of Emergency Physicians
Jennifer Kanapicki Comer, MD FAAEM
California Chapter Division of AAEM Stanford University School of Medicine
Katie Geraghty
American College of Osteopathic Emergency Physicians
Kimberly Ang, MBA UC Irvine Health School of Medicine
Randall J. Young, MD, MMM, FACEP
California ACEP

American College of Emergency Physicians

Kaiser Permanente
Mark I. Langdorf, MD, MHPE, FAAEM, FACEP
UC Irvine Health School of Medicine
Robert Suter, DO, MHA American College of Osteopathic Emergency Physicians UT Southwestern Medical Center
Shahram Lotfipour, MD, MPH FAAEM, FACEP UC Irvine Health School of Medicine
Jorge Fernandez, MD, FACEP UC San Diego Health School of Medicine
Isabelle Nepomuceno, BS Executive Editorial Director
Visha Bajaria, BS WestJEM Editorial Director
Anuki Edirimuni, BS WestJEM Editorial Director
Zaynab Ketana, BS CPC-EM Editorial Director Associate Marketing Director
Stephanie Burmeister, MLIS WestJEM Staff Liaison
Cassandra Saucedo, MS Executive Publishing Director
Jordan Lam, BS WestJEM Publishing Director
Anthony Hoang, BS WestJEM Associate Publishing Director
Rubina Rafi, BS CPC-EM Publishing Director
Avni Agrawal, BS WestJEM Associate Publishing Director Associate Marketing Director
June Casey, BA Copy Editor
Available in MEDLINE, PubMed, PubMed Central, Europe PubMed Central, PubMed Central Canada, CINAHL, SCOPUS, Google Scholar, eScholarship, Melvyl, DOAJ, EBSCO, EMBASE, Medscape, HINARI, and MDLinx Emergency Med. Members of OASPA. Editorial and Publishing Office: WestJEM/Depatment of Emergency Medicine, UC Irvine Health, 3800 W. Chapman Ave. Suite 3200, Orange, CA 92868, USA Office: 1-714-456-6389; Email: Editor@westjem.org
Official Journal of the California Chapter of the American College of Emergency Physicians, the America College of Osteopathic Emergency Physicians, and the California Chapter of the American Academy of Emergency Medicine
Western Journal of Emergency Medicine ii Volume 23, no. 5: September 2022
Western Journal of Emergency Medicine:
JOURNAL FOCUS
Emergency medicine is a specialty which closely reflects societal challenges and consequences of public policy decisions. The emergency department specifically deals with social injustice, health and economic disparities, violence, substance abuse, and disaster preparedness and response. This journal focuses on how emergency care affects the health of the community and population, and conversely, how these societal challenges affect the composition of the patient population who seek care in the emergency department. The development of better systems to provide emergency care, including technology solutions, is critical to enhancing population health.
Table of Contents
650 A Structural Competency Framework for Emergency Medicine Research: Results from a Scoping Review and Consensus Conference
A Zeidan, B Salhi, A Backster, E Shelton, A Valente, B Safdar, A Wong, A Della Porta, S Lee, T Schneberk, J Wilson, B Westgard, M Samuels-Kalow
660 WOMen profEssioNal developmenT oUtcome Metrics in Academic Emergency Medicine: Results from the WOMENTUM Modified Delphi Study
JS Love, AJ Zeidan, UG Khatri, ME Samuels-Kalow, AM Mills, CH Hsu
Women’s Health
672 Traumatic Injuries in Sexual Assault Patients in the Emergency Department D McCormack, S Subburamu, G Guzman, C Calderon, R Darapaneni, R Lis, N Sima, J Sperling, J Corbo
678 Trends of Pandemic Parenting in Medical Academia
M Shah, M Holmes, I Husain, D Davenport, S Dugan, S Ansari
Behavioral Health
684 Stage-of-change Assessment Predicts Short-term Treatment Engagement for Opioid Use Disorder Patients Initiated on Buprenorphine
Q Reuter, GL Larkin, M Dubé, S Vellanki, A Dos Santos, J McKinnon, N Jouriles, D Seaberg Multidisciplinary Wellness Initiative in an Academic Emergency Department Jacobson, R Westein, R Nordstrom, A Pilarski
Critical Care Accuracy of Sepsis Screening Score for Mortality Prediction at Emergency Department Triage Suttapanit, S Satiracharoenkul, P Sanguanwit, T Prachanukool vs Video for Difficult Airway Patients in the Emergency Department: A National Emergency Airway Registry Study Department
Policies for peer review, author instructions, conflicts of interest and human and animal subjects protections can be found online at www.westjem.com.
Volume 23, no. 5: September 2022 iii Western Journal of Emergency Medicine
693 #WhyIDoIt: A
N
698 The
K
706 Direct
Laryngoscopy
BT Ruderman, M Mali AH Kaji, R Kilgo, S Watts, R Wells, AT Limkakeng, JB Borawski, AE Fantegrossi, RM Walls, CA Brown Emergency
Operations 716 Pain Assessment in the Emergency Department: A Prospective Videotaped Study H-P Hsu, MT, Cheng, T-C Lu, Y-C Chen, E Che-Wei Liao, C-Q Sung, C-Q Liew, D-A Ling, C-H Ko, N-W Ku, L-C Fu, C-H Huang, C-L Tsai 724 Where Have All the FLOWERS Gone? A Multicenter Investigation of Frequent Users of Midwest Emergency Department Services During the COVID-19 Stay-at-home Orders HW Levitin, BG Jones, MM Lockhart, CM Lloyd, MD Sharkey, PA Willette, AF Kalnow
Integrating Emergency Care with Population Health Indexed in MEDLINE, PubMed, and Clarivate Web of Science, Science Citation Index Expanded
Western Journal of Emergency Medicine: Integrating Emergency Care with Population Health
Indexed in MEDLINE, PubMed, and Clarivate Web of Science, Science Citation Index Expanded
Table of Contents continued
Geriatrics
734 Geriatric Falls: Patient Characteristics Associated with Emergency Department Revisits DD Cox, R Subramony, B Supat, JJ Brennan, RY Hsia, EM Castillo
Health Outcomes
739 Low Rates of Lung and Colorectal Cancer Screening Uptake Among a Safety-net Emergency Department Population N Pettit, D Ceppa, P Monahan
International Emergency Medicine
746 Emergency Services Capacity of a Rural Community in Guatemala M Hughes, J Schmidy, J Svenson
Pediatrics
754 COVID-19 and Serious Bacterial Infection in Febrile Infants Less Than 60 Days Old D Guernsey, M Pfeffer, J Kimpo, H Vazquez, J Zerzan
Technology in Emergency Medicine
760 Economic Evaluation of Ultrasound-guided Central Venous Catheter Confirmation vs Chest Radiography in Critically Ill Patients: A Labor Cost Model
EA Ablordeppey, AM Koenig, AR Barker, EE Hernandez, SM Simkovich, JG Krings, DS Brown, RT Griffey
Trauma
769 Blood Pressure Variability and Outcome in Traumatic Brain Injury: A Propensity Score Matching Study
QK Tran, H Frederick, C Tran, H Baqai, T Lurie, J Solomon, A Aligabi, J Olexa, S Cardona, U Bodanapally, G Schwartzbauer, J Downing
Violence Assessment and Prevention
781 A Novel Technique to Identify Intimate Partner Violence in a Hospital Setting A Tabaie, AJ Zeidan, DP Evans, RN Smith, R Kamaleswaran
Education
789 Electronic Health Record-based COVID-19 Interprofessional Case Collaboration B Ringwald, S Shawar, C Curren, J McCallister, C Mead, NE Kman
Letters to the Editor
792 Comment on “Comparing Physician Assistant and Nurse Practitioner Practice in US Emergency Departments S Croughan, D Glynn
793 Response to Comment on”Comparing Physician Assistant and Nurse Practitioner Practice in US Emergency Departments, 2010–2017” M Darracq, F Wu
Volume 23, no. 5: September 2022 iv Western Journal of Emergency Medicine
Western Journal of Emergency Medicine: Integrating Emergency Care with Population Health
Indexed in MEDLINE, PubMed, and Clarivate Web of Science, Science Citation Index Expanded
This open access publication would not be possible without the generous and continual financial support of our society sponsors, department and chapter subscribers.
Professional Society Sponsors
American College of Osteopathic Emergency Physicians California ACEP
Academic Department of Emergency Medicine Subscriber
Albany Medical College Albany, NY
Allegheny Health Network Pittsburgh, PA
American University of Beirut Beirut, Lebanon
AMITA Health Resurrection Medical Center Chicago, IL
Arrowhead Regional Medical Center Colton, CA
Baylor College of Medicine Houston, TX
Baystate Medical Center Springfield, MA
Bellevue Hospital Center New York, NY
Beth Israel Deaconess Medical Center Boston, MA
Boston Medical Center Boston, MA
Brigham and Women’s Hospital Boston, MA
Brown University Providence, RI
Carl R. Darnall Army Medical Center Fort Hood, TX
Cleveland Clinic Cleveland, OH
Columbia University Vagelos New York, NY
State Chapter Subscriber
Arizona Chapter Division of the American Academy of Emergency Medicine
California Chapter Division of the American Academy of Emergency Medicine
Florida Chapter Division of the American Academy of Emergency Medicine
International Society Partners
Conemaugh Memorial Medical Center Johnstown, PA
Crozer-Chester Medical Center Upland, PA
Desert Regional Medical Center Palm Springs, CA
Detroit Medical Center/ Wayne State University Detroit, MI
Eastern Virginia Medical School Norfolk, VA
Einstein Healthcare Network Philadelphia, PA
Eisenhower Medical Center Rancho Mirage, CA
Emory University Atlanta, GA
Franciscan Health Carmel, IN
Geisinger Medical Center Danville, PA
Grand State Medical Center Allendale, MI
Healthpartners Institute/ Regions Hospital Minneapolis, MN
Hennepin County Medical Center Minneapolis, MN
Henry Ford Medical Center Detroit, MI
Henry Ford Wyandotte Hospital Wyandotte, MI
INTEGRIS Health Oklahoma City, OK
California Chapter Division of American Academy of Emergency Medicine
Mayo Clinic Jacksonville, FL
Kaiser Permenante Medical Center San Diego, CA
Kaweah Delta Health Care District Visalia, CA
Kennedy University Hospitals Turnersville, NJ
Kent Hospital Warwick, RI
Kern Medical Bakersfield, CA
Lakeland HealthCare St. Joseph, MI
Lehigh Valley Hospital and Health Network Allentown, PA
Loma Linda University Medical Center Loma Linda, CA
Louisiana State University Health Sciences Center New Orleans, LA
Louisiana State University Shreveport Shereveport, LA
Madigan Army Medical Center Tacoma, WA
Maimonides Medical Center Brooklyn, NY
Maine Medical Center Portland, ME
Massachusetts General Hospital/Brigham and Women’s Hospital/ Harvard Medical Boston, MA
Great Lakes Chapter Division of the American Academy of Emergency Medicine Tennessee Chapter Division of the
Emergency Medicine Association of Turkey Lebanese Academy of Emergency Medicine Mediterranean Academy of Emergency Medicine
Norwegian Society for Emergency Medicine Sociedad Argentina de Emergencias
Mayo Clinic College of Medicine Rochester, MN
Mercy Health - Hackley Campus Muskegon, MI
Merit Health Wesley Hattiesburg, MS
Midwestern University Glendale, AZ
Mount Sinai School of Medicine New York, NY
New York University Langone Health New York, NY
North Shore University Hospital Manhasset, NY
Northwestern Medical Group Chicago, IL
NYC Health and Hospitals/ Jacobi New York, NY
Ohio State University Medical Center Columbus, OH
Ohio Valley Medical Center Wheeling, WV
Oregon Health and Science University Portland, OR
Penn State Milton S. Hershey Medical Center Hershey, PA
American Academy of Emergency Medicine
Uniformed Services Chapter Division of the American Academy of Emergency Medicine
Virginia Chapter Division of the American Academy of Emergency Medicine
Sociedad Chileno Medicina Urgencia Thai Association for Emergency Medicine
To become a WestJEM departmental sponsor, waive article processing fee, receive electronic copies for all faculty and residents, and free CME and faculty/fellow position advertisement space, please go to http://westjem.com/subscribe or contact:
Stephanie Burmeister
WestJEM Staff Liaison
Phone: 1-800-884-2236
Email: sales@westjem.org
Western Journal of Emergency Medicine v Volume 23, no. 5: September 2022
Western Journal of Emergency Medicine: Integrating Emergency Care with Population Health
Indexed in MEDLINE, PubMed, and Clarivate Web of Science, Science Citation Index Expanded
This open access publication would not be possible without the generous and continual financial support of our society sponsors, department and chapter subscribers.
Professional Society Sponsors
American College of Osteopathic Emergency Physicians California ACEP
Academic Department of Emergency Medicine Subscriber
Prisma Health/ University of South Carolina SOM Greenville Greenville, SC
Regions Hospital Emergency Medicine Residency Program St. Paul, MN
Rhode Island Hospital Providence, RI
Robert Wood Johnson University Hospital New Brunswick, NJ
Rush University Medical Center Chicago, IL
St. Luke’s University Health Network Bethlehem, PA
Spectrum Health Lakeland St. Joseph, MI Stanford Stanford, CA
SUNY Upstate Medical University Syracuse, NY
Temple University Philadelphia, PA
Texas Tech University Health Sciences Center El Paso, TX
The MetroHealth System/ Case Western Reserve University Cleveland, OH
UMass Chan Medical School Worcester, MA
University at Buffalo Program Buffalo, NY
State Chapter Subscriber
Arizona Chapter Division of the American Academy of Emergency Medicine
California Chapter Division of the American Academy of Emergency Medicine
Florida Chapter Division of the American Academy of Emergency Medicine
International Society Partners
University of Alabama Medical Center Northport, AL
University of Alabama, Birmingham Birmingham, AL
University of Arizona College of Medicine-Tucson Tucson, AZ
University of California, Davis Medical Center Sacramento, CA
University of California, Irvine Orange, CA
University of California, Los Angeles Los Angeles, CA
University of California, San Diego La Jolla, CA
University of California, San Francisco San Francisco, CA
UCSF Fresno Center Fresno, CA University of Chicago Chicago, IL
University of Cincinnati Medical Center/ College of Medicine Cincinnati, OH
University of Colorado Denver Denver, CO
University of Florida Gainesville, FL
University of Florida, Jacksonville Jacksonville, FL
Emergency Medicine Association of Turkey Lebanese Academy of Emergency Medicine Mediterranean Academy of Emergency Medicine
California Chapter Division of American Academy of Emergency Medicine
University of Illinois at Chicago Chicago, IL
University of Iowa Iowa City, IA University of Louisville Louisville, KY
University of Maryland Baltimore, MD University of Massachusetts Amherst, MA
University of Michigan Ann Arbor, MI
University of Missouri, Columbia Columbia, MO
University of North Dakota School of Medicine and Health Sciences Grand Forks, ND
University of Nebraska Medical Center Omaha, NE
University of Nevada, Las Vegas Las Vegas, NV
University of Southern Alabama Mobile, AL
University of Southern California Los Angeles, CA
University of Tennessee, Memphis Memphis, TN
University of Texas, Houston Houston, TX
University of Washington Seattle, WA
Great Lakes Chapter Division of the American Academy of Emergency Medicine Tennessee Chapter Division of the
Norwegian Society for Emergency Medicine Sociedad Argentina de Emergencias
University of WashingtonHarborview Medical Center Seattle, WA
University of Wisconsin Hospitals and Clinics Madison, WI
UT Southwestern Dallas, TX
Valleywise Health Medical Center Phoenix, AZ
Virginia Commonwealth University Medical Center Richmond, VA
Wake Forest University Winston-Salem, NC
Wake Technical Community College Raleigh, NC Wayne State Detroit, MI
Wright State University Dayton, OH
Yale School of Medicine New Haven, CT
American Academy of Emergency Medicine
Uniformed Services Chapter Division of the American Academy of Emergency Medicine
Virginia Chapter Division of the American Academy of Emergency Medicine
Sociedad Chileno Medicina Urgencia Thai Association for Emergency Medicine
To become a WestJEM departmental sponsor, waive article processing fee, receive electronic copies for all faculty and residents, and free CME and faculty/fellow position advertisement space, please go to http://westjem.com/subscribe or contact:
Stephanie Burmeister
WestJEM Staff Liaison
Phone: 1-800-884-2236
Email: sales@westjem.org
Western Journal of Emergency Medicine vi Volume 23, no. 5: September 2022

Call for Section Editors • Behavioral Emergencies • Emergency Cardiac Care • International Medicine • Pediatric Emergencies • Public Health • Trauma Care • Ultrasound Send CV and letter of interest to Editor@WestJEM.org NEW: HEALTH EQUITY SECTION Call for Reviewers and Manuscripts Send CV and letter of interest to Editor@WestJEM.org
Call for Reviewers!


Please send your CV and letter of interest to editor@westjem.org
Position: Ultrasound Director
The Department of Emergency Medicine at the University of California, Irvine School of Medicine is seeking applicants for a faculty position in the Health Sciences Clinical Professor Series, at the Assistant, Associate, or Full Professor rank.

The University of California, Irvine Medical Center is a 472-bed tertiary care hospital with all residencies. The ED is a progressive 35-bed Level I Trauma Center with 50,000 patients, in urban Orange County. The ED has collegial relationships with all services and offers excellent salary and benefits with an incentive plan.
Criteria for the Health Sciences Clinical Professor Series: The incumbent will be expected to teach residents and medical students; provide direct patient care; perform research and/or creative work; and public and University service. Candidates must have demonstrated capabilities for teaching and research or creative work suitable for this series.
Candidates must possess an M.D. or D.O. degree, board certification in Emergency Medicine, and be eligible for a California Medical License. Fellowship sub-specialization in Ultrasound is also required.
The successful candidate will be expected to engage in the following:
Maintain function and peak performance of all 6 ultrasound trollies, 4 boom mounted machines, and 8 handheld units
Review all EM resident scans for competency and graduation requirements
Optimize documentation templates
Maintain Clinical Ultrasound Accreditation Program through ACEP
Monitor credentialing progress for each new faculty and nurse practitioner
Administer annual “bootcamp” for all new EM faculty, residents, and fellows
Provide Chair with quarterly faculty ultrasound metrics
Work with hospital IT to troubleshoot workflow and middleware issues
Establish and maintain an active transesophageal echo program
Oversee ultrasound quality assurance
Academic rank, step, and salary will be based upon the candidate’s training, qualifications, and experience.
Application Instructions To be considered for the position, interested candidates should visit: https://recruit.ap.uci.edu/JPF07727 , complete an online application profile and upload application materials electronically.
Department of Emergency Medicine
Racial and Ethnic Disparities in Hospitalization and Clinical Outcomes Among Patients with COVID-19
Felipe Serrano, MD*
Erik J. Blutinger, MD, MSc*
Carmen Vargas-Torres, MA* Saadiyah Bilal, MD, MPH*
Christopher Counts, MD, MSc*
Matthew Straight, MD* Michelle P. Lin, MD, MPH, MS*†
* †
Icahn School of Medicine at Mount Sinai, Department of Emergency Medicine, New York, New York Icahn School of Medicine at Mount Sinai, Department of Population Health Science and Policy, New York, New York
Section Editor: Mark Langdorf, MD, MHPE
Submission history: Submitted May 6, 2021; Revision received March 3, 2022; Accepted April 8, 2022
Electronically published August 11, 2022
Full text available through open access at http://escholarship.org/uc/uciem_westjem DOI: 10.5811/westjem.2022.3.53065
Introduction: The recent spread of coronavirus disease 2019 (COVID-19) has disproportionately impacted racial and ethnic minority groups; however, the impact of healthcare utilization on outcome disparities remains unexplored. Our study examines racial and ethnic disparities in hospitalization, medication usage, intensive care unit (ICU) admission and in-hospital mortality for COVID-19 patients.
Methods: In this retrospective cohort study, we analyzed data for adult patients within an integrated healthcare system in New York City between February 28–August 28, 2020, who had a labconfirmed COVID-19 diagnosis. Primary outcome was likelihood of inpatient admission. Secondary outcomes were differences in medication administration, ICU admission, and in-hospital mortality.
Results: Of 4717 adult patients evaluated in the emergency department (ED), 3219 (68.2%) were admitted to an inpatient setting. Black patients were the largest group (29.1%), followed by Hispanic/ Latinx (29.0%), White (22.9%), Asian (3.86%), and patients who reported “other” race-ethnicity (19.0%). After adjusting for demographic, clinical factors, time, and hospital site, Hispanic/Latinx patients had a significantly lower adjusted rate of admission compared to White patients (odds ratio [OR] 0.51; 95% confidence interval [CI] 0.34-0.76). Black (OR 0.60; 95% CI 0.43-0.84) and Asian patients (OR 0.47; 95% CI 0.25 - 0.89) were less likely to be admitted to the ICU. We observed higher rates of ICU admission (OR 2.96; 95% CI 1.43-6.15, and OR 1.83; 95% CI 1.26-2.65) and in-hospital mortality (OR 4.38; 95% CI 2.66-7.24; and OR 2.96; 95% CI 2.12-4.14) at two communitybased academic affiliate sites relative to the primary academic site.
Conclusion: Non-White patients accounted for a disproportionate share of COVID-19 patients seeking care in the ED but were less likely to be admitted. Hospitals serving the highest proportion of minority patients experienced the worst outcomes, even within an integrated health system with shared resources. Limited capacity during the COVID-19 pandemic likely exacerbated pre-existing health disparities across racial and ethnic minority groups. [West J Emerg Med. 2022;23(5)601–612.]
INTRODUCTION
Since the beginning of the coronavirus 2019 (COVID-19) pandemic, over 30.3 million people in the
United States have been infected, and over 500,000 have died.1 Of these, over 31,000 were in the New York City (NYC) area alone. However, the burden of illness has been
Volume 23, no. 5: September 2022 601 Western Journal of Emergency Medicine Original Research
unequally distributed among racial and ethnic groups, with early evidence demonstrating substantially higher burden of disease and worse health outcomes among Black, Asian, and Hispanic/Latinx persons.2 The disproportionate burden of disease among racial minorities has been consistent with –and has potentially exacerbated – pre-existing disparities in health outcomes.3-10
The onset of the pandemic in NYC in early 2020 was characterized by an unprecedented surge in the demand for healthcare, associated with limited capacity and resources among healthcare facilities.11 One of the most consequential decisions that emergency physicians make on a daily basis is whether to admit a patient to the hospital. The decision to admit became even more challenging when caring for an overwhelming number of patients with a highly communicable disease requiring isolation and limited access to supplemental oxygen and respirators.
While racial and ethnic differences in COVID-19 infection and mortality rates have been well established, the contribution of health systems to these differences in outcomes remains unexplored.12-15 To date, there has been little research examining differences in emergency department (ED) admission among racial groups and how these differences are associated with health outcomes. Therefore, we examined the association between race and the likelihood of admission among COVID-19 patients presenting to the ED. Among patients admitted to the hospital, we also examined the association of race with the likelihood of medication administration, intensive care unit (ICU) admission, and death.
METHODS
We conducted a retrospective analysis using electronic health record (EHR) data from a large, urban, academic health system in NYC with three academic sites based in Manhattan and two community-based academic affiliates in Brooklyn and Queens. The institutional review board approved this study. No sponsors or funding were obtained for this study. We adhered to the Strengthening the Reporting of Observational Studies in Epidemiology (STROBE) guidelines for reporting observational studies.
Clinical data for this analysis were extracted from the EHR using an enterprise data warehouse specifically designed to store COVID-19-related patient information. This was performed periodically by a separate group of researchers and shared in a secure, Health Insurance Portability and Accountaility Act-compliant database for ease of analysis by different investigator groups. Data extracted included patient demographics (age, gender, patient-reported race and ethnic group, preferred language, primary expected payer); chronic conditions documented through diagnosis codes in the International Classification of Disease 10th Revision (ICD10); body mass index; detailed visit history such as date(s) of visit, type of visit, initial vital signs, laboratory results, and medications administered. All patients satisfying one or more
Population Health Research Capsule
What do we already know about this issue?
COVID-19 has disproportionally affected racial/ethnic minorities. Disparities in treatment have been shown to affect outcomes for numerous other conditions.
What was the research question?
Were there racial and ethnic disparities in COVID-19 admission rates from the ED, and in medication administration, and mortality?
What was the major finding of the study?
Non-White patients were more likely to seek care for COVID-19 in the ED but had lower adjusted odds of hospital and ICU admission.
How does this improve population health?
Lower rates of ED admission among nonWhite COVID-19 patients after adjusting for clinical severity may be due to structural racism; efforts targeting ED clinicians may reduce disparities.
of the following criteria were included in the database: 1) had a COVID-19 related encounter diagnosis; 2) had an encounter with a COVID-19 related visit type; 3) had an order or result for a severe acute respiratory syndrome coronavirus 2 (SARSCoV-2) Mount Sinai Health System (MSHS) laboratory test; or 4) had a SARS-CoV-2 test result from the New York State Department of Health (NYSDOH) Wadsworth laboratory.
Because ethnicity is infrequently reported by nonHispanic patients and Hispanic/Latinx patients’ race is frequently reported as “other” or unknown, we used a combined race-ethnicity variable derived by the data warehouse as our predictor of interest. Race-ethnicity groups were defined as White, Black, Hispanic/Latinx, Asian, and other (represented by American Indian, other, and unknown). Given that race-ethnicity was our primary variable of interest, we excluded patients with missing race-ethnicity (6.29%). The cohort included adult patients ≥18 years of age.
The primary outcome of interest was admission to the hospital from the ED. Of note, during the COVID-19 pandemic, observation status was suspended due to capacity limitations. For our analysis, we included all patients who had a visit type of ED and/or inpatient and had a positive SARS-CoV-2 test result from the MSHS laboratory or NYSDOH laboratory. Secondary outcomes included likelihood of receiving medications for the treatment of
Western Journal of Emergency Medicine 602 Volume 23, no. 5: September 2022 Racial and Ethnic Disparities Among Patients with COVID-19 Serrano et al.
COVID, ICU admission, and in-hospital death. For these outcomes, we also excluded patients discharged from the ED given the reduced likelihood of COVID-19-specific prescription medication administration in outpatient settings. We focused our analysis on medications that were designated primarily for the treatment of COVID-19 to minimize confounders. The primary medications of interest were hydroxychloroquine, remdesivir, interleukin-6 (IL-6) inhibitors as a class (tocilizumab, sarilumab), oral steroids (prednisone, prednisolone, oral dexamethasone), and intravenous (IV) steroids (methylprednisolone, hydrocortisone, IV dexamethasone).
In our primary analysis examining differences in admission rates, we adjusted for the previously listed patient demographics; medical risk factors including obesity, hypertension (classified separately because it is an independent risk factor for poor COVID-19 outcomes but not included in the Charlson Comorbidity Index [CCI] score), smoking status, CCI score,16 and abnormal vital signs including oxygen saturation. We also adjusted for hospital site and month, given the differences in resource availability and practice patterns in different hospital settings during different phases of the pandemic. For secondary outcomes among admitted patients, we also adjusted for abnormal laboratory findings (white blood cell including lymphocyte and neutrophil count, platelets, alanine transaminase, troponin, glomerular filtration rate (GFR), D-dimer, C-reactive protein, ferritin, IL-6). We evaluated the inclusion of recently derived but unvalidated COVID-19 risk scores but elected not to include them because they were not available at the time of data collection to emergency clinicians who were making the decision to admit, and due to lack of validation.
We conducted parametric and non-parametric tests for all descriptive statistics, as appropriate. Categorical measures are presented as percentages. Continuous measures are presented as means and standard deviations or medians and interquartile ranges. We conducted bivariate tests of association, and then examined patient-level outcomes using multilevel, multivariable logistic regression to test for differences in the odds of inpatient admission, medication administration, ICU admission, and in-hospital mortality after accounting for hospital-level clustering. We conducted sensitivity analyses by including patients with suspected but not confirmed COVID-19 in the cohort and examining specific medication types in separate models (specifically steroids and hydroxychloroquine). All regression variables were selected a priori. We conducted analyses in Stata 16 (StataCorp LLC, College Station, TX). We adhered to STROBE guidelines for reporting observational studies.
RESULTS
A total of 4,717 adult patients with a positive SARSCoV-2 test in the ED or inpatient setting within the time
period of interest were included in the primary analysis. Of these, 3,219 (68.2%) were admitted to an inpatient setting and were included in the analyses examining differences in medication administration, ICU admission, and death.
Demographic and clinical data for all patients is by race-ethnicity in Table 1. Black patients were the largest group (29.1%), followed by Hispanic/Latinx (29.0%), White (22.9%), Asian (3.86%), and patients who reported “other” race-ethnicity (15.1%). Hispanic/Latinx patients (27.7%), Asian (25.8%), and Black (18.1%) patients were more frequently insured by Medicaid compared to White patients (7.24%). Black (35.1%), Asian (32.4%), and Hispanic/ Latinx (31.8%) patients were also more likely to have the highest chronic disease burden, defined as CCI score 3 or higher compared to White patients (26.6%). Black (33.3%) and Hispanic/Latinx (30%) patients were also more likely to be obese, while Asian (39.6%), Hispanic/Latinx (37.6%), and Black (32.5%) patients were more likely to have been diagnosed with hypertension. Black patients were disproportionately overrepresented at the community-based academic affiliate in Brooklyn, while Asian and Hispanic/ Latinx patients were disproportionately overrepresented at the community-based academic affiliate in Queens. Unadjusted mortality was highest among Black (28.2%) and Asian (25.3%) patients.
Table 2 shows characteristics and factors associated with admission from the ED. White patients (24.3%) were disproportionately overrepresented among admitted patients, while Hispanic/Latinx (27.8%) and Black (19.3%) patients were underrepresented. Hispanic/Latinx patients had a significantly lower adjusted rate of admission compared to White patients (odds ratio [OR] 0.51; 95% confidence interval [CI] 0.34-0.76). Patients aged 36-55 years (OR 1.97; 95% CI 1.15-3.40), and 75 years or older (OR1.97; 95% CI 1.02-3.81) were more likely to be admitted relative to those aged 18-35 years. Patients insured by Medicaid (OR 2.02; 95% CI 1.36-2.99) and Medicare (OR 1.63; 95% CI 1.09-2.44) also had significantly higher rates of admission compared to patients with private insurance. Both severe and mild hypoxia were significantly associated with admission (OR 39.6; 95% CI 24.46-64.35 for oxygen saturation (SpO2) 92-96%, and OR 241.7; 95% CI 140.36-416.25 for SpO2 <92%) as was fever (OR 4.59; 95% CI 3.47-6.09). We found significant and progressively higher odds of admission in April through August relative to March. We also found significantly lower odds of admission (OR 0.68; 95% CI 0.46-0.99) at the community-based, academically affiliated hospital site located in Queens compared to the academic, quaternary-care referral hospital of the healthcare system located in Manhattan.
Factors associated with ICU admission are shown in Table 3. Patients of Black (OR 0.60; 95% CI 0.43-0.84) and Asian race (OR 0.47; 95% CI 0.25-0.89) were less likely to be admitted to an ICU setting. Patients in the older age
Volume 23, no. 5: September 2022 603 Western Journal of Emergency Medicine Serrano et al. Racial and Ethnic Disparities Among Patients with COVID-19
Table 1. Characteristics of study sample by race and ethnicity.
Patient/hospital characteristic
Total N = 4,717 White (22.85%, N = 1,078) Black (29.13%, N = 1,374 Hispanic/Latinx (29.02%, N = 1,369) Asian (3.86 %, N = 182) Other (15.14%, N = 714)
Age, mean (SD) 63.51 (17.33) 68.70 (17.38) 61.56 (16.54) 61.90 (17.74) 63.22 (15.92) 62.61 (16.81)
Female 46.92 42.95 51.75 47.48 40.66 44.12
English as primary language 80.33 91.47 96.51 54.93 74.73 82.49
Insurance
Missing 1.08 1.21 1.02 1.02 1.65 0.98
Medicaid 19.31 7.24 18.05 27.68 25.82 22.27
Medicare 48.95 62.15 44.76 46.38 37.36 44.96
Private 22.28 22.36 27.80 16.07 28.02 21.99
Other 7.29 6.03 7.50 7.38 7.14 8.68
Self-pay 1.08 1.02 0.87 1.46 0.00 1.12
Hospital Site
Brooklyn 21.05 29.22 36.24 3.51 20.33 13.31
Queens 17.77 18.27 6.19 25.20 37.36 20.03
Manhattan 1 32.99 29.87 28.31 35.87 25.82 43.00
Manhattan 2 9.24 14.94 6.11 8.84 10.44 7.14
Manhattan 3 18.95 7.70 23.14 26.59 6.04 16.53
Time period (2020)
March 1-March 31 42.61 42.67 44.54 41.49 37.36 42.30
April 1-30 46.24 45.45 43.81 47.48 51.10 48.46
May 1-31 6.21 6.77 7.13 5.33 7.69 4.90
June 1-Aug 19 4.94 5.10 4.51 5.70 3.85 4.34
Total prior visits *
0 97.46 97.59 97.02 97.22 95.05 99.16
1 2.40 2.13 2.84 2.63 4.95 0.84
2+ 0.15 0.28 0.15 0.15 0.00 0.00
Past Medical History
Hypertension 32.65 28.48 32.53 37.62 39.56 27.87
CCI score 0 58.30 58.72 58.15 54.57 58.24 65.13
CCI score 1-2 11.30 14.66 10.04 10.30 9.34 11.06
CCI score 3+ 30.40 26.62 31.80 35.14 32.42 23.81
Obesity (BMI ≥30) 28.47 24.86 33.26 29.95 12.64 25.91
Smoker (active/ former/ intermittent) 28.58 29.31 30.35 28.12 26.92 25.35
Initial Vital Signs
Temperature ≥37.5° Celsius 65.06 60.58 62.66 67.86 69.78 69.89
Heart rate ≥90 64.83 58.44 65.72 68.01 62.64 67.23
Respiratory rate ≥22 31.21 29.59 27.44 33.46 34.07 35.85
Systolic BP ≤100 1.95 2.32 1.67 1.61 1.65 2.66
SpO2 ≥96% 20.27 16.79 25.18 18.41 20.88 19.47
SpO2 92-95% 27.54 26.72 27.80 29.00 17.03 28.15
*Total prior encounters ≤14 days before index ED encounter (all encounter types, including outpatient and telehealth). SD, standard deviation; CCI, Charlson comorbity index; BMI, body mass index; BP, blood pressure; SpO2, oxygen saturation; ALT, alanine transaminase; GFR, glomerular filtration rate; CRP, C-reactive protein; IV, intravenous; ICU, intensive care unit; U/L, units per liter; μg/L, micrograms per liter; pg/L, picogram per liter; IL-6, interleukin-6; PO, by mouth; IQR, interquartile range.
Western Journal of Emergency Medicine 604 Volume 23, no. 5: September 2022 Racial and Ethnic Disparities Among Patients with COVID-19 Serrano et al.
Serrano
Table 1. Continued.
Patient/hospital characteristic
Racial and Ethnic Disparities Among Patients with
Total N = 4,717 White (22.85%, N = 1,078) Black (29.13%, N = 1,374
Hispanic/Latinx (29.02%, N = 1,369) Asian (3.86 %, N = 182) Other (15.14%, N = 714)
SpO2 <92% 52.02 56.40 46.72 52.52 62.09 52.10
Initial Lab Tests
White blood cell count <4K or >12K 23.81 24.77 16.74 25.86 32.97 29.69
Absolute neutrophil count <500 18.00 17.44 14.56 19.72 24.18 20.59
Absolute lymphocyte count <1500 81.03 82.00 78.17 82.25 80.22 82.91
Platelet count 2.97 2.23 2.69 3.58 80.22 3.78 <1500 per mm3 2.97 2.23 2.69 3.58 1.65 3.78
ALT ≥40 U/L 42.02 39.98 37.19 44.85 52.75 46.22
Troponin ≥0.04 pg/L 53.17 54.36 53.28 51.79 56.04 53.06
GFR 15-60 ml/min 43.80 46.29 46.43 39.08 43.96 43.98
GFR <15 ml/min 15.35 11.78 19.58 13.59 16.48 15.69
D-dimer ≥0.5 mg/L 59.55 58.44 56.55 61.50 60.99 62.89
CRP ≥16.6 mg/L 25.61 25.88 30.79 24.03 19.23 19.89
Ferritin >300 μg/L 52.51 51.86 48.98 52.59 60.99 57.98
IL-6 ≥ 80 pg/mL 19.19 17.81 18.56 18.63 24.18 22.27
Medications (% receiving)
Any medication 52.70 53.90 51.38 52.30 55.49 53.50
Hydroxychloroquine 46.83 47.31 46.00 46.53 49.45 47.62
Remdesivir 1.65 1.86 1.31 1.75 2.20 1.68
IL-6 inhibitor 3.52 3.25 4.00 2.56 7.69 3.78
Steroids (PO + IV) 20.75 19.67 17.47 23.16 28.02 22.27
Outcomes
Hospital days, median 6.92 (3.87 - 11.89) 6.83 (3.94 - 11.82) 7.12 (4.08 - 12.51) 6.87 (3.62 - 11.11) 8.02 (4.33 13.24) 6.41 (3.49 11.61)
ICU admission 14.54 14.29 13.25 15.41 13.19 16.11
ICU days, median (IQR) 4.43 (1.85 - 9.59) 3.73 (1.80 - 7.68) 4.85 (2.03 - 10.36) 4.61 (1.75 - 11.16) 6.80 (1.72 13.21) 3.89 (1.90 9.42)
Died in hospital % 22.56 28.20 19.36 19.87 25.27 24.65
*Total prior encounters ≤14 days before index ED encounter (all encounter types, including outpatient and telehealth). SD, standard deviation; CCI, Charlson comorbity index; BMI, body mass index; BP, blood pressure; SpO2, oxygen saturation; ALT, alanine transaminase; GFR, glomerular filtration rate; CRP, C-reactive protein; IV, intravenous; ICU, intensive care unit; U/L, units per liter; μg/L, micrograms per liter; pg/L, picogram per liter; IL-6, interleukin-6; PO, by mouth; IQR, interquartile range.
group, over 75 years, (OR 0.4; 95% CI 0.19-0.85) were significantly less likely to be admitted to the ICU relative to those aged 18-35 years. Patients were more likely to be admitted to the ICU if they were obese (OR 1.43; 95% CI 1.12-1.84), severely hypoxic (OR 12.19; 95% CI 1.8679.78), febrile (OR 1.86; 95% CI 1.23-2.80), or tachypneic (OR 1.92; 95% CI 1.50-2.47) but less likely to be admitted to the ICU if hypotensive (OR 0.26; 95% CI 0.08-0.86). Nearly all lab abnormalities were independently associated
with increased ICU admission except for lymphocyte count, D-dimer, and ferritin. Hospital site was again independently associated with outcomes in this analysis with three sites having significantly increased ICU admission relative to the quaternary-care academic hospital, including the community-based academic affiliate sites in Brooklyn (OR 2.96; 95% CI 1.43-6.15) and Queens (OR 1.83; 95% CI 1.26-2.65). Patients were less likely to be admitted to the ICU in April (OR 0.46; 95% CI 0.30-0.49) relative to March.
Volume 23, no. 5: September 2022 605 Western Journal of Emergency Medicine
et al.
COVID-19
Table 2. Characteristics and factors associated with emergency department admission.
Characteristic
Age Groups (%)
1 (18-35)
Total N = 4,717
Admitted (68.24%) N = 3,219 Discharged (31.76%) N = 1,498
Odds ratio for admission 95% Confidence interval
8.14 3.39 18.36 Ref -
2 (36-55) 21.94 16.74 33.11 1.97* 1.15 - 3.40
3 (56-65) 20.92 20.35 22.16 1.24 0.72 - 2.13
4 (66-75) 22.3 25.54 15.35 1.70 3.13 - 3.13
5 (76+) 26.69 33.99 11.01 1.97* 1.02 - 3.81
Female 46.92 44.77 51.54 1.15 0.88 - 1.50
English as primary language 80.33 78.60 84.05 0.92 0.63 - 1.34
Race
White (reference) 22.85 24.29 19.76 Ref -
Black 29.13 27.80 31.98 0.74 0.50 - 1.10
Hispanic/Latinx 29.02 28.64 29.84 0.51** 0.34 - 0.76
Asian 3.86 4.01 3.54 0.74 0.39 - 1.43
Other 15.14 15.25 14.89 0.77 0.47 - 1.25
Insurance
Missing 1.08 0.75 1.80 0.61 0.19 - 1.96
Medicaid 19.31 19.20 19.56 2.02** 1.36 - 2.99
Medicare 48.95 59.89 25.43 1.63* 1.09 -2.44
Private (reference) 22.28 13.23 41.72 RefOther 7.29 6.77 8.41 1.64 0.89 - 3.02
Self-pay 1.08 0.16 3.07 0.55 0.12 -2.56
Hospital Site
Brooklyn 21.05 15.81 32.31 1.17 0.77 - 1.78
Queens 17.77 19.07 14.95 0.68* 0.46 - 0.99
Manhattan 1 32.99 34.54 29.64 RefManhattan 2 9.24 10.07 7.48 0.66 0.43 - 1.01
Manhattan 3 18.95 20.50 15.62 0.86 0.59 -1.25
TIME PERIOD
March 1-March 31 42.61 34.86 59.28 ReferenceApril 1-30 46.24 53.25 31.17 1.92** 1.45 - 2.54
May 1-31 6.21 7.52 3.40 5.71** 2.99 - 10.90
June 1-Aug 19 4.94 4.38 6.14 7.40** 3.80 - 14.42
Prior visits***
0 97.46 97.17 98.06 Reference 1 2.40 2.67 1.80 0.85 0.37 - 1.94 2+ 0.15 0.16 0.13 3.01 0.79 - 11.50
Past Medical History
Hypertension 32.65 38.83 19.36 0.95 0.70 - 1.30
CCI score 0 58.30 49.74 76.70 Reference
CCI score 1-2 11.30 13.58 6.41 1.48 0.99 - 2.22
CCI score 3+ 30.40 36.69 16.89 1.35 0.98 - 1.86
* P <0.05; **P <0.01.
***Total prior encounters ≤14 days before index ED encounter (all encounter types, including outpatient and telehealth).
CCI, Charlson comorbidity index.
Western Journal of Emergency Medicine 606 Volume 23, no. 5: September 2022 Racial and Ethnic Disparities Among Patients with COVID-19 Serrano et al.
Serrano
Table 2. Continued.
Characteristic
Racial and Ethnic Disparities Among
Total N = 4,717 Admitted (68.24%) N = 3,219 Discharged (31.76%) N = 1,498
Odds ratio for admission 95% Confidence interval
Obesity (BMI ≥30 kg/m2) 28.47 32.68 19.43 0.79 0.60 - 1.05
Smoker (Active/former intermittent) 28.58 31.62 22.03 0.93 0.70 -01.22
Initial Vital Signs
Temperature ≥37.5°C 65.06 79.93 33.11 4.59 3.47 - 6.09
Heart rate ≥90 64.83 68.47 57.01 1.02 0.77 - 1.34
Respiratory rate ≥22 31.21 41.35 9.41 1.31 0.94 - 1.82
Systolic BP ≤100 1.95 1.93 2.00 0.50 0.22 - 1.12
SpO2 ≥96% 20.27 1.12 61.42 Reference
SpO2 92-95% 27.54 26.75 29.24 39.67** 24.46 - 64.35
SpO2 <92% 52.02 72.13 8.81 241.71** 140.36 - 416.25
* P <0.05; **P <0.01.
***Total prior encounters ≤14 days before index ED encounter (all encounter types, including outpatient and telehealth). BMI, body mass index; BP, blood pressure; C, Celsius; SpO2, oxygen saturation.
Table 3 shows factors associated with in-hospital death. Increasing age, tachypnea, hypoxia, elevated troponin, and reduced GFR were independently associated with higher odds of in-hospital mortality. There was significantly higher mortality at the community-based academic affiliate sites in Brooklyn (OR 4.38; 95% CI 2.66-7.24) and Queens (OR 2.96; 95% CI 2.12-4.14) relative to the quaternary-care academic hospital. In-hospital mortality decreased significantly with each time period as the pandemic progressed. Absolute lymphocyte count below 1500 (OR 0.25; 95% CI 0.15-0.44) and receiving hydroxychloroquine (OR 0.58, 95% CI 0.450.75) were associated with lower odds of mortality. After adjusting for hospital site, time period, demographics and clinical factors, race was not independently associated with in-hospital mortality.
We also analyzed predictors associated with medication administration. The data is included as Appendix A. Patients were more likely to receive medication if they were severely hypoxic (SpO2 <92%, OR14.18; 95% CI 7.86-25.57), mildly hypoxic (SpO2 92-96%; OR 6.97; 95% CI 3.93-12.35), febrile (OR 1.91; 95% CI 1.52-02.39), treated at the communitybased academic affiliate site in Brooklyn (OR 2.53; 95% CI 1.68-3.80), admitted to the ICU (OR 1.42; 95% CI 1.04-1.93) or had abnormal lab values (white cell and lymphocyte count, transaminase, D-dimer, C-reactive protein, ferritin, and IL-6 levels). Patients were less likely to receive medications if they had a CCI score of 3 or higher (OR 0.74; 95% C 0.58-0.94) or were admitted in May through August relative to March. Race, age, insurance, and gender were not associated with odds of receiving COVID-19-related medications.
In sensitivity analyses examining patients with both suspected and confirmed COVID-19, we similarly found
significantly lower admission rates among ED patients of Hispanic/Latinx descent although the magnitude of difference was smaller (OR 0.71 vs 0.51). In addition, we found significantly lower rates of medication administration among non-English speaking inpatients; however, this finding did not persist after excluding patients with suspected but unconfirmed COVID-19. When we examined specific types of medications – hydroxychloroquine and steroids separately –we found no differences between racial or ethnic groups.
DISCUSSION
Black and Hispanic/Latinx patients accounted for the highest proportion of ED patients diagnosed with COVID-19; however, Hispanic/Latinx race-ethnicity was associated with significantly decreased odds of admission compared to White patients. Among hospitalized patients, Black and Asian patients were less likely to be admitted to the ICU relative to White patients. We also observed higher rates of ICU admission and mortality at two communitybased, academic affiliate sites serving predominantly Black, Asian, and Hispanic/Latinx populations.
Consistent with prior studies, Black and Hispanic/Latinx patients accounted for the largest proportion of COVID-19 patients and are substantially overrepresented relative to the demographic composition of both NYC and the US.17 Despite this, we observed lower rates of inpatient admission for Hispanic/Latinx patients, and lower rates of ICU admission for Black and Asian patients, respectively. The decreased likelihood of admission from the ED for Hispanic/Latinx patients in our analysis contrasts with previous studies that showed either similar or increased odds of admission for this patient population.2, 3, 12, 13, 18-20 The majority of these studies relied
Volume 23, no. 5: September 2022 607 Western Journal of Emergency Medicine
et al.
Patients with COVID-19
Racial
Table 3. Characteristics and factors associated with intensive care unit admission and in-hospital mortality.
Characteristic
Age Groups %
Admitted to ICU (21.31%) N = 686
Not admitted to ICU (78.69 %) N = 2,533
Odds ratio for ICU admission 95% Confidence interval Died (29.89%) N = 962 Survived (70.11%) N = 2,257 Odds ratio for death 95% Confidence interval
18-35 years 4.23 8.81 Reference 0.19 10.46 Reference36-55 years 18.37 22.55 0.70 0.34 - 1.45 7.71 26.09 9.25* 1.26 - 67.75 56-65 years 22.01 20.74 0.59 0.29 - 1.22 15.51 22.50 16.31** 2.23119.15 66-75 years 29.30 21.11 0.61 0.29 - 1.28 25.09 21.49 20.42** 2.75151.72
76+ years 26.09 26.79 0.40* 0.19 - 0.85 51.50 19.46 51.75** 6.96384.74
Female 40.23 45.99 1.03 0.81 - 1.31 44.49 44.88 0.89 0.72 - 1.12 English as primary language 76.53 79.16 0.79 0.57 - 1.08 75.78 79.80 0.94 0.70 - 1.27
Race
White (reference) 22.45 22.92 Reference - 28.57 21.19 Reference
Black 26.53 29.57 0.60** 0.43 - 0.84 25.00 30.33 0.76 0.56 - 1.02
Hispanic/Latinx 30.76 28.73 0.82 0.57 - 1.17 25.56 30.03 0.80 0.58 - 1.11
Asian 3.50 3.92 0.47* 0.25 - 0.89 4.32 3.72 0.62 0.35 - 1.11
Other 16.76 14.86 0.77 0.52 - 1.13 16.54 14.73 1.02 0.71 - 1.44
InsuranceMissing 1.60 0.51 2.93 0.69 - 12.45 0.42 0.89 1.29 0.16 - 10.59
Medicaid 20.55 18.83 1.07 0.72 - 1.58 12.79 21.93 1.42 0.92 - 2.21
Medicare 55.69 61.03 0.70 0.48 - 1.03 74.01 53.88 1.30 0.88 - 1.92
Private 13.99 13.03 Ref - 7.38 15.73 RefOther 8.02 6.44 1.01 0.59 - 1.73 5.41 7.35 1.37 0.80 - 2.34
Self-pay 0.15 0.16 - 0.22 -
Hospital SiteBrooklyn 13.56 16.42 2.96** 1.43 - 6.15 20.69 13.74 4.38** 2.66 - 7.24
Queens 16.76 19.70 1.83** 1.26 - 2.65 23.80 17.06 2.96** 2.12 - 4.14
Manhattan 1 35.86 34.19 Reference - 28.27 37.22 Reference Manhattan 2 12.24 9.47 2.62* 1.18 - 5.84 7.38 11.21 1.06 0.58 - 1.93
Manhattan 3 21.57 20.21 1.71 0.79 - 3.70 19.85 20.78 1.52 0.86 - 2.70
Time period -
March1-March 31 46.36 31.74 Reference - 38.15 33.45 ReferenceApril 1-30 40.38 56.73 0.38** 0.30 - 0.49 55.72 52.19 0.81 0.63 - 1.05
May 1-31 8.16 7.34 0.90 0.56 - 1.46 5.09 8.55 0.41** 0.24 - 0.70
June 1-Aug 19 5.10 4.18 1.88 0.92 - 3.85 1.04 5.80 0.08** 0.03 - 0.24
Total prior visits*** -
0 96.79 97.28 Reference - 97.51 97.03 Reference
1 2.77 2.65 1.09 0.56 - 2.12 2.29 2.84 0.86 0.45 - 1.62
2+ 0.44 0.08 4.83 0.96 - 24.33 0.21 0.13 0.69 0.14 - 3.30
Past medicalHypertension 37.76 39.12 0.79 0.61 - 1.03 42.52 37.26 1.06 0.83 - 1.35
*P <0.05; **P <0.01.
***Total prior encounters ≤14 days before index ED encounter (all encounter types, including outpatient and telehealth).
*** Frequencies reported but excluded from the model as length of stay is confounded by mortality.
ICU, intensive care unit.
Western Journal of Emergency Medicine 608 Volume 23, no. 5: September 2022
and Ethnic Disparities Among Patients with COVID-19 Serrano et al.
Table 3. Continued.
Characteristic
Admitted to ICU (21.31%) N = 686
Not admitted to ICU (78.69 %) N = 2,533
Racial and Ethnic Disparities Among Patients
Odds ratio for ICU admission 95% Confidence interval Died (29.89%) N = 962 Survived (70.11%) N = 2,257 Odds ratio for death 95% Confidence interval
CCI score 0 47.38 50.38 Ref - 46.47 51.13 Ref -
CCI score 1-2 90.00 13.70 0.98 0.67 - 1.41 14.97 12.98 1.06 0.77 - 1.47
CCI score 3+ 271.00 35.93 1.00 0.75 - 1.33 38.57 35.89 1.00 0.77 - 1.30
Obesity (BMI ≥30 kg/ m2) 40.52 30.56 1.43** 1.12 - 1.84 30.15 33.76 1.10 0.88 - 1.39
Smoker (active/ former intermittent) 32.65 30.56 1.12 0.88 - 1.44 32.33 31.32 1.06 0.84 - 1.33
Initial vital signs
Temperature ≥ 37.5 °Celsius 91.98 76.67 1.86** 1.23 - 2.80 83.26 78.51 0.82 0.61 - 1.10
Heart rate ≥ 90 74.20 66.92 1.19 0.91 - 1.55 68.81 68.32 1.11 0.88 - 1.40
Respiratory rate ≥22 59.33 36.48 1.92** 1.50 - 2.47 54.78 35.62 1.66** 1.32 - 2.10
Systolic BP ≤100 1.02 2.17 0.26 0.08 - 0.86 2.70 1.60 1.25 0.61 - 2.55
SpO2 ≥96% 0.29 1.34 Ref 0.21 1.51 Ref
SpO2 92-95% 8.60 31.66 5.04 0.76 - 33.35 6.03 35.58 1.06 0.48 - 2.36
SpO2 <92% 91.11 67.00 12.19** 1.86 - 79.78 93.76 62.92 5.33** 2.45 - 11.61
Initial Lab Tests
White blood cell count < 4K or >12K 44.61 28.62 2.18** 1.46 - 3.25 39.09 29.02 1.23 0.87 - 1.74
Absolute neutrophil count <500 37.76 21.63 1.61** 1.15 - 2.27 32.43 21.93 1.02 0.74 - 1.42
Absolute lymphocyte count <1500 98.25 97.79 1.74 0.79 - 3.83 96.15 98.63 0.25** 0.15 - 0.44
Platelet count < 1500 per mm3 9.62 2.76 2.06** 1.29 - 3.30 5.72 3.59 0.95 0.54 - 1.68
ALT ≥40 U/L 73.47 51.52 1.46** 1.13 - 1.88 62.47 53.52 0.93 0.73 - 1.18 Troponin ≥0.04 pg/L 78.86 65.06 1.54** 1.17 - 2.03 78.38 63.58 1.53** 1.19 - 1.97
GFR 15-60 ml/min 76.82 51.80 2.81** 2.15 - 3.68 82.22 46.43 2.84** 2.22 - 3.64
GFR <15 ml/min 39.36 16.78 2.36** 1.80 - 3.08 40.33 13.60 3.02** 2.31 - 3.94
D-dimer ≥0.5 mg/L 90.52 77.62 1.56* 1.01 - 2.41 84.82 78.47 0.94 0.65 - 1.36
CRP ≥16.6 mg/L 42.71 32.37 1.87* 1.00 - 3.48 38.88 32.74 0.98 0.61 - 1.59
Ferritin >300 μg/L 84.55 68.73 0.77 0.53 - 1.11 81.08 68.28 1.19 0.86 - 1.64
IL-6 ≥80 pg/mL 57.00 19.62 3.92** 3.02 - 5.08 43.56 20.78 1.94** 1.48 - 2.53
Outcomes
Hospital days, median (IQR) **** 10.52 (5.26- 20.63) 6.35 (3.64 -10.49) 77.86 73.24
Died in hospital 54.96 23.10 67.67 66.59 0.58** 0.45 - 0.75
*P <0.05; **P <0.01.
***Total prior encounters ≤14 days before index ED encounter (all encounter types, including outpatient and telehealth).
*** Frequencies reported but excluded from the model as length of stay is confounded by mortality.
ICU, intensive care unit; CCI, Charlson comorbidity index; BMI, body mass index; BP, blood pressure; SpO2, oxygen saturation; k, thousand; mm3, millimeters cubic; U/L, units per liter; mg/L, milligrams per liter; μg/L, micrograms per liter; pg/mL, picograms per milliliter; ALT, alanine transaminase; GFR, glomerular filtration rate; CRP, C-reactive protein; IQR, interquartile range.
on population-level statistics without controlling for disease severity or other demographic characteristics. Our results differ from one recent retrospective analysis out of NYC with
similar methods; however, our study sample includes a longer time period and attempts to control for time of presentation and site.21 It is possible that in our ED cohort Hispanic/Latinx
Volume 23, no. 5: September 2022 609 Western Journal of Emergency Medicine Serrano et al.
with COVID-19
patients were less sick overall and, therefore, less likely to require admission; however, this is unlikely since we controlled for hypoxia and other clinical indicators of disease severity that are likely to be associated with the decision to admit.
The lower admission rates at the community-based site in Queens may reflect the higher incidence of COVID-19 in that borough and strained capacity relative to Manhattan sites, resulting in fewer available inpatient beds and higher risk discharges.19-21 Another possible explanation is that Hispanic/ Latinx patients were seeking care at hospitals farther from home, given prior research suggesting lower rates of admission are associated with increasing distance to a hospital from a patient’s home. 22 Given that about 75% of frontline workers in NYC are people of color,23 it is possible that many Hispanic/ Latinx patients in our cohort lived far from the ED they were evaluated in and presented due to the proximity to their place of work. The proportion of Hispanic/Latinx patients (29%) in our sample is similar to that of NYC; however, only two of the top 50 NYC ZIP codes with the highest proportion of Hispanic/ Latinx residents are located in close proximity to study sites.17 It is possible that these patients would be reluctant to agree to hospitalization given their role as frontline workers and providers for their family.24,25
The decreased likelihood of admission and ICU utilization among minority patients could have reflected an inherent and systemic bias in our healthcare system toward fewer admissions of minority patients. Prior studies have explored the relationship between race and discriminatory access to healthcare resources, leading to decreased healthcare utilization among minority populations due to the expectation of worse outcomes or inability to pay.26,27 Hispanic/Latinx and Asian patients may also not have been able to communicate the severity of their symptoms due to language barriers. Our findings raise concerns that in the resource-depleted setting of a major pandemic, allocation of limited inpatient and ICU beds may have been racially biased.
Even within our healthcare system with a shared resource pool, we found significant differences in admission rates and clinical outcomes between different hospital sites, specifically higher rates of ICU admission and in-hospital mortality at two community-based, academic affiliates serving a disproportionately higher share of Black (Brooklyn), Asian and Hispanic/Latinx (Queens) patients. Prior research has demonstrated poor COVID-19 outcomes associated with different settings of care.28 Not only are Black, Asian, and Hispanic/Latinx patients more likely to have pre-existing conditions and lack health insurance, leading to increased morbidity and decreased access to care,29 they are also more likely to live in racially segregated neighborhoods 30 and seek care at minority-serving hospitals, which are often less wellfunded and have fewer licensed and ICU beds per inhabitant.31 Prior evidence on maternal mortality has identified even wider disparities among Black patients treated at facilities primarily serving Black patients.32
Additionally, Black patients in our cohort were more likely to be female compared to their White counterparts. Studies have shown that male gender is associated with increased COVID-19 mortality,33 which suggests Black male patients were less likely to present to the ED when ill with COVID-19. This may reflect distrust of the medical system, decreased access to care or, as described above, decreased willingness to seek care given financial difficulties. While we did not examine within-hospital site differences in outcomes by race, further analysis of disparities in COVID-19 outcomes after accounting for community demographics is needed.
Our findings confirm that age is an independent risk factor for inpatient mortality, even after adjusting for other markers of pre-existing disease, severity of illness or demographics, consistent with prior studies.34-36 However, we found decreasing odds of being admitted to the ICU with increasing age. Combined with the increased odds of admission over time, these findings suggest allocation based on likelihood of survival due to extremely limited resources during a pandemic. Additional research is needed to further examine the impact of non-clinical factors on clinical care and resource allocation in a pandemic situation.
LIMITATIONS
Our analysis has several limitations. Our population was limited to one integrated healthcare system in NYC, which limits its generalizability to other settings; however, the study sample is diverse, and our findings are consistent with several national studies identifying disparities in utilization and outcomes. Our findings are also limited by the exclusion of the 6% of patients with missing data for race and ethnicity. While missing race-ethnicity data may be non-random, using imputation methods to estimate the probability of belonging to different racial groups, such as geocoding or surname data, only produces probability of belonging to a certain group, which may have underestimated their sampling variability and led to bias in our analysis.37
In addition, as described above, we did not have data on neighborhood, socioeconomic status, and other social determinants, which limits our ability to draw conclusions regarding geolocalized economic and racial factors that may be contributing to differential admission rates and clinical outcomes in our patient population. Lastly, we did not have data on endotracheal intubation or ventilation, given that our analysis was limited to structured data fields readily extracted from the EHR, and procedures such as intubation are more likely to appear in clinician documentation or billing records. However, we examined other patient-centered outcomes including ICU admission and death and adjusted for numerous clinical indicators of severity of illness.
CONCLUSION
In this largely diverse, urban, and multicultural population, we found a disproportionate burden of disease
Western Journal of Emergency Medicine 610 Volume 23, no. 5: September 2022 Racial and Ethnic Disparities Among Patients with COVID-19 Serrano et al.
and disparities in care among minority populations that was likely exacerbated by limited resources during the COVID-19 pandemic. Non-White patients accounted for a disproportionate share of COVID-19 patients seeking care in the ED but were less likely to be admitted to the ICU or hospitalized. Furthermore, hospitals serving the highest proportion of minority patients experienced the worst outcomes, even within an integrated health system serving a diverse patient population. Dismantling structural racism within the healthcare system and our society as a whole is necessary to improve the health and well-being of historically marginalized populations.
Address for Correspondence: Felipe Serrano, MD, Icahn School of Medicine at Mount Sinai, Department of Emergency Medicine, 250 West 57th Street, 15th Floor, New York, NY 10107. Email: felipe.serrano@mountsinai.org.
Conflicts of Interest: By the WestJEM article submission agreement, all authors are required to disclose all affiliations, funding sources and financial or management relationships that could be perceived as potential sources of bias. No author has professional or financial relationships with any companies that are relevant to this study. There are no conflicts of interest or sources of funding to declare.
Copyright: © 2022 Serrano et al. This is an open access article distributed in accordance with the terms of the Creative Commons Attribution (CC BY 4.0) License. See: http://creativecommons.org/ licenses/by/4.0/
race and ethnicity - United States, 2014-2016. MMWR Morb Mortal Wkly Rep. 2018;67(41):1147-50.
8. Chen J, Rizzo J. Racial and ethnic disparities in antidepressant drug use. J Ment Health Policy Econ. 2008;11(4):155-6.
9. Cunningham T, Croft J, Liu Y, et al. Vital Signs: racial disparities in age-specific mortality among Blacks or African Americans — United States, 1999–2015. MMWR Morb Mortal Wkly Rep. 2017;66(17):444–5.
10. Boulware L, Cooper L, Ratner L et al. Race and trust in the health care system. Public Health Rep. 2003;118(4):358-65.
11. Dar M, Swamy L, Gavin D, et al. Mechanical-ventilation supply and options for the COVID-19 pandemic. Leveraging all available resources for a limited resource in a crisis. Ann Am Thorac Soc. 2021;18(3):408-16.
12. Azar K, Shen Z, Romanelli R, et al. Disparities In outcomes among COVID-19 patients in a large health care system in California. Health Aff (Millwood). 2020;39(7):1253-62
13. Mendy A, Apewokin S, Wells AA, et al. Factors Associated with Hospitalization and Disease Severity in a Racially and Ethnically Diverse Population of COVID-19 Patients. medRxiv [Preprint]. 2020 Jun 27:2020.06.25.20137323. doi: 10.1101/2020.06.25.20137323. PMID: 32607513; PMCID: PMC7325178.
14. Cyrus E, Clarke R, Hadley D, et al. The impact of COVID-19 on African American communities in the United States. medRxiv [Preprint]. 2020 May 19:2020.05.15.20096552. doi: 10.1101/2020.05.15.20096552. Update in: Health Equity. 2020 Oct 30;4(1):476-483. PMID: 32511486; PMCID: PMC7273254.
15. Millett G, Jones A, Benkeser D, et al. Assessing differential impacts of COVID-19 on Black communities. Ann Epidemiol. 2020;47:37-44.
REFERENCES
1. United States COVID-19 Cases and Deaths by State. 2021. Available at: https://covid.cdc.gov/covid-data-tracker/#cases_ casesper100klast7days. Accessed March 21, 2021.
2. COVID-19 Racial and Ethnic Health Disparities. 2020. Available at: https://www.cdc.gov/coronavirus/2019-ncov/community/health-equity/ racial-ethnic-disparities/index.html. Accessed February 12, 2021.
3. Johnson T, Weaver M, Borrero S, et al. Association of race and ethnicity with management of abdominal pain in the emergency department. Pediatrics. 2013;132(4):e851-8.
4. Goyal M, Kuppermann N, Cleary S, et al. Racial disparities in pain management of children with appendicitis in emergency departments. JAMA Pediatr. 2015;169(11):996-1002.
5. Nathan A, Geng Z, Dayoub E, et al. Racial, ethnic, and socioeconomic inequities in the prescription of direct oral anticoagulants in patients with venous thromboembolism in the United States. Circ Cardiovasc Qual Outcomes. 2019;12(4):e005600.
6. Essien U, Holmes D, Jackson L, et al. Association of race/ethnicity with oral anticoagulant use in patients with atrial fibrillation: findings from the Outcomes Registry for Better Informed Treatment of Atrial Fibrillation II. JAMA Cardiol. 2018;3(12):1174-82.
7. Huang Y, Zhu W, Smith D, et al. HIV preexposure prophylaxis, by
16. Charlson M, Szatrowski T, Peterson J, et al. Validation of a combined comorbidity index. J Clin Epidemiol. 1994;47(11):1245-51.
17. ZIP Codes with the highest percentage of Hispanics in New York. Available at: http://zipatlas.com/us/ny/zip-code-comparison/ percentage-hispanic-population.htm. Accessed January 30,2021.
18. Webb Hooper M, Nápoles A, Pérez-Stable E. COVID-19 and racial/ ethnic disparities. JAMA. 2020;323(24):2466–7.
19. Wadhera R, Wadhera P, Gaba P, et al. Variation in COVID-19 hospitalizations and deaths across New York City boroughs. JAMA. 2020;323(21):2192-5.
20. Karaca-Mandic P, Georgiou A, Sen S. Assessment of COVID-19 hospitalizations by race/ethnicity in 12 states. JAMA Intern Med. 2021;181(1):131-4.
21. Ogedegbe G, Ravenell J, Adhikari S, et al. Assessment of racial/ethnic disparities in hospitalization and mortality in patients with COVID-19 in New York City. JAMA Netw Open. 2020;3(12):e2026881.
22. Goodman D, Fisher E, Stukel T, et al. The distance to community medical care and the likelihood of hospitalization: Is closer always better? Am J Public Health. 1997;87(7):1144-50.
23. American Community Survey 2014-2018 5-Year Estimates. 2019. Available at: https://data.census.gov/cedsci. Accessed February 15, 2021.
Volume 23, no. 5: September 2022 611 Western Journal of Emergency Medicine Serrano et al. Racial and Ethnic Disparities Among Patients with COVID-19
Racial and Ethnic Disparities Among Patients with COVID-19
24. Aliyu Z. Discharge against medical advice: sociodemographic, clinical and financial perspectives. Int J Clin Pract. 2002;56(5):325-7.
25. Alfandre D. “I’m going home”: discharges against medical advice. Mayo Clin Proc. 2009;84(3):255-60.
26. Yearby R. Racial inequities in mortality and access to health care. The untold peril of rationing health care in the United States. J Leg Med. 2011;32(1):77-91.
27. Schmidt H, Roberts D, Eneanya N. Rationing, racism and justice: advancing the debate around ‘colourblind’ COVID-19 ventilator allocation. J Med Ethics. 2022;48(2):126-30.
28. Rodriguez F, Solomon N, de Lemos J, et al. Racial and ethnic differences in presentation and outcomes for patients hospitalized with COVID-19: findings from the American Heart Association’s COVID-19 Cardiovascular Disease Registry. Circulation. 2021;143(24):2332-42.
29. Graham G. Disparities in cardiovascular disease risk in the United States. Curr Cardiol Rev. 2015;11(3):238-45.
30. Fang J, Madhavan S, Bosworth W, et al. Residential segregation and mortality in New York City. Soc Sci Med. 1998;47(4):469-76.
31. Douglas J, Subica A. COVID-19 treatment resource disparities and
social disadvantage in New York City. Prev Med. 2020;141:106282.
32. Howell E, Egorova N, Balbierz A, et al. Black-White differences in severe maternal morbidity and site of care. Am J Obstet Gynecol. 2020;135(2):28-293.
33. Gebhard C, Regitz-Zagrosek V, Neuhauser H, et al. Impact of sex and gender on COVID-19 outcomes in Europe. Biol Sex Differ. 2020;11(1):29.
34. Bonanad C, García-Blas S, Tarazona-Santabalbina F, et al. The effect of age on mortality in patients with COVID-19: a meta-analysis with 611,583 subjects. J Am Med Dir Assoc. 2020;21(7):915-8.
35. Lim J, Low K, Lin N, et al. Predictors for development of critical illness amongst older adults with COVID-19: beyond age to ageassociated factors. Arch Gerontol Geriatr. 2021;94:104331.
36. Michelozzi P, de’Donato F, Scortichini M, et al. Mortality impacts of the coronavirus disease (COVID-19) outbreak by sex and age: rapid mortality surveillance system, Italy, 1 February to 18 April 2020. Euro Surveill. 2020;25(19):2000620.
37. Silva G, Trivedi A, Gutman R. Developing and evaluating methods to impute race/ethnicity in an incomplete dataset. In: Health Services and Outcomes Research Methodology 2019;19: 175-195.
Western Journal of Emergency Medicine 612 Volume 23, no. 5: September 2022
Serrano et al.
Brief
Can Urinalysis and Past Medical History of Kidney Stones Predict Urine Antibiotic Resistance?
Michael Mohseni, MD* Emily C. Craver, MS† Michael G. Heckman, MS† Johnathan M. Sheele, MD, MPH, MHS*
Section Editor: Elissa Perkins, MD, MPH
Mayo Clinic, Department of Emergency Medicine, Jacksonville, Florida Mayo Clinic, Division of Clinical Trials and Biostatistics, Jacksonville, Florida
Submission history: Submitted September 25, 2022; Revision received April 14, 2022; Accepted April 27, 2022 Electronically published August 19, 2022 Full text available through open access at http://escholarship.org/uc/uciem_westjem DOI: 10.5811/westjem.2022.4.54872
Introduction: Urinary tract infections (UTI) are one of the most common infections encountered in the emergency department (ED) with an estimated 2-3 million annual visits. Commonly prescribed antibiotics for UTIs have shown growing rates of resistance. Previous studies lack direction on improving UTI treatment based on the labs available to the bedside clinician.
Methods: We sought to determine if antibiotic resistance in UTIs was related to demographics, urinalysis, and history of renal failure or kidney stones. We conducted an analysis of 892 women ≥18 years of age discharged from the ED with a UTI diagnosis. We assessed predictors of nitrofurantoin resistance, cefazolin resistance, ciprofloxacin resistance, and trimethoprim-sulfamethoxazole resistance using unadjusted and multivariable logistic regression models.
Results: Antibiotic resistance was 13.6% for nitrofurantoin, 11.9% for cefazolin, 12.8% for ciprofloxacin, and 17.1% for trimethoprim-sulfamethoxazole. In multivariable analysis, significant independent associations with an increased likelihood of resistance to nitrofurantoin were observed for less urine blood (OR [per 1 category increase of score] 0.81; P = 0.02); greater mucous (OR [per 1 category increase of score] 1.22; P = 0.02); less specific gravity urine (OR [per 1 category increase] 0.87; P = 0.04), and presence of any history of kidney stones (OR 3.24; P = 0.01). There were no significant predictors for cefazolin resistance (all P ≥0.06); age was the only significant predictor of ciprofloxacin resistance (OR per 10 year increase] 1.10, P = 0.05), and lower specific gravity urine was significantly associated with an increased risk of resistance to trimethoprim- sulfamethoxazole (OR [per 1 category increase] 0.88, P = 0.04).
Conclusion: Women with any history of kidney stones may have bacteriuria resistant to nitrofurantoin, suggesting that providers might consider alternative antibiotic therapies in this scenario. [West J Emerg Med. 2022;23(5)613–617.]
Urinary tract infections (UTI) are one of the most common infections encountered in the emergency department (ED) with an estimated 2-3 million annual visits.1 Widespread rapid antibiotic sensitivity testing is not available during the ED clinical visit; so antibiotics may be prescribed for which the bacteriuria is resistant. Given the difficulty in predicting the proper antimicrobial sensitivity in the setting of emerging and increasingly resistant bacteria, treatment failures may occur.2 Commonly prescribed antibiotics for UTIs, including trimethoprim-sulfamethoxazole, fluoroquinolones, and betalactams, have all shown growing rates of resistance.3 Previous studies have attempted to elucidate general characteristics of antimicrobial resistance of bacteria4-7 but lack clear direction
on improving successful UTI treatment based on the limited laboratory data available to the bedside clinician.
We sought to determine whether nitrofurantoin, cefazolin, ciprofloxacin, and trimethoprim-sulfamethoxazole resistance could be predicted based on triage and demographic data, urinalysis results, and past histories of renal failure/dialysis or kidney stones. We conducted an analysis of an existing dataset of ED patient encounters ≥18 years of age from a single healthcare system between April 18, 2014–March 7, 2017. We examined 892 women discharged from the ED with a UTI based on their discharge International Classification of Diseases (ICD) code and who had a positive urine culture (≥10,000 colony forming units per milliliter (CFU/mL) (CFU/mL bacteria in monoculture).
Volume 23, no. 5: September 2022 613 Western Journal of Emergency Medicine
Research Report
* †
Can Urinalysis and Past Medical History Predict Urine Antibiotic Resistance?
Women were considered pregnant if they had a pregnancy-related ICD code or a positive pregnancy test.
We assessed predictors of nitrofurantoin resistance, cefazolin resistance, ciprofloxacin resistance, and trimethoprim-sulfamethoxazole resistance using unadjusted and multivariable logistic regression models. Odds ratios (OR) and 95% confidence intervals (CI) were estimated and are interpreted as the multiplicative increase in the odds of antibiotic resistance for the given antibiotic. Multivariable models were adjusted for any variable with a P-value <0.10 in the unadjusted analysis for the given antibiotic resistance outcome (and also had <10% missing data). P-values less than
0.05 were considered statistically significant. We performed analyses using R Statistical Software version 4.0.3 (R Foundation for Statistical Computing, Vienna, Austria).
A summary of patient characteristics is shown in Table 1. Median age was 49 years, and 53.3% of the patients were White. Antibiotic resistance was 13.6% for nitrofurantoin, 11.9% for cefazolin, 12.8% for ciprofloxacin, and 17.1% for trimethoprimsulfamethoxazole. An evaluation of predictors of resistance to nitrofurantoin is provided in Table 2. In multivariable analysis (adjusting for urine blood, mucous, white blood cell clumps, and a history of kidney stones), significant independent associations with resistance to nitrofurantoin were observed for urine blood
Table 1. Summary of patients characteristics in 892 women analyzed..
Variable N Median (minimum, maximum) or No. (%) of patients
Age (years) 892 49 (18, 103)
Race 889
White 474 (53.3%)
Black 405 (45.6%)
Other 10 (1.1%)
Marital status 890
Single 423 (47.5%)
Married 259 (29.1%)
Other 208 (23.4%)
Primary care doctor 892 378 (42.4%)
Emergency severity index 869
1 1 (0.1%)
2 34 (3.9%)
3 568 (65.4%)
4 262 (30.1%) 5 4 (0.5%)
Urine specimen source 698
Clean catheter/voided urine 631 (90.4%)
Straight catheter or urine from new bladder catheter 41 (5.9%)
Bladder catheter not known to be new 25 (3.6%)
Suprapubic catheter 1 (0.1%)
Amorphous crystals urine (positive) 885 62 (7.0%)
Bacteria urine score 886
0 117 (13.2%)
1 255 (28.8%)
2 159 (17.9%)
3 151 (17.0%)
4 204 (23.0%)
Bilirubin urine score 885
0 852 (96.3%)
1 11 (1.2%) 2 17 (1.9%) 3 5 (0.6%)
Western Journal of Emergency Medicine 614 Volume 23, no. 5: September 2022
Mohseni et al.
Mohseni
Table 1. Continued.
Can Urinalysis and Past Medical History Predict Urine Antibiotic Resistance?
Variable N Median (minimum, maximum) or No. (%) of patients
Blood urine score 880
0 256 (29.1%)
1 189 (21.5%)
2 154 (17.5%)
3 281 (31.9%)
Glucose urine (positive) 886 63 (7.1%)
Ketones urine (positive) 885 115 (13.0%)
Leukocyte esterase urine score 873
0 76 (8.7%)
1 144 (16.5%)
2 104 (11.9%)
3 549 (62.9%)
Mucous urine score 885
0 634 (71.6%)
1 133 (15.0%)
2 43 (4.9%)
3 39 (4.4%) 4 36 (4.1%)
Nitrite urine (positive) 885 328 (37.1%)
Urine pH 887 6 (5, 9)
Protein urine (positive) 887 557 (62.8%)
Red blood cells 882 11 (0, 100)
Specific gravity urine 887
1.000 to 1.004 31 (3.5%)
1.005 to 1.009 227 (25.6%) 1.010 to 1.014 187 (21.1%) 1.015 to 1.019 162 (18.3%) 1.020 to 1.024 128 (14.4%) 1.025 to 1.029 96 (10.8%) 1.030 to 1.034 48 (5.4%)
≥ 1.035 8 (0.9%)
Trichomonas urine (positive) 885 4 (0.5%)
Urobilinogen urine (≥2) 887 173 (19.5%)
White blood cell clumps urine (present) 882 205 (23.2%)
White blood cells 877 36 (0, 100)
Yeast in urine (positive) 885 20 (2.3%)
Pregnant 892 12 (1.3%)
History of renal failure or dialysis 892 21 (2.4%)
History of kidney stones 892 28 (3.1%)
Resistance to cefazolin 831 99 (11.9%)
Resistance to ciprofloxacin 892 114 (12.8%)
Resistance to nitrofurantoin 853 116 (13.6%)
Resistance to trimethoprim-sulfamethoxazole 859 147 (17.1%)
Volume 23, no. 5: September 2022 615 Western Journal of Emergency Medicine
et al.
Can Urinalysis and Past Medical History Predict Urine Antibiotic Resistance?
Table 2. Evaluation of predictors of resistance to nitrofurantoin.
Unadjusted analysis
Multivariable analysis
Variable N OR (95% CI) P-value OR (95% CI) P-value
Age (10 year increase)
Race (non-White)
Marital status
853 1.03 (0.95, 1.12) 0.47 1.05 (0.95, 1.15) 0.34
850 1.24 (0.84, 1.84) 0.28 1.16 (0.77, 1.75) 0.49
851 Overall test of difference: P=0.49 Overall test of difference: P=0.43
Single 1.00 (reference) N/A 1.00 (reference) N/A
Married 0.90 (0.55, 1.43) 0.65 0.96 (0.58, 1.56) 0.87
Other 1.23 (0.76, 1.97) 0.38 1.34 (0.81, 2.19) 0.25
Primary care doctor
Emergency severity index (1 unit increase)
Urine specimen source (non-clean catch/ void urine)
Amorphous crystals urine (positive)
Bacteria urine score (1 category increase)
Bilirubin urine score (1 category increase)
Blood urine score (1 category increase)
853 1.01 (0.68, 1.50) 0.94 1.02 (0.68, 1.53) 0.91
830 0.86 (0.59, 1.23) 0.41 0.94 (0.65, 1.36) 0.74
670 1.42 (0.68, 2.74) 0.32 1.31 (0.62, 2.58) 0.45
846 1.56 (0.75, 3.00) 0.21 1.53 (0.72, 3.03) 0.24
847 0.99 (0.86, 1.14) 0.85 0.97 (0.84, 1.12) 0.66
846 0.76 (0.34, 1.33) 0.42 0.74 (0.32, 1.30) 0.37
842 0.82 (0.69, 0.96) 0.02 0.81 (0.69, 0.96) 0.02
Glucose urine (positive)
Leukocyte esterase urine score (1 category increase)
846 0.68 (0.33, 1.25) 0.24 0.60 (0.29, 1.12) 0.13
848 1.12 (0.50, 2.24) 0.76 1.12 (0.50, 2.27) 0.77 Ketones urine (positive)
836 0.98 (0.81, 1.19) 0.81 1.10 (0.90, 1.36) 0.37
Mucous urine score (1 category increase)
Urine pH (1 unit increase)
Protein urine (positive)
Red blood cells (10 unit increase)
Specific gravity urine (1 category increase)
Urobilinogen urine (≥2)
White blood cell clumps urine (present)
846 0.73 (0.47, 1.10) 0.13 0.68 (0.44, 1.04) 0.08
846 1.22 (1.03, 1.44) 0.02 1.22 (1.03, 1.43) 0.02 Nitrite urine (positive)
848 1.07 (0.86, 1.32) 0.53 1.08 (0.87, 1.34) 0.46
848 0.79 (0.53, 1.19) 0.26 0.99 (0.64, 1.55) 0.98
843 0.96 (0.91, 1.02) 0.23 1.01 (0.94, 1.09) 0.76
848 0.93 (0.82, 1.05) 0.26 0.87 (0.76, 0.99) 0.04
848 0.95 (0.56, 1.53) 0.83 0.82 (0.48, 1.35) 0.45
843 0.64 (0.38, 1.05) 0.09 0.69 (0.40, 1.13) 0.15
White blood cells (10 unit increase) 838 0.99 (0.94, 1.04) 0.69 1.02 (0.96, 1.08) 0.56
Yeast in urine (positive)
Pregnant
846 1.11 (0.26, 3.38) 0.87 1.12 (0.25, 3.52) 0.87
853 0.63 (0.03, 3.35) 0.66 0.58 (0.03, 3.18) 0.61
History of renal failure or dialysis 853 0.70 (0.11, 2.47) 0.64 0.73 (0.11, 2.60) 0.67
History of kidney stones 853 2.72 (1.03, 6.46) 0.03 3.24 (1.21, 7.90) 0.01
ORs are interpreted as the multiplicative increase in the odds of resistance to nitrofurantoin for each increase given in parenthesis (continuous variables) or presence of the given characteristic (categorical variables). Multivariable models were adjusted for all variables with a p-value <0.10 in unadjusted analysis (blood urine score, mucous urine score, WBC clumps urine, and history of kidney stones). The “Overall test of difference” that is provided for marital status tests whether there is any difference in resistance to nitrofurantoin between the three marital status categories. OR, odds ratio; CI, confidence interval.
(OR 0.81; P = 0.016); mucous (OR 1.22; P = 0.019); specific gravity urine (OR 0.87; P = 0.044), and any history of kidney stones (OR 3.24; P = 0.013).
Associations of antibiotic resistance for cefazolin, ciprofloxacin, and trimethoprim-sulfamethoxazole are shown in Supplements 1-3. In multivariable analysis, there were no significant predictors for cefazolin resistance (all P ≥0.056); age was the only significant predictor of ciprofloxacin resistance (OR 1.10, P = 0.048), and specific gravity urine was significantly associated with resistance to trimethoprim-
sulfamethoxazole (OR 0.88, P = 0.035). For patients resistant to nitrofurantoin, we estimated the proportion who were resistant to our other antibiotics and found that antibiotic resistance was lowest for trimethoprim-sulfamethoxazole (9.6%, 11/115), then ciprofloxacin (14.7%, 17/116), and finally cefazolin (22.6%, 26/115).
One of the risk factors for nitrofurantoin resistance in our study based on multivariable analysis was a history of kidney stones (OR 3.24). Our findings support previous studies finding a higher likelihood of resistant pathogens in patients with a history
Western Journal of Emergency Medicine 616 Volume 23, no. 5: September 2022
Mohseni et al.
Mohseni
Can Urinalysis and Past Medical History Predict Urine Antibiotic Resistance?
of nephrolithiasis.8-9 The Proteeae group of bacteria (Proteus, Morganella morganii, and Providencia) are known to produce urease and are associated with kidney stones.10 The Proteeae group has inherent resistance to nitrofurantoin,11 which could explain our findings although our study did not examine which bacteria were growing in patients’ culture or determine whether kidney stones were diagnosed during the current encounter. The clinical significance of our findings remains unclear, but 29.2% (7/24) of women with any history of kidney stones had bacteriuria resistant to nitrofurantoin compared to 13.1% (109/829) for those women without stones. Age ≥65 years was associated with ciprofloxacin resistance, which is consistent with the findings of our study.12
The results of this study suggest female UTI patients with any history of kidney stones may have increased rates of treatment failure with nitrofurantoin. Furthermore, in our analysis, antibiotic resistance was lowest with trimethoprim-sulfamethoxazole in those cases of observed nitrofurantoin resistance.
REFERENCES
1. Flores-Mireles AL, Walker JN, Caparon M, et al. Urinary tract infections: epidemiology, mechanisms of infection and treatment options. Nat Rev Microbiol . 2015;13(5):269-84.
2. Cohen ML. Epidemiology of drug resistance: implications for a post-antimicrobial era. Science . 1992;257(5073);1050-5.
3. Schaeffer AJ. Urinary tract infections: antimicrobial resistance. Curr Opin Urol . 2000;10(1);23-4.
4. Leibovici L, Greenshtain S, Cohen O, et al. Toward improved empiric management of moderate to severe urinary tract infections. Arch Intern Med . 1992;152(12);2481- 6.
5. Svanborg C. Resistance to urinary tract infection. N Engl J Med 1993;329;802-3.
6. Dyer IE, Sankary TM, Dawson JA. Antibiotic resistance in bacterial urinary tract infections, 1991 to 1997. West J Med 1998;169(5);265-8.
7. Gupta K, Sahm DF, Mayfield D, et al. Antimicrobial resistance among uropathogens that cause community-acquired urinary tract infections in women: a nationwide analysis. Clin Infect Dis 2001;33(1);89-94.
Address for Correspondence: Michael Mohseni, MD, Department of Emergency Medicine, Mayo Clinic, 4500 San Pablo Rd, Jacksonville, FL 32224. Email: Mohseni.Michael@Mayo.edu.
Conflicts of Interest: By the WestJEM article submission agreement, all authors are required to disclose all affiliations, funding sources and financial or management relationships that could be perceived as potential sources of bias. No author has professional or financial relationships with any companies that are relevant to this study. There are no conflicts of interest or sources of funding to declare.
Copyright: © 2022 Mohseni et al. This is an open access article distributed in accordance with the terms of the Creative Commons Attribution (CC BY 4.0) License. See: http://creativecommons.org/ licenses/by/4.0/
8. Efstathiou SP, Pefanis AV, Tsioulos DI, et al. Acute pyelonephritis in adults: prediction of mortality and failure of treatment. Arch Intern Med . 2003;163(10):1206-12.
9. Brown PD. Management of urinary tract infections associated with nephrolithiasis. Curr Infect Dis Rep . 2010;12(6):450-4.
10. Griffith DP, Musher DÁ, Itin C. Urease. The primary cause of infection-induced urinary stones. Invest Urol . 1976;13(5):346-50.
11. O’Hara CM, Brenner FW, Miller JM. Classification, identification, and clinical significance of Proteus , Providencia, and Morganella Clin Microbiol Rev . 2000;13(4):534-46.
12. Erb S, Frei R, Suter ST, et al. Basic patient characteristics predict antimicrobial resistance in E. coli from urinary tract specimens: a retrospective cohort analysis of 5246 urine samples. Swiss Med Wkly . 2018;148:w14660.
Volume 23, no. 5: September 2022 617 Western Journal of Emergency Medicine
et al.
More Accessible COVID-19 Treatment Through Monoclonal Antibody Infusion in the Emergency Department
Sara W. Heinert, PhD, MPH*
Jonathan McCoy, MD* Pamela Ohman Strickland, PhD† Renee Riggs, DO* Robert Eisenstein, MD*
Rutgers Robert Wood Johnson Medical School, Department of Emergency Medicine, New Brunswick, New Jersey Rutgers School of Public Health, Department of Biostatistics and Epidemiology, Piscataway, New Jersey
Section Editor: Kevin Lunney, MD, PhD, MHS
Submission history: Submitted October 28, 2021; Revision received May 26, 2022; Accepted May 28, 2022
Electronically published August 19, 2022
Full text available through open access at http://escholarship.org/uc/uciem_westjem
DOI: 10.5811/westjem.2022.5.55234
Introduction: Monoclonal antibody (MAB) infusion is the first treatment to manage coronavirus 2019 (COVID-19) in an outpatient setting. Yet increased risk of severe COVID-19 illness may occur from inequities in social determinants of health including access to quality healthcare. Given the safety-net nature of emergency departments (ED), a model that puts them at the center of MAB infusion may better reach underserved patients than models that require physician referral and distribute MAB at outpatient infusion centers. We examined characteristics of two groups of patients who received MAB infusion in the Robert Wood Johnson University Hospital (RWJUH) ED in New Brunswick, New Jersey: 1) patients who tested positive for COVID-19 in the ED and received ED infusion; and 2) patients who tested positive elsewhere and were referred to the ED for infusion. The process for the latter group was similar to the more common national model of patients testing COVID-19 positive in the community and then being referred to an infusion center for MAB therapy.
Methods: We performed a cross-sectional retrospective health record review of all adult patients presenting to the ED from November 20, 2020–March 15, 2021 who received MAB infusion at RWJUH ED (N = 486). Patients were identified through the electronic health record system by an administrative query, with manual chart review for any additional characteristics not available through the query. We compared the two groups using chi-squared tests for categorical variables and t-tests for continuous variables.
Results: We found higher proportions of Black (18% vs 6% P < 0.001, statistically significant), Hispanic (19% vs 11% P = 0.02), Medicaid (12% vs 9% P = 0.01), and uninsured (17% vs 8% P = 0.01) patients who tested positive for COVID-19 in their ED visit and then received MAB therapy during their visit than patients tested elsewhere in the community and referred to the ED for MAB therapy.
Conclusion: These findings suggest that providing MAB infusion in the ED allows increased access for patients traditionally marginalized from the healthcare system, who may be at risk of longer disease duration and complications from COVID-19. [West J Emerg Med. 2022;23(5)618–622.]
INTRODUCTION
On November 9, 2020, the US Food and Drug Administration (FDA) issued an emergency use authorization (EUA) for the investigational monoclonal antibody (MAB) therapeutic bamlanivimab for the treatment of mild-to-
moderate coronavirus 2019 (COVID-19) in adult and pediatric patients.1 On November 21, 2020, the FDA issued an EUA for casirivimab + imdevimab to be administered together for the treatment of mild-to-moderate COVID-19 in adult and pediatric patients.2 Both treatments, bamlanivimab and
Western Journal of Emergency Medicine 618 Volume 23, no. 5: September 2022 Brief Research Report
* †
casirivimab + imdevimab, are monoclonal antibodies, which are laboratory-made proteins that mimic the immune system’s response to fight off harmful pathogens such as viruses1,2 and provided the first treatment to manage COVID-19 in an outpatient setting.
Both MAB therapies were authorized for patients aged 12 years or older weighing at least 40 kilograms, with positive results of direct severe acute respiratory syndrome coronavirus-2 viral testing, and who are at high risk for progression to severe COVID-19 (including those who are 65 years or older or who have certain chronic medical conditions)1,2 and who present for treatment within 10 days of developing COVID-19 symptoms. The therapies were not authorized for patients who are hospitalized or have a new oxygen requirement due to COVID-19.1,2
The risk of COVID-19 cases, hospitalizations, and deaths for racial and ethnic minority groups are higher than White, non-Hispanic persons. 3 Studies have found that racial and ethnic minority groups are more likely to have increased COVID-19 disease severity upon hospital admission compared to non-Hispanic White patients.4,5 Increased risk of severe COVID-19 illness may occur from inequities in social determinants of health including health, social, and economic inequities. 6 Thus, the US Centers for Disease Control and Prevention (CDC) recommends systems and policies that overcome obstacles to health and healthcare to help achieve health equity. 7
Within 10 days of the first EUA, the Robert Wood Johnson Barnabas Health (RWJBH) system began treating eligible patients in the ED.8 Other large health systems have provided MAB therapy in outpatient infusion centers9; however, RWJBH chose to deliver the treatment in its 11 emergency departments (ED) across New Jersey. The system has two pathways for patients to receive MAB treatment. First, patients who present to the ED and test positive for COVID-19 in the ED can be assessed for eligibility and receive MAB during the same visit. Second, patients who test positive for COVID-19 in the community and are candidates for MAB can be referred by their doctor to the ED for treatment. In this case, the referring physician usually called the ED before referring so the ED staff knew the patient was coming. Since patients were known COVID-19 positive, their care was expedited. They were quickly moved to a room where they were screened to ensure they did not need admission and MAB was ordered. In our health system, all the EDs and no infusion centers provided MAB therapy.
Given the safety-net nature of EDs, a model that puts EDs at the center of MAB infusion may better reach underserved patients than models that require physician referral and distribute MAB at outpatient infusion centers. Many underserved patients who present to the ED lack access to primary care and do not otherwise interact with the healthcare system.10 Thus, the characteristics of patients who test positive for COVID-19 in their ED visit and then receive MAB therapy
during their visit may be different than patients who accessed testing elsewhere in the community and were referred to the ED for MAB therapy. The process for the latter group was similar to the more common national model of patients testing COVID-19 positive in the community and then being referred to an infusion center for MAB therapy.
The purpose of this study was to explore characteristics of two groups of patients who received MAB infusion in the RWJUH ED in New Brunswick, NJ: 1) patients who tested positive for COVID-19 in the ED and received infusion; and 2) patients who tested positive elsewhere and came to the ED for infusion.
METHODS Study Setting
The RWJUH’s ED is a Level I trauma center that treats approximately 71,000 adult (21+ years) patients annually. The ED serves a socioeconomic and ethnically diverse patient population of approximately 24% Hispanic, 21% nonHispanic Black, 37% non-Hispanic White, 7% Asian, and 10% other race/ethnicity (remaining <2% is unknown race/ ethnicity). The population of Middlesex County, where the hospital is located, is 22% Hispanic, 12% Black, 42% nonHispanic White, 25% Asian, and 1% other race/ethnicity.11 In the county, 9% of persons under 65 years old are without health insurance and 7% live in poverty.12
Data Collection
We performed a cross-sectional, retrospective health record review of all adult patients presenting to the ED from November 20, 2020–March 15, 2021 who received MAB infusion at RWJUH ED (N = 486). Patients were identified through the electronic health record system AllScripts Sunrise Clinical Manager (Practice EHR, Plano, TX) by an administrative query, with manual chart review for any additional characteristics not available through the query, such as comorbidities. For data entry, the study team created a standardized data collection form using REDCap electronic data capture tools hosted at Rutgers University.12,13 REDCap (Research Electronic Data Capture) is a secure, web-based software platform designed to support data capture for research studies, providing 1) an intuitive interface for validated data capture; 2) audit trails for tracking data manipulation and export procedures; 3) automated export procedures for seamless data downloads to common statistical packages; and 4) procedures for data integration and interoperability with external sources. Data entry was frequently reviewed by the two lead investigators, and any errors were reported back to the person who had entered the data to correct them.
Statistical Analysis
Analysis compared demographics, medical characteristics, and vital signs at triage for patients who tested COVID-19
Volume 23, no. 5: September 2022 619 Western Journal of Emergency Medicine Heinert et al. More Accessible COVID-19 Treatment
positive in the ED and received MAB infusion to patients who tested COVID-19 positive elsewhere and came to the ED for infusion. We used chi-squared tests for categorical variables and t-tests for continuous variables using Stata version 16.0 (StataCorp LLC, College Station, TX). We carried out an analysis for the statistical significance of the results using the Bonferroni correction for multiple variables. This study was approved by the Rutgers University Institutional Review Board.
RESULTS
A total of 819 patients tested COVID-19 positive and/or received MAB in the ED, of whom 486 received MAB in the ED. Three-hundred thirty-three (333) patients did not receive MAB, of whom 75 (23%) were eligible for MAB. The table shows characteristics of patients who received MAB infusion in the RWJUH ED, comparing patients who tested COVID-19 positive in the ED to those who tested positive elsewhere and were referred to the ED for infusion. Compared to patients who tested positive in the community and were referred to the ED (n = 334), patients who tested positive for COVID-19 in the ED (n = 152) were significantly different in race (P <0.001), ethnicity (P = 0.02), and insurance type (P = 0.01) with higher proportions of Black (18% vs 6% P < 0.001) and Hispanic (19% vs 11% P = 0.02) patients. There were higher proportions of
Medicaid patients tested in the ED than outside the ED (12% vs 9% P = 0.01) and double the proportion of uninsured patients (self-pay and charity care) (17% vs 8% P = 0.01). There were no significant differences in gender between the two groups.
We also analyzed medical characteristics and vital signs at triage (not shown), of which only heart rate and systolic blood pressure (BP) were significantly different between the two groups. While mean heart rate was statistically significantly higher for patients testing positive in the ED (93.3, standard deviation [SD] = 17.3) than patients referred to the ED for infusion (89.1, SD = 16.0), this is unlikely to be of any clinical significance. Likewise, systolic BP was statistically significantly lower for patients testing positive in the ED (137.3, SD = 21.1) than patients referred to the ED for infusion (141.6, SD = 23.2). Race was the only finding that remained significant after using the Bonferroni correction (not shown).
DISCUSSION
Overall, there were significant demographic differences but few medical differences between patients who tested COVID-19 positive in the ED and received MAB infusion compared to patients who tested COVID-19 positive in the community with referral to the ED for MAB infusion. There were significantly higher proportions of underserved (racial/ethnic minority,
Table 1. Characteristics of patients receiving monoclonal antibody infusion in the emergency department (ED) comparing patients testing COVID-19 positive in the ED to patients testing COVID-19 positive elsewhere with referral for infusion to the ED.
Characteristics
Demographics
Gender
Overall (N = 486) N (%) Tested Elsewhere (n = 334) n (%) Tested in ED (n = 152) n (%) P-value
Women 250 (51%) 165 (49%) 85 (56%) 0.18
Men 236 (49%) 169 (51%) 67 (44%)
Race (n = 483)
Asian 29 (6%) 22 (7%) 7 (5%) <0.001*
Black 48 (10%) 21 (6%) 27 (18%)
Other 168 (35%) 107 (32%) 61 (40%)
White 238 (49%) 182 (55%) 56 (37%)
Ethnicity (n = 476)
Non-Hispanic 413 (87%) 294 (89%) 119 (82%) 0.02
Hispanic 63 (13%) 36 (11%) 27 (19%)
Insurance type
Charity 8 (2%) 2 (<1%) 6 (4%) 0.01
Medicaid 49 (10%) 31 (9%) 18 (12%)
Medicare 147 (30%) 106 (32%) 41 (27%)
Other 3 (1%) 1 (<1%) 2 (1%)
Private 234 (48%) 169 (51%) 65 (43%)
Self-Pay 45 (9%) 25 (8%) 20 (13%)
* Only patient characteristic that was statistically significant after Bonferroni correction. ED, emergency department; COVID-19, coronavirus disease of 2019; P-value, probability value.
Western Journal of Emergency Medicine 620 Volume 23, no. 5: September 2022 More Accessible COVID-19 Treatment Heinert et al.
Medicaid, and uninsured) patients who tested positive for COVID-19 in their ED visit and then received MAB therapy during their visit than patients tested elsewhere in the community and referred to the ED for MAB therapy. Medical differences were of limited clinical significance but may highlight that patients diagnosed and treated in the ED were slightly sicker on average than the referred population. After using the Bonferroni correction for comparing multiple variables, race was the only variable that was significantly different between the two groups. However, this study was exploratory with highly correlated covariates such as race with ethnicity and insurance type, suggesting that race itself was likely not the only determining factor, and ethnicity and insurance type were statistically significant prior to Bonferroni correction.
These findings are promising for creating programs to better serve underserved patients, and some health systems that initially referred eligible ED patients to outpatient infusions centers have since shifted their model to include MAB distribution in the ED.14 However, it is also important to consider and plan for potential ED workflow issues that can arise from providing MAB infusion in the ED. This can include additional use of beds and staffing, which may already be in short supply, especially during a pandemic.
LIMITATIONS
Our study had some limitations. First, this was a retrospective quantitative study of healthcare utilization. Two areas of potential bias in chart review studies are that the data in patient records is inaccurate and that the data is collected with non-systematic and potentially inaccurate methodology. Medical variables for our study were objective in nature and demographics were self-reported by the patient, which would minimize bias compared to ED staff-reported patient demographics. While several best practice methods of chart review studies15 were completed, such as standardized abstraction forms, there were some practices that we were unable to accomplish, specifically blinding abstractors to study hypotheses and measuring interrater reliability.
We were also unable to measure ED patients’ logistical ability to receive MAB infusion in an infusion center if the MAB was not available in the ED. Neither were we able to quantify who tested positive for COVID-19 in the community but were not able to come to the ED for the infusion, nor the demographics of patients who received MAB at infusion centers. Second, our dataset did not include primary care physician (PCP). One explanation for our findings is that if patients test positive for COVID-19 in the community and do not have a PCP, then no one is advocating for them or educating them to go to the ED for MAB infusion if they are eligible for the treatment. Thus, there may be a much higher proportion of patients with PCPs in the community who were tested and referred to the ED than those in the ED-tested group. However, we were unable to observe this difference without this variable in the study data.
CONCLUSION
These findings suggest that providing MAB infusion in the ED allows increased access for patients traditionally marginalized from the healthcare system, who may be at risk of longer disease duration and complications from COVID-19.
Address for Correspondence: Sara W. Heinert, PhD, MPH, Rutgers Robert Wood Johnson Medical School, Department of Emergency Medicine, 1 Robert Wood Johnson Place, New Brunswick, New Jersey 08901. Email: sara.heinert@rutgers.edu.
Conflicts of Interest: By the WestJEM article submission agreement, all authors are required to disclose all affiliations, funding sources and financial or management relationships that could be perceived as potential sources of bias. Dr. Heinert is supported by the National Center for Advancing Translational Sciences (NCATS), a component of the National Institutes of Health (NIH) under award number KL2TR003018/UL1TR003017. The content is solely the responsibility of the authors and does not necessarily represent the official views of the National Institutes of Health.
Copyright: © 2022 Heinert et al. This is an open access article distributed in accordance with the terms of the Creative Commons Attribution (CC BY 4.0) License. See: http://creativecommons.org/ licenses/by/4.0/
REFERENCES
1. U.S. Food and Drug Administration. Coronavirus (COVID-19) Update: FDA authorizes monoclonal antibody for treatment of COVID-19. 2020. Available at: https://www.fda.gov/news-events/press-announcements/ coronavirus-covid-19-update-fda-authorizes-monoclonal-antibodytreatment-covid-19. Accessed December 15, 2020.
2. U.S. Food and Drug Administration. Coronavirus (COVID-19) Update: FDA authorizes monoclonal antibodies for treatment of COVID-19. 2020. Available at: https://www.fda.gov/news-events/press-announce ments/coronavirus-covid-19-update-fda-authorizes-monoclonal-anti bodies-treatment-covid-19. Accessed December 15, 2020.
3. Centers for Disease Control and Prevention. Risk for COVID-19 Infection, Hospitalization, and Death By Race/Ethnicity. Available at: https://www.cdc.gov/coronavirus/2019-ncov/covid-data/investiga tions-discovery/hospitalization-death-by-race-ethnicity.html. Updated June 24, 2022. Accessed August 1, 2022.
4. Azar KMJ, Shen Z, Romanelli RJ, et al. Disparities In outcomes among COVID-19 patients in a large health care system In Califor nia. Health Aff (Millwood). 2020;39(7):1253-62.
5. Joseph NP, Reid NJ, Som A, et al. Racial and ethnic disparities in disease severity on admission chest radiographs among patients admitted with confirmed coronavirus disease 2019: a retrospective cohort study. Radiology. 2020;297(3):E303-E312.
6. Centers for Disease Control and Prevention. Social Determinants of Health. Available at: https://www.cdc.gov/publichealthgateway/sdoh/
Volume 23, no. 5: September 2022 621 Western Journal of Emergency Medicine Heinert et al. More Accessible COVID-19 Treatment
index.html. Updated July 20, 2022. Accessed August 1, 2022.
7. Centers for Disease Control and Prevention. What is Health Equity? Available at: https://www.cdc.gov/healthequity/whatis/. Updated July 1, 2022. Accessed August 1, 2022.
8. Cheney C. Coronavirus: how RWJBarnabas Health is administering monoclonal antibodies. 2021. Available at: https://www.healthleaders media.com/clinical-care/coronavirus-how-rwjbarnabas-health-admin istering-monoclonal-antibodies. Accessed October 14, 2021.
9. Bariola JR, McCreary EK, Khadem T, et al. Establishing a distribution network for COVID-19 monoclonal antibody therapy across a large health system during a global pandemic. Open Forum Infect Dis 2021;8(7):ofab151.
10. Begley CE, Vojvodic RW, Seo M, et al. Emergency room use and access to primary care: evidence from Houston, Texas. J Health Care Poor Underserved. 2006;17(3):610-24.
11. U.S. Census Bureau. QuickFacts: Middlesex County, New Jersey.
2021. Available at: https://www.census.gov/quickfacts/fact/table/ middlesexcountynewjersey/PST045221. Accessed March 7, 2022.
12. Harris PA, Taylor R, Thielke R, et al. Research electronic data capture (REDCap)--a metadata-driven methodology and workflow process for providing translational research informatics support. J Biomed Inform. 2009;42(2):377-81.
13. Harris PA, Taylor R, Minor BL, et al. The REDCap consortium: build ing an international community of software platform partners. J Biomed Inform. 2019;95:103208.
14. Woltemate TJ, Wadas RJ, McCreary EK, et al. Emergency depart ment implementation of monoclonal antibody infusion for the treat ment of coronavirus disease 2019: a template for rapid deployment. J Am Coll Emerg Physicians Open. 2021;2(5):e12550.
15. Gilbert EH, Lowenstein SR, Koziol-McLain J, et al. Chart reviews in emergency medicine research: Where are the methods? Ann Emerg Med. 1996;27(3):305-8.
Western Journal of Emergency Medicine 622 Volume 23, no. 5: September 2022 More Accessible COVID-19 Treatment Heinert et al.
Prospective Case-control Study of Contact Tracing Speed for Emergency Department-based Contact Tracers
Sean C. Weaver, DO, MPH* Samuel S. Byrne, MPH† Hollianne Bruce, MPH‡ Olivia L. Vargas, MPH* Thomas E. Robey, MD, PhD*
Section Editor: Erik Anderson, MD
Washington State University Elson S. Floyd College of Medicine, Providence Regional Medical Center Everett, Department of Emergency Medicine, Everett, Washington University of Washington Environmental Health and Safety Department, Everett, Washington Snohomish Health District, Everett, Washington * † ‡
Submission history: Submitted October 29, 2021; Revision received May 4, 2022; Accepted May 31, 2022
Electronically published August 24, 2022
Full text available through open access at http://escholarship.org/uc/uciem_westjem
DOI: 10.5811/westjem.2022.5.53196
Introduction: In Snohomish County, WA, the time from obtaining a positive severe acute respiratory syndrome coronavirus 2 (SARS-CoV-2) test and initiating contact tracing is 4-6 days. We tested whether emergency department (ED)-based contact tracing reduces time to initiation and completion of contact tracing investigations.
Methods: All eligible coronavirus disease 2019 (COVID-19)-positive patients were offered enrollment in this prospective case-control study. Contact tracers were present in the ED from 7 AM to 2 AM for 60 consecutive days. Tracers conducted interviews using the Washington State Department of Health’s extended COVID-19 reporting form, which is also used by the Snohomish Health District (SHD).
Results: Eighty-one eligible SARS-CoV-2 positive patients were identified and 71 (88%) consented for the study. The mean time between positive COVID-19 test result and initiation of contact tracing investigation was 111 minutes with a median of 32 minutes (range: 1-1,203 minutes). The mean time from positive test result and completion of ED-based contact tracing investigation was 244 minutes with a median of 132 minutes (range: 23-1,233 minutes). In 100% of the enrolled cases, contact tracing was completed within 24 hours of a positive COVID-19 test result. For comparison, during this same period, SHD was able to complete contact tracing in 64% of positive cases within 24 hours of notification of a positive test result (P < 0.001). In the ED, each case identified a mean of 2.8 contacts as compared to 1.4 contacts identified by SHD-interviewed cases. There was no statistically significant difference between the percentage of contacts reached through ED contact tracing (82%) when compared to the usual practice (78%) (P = 0.16).
Conclusion: When contact tracing investigations occur at the point of diagnoses, the time to initiation and completion are reduced, there is higher enrollment, and more contacts are identified. [West J Emerg Med. 2022;23(5)623–627.]
INTRODUCTION
Rapid testing and contact tracing are foundational for containing rapidly spreading infectious diseases such as coronavirus disease 2019 (COVID-19).1,2 As with most US health districts, contact tracing in Snohomish County, WA, uses positive test result reports to initiate investigation by the Snohomish Health District (SHD). Typically, the time from testing to investigation completion spans 4-6 days. To reduce
this time, we designed a program at the Providence Regional Medical Center Everett (PRMCE) to speed up contact tracing investigations by positioning contact tracers in the emergency department (ED). We hypothesized that physical proximity to the patient and temporal proximity to the diagnosis would decrease the time needed for the contact tracing process. The primary outcome was time to initiation of ED-based contact tracing. Secondary measures included time to investigation
Volume 23, no. 5: September 2022 623 Western Journal of Emergency Medicine Original Research
completion, number of contacts identified, and percent participation with contact tracing.
METHODS
This was a prospective case-control study comparing contact tracing times for COVID-19-positive patients in Snohomish County tested in the PRMCE ED to all COVID19-positive patients in the county, as traced by the SHD standard-of-care process. All patients who tested positive during an eight-week period were offered enrollment. Data collected for the ED cases included timestamps for diagnosis, consent, interview completion, and contact tracing completion. Data collected by the public health department for the standard-of-care group included time of notification and time of completion of contact tracing.
The PRMCE is an urban, tertiary receiving hospital, Level II trauma center, 530-bed community hospital with approximately 86,000 ED visits in 20193 and serves three counties with a total population just over 1,100,000. During the study, the hospital lab used the polymerase chain reaction (PCR)-based rapid GeneXpert platform (Cepheid, Sunnyvale, CA) to diagnose severe acute respiratory syndrome coronavirus 2 (SARS-CoV-2) infection within 90 minutes of nasal swab. Six contact tracers based in the PRMCE ED were trained following SHD recommendations. The contact tracers were a mix of graduate public health students, a secondyear medical student with a Master’s in Public Health, and a foreign medical school graduate. A single contact tracer was in the ED between 7 am to 2 am with one hour of overlap from 4 pm to 5 pm to allow for sign-out. From July 10–September 5, 2020 between the hours of 7 am to 2 am, the charge nurse informed the contact tracers of all positive SARS-CoV-2 PCR results. These tests were conducted during routine patient care, independent of the study. Patients with positive results between 2 am to 7 am had their contact information confirmed by nursing staff and were informed that a contact tracer would call them later that day.
Contact tracers were trained under good research practice to ensure research integrity during the process of requesting consent for inclusion in the study. Patients who did not consent to participation were not enrolled and specific information was not collected about them; however, due to the public health emergency, and to minimize biasing the subjects, they were informed they would be contacted later following standard-ofcare public health practice. If a patient consented to the study but declined interview due to fatigue or other reason during the ED visit, the contact tracer scheduled a time, preferably within 12 hours, to conduct the interview. Contact tracers conducted interviews using the Washington State Department of Health Extended COVID-19 reporting form to guide the interview.4
Tracers were provided caregiver personal protective equipment but minimized contact with patients. Telephones were used to communicate with patients in their rooms, often with tracers standing outside the room’s glass door to
Population Health Research Capsule
What do we already know about this issue?
Contact tracing is an important component of public health pandemic response but can be delayed by result reporting and difficult-to-reach populations.
What was the research question?
Could proximity to COVID-19 diagnosis decrease the time needed for the contact tracing process?
What was the major finding of the study?
Contact tracers for COVID in the ED speed up contact tracing (100% complete within 24 hours vs. 64%), find more contacts (2.8 vs. 1.4) and access populations typically missed by traditional methods.
How does this improve population health?
Contact tracing of newly positive patients in the ED can expedite isolation and testing, thereby slowing pathogen spread and reducing population disease burden.
further maintain safety. Contacts identified by patients were called immediately. Completed interviews were faxed to the SHD. Confirmed cases from congregate living settings or other complicated situations were faxed to SHD as soon as the interview was complete. Expeditious notification of SHD superseded the goals of the study. The research consent and contact tracing enrollment process took between 5-15 minutes, depending on subject questions. Contact tracers were instructed to obtain follow-up contact information to continue interviews after discharge or admission, so as not to change the patient’s ED length of stay.
The primary endpoint of this study was time from result report to initiation of contact tracing. Secondary measurements were time to investigation completion, number of contacts identified, and percent participation with contact tracing. We grouped and compared enrolled subjects’ data against the data provided to the public by the SHD. We calculated 95% confidence intervals (CI) for ED data following the central limit theorem to illustrate numerical distribution of subjects. The SHD provided mean time values and case numbers for percentage calculation. All PRMCE ED patients were included in county-wide SHD values, which biased the SHD data to be more like ED data. We directly compared costs of this study with standard contact tracing costs.
Patients were given the option to enroll in this study (Spokane Institutional Review Board Protocol # STUDY2020000425) or be followed by SHD following
Prospective Case-control Study of Contact Tracing Speed for ED-based Contact Tracers
Western Journal of Emergency Medicine 624 Volume 23, no. 5: September 2022
Weaver et al.
public health standard-of-care. Patients not enrolled were included in the publicly reported data provided by SHD. Statistics were calculated using Microsoft Excel (Microsoft Corporation, Redmond, WA) and plotted in Prism (Graphpad Software Inc, La Jolla, CA). We used R v4.0.3 (RStudio Inc, Boston, MA) to conduct a two-sided test at the 95% CI to determine statistical significance.
RESULTS
From July 10–September 8, 2020, 124 patients tested positive for SARS-CoV-2. We excluded 37 (30%) patients based on any previous positive COVID-19 test, and four (3%) were excluded due to age (< 18 years old). Of the 83 patients eligible for the study, 10 (12%) declined to enroll in the research protocol and had attempts to contact by SHD based on public health standards of care. One (1%) patient was unable to consent, and one patient (1%) refused to use a hospital-certified interpreter. In total, 71 (86%) eligible patients consented for the study. Figure 1 illustrates enrollment.
enrolled patients, 54% were male, 13% lived in congregate living facilities, including shelters, and 4% identified as homeless on the street. Medicare/Medicaid recipients made up 69% of the enrolled patient population, 21% had private insurance, and 10% were uninsured. Patients presented an average of 4.4 days after symptom onset. In total, 46% enrolled patients were admitted to the hospital and 8% went to the intensive care unit. Follow-up interviews occurred in nine instances (12%), typically at the patient’s request and for admitted patients too weak to communicate.
The primary outcome under investigation was time to initiation of ED-based contact tracing. The mean time between positive COVID-19 test result and initiation of contact tracing study in the ED was 111 minutes with a median of 32 minutes (range: 1-1,203 minutes). The mean time from positive test result and completion of ED-based contact tracing investigation was 244 minutes with a median of 132 minutes (range: 231,233 minutes). Figure 2 illustrates durations of time to contact tracing initiation and investigation completion for each case, including median, quartiles, and range.
A B Time to Start
Time to Completion
Figure 2. Distributions of times from positive COVID-19 test result
Figure 1. Distributions of times from positive test result to (A) initiation of contact tracing and to (B) investigation completion plotted on a log scale. Box and whisker boxes show median and 25th to 75th percentiles; whiskers indicate minimum and maximum values. Each individual case is plotted.
Figure 1. Flowchart of patient enrollment for expedited contact tracing of COVID-19 positive patients beginning in the ED at time of diagnosis.
COVID, coronavirus disease.
The average age of ED patients enrolled in the study was 57 years (95% CI 52-62 years) with a range of 19-94 years.
A majority of patients identified their race as White (82%), followed by Asian (6%), unknown (6%), American Indian/ Alaskan native (3%), Black/African American (1%), Native Hawaiian or Pacific Islander (1%), and other (1%). This corresponds to the region’s demographics. Primary Englishspeaking patients accounted for 76% of positive cases followed by Spanish (6%), Ukrainian (6%), nonverbal (6%), Russian (3%), French (1%), Nepali (1%), and Tagalog (1%). Of the
When compared to the usual practice, completion of contact tracing within 24 hours was statistically significant. Of the enrolled ED-based contact tracing cases, 100% were completed within 24 hours. During this same time period, the usual practice resulted in 64% of cases being completed in less than 24 hours (P = <0.001). In the SHD population, the exact duration between time of positive COVID-19 test result and SHD notification of the positive test result is unknown, but hospital labs and testing sites typically reported results within 6-36 hours. In the ED, each case identified a mean of 2.8 contacts (range 0-9). Cases interviewed by SHD identified an average of 1.4 contacts per case during the same time period. There was not a statistical difference between the percentage of contacts reached

 Weaver et al. Prospective Case-control Study of Contact Tracing Speed for ED-based Contact Tracers
Volume 23, no. 5: September 2022 625 Western Journal of Emergency Medicine
0.1 1 10 100 1000 10000 M i n u t e s
0.1 1 10 100 1000 10000 M i n u t e s
through ED-based contact tracing – 83% (162/197), when compared to usual practice, 78% (2,683/3,441) (P = 0.16). Of all the contacts ED-based contact tracers were able to reach, only seven (4%) refused to participate.
The ED-based contact tracers were temporary workers paid $25/hour (no benefits) for this two-month study, which is consistent with local cost-of-living salaries. The cost of staffing the ED was $500 per day, which averaged $416 per patient enrolled and $238 per positive case (including cases prospectively excluded). In the two months this study was underway our region saw a small uptick in cases. Just four months after completion of enrollment, the ED saw 8-15 cases per day, which would correspond to $33 to $63 per case, consistent with SHD estimates of $50 per case.
DISCUSSION
Emergency department-based COVID-19 contact tracing resulted in a decrease in time to initiation and completion of contact tracing. Mathematical modeling has shown that contact tracing will only contribute to containment of COVID-19 if it is conducted with minimal time between symptom onset, positive test result and contact tracing.5 A decrease in time to initiation and completion of contact tracing investigation through an ED-based contact tracing program has the potential to have a significant impact on COVID-19 containment. Even with patients declining to enroll in this study, when compared to the usual practice in Snohomish County, a higher participation rate was observed when contact tracing occurred at the point of diagnosis. Endorsement of contact tracing by trusted healthcare professionals, convenience for the patient, and the ability to leverage human interactions are the likely reasons for this benefit.6
Multiple factors influence whether a patient participates in contact tracing. Media outlets have documented the struggles health jurisdictions encounter while trying to conduct contract tracing,7,8 and the practice has been polarizing.9 A patientfocused, point-of-diagnosis COVID-19 contact tracing program can mitigate some of these challenges. The trust developed between patient and physician is easily conferred to contact tracers, thereby encouraging participation. Healthcare clinicians also have a clinical understanding of the patient and can identify and address potential barriers to participation. This study indicates that the combination of these factors has the potential to significantly increase patient participation in contact tracing. The research enrollment and contact tracing intervention were brief enough that length of stay was minimally impacted, while the number of contacts identified and the percentage of contacts agreeable to interview was equivalent to the SHD standard of care. As has been reported in other EDs in the United States, we noticed that ED patient volumes decreased throughout most of the pandemic.
Patients typically difficult to reach who are easier to engage in the ED include admitted patients, residents of adult family homes, and people experiencing homelessness. Face-
to-face interviews with these individuals, or with their family members, clarified important details in the contact tracing process and resulted in fewer cases lost to follow-up. The cost of contact tracing and its apparent limitations in application to such widespread infections could be mitigated by stationing contact tracers in a safe section of the ED. Contact tracers based in the ED would capture nearly all ED diagnoses and could concurrently work on other contact tracing cases reported through clinics and testing sites. This process would transform the relatively high cost observed in this pilot to a more cost-effective approach. Alternatively, contact tracers could be mobilized to respond to ED-based operations when case numbers dictate effective resource utilization.
LIMITATIONS
Limitations to this study include the fact that it was a single-center study, the moderate case load, and its cost. An average of 2.1 patients tested positive each day and 1.2 patients were enrolled each day. A higher incidence of cases could overwhelm a single contact tracer resulting in higher loss to follow-up; we estimate that our contact tracers could have reasonably conducted six- to eight-fold the number of cases managed each day during this study’s enrollment. At 1.2 patients per day, the cost per case using a contact tracer salary of $25/hour was $416 per enrolled case. With eight cases per day, the cost per case would be $62.50, which matches the amount paid to traditional contact tracers. The hospital lab turnaround time from swab to result was approximately 90 minutes; this is faster than most facilities in the county, but some patients still found this wait time unacceptable. The SHD received positive test results 24 hours a day; however, overnight results were not processed until morning, with nine fewer hours of coverage than were available to our contact tracers.
At the time of the study, Snohomish County was experiencing a mild surge in cases. Emergency departmentbased contact tracing could have a greater utility with higher case numbers. The population described in this study matches the local general patient population for race and ethnicity, with sizeable unique underserved populations of Russianand Ukrainian-speaking individuals, which was the only population over-represented in this study. In Snohomish County 79% of all patients are insured by Medicare or Medicaid, and homelessness is estimated as a factor in 5% of the general ED population. The SHD was unable to contact most of their homeless cases, whereas an ED-based approach enabled contact tracing of these individuals.. While this demographic pertains to the region studied, many elements contributing to challenging follow-up do translate to other catchment hospitals.
CONCLUSION
This study shows the feasibility of point-of-diagnosis EDbased contact tracing. Implementation required partnership with the administration of Providence Regional Medical
Prospective Case-control Study of Contact Tracing Speed for ED-based Contact Tracers
Western Journal of Emergency Medicine 626 Volume 23, no. 5: September 2022
Weaver et al.
Center Everett, the ED nursing staff, and Snohomish Health District leadership. The cost of implementing this project was not overwhelming, and in the context of an outbreak with more COVID-19 cases per day, an economy of scale could reduce the per patient expense. Future efforts should focus on leveraging the power of face-to-face interactions, reducing barriers by capitalizing on technology or a telehealth infrastructure and repurposing healthcare resources to conduct contact tracing at the point of patient contact.
ACKNOWLEDGMENTS
The authors would like to thank Jerome Differding and the staff of the PRMCE Research Office for providing logistical support. Special thanks to the Snohomish Health District for their partnership and logistical support. Additional contact tracers not involved in study design or manuscript preparation include Robbie Emanual David, Alexandria Vingino, Elspeth Rensema, and Sarah Romano. Special thanks to Dr. Linda Degutis for critically reviewing the manuscript.
REFERENCES
1. Wu J, Tang B, Bragazzi NL, et al. Quantifying the role of social distancing, personal protection and case detection in mitigating COVID-19 outbreak in Ontario, Canada. J Math Ind. 2020;10(1):15.
2. Centers for Disease Control and Prevention. 2020. Coronavirus Disease (COVID-19): Contact Tracing and Investigation Guidelines. Available at: https://www.cdc.gov/coronavirus/2019-ncov/php/contact-tracing/contacttracing-plan/overview.html. Accessed October 23, 2020.
3. Washington State Hospital Association. 2020. Providence Regional Medical Center Everett. Available at: https://www. wsha.org/members/providence-regional-medical-center-everett/ Accessed October 23, 2020.
4. Washington State Department of Health. Covid-19 Extended Form, DOH 420-110. Available at: https://www.doh.wa.gov/Portals/1/ Documents/5100/420-110-ReportForm-Coronavirus.pdf. Accessed July 10, 2020.
5. Kretzschmar ME, Rozhnova G, Bootsma MCJ, et al. Impact of delays on effectiveness of contact tracing strategies for COVID-19: a modelling study. Lancet Public Health. 2020;5(8):e452-9.
Address for Correspondence: Thomas Robey, MD, PhD, Providence Regional Medical Center Everett, Department of Emergency Medicine, 1700 13th St. Everett, WA 98201. Email: terobey@northsoundem.com.
Conflicts of Interest: By the WestJEM article submission agreement, all authors are required to disclose all affiliations, funding sources and financial or management relationships that could be perceived as potential sources of bias. No author has professional or financial relationships with any companies that are relevant to this study. This study was funded by the Providence General Foundation. There are no conflicts of interest to declare.
Copyright: © 2022 Weaver et al. This is an open access article distributed in accordance with the terms of the Creative Commons Attribution (CC BY 4.0) License. See: http://creativecommons.org/ licenses/by/4.0/
6. National Academies of Sciences, Engineering, and Medicine. 2020. Encouraging Participation and Cooperation in Contact Tracing: Lessons from Survey Research. Washington, DC: The National Academies Press. Available at: https://doi.org/10.17226/25916 Accessed October 23, 2020.
7. Khazan, O. The most American COVID-19 failure yet. The Atlantic. 2020. Available at: https://www.theatlantic.com/politics/ archive/2020/08/contact-tracing-hr-6666-working-us/615637/ Accessed November 2, 2020.
8. Steinhauer J, Goodnough A. Contact tracing is failing in many states. Here’s why. The New York Times. 2020. Available at: https://www. nytimes.com/2020/07/31/health/covid-contact-tracing-tests.html Accessed November 2, 2020.
9. Ollstein AM, Tahir D. Contact tracing foiled by conspiracy theories, lack of federal messaging. Politico. 2020. Available at: https://www.politico. com/news/2020/09/03/contact-tracing-conspiracy-theories-trumpmessaging-408611. Accessed on November 2, 2020.
Weaver et al. Prospective Case-control Study of Contact Tracing Speed for ED-based Contact Tracers
Volume 23, no. 5: September 2022 627 Western Journal of Emergency Medicine
Evaluation of an Emergency Department Influenza Vaccination Program: Uptake Factors and Opportunities
Canada Parrish, PhD, MSPH*
Crystal A. Phares, MD* Tim Fredrickson, RN†
John B. Lynch, MD, MPH‡
Lauren K. Whiteside, MD, MS* Herbert C. Duber, MD, MPH*
Section Editor: Patrick Meloy, MD
University of Washington, Department of Emergency Medicine, Seattle, Washington Harborview Medical Center, Department of Emergency Medicine, Seattle, Washington University of Washington, Division of Allergy and Infectious Disease, Seattle, Washington
Submission history: Submitted October 26, 2021; Revision received May 27, 2022; Accepted June 30, 2022
Electronically published August 19, 2022
Full text available through open access at http://escholarship.org/uc/uciem_westjem DOI: 10.5811/westjem.2022.5.55227
Introduction: Influenza vaccines are commonly provided through community health events and primary care appointments. However, acute unscheduled healthcare visits such as emergency department (ED) visits are increasingly viewed as important vaccination opportunities. Emergency departments may be well-positioned to complement broader public health efforts with integrated vaccination programs.
Methods: We studied an ED-based influenza vaccination initiative in an urban hospital and examined patient-level factors associated with screening and vaccination uptake. Our analyses included patient visits to the ED from October 1, 2019-April 1, 2020.
Results: The influenza screening and vaccination program proved feasible. Of the 20,878 ED visits that occurred within the study period, 3,565 (17.1%) included a screening for influenza vaccine eligibility; a small proportion (11.5%) of the patients seen had multiple screenings. Among the patients screened eligible for the vaccine, 916 ultimately received an influenza vaccination while in the ED (43.7% of eligible patients). There was significant variability in the characteristics of patients who were and were not screened and vaccinated. Age, gender, race, preferred language, and receipt of a flu vaccine in prior years were associated with screening and/or receiving a vaccine in the ED.
Conclusion: Vaccination programs in the ED can boost community vaccination rates and play a role in both preventing and treating current and future vaccine-preventable public health crises, although efforts must be made to deliver services equitably. [West J Emerg Med. 2022;23(5)628–632.]
INTRODUCTION
Prior to the COVID-19 pandemic (respiratory disease caused by a coronavirus, SARS-CoV-2, discovered in 2019), seasonal influenza was the most common vaccine preventable illness in the United States.The US Centers for Disease Control and Prevention estimates from the 20192020 influenza season suggest 39-56 million infections, 410,000-740,000 hospitalizations, and 24,000-62,000 deaths due to influenza.1 Despite this toll, less than half of the adult population received an influenza vaccine.2 Further,
there are disproportionately low rates of vaccination among communities of color with less access to traditional healthcare services.2
Influenza vaccines are commonly provided through community health events and primary care appointments. However, acute unscheduled healthcare visits such as emergency department (ED) visits are increasingly viewed as important vaccination opportunities.3 With more than 145 million ED visits per year in the US, and a patient population that often includes vulnerable and underserved
Western Journal of Emergency Medicine 628 Volume 23, no. 5: September 2022 Brief Research Report
* † ‡
individuals/communities, the ED is uniquely positioned to support a comprehensive national vaccine strategy. Developing an effective ED-based vaccination program is complicated. Emergency physicians and other clinicians have limited time and may frequently opt out of screening for non-emergency concerns. Incorporating public health interventions into routine ED flow using the full spectrum of ED staff has the potential to reduce the burden associated with these non-emergent tasks and increase vaccination rates. In this retrospective, observational study we examined the uptake of a nurse-initiated influenza vaccination program in a single-center, urban ED during the 2019-2020 influenza season and explored patient-level correlates of screening participation and vaccination.
METHODS
Harborview Medical Center (HMC) is a large, publicly owned, urban, Level I trauma center located on the West Coast with a mission focused on underserved, immigrant, and other vulnerable populations. During the 2019-2020 influenza season, HMC implemented a nurse-initiated ED vaccination program using a “task list” embedded in the electronic health record (EHR). The EHR screening tool used in this study was part of a non-interruptive, non-mandatory nursing task. The task list was used since it was easy to program and allowed nursing staff the flexibility requested by nursing leadership. It should be noted that this work was implemented just prior to an EHR change, and limited information technology capacity was available for a more integrated format. Nurse managers educated staff about the task list and how to use it. It was not included in the standard triage process, although individual nurses could choose to do this based on ED volume and wait times.
When the influenza task was selected, the nurse was prompted to ask a set of vaccine eligibility and exclusion criteria questions. Patients were considered eligible if they had not previously received the 2019-2020 flu season vaccine and there were no medical contraindications for vaccination (eg, enrolled in immunotherapy.). If eligible, the patient was asked whether they would like the influenza vaccine, which was then administered by the screening nurse if the patient consented. Information on eligibility, refusal, and vaccine administration were documented in the EHR.
Our analyses included all patient visits with Emergency Severity Index (ESI) ≥3 to the HMC ED from October 1, 2019-April 1, 2020. The ESI is a triage algorithm that classifies patients into five case groups ranging from 1 (most urgent) to 5 (least urgent) based on clinical acuity and resource needs.4 Those with ESI <3 were excluded, as screening for influenza vaccine eligibility in these patients may not be likely, feasible, or appropriate. Deidentified patient data was obtained by a data analyst from the electronic data warehouse. Variables analyzed for each visit in our descriptive analyses and regression modeling included the following: age as a
binary variable categorized as <35 years of age (child though young adult, reference category) vs ≥35 years of age (middleage to older adult); gender; insurance status; race/ethnicity; preferred language; designated primary care physician, and receipt of prior influenza vaccine.
We conducted two sets of analyses. In the first set, we used ED visits as the unit of analysis, comparing characteristics of those who were screened vs not screened during those visits. We then examined unique patients who were screened and eligible for vaccination, comparing characteristics among those who were ultimately vaccinated in the ED vs those who were not vaccinated among those screened eligible. For each set of analyses, we compared the distributions of patient characteristics using chi-square tests and constructed multivariable logistic regression models to examine patient factors associated with screening and vaccination uptake. Robust clustered standard errors by patient identifier were used to account for correlation across individual patients over time in the screening uptake models, as some patients had multiple ED visits within the study period.
RESULTS
We included 20,878 ED visits from 13,765 unique patients in the analysis.
Screening
During the study period 3,565 influenza vaccinationeligibility screenings (17.1% of all ED visits) occurred. Most patients who entered the ED had only one influenza vaccination screen; 11.5% of patients were screened more than once over the course of the study period. There were observed differences in key patient demographics between those screened and those not screened during the study period. Those who received screenings were slightly older and more likely to have English as a preferred language than those who did not get screened (Table 1). In our logistic regression models examining associations between patient characteristics and the performance of influenza vaccination-eligibility screening, we found statistically significant associations for age, Black race, and Asian race (Table 2). Age was associated with increased odds of being screened; patients who were Black or Asian had reduced odds of being screened.
Vaccination
Among all 3,099 unique patients screened, 2,098 (67.7%) were deemed eligible for vaccination. Less than 1% of patients had documented contraindications. Of those 2,098 eligible, 916 ultimately received an influenza vaccination (43.7% of eligible patients). The remaining 1,182 patients declined vaccination as documented in the EHR after screening eligibility.
All patient characteristics included in our analysis, with the exception of race and insurance provider, were statistically significantly different between eligible screened patients who
Volume 23, no. 5: September 2022 629 Western Journal of Emergency Medicine Parrish et al. ED Influenza Vaccination Program
ED
Table 1. Descriptive characteristics of patients and emergency department visits, by screening status and vaccination status.
Screening status
Vaccination status (among those screened eligible)
Patient characteristics Screened (n = 3,565) Not screened (n = 17,313) P-value Vaccinated (n = 916) Not vaccinated (n = 1,182) P-value
Age in years, mean (SD) 46.2 (15.9) 45.4 (16.8) 0.01 44.2 (15.1) 42.8 (15.3) 0.04
Female, n (%) 1,269 (35.6) 6,006 (34.7) 0.30 279 (30.5) 431 (36.5) <0.01
Race, n (%) 0.01 0.07
White 2,239 (62.8) 10,189 (58.9) 597 (65.2) 727 (61.5)
Black 929 (26.1) 5,000 (28.8) 223 (24.3) 339 (28.7)
Asian 195 (5.5) 1,107 (6.3) 40 (4.4) 53 (4.5)
American Indian or Alaska Native 140 (3.9) 684 (4.0) 34 (3.7) 49 (4.2)
Native Hawaiian or Pacific Islander 34 (1.0) 198 (1.1) 11 (1.2) 9 (0.8)
Unknown or declined to answer 28 (0.8) 135 (0.8) 11 (1.2) 5 (0.4)
Hispanic, n (%) 474 (13.3) 2,338 (13.5) 0.91 163 (17.8) 128 (10.8) <0.01
Insurance, n (%) 0.75 0.09
Medicaid 1,642 (46.1) 8,104 (46.8) 446 (48.7) 591 (50.0)
Medicare 812 (22.8) 3,894 (22.5) 160 (17.5) 210 (17.8)
Commercial 456 (12.8) 2,089 (12.1) 100 (10.9) 160 (13.5)
Self 469 (13.2) 2,325 (13.4) 155 (16.9) 157 (13.3)
Other 186 (5.2) 901 (5.2) 55 (6.0) 64 (5.4)
Language, n (%) 0.02 <0.01
English 3,136 (88.0) 14,980 (86.5) 770 (84.1) 1,075 (91.0)
Spanish 225 (6.3) 1,125 (6.5) 88 (9.6) 50 (4.2)
Other 204 (5.7) 1,208 (7.0) 58 (6.3) 57 (4.8)
Designated PCP, n (%) 1,837 (51.5) 8,791 (50.8) 0.41 441 (48.1) 499 (42.2) 0.01
Prior influenza vaccine, n (%) 1,039 (29.1) 4,875 (28.2) 0.23 275 (30.0) 187 (15.8) <0.01 PCP, primary care physician.
Table 2. Associations between patient characteristics and screening and vaccination status from adjusted analyses.
Screening status
N = 20,878
Patient characteristics
Vaccination status (among those screened eligible) n = 2,098
Odds ratio 95% CI P-value Odds ratio 95% CI P-value
Age, ≥ 35 years (ref < 35 years) 1.10 1.01, 1.20 0.04 1.06 0.87, 1.30 0.54 Female (ref male) 1.05 0.97, 1.13 0.26 0.70 0.58, 0.85 <0.01 Race (ref White)
Black 0.85 0.77, 0.93 <0.01 0.76 0.61, 0.94 0.01
Asian 0.82 0.69, 0.97 0.02 0.86 0.54, 1.36 0.53
American Indian or Alaska Native 0.93 0.76, 1.14 0.48 0.84 0.53, 1.32 0.45
Native Hawaiian or Pacific Islander 0.79 0.54, 1.16 0.23 1.41 0.56, 3.55 0.46
Unknown or declined to answer 0.98 0.65, 1.47 0.91 2.19 0.72, 6.62 0.17
Hispanic (ref Non-Hispanic) 0.94 0.81, 1.09 0.43 1.30 0.93, 1.81 0.13 Insurance (ref Medicaid)
Medicare 0.98 0.89, 1.09 0.76 0.86 0.66, 1.11 0.23 Commercial 1.07 0.95, 1.21 0.24 0.82 0.61, 1.10 0.18 CI, confidence interval; ref, reference.
Western Journal of Emergency Medicine 630 Volume 23, no. 5: September 2022
Influenza Vaccination Program Parrish et al.
Table 2. Continued.
Patient characteristics
Screening status N = 20,878
Vaccination status (among those screened eligible) n = 2,098
Odds ratio 95% CI P-value Odds ratio 95% CI P-value
Self 1.04 0.92, 1.18 0.53 1.07 0.80, 1.44 0.62
Other 1.02 0.86, 1.21 0.80 1.11 0.75, 1.65 0.58
Language (ref English)
Spanish 0.91 0.79, 1.05 0.22 1.72 1.06, 2.79 0.02
Other 0.86 0.73, 1.01 0.08 1.54 1.02, 2.32 0.04
Designated PCP, n (%) 1.00 0.92, 1.09 0.99 1.10 0.91, 1.34 0.32
Prior influenza vaccine, n (%) 1.05 0.96, 1.16 0.26 2.33 1.85, 2.93 <0.01
did and did not receive influenza vaccines in the ED (Table 1). The patient group that received an influenza vaccine had a higher mean age, lower proportion of females, higher proportion of Spanish speakers, and higher proportion of documented receipt of a prior influenza vaccine. In the multivariable regression models, the receipt of an influenza vaccine in the ED was positively associated with Spanish as preferred language, and documented evidence of prior influenza vaccination. There were statistically significant negative associations for patient gender and race. Vaccine-eligible patients who were female or Black had lower odds of receiving an influenza vaccine compared to male or White patients (Table 2).
DISCUSSION
In this retrospective study, we found that an EDbased, nurse-initiated influenza vaccination program can be integrated into a busy clinical workflow. This program represents an opportunity to increase vaccination rates and support population health initiatives, especially for those with limited access to non-emergency care services.5 Important questions around workflow, financial viability, and limitations related to the scope and scale of potential non-emergent services performed in the ED setting still remain.
We observed substantial variability in patient characteristics between those who were screened for influenza vaccination eligibility, and subsequently those who eventually were immunized. Individuals who are Black or Asian were less likely to be screened for vaccine eligibility. While it is more difficult to comment on the disparities observed for vaccination uptake among eligible patients (this no longer represents a subgroup of all ED visits), we again note that vaccine-eligible Black patients were less likely to be vaccinated than White patients. Racial bias is welldocumented in the American healthcare system generally6 and in the ED more specifically.7,8 This study again raises important questions about equity in healthcare delivery.
Initiatives promoting vaccination in the ED must examine mechanisms that work toward consistent and equitable screening and vaccination to ensure that disparities in health services utilization are mitigated, not exacerbated. Additionally, future work should educate healthcare workers on how to talk to patients about vaccines including use of presumptive language9 and use of motivational interviewing as ways to address vaccine hesitancy.10
LIMITATIONS
This study should be interpreted within the context of several important limitations. Perhaps most importantly, the EHR screening tool was not a part of standard, mandatory triage protocol, resulting in missed opportunities to screen and vaccinate a large number of ED patients. Integration into standard protocol could boost screening rates. Due to the nature of the data available for this analysis, we were unable to explore specific reasons as to why a patient was not screened or why a patient ultimately declined vaccination or had no documented vaccine. Further, our data does not include reason(s) for vaccine refusal nor information as to when or how healthcare workers provided motivation and counseling.
CONCLUSION
Currently, the world is in the midst of the COVID-19 pandemic. Effective vaccines that protect against the severe consequences of COVID-19 exist, but critical thresholds of vaccination rates are needed to achieve sufficient levels of morbidity and mortality reduction in the population.11 The ED is uniquely poised to fill an important vaccination gap in reaching patients who are often vulnerable and lack access to primary care services.12 This work demonstrates that ED-based vaccination programs are feasibly implemented and can boost vaccination rates, though efforts must be made to ensure equitable delivery.
CI, confidence interval; ref, reference; PCP, primary care physician
Volume 23, no. 5: September 2022 631 Western Journal of Emergency Medicine Parrish et al. ED Influenza Vaccination Program
ED Influenza Vaccination Program
Address for Correspondence: Canada Parrish, PhD, MSPH, University of Washington, Department of Emergency Medicine, Magnuson Health Sciences Building, 1705 NE Pacific Street, F Wing, UW Box 357235 Seattle, WA 98195. Email: canada05@uw.edu.
Conflicts of Interest: By the WestJEM article submission agreement, all authors are required to disclose all affiliations, funding sources and financial or management relationships that could be perceived as potential sources of bias. No author has professional or financial relationships with any companies that are relevant to this study. There are no conflicts of interest or sources of funding to declare.
Copyright: © 2022 Parrish et al. This is an open access article distributed in accordance with the terms of the Creative Commons Attribution (CC BY 4.0) License. See: http://creativecommons.org/ licenses/by/4.0/
department. JAMA Pediatr. 2018;172(1):e173879.
4. Agency for Healthcare Research and Quality. Emergency Severity Index (ESI): A Triage Tool for Emergency Departments. 2020. Available at: https://www.ahrq.gov/patient-safety/settings/emergencydept/esi.html. Accessed June 29, 2021.
5. Rust G, Ye J, Baltrus P,et al. Practical barriers to timely primary care access: Impact on adult use of emergency department services. Arch Intern Med. 2008;168(15):1705-10.
6. Williams DR, Wyatt R. Racial bias in health care and health: challenges and opportunities. JAMA. 2015;314(6):555-6.
7. Raman J, Johnson TJ, Hayes K, et al. Racial differences in sepsis recognition in the emergency department. Pediatrics 2019;144(4):20190348.
8. Wong AH, Whitfill T, Ohuabunwa EC, et al. Association of race/ ethnicity and other demographic characteristics with use of physical restraints in the emergency department. JAMA Netw Open 2021;4(1):e2035241.
REFERENCES
1. Centers for Disease Control and Prevention. 2019-2020 U.S. Flu Season: Preliminary In-Season Burden Estimates | CDC. Available at: https://www.cdc.gov/flu/about/burden/preliminary-in-seasonestimates.htm. Accessed June 29, 2021.
2. Centers for Disease Control and Prevention. Flu Vaccination Coverage, United States, 2019–20 Influenza Season | FluVaxView | Seasonal Influenza (Flu) | CDC. Available at: https://www.cdc.gov/flu/ fluvaxview/coverage-1920estimates.htm. Accessed June 29, 2021.
3. Hart RJ, Stevenson MD, Smith MJ,et al. Cost-effectiveness of strategies for offering influenza vaccine in the pediatric emergency
9. Opel DJ, Heritage J, Taylor JA, et al. The architecture of providerparent vaccine discussions at health supervision visits. Pediatrics 2013;132(6):1037.
10. Wermers R, Ostroski T, Hagler D. Health care provider use of motivational interviewing to address vaccine hesitancy in college students. J Am Assoc Nurse Pract. 2021;33(1):86-93.
11. Omer SB, Yildirim I, Forman HP. Herd Immunity and Implications for SARS-CoV-2 control. JAMA. 2020;324(20):2095-6.
12. Waxman MJ, Moschella P, Duber HC, et al. Emergency department–based COVID-19 vaccination: Where do we stand? Acad Emerg Med. 2021;28(6):707-9.
Western Journal of Emergency Medicine 632 Volume 23, no. 5: September 2022
Parrish et al.
Brief Research
Horizontal Violence Toward Emergency Medicine Residents: Gender as a Risk Factor
Ashley A. Jacobson, MD* James E. Colletti, MD† Neha P. Raukar, MD, MS†
Section Editor: Jeffrey Druck, MD
Mayo Clinic Health System, Department of Emergency Medicine, Eau Claire, Wisconsin Mayo Clinic, Department of Emergency Medicine, Rochester, Minnesota
Submission history: Submitted November 25, 2021; Revision received June 13, 2022; Accepted June 5, 2022 Electronically published August 19, 2022
Full text available through open access at http://escholarship.org/uc/uciem_westjem DOI: 10.5811/westjem.2022.6.55485
Introduction: Horizontal violence (HV) is defined as “persistent exposure to interpersonal aggression and mistreatment from colleagues.” Our objective in this pilot, single-site study was to identify sources of HV toward emergency medicine (EM) residents, using the Negative Acts Questionnaire-Revised (NAQ-R).
Methods: In this investigation we used a descriptive cross-sectional survey design to categorize HV. All voluntary participants were residents in an Accreditation Council for Graduate Medical Educationapproved, three-year academic EM residency. Data were collected via electronic survey and occurred six months into an academic year. We collected demographic information and responses to the NAQ-R in 2020. Horizontal violence is subdivided into three categories: work-related; personrelated; and physical intimidation. Emergency medicine residents answered questions as they related to their interactions with residents and support staff, which included nursing.
Results: A total of 23 of 26 residents responded (89%). Participants were 56% women, 78% white, 11% Hispanic, and 89% heterosexual. Participant clinical year was 39% first-, 39% second-, and 22% third-year residents. Women reported a higher frequency of HV compared to men (1.3 vs 1.1, P =.01). By category, women indicated higher incidence of work-related violence from other residents (P = .05) and staff (P =.02). There was no difference in reported frequency of violence for interns compared to senior residents.
Conclusion: Our pilot study demonstrated horizontal violence toward EM residents exists and is more prevalent in women. [West J Emerg Med. 2022;23(5)633–636.]
INTRODUCTION
The hierarchical structure of education in healthcare is a known risk factor for workplace bullying.1-7 Workplace bullying is defined as “harassing, offending, socially excluding someone, or negatively affecting someone’s work…occur[ing] repeatedly and regularly (weekly) and over a period of time (eg, about six months).”8
Horizontal violence (HV), “ persistent exposure to interpersonal aggression and mistreatment from colleagues,” 9 has predominately been researched within the nursing field 10-11 with interest in resident-directed HV
only recently gaining momentum.7,12-13 Resident-directed HV is comprised of staff-to-resident and resident-toresident bullying. This study focused on HV and did not evaluate vertical violence (attending-to-resident bullying). The general surveys globally used to assess attending and resident physician workplace bullying are the Negative Acts Questionnaire-Revised (NAQ-R), 4-6,12-14 a bullying scale predominantly used within the United Kingdom,1,3 and various single-site questionnaires.15-17
Worldwide, workplace bullying of residents has been identified.7 In the US, Daugherty et al15 found that after
Volume 23, no. 5: September 2022 633 Western Journal of Emergency Medicine
Report
* †
intern year, 62.9% of residents had experienced mistreatment from any source (eg, medical student, resident, attending, nurse, patient). A subsequent study elucidated that 66% of US trainees across all years and specialties experienced at least one type of bullying behavior from either an attending, nurse, patient, peer, consultant, or ancillary staff, with female, non-white residents reporting higher frequency of these episodes.1 Workplace bullying of resident physicians is associated with increased psychological distress, increased depressive symptoms, and a positive post-traumatic stress disorder screening.3,18-19
Overall, there is a paucity of data regarding HV specifically and its adverse effects on residents, especially residents in EM – a specialty that depends on frequent interactions with staff and residents from different services. In this pilot study we hypothesized that women residents in their first year of residency training would experience more HV, specifically from other residents and support staff, as measured by a tailored healthcare version of the 22-item NAQ-R.
METHODS
This pilot study used a descriptive cross-sectional design to determine HV specifically within an EM residency program. All participants were residents within an academic, Level I trauma center in the United States. A voluntary, electronic version of the NAQ-R, that has been used in other healthcare residency settings,12-13 was disseminated. Data were collected anonymously in 2020, six months into the resident’s current year of training. Data collected included demographic information and responses to the NAQ-R. All data were blinded prior to analysis to decrease the risk associated with surveying a vulnerable population. This study was deemed exempt by the institutional review board. There was no external funding to support this project.
We chose the 22-item NAQ-R as the survey instrument as it is considered the gold standard worldwide (Appendix A). The NAQ-R assesses bullying related to work, personhood, and physical intimidation. Work-related HV questions focus on withholding information, ignoring orders, and excessive monitoring. Person-related HV questions focus on humiliation, gossip, ridicule, and insults. Physical intimidation HV questions focus on shouting, finger-pointing, and physical violence.9,12-13 These questions have been previously tailored to represent the healthcare environment and have been previously validated within general surgery and obstetrics and gynecology residency populations.13
Bullying is evaluated in two different ways within the NAQ-R. The NAQ-R originally used an operational definition in 2009; in 2012, the authors reanalyzed the original data to create a cut-off score definition. This was done to improve analysis related to prevalence of workplace bullying. Current literature primarily focuses on the quantitative definition. The operational definition defines bullying as experiencing a negative act once per
week during the prior six months; to determine these criteria, survey item responses of “ weekly” or any response of “daily” corresponded to each operationalized definition of bullying. The quantitative definition of bullying takes the total score of the 22-item NAQ-R (maximum score 110 if answered “daily” to all questions), and those with total scores greater than 33 are classified as bullying. 4,9,20-21
Residents were asked to complete the 22 questions as they related specifically to other residents, including co-residents, off-service residents, and consulting service residents. They then answered the 22 questions as they related to support staff, including nurses, respiratory therapists, lab technicians, personal care assistants, care team assistants, and finance representatives. We summarized the data with medians and interquartile ranges or with frequency counts and percentages, as applicable. Survey items were presented to respondents using a descriptive Likert scale and were subsequently coded from 1 to 5 with 1 (never), 2 (now and then), 3 (monthly), 4 (weekly), and 5 (daily). A total response score was computed by adding the responses across all 22 survey items. Additionally, we further grouped the survey items into categories of work-related, person-related, and physical intimidation. Data analysis was completed using R Core Team (2019) software (R Foundation for Statistical Computing, Vienna, Austria). Gender and postgraduate year responses to event-frequency questions were performed using Wilcoxon rank sum tests. To avoid issues of multiple comparisons, all P -values were adjusted using the false discovery rate correction. All tests were two-sided, and P -values less than 0.05 were considered significant.
RESULTS
A total of 23 of 26 residents completed the questionnaire for a response rate of 88.5%. The table summarizes demographic data. Five respondents only completed the resident portion of the questionnaire. These data are included within the resident analysis making the resident data analysis out of 23 participants; the support staff data analysis included 18 total participants.
From the operational NAQ-R definition of bullying, 13.0% of respondents (3/23) reported being bullied by residents, and 11.1% of respondents (2/18) indicated being bullied by support staff once a week. When the quantitative bullying score (>33 points) was used, 17.4% of respondents were bullied by residents (4/23) and 27.8% were bullied by support staff (5/18); there was no significant difference between support staff and resident bullying (P =.471). Overall, women reported a higher frequency of HV compared to men (1.3 vs 1.1, P =.01). When subdividing HV into the three categories of work-related violence, personrelated violence, and physical intimidation categories, women indicated a higher incidence of work-related violence, both from residents (P= .05) and from support staff
Western Journal of Emergency Medicine 634 Volume 23, no. 5: September 2022 Horizontal Violence Toward Emergency Medicine Residents Jacobson et al.
Table. Demographics of residents who participated in survey on frequency of horizontal violence.
Demographics
Number of Respondents (N = 18a)
Gender
Women 10 (56%)
Men 8 (44%)
Postgraduate Year (PGY)
PGY 1 7 (39%)
PGY 2 7 (39%)
PGY 3 4 (22%)
Race
American Indian or Alaska Native 0 (0%)
Asian 0 (0%)
Black or African American 0 (0%)
Native Hawaiian or other Pacific Islander 0 (0%)
White 14 (78%)
Other/Did not disclose 4 (22%)
Ethnicity
Hispanic or Latino 2 (11%)
Not Hispanic or Latino 15 (83%)
Did not disclose 1 (6%)
Sexual orientation
Bisexual 1 (6%)
Heterosexual or straight 16 (89%)
Lesbian or gay 0 (0%)
Did not disclose 1 (6%)
a5 Respondents did not disclose any demographic information.
Figure. Horizontal violence (HV) presented as average survey response and broken down by gender and the three subcategories of HV: work-related, person-related, and physical intimidation. The self-reported frequency of violence is scored from 1 (never) to 5 (daily). Women experienced a higher incidence of work-related violence, both from other residents (P =.05) and from support staff members (P =.02). This was statistically significant in comparison to men.
more heterogeneous population of EM residents across multiple EM residency programs to evaluate the role of race, ethnicity, and sexual orientation to help inform the creation of future interventions aimed at reducing HV. Further studies will be needed to determine what type of interventions need to be implemented.
LIMITATIONS
(P =.02) as viewed in the Figure. There was no difference in reported violence between clinical years.
DISCUSSION
The literature has focused on HV experienced by nurses; this study highlights that residents also experience HV. The HV that was reported during the first six months of the clinical year demonstrates more EM women residents experience overall HV from both cohorts – residents and support staff. Overall, there is statistical significance between gender, specifically in work-related HV. This specific subset of HV consists of ignoring orders/withholding of information. Men, on the other hand, seem to have a consistent experience with notably less HV than women. Clinical year did not affect HV reported.
Our findings are in line with prior studies that found residents experience more work-related HV overall and that women residents experience more bullying.1,7,12-13 Future work should expand this pilot study to include a
Limitations to this pilot study include the small sample size of 26 possible residents, which limited the ability to perform a robust statistical analysis. As this was a selfreported questionnaire, the data may be influenced by recall bias. Age was not included in the demographic portion of the questionnaire, which may be an important variable to consider as well. Unfortunately, not everyone completed all the demographic questions.
CONCLUSION
The ED is a complex work environment with highacuity patients presenting in a time-sensitive manner with frequent communication between sub-specialties and admitting services. The addition of residents adds to the complexity of patient care for learners and staff. It is noteworthy that even with a small sample size and homogeneous resident population, gender is a potential factor as to who experiences horizontal violence and from which sources. Overall, this study highlights an area of opportunity to improve the educational experience of residents. Recognizing that gender may be an indicator for HV during resident training is an important first step to ultimately creating a safer learning environment.
Volume 23, no. 5: September 2022 635 Western Journal of Emergency Medicine Jacobson et al. Horizontal Violence Toward Emergency Medicine Residents
Address for Correspondence : Ashley A. Jacobson, MD, Department of Emergency Medicine, Mayo Clinic Health System, 1221 Whipple Street, Eau Claire, WI 54701. Email: jacobson.ashley1@mayo.edu.
Conflicts of Interest: By the WestJEM article submission agreement, all authors are required to disclose all affiliations, funding sources and financial or management relationships that could be perceived as potential sources of bias. No author has professional or financial relationships with any companies that are relevant to this study. There are no conflicts of interest or sources of funding to declare.
Copyright: © 2022 Jacobson et al. This is an open access article distributed in accordance with the terms of the Creative Commons Attribution (CC BY 4.0) License. See: http://creativecommons.org/ licenses/by/4.0/
prevalence, antecedents and consequences. Int J Organ Theory Behav. 2010;13(2):202-48.
9. Einarsen S, Hoel H, Notelaers G. Measuring exposure to bullying and harassment at work: validity, factor structure and psychometric properties of the Negative Acts Questionnaire-Revised. Work Stress 2009;23(1):24-44.
10. Bambi S, Foà C, De Felippis C, et al. Workplace incivility, lateral violence and bullying among nurses. A review about their prevalence and related factors. Acta Biomed. 2018;89:51-79.
11. Serafin L, Sak Dankosky N, Czarkowska Pączek B. Bullying in nursing evaluated by the Negative Acts Questionnaire Revised: A systematic review and meta analysis. J Adv Nurs 2020;76(6):1320-33.
12. Chowdhury ML, Husainat MM, Suson KD. Workplace bullying of urology residents: implications for the patient and provider. Urology 2019;127:30-5.
REFERENCES
1. Chadaga AR, Villines D, Krikorian A. Bullying in the American graduate medical education system: a national cross-sectional survey. PLoS One. 2016;11(3):1-14.
2. Karim S, Duchcherer M. Intimidation and harassment in residency: a review of the literature and results of the 2012 Canadian Association of Interns and Residents National Survey. Can Med Educ J 2014;5(1):e51-7.
3. Quine L. Workplace bullying, psychological distress, and job satisfaction in junior doctors. Camb Q Healthc Ethics. 2003;12(1):91-101.
4. Rahm GB, Rystedt I, Wilde Larsson B, et al. Workplace bullying among healthcare professionals in Sweden: a descriptive study. Scand J Caring Sci. 2019;33(3):582-91.
5. Rouse LP, Gallagher-Garza S, Gebhard RE, et al. Workplace bullying among family physicians: a gender focused study. J Womens Health (Larchmt). 2016;25(9):882-8.
6. Westbrook J, Sunderland N, Li L, et al. The prevalence and impact of unprofessional behaviour among hospital workers: a survey in seven Australian hospitals. Med J Aust. 2021;214(1):31-7.
7. Samsudin EZ, Isahak M, Rampal S. The prevalence, risk factors and outcomes of workplace bullying among junior doctors: a systematic review. Eur J Work Organ. 2018:1-19.
8. Matthiesen SB, Einarsen S. Bullying in the workplace: definition,
13. Schlitzkus LL, Vogt KN, Sullivan ME, et al. Workplace bullying of general surgery residents by nurses. J Surg Educ. 2014;71(6):e149-54.
14. Ling M, Young CJ, Shepherd HL, et al. Workplace bullying in surgery. World J Surg. 2016;40(11):2560-6.
15. Daugherty SR, Baldwin Jr DWC, Rowley BD. Learning, satisfaction, and mistreatment during medical internship. JAMA 1998;279(15):1194-9.
16. Volz N, Fringer R, Walters B, et al. Prevalence of horizontal violence among emergency attending physicians, residents, and physician assistants. West J Emerg Med. 2017;18(2):213-8.
17. Wolfman DJ, Parikh JR. Resident bullying in diagnostic radiology. Clin Imaging. 2019;55:47-52.
18. Loerbroks A, Weigl M, Li J, et al. Workplace bullying and depressive symptoms: a prospective study among junior physicians in Germany. J Psychosom Res. 2015;78(2):168-72.
19. Jackson T, Provencio A, Bentley-Kumar K, et al. PTSD and surgical residents: Everybody hurts… sometimes. Am J Surg 2017;214(6):1118-24.
20. Mikkelsen EG, Einarsen S. Bullying in Danish work-life: prevalence and health correlates. Eur J Work Organ. 2001;10(4):393-413.
21. Notelaers G, Einarsen S. The world turns at 33 and 45: defining simple cutoff scores for the NEGATIVE Acts Questionnaire–revised in a representative sample. Eur J Work Organ. 2013;22(6):670-82.
Western Journal of Emergency Medicine 636 Volume 23, no. 5: September 2022 Horizontal Violence Toward Emergency Medicine Residents Jacobson et al.
Discharge Navigator: Implementation and Cross-Sectional Evaluation of a Digital Decision Tool for Social Resources upon Emergency Department Discharge
Madeline Grade, MD, MSc*¶ Nicholas Stark, MD, MBA*¶
David Emanuels, BSE†
Alice Lu, MSL†
Jay Doshi, BS‡ Sherman Leung, MS§ Christopher Peabody, MD, MPH*¶
Section Editor: Nikhil Goyal, MD
University of California San Francisco, Department of Emergency Medicine, San Francisco, California
University of California San Francisco School of Medicine, San Francisco, California Cornell University, Ithaca, New York Icahn School of Medicine at Mount Sinai, New York City, New York University of California San Francisco, Acute Care Innovation Center, San Francisco, California
Submission history: Submitted October 9, 2021; Revision received March 3, 2022; Accepted June 23, 2022
Electronically published August 11, 2022
Full text available through open access at http://escholarship.org/uc/uciem_westjem DOI: 10.5811/westjem.2022.5.55015
Introduction: Many patients have unaddressed social needs that significantly impact their health, yet navigating the landscape of available resources and eligibility requirements is complex for both patients and clinicians.
Methods: Using an iterative design-thinking approach, our multidisciplinary team built, tested, and deployed a digital decision tool called “Discharge Navigator” (edrive.ucsf.edu/dcnav) that helps emergency clinicians identify targeted social resources for patients upon discharge from the acute care setting. The tool uses each patient’s clinical and demographic information to tailor recommended community resources, providing the clinician with action items, pandemic restrictions, and patient handouts for relevant resources in five languages. We implemented two modules at our urban, academic, Level I trauma center.
Results: Over the 10-week period following product launch, between 4-81 on-shift emergency clinicians used our tool each week. Anonymously surveyed clinicians (n = 53) reported a significant increase in awareness of homelessness resources (33% pre to 70% post, P<0.0001) and substance use resources (17% to 65%, P<0.0001); confidence in accessing resources (22% to 74%, P<0.0001); knowledge of eligibility criteria (13% to 75%, P<0.0001); and ability to refer patients always or most of the time (11% to 43%, P<0.0001). The average likelihood to recommend the tool was 7.8 of 10.
Conclusion: Our design process and low-cost tool may be replicated at other institutions to improve knowledge and referrals to local community resources. [West J Emerg Med. 2022;23(5)637–643.]
BACKGROUND
The field of emergency medicine (EM) recognizes that emergency care extends beyond meeting patients’ acute medical needs; addressing patients’ underlying psychosocial needs is a key tenet of social EM.1-3 Considering the complex medical, behavioral, and social needs of individual patients
is vital to provide well-rounded care that addresses structural determinants of health such as racism and poverty.4-6 Such an approach necessitates both attentive care within the emergency department (ED) and connecting patients with community resources upon discharge. However, the complexity of navigating available resources is a barrier that may leave
Volume 23, no. 5: September 2022 637 Western Journal of Emergency Medicine Educational Advances
* † ‡ § ¶
social needs unaddressed.
Several companies have attempted to tackle this challenge by developing electronic databases, search tools, and community referral platforms with the goal of connecting patients to social resources. Widely used platforms include 1Degree (San Francisco CA), Unite Us (New York, NY), and Aunt Bertha (now findhelp.org) (Austin, TX).7 Most of these tools integrate a resource directory with a referral tracking component and offer some degree of filtering by category of patient need. However, these platforms are often patientfacing and tend to present patients an overwhelming number of potential resources, which can be time- consuming and painstaking for patients and clinicians to sift through without aid from a social work team. Moreover, only a few provide patients with translated materials in Spanish and even fewer offer any other languages, which is an important gap given our diverse patient population. The existing tools did not meet our need for a targeted list of local resources tailored to specific patient needs. We were also looking for the flexibility to customize listings and prioritize institution-specific resource recommendations, as well as embed clinician action items per resource to facilitate the referral process.
OBJECTIVES
Using an iterative design-thinking approach, our team aimed to create a digital decision tool to help clinicians identify and link patients to social resources upon discharge. We sought to make this tool 1) customizable, using each patient’s clinical and demographic information to tailor recommended local resources, and 2) actionable, providing the clinician with clear next steps, patient handouts in multiple languages, and updated pandemic restrictions. We also aimed to evaluate the impact of this tool on clinicians’ knowledge and confidence in caring for patients with discharge needs in domains such as housing and substance use. Ultimately, we intended to augment the existing institutional processes for patient referrals (social work, social medicine team). Through this intervention, we hoped to fortify an institutional culture of addressing social needs at multiple levels of clinical care.
DESIGN
Setting the Stage for Innovation
Our institution, San Francisco General Hospital, is a Level I trauma center with academic affiliations with the University of California San Francisco (UCSF). Prior to building our tool, we determined key stakeholders among patients, hospital and department leadership, and community partners. We also explored available funding and logistical resources to ensure sustainability. We housed this project within the UCSF Department of Emergency Medicine’s Acute Care Innovation Center (acutecare.ucsf.edu) and obtained departmental support for implementing a new tool in our clinical workflow.
Building a Multidisciplinary Team
Our project team consisted of EM faculty and residents, medical students, and undergraduates, with design assistance from members of a digital product studio at the UCSF School of Medicine, and topic expertise from physicians and social workers on our institution’s social medicine team. Hospital leadership, including the chief and vice chief of the Department of Emergency Medicine, were key stakeholders in the development and launch of the platform.
Design Process
Our team used an iterative design-thinking approach to build, test, and deploy a homegrown digital decision tool called “Discharge Navigator” (edrive.ucsf.edu/dcnav). The design process occurred over a period of 18 months, beginning with interviews of key stakeholders (patients, clinicians, nurses, and social workers) and problem definition. Throughout this process, our team learned that existing platforms in the community resource arena did not meet our local needs; so we embarked on designing our own tool. In coordination with a digital product studio at the UCSF School of Medicine, we spent over 80 hours testing a series of concepts and prototypes with focus groups of EM residents and faculty. We learned that given the time constraints of medical practice, users preferred information to be displayed by relevance to their patient’s characteristics, rather than sorting through a long list of resources themselves. We also learned that users had particular difficulty recalling the eligibility requirements and pandemic restrictions for various resources, and designs in which these were prominently highlighted were more favorably received. To maximize ease of use, we ultimately decided to build a web-based tool housed within a larger digital hub designed for daily use by our staff and accessible via the electronic health record (EHR) interface.8
We asked our focus groups to brainstorm and rank social resource domains, determining that housing and substance use treatment resources would be the highest impact pilot modules. The resident physicians and medical students on our team conducted in-depth interviews with topic experts from our institution’s social medicine team6 to identify relevant resources and key branch points in the decision trees based on patient-related inputs. We filtered resource outputs based on acuity of care required, breadth of services required, and relevant patient demographic information (eg, primary language, gender, sexual orientation, pregnancy status, and age).
Tool Development
An example of the decision tree for resources for patients experiencing homelessness is included below and was developed using LucidChart9 (Lucid Software Inc, South Jordan, UT) (Figure 1). Once the decision trees and resource
Western Journal of Emergency Medicine 638 Volume 23, no. 5: September 2022 Digital Decision Tool for Social Resources upon ED Discharge Grade et al.
end points were finalized, a volunteer team of undergraduate and medical students developed a database of community resources under the guidance of resident physicians. This database includes standardized input fields for each resource’s hours and contact information, eligibility restrictions, insurance requirements, disability accessibility, interpreter services, duration of stay, current pandemic-related restrictions and protocols, and clinician actions necessary for referral. The team contacted each community partner by phone to verify information. Updates are conducted quarterly and tracked via a rigorous change-control document.
Following the development of this database, our design team converted the standardized inputs for each resource into templated, single-page patient handouts ( Figure 2 ). Handouts were translated from English
into Spanish, Mandarin, Tagalog, and Cantonese by a private organization. We then converted the decisiontree algorithms and resource information into an intuitive and interactive digital decision tool called “Discharge Navigator,” using the web application development platform Bubble.io (New York, NY). 10 Following the embedded decision-tree logic, the calculator-like interface translates patient-related inputs into a dynamic list of relevant resources, updating with each click (Figure 3 ). For each resource listed, the digital tool highlights any clinician action items needed to complete the referral, as well as any pandemic-related requirements such as necessary COVID-19 testing. Additionally, with each resource, the Discharge Navigator provides links to patient handouts in five different language options.
 Figure 1. Decision tree for community resources to address homelessness, based on patient characteristics.
Volume 23, no. 5: September 2022 639 Western Journal of Emergency Medicine Grade et al. Digital Decision Tool for Social Resources upon ED Discharge
Implementation and Evaluation
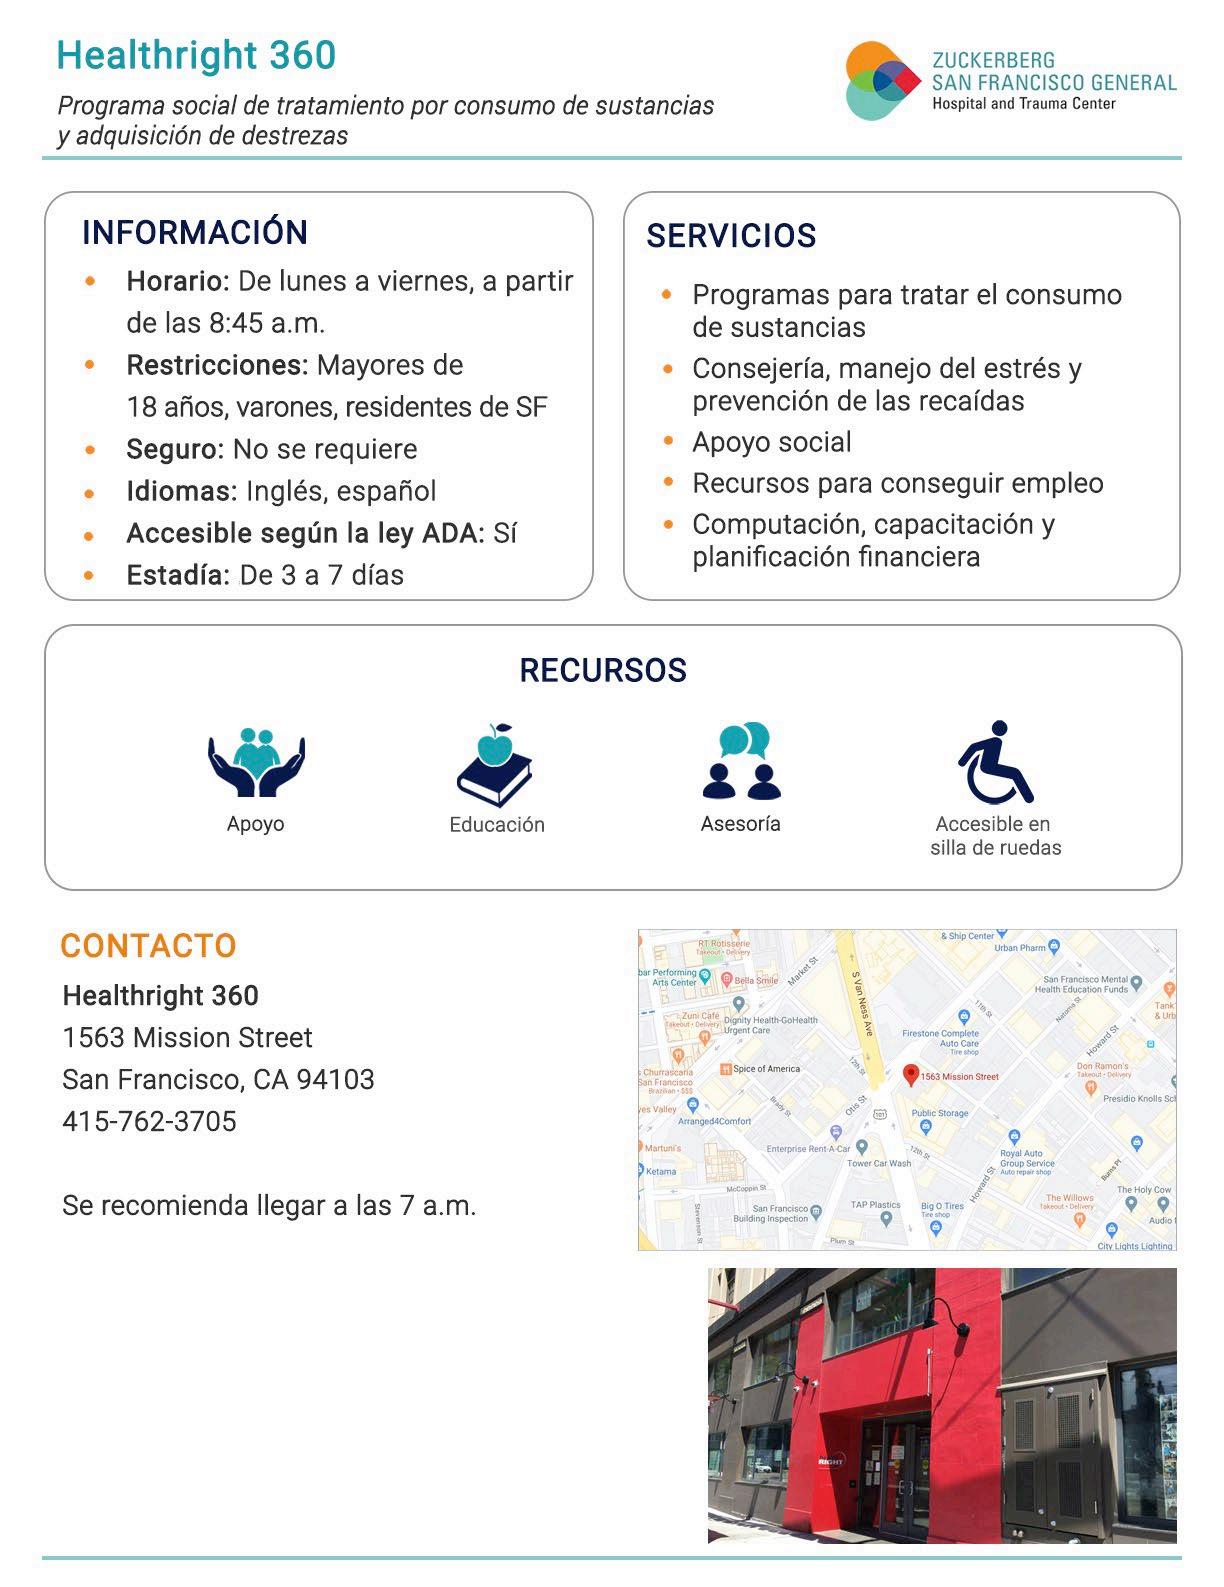
We built upon an institutional collaboration to create a digital tool for streamlining care in the COVID-19 pandemic11 and housed Discharge Navigator in our departmental digital resource hub, linked directly from our EHR system (Epic Systems Corporation, Madison, WI). We performed walkthroughs of the tool at departmental faculty and resident meetings, created a promotional video, and posted information flyers around the department.
In a 10-week period after platform launch, we conducted a single, anonymous, cross-sectional survey of emergency clinicians that asked them to recall their knowledge and confidence prior to deployment and compare that with the current state. We used Qualtrics (Provo, UT),12 with approval from our institutional review board. We considered previously validated survey measures whenever possible (eg, for perceived usefulness13 and usability14 of the digital tool) and adapted questions in the domains of tool understandability, navigability, ease of use, usefulness, and frequency of use
to create a novel unvalidated survey (Supplement 1). We compared clinician knowledge and confidence pre- and postimplementation using chi-square statistical tests, ranked perceived barriers to referral, and measured tool usage and satisfaction metrics. Collecting clinician feedback enabled the project team to iteratively improve the usability of the tool and add an additional resource domain, mental health, upon completion of the pilot.
IMPACT
During the study period, between 4-81 (average 23) individual IP addresses accessed the Discharge Navigator website per week. Fifty-five respondents completed the survey (response rate of 48%). Respondents were 58% residents and fellows, 34% attendings, and 8% nurse practitioners. Prior to the implementation of this tool, top cited barriers to referring patients to social resources were lack of knowledge of resources (44% ranked first), eligibility requirements (74% ranked first or second), and pandemic-related restrictions (20% ranked first). The launch of our tool yielded a statistically significant increase in awareness of homelessness and substance use resources, confidence in accessing resources, knowledge of eligibility criteria, and ability to refer patients always or most of the time (Figure 4). The majority of respondents found the tool useful and easy to navigate (Figure 5). We found that 53% of respondents used the tool one or more times per week, 89% used it at least once per month, 86% planned on using it more frequently, and 80% endorsed using the tool most often during
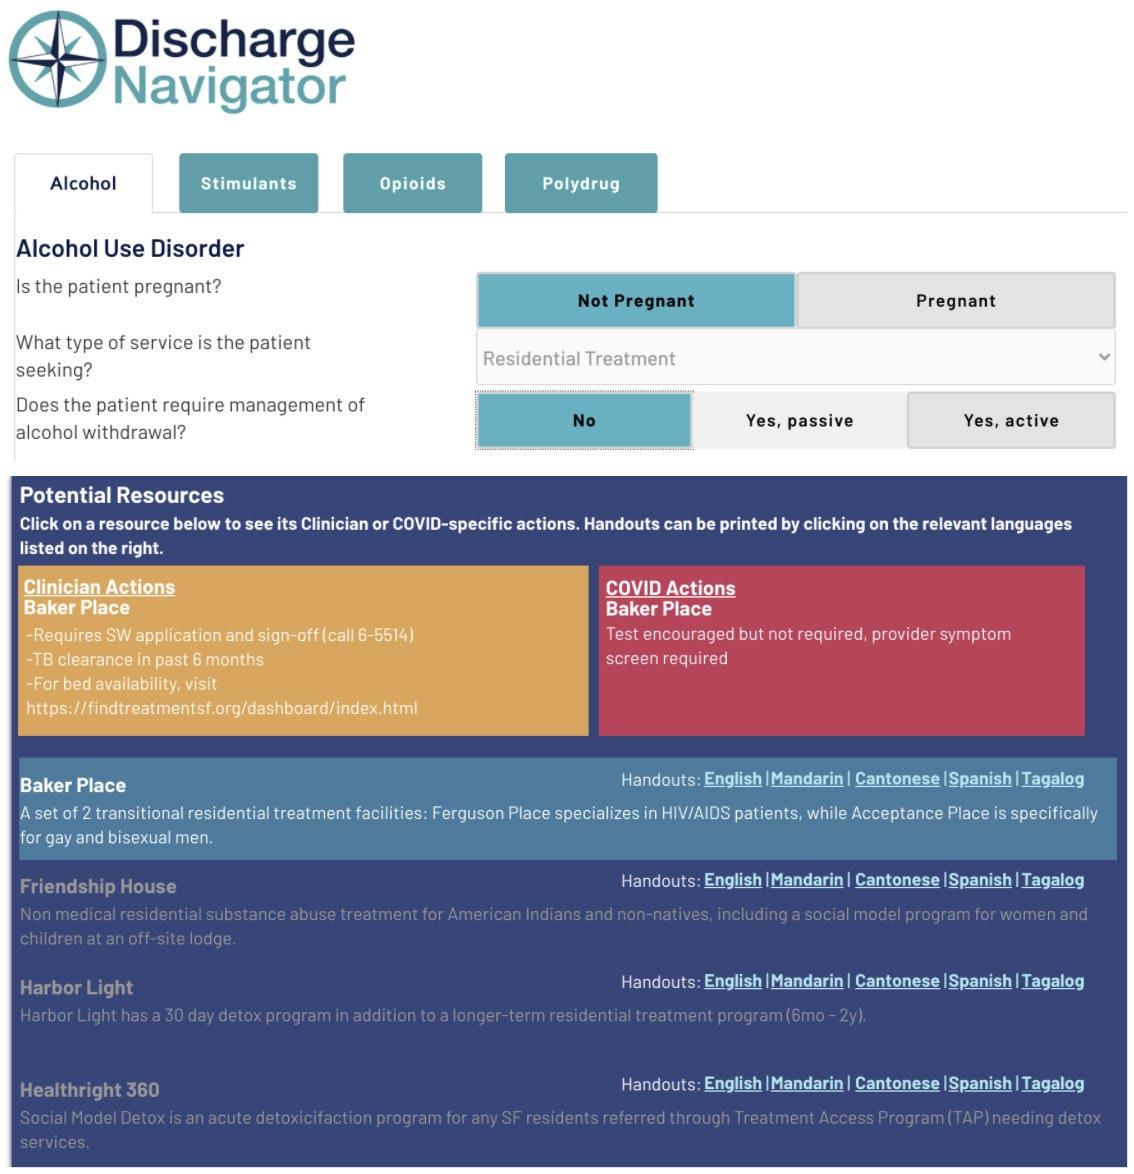 Figure 2. Example handout for a community substance use treat ment center, in Spanish.
Figure 3. Sample of digital decision tool interface, with inputs and outputs.
Figure 2. Example handout for a community substance use treat ment center, in Spanish.
Figure 3. Sample of digital decision tool interface, with inputs and outputs.
Western Journal of Emergency Medicine 640 Volume 23, no. 5: September 2022 Digital Decision Tool for Social Resources upon ED Discharge Grade et al.
nights and weekends. The average likelihood to recommend the tool to other clinicians was 7.8 of 10.
DISCUSSION
We successfully designed, built, and implemented a custom digital decision tool for social discharge resources, which was regularly used by clinicians in a public tertiary ED. Importantly, our results suggest that Discharge Navigator is an effective educational tool for emergency clinicians at our institution. Our tool significantly increased self-reported clinician knowledge and confidence in referring patients to community resources for substance use treatment and housing insecurity. In effect, the tool may help directly address the most-cited clinician-specific barriers identified in our problemdefinition interviews.

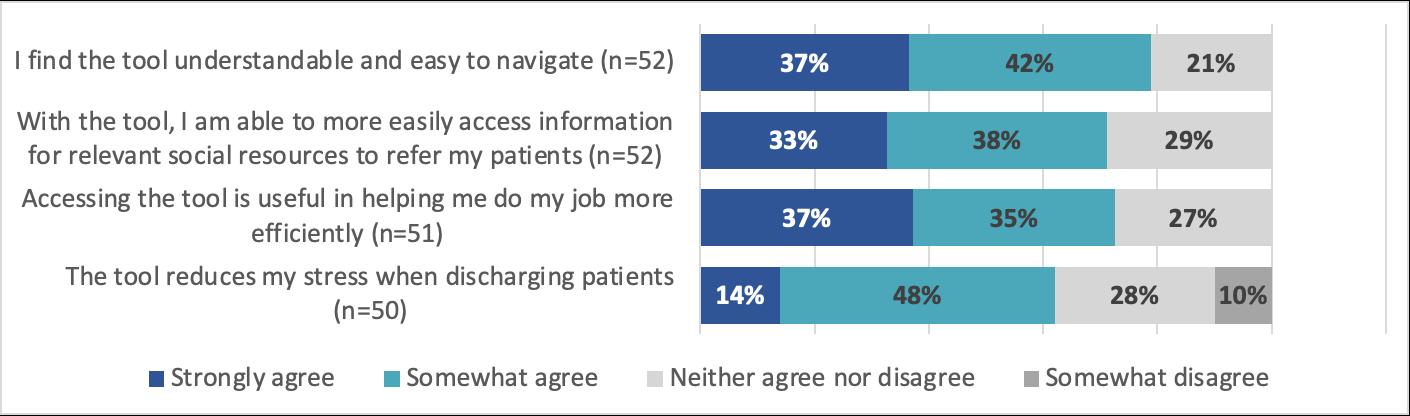
Our design process and implementation yielded several valuable insights that may assist in the development of
similar tools at other institutions. We recommend first identifying current gaps and barriers to addressing patient social needs and identifying key stakeholders including supportive leadership. It is particularly effective to develop a multidisciplinary team that includes clinicians, social workers, designers, students, and patients. A design-thinking approach or gap analysis can help identify whether the appropriate intervention is a new vs existing tool.15 In busy practice settings in which changes to workflow can face resistance, designing with user input from the start can improve resultant adoption and satisfaction. Iterating our tool with the assistance of emergency clinician focus groups helped yield a product tailored for ease of use, with a high likelihood-to-recommend score and a large majority of users planning on increasing their use of the tool in their future workflows. Collecting clinician feedback also enabled our project team to iteratively improve the usability of the tool and add an additional
Figure 4. Impact of digital decision tool on clinician knowledge of and confidence in accessing homelessness and substance use resources
Figure 5. Clinician perceptions of the digital decision tool’s usability and usefulness.
Volume 23, no. 5: September 2022 641 Western Journal of Emergency Medicine Grade et al. Digital Decision Tool for Social Resources upon ED Discharge
resource domain, mental health, upon completion of the pilot.
It is important to consider project sustainability throughout the design process. Ensuring updated community resource information was our largest implementation hurdle, as it required regular, occasionally time-intensive interactions with community partners. We partnered with students from a volunteer organization with an aligned social mission (California Social Resource Database: caliresources.org), allowing for sustainability of future updates. A $5,000 portion of a local grant was also necessary to develop and implement this tool, including fees for our handout design and translation services. For practice settings in which additional funds are unavailable, it may be more difficult to offer patient resources in multiple languages. In addition, we encountered minor technical hurdles during the iterative tool buildout process (for example, while Bubble.io offers a user-friendly interface for updates, it is limited in its pre-set options for result filtration based on multiple patient inputs). This type of technical tradeoff is important to consider when selecting a digital platform.
Our tool is a valuable addition to the existing literature of innovations to help better address social needs in the ED. Complementing prior work that describes dedicated care teams or clinics that bridge patients to resources,6,15-16 digital interventions require fewer resources and may be more feasible to implement in certain practice settings.17-19
There have been several published educational interventions to improve physician and nurse knowledge surrounding social medicine topics relevant to ED discharge, commonly in the form of modules, protocols, or EHR dot phrases.18,20 To our knowledge, Discharge Navigator is distinctive as an educational intervention for several reasons, including that it is freely accessible outside of the EHR (as well as easily linked within an EHR toolbar); spans multiple topic domains, and is designed for seamless addition of new modules; is interactive and customizable in real time to filter for specific patient characteristics (including vulnerable subgroups and treatment needs); highlights specific clinician actions for each resource; and offers simple, templated patient handouts in five languages (in contrast to discharge handouts with more complex content or heterogenous design21).
LIMITATIONS
There are several limitations of this pilot study. Our crosssectional analysis is based on self-reported metrics rather than objective measures, introducing the possibility of recall bias or inaccurate self-assessments.22-23 Using a retrospective pre/post assessment may have helped to limit response shift bias.24-25 The survey contained abbreviated or adapted questions rather than entire validated instruments. Given that our tool is custom-built for our practice setting, external validity is uncertain, although we believe that similar tools could easily be replicated and tested in other institutions based on our open-access model. Most importantly, while our pilot shows promising impact on emergency clinicians, the main limitation of our evaluation is
the lack of direct patient outcomes. Survey respondents selfreported a significant increase in their ability to refer patients to resources, but there is not currently a process in which we can track the number of patients who follow through with referrals to third-party resources, as has been done in the evaluation of other types of interventions to increase social resource referrals from the ED.17-19 This is an important area of focus for future development, as our ultimate aim is for interventions such as this one to translate into tangible patient impact.
CONCLUSION
We describe a replicable and innovative tool for improving the ability of clinicians to connect their patients with community resources, with demonstrable educational impact. By describing our design process, outcomes, and learnings, we hope that Discharge Navigator and similar tools may help build a community of emergency clinicians who regularly incorporate social determinants of health into their patient care.
Address for Correspondence: Madeline Grade, MD, MSc, University of California San Francisco, Department of Emergency Medicine, 505 Parnassus Ave, Rm M24, San Francsico, CA 94143. Email: Madeline.Grade@ucsf.edu.
Conflicts of Interest: By the WestJEM article submission agreement, all authors are required to disclose all affiliations, funding sources and financial or management relationships that could be perceived as potential sources of bias. Christopher Peabody works a consultant in unrelated capacities for FujiFilm SonoSite and BrainScope.
Copyright: © 2022 Grade et al. This is an open access article distributed in accordance with the terms of the Creative Commons Attribution (CC BY 4.0) License. See: http://creativecommons.org/ licenses/by/4.0/
REFERENCES
1. Gordon JA. Social welfare in the hospital emergency department: the challenge of integrated community health care. Ann Emerg Med 2009;53(5):603-4.
2. Anderson ES, Hsieh D, Alter HJ. Social emergency medicine: embracing the dual role of the emergency department in acute care and population health. Ann Emerg Med 2016;68(1):21-5.
3. Anderson ES, Lippert S, Newberry J, et al. Addressing social determinants of health from the emergency department through social emergency medicine. West J Emerg Med. 2016;17(4):487-9.
4. Bibbins-Domingo K. Integrating social care into the delivery of health care. JAMA. 2019;322(18):1763-4.
5. Castrucci B, Auerbach J. Meeting individual social needs falls short of addressing social determinants of health. Health Aff Blog. Available at: https://www.healthaffairs.org/do/10.1377/ forefront.20190115.234942/. Accessed May 2021.
Western Journal of Emergency Medicine 642 Volume 23, no. 5: September 2022 Digital Decision Tool for Social Resources upon ED Discharge Grade et al.
6. Chase J, Bilinski J, Kanzaria HK. Caring for emergency department patients with complex medical, behavioral health, and social needs. JAMA. 2020;324(24):2550-1.
7. Cartier Y, Fichtenberg C, Gottlieb L. Community resource referral platforms: a guide for health care organizations. SIREN. Apr 16, 2019. Available at: https://sirenetwork.ucsf.edu/sites/default/files/ wysiwyg/Community-Resource-Referral-Platforms-Guide.pdf Accessed June 27, 2021.
8. Schwartz HEM, Stark NR, Sowa CS, et al. Building back better: applying lessons from the COVID-19 pandemic to expand critical information access. J Emerg Med. 2021;61(5):607-14.
9. LucidChart. 2010. Available at: https://www.lucidchart.com. Accessed December 2020.
10. Bubble. 2012. Available at: https://www.bubble.io/. Accessed December 2020.
11. Stark N, Kerrissey M, Grade M, et al. Streamlining care in crisis: rapid creation and implementation of a digital support tool for COVID-19. West J Emerg Med. 2020;21(5):1095-101.
12. Qualtrics. 2005. Available at: https://www.qualtrics.com. Accessed February 2021.
13. David FD. Perceived usefulness, perceived ease of use, and user acceptance of information technology. MIS Quarterly 1989;13(3):319–40.
14. Brooke J. SUS: A quick and dirty usability scale. In: Usability Evaluation in Industry. 1996;189(194):4–10.
15. Rotenstein L, Melia C, Samal L, et al. Development of a primary care transitions clinic in an academic medical center. J Gen Intern Med 2022;37(3):582-9.
16. Roy S, Reyes F, Himmelrich S, et al. Learnings from a large-scale emergency department care management program in New York City.
NEJM Catalyst. 2018;4(1).
17. Wallace AS, Luther BL, Sisler SM, et al. Integrating social determinants of health screening and referral during routine emergency department care: evaluation of reach and implementation challenges. Implement Sci Commun. 2021;2(1):114.
18. Martel ML, Klein LR, Hager KA, et al. Emergency department experience with novel electronic medical record order for referral to food resources. West J Emerg Med. 2018;19(2):232.
19. Lindau ST, Makelarski JA, Abramsohn EM, et al. CommunityRx: a real-world controlled clinical trial of a scalable, low-intensity community resource referral intervention. Am J Public Health 2019;109(4):600-6.
20. Bacidore V, Letizia M, Mitchel AM. Implementing interprofessional alcohol screening, brief intervention, and referral to treatment in the emergency department: an evidence-based quality improvement initiative. Adv Emerg Nurs J. 2017;39(3):199-216.
21. Phonpruk K, Flowers K, Naughton G, et al. Analysis of written resources for parents of children discharged from a paediatric emergency department. J Child Health Care. 2019;23(4):652-62.
22. Aiken LS, West SG. Invalidity of true experiments: self-report pretest biases. Evaluation Review. 1990;14:374-90.
23. Davis DA, Mazmanian PE, Fordis M, et al. Accuracy of physician self-assessment compared with observed measures of competence: a systematic review. JAMA. 2006;296(9):1094-102.
24. Howard GS. Response shift-bias: a problem in evaluating programs with pre/post self-reports. Evaluation Review. 1980;4:93-106.
25. Hoogstraten J. The retrospective pre-test in an educational training context. J Exp Educ. 1982;50(4):200-4.
26. Cross N. (2011). Design Thinking: Understanding How Designers Think and Work. Berg Publishers; Oxford, England.
Volume 23, no. 5: September 2022 643 Western Journal of Emergency Medicine Grade et al. Digital Decision Tool for Social Resources upon ED Discharge
Original Research
Race and Other Disparate Demographic Variables Identified Among Emergency Department Boarders
Robert C. Ruffo, MD Erin F. Shufflebarger, MD James S. Booth, MD Lauren A. Walter, MD
Section Editor: Mandy Hill, DrPH, MPH
University of Alabama at Birmingham Heersink School of Medicine, Department of Emergency Medicine, Birmingham, Alabama
Submission history: Submitted December 15, 2021; Revision received May 10, 2022; Accepted May 27, 2022 Electronically published August 28, 2022
Full text available through open access at http://escholarship.org/uc/uciem_westjem DOI: 10.5811/westjem.2022.5.55703
Introduction: Emergency department (ED) boarding, the process of holding patients in the ED due to a lack of inpatient beds after the decision is made to admit, has profound consequences. Increased ED boarding times are associated with adverse patient outcomes, including increased mortality. While previous studies have demonstrated racial disparities with regard to ED boarding, current literature lacks insight into discrepancies that may exist among other demographic groups as it pertains to ED boarding. We sought to review ED boarding times differentiated by demographic characteristics.
Methods: We conducted a retrospective review of all ED admissions from an academic ED in the Southeast from April–September 2019. The primary outcome assessed was boarding time, defined as time from decision to admit to ED departure. Patient demographic data including race, gender, and age were collected and analyzed. We performed descriptive statistics and chi-square analyses.
Results: The study population included 17,606 patients with a mean age of 56.3. Nearly half (49.8%) of the patients were female. Additionally, 43.8% of patients were Black and 48.6% White. For all admissions, there was no difference in mean boarding time among Black and White patients (5.2 ± 8.8 vs 5.2 ± 8.2 hours, P = 0.11). Among Emergency Severity Index (ESI) level I admissions, Black patients boarded longer than White patients (4.1 ± 0.3 vs 2.7 ± 0.3 hours, P = 0.009). Black patients also boarded significantly longer than White patients for psychiatric admissions (22.7 ± 23.7 vs 18.5 ± 19.4 hours, P <0.05). For all admissions, males boarded longer than females (5.5 ± 8.5 vs 4.9 ± 8.2 hours, P <.0001). Patients older than 75 boarded for less time (3.8 ± 6.2 hours) compared to younger groups (15-24: 6.4 ± 10.8 hours; 25-44: 6.6 ± 10.8; 45-64: 5.0 ± 7.6; and 64-75: 4.7 ± 6.7; all P <.05).
Conclusion: This analysis demonstrated significant differences in ED boarding times between races among psychiatric and ESI I admissions, gender, and age. This data provides insight into differences in ED boarding times among demographic groups and provides a focal point for examining possible factors contributing to the observed differences. [West J Emerg Med. 2022;23(5)644–649.]
INTRODUCTION
Emergency department (ED) boarding, the process of holding patients in the ED due to a lack of inpatient beds after the decision is made to admit, is prevalent across hospitals throughout the United States (US). As of 2015, US inpatient
beds have decreased by nearly one-third compared to 1975 while ED visits have significantly increased.1-2 Moreover, ED boarding time has been shown to be an important indicator of patient-centered outcomes. There is evidence that as ED boarding times increase, mortality and hospital length of stay
Western Journal of Emergency Medicine 644 Volume 23, no. 5: September 2022
(LOS) also increase in a nearly linear fashion.3 The medical literature has suggested numerous factors that likely contribute to adverse outcomes among boarding ED patients including delays in medication delivery, completion of orders, and nursing staff shortages.4-6
In 2009, Pines et al found that Black patients had significantly longer ED boarding times compared to non-Black patients in a large multicenter study that included over 14,000 patients.7 This study is relatively unique in that it clearly identified a disparity among a large sample of ED boarding patients. While this evidence is important, it was published over a decade ago with little additional research contributing to the topic of racial disparities and ED boarding in the interim. Because Black Americans suffer disproportionately from health disparities, it is vital that additional research be conducted to reveal more insight into potential underlying disparities in ED boarding across racial groups.
Moreover, it has been shown that ED boarding and psychiatric visit times are longer when compared to nonpsychiatric ED encounters.8-9 According to 2016 data, nearly 10 million inpatient admissions across the US were associated with a psychiatric or substance use disorder and cost hospitals nearly $15.3 billion.10 Psychiatric patients are a vulnerable population due to tendencies of socioeconomic instability, high rates of concomitant substance misuse, and inconsistent access to healthcare resources. Because ED psychiatric visits are common, costly, and involve a susceptible population, it is crucial that disparities, if present, be identified to reduce potential adverse events and improve overall quality of care for this group.
Because there is a clear association with ED LOS and poor patient outcomes, it is important to identify factors associated with longer boarding times. While the medical literature does provide clear examples of disparities among Black and psychiatric patients, there is little recent literature regarding additional differences in ED boarding times across other demographic groups such as gender and age. We aimed to fill in these gaps in the literature and provide additional data on known disparities by identifying differences in ED boarding time across several demographic groups awaiting hospital inpatient beds in a large academic hospital in the Southeast.
METHODS
This study is a retrospective review and analysis of all admissions from the University of Alabama at Birmingham (UAB)’s two hospital EDs over a six-month period from April–September 2019. This study, including data collection and analysis, has been reviewed and approved by the UAB Institutional Review Board. UAB is an urban, academic, tertiary care center. UAB ED averages approximately 73,000 patient visits annually. An additional site, UAB-HighlandsHighlands, located nearby on UAB’s southern campus, is a Level 1 geriatric ED and averages approximately 32,000
Population Health Research Capsule
What do we already know about this issue?
Black patients board significantly longer than White patients when admitted to hospitals through the ED. Longer boarding times are linked to increased mortality.
What was the research question?
Do other disparities exist among ED boarders across various demographic groups?
What was the major finding of the study?
We found longer ED boarding times for Black critically ill patients and psychiatric admissions, compared to Whites, and for all men and non-elderly patients.
How does this improve population health?
Identifying disparities among ED boarders may provide insight into underlying factors, and inform future studies.
patient visits annually. Data analysis and statistical review began in December 2020.
All patients seen at UAB ED are given an Emergency Severity Index (ESI) score ranging from I (most urgent) to V (least urgent) and have demographic data including gender, age, and race recorded in an electronic health record (EHR). The ESI is a triage tool integrated into the EHR for stratifying patients based on acuity and projected resource needs.11 Given the size of the hospital site with 1,207 inpatient beds, a central patient flow and bed control system is used for inpatient bed assignment. Once the decision is made to admit, the clinician places a bed request order in the EHR, which alerts the patient flow staff that the patient needs an inpatient bed assignment. The ED has little control over the patient’s ultimate destination aside from determining the level of care required in conjunction with the accepting inpatient team. Medical patients are assigned beds based on availability which varies depending on level of care required (acute, intermediate or intensive), hospital capacity and staff availability.
Our institution does have specialty intensive care units (ICU) (eg, cardiac, neurological, medical and trauma, surgical), but depending on resource availability, ED patients can be placed in the ICU that is the best fit. The patient flow staff may use age when determining bed assignment, as some units and services have certain age criteria. Other demographic factors are not immediately accessible during this process and are not typically reviewed. A different process is in place for
Volume 23, no. 5: September 2022 645 Western Journal of Emergency Medicine Ruffo et al. Race and Other Disparate Demographic Variables Among ED Boarders
psychiatric admissions, as the center for psychiatric medicine handles the bed assignments internally.
The primary outcome assessed in this study was boarding time, which we defined as time from decision to admit to ED departure. Using data stored in UAB’s EHR, we examined boarding time among various demographic categories such as race, gender, and age among psychiatric and medical admissions during the specified period. Efforts to limit bias were made by using secure datasets stored in the EHR. The study size consisted of all admitted patients during the specified time period at UAB’s two hospital EDs. We conducted the analysis using descriptive statistics and bivariate analysis with independent t-test and ANOVA. The statistical analysis was performed using JMP Pro 16 (JMP Statistical Discovery LLC, Cary, NC).
RESULTS
During the study period, 17,606 patients were admitted; and we collected and analyzed demographic information and acuity level for mean boarding times as shown in Table 1 Missing demographic data ranged from 5.3% (gender, age) to 7.8% (race). Of the admitted patients, approximately half were male (50.2%) with a mean age of 56.3 ± 18.2 years. There were slightly more White patients (48.6%) than Black (43.8%). The vast majority (95.7%) of the patients admitted
Table
Variable n (%)
Gender
Boarding in hours (Mean ± SD)
Female 8,308 (49.8) →4.9 ± 8.2
Male 8,364 (50.2) →5.5 ± 8.5
Race
Black 7,116 (43.8) 5.2 ± 8.8
White 7,886 (48.6) 5.2 ± 8.2
Other 1,231 (7.6) 4.7 ± 6.6
Age (years)
15-24 691 (4.1) 6.4 ± 10.8 25-44 3,998 (24.0) 6.6 ± 10.8 45-64 6,279 (37.7) 5.0 ± 7.6 2,938 (17.6) 4.7 ± 6.7 2,764 (16.6) →3.8 ± 6.2
ESI Level
I 671 (3.8) 2.9 ± 3.6
II 9,150 (52.1) 5.6 ± 9.2
III 7,693 (43.8) 4.5 ± 7.0
IV 50 (0.3) 3.6 ± 4.2
V 4 (0.02) 0.7 ± 0.4
ESI,
had an ESI score of II or III. The overall data for each demographic group stratified by ESI level is shown in Table 2. When evaluating boarding time for all admissions by racial group, we found no significant difference in mean boarding time among White, Black, and other racial groups. Black patients boarded for a mean duration of 5.2 ± 8.8 hours, White patients for a mean of 5.2 hours ± 8.2 hours, and other racial groups boarded for a mean of 4.7 ± 6.6 hours (P = .111, F = 2.2.). However, the data also showed that among the sickest patients admitted to the hospital (ESI level I admissions), Black patients boarded significantly longer than White patients with a mean duration of 4.1 ± 0.3 hours compared to 2.7 ± 0.3 hours (P = 0.009).
While there was no significant difference in boarding time among racial groups for all admissions regardless of acuity, when examining admissions by particular type of admission, we found a significant difference in mean boarding time among Black and White psychiatric patients. Black patients (n = 401) awaiting psychiatric admission boarded for a mean duration of 22.7 ± 23.7 hours compared to White psychiatric patients (n = 526) who boarded for a mean duration of 18.5 hours ±19.4 (P = 0.0078). All other racial groups (n = 57) boarded for a mean duration of 17.8 ± 13.4 hours awaiting psychiatric admission as shown in Table 3.
Regarding male and female patients, there was a significant difference in mean boarding time. For all admissions, male patients boarded for a mean duration of 5.5 ± 8.5 hours while female patients boarded for a mean duration of 4.9 ± 8.2 hours [t = 4.32, dF = 16,665, P < .0001]. Additionally, among ESI level III patients, males boarded significantly longer than females for a mean duration of 4.9 ± 0.1 hours compared to 4.2 ± 0.1 hours (P < .0001). There were no additional differences between male and female patients based on acuity level or admission type.
Lastly, the data for ED boarding time for all admissions among age groups showed that patients in the ≥75 age group boarded for a significantly shorter duration than all other age groups with a mean duration of 3.8 ± 6.2 hours [ANOVA, F = 43.9, P < .001]. Additionally, patients ≤44 years had significantly longer boarding times than all other older age groups (P <.0001). There were no significant differences between age groups among psychiatric admissions. However, there were significant differences observed among age groups based on acuity level. For all ESI level II admissions, boarding times by age group were almost uniformly shorter as age increased. The ≥75 age group boarded for a mean of 4.1 ± 0.1 hours, which was significantly shorter compared to all other age groups (P <.0001). Additionally, boarding times were significantly shorter for the 65-74 age group (P <.0001) compared to the younger 25-44 and 15-24 age groups and boarding duration for the 45-64 age group was significantly shorter compared to respective younger age groups (P <.0001). For ESI level III admissions, boarding time for the ≥75 age group was significantly shorter compared
Western Journal of Emergency Medicine 646 Volume 23, no. 5: September 2022 Race and Other Disparate Demographic Variables Among ED Boarders Ruffo et al.
65-74
75+
1. Boarding times shown by demographic group and acuity level.
Emergency Severity Index.
Ruffo
Race and Other Disparate Demographic Variables Among
Table 2. Mean boarding times by Emergency Severity Index level.
Boarding time in hours, mean ± SD (n, %)
Variable ESI I (n = 671) ESI II (n = 9,150) ESI III (n = 7,693) ESI IV (n = 50) ESV V (n = 4)
Gender
Female 3.2 ± 0.3 (216, 43.1) 5.8 ± 0.2 (3910, 46.5) →4.2 ± 0.1 (4144, 54.0) 4.0 ± 5.2 (16, 32) 0.5 ± 0.3 (2, 50)
Male 3.5 ± 0.2 (285, 56.9) 6.1 ± 0.1 (4507, 53.5) →4.9 ± 0.1 (3529, 46.0) 3.4 ± 3.8 (34, 68) 0.9 ± 0.3 (2, 50)
Race
Black →4.1 ± 0.3 (217, 44.9) 6.0 ± 10.4 (3279, 40.0) 4.4 ± 0.1 (3574, 47.8) 3.0 ± 3.2 (24, 49.0) 0.7 ± 0.3 (3, 75.0)
White →2.7 ± 0.3 (224, 46.4) 5.9 ± 9.1 (4315, 52.7) 4.5 ± 0.1 (3319, 44.4) 4.8 ± 5.1 (18, 36.7) 0.7 ± 0.5 (1, 25.0)
Other 4.1 ± 0.6 (42, 8.7) 5.2 ± 7.2 (602, 7.3) 4.3 ± 0.3 (579, 7.7) 3.2 ± 5.0 (7, 14.3)
Age (years)
15-24 2.1 ± 0.8 (25, 5.0) 8.0 ± 0.5 (354, 4.2) 5.1 ± 0.4 (304, 4.0) 1.9 ± 2.0 (5, 10.0)
25-44 2.6 ± 0.4 (105, 21.0) 8.1 ± 0.2 (1988, 23.6) 5.1 ± 0.2 (1867, 2.4) 4.2 ± 5.3 (16, 32.0) 0.5 ± 0.1 (2, 50.0) 45-64 3.6 ± 0.3 (189,37.8) 5.6 ± 0.2 (3165, 37.6) 4.5 ± 0.1 (2898, 37.8) 3.5 ± 4.2 (22, 44.0) 1.2 ± 0.2 (1, 25.0) 65-74 4.0 ± 0.4 (105, 21.0) 4.9 ± 0.2 (1496, 17.8) 4.5 ± 0.2 (1331, 17.3) 5.0 ± 2.5 (5, 10.0) 0.5 ± 0.2 (1, 25.0) 75+ 3.4 ± 0.4 (76, 15.2) →4.1 ± 0.3 (1413, 16.8) →3.4 ± 0.2 (1273, 16.6) 0.9 ± 0.6 (2, 4.0)
*Horizontal dashed lines denotes that no data for this particular category. ESI, Emergency Severity Index.
Table 3. Mean boarding time by admission type.
Boarding time in hours, mean ± SD (n, %) Variable Medical admissions (n = 16,541) Psychiatric admissions (n = 1,065)
Gender
Female →3.9 ± 0.1 (7,807, 50.0) 20.3 ± 0.9 (501, 47.8)
Male →4.5 ± 0.1 (7,816, 50.0) 19.4 ± 0.9 (548, 52.2)
Race
Black 4.1 ± 0.1 (6,715, 44.0) →22.7 ± 23.7 (401, 40.8)
White 4.3 ± 0.1 (7,362, 48.3) →18.5 ± 19.4 (524, 53.4)
Other 4.1 ± 0.2 (1,174, 7.7) 17.8 ± 13.4 (57, 5.8)
Age (years)
15-24 3.8 ± 5.3 (539, 3.5) 15.8 ± 1.7 (152, 14.5) 25-44 4.3 ± 5.7 (3,431, 21.96) 20.3 ± 0.9 (567, 54.1)
45-64 4.4 ± 5.5 (6,016, 38.5) 20.3 ± 1.3 (263, 25.1)
65-74 4.4 ± 5.7 (2,891, 18.5) 22.3 ± 3.0 (47,4.5)
75+ →3.6 ± 4.6 (2,745, 17.6) 28.1 ± 4.8 (19, 1.8)
ESI Level
I 2.9 ± 3.6 (670, 4.1) 1.7 (1, 0.09)
II 4.3 ± 5.8 (8,382, 50.8) 20.1 ± 20.6 (768, 72.6)
III 3.9 ± 5.0 (7,413, 44.9) 19.5 ± 21.7 (280, 26.5)
IV 2.7 ± 3.2 (41, 0.3) 7.8 ± 5.6 (9, 0.9)
V 0.7 ± 0.4 (4, 0.02)
*Horizontal dashed lines denotes that no data for this particular category.
ESI, Emergency Severity Index.
to all younger age groups (P <.001) and the 45-64 age group boarded for significantly less time compared to the 25-44 age group (P <0.05). There were no significant differences among age groups for ESI level I, IV and V admissions.
DISCUSSION
In this review we identified several significant trends with regard to demographic characteristics and ED boarding times. While Pines et al found significant differences in ED boarding time among racial groups for medical admissions in a large, multicenter study, our findings did not show significant differences across racial groups for all admissions; however, we did find significant differences in ESI I and psychiatric admissions. Generally, patients with an ESI I have life-threatening conditions and require immediate interventions and ultimately ICU admission. Because of this, ESI I admissions should have similar boarding times due to a shared need for critical resources, including rapid transportation to an inpatient unit. While the cause of this discrepancy is unclear, it demonstrates an obvious disparity in this subgroup. Because these are the sickest patients in the hospital, identifying underlying factors for this discrepancy in the future may have a profound impact on patient outcomes.
Existing literature suggests that patients admitted to psychiatric services have longer ED boarding times compared to patients admitted to medical services.8-9 However, none of these studies specifically examined differences in ED boarding times among racial groups in the psychiatric populations. Because we found that Black psychiatric admits board significantly longer than their White counterparts, we believe this to be a relatively
Volume 23, no. 5: September 2022 647 Western Journal of Emergency Medicine
et al.
ED Boarders
novel finding that would be useful for future research. Psychiatric patients present with a variety of complaints ranging from mild depression to severe psychosis. Many patients with severe, acute mental illness (ie, psychosis and violent behavior) require more resources and higher security rooms for detention and monitoring than others. Because there may be limited high-security areas, psychiatric patients may experience longer boarding times than others. We did not examine differences in specific psychiatric diagnoses among racial groups; thus, it is possible that this may have contributed to the observed differences. Moreover, there is evidence that suggests that psychiatric boarding times may be related to individual insurance status.12 While it is possible that socioeconomic factors (insurance, access to transportation, etc.) play a large role in the overall care of psychiatric patients, it is unclear whether there are other underlying factors responsible for the observed differences that we found. Because of this, we believe that it is crucial for this vulnerable patient population to be studied further in the future.
Regarding gender, our findings showed that male patients had significantly longer ED LOS among general admissions and ESI III admissions. Generally, higher acuity patients are prioritized for available inpatient beds over less sick patients. The discrepancy for general admissions doesn’t appear to be related to acuity level as male patients had a higher overall total and relative proportion of higher acuity visits (ESI I and II) compared to females. Females were significantly older than males (57.4 ± 18.9 vs 55.2 ± 17.3 years, respectively). Because older patients typically board for less time compared to younger patients, it is possible that age affected the comparison between genders. However, there may be additional reasons for this discrepancy in our population that aren’t clear.
Additionally, our analysis of the age groups found that elderly patients boarded for significantly less time than the younger age groups. Our data revealed that the oldest patients boarded for the shortest mean duration for general admissions and among ESI II and III admissions. Interestingly, mean boarding time among the ESI II and III subgroups largely decreases as age increases. This finding suggests that the discrepancies in boarding time among age groups may be related to factors that are intrinsically more common among elderly age groups such as baseline health comorbidities, lower functional mobility, and age-related cognitive dysfunction. The literature is scant on the topic of ED boarding time as it relates to age; however, one previous study found that older and sicker patients experienced longer boarding times compared to younger age groups.13 Explanations for this discrepancy are lacking. Reasons for this are unclear; however, the extremes of age (ie, youngest and oldest patients) are often prioritized for inpatient beds.
The flow of patients through an ED to an inpatient unit requires multiple steps and complex coordination of communication, technology and, ultimately, physical interactions for patients to arrive at their final destination. These processes are admittedly complex and require
thorough analysis that is outside the scope of this study to fully understand how to improve efficiency from a patient flow standpoint. However, our findings show clear differences in ED LOS among various groups and suggest the possibility that inherent patient demographics may somehow be impacting overall boarding times, in addition to the multifaceted mechanisms responsible for patient flow.
LIMITATIONS
The main limitation to our study is that it was a singlecenter, retrospective analysis. This single-center design could limit generalizability to other institutions. Selection bias was minimized by using a dataset of all admissions over a sixmonth period before the coronavirus 2019 pandemic. However, there was a subset of this dataset with missing demographic information, which could have led to selection bias. Additionally, there was potential for bias with ESI level designation. While this system does have objective parameters considering patient acuity and resource needs, the final level is ultimately determined by a triage nurse whose decision could be affected by the patient’s gender, age, race, or chief complaint. Finally, we did not adjust for additional confounders including admission diagnosis, which could have led to bias in the study design.
CONCLUSION
We found significant differences in ED boarding times among racial groups for ESI I and psychiatric admissions, gender, and among various age groups. There is strong evidence demonstrating the detrimental impact of long ED boarding times on overall patient outcomes, highlighting the importance of uncovering additional factors that may be causing the observed differences. Because our findings have not been previously well described in the literature, this data is a useful addition that may serve as a focal point for examining underlying clinical and social factors that may be contributing to the observed differences.
Address for Correspondence: Robert C. Ruffo, MD, University of Alabama at Birmingham Heersink School of Medicine, Department of Emergency Medicine, 701 20th St S, 990-G Admin Building, Birmingham, AL 35233. Email: robertruffo@uabmc.edu.
Conflicts of Interest: By the WestJEM article submission agreement, all authors are required to disclose all affiliations, funding sources and financial or management relationships that could be perceived as potential sources of bias. No author has professional or financial relationships with any companies that are relevant to this study. There are no conflicts of interest or sources of funding to declare.
Copyright: © 2022 Ruffo et al. This is an open access article distributed in accordance with the terms of the Creative Commons Attribution (CC BY 4.0) License. See: http://creativecommons.org/ licenses/by/4.0/
Western Journal of Emergency Medicine 648 Volume 23, no. 5: September 2022 Race and Other Disparate Demographic Variables Among ED Boarders Ruffo et al.
Race and Other Disparate Demographic Variables Among ED Boarders
REFERENCES
1. AHA. American Hospital Association. Fast facts on U.S. hospitals, 2021. 2021. Available at: https://www.aha.org/statistics/fast-factsus-hospitals. Accessed December 5, 2021.
2. U.S. Department of Health and Human Services. Health, United States, 2012. 2013. Available at: https://www.cdc.gov/nchs/data/ hus/hus12.pdf. Accessed December 5, 2021.
3. Singer AJ, Viccellio AW, Thode HC, et al. Association between length of emergency department boarding, mortality and length of hospital stay. Ann Emerg Med. 2009;54(3):1325-7.
4. Sri-On J, Chang Y, Curley DP, et al. Boarding is associated with higher rates of medication delays and adverse events but fewer laboratory-related delays. Am J Emerg Med. 2014;32(9):1033-6.
5. Coil CJ, Flood JD, Belyeu BM, et al. The effect of emergency department boarding on order completion. Ann Emerg Med 2016;67(6):730-6.
6. Ramsey Z, Palter J, Hardwick J, et al. Decreased nursing staffing adversely affects emergency department throughput metrics. West J Emerg Med. 2018;19(3):496-500.
7. Pines JM, Russell Localio A, Hollander JE. Racial disparities in emergency department length of stay for admitted patients in the
United States. Acad Emerg Med. 2009;16(5):403-10.
8. Nicks BA, Manthey DM. The impact of psychiatric patient boarding in emergency departments. Emerg Med Int. 2012;2012:1-5.
9. Slade EP, Dixon LB, Semmel S. Trends in the duration of emergency department visits, 2001–2006. Psychiatr Serv 2010;61(9):878-84.
10. Owens PL, Fingar KR, McDermott KW, et. al. Inpatient stays involving mental and substance use disorders, 2016: Statistical brief #249. Healthcare Cost and Utilization Project (HCUP) Statistical Briefs. 2019. Available at: https://www.ncbi.nlm.nih.gov/ pubmed/31063293. Accessed November 9, 2021.
11. Emergency severity index (ESI): a triage tool for emergency department. AHRQ. Available at: https://www.ahrq.gov/patient-safety/ settings/emergency-dept/esi.html. Accessed November 15, 2021.
12. Pearlmutter MD, Dwyer KH, Burke LG, et al. Analysis of emergency department length of stay for mental health patients at ten Massachusetts emergency departments. Ann Emerg Med 2017;70(2):193-202.
13. Salehi L, Phalpher P, Valani R, et al. Emergency department boarding: a descriptive analysis and measurement of impact on outcomes. CJEM. 2018;20(6):929-37.
Volume 23, no. 5: September 2022 649 Western Journal of Emergency Medicine Ruffo et al.
A Structural Competency Framework for Emergency Medicine Research: Results from a Scoping Review and Consensus Conference
Amy Zeidan, MD*
Brian Salhi, MD, PhD*
Anika Backster, MD, MSCR*
Erica Shelton, MD, MPH†
Alycia Valente, MD‡
Basmah Safdar, MD§
Ambrose Wong, MD, MHS, MSEd§
Alessandra Della Porta, MD¶
Sangil Lee, MD, MS||
Todd Schneberk, MD, MS, MA#
Jason Wilson, MD, MA**
Bjorn Westgard, MD††
Margaret Samuels-Kalow, MD, Mphil, MSHP‡‡
Emory University School of Medicine, Department of Emergency Medicine, Atlanta, Georgia
Johns Hopkins University School of Medicine, Department of Emergency Medicine, Baltimore, Maryland University of Massachusetts, Department of Emergency Medicine, Worcester, Massachusetts Yale University, Department of Emergency Medicine, New Haven, Connecticut
University of Cincinnati, Department of Emergency Medicine, Cincinnati, Ohio
The University of Iowa Carver College of Medicine, Department of Emergency Medicine, Iowa City, Iowa Los Angeles + University of Southern California, Department of Emergency Medicine, Los Angeles, California Morsani College of Medicine, Division of Emergency Medicine, Department of Internal Medicine, Tampa, Florida
University of Minnesota Medical School, Department of Emergency Medicine, Minneapolis, Minnesota Massachusetts General Hospital, Department of Emergency Medicine, Boston, Massachusetts
Section Editor: Leon Sanchez, MD, MPH
Submission history: Submitted January 10, 2022; Revision received June 23, 2022; Accepted June 23, 2022
Electronically published September 12, 2022
Full text available through open access at http://escholarship.org/uc/uciem_westjem DOI: 10.5811/westjem.2022.6.56056
Introduction: The application of structural competency and structural vulnerability to emergency medicine (EM) research has not been previously described despite EM researchers routinely engaging structurally vulnerable populations. The purpose of this study was to conduct a scoping review and consensus-building process to develop a structurally competent research approach and operational framework relevant to EM research.
Methods: We conducted a scoping review focused on structural competency and structural vulnerability. Results of the review informed the development of a structural competency research framework that was presented throughout a multi-step consensus process culminating in the 2021 Society for Academic Emergency Medicine Consensus Conference. Feedback to the framework was incorporated throughout the conference.
Results: The scoping review produced 291 articles with 123 articles relevant to EM research. All 123 articles underwent full-text review and data extraction following a standardized data extraction form. Most of the articles acknowledged or described structures that lead to inequities with a variety of methodological approaches used to operationalize structural competency and/or structural vulnerability. The framework developed aligned with components of the research process, drawing upon methodologies from studies included in the scoping review.
Conclusion: The framework developed provides a starting point for EM researchers seeking to understand, acknowledge, and incorporate structural competency into EM research. By incorporating components of the framework, researchers may enhance their ability to address social, historical, political, and economic forces that lead to health inequities, reframing drivers of inequities away from individual factors and focusing on structural factors. [West J Emerg Med. 2022;23(5)650–659.]
Western Journal of Emergency Medicine 650 Volume 23, no. 5: September 2022 ReviewArticle
* † ‡ § ¶ || # ** †† ‡‡
INTRODUCTION
The emergency department (ED) has long been recognized as a “safety net” of the United States’ healthcare system, serving as a portal of entry for people and communities that would otherwise be unable to access care.1 Much of the difficulty in accessing care results from structural inequities and barriers faced by these populations (eg, lack of health insurance, paid leave, transportation) rather than personal choice or preference.2 The ED, therefore, serves as critical setting to examine and address structural barriers to care, “upstream” drivers of healthseeking behaviors, and contributors to health inequities.
Recent trends in “social emergency medicine” (EM) have made strides to reframe the healthcare encounter in structural—rather than individualistic—terms.3,4,5 We take social EM to refer to a general approach to understanding how historical, political, and economic conditions impact health, disease, and the practice of EM. Importantly, this approach is undertaken to promote conditions and practices that may lead to a more equitable and, therefore, healthier society. In other words, we conceive of social EM as relevant to all EM research topical areas (eg, cardiovascular care, trauma) rather than comprising a distinct or unrelated topical area.
Despite the clear relevance of this approach to EM research and practice, there is limited literature addressing how to incorporate such an approach in EM, especially within the research process. To address this gap in the literature, we drew on the theoretical framework of structural competency, which is defined as the trained ability for health professionals to recognize and respond to signs and symptoms of individual illness as the downstream effects of broad historical, social, political, and economic structures.3 Throughout this paper, we use “structure” to refer to the ways that society is hierarchically organized through institutions, political and economic policies, and normative beliefs—thus beyond the powers of an individual actor to overcome, change, or reform Structural competency was first conceived as a framework to inform medical education and has been used to develop educational curricula and clinical tools for learners at all stages in medical training.6,7,8
We argue that the structural competency framework may be extended from education to research in the ED setting, especially when coupled with a related term, “structural vulnerability.” Structural vulnerability refers to physical and emotional suffering among specific groups and individuals that results or is made worse from patterns of bias and advantage/disadvantage across organizations, institutions, governments, and social networks.9,10 This suffering is resultant from or exacerbated by class-based economic exploitation and cultural, gender/sexual, racialized, and other forms of discrimination, rather than individual actions or “choices.”8 While structural competency and structural vulnerability are related to social determinants of health, defined as conditions in one’s environment that impact their health and health outcomes, they are distinct in their focus on how political decisions, economic systems, and
historical context produce social determinants of health (eg, differential access to material goods and opportunities).11,3,8 Application of structural competency and structural vulnerability to EM research is paramount given our specialty’s growing calls to address and redress structural and health inequities.12 Creating a framework for structurally competent research within EM is a critical step in moving toward EM research that is inclusive and collaborative, and accounts for the historical and structural forces that impact healthcare delivery and health outcomes.
To apply concepts of structural competency and structural vulnerability to EM research, we conducted a scoping review of structural competency and structural vulnerability literature and engaged in a multi-step consensus process culminating in the 2021 Consensus Conference of the Society for Academic Emergency Medicine (SAEM). In this paper we report findings from the scoping review and consensus conference, providing a theoretical framework to incorporate structural competency concepts in the EM research process.
MATERIALS AND METHODS
Scoping Review
We conducted a scoping review of published work focused on structural competency and structural vulnerability following Arksey and O’Malley’s six-step framework for scoping reviews, with the exception of the optional consultation exercise.13 Our aims were to 1) provide a comprehensive overview of literature published on structural competency and structural vulnerability; 2) identify the ways in which structural competency and structural vulnerability have been operationalized in published research; 3) identify existing gaps in the literature that could inform future research in EM; and 4) identify methodological approaches salient to EM research.
We identified relevant studies using the key terms “structural vulnerability” and “structural competency” searching records published before November 2020 in MEDLINE, Scopus, and Web of Science. All publication types (eg, original research, reviews, perspectives) and methods (qualitative and quantitative) were considered. Articles were included in the initial screen if they were published in English, performed in the US or Canada, and addressed a topic broadly relevant to EM. The remaining articles were reviewed by two independent reviewers for title and abstract screening and inclusion to determine whether the articles were relevant to EM research or education. Any disagreement between the independent reviewers was resolved by BAS and AZ. Eligible articles were reviewed by two additional independent reviewers, who used Covidence14 to complete a standardized data extraction form developed a priori (Table 1). Extracted variables included literature characteristics and freetext variables related to study aims.
Consensus Building Process
The scoping review was undertaken alongside a multi-step consensus process culminating in the 2021 SAEM Consensus
Volume 23, no. 5: September 2022 651 Western Journal of Emergency Medicine Zeidan et al. A Structural Competency Framework for EM Research
Table 1. Scoping review data-extraction form.
Article characteristics
● Study title
● Journal name
● Year published
● Funded (yes/no, if yes, source)
● Publication/article type (Letter to the editor; Editorial/Commentary; Case study/case report; review, Original research; Other)
● Study type (Experimental study; RCT; Cohort study; Observational study; Survey; Focus group and/or interview study; Ethnographic study; Community-based research; Other)
● Academic discipline of journal (Undergraduate ME; Emergency Medicine; Psychiatry/Psychology/ Mental Health; Primary Care; Infectious Disease; Sociology; Anthropology; Nursing; Social Work; Public Health; Other or Multidisciplinary)
Research-related variables
● Research question/Purpose (free text)
● Topic/Category – choose all that apply (Community Health; COVID-19 pandemic; Food insecurity; Gender disparities; HIV/STI; Homelessness; Immigration; Incarceration/Policing; LGBTQ+; Mental Health; Migrant or Farm Labor; Race/Racial disparities; Sex work; Substance use, Violence; Other/Free text)
● Inclusion Criteria (free text, not explicitly described)
● Exclusion Criteria (free text, not explicitly described)
● Study population: sex, gender, race/ethnicity, language, subpopulation (free text)
● Inclusion of community partners on research team or with research protocol? (yes/no)
○If yes, describe in free text
● Inclusion of study population on research team or with research protocol? (yes/no)
○ If yes, describe in free text
● Recruitment process/methods
○ Direct recruitment of participants through community organization/partner; Direct recruitment in a healthcare setting; Direct recruitment of participants known to study team; Solicitation of participation through advertisements/ media notices/community flyers.
○ Other: Free text
○ Not applicable
● Consent process
○ written/verbal/waived/community consent/mixed ○ other/free text/interpretation present/translation used for consent
● Incentive ○ yes/no
○ If yes, type of incentive: direct cash payment; gift card or voucher; gift/good exchange; other: free text.
● Intervention ○ yes/no/not applicable
○ If yes, describe via free text
● Outcome Measures: (free text or not applicable)
Structural competency related variables
● Was structural competency defined? ○ yes/no/other
○ If yes, describe how structural competency was defined (free text)
● How was structural competency operationalized?
○ Acknowledgment/description of structures/systems that lead to inequities? (Single issue SDHrelated component vs broader structural competency)
● Other observations/notes
RCT, randomized control trial; ME, medical education; COVID-19, coronavirus disease 2019; HIV, human immunodeficiency virus; STI, sexually transmitted infection; LGBTQ+, lesbian, gay, bisexual, transgender, queer/questioning+; SDH, social determinants of health.
Conference, which aimed to create a focused research agenda for social EM and population health.15 Briefly, the consensusbuilding process began in the year prior to the SAEM meeting and included working groups that met regularly to discuss findings from the scoping review, develop a structural competency framework for EM research, and to shape content for two conference breakout sessions. During the breakout sessions, the working group leaders (BAS and AZ) presented an assessment of the current literature and a draft of the research framework to operationalize the concepts of
structural competency and structural vulnerability. Attendees included SAEM members and non-SAEM stakeholders, all of whom provided feedback during breakout sessions and participated in anonymous surveys following each session.
Development of the Research Framework
Results from the scoping review and feedback from the consensus-building process were used to develop an operational framework for applying structural competency to EM research. The following objectives were considered
Western Journal of Emergency Medicine 652 Volume 23, no. 5: September 2022 A Structural Competency Framework for EM Research Zeidan et al.
when developing the framework: 1) acknowledgment of structural forces, structural vulnerabilities, and systemic causes of health inequities and how these impact patients, their health-seeking behaviors, ability to pursue treatment plans, and health outcomes; 2) consideration of how systemic causes of health inequities impact an individual’s involvement in research, specifically recognizing the long and ongoing legacy of injustice and exploitation in medical research; and 3) operationalization of structural competency throughout the research process including study purpose, study design, data collection, data analysis, and dissemination. We recognize that there is significant variability in research questions, methods, and analysis and have, therefore, designed the framework to be incorporated in part, or in whole, as deemed appropriate by researchers.
RESULTS
Scoping Review Results
The literature review produced 291 articles of which 123 articles were determined relevant to EM research and 51 relevant to EM education after title and abstract review. All articles underwent full text review and data extraction following the standardized data extraction form (see Table 2). (Results from the education review are presented elsewhere).16
Table 2. Scoping review article characteristics.
Academic discipline
n
Sociology or Anthropology 36
Public health 33
Multidisciplinary 20
Psychiatry, psychology, or mental health 7
Infectious disease
Policy
Substance use
Public policy 2
Palliative care 2
Social work 2
Drug policy 2
Primary care and Public health 1
Nursing 1
Population health 1
Primary care 1
Publication type
Case study/Case report 3
Editorial/Commentary 13
Original Research 104
Letter to Editor 1
Other 2
Table 2. Continued. N/A, not applicable.
n
Study design
Interview study 35
Ethnographic study 26
Mixed design 17
Not applicable (e.g., opinion piece, letter to editor) 14
Survey study 9
Observational study 5
Community-based research 3
Evidence review 3
Systematic review 3
Cohort study 3
Focus group 2
Experimental study 1
Non-randomized experimental study 1
Inclusion of community partners
Yes 47 No 51 N/A 25
Inclusion of study population Yes 18 No 85 N/A 20
Recruitment process
Not applicable 29
Direct recruitment through community partners 28
Direct recruitment of participants known to study team 23
Direct recruitment through healthcare setting 13 Mixed 11
Targeted population 9 Canvassing 8
Direct referral 2
Was structural competency defined?
Yes 49 No 47 N/A 27
How was structural competency operationalized?
Acknowledgment/description of the structures or systems that lead to inequities 104
N/A or not operationalized 10
Reference to single-issue social determinant of health (e.g., homelessness) 5
Other 5
Most articles were published in public health, sociology and anthropology, or multidisciplinary journals, and the majority
Volume 23, no. 5: September 2022 653 Western Journal of Emergency Medicine Zeidan et al. A Structural Competency Framework for EM Research
6
5
4
of articles represented original research (predominantly ethnographic and interview study designs). Only three studies were conducted directly in the ED or focused on ED populations17,18,19; none of the studies were published in EM journals. For studies that were original research, 48% (n = 47) included community partners,20,21,22 and 17% of studies (n = 18) included the study population (see Appendix for examples). 23,24,25,26 Nearly half of the articles explicitly defined structural competency (40%) or structural vulnerability (15%), and most articles acknowledged or described structures or systems that lead to inequities (85%).
Articles included in this review were not characterized by a specific population or single topical area of interest. For example, populations examined migrant workers, sex workers, people who use27 drugs, people living with human immunodeficiency virus/sexually transmitted infections, people experiencing homelessness, incarcerated people, LGBTQI communities, racialized populations, and communities disproportionally affected by COVID-19. Analytical and explanatory models within these articles, therefore, shifted responsibility away from the individual and toward the system in which a person or community is living (ie, structural competency). Papers described and analyzed how health and social outcomes of communities were resultant from their place in social, political, cultural, and economic hierarchies determined by complex power structures that often reinforce subordinated status (ie, structural vulnerability). Researchers also drew upon a related concept, “structural violence,” which refers to the ways in which structures of power render some people “unable to achieve their capacities or capabilities to their full potential, and almost certainly if they are unable to do so to the same extent as others.”27
Consensus Conference Feedback
Feedback from the first breakout session highlighted the difficulty of defining the “community,” specifically who is a part of the community or study population, who may be appropriate to represent the study population, and how to define the role of community advisors/partners. Much of the discussion focused on community-based participatory research (CBPR) and incorporating or distinguishing this methodology within the structural competency framework. Overall, participants determined that CBPR may not be applicable to all EM research, whereas the structural competency framework is meant to be used in all types of EM research. Participants also emphasized the need to center the needs of the study population when developing the research question, which might be accomplished by engaging the study population prior to the start of the study.
During the second consensus conference session, participants discussed how to operationalize the needs of the community within the research framework, specifically recommending that community needs be identified prior to the start of the study, as well as incorporating existing efforts
within that community. Respondents also suggested that, given histories of structural vulnerability, research teams should focus on strengths rather than focusing only on deficiencies among study populations. Finally, participants discussed that a framework that foregrounds structural competency must also consider the asymmetries and inequities that are manifest in regulatory structures, including institutional review boards (IRB), as well as funding institutions and pipelines.
A Structurally Competent Research Approach and Operational Framework
Results of the scoping review informed the development of a structurally competent research approach and framework. The framework was specifically created in alignment with components of the research process including the following: 1) defining the research question; 2) study design; 3) data collection; 4) data analysis/interpretation; and 5) dissemination. Feedback from the Consensus Conference was incorporated to modify and refine the framework. We detail specific examples in the following section and provide a visual depiction in Table 3. Using specific examples from the articles reviewed, the following section describes a structurally competent research framework. This framework empowers EM researchers to understand, acknowledge, and take into account structural forces and barriers impacting ED patients, and to act ethically in carrying out research and intervening at system and community levels to maximize patient health outcomes.
Defining the Research Question and/or Study Purpose
Developing a well-considered research question and/or study purpose is the cornerstone of valid, impactful research. It is, therefore, critical that EM researchers examine their research question for implicit assumptions that may influence the methods and analysis. We advocate that the literature reviewed for the study background draw on existing work from related disciplines, including history, sociology, and anthropology (among others) and to reconsider the research question in light of this evidence. Ideally. and if applicable, the research question should incorporate or acknowledge the impact of structural forces on the proposed study population(s). Whenever possible, the study population may be engaged in the initial stages to assist in developing a research question and potential outcomes that address their priorities and recognize their strengths and vulnerabilities to ensure that the research question aligns with their interests.28
For example, Kolla and Strike21 provide a salient example of this approach in their examination of the structural vulnerabilities of harm-reduction workers and people who use drugs in an overdose education and naloxone distribution (OEND) program. While noting that OEND programs have made major strides toward preventing overdose deaths, they extend their research question beyond relative risk reduction of naloxone provision and note the ongoing structural
Western Journal of Emergency Medicine 654 Volume 23, no. 5: September 2022 A Structural Competency Framework for EM Research Zeidan et al.
Table 3. Structural competency framework recommendations.
Research phase Description Checklist of recommended actions
Phase 1: Defining the Research Question Study team examines research question for implicit assumptions and incorporates structural forces and structural vulnerabilities of the study population
▪ Does the literature review incorporate structural vulnerabilities of study population(s)?
▪ Does the research question acknowledge the impact of structural forces (historical, social, political, and economic structures) and how this has led to health inequities of study populations?
▪ Has the study team engaged with study populations/ communities when defining the research question?
▪ Does the research team include members from the study populations/representative community members who provide input regarding the study question?
▪ Does the background work incorporate strengths of study populations and key works from researchers/community organizations representing the study populations?
Key sample references
Holmes SM. “Is it worth risking your life?”: Ethnography, risk, and death on the U.S.-Mexico border. Social Science and Medicine. 2013;99:153–6
Kolla G, Strike C. ‘It’s too much, I’m getting really tired of it’: Overdose response and structural vulnerabilities among harm reduction workers in community settings. International Journal of Drug Policy. 2019;74:127–35
Phase 2: Study Design Study team incorporates structurally sensitive elements into study design and uses ideal processes to involve study populations
▪ How have the study populations historically interacted with the health system? Does the design account for how the study populations may been negatively impacted by medical research?
▪ Does the study team have a prior relationship with the study populations/ representative community members or community organizations? If not, consider revisiting Phase 1 to develop meaningful partnerships and implore community-based participatory research (CBPR).
▪ If appropriate for the study design, employ CBPR and recruit those familiar with this methodology.
▪ Inclusion/Exclusion Criteria: Does the criteria unintentionally exclude specific populations (eg, language requirement, insurance status, etc)?
▪ Recruitment Process: Where are subjects recruited, who is recruiting subjects, will subjects feel comfortable with the recruitment location and study team member recruiting?
▪ Consent process: Is consent equally available to all study populations? Who is providing consent, and will study populations feel comfortable with the consent process? Will written consent be a barrier for participation?
▪ Incentive: Is the form of incentive accessible to all study populations and free of bias?
Wilmsen C. Working in the Shadows: Safety and Health in Forestry Services in Southern Oregon. J Forest 2015;113(3):315–24.
Cheney AM, Newkirk C, Rodriguez K, Montez A. Inequality, and health among foreign-born Latinos in rural borderland communities. Social Science and Medicine. 2018:115–22.
Phase 3: Data Collection/ Storage Study team recognizes ideal methods for data collection and storage that recognize and mitigate structural forces
Phase 4: Data Analysis/ Interpretation Study team members analyzing data consider context, feedback, and implications of results
▪ Who will be collecting the data? Will study populations feel comfortable with the individuals collecting the data?
▪ How is data being collected (written vs electronic), in what language, and is this the ideal method for data collection?
▪ How will data be stored, and will appropriate individuals have access to data? Will data be stored at a community site, hospital site, etc?
▪ Is data analyzed within the context of structural vulnerabilities of the study population?
▪ Are appropriate members of the study team involved in analysis/interpretation, specifically those with lived experience representing the study populations?
▪ Who will be providing feedback regarding data analysis, and how will feedback be incorporated?
▪ How may results impact the study populations negatively or positively?
▪ How will this data be used? What are the implications of the results?
Organista KC, Arreola SG, Neilands TB. La desesperación in Latino migrant day laborers and its role in alcohol and substance-related sexual risk. SSM - Population Health. 2016;2:32–42.
Mayer S, Fowler A, Brohman I, et al. Motivations to initiate injectable hydromorphone and diacetylmorphine treatment: a qualitative study of patient experiences in Vancouver, Canada. International Journal of Drug Policy. 2020;85:102930
EM, emergency medicine.
Volume 23, no. 5: September 2022 655 Western Journal of Emergency Medicine Zeidan et al. A Structural Competency Framework for EM Research
Table 3. Continued.
Research phase Description
Phase 5: Dissemination/ Policy Change Study team employs unique strategies for dissemination and incorporates opportunities for policy change
Checklist of recommended actions Key sample references
▪ Consider dissemination of results beyond EM audience targeting multidisciplinary sources and avenues other than academic publications.
▪ When possible, opt for open access for publications.
▪ Determine mechanism to disseminate findings to study populations.
▪ Consider how results will be translated to policy change. EM, emergency medicine.
limitations and unintended side effects of these programs. For example, the authors cite examples of criminalization and stigma applied to those who use drugs, thereby exacerbating barriers to seeking help (eg, police accompanying ambulances for overdose response, which exacerbates fears and limits access to healthcare services). In this example, the authors contextualize the research question within the historical and political examples relevant to their specific study populations. While this study was not conducted in an ED setting people who use drugs frequently receive care in the ED—often as a direct result of stigma and criminalization associated with drug use. Taking these histories and vulnerabilities into account is, therefore, critical to asking insightful and impactful EM research questions.
Study Design
In developing the research design, it is important to consider the study population’s relationships with the healthcare system, historical research practices, and/or the researchers’ institutions writ large. Taking the time to consider these factors provides important insights for the study design, including best practices for recruitment, consent, incentive, and implementation of an intervention (depending on the study design). If applicable, the study team could consider developing relationships with the target population to better understand their experiences and/or partnering with study participants or representatives of the study community (community advisory board, community partners, stakeholders, proxies, etc.) to develop the design. While the term “community” may have a variety of interpretations and definitions, we encourage the study team to consider groups or organizations that are representative and inclusive of the study population, incorporating suggestions from individuals with lived experiences relevant to the study population whenever possible. Relatedly, it is important to remember that single individuals acting as community representatives may not successfully represent all perspectives of the community. We stress that relationships with community partners and other stakeholders be longitudinal to the degree that it is possible and/or appropriate. Partnerships that are forged solely for the sake of research purposes may be perceived as extractive or exploitative, therefore perpetuating harms and distrust.
For example, Cheney et al29 used a formalized community-based participatory research (CBPR) approach
to develop sustainable partnerships with local farmworkers and farmworker organizations in studying how poverty and inequality affect the health of foreign-born Latinos. Prior to the start of the study, the study team engaged community leaders, advocacy groups, farmworkers, healthcare clinicians, and political officials to understand the community needs and research capacity, and to explore potentially salient research topics. This allowed for the study team to define a research question relevant to the community (eg, alcohol use among farmworkers), and engage them throughout the research process—including the development of the research question, study design, recruitment, data analysis and interpretation, and dissemination of findings.
Notably, CBPR is a methodological approach that considers historical, economic, and political contexts and engages community members as partners in the research process to develop trust and community capacity to engage in research.30,31 Community-based participatory research is a well-established and valuable research methodology but may not be possible to carry out in all research contexts. Like CBPR, we prioritize consideration of historical, economic, and political contexts and engagement of community members whenever possible. However, we also argue that attention to structural forces and processes is paramount even when community engagement is not feasible or applicable.
For example, Willging et al32 incorporate frameworks of structural competency and vulnerability in their interviewbased study of transgender and gender non-conforming (TGGNC) ED patients. The authors describe how TGGNC patients are often denied social services, which in turn exacerbates structural vulnerabilities (ie, access to medical and social services, unemployment, housing instability, violence/ trauma) and places them at risk of adverse health outcomes. Participants in the study described unstable employment and economic challenges as a barrier to insurance and, thus, access to care beyond the ED. They also described an increased risk of violence and physical injury related to stigma and discrimination, which is often addressed and treated in the ED. The authors effectively incorporate a structural competency framework (using a non-CBPR methodology) to highlight the structural issues that adversely impact the health and wellbeing of TGGNC ED patients. Moreover, the authors extend their findings to help address contributors to
Western Journal of Emergency Medicine 656 Volume 23, no. 5: September 2022 A Structural Competency Framework for EM Research Zeidan et al.
delayed care and to suggest structurally competent services for TGGNC patients.
We stress that frameworks of structural competency and vulnerability are not limited to qualitative studies or the social sciences, despite their predominance in this review. For example, for studies that rely on large datasets, EM researchers can still be cognizant of the ways that data is collected (eg, questions asked, language of questionnaires, etc.) and whether the study methodology may overlook or perpetuate inequities in care.
Data Collection and Storage
In addition to following IRB guidelines, extra consideration may be helpful to ensure participants feel valued and respected during the data collection process and to mitigate any power differentials that may discourage participation or quality data collection. Researchers should, for example, ask: Who is collecting the data? What is the setting of recruitment or engagement and how may this affect data collection? How is data being collected (eg, written vs electronic)? What is the most appropriate language of data collection (eg, should the study team include a bilingual member)? Who will have access to the data during the study and at the completion of the study?
For example, Organista et al26 studied the relationship between psychological distress and alcohol and substancerelated sexual risk in Latino migrant day laborers. Recognizing the stigma associated with their study topic and the power differential between the research team and the study population, Organista et al included an “expert informant,” a day laborer from the study population, and partnered directly with the San Francisco Day Labor Program, a local community organization, to engage participants. To ensure ethical engagement and quality data collection, recruitment occurred at the community partner site, interviews were conducted in the participant’s language, and some interviews were completed directly by the expert informant.
It is important to pay particular attention to challenges with anonymity and data protection when conducting qualitative research, where individuals’ stories, experiences, and voices are the central focus of data collection. Researchers should be attuned that vulnerability may be especially heightened among ED patients and should explore options to mitigate these vulnerabilities.
Data Analysis and Interpretation
In analyzing the data and applying results to future practices and policies, it may be helpful to consider in advance how the data will be used, who will be reviewing the data and providing feedback (ie, the study population or community representatives), how results could impact the study population and whether results are interpreted with respect to existing structural forces and structural vulnerabilities of the study population. Similarly, it may be helpful to discuss what
outcomes are important to the study population/stakeholders, particularly if these outcomes differ from those of the research team. It may also be important to consider demographic factors and how they are interpreted or rather misinterpreted as “risk factors” rather than structural vulnerabilities. Indeed, when racial and ethnic health inequities are found, we urge that researchers, reviewers, editors, and readers ask why and how these come to be.33 Frameworks of structural competency and vulnerability are especially useful in highlighting how health inequities are produced without resorting to fallacies of biological difference.
In the study by Mayer et al25 of patients’ motivations to initiate injectable hydromorphone and diacetylmorphine treatment, preliminary findings were reviewed by a community advisory board that consisted of representatives from the target population. Results were also contextualized within the target population’s structural vulnerabilities, including poverty, food insecurity, housing insecurity, criminalization, and how these vulnerabilities influenced their experiences when initiating treatment for opioid use disorder. The authors demonstrate that understanding the social context and existing structural vulnerabilities of the study population are imperative when considering successful treatment initiation.
Dissemination
Dissemination is critical to maximizing the impact of research and shaping future research questions. Researchers in EM should consider disseminating results beyond an EM audience to include multidisciplinary and open-access options. Because research findings are often not readily accessible to participants or the broader public (eg, due to costs and/ or technical language), researchers should consider alternate mechanisms for disseminating findings back to the target population and broader public (eg, local news, podcasts, healthcare institutions, varying levels of government) to model transparency and engender trust in research.
DISCUSSION
Results of the scoping review and development of the framework described here provide an opportunity for EM researchers to incorporate concepts of structural competency and structural vulnerability in EM research. As the ED continues to serve as a safety net for structurally vulnerable populations, we are uniquely positioned to address conditions of suffering and contributors to poor health. By incorporating frameworks of structural competency and vulnerability, we may be better equipped to recognize and address the health inequities and the complexities of ED care.
Relatedly, Metzl et al34 describe a structurally competent research agenda specific to firearm and mental health research, specifically focused on how to study mass shootings and multiple-victim gun homicides. The authors consider contextual factors of gun policies and laws (eg, inaccurate narratives that people with mental illness are more dangerous,
Volume 23, no. 5: September 2022 657 Western Journal of Emergency Medicine Zeidan et al. A Structural Competency Framework for EM Research
resulting in legislation requiring mental health professionals to report patients who pose a “risk”), the racialization of gun violence, community over policing, and the meaning and value that different individuals ascribe to guns. In considering these myriad contributors to gun violence in the US, the authors provide a research framework that incorporates structural interventions, antiracist gun research, messaging from trusted sources, and politically neutral policies that focus on violence prevention. The authors advocate that this approach will ensure research targets effective and equitable interventions and policies for all people and communities. Metzl and colleagues provide an example of how to apply structural components to a topic-specific research agenda, in this case firearm injury and mental health, that could be applied to other EM-relevant research topics.
The proposed framework allows EM researchers to build on the aforementioned examples to directly apply structural competency and vulnerability to research principles and processes, for example, by redefining the study question through acknowledgment of existing and historical structures and systems, collaborating with the study population and community partners that serve the study population, and analyzing data using a structural vulnerability lens.
LIMITATIONS
Our review included only studies that used frameworks of structural competency and structural vulnerability. Our search terms may have excluded published papers that add to our understanding of the ways that historical, political, and economic structures influence health, illness, clinical care delivery, and their related research. However, our database search results underwent multiple reviews and discussions, and we are confident that the data presented are representative of the current state of structural competency and structural vulnerability and their applicability to EM research. Second, we excluded studies published outside the US or Canada. While we recognize that historical, political, and economic structures are salient to EM research across the world, we sought to summarize data and propose a framework adaptable to EM research in the US and Canada, and we believe that our selection criteria have accomplished this. Finally, the transferability of findings to EM research may be limited by the small number of articles conducted in an EM setting. Nevertheless, a large body of evidence strongly suggests that EM research is fertile ground for a unifying structural competency framework.12
CONCLUSION
Since its inception, EM has interfaced with a broad spectrum of patients, especially those with structural vulnerabilities. A growing body of EM research has focused on upstream drivers of ED patients’ presentations and health outcomes. Our scoping review and structurally competent research framework outline considerations and tangible
strategies for engaging structurally vulnerable populations and making strides to eliminate health inequities.
ACKNOWLEDGMENTS
The authors would like to thank those who attended the SAEM Consensus Conference sessions and/or provided feedback following the sessions, and to the stakeholders who provided their time and expertise throughout the process: Drs. Malika Fair (AAMC) and Isabel Chen (Beyond Flexner Alliance).
Address for Correspondence: Amy Zeidan, MD, Emory University School of Medicine, Department of Emergency Medicine, 49 Jesse Hill Jr Dr. SE, Atlanta, GA 30303. Email: ajzeida@emory.edu.
Conflicts of Interest: By the WestJEM article submission agreement, all authors are required to disclose all affiliations, funding sources and financial or management relationships that could be perceived as potential sources of bias. No author has professional or financial relationships with any companies that are relevant to this study. There are no conflicts of interest or sources of funding to declare.
Copyright: © 2022 Zeidan et al. This is an open access article distributed in accordance with the terms of the Creative Commons Attribution (CC BY 4.0) License. See: http://creativecommons.org/ licenses/by/4.0/
REFERENCES
1. Hoffman B. (2006). Emergency rooms: the reluctant safety net. History and Health Policy in the United States (250-72). New Brunswick: Rutgers University Press.
2. Burt CW, Arispe IE. Characteristics of emergency departments serving high volumes of safety-net patients: United States, 2000. Vital Health Stat 13. 2004;(155):1-16.
3. Metzl JM, Hansen H. Structural competency: theorizing a new medical engagement withstigma and inequality. Soc. Sci 2014;103:126–33.
4. Alter H, Dalawari P, Doran KM, et al. Social Emergency Medicine Springer; 2021.
5. Anderson E, Bernstein E, Xuan Z, et al. Inventing social emergency medicine: summary of common and critical research themes using a modified Haddon matrix. Ann Emerg Med. 2019;74(5):S74–7.
6. Hansen H, Metzl JM. New medicine for the U.S. health care system: training physicians for structural interventions. Acad Med 2017;92(3):279–81.
7. Salhi BA, Tsai JW, Druck J, et al. Toward structural competency in emergency medical education. AEM Edu Train. 2020;4(S1):S88–97.
8. Bourgois P, Holmes SM, Sue K, et al. Structural vulnerability: operationalizing the concept to address health disparities in clinical care. Acad Med. 2017;92(3):299–307.
9. Quesada J, Hart LK, Bourgois P. Structural vulnerability and health: Latino migrant laborers in the United States. Med Anthropol. 2011;30(4):339–62.
Western Journal of Emergency Medicine 658 Volume 23, no. 5: September 2022 A Structural Competency Framework for EM Research Zeidan et al.
10. Valdez ES, Valdez LA, Sabo S. Structural vulnerability among migrating women and children fleeing Central America and Mexico: the public health impact of “humanitarian parole.” Public Health Front 2015;3(163):1–8.
11. Samuels-Kalow ME, Ciccolo GE, Lin MP, et al. The terminology of social emergency medicine: measuring social determinants of health, social risk, and social need. JACEP Open. 2020;1(5):852–6.
12. Annals of Emergency Medicine. Special Article Collection on Equity in Health Care. 2021. Available at: https://www. sciencedirect.com/journal/annals-of-emergency-medicine/specialissue/10SC1W0XMW6. Accessed March 1, 2021
13. Arksey H, O’Malley L. Scoping studies: towards a methodological framework. Int J Soc Res. 2005;8(1):19–32.
14. Covidence. Better systematic review management. 2014. Available at: www.covidence.org. Accessed January 15, 2021.
15. Schoenfeld EM, Lin MP, Samuels-Kalow ME. Executive summary of the 2021 SAEM Consensus Conference: From bedside to policy: advancing social emergency medicine and population health through research, collaboration, and education. Acad Emerg Med 2022;29(3):354-63.
16. Salhi BA, Zeidan A, Stehman CR, et al. Structural competency in emergency medical education: a scoping review and operational framework. AEM Educ Train. 2022;6(Suppl 1):S13-S22.
17. Buchbinder M. Keeping out and getting in: reframing emergency department gatekeeping as structural competence. Sociol Health Illn 2017;39(7):1166–79.
18. Willging C, Gunderson L, et al. Structural competency in emergency medicine services for transgender and gender non-conforming patients. Soc Sci. 2019;222:67–75.
19. Hudgins A, Rising KL. Fear, vulnerability and sacrifice: drivers of emergency department use and implications for policy. Soc Sci 2016;169:50–7.
20. Wilmsen C. Working in the shadows: safety and health in forestry services in Southern Oregon. J Forest. 2015;113(3):315–24.
21. Kolla G, Strike C. ‘It’s too much, I’m getting really tired of it’: Overdose response and structural vulnerabilities among harm reduction workers in community settings. Int J Drug Policy 2019;74:127–35.
22. Wallace B, Barber K, Pauly B. Sheltering risks: Implementation of
harm reduction in homeless shelters during an overdose emergency. Int J Drug Policy. 2018;53:83–9.
23. Silberzahn BE, Morris MB, Riegger KE, et al. Barriers and facilitators to retaining a cohort of street-based cisgender female sex workers recruited in Baltimore, Maryland, USA: results from the SAPPHIRE study. BMC Public Health. 2020;20(1):1–12.
24. Glick JL, Lim S, Lim S, et al. Structural vulnerabilities and HIV risk among sexual minority female sex workers (SM-FSW) by identity and behavior in Baltimore, MD. Harm Reduct J. 2020;17(1):1–9.
25. Mayer S, Fowler A, Brohman I, et al. Motivations to initiate injectable hydromorphone and diacetylmorphine treatment: a qualitative study of patient experiences in Vancouver, Canada. Int J Drug Policy 2020;85:102930.
26. Organista KC, Arreola SG, Neilands TB. La desesperación in Latino migrant day laborers and its role in alcohol and substance-related sexual risk. SSM - Popul Health. 2016;2:32–42.
27. Gupta A. (2012). Red Tape: Bureaucracy, Structural Violence and Poverty in India. North Carolina: Duke University Press.
28. Joosten YA, Israel TL, Williams NA, et al. Community engagement studios: a structured approach to obtaining meaningful input from stakeholders to inform research. Acad Med. 2015;90(12):1646–50.
29. Cheney AM, Newkirk C, Rodriguez K, et al. Inequality and health among foreign-born Latinos in rural borderland communities. Soc Sci. 2018;215:115–22.
30. Holkup PA, Tripp-Reimer T, Salois EM, et al. Community-based participatory research: an approach to intervention research with a Native American community. ANS Adv Nurs Sci. 2004;27(3):162–75.
31. Wallerstein NB, Duran B. Using community-based participatory research to address health disparities. Health Promot Pract 2006;7(3):312–23.
32. Willging C, Gunderson L, Shattuck D, et al. Structural competency in emergency medicine services for transgender and gender nonconforming patients. Soc Sci. 2019;222:67–75.
33. Boyd RW, Lindo EG, Week LD, et al. On racism: a new standard for publishing on racial health inequities. 2020. Available at: https://www. healthaffairs.org/do/10.1377/hblog20200630.939347/full/. Accessed March 1, 2021.
34. Metzl JM, McKay T, Piemonte JL. Structural competency and the future of firearm research. Soc Sci Med. 2021;277:113879.
Volume 23, no. 5: September 2022 659 Western Journal of Emergency Medicine Zeidan et al. A Structural Competency Framework for EM Research
WOMen profEssioNal developmenT oUtcome Metrics in Academic Emergency Medicine: Results from the WOMENTUM Modified Delphi Study
Jennifer S. Love, MD*
Amy J. Zeidan, MD
Utsha G. Khatri, MD, MSHP*
Margaret E. Samuels-Kalow, MD, MPhil, MSHP
Angela M. Mills, MD
Cindy H. Hsu, MD, PhD
Icahn School of Medicine at Mount Sinai, Department of Emergency Medicine, New York, New York Emory University School of Medicine, Department of Emergency Medicine, Atlanta, Georgia
Icahn School of Medicine at Mount Sinai, Department of Population Health Science and Policy, New York, New York
Harvard Medical School, Massachusetts General Hospital, Department of Emergency Medicine, Boston, Massachusetts Columbia University College of Physicians and Surgeons, Department of Emergency Medicine, New York, New York University of Michigan Medical School, Department of Emergency Medicine, Ann Arbor, Michigan
Section Editor: Rama Salhi, MD, MHS
Submission history: Submitted March 2, 2022; Revision received July 17, 2022; Accepted June 30, 2022
Electronically published September 12, 2022
Full text available through open access at http://escholarship.org/uc/uciem_westjem DOI: 10.5811/westjem.2022.6.56608.
Introduction: To address persistent gender inequities in academic medicine, women professional development groups (PDG) have been developed to support the advancement of women in medicine. While these programs have shown promising outcomes, long-term evaluative metrics do not currently exist. The objective of this study was to establish metrics to assess women’s PDGs.
Methods: This was a modified Delphi study that included an expert panel of current and past emergency department (ED) chairs and Academy for Women in Academic Emergency Medicine (AWAEM) presidents. The panel completed three iterative surveys to develop and rank metrics to assess women PDGs. Metrics established by the expert panel were also distributed for memberchecking to women EM faculty.
Results: The expert panel ranked 11 metrics with high to moderate consensus ranking with three metrics receiving greater than 90% consensus: gender equity strategy and plan; recruitment; and compensation. Members ranked 12 metrics with high consensus with three metrics receiving greater than 90% consensus: gender equity strategy and plan; compensation; and gender equity in promotion rates among faculty. Participants emphasized that departments should be responsible for leading gender equity efforts with PDGs providing a supportive role.
Conclusion: In this study, we identified metrics that can be used to assess academic EDs’ gender equity initiatives and the advisory efforts of a departmental women’s PDG. These metrics can be tailored to individual departmental/institutional needs, as well as to a PDG’s mission. Importantly, PDGs can use metrics to develop and assess programming, acknowledging that many metrics are the responsibility of the department rather than the PDG. [West J Emerg Med. 2022;23(5)660–671.]
Western Journal of Emergency Medicine 660 Volume 23, no. 5: September 2022 Original Research
†
‡
§
¶
||
* † ‡ § ¶ ||
INTRODUCTION
Gender disparities in academic medicine continue to exist in several areas including advancement, promotion, compensation, grant funding, and authorship.1–6 In response, dedicated programmatic interventions including mentorship programs, career development initiatives, and women’s professional development groups (PDG) have been created to target inequities and support the advancement of women in medicine. PDGs and similar gender equity programs have been associated with positive outcomes related to retention, advancement, and promotion of women in academic medicine.7–10
As institutional women’s PDGs grow in number, establishing a robust outcome assessment can help measure impact, support improvements, and ensure sustainability. While PDGs report positive outcomes and participant satisfaction, these studies have highlighted the need for longterm evaluative metrics.7,11 Various metrics have been used to describe PDG successes. For example, following PDG and workshop implementation, one institution reported an increased number of women faculty at all departmental rank levels.12 Other programs have described higher participant retention and career satisfaction, and development of genderspecific policies.11,13,14 Notably, participation in a national emergency medicine (EM) women’s PDG was associated with increased scholarly collaborations and mentorship/sponsorship that promoted participant visibility through speaking, leadership, and awards.15 While programs should be lauded for their various success, standard metrics for uniform PDG evaluation will allow cross-program comparison and strategic development of new programs.
In this study we developed measurable outcome metrics for departmental women’s PDGs using expert consensus from a panel of emergency department (ED) chairs and gender equity leaders in EM. Our goal in this study was to establish metrics to guide departmental PDG development and evaluation strategies.
METHODS
Study Design
We used modified Delphi methodology to establish metrics for women’s departmental PDG assessment. This methodology is widely accepted and commonly used to establish consensus from individuals with expertise specific to the desired topic.16–19 The Delphi technique uses sequential questionnaires to obtain opinions and agreement from participants on a topic where well-established consensus does not exist. 20,21
Study Participants
Expert panel participants met one of the following criteria: 1) current ED chair; 2) past ED chair; 3) current president of the Society for Academic Emergency Medicine’s (SAEM) Academy for Women in Academic Emergency Medicine
Population Health Research Capsule
What do we already know about this issue?
Women’s professional development groups (PDG) support the advancement of women in medicine, but no long-term evaluative metrics for PDGs exist.
What was the research question?
Based on consensus from emergency department (ED) chairs and gender equity leaders, what are the optimal evaluative metrics for women’s PDGs in emergency medicine?
What was the major finding of the study?
High-consensus women’s PDG metrics include workplace gender equity, compensation, recruitment, retention, and leadership.
How does this improve population health?
While many gender equity metrics are departmental responsibilities, women’s PDGs can use these metrics to guide programmatic development.
(AWAEM); 4) past AWAEM president. We selected current/ past ED chairs for their role in overseeing departmental activities including funding dissemination, diversity and equity initiatives, and career advancement. Current/past AWAEM presidents were selected for their expertise in recruitment, advancement, and leadership of women in EM. We recruited current/past ED chairs from the Association of Academic Chairs of Emergency Medicine (AACEM), while current/past AWAEM presidents were identified from the AWAEM website and contacted via email. We recruited current/past department chairs and current/past AWAEM presidents independently from their academic institutions. A single institution could have multiple participants.
Member-checking participants were recruited using the AWAEM and FemInEM (www.feminem.org) email listservs. Member-checking is a technique used to enhance the validity of metrics identified by experts.22 These listservs were selected because 1) their memberships include a large, diverse population of EM women faculty in the United States, and 2) their members include individuals who would likely participate in women’s PDGs.
Delphi Procedure (Figure 1)
This study included four phases during which experts completed three questionnaires. In phase 1, participants completed an open-ended questionnaire to gather all relevant
Volume 23, no. 5: September 2022 661 Western Journal of Emergency Medicine Love et al. Results from the WOMENTUM Study
opinions. In phase 2, participants ranked summarized opinions from phase 1. In phase 3, participants ranked metrics with moderate and high consensus. In the final phase, we employed member-checking. Members reviewed and ranked phase 2 metrics. Member-checking supported the credibility of findings, acknowledging that members would most benefit from PDGs and would provide critical feedback on specific metrics. This study was reviewed and approved by the institutional review board at Oregon Health & Science University.
Phase 1: Qualitative Assessment
Expert participants completed an open-ended online questionnaire (“What metrics are important to assess for the effectiveness of a women’s PDG? Please name, describe, and give your reasoning for at least three metrics”), which solicited metrics to evaluate women PDGs Participants were asked to list metrics to evaluate women’s PDGs, a metric description, and a rationale for why metric inclusion was important. Responses were manually reviewed and qualitatively analyzed by three authors (JL, AZ, UK) using an iterative approach until consensus on thematic categorizations was achieved.23 We then categorized common metrics thematically.
Phase 2: All Metrics Ranking Survey
We developed a ranking survey (survey 2) using phase 1 responses, which we sent to all initial expert participants. The survey included each metric and assessment methods for the individual metric. Sub-metrics were included for some metrics. Participants ranked metrics by level of importance using a five-point priority scale. They were provided the following prompt: “Your department’s women’s professional development group (PDG) requests funding and support for the upcoming academic year. What metrics should the PDG measure to determine the success of the program? Please categorize the metrics listed below as lowest (1) to highest (5) priority in evaluating the PDG to decide whether or not you
contribute funding support.” The study question was framed around PDG funding support because departmental support for specialized interests (ie, research, operations, education) is frequently provided as financial or time support.
We analyzed responses using high, moderate, and low consensus. Consensus was defined as the degree to which participants agreed on metrics. Consensus was considered to be high if there was >80% agreement in two contiguous categories (priority score 4 or 5) and moderate consensus was considered 70-80% agreement in two contiguous categories.24 Low consensus was considered <70% agreement in two contiguous categories.
Phase 3: Ranking Survey
The phase 3 survey (survey 3) was developed using phase 2 metrics and sub-metrics receiving moderate (70- 80%) or high consensus (>80%) in two contiguous priority score categories (score 4 or 5). Experts were provided with the metric name, level of consensus, and mean metric priority score from phase 2. The following prompt was used: “Your department’s women’s professional development group (PDG) requests funding and support for the upcoming academic year. What metrics should the PDG measure to determine the success of the program? Please categorize the metrics listed below as lowest (1) to highest (5) priority in evaluating the PDG to decide whether or not you contribute funding support. The final metrics list (top 10) will be determined by mean rank scores of the metrics below.” Participants ranked metrics by level of importance using a five-point priority scale.
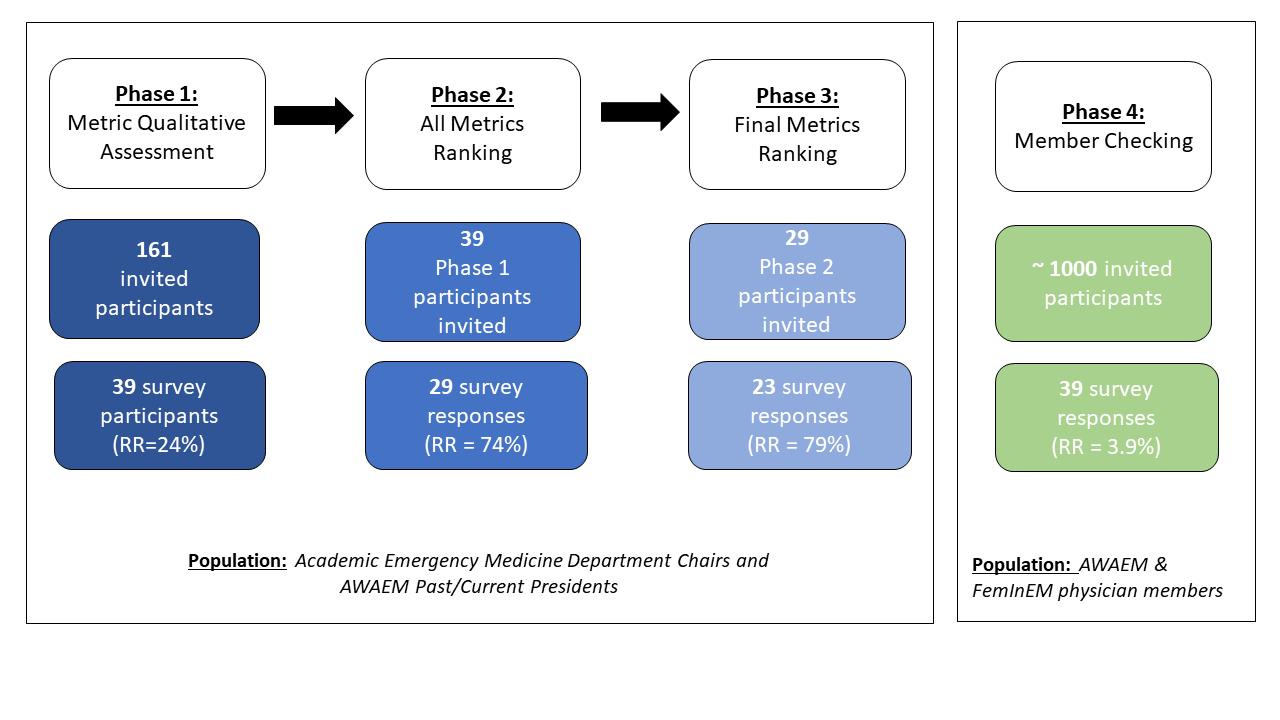
Phase 4: Member-checking
Survey 3 was also distributed to women EM faculty and trainees across the US. The primary member prompt stated: “Consider the following scenario: You are leading your departmental women’s professional development group (PDG) and would like to request funding and support for the upcoming academic year. As the PDG leader, what metrics do
Figure 1. WOMENTUM study phases and participants. AWAEM, Academy for Women in Academic Emergency Medicine; RR, response rate.
Western Journal of Emergency Medicine 662 Volume 23, no. 5: September 2022 Results from the WOMENTUM Study Love et al.
you think are important to evaluate to determine the success of the program? Please categorize the metrics listed below as lowest (1) to highest (5) priority in evaluating the PDG to support your request for funding support.” The study question was again framed around PDG funding support because departmental specialized interest support is often requested and provided as financial or time compensation. The survey was distributed via the AWAEM and FemInEM listservs with two email reminders over four weeks.
We ranked phases 3 and 4 results by mean metric score. Metrics with a mean priority score of 4.0 or greater were sorted by consensus ranking for each group. Sub-metrics were included under the metric category assigned at phase 2. Final metric lists were compared between groups for similarities and grouped according to theme. The final metric list was used to develop a sample departmental metrics assessment tool.
RESULTS
Phase 1: Metric Qualitative Assessment
Of 161 experts, 39 (24%) completed the initial survey. Table 1a includes the expert panel demographics. Of respondents, 77% self-identified as ED chairs and 10% selfidentified as AWAEM past or current presidents. Remaining participants (13%) self-identified their academic role as a vice chair, vice president, hospital practice chair, or vice dean. Average participant age was 57 years (SD 12.7 years); 46% of responders were female and 85% were White. Most experts (79.5%) had practiced EM for more than 15 years. The majority (87%) of participants worked at an institution with a women’s EM PDG.
Common metrics recommended by participants included the following: promotion; leadership; scholarship (described as speakership/lectures, published work, grant funding, and education-focused scholarly activity); recognition/reputation (awards, visibility); service (committee service, advocacy efforts, mentorship/ sponsorship); wellness; workplace gender equity (gender equity among faculty, presence of gender equity strategy and plan, departmental programming targeting gender equity, compensation, recruitment, retention); and PDG-specific metrics (engagement in PDG activities over time). Within each category, specific recommendations were included with a detailed assessment incorporated from responses. (See Table 2 for metrics/submetrics and appendix for illustrative quotes.)
Phase 2: All Metrics Ranking
Of the 39 invited participants, 29 (74%) from phase 1 ranked 55 metrics. Table 3 lists all metrics ranked in this phase, and those with high consensus level are highlighted. We included all metrics with high or moderate consensus level in phase 3 and phase 4 surveys.
When asked to describe modifications to the metric descriptions, one participant wrote: … “the metrics for success for a woman who wants to make
Table 1. Study participant demographic characteristics.
1a: Expert panelist (Chairs and AWAEM Presidents demographics
Current position characteristics
Number of past/current department chairs, n (%) 30 (76.9%)
Number of AWAEM past/current presidents, n (%) 4 (10.3%)
Number of other, n (%) 5 (12.8%)
Gender, n (%)
Female 18 (46%)
Race, n (%)
White 33 (84.6%)
Hispanic/Latino 4 (10.3%)
Black/African American 1 (2.6%)
Native American/American Indian 2 (5.1%)
Asian 4 (10.3%)
Native Hawaiian/Pacific Islander 0 (0%)
Other 1 (2.6%)
Years Practicing Emergency Medicine, n (%)
6-10 years 3 (7.7%)
11-15 years 5 (12.8%)
16-20 years 11 (28.2%)
More than 20 years 20 (51.3%)
Institutional features
Number of participants at an institution with a women’s emergency medicine PDG 34 (87.1%)
1b: Member demographics Gender, n (%)
Female 39 (100%)
Race, n (%)
White 29 (74.3%)
Hispanic/Latino 0 (0%)
Black/African American 1 (2.6%)
Native American/American Indian 0 (0%)
Asian 9 (23.1%)
Native Hawaiian/Pacific Islander 0 (0%)
Prefer not to answer 1 (2.6%)
Years Practicing Emergency Medicine, n (%)
< 1 year 2 (5.1%)
1-5 years 4 (10.2%)
6-10 years 9 (23.1%)
11-15 years 6 (15.4%)
16-20 years 9 (23.1%)
More than 20 years 8 (20.5%)
AWAEM, Academy for Women in Academic Emergency Medicine.
her career in operations or education or maybe a “master clinician” is different from a woman who wants to be a researcher in XX. And they all have somewhat different goals...
Volume 23, no. 5: September 2022 663 Western Journal of Emergency Medicine Love et al. Results from the WOMENTUM Study
Table 2. Phase 1 responses – primary metrics and sub-metrics for ranking survey.
Promotion
Primary metrics Ranked sub-metrics
Time to promotion
Number of women applying for promotion annually
Number of women promoted annually
Gender equity in promotion rates among faculty Leadership*
Number of women with departmental, institutional, regional, national leadership roles*
Proportion of total faculty who are women applying for leadership positions
Gender equity in leadership positions within the department* Speakership Departmental speakership
Institutional speakership
National speakership*
International speakership
Published work
Author/editor of book chapter
Peer-reviewed publications*
Lead author on peer-reviewed publication
Journal impact factor
Non-peer reviewed written work
Grant funding Number of grants applied for
Number of grants awarded
Type of grant received
Role on grant received
Gender equity in grant funding – includes proportion of women PIs on funded grants in the department
Education focused scholarly activity: includes development or redesign of curricula
Awards/recognition
Total number of awards received Number of departmental awards
Number of institutional awards Number of national awards Number of international awards
Reputation/visibility*: includes reputation/visibility of faculty members at institutional and national levels
Committee service Departmental committee service
Institutional committee service
National committee service International committee service
Non-committee role/title
Advocacy efforts: includes engagement in activities that address and/or promote a particular cause or policy
Mentorship/sponsorship: includes number of mentees, regardless of gender
Wellness: includes burnout and satisfaction among women faculty using validated wellness tools Starred (*) metric indicate high level of consensus on survey 1. PI, principal investigator.
Western Journal of Emergency Medicine 664 Volume 23, no. 5: September 2022 Results from the WOMENTUM Study Love et al.
Table 2. Continued.
Primary ranked metric Ranked submetrics
Gender-specific professional needs: includes policy development/presence of existing policies that recognize the unique needs of women, childcare/sick care options, engagement of non-full-time faculty
Gender equity among faculty*: includes a quantitative measure of women in various categories including mid-career and senior faculty in appropriate rank, gender equity among faculty with protected time, gender equity among departmental leadership
Gender equity strategy and plan*: includes a gender equity strategy and plan, routine assessment with workplace climate survey
Departmental programming targeting gender equity*: includes number of leadership, training, advancement, and mentorship programs that are specific to women faculty
Compensation*: salary equity among faculty
Recruitment: includes the number of women faculty and residents recruited
Retention: includes the number of women working after short/long terms, number of women maintaining FTE status
PDG recruitment and retention: includes the number of participants that continue to engage in activities over time
Number of women faculty recruited to the department
Number of women residents recruited to the residency program
Number of women working after 1 or 2 years and long term
Number of women maintaining FTE status
Starred (*) metric indicate high level of consensus on survey 1. FTE, full-time equivalent; PDG, professional development group.
and different metrics. The real success – and challenge – of a PDG is to support and provide skill-building/leadership training/ networking/community building around the different career pathways for all women. But wellness, climate, satisfaction, and equity should be the goal regardless of career path.”
Another participant commented:
“Some of these metrics are controlled at the department level and may be easier to impact with the work of a PDG, whereas others are at the institutional level and it is more difficult to make change there.”
When asked about rationale for priority ranking, one participant commented: “I think these things support the need for a women’s group but I’m not sure that many of these things are, or should be, the responsibility of the women’s PDG. I’d say the chair/vice chairs should stop getting funding if these things don’t improve!”
Additional phase 2 comments are listed in the appendix.
Phase 3: Final Metrics Ranking
Twenty-three of 29 invited participants (79% response rate) ranked 23 metrics for the final list; 52% of participants were
female and average age was 46 years old. Table 3 shows the 11 key final metrics. Nine metrics had a high consensus ranking (greater than 80%) and a score greater than 4.0 on a priority scale. Two metrics had moderate consensus but were included due to their high-moderate consensus ranking (78%) and high average score (greater than 4.0). The three metrics with greater than 90% consensus included 1) gender equity strategy and plan (96%); 2) recruitment (96%); and 3) compensation (91%).
When asked about rationale for priority ranking, one participant commented: “Promotion and attainment of publication and grant successes are the gold standards of academic success. EM women have a flat promotion rate (REI [Rank Equity Index]-Hobgood et al, AEM) and have been for many years despite adequate numbers of women matriculating as faculty. Recruitment of women residents is declining – we must shore up this number to ensure adequate numbers of women matriculating into the discipline and subsequently becoming faculty. Our goal should be 50.5%, which is the current percentage of women medical students. In addition, the retention of women in the faculty is critically important. When women students and residents observe their
Volume 23, no. 5: September 2022 665 Western Journal of Emergency Medicine Love et al. Results from the WOMENTUM Study
Table 3. Top metrics by consensus ranking and metric scoreChair/AWAEM presidents.
Rank Metric description
Consensus Ranking Mean Metric Score
1 Gender equity strategy and plan 0.96 4.48
2 Recruitment 0.96 4.43
Number of women faculty recruited to the department 0.96 4.09
Number of women residents recruited to the residency program 0.83 4.09
3 Compensation 0.91 4.7
4 Departmental programming targeting gender equity 0.87 4.13
5 Gender equity among faculty 0.83 4.17
6 Number of women with leadership roles 0.83 4.13
7 Peer-reviewed publications 0.83 4.04
Lead author on peerreviewed publications 0.78 4.35
8 Reputation/visibility 0.83 4
9 Retention 0.83 4
10 Gender equity in leadership positions within the department 0.78 4.17
11 Gender-specific professional needs 0.78 4.09
member demographics. A total of 39 female emergency physicians completed the survey (estimated response rate 3.9%). All participants identified as female, average participant age was 42 years old, and 74% were White.
Table 4 shows the member priority metric list containing 12 key metrics. All metrics had a high consensus ranking (greater than 80%) and a score greater than 4.0. The three metrics with greater than 90% consensus included 1) compensation (92%); 2) gender equity in promotion rates among faculty (92%); and 3) gender equity strategy and plan (92%).
When asked about rationale for priority ranking, one member commented:
“Promotion is important but takes time. AND is not a goal of every faculty member. Markers of goals accomplished makes the program personalized to the needs of the women. VERY important that gender equity is analyzed and reported by department leadership in terms of salary, bonuses, directorship/leadership positions, protected time, access to mentors/sponsors, awards, and recognition. Authorship on manuscripts – tracking gender distribution in the department – this networking often reveals major inequities in opportunities.”
As in phase 3, member participants commented on the need to distinguish between metrics that are departmental
Table 4. Top metrics by consensus rating and metric scoremembers.
Rank Metric description Consensus Ranking Mean Metric Score
1 Compensation 0.92 4.71
2 Gender equity in promotion rates among faculty 0.92 4.61
women faculty leave the discipline, they question the career choice. We can attain no long-term leadership success for women without an adequate cohort and full professor status.”
Another participant noted:
“I think it is important to recognize that many of these factors are not for women themselves to fix. Putting the expectation that a women’s group will increase the leadership metric when there are so many factors biased against women could be an unrealistic expectation of a group like this. However, the group could put pressure on the department to develop things like an equity group. I think it’s very important to make a distinction here, lest this data be used to derail and argue against investing in such a group because it’s not effective.”
Additional phase 3 comments are summarized in the appendix.
Phase 4: Member-checking
The final ranking survey from Phase 3 (23 metrics) was distributed to approximately 1000 members. Table 1b includes
3 Gender equity strategy and plan 0.92 4.41 Gender equity among faculty 0.89 4.51 0.89 4.46 faculty retention 0.87 4.35 0.89 4.41 of women with 0.84 0.89 4.23 0.87 0.87 Gender equity in leadership positions within the 0.82 4.35 Reputation/visibility 0.82 4.17 PDG recruitment and retention 0.82 4
PDG, professional development group.
AWAEM, Academy for Women in Academic Emergency Medicine.
Western Journal of Emergency Medicine 666 Volume 23, no. 5: September 2022 Results from the WOMENTUM Study Love et al.
4
5 Retention
Female
6 Leadership
Number
leadership positions
4.23 7 Promotion
8 Recruitment
4.38 9 Gender-specific professional needs
4.28 10
department
11
12
responsibilities and those that are a PDG’s responsibility. A common theme included the need to incorporate institutional variation in metrics as each institution may ascribe different specific values to promotional criteria depending on its strengths/weaknesses. Participants highlighted the need for a comprehensive review of “successful metrics,” recommending non-traditional metrics that are equally as valuable including advocacy, community engagement, and the social impact of one’s work. Participants emphasized importance of flexible time and timelines, evaluating protected time of women vs men, discouraging use of traditional promotion timelines, and incorporating flexible scheduling support that does not impact compensation. Additional phase 4 comments are summarized in the appendix.
Final Metric Determination
The following metrics achieved high consensus by experts and members: workplace gender equity; compensation; recruitment; retention; and leadership. Metrics were collated into four thematic categories: gender equity; sustainability; financial; and acclaim (Table 5) to highlight key strategic planning and intervention areas. Figure 2 displays a sample metrics assessment tool for PDGs using final categorizations and metrics.
DISCUSSION
Our study is the first initiative to develop and rank assessment metrics for women’s PDGs in EM by expert consensus. We found that top metrics recommended by experts
Table 5. High consensus departmental PDG metrics as evaluated by emergency medicine departmental chairs and women emergency physicians.
Gender equity Sustainability Financial Acclaim Gender equity strategy and plan Recruitment Compensation Number of women with leadership roles
Gender equity among faculty Retention Reputation/ Visibility Gender equity in promotion rates among faculty Genderspecific professional needs Peer-reviewed publications
Gender equity in leadership positions win the department
Departmental programming targeting gender equity
PDG, professional development group.
for departmental women’s PDGs included workplace gender equity, compensation, recruitment, retention, and leadership. Compared to experts, physician members ranked similar metric categories as most important but ranked gender equityrelated metrics with higher mean scores and recruitment metrics with lower mean scores. Discussion around metric ranking centered on differentiating PDG vs departmental gender-equity responsibilities and emphasized two key themes: 1) gender equity efforts mandate departmental leadership and support; and 2) PDGs should aid leadership in addressing gender-equity gaps. Our final consensus metrics might be best targeted toward a departmental gender equity strategic plan advised by a women’s PDG.
Departmental Gender Equity: Who Is Responsible - the PDG or Department Leadership?
A critical theme that emerged was tension between departmental versus PDG priority areas. In phase 1, many experts provided “traditional” promotion-related metrics for initial ranking, such as research grants, publications, and leadership positions. This initial metric list focused on department chair priorities and, in some ways, may lack reasonable scope for a non-funded initiative like a PDG. In later phases, the importance of delineating between evaluating a PDG versus a department on gender-related metrics became more apparent through comments and metric consensus. Participants highlighted the need for some metrics to be distinguished as departmental and institutional priorities, and the responsibility of a chair/ vice chair. Respondents remarked that metrics outside the purview of a PDG could be supported or advised by a PDG. This is best captured by the comment that the presence of these metrics supports the need for PDG-based programming to help women improve in promotional areas, but that the department should be evaluated in these metrics, not the PDG.
The theme of the PDG as a leadership group to support and create programming to target departmental genderequity goals is ultimately reflected in the expert metric list. Both groups highlighted a desire for targeted programming by their high rank and consensus for the “gender equity strategy and plan” metric. Gender-equity strategy and plan was the expert panel’s top ranked metric. Additional metrics, such as recruitment of female faculty and residents and departmental programming for gender equity, were also highly ranked by experts. This ranking reflects an expectation by department chairs that a PDG will focus on efforts to support equity but will not be measured on the achievement of equity.
Future work should seek to explore the expectations of departmental leadership and PDG leadership in devising a departmental gender-equity plan. While some metrics described here (ie, compensation or recruitment) might seem beyond the scope of a PDG, other metrics, such as a gender-equity strategy
Volume 23, no. 5: September 2022 667 Western Journal of Emergency Medicine Love et al. Results from the WOMENTUM Study
Metric Description Departmental priority rank Implementation stage
Gender equity
Gender equity strategy and plan
Departmental programming targeting gender equity
Includes a gender equity strategy and plan, routine assessment with workplace climate survey
Includes number of leadership, training, advancement, and mentorship programs that are specific to women faculty
Gender equity among faculty Includes a quantitative measure of women in various categories including mid-career and senior faculty in appropriate rank, gender equity among faculty with protected time, gender equity among departmental leadership
Gender equity in leadership Gender equity in leadership positions win the department, number of women with departmental, institutional, regional, national leadership roles
☐ Planning ☐ Drafting ☐ Reviewing ☐ Enacted 1. 2.
☐ Planning ☐ Drafting ☐ Reviewing ☐ Enacted 1. 2.
Annual relevant programming
☐ Planning ☐ Drafting ☐ Reviewing ☐ Enacted 1. 2.
☐ Planning ☐ Drafting ☐ Reviewing ☐ Enacted 1. 2.
Financial Compensation Salary equity among faculty ☐ Planning ☐ Drafting ☐ Reviewing ☐ Enacted 1. 2.
Sustainability
Recruitment Includes the number of women faculty and residents recruited, proportion of total faculty who are women applying for leadership positions ☐ Planning ☐ Drafting ☐ Reviewing ☐ Enacted 1. 2.
Retention Includes the number of women working after short/long terms, number of women maintaining FTE status
☐ Planning ☐ Drafting ☐ Reviewing ☐ Enacted 1. 2.
Gender-specific professional needs Includes policy development/presence of existing policies that recognize the unique needs of women, childcare/sick care options, engagement of non-full-time faculty ☐ Planning ☐ Drafting ☐ Reviewing ☐ Enacted 1. 2.
*Assessment criteria can be determined by each PDG. PDG, professional development group; FTE, full-time equivalent.
Figure 2. Metrics Assessment* Tool for Women’s Professional Development Groups.
Western Journal of Emergency Medicine 668 Volume 23, no. 5: September 2022 Results from the WOMENTUM Study Love et al.
Figure 2. Continued.
Metric Description Departmental priority rank Implementation stage
PDG recruitment and retention Includes the number of participants that continue to engage in activities over time Planning Drafting Reviewing Enacted
Acclaim
Peer-reviewed publications
1. 2.
Annual relevant programming
Lead author on peerreviewed publications Planning ☐ Drafting Reviewing Enacted 1. 2.
Includes reputation/ visibility of faculty members at an institutional/national level Planning Drafting Reviewing Enacted 1. 2. Promotion Includes time to promotion, number of women applying for promotion annually, number of women promoted annually, gender equity in promotion rates among faculty Planning Drafting Reviewing Enacted 1. 2.
Reputation/visibility
PDG, professional development group; FTE, full-time equivalent.
or gender-equity programming, would both meet a PDG’s scope and would benefit from a PDG’s expert guidance.
Expert Panel and Member Metric Rank List Comparisons: What Matters Most?
Top ranked metric categories for both survey groups included workplace gender equity, compensation, recruitment, retention, and leadership. Metrics prioritized in our study have been described in publications on the critical role of national PDGs in academic career development.15,25 A qualitative study by Lin et al on a national EM PDG for women noted that the PDG was instrumental in helping women address the barriers (gender equity, work-life balance) and achieve metrics (awards, speakership) highlighted by our results.15 Similarly, a study by Pierce et al evaluating academic productivity metrics of SAEM’s Academy for Diversity and Inclusion in Emergency Medicine showed increased publications, speakership, and mentoring opportunities for leaders.25 National PDGs anticipate and fulfill niches for underrepresented groups in academic EM with programming and sponsorship needed for success.26 Priorities and goals of a PDG are consistent: building equity strategies and targeted programming are necessary to bolster women’s academic careers.
Notably, both studies reported mentorship as a successful component of a PDG. In our study, mentorship was identified in phase 1 but received moderate agreement ranking in phase 2. This finding was surprising, as previous studies indicate that mentoring programs for women are beneficial for career
development.27 This difference in our rank position compared to previous literature may reflect the inherent nature of mentorship that exists within PDGs, and within other highly ranked metrics (eg, leadership, recruitment, retention). Alternatively, the rank position may reflect the challenge of measuring mentorship and the limited ability to measure changes in mentorship that a PDG may impact.
The high ranking of “equitable compensation” as a top PDG evaluative criterion for all participants is also interesting. “Compensation” had greater than 90% consensus and a mean score greater than 4.0. This ranking reflects the continued pervasive awareness of unequal financial compensation for women by members and leaders and the need to uphold fair pay.2 Compensation often falls under the purview of the department chair or institutional governance. However, all participants thought a PDG should have a role in working toward pay equity. Future discussion between the institution, department chair, and departmental genderequity leaders should focus on PDG strategies to support equal pay initiatives. These may include transparent salary scale development, maintenance of a faculty compensation database, and/or PDG representation in institutional compensation meetings.
The member rank list also included promotion-related metrics: 1) gender equity in promotion rates among faculty; and 2) promotion. These metrics were not highly ranked by experts and were not included in the final list. Absence of promotion-related metrics from the expert rank list may reflect
Volume 23, no. 5: September 2022 669 Western Journal of Emergency Medicine Love et al. Results from the WOMENTUM Study
☐
☐
☐
☐
☐
☐
☐
☐
☐
☐
☐
☐
☐
☐
☐
departmental chair belief that promotion is not the PDG’s responsibility. However, their high ranking by members may reflect member sentiment that additional mechanisms are needed to prioritize for gender equity in promotion.
Departmental and Institutional Metric Assessment Tool for Professional Development Group
Metrics identified in our study (Table 5) can serve as an assessment tool for PDGs when developing programming and evaluating PDG initiatives (Figure 2). The tool is a guide and should be adapted to individual PDG needs and institutional/ departmental goals. While the metrics described target women’s PDGs, they could be used for departmental/institutional programming. Future efforts may focus on implementation of the assessment tool to validate and refine metrics.
High rank score of equity strategy and plan suggests that a departmental gender-equity strategy and plan are essential. The details of such a plan are beyond the scope of this study, but future work could focus on key strategy and plan components, potentially incorporating highly ranked metrics identified in this study.
The potential misapplication of these metrics within a departmental faculty development plan could threaten gender equity. As noted by one participant, “Many of these factors are not for women themselves to fix.” In providing the metrics guide, our goal is to provide academic departments a framework for creating individualized gender equity targets. The PDGs cannot be strictly quantitatively measured by these metrics, as there are numerous institutional and structural barriers to attaining them. Instead, we recommend that PDG and departmental leadership meet annually to review the framework and prioritize gender-equity goals. Then, the PDG can develop programming within its effort and budgetary scope that reflects departmental goals, collect data on targeted programs, and report back to departmental leaders.
LIMITATIONS
There are several limitations to this study. Low survey response rates for experts (~24% of the AACEM and AWAEM leaders) and member phases (~3.9% of the AWAEM and FemInEM listservs) limit generalizability. However, while small sample size may limit generalizability, the sample was large enough to reach thematic saturation.23,28 Convenience sampling may have led to overrepresentation of women in the study population, as 46% of the experts were female. Based on 2020 AAMC data, only 11% of ED chairs were women, yet 26% of our chair participants were women.29 Additionally, 87% of experts reported having a PDG at their institution, which may have introduced selection bias. Despite these limitations, our data reflect novel and critical themes relevant to promoting gender-equity priorities in academic medicine. Additionally, overrepresentation of women in our sample may lend accuracy to the metrics developed, as this group may be better equipped to inform achievable metrics for a departmental PDG.
The metrics and priorities described here are largely focused on faculty development and a PDG structure with significant faculty membership. However, some PDGs may focus on resident-led initiatives, and only one metric (number of women residents recruited to the residency program) was included to specifically reflect resident priorities. Future studies may examine differences in programming and evaluative metrics based on PDG leadership and membership (resident versus faculty group). Similarly, the study objective and questionnaire prompts were targeted toward supporting and funding PDGs at a departmental level, rather than institutional or national PDGs. As PDGs take a variety of forms, results may not be directly applicable to nondepartmental PDGs but could serve as a guide for PDGs of other forms. Future studies may seek to better understand the time and financial resources required to attain various levels of gender-equity programming within a department.
CONCLUSION
Experts and members recommend that academic EDs and women’s PDGs focus effort on prioritizing genderequity programming and strategies within their institution. Equitable compensation and recruitment/retention were also highlighted as top priorities by survey participants. These top metrics represent priority domains for institutional and departmental gender-equity initiatives that are supported by a PDG. Future work is necessary to determine the optimal strategies to support PDGs’ efforts, delineate between departmental/institutional versus PDG initiatives, and establish innovative metrics that can equitably assess career advancement of all women emergency physicians.
Address for Correspondence: Jennifer S. Love, MD, Research Division, Department of Emergency Medicine, Icahn School of Medicine at Mount Sinai, 555 W 57th St, 5th Floor, Suite 5-25, New York, NY 10019. Email: jennifer.love@mountsinai.org.
Conflicts of Interest: By the WestJEM article submission agreement, all authors are required to disclose all affiliations, funding sources and financial or management relationships that could be perceived as potential sources of bias. No author has professional or financial relationships with any companies that are relevant to this study. JSL and AZ serve in volunteer, unpaid AWAEM leadership roles: JSL is co-chair of AWAEM research committee, AZ is AWAEM secretary. AM serves on the board of directors for SAEM, which is a voluntary unpaid position. AM was a Member-at-Large (2016-2020), Secretary-Treasurer (May 2020-April 2021) and President-Elect (May 2021-Present). AM also provides paid legal consulting services. This study was funded by the 2020 SAEM AWAEM Research Fund. There are no conflicts of interest to declare.
Copyright: © 2022 Love et al. This is an open access article distributed in accordance with the terms of the Creative Commons Attribution (CC BY 4.0) License. See: http://creativecommons.org/ licenses/by/4.0/
Western Journal of Emergency Medicine 670 Volume 23, no. 5: September 2022 Results from the WOMENTUM Study Love et al.
REFERENCES
1. Jagsi R, Motomura AR, Griffith KA, et al. Sex differences in attainment of independent funding by career development awardees. Ann Intern Med. 2009;151(11):804–11.
2. Wiler JL, Rounds K, McGowan B, et al. Continuation of gender disparities in pay among academic emergency medicine physicians. Acad Emerg Med. 2019;26(3):286–92.
3. Jagsi R, Guancial EA, Worobey CC, et al. The “gender gap” in authorship of academic medical literature — a 35-year perspective. N Engl J Med. 2006;355(3):281–7.
4. Rochon PA, Davidoff F, Levinson W. Women in academic medicine leadership: Has anything changed in 25 years? Acad Med 2016;91(8):1053–6.
5. Guille C, Frank E, Zhao Z, et al. Work-family conflict and the sex difference in depression among training physicians. JAMA Intern Med. 2017;177(12):1766–72.
6. Mueller AS, Jenkins TM, Osborne M, et al. Gender differences in attending physicians’ feedback to residents: a qualitative analysis. J Grad Med Educ. 2017;9(5):577–85.
7. Debebe G, Anderson D, Bilimoria D, et al. Women’s leadership development programs: lessons learned and new frontiers. J Manag Educ. 2016;40(3):231–52.
8. Choo EK, Kass D, Westergaard M, et al. The development of best practice recommendations to support the hiring, recruitment, and advancement of women physicians in emergency medicine. Acad Emerg Med. 2016;23(11):1203–9.
9. Khatri UG, Love J, Zeidan A, et al. #Shemergency: use of a professional development group to promote female resident recruitment and retention. Acad Med. 2020;95(2):216-20.
10. Lee LK, Platz E, Klig J, et al. Addressing gender inequities: creation of a multi-institutional consortium of women physicians in academic emergency medicine. Acad Emerg Med. 2021;28(12):1358–67.
11. Bauman MD, Howell LP, Villablanca AC. The women in medicine and health science program: an innovative initiative to support female faculty at the University of California Davis School of Medicine. Acad Med. 2014;89(11):1462–6.
12. Valantine HA, Grewal D, Ku MC, et al. The gender gap in academic medicine: comparing results from a multifaceted intervention for stanford faculty to peer and national cohorts. Acad Med 2014;89(6):904–11.
13. Welch JL, Jimenez HL, Walthall J, et al. The Women in Emergency Medicine Mentoring Program: an innovative approach to mentoring. J Grad Med Educ. 2012;4(3):362–6.
14. Dannels SA, Yamagata H, McDade SA, et al. Evaluating a leadership program: a comparative, longitudinal study to assess the impact of the Executive Leadership in Academic Medicine (ELAM) program for
women. Acad Med. 2008;83(5):488–95.
15. Lin MP, Lall MD, Samuels-Kalow M, et al. Impact of a womenfocused professional organization on academic retention and advancement: perceptions from a qualitative study. Acad Emerg Med. 2019;26(3):303–16.
16. Micheller D, Peterson WJ, Cover M, et al. Defining a theorydriven ultrasound curriculum for prehospital providers. Air Med J 2019;38(4):285–8.
17. Thoma B, Chan TM, Paterson QS, et al. Emergency medicine and critical care blogs and podcasts: establishing an international consensus on quality. Ann Emerg Med. 2015;66(4):396-402.e4.
18. Panchal AR, Cash RE, Crowe RP, et al. Delphi analysis of science gaps in the 2015 American Heart Association cardiac arrest guidelines. J Am Heart Assoc. 2018;7(13).
19. Santen SA, Peterson WJ, Khandelwal S, et al. Medical student milestones in emergency medicine. Acad Emerg Med. 2014;21(8):905–11.
20. Hasson F, Keeney S, McKenna H. Research guidelines for the Delphi survey technique. J Adv Nurs. 2000;32(4):1008–15.
21. Hsu CC, Sandford BA. The Delphi technique: making sense of consensus. Pract Assessment, Res Eval. 2007;12(10):1–8.
22. Birt L, Scott S, Cavers D, et al. Member checking: a tool to enhance trustworthiness or merely a nod to validation? Qual Health Res 2016;26(13):1802–11.
23. Guest G, Namey E, Chen M. A simple method to assess and report thematic saturation in qualitative research. PLoS One. 2020;15(5):1–17.
24. de Loe RC. Exploring complex policy questions using the policy Delphi. A multi-round, interactive survey method. Appl Geogr 1995;15(1):53–68.
25. Pierce AE, Moreno-Walton L, Boatright D, et al. Advancing diversity and inclusion: an organized approach through a medical specialty academy. AEM Educ Train. 2020;4(S1):S40–6.
26. Sethuraman KN, Lall MD, Watts SH, et al. A commentary on impact of women-focused professional organization and academic retention and advancement: perceptions from a qualitative study. Acad Emerg Med. 2019;26(3):354–7.
27. Voytko M Lou, Barrett N, Courtney-Smith Di, et al. Positive value of a women’s junior faculty mentoring program: a mentor-mentee analysis. J Women’s Heal. 2018;27(8):1045–53.
28. Saunders B, Sim J, Kingstone T, et al. Saturation in qualitative research: exploring its conceptualization and operationalization. Qual Quant. 2018;52(4):1893–907.
29. Association of American Medical Colleges. Table C: Department Chairs by Department, Sex, and Race/Ethnicity, 2020. 2020. Available at: https://www.aamc.org/download/486590/data/ supplementaltablec.pdf. Accessed July 6, 2022.
Volume 23, no. 5: September 2022 671 Western Journal of Emergency Medicine Love et al. Results from the WOMENTUM Study
Traumatic Injuries in Sexual Assault Patients in the Emergency Department
Denise McCormack MD, MPH*† Sushi Subburamu, MD†‡
Glenda Guzman, DHSc, PA-C† Carmen Calderon, LCSW§ Ruchika Darapaneni, MSIV¶ Robert Lis, MSIV¶ Niloofar Sima, MSIV¶ Jeremy Sperling, MD*† Jill Corbo, MD*†
Section Editor: Patrick Meloy, MD
Albert Einstein College of Medicine, Department of Emergency Medicine, Bronx, New York Jacobi Medical Center and North Central Bronx Hospital, Department of Emergency Medicine, Bronx, New York Montefiore and Jacobi Medical Center, Department of Emergency Medicine, Bronx, New York North Central Bronx Hospital, Department of Social Work, Bronx, New York Albert Einstein College of Medicine, Office of Medical Student Research, Bronx, New York
Submission history: Submitted July 1, 2021; Revision received January 5, 2022; Accepted January 24, 2022
Electronically published August 19, 2022
Full text available through open access at http://escholarship.org/uc/uciem_westjem DOI: 10.5811/westjem.2022.1.53994
Introduction: The emergency department (ED) is at the forefront for treatment of sexual assault patients. Many require treatment for injuries sustained during the assault, ranging from mild to severe. Our objective in this study was to characterize types of injuries associated with sexual assault and identify associated factors.
Methods: We reviewed ED charts from an inner-city trauma center and nearby community hospital from 2019-2020 for patients age ≥13 years with a chief complaint of sexual assault. We used descriptive statistics, chi square, and logistic regression to characterize demographics and identify factors associated with trauma.
Results: A total of 157 patients met inclusion criteria. The mean age was 27.9 years old (range 1379 years) and 92.4% were female. Adult patients (age >18 years) comprised 77.5% of assaults vs adolescents (age 13-18 years) at 22.3%. Most patients presented to the trauma center compared to the community hospital (69.4% vs 30.6%). The assailants were reported as 61.2% acquaintance, 22.9% stranger, and 15.9% intimate partner. A forensic rape kit was performed in 92 (58.6%) cases. The patient was intoxicated with alcohol in 39 (24.8%) cases, and 22 (14%) patients reported drug-facilitated assault where an unknown substance was given to them. Alcohol (P = 0.95) and drug-facilitated assault (P = 0.64) did not change the occurrence of injuries. Fifty-seven (36.3%) patients exhibited physical trauma on presentation. Forty-five (28.6%) patients had minor injuries of abrasions, lacerations, or contusions. Major trauma was defined as fracture, brain injury, hemorrhage, strangulation, or injury requiring surgical consultation. There were 12 patients with major trauma consisting of fracture injury or nonfatal strangulation. None of the patients required admission. Sexual assault by an intimate partner (odds ratio [OR] 2.6; 95% CI: 1.1-6.5) and being an adult patient compared to adolescent (OR 3.0; 95% CI, 1.17.7) was significantly associated with physical trauma. Sexual assault by an intimate partner was also associated with nonfatal strangulation (OR 4.0; 95% CI, 1.1-15.4).
Conclusion: Physical injuries that resulted from sexual assault were mostly minor and occurred in 36% of rape victims. Intimate partner violence was found to be associated with physical trauma as well as nonfatal strangulation. Overall, this study helps us to understand key factors associated with sexual violence. [West J Emerg Med. 2022;23(5)672–677.]
Western Journal of Emergency Medicine 672 Volume 23, no. 5: September 2022 Original Research
* † ‡ § ¶
INTRODUCTION
In the United States, approximately 52 million women and 27 million men have experienced sexual assault (SA) in their lifetime.1 The emergency department (ED) remains the most common place where SA patients first seek out comprehensive care to receive emergency contraception, prophylaxis against sexually transmitted infections, completion of a forensic rape kit, and treatment for their injuries. Studies have shown that 30-80% of SA patients present to the ED with traumatic injury.2-4 However, there is conflicting evidence regarding the severity of these injuries.5-6
Several prior studies suggested that traumatic injuries during sexual assault were more likely to occur when a stranger was the assailant.7-9 However, other studies determined that a significant injury was more likely to happen when the assailant was an intimate partner (IP).10-11 In this study we evaluated the likelihood of SA being committed by an IP, acquaintance, or stranger, and whether this was related to the patient experiencing traumatic injuries.
Sexual assaults are frequently associated with drug-facilitated sexual assault (DFSA), illicit drugs, or alcohol. Drug-facilitated sexual assault has prevalence as high as 20.9% and is defined as when a drug is given to incapacitate the victim. Common DFSA drugs are gamma hydroxybutyrate, ketamine and benzodiazepines.12-15 Overthe-counter agents such as diphenhydramine (Benadryl) and Visine eye drops have also been reported.16-17 Alcohol intoxication in comparison to DFSA is more frequent and is typically the most common substance associated with sexual assault, occurring in 33-60% of cases.18-19 In this study, we aimed to determine how frequently SA patients sustained traumatic injuries when either alcohol or DFSA was involved.
METHODS
Patient Selection
We conducted a retrospective ED chart review from July 1, 2019–July 31, 2020 from a Level I trauma center with over 100,000 annual visits and community hospital with 50,000 annual visits, both located in medically underserved areas. Both hospitals are state designated Sexual Assault Forensic Examiner (SAFE) facilities of excellence with a dedicated sexual assault response team. Professionals from the team respond to all ED cases presenting with a chief complaint of SA. The team has formal training and expertise in providing standardized care to SA patients based on federal and state guidelines.20-22 The institutional review board approved this study.
Inclusion and Exclusion Criteria
Inclusion criteria consisted of patients ≥13 years of age with an ED chief complaint of SA. Patients were excluded if they were younger than 13, left after nursing triage assessment, or had an acute psychiatric condition based on medical history and impairment of mental status. We omitted from the study charts with missing variables of interest.
Population Health Research Capsule
What do we already know about this issue?
An estimated 52 million women and 27 million men in the USA have experienced sexual assault in their lifetime. The emergency department (ED) is at the forefront for the specialized treatment of these patients.
What was the research question?
What are the key elements associated with ED presentations of sexual assault and traumatic injury?
What was the major finding of the study?
Physical trauma was found in 36.3% of sexual assault patients, with 8% categorized as major trauma. Intimate partner violence was found in 15.9% of ED complaints for sexual assault.
How does this improve population health?
This study helps us to understand the complexities of sexual violence with the goal of improving the patient care model for this vulnerable patient population.
Demographics
Adolescent was defined as age 13-18 years old and adult >18 years. Racial categories were Black, Hispanic, White, Asian and other. Adult age was divided into 19-34, 35-64, and ≥65.
Data Collection
Three research fellowship medical students RL, RD and NS served as abstractors and conducted supervised chart reviews, according to best practices in medical record review.23 The recommended chart review methods were adhered to for this study. The data abstractors received training in electronic health record (EHR) data collection. A research protocol with specific variables, standardized definitions, and abstraction procedures was provided to the three abstractors who were blinded to the hypothesis being tested. The data collection form was piloted for reliability prior to finalization. The three abstractors met with the first author on a regular basis who reviewed charts for interobserver reliability and uniformity of data collection procedures.
Eligible patients were identified by a list generated from the hospital EHR based upon a chief complaint of SA. The patient list was then confirmed with the names listed on the hospital SA hotline call log to confirm a complete consecutive patient sample. Each patient chart was reviewed for inclusion and exclusion criteria and relevant clinical details about their
Volume 23, no. 5: September 2022 673 Western Journal of Emergency Medicine McCormack et al. Traumatic Injuries in Sexual Assault Patients
Traumatic Injuries in Sexual Assault Patients
ED visit. The first author adjudicated all questions related to inclusion/exclusion criteria and clinical information.
Definitions
Sexual Assault: The penetration, no matter how slight, of the vagina or anus with any body part or object, or oral penetration by a sex organ of another person, without the consent of the victim.
Emergency Medical Services (EMS) arrival: Patient arrived to the ED by ambulance or brought by local police.
Acquaintance: Friend, classmate, relative, neighbor, or co-worker.
Intimate Partner (IP): Current or former spouse, girlfriend, boyfriend, or partner.
Stranger: Perpetrator who was unknown to the patient.
Non-fatal strangulation (NFS): The impairment of air or blood flow through the neck as a result of external pressure. Manual or ligature strangulation performed by applying direct pressure usually with the hands around the neck or by tightening a ropelike ligature around the neck.24
Drug-facilitated sexual assault (DFSA): Suspected if the patient remembers consuming a beverage but cannot recall what happened for a period of time after consumption or feels a lot more intoxicated than their response to the amount of alcohol consumed or feels intoxicated after drinking a non-alcoholic beverage. If the patient woke up experiencing memory lapses or was unable to account for a period of time or the patient feels as though someone had sexual intercourse with them but cannot recall any or all of the incident.25
Alcohol and illicit drug use: Patient reports consuming alcohol or using an illicit substance during the immediate time period leading up to the SA.
Traumatic injury: Minor injury was defined as laceration, abrasion, or contusion to general areas of the body, excluding genital trauma. Major injury was defined as fracture, traumatic brain injury, internal hemorrhage, any evidence of attempted strangulation, or any injury requiring consultation by a surgical subspecialty.
Statistical Analysis
We used chi-square tests for statistical analysis of categorical variables: age, gender, race, involvement of alcohol, illicit drug or DFSA, perpetrator type, completion of forensic rape kit, and presence of injury on exam. Logistic regression was performed to identify associations with traumatic injury, as measured by calculated odds ratio (OR) and 95% confidence interval (CI). Statistical significance was defined as P < 0.05.
The software program Stata version 16 (StataCorp LLC, College Station, TX) was used to compute statistical analyses.
RESULTS
A total of 157 patients met inclusion criteria, and 15 patients were excluded from the study. Nine patients were excluded due to age <13 years, two patients were excluded because of an acute psychiatric condition, and four patients left the ED after triage assessment. The mean age was 27.9 years old (range 13-79 years), and 92.4% were female (Table 1). Adult patients (age >18 years) comprised 77.5% of assault
Table 1. Sexual assault patient characteristics. Patient characteristics Total N = 157 Age
27.9 years ± 11.5
13-18 years adolescent 35, 22.3%
≥19 years adult 122, 77.7%
Adult 19-34 years 82, 67.2% 35-64 years 38, 31.1% ≥ 65 years 2, 1.7%
Gender Female 145, 92.4%
Male 12, 7.6%
Race Hispanic 75, 47.7%
Black 51, 32.5%
White 22, 14%
Asian 7, 4.5%
Other 2, 1.3%
Perpetrator
Acquaintance 96, 61.2%
Stranger 36, 22.9%
Intimate partner 25, 15.9%
DFSA
Yes 22, 14.0%
No 135, 86.0%
Alcohol-related
Yes 39, 24.8%
No 118, 75.2%
Illicit drug
Yes 6, 3.8%
No 151, 96.2%
Mode of arrival
EMS 89, 56.7%
DFSA, drug-facilitated sexual assault; EMS, emergency medical services
Western Journal of Emergency Medicine 674 Volume 23, no. 5: September 2022
McCormack et al.
Patient characteristics Total N = 157
Walk-in 68, 43.3%
SAFE Facility
Level I trauma center 109, 69.4%
Community hospital 48, 30.6%
Forensic rape kit
Yes 92, 58.6%
No 65, 41.4%
Traumatic Injury
Yes 57, 36.3%
Major 12, 21.1%
Minor 45, 78.9%
No 100, 63.7%
Non-fatal strangulation
Table 1. Continued. SAFE, Sexual Assault Forensic Examiner.
Yes 10, 6.4%
No 147, 93.6%
victims compared to adolescents (age 13-18 years) at 22.3%. Most patients presented to the trauma center compared to the community hospital (69.4% vs 30.6%). The perpetrators of these assaults were reported as 61.2% acquaintance, 22.9% stranger, and 15.9% IP. In 8.9% of cases, there was an assault by multiple assailants. Fifty-seven (36.3%) patients exhibited traumatic injury on presentation. A forensic rape kit was performed in 92 (58.6%) cases but was not associated with the presence of trauma (P = 0.23) (Table 2).
Table 2. Comparison of sexual assault patients who suffered trauma.
Patient characteristics All N = 157 Trauma n = 57 No trauma n = 100 X2 P-value
Age
Adolescent 35 6, 17.1% 29, 82.9% *P<0.05
Adult 122 51, 41.8% 71, 58.2%
Adult
19-34 years 82 31, 37.8% 51, 62.2% 0.15
35-64 years 38 18, 47.4% 20, 52.6% ≥ 65 years 2 2, 100% 0, 0%
Gender
Female 145 54, 37.2% 91, 62.8% 0.69
Male 12 3, 25% 9, 75%
Race
Hispanic 75 29, 38.7% 46, 61.3% 0.75
Black 51 17, 33.3% 34, 66.7%
White 22 9, 40.9% 13, 59.1%
Asian 7 2, 28.6% 5, 71.4%
Table 2. Continued.
Patient characteristics All N = 157 Trauma n = 57 No trauma n = 100 X2 P-value
Other 2 0, 0% 2, 100%
Perpetrator
Acquaintance 96 24, 25% 72, 75% *P<0.05
Stranger 36 18, 50% 18, 50%
Intimate partner 25 15, 60% 10, 40%
DFSA
Yes 22 7, 31.8% 15, 68.2% 0.64
No 135 50, 37.1% 85, 62.9%
Alcohol-related
Yes 39 14, 35.9% 25, 64.1% 0.95
No 118 43, 36.4% 75, 63.6%
Illicit drug
Yes
6 2, 33.3% 4, 66.7% 0.88
No 151 55, 36.4% 96, 63.6%
SAFE facility
Level I trauma center 109 38, 34.9% 71, 65.1% 0.57
Community hospital 48 19, 39.6% 29, 60.4%
Forensic rape kit
Yes 92 37, 40.2% 55, 59.8% 0.23
No 65 20, 30.8% 45, 69.2%
DFSA, drug-facilitated sexual assault; SAFE, Sexual Assault Forensic Examiner.
There were 39 (24.8%) cases where the patient was intoxicated with alcohol (P = 0.95), and 22 (14%) reported DFSA (P = 0.64), but neither was associated with physical trauma (Table 2). Forty-five (28.6%) patients had minor injury described as abrasions, lacerations or contusions, and major trauma occurred in 12 patients, which consisted of either having a fracture injury or NFS. Logistic regression determined that sexual assault by IP (OR 2.6; 95% CI: 1.1-6.5) and being an adult patient compared to adolescent (OR 3.0; 95% CI: 1.1-7.7) was associated with physical injury (Table 3). A sexual assault perpetrated by IP also was associated with NFS (OR 4.0; 95% CI: 1.1-15.4).
Table 3. Associations of sexual assault with traumatic injury. Predictor
Odds Ratio; 95% CI
Adult patient > 18 years old 3.0; CI: 1.1 - 7.7 Intimate partner violence 2.6; CI: 1.1 - 6.5
DISCUSSION
Our results show that SA patients who present to the ED for treatment are overwhelmingly young women and their
Volume 23, no. 5: September 2022 675 Western Journal of Emergency Medicine McCormack et al. Traumatic Injuries in Sexual Assault Patients
Traumatic Injuries in Sexual Assault Patients
acquaintances are commonly the perpetrator. This familiar pattern may help to explain why under-reporting to law authorities might occur.26-27 The United States Department of Justice estimates that up to 67% of sexual assaults are not reported to the police.28 In our study we discovered that merely 58.6% of ED patients consented to have a forensic rape kit completed, a process that entails collecting DNA evidence from the patient to aid in the legal prosecution of a perpetrator. In SA cases where the patient declined a forensic rape kit in the ED, the assault was not disclosed to law enforcement officials at the patient’s request. Although our study did not examine the reasons why patients declined a forensic rape kit, it has been widely reported that many patients do not report SA to law enforcement due to fear of reprisal, shame, and stigma.29-30
The physical injuries of the SA patients were typically mild, and none of the patients were admitted. Patients with physical trauma were more often adults than adolescents. The reason for this finding is unknown. We found alcohol to be the most common substance associated with SA, whereas DFSA and illicit drug use were relatively low. Furthermore, neither alcohol nor DFSA were associated with trauma. This differs from prior research where patients with DFSA were less likely to sustain physical injuries during SA, possibly due to sedation and lessened mobility.31-32
When major trauma resulted, specifically NFS or “choking,” the perpetrator was often an IP, consistent with previous studies.33-36 Our finding that SA patients were more likely to experience attempted strangulation if the perpetrator was an IP is alarming, since this carries an increased homicide risk.34 However, the occurrence of NFS was relatively low at 6.4% in our patient sample, which is similar to a large study that found NFS in 7.4% of SA cases.33 It remains difficult to determine whether this occurrence is low because some strangulation victims did not survive.
Our findings confirm the conclusions of previous research that severe trauma in SA victims is infrequent. However, we discovered that there was more trauma associated with IP sexual violence (IPSV), which occurred in 15.9% of our inner-city patients. It is an often overlooked problem even though IPSV occurs in 1/10 men and 1/4 women nationwide.1,37 A recent multicenter study found that 11.4% of patients who presented to Level I trauma centers for injury also reported IPSV.38 Additional research is needed to determine whether the prevalence of IPSV is greater among inner-city ED patients compared to other regions. This discovery could lead to improved SA protocols and resource allocation in higher risk communities.
Overall, it remains imperative that clinicians in the ED adhere to screening guidelines for intimate partner abuse and address the topics of SA and IPSV in the ED when applicable. Tangible solutions to these challenges are still evolving; nevertheless, our study results can be used to enhance education of medical professionals with an emphasis on improving standardized care for SA victims and optimizing forensic rape kit collection when required.
LIMITATIONS
Our study was retrospective and drew patients from EDs designated as SAFE facilities of excellence located in an inner-city community. Therefore, the results may not be generalizable to other communities. Additionally, the patient sample was generated from the EHR based on a chief complaint of SA, which may have underestimated the true occurrence of SA in our patients due to selection and sample biases. The study sample could also have missed patients with a primary trauma-related complaint or those with altered mental status, where the SA was either addressed secondarily or never disclosed to the treatment team. Our study most likely did not capture cases in which a patient presented in extremis due to severe trauma and the SA aspect was unknown to the ED clinicians. In addition to these several factors, we recognize that SA is often under-reported, which further contributed to our study having a small number of patients.
CONCLUSION
Alcohol is the most common substance that is reported among sexual assault patients presenting to the ED. Traumatic injuries occurred in just more than one-third of these SA victims and were categorized as minor. Intimate partner sexual violence was found to be substantially associated with physical trauma and strangulation. Overall, this study helps us to understand several key factors associated with sexual violence.
Address for Correspondence: Denise McCormack, MD, MPH, Albert Einstein College of Medicine, Jacobi Medical Center and North Central Bronx Hospital, Department of Emergency Medicine, 1400 Pelham Parkway, Bronx, NY 10461. Email: mccormad@nychhc.org.
Conflicts of Interest: By the WestJEM article submission agreement, all authors are required to disclose all affiliations, funding sources and financial or management relationships that could be perceived as potential sources of bias. No author has professional or financial relationships with any companies that are relevant to this study. There are no conflicts of interest or sources of funding to declare.
Copyright: © 2022 McCormack et al. This is an open access article distributed in accordance with the terms of the Creative Commons Attribution (CC BY 4.0) License. See: http:// creativecommons.org/licenses/by/4.0/
REFERENCES
1. Smith, SG, Zhang, X, Basile, KC, et al (2018). The National Intimate Partner and Sexual Violence Survey (NISVS): 2015 Data Brief. Atlanta, GA: National Center for Injury Prevention and Control, Centers for Disease Control and Prevention. Available at: https://www.cdc.gov/ violenceprevention/pdf/2015data-brief508.pdf Accessed June 8, 2021.
2. Alempijevic D, Savic S, Pavlekic S, et al. Severity of injuries among sexual assault victims. J Forensic Leg Med. 2007;14(5):266-9.
Western Journal of Emergency Medicine 676 Volume 23, no. 5: September 2022
McCormack et al.
3. Loder RT, Robinson TP. The demographics of patients presenting for sexual assault to US emergency departments. J Forensic Leg Med 2020;69:101887.
4. Maguire W, Goodall E, Moore T. Injury in adult female sexual assault complainants and related factors. Eur J Obstet Gynecol Reprod Biol 2009;142(2):149-53.
5. Riggs N, Houry D, Long G, et al. Analysis of 1,076 cases of sexual assault. Ann Emerg Med. 2000;35(4):358-62.
6. Avegno J, Mills TJ, Mills LD. Sexual assault victims in the emergency department: analysis by demographic and event characteristics. J Emerg Med. 2009;37(3):328-34
7. Stermac LE, Du Mont JA, Kalemba V. Comparison of sexual assaults by strangers and known assailants in an urban population of women. CMAJ. 1995;153(8):1089-94.
8. Jones JS, Wynn BN, Kroeze B, et al. Comparison of sexual assaults by strangers versus known assailants in a community-based population. Am J Emerg Med. 2004;22(6):454-9.
9. Sugar NF, Fine DN, Eckert LO. Physical injury after sexual assault: findings of a large case series. Am J Obstet Gynecol. 2004;190(1):71-6.
10. Möller AS, Bäckström T, Söndergaard HP, et al. Patterns of injury and reported violence depending on relationship to assailant in female Swedish sexual assault victims. J Interpers Violence. 2012;27(16):3131-48.
11. Zilkens RR, Smith DA, Kelly MC, et al. Sexual assault and general body injuries: a detailed cross-sectional Australian study of 1163 women. Forensic Sci Int. 2017;279:112-20.
12. McCormack D, Koons K. Sexually transmitted infections. Emerg Med Clin North Am. 2019;37(4):725-38.
13. Du Mont J, Macdonald S, Rotbard N, et al. Factors associated with suspected drug-facilitated sexual assault. CMAJ. 2009;180(5):513-9.
14. Bechtel LK, Holstege CP. Criminal poisoning: drug-facilitated sexual assault. Emerg Med Clin North Am. 2007;25(2):499-525.
15. Fiorentin TR, Logan BK. Toxicological findings in 1000 cases of suspected drug facilitated sexual assault in the United States. J Forensic Leg Med. 2019;61:56-64.
16. Smith KM, Larive LL, Romanelli F. Club drugs: methylenedioxymethamphetamine, flunitrazepam, ketamine hydrochloride, and gammahydroxybutyrate. Am J Health Syst Pharm. 2002;59(11):1067-76.
17. Spiller H, Rogers J, Sawyer T. Drug facilitated sexual assault using an over-the-counter ocular solution containing tetrahydrozoline (Visine). Leg Med. 2007;9:192-5.
18. Tadros A, Sharon MJ, Hoffman SM, et al. Emergency department visits for sexual assault by emerging adults: Is alcohol a factor?. West J Emerg Med. 2018;19(5):797-802.
19. Anderson LJ, Flynn A, Pilgrim JL. A global epidemiological perspective on the toxicology of drug-facilitated sexual assault: a systematic review J Forensic Leg Med. 2017;47:46-54.
20. New York State Department of Health Bureau of Women, Infant and Adolescent Health Sexual Assault Forensic Examiner (SAFE) Program Overview. 2019. Available at: 21. https://www.health.ny.gov/professionals/safe/docs/program_overview_ and_standards.pdf Accessed June 20, 2021.
22. Campbell R, Patterson D, Lichty LF. The effectiveness of sexual assault nurse examiner (SANE) programs: a review of psychological, medical, legal, and community outcomes. Trauma Violence Abuse 2005;6(4):313-29.
23. Worster A, Bledsoe RD, Cleve P, et al. Reassessing the methods of medical record review studies in emergency medicine research. Ann Emerg Med. 2005;45(4):448-51.
24. Armstrong M Jr, Strack GB. Recognition and documentation of strangulation crimes: a review. JAMA Otolaryngol Head Neck Surg. 2016;142(9):891-7.
25. New York State Department of Health. Drug facilitated sexual assault. 2017. Available at: Https://www.health.ny.gov/professionals/safe/docs/ dfsa_alert_sheet.pdf. Accessed June 8, 2021.
26. Jones JS, Alexander C, Wynn BN, et al. Why women don’t report sexual assault to the police: the influence of psychosocial variables and traumatic injury. J Emerg Med. 2009;36(4):417-24.
27. Wolitzky-Taylor KB, Resnick HS, Amstadter AB et al. Reporting rape in a national sample of college women. J Am Coll Health. 2011;59(7):582-7.
28. Langton, L, Berzofsky M, Krebs C, et al. Bureau of Justice Statistics: Victimizations Not Reported to the Police 2006-2010. RTI International 2012. Available at: https://www.rti.org/news/report-more-half-violentcrimes-went-unreported-police-2006-2010. Accessed June 8, 2021.
29. Feldhaus KM, Houry D, Kaminsky R. Lifetime sexual assault prevalence rates and reporting practices in an emergency department population. Ann Emerg Med. 2000;36(1):23-7
30. Taylor SC, Gassner, L. Stemming the flow: challenges for policing adult sexual assault with regard to attrition rates and under-reporting of sexual offences. Police Pract Res. 2010;11(3):240-55.
31. McGregor MJ, Ericksen J, Ronald LA, et al. Rising incidence of hospitalreported drug-facilitated sexual assault in a large urban community in Canada. Retrospective population-based study. Can J Public Health 2004;95(6):441-5.
32. McGregor MJ, Lipowska M, Shah S, et al. An exploratory analysis of suspected drug-facilitated sexual assault seen in a hospital emergency department. Women Health. 2003;37(3):71-80.
33. Zilkens RR, Phillips MA, Kelly MC, et al. Non-fatal strangulation in sexual assault: a study of clinical and assault characteristics highlighting the role of intimate partner violence. J Forensic Leg Med. 2016;43:1-7.
34. Glass N, Laughon K, Campbell J, et al. Non-fatal strangulation is an important risk factor for homicide of women. J Emerg Med 2008;35(3):329-35.
35. Wilbur L, Higley M, Hatfield J, et al. Survey results of women who have been strangled while in an abusive relationship. J Emerg Med. 2001;21(3):297-302.
36. Smith DJ Jr, Mills T, Taliaferro EH. Frequency and relationship of reported symptomology in victims of intimate partner violence: the effect of multiple strangulation attacks. J Emerg Med. 2001;21(3):323-9.
37. Barker LC, Stewart DE, Vigod SN. Intimate partner sexual violence: an often overlooked problem. J Womens Health. 2019;28(3):363-74.
38. Zakrison TL, Ruiz X, Gelbard R, et al. Universal screening for intimate partner and sexual violence in trauma patients: an EAST multicenter trial. J Trauma Acute Care Surg. 2017;83(1):105-10.
Volume 23, no. 5: September 2022 677 Western Journal of Emergency Medicine McCormack et al. Traumatic Injuries in Sexual Assault Patients
Brief Research
Trends of Pandemic Parenting in Medical Academia
Meeta Shah, MD
Melissa Holmes, MD
Inna Husain, MD Dayle Davenport, MD Sheila Dugan, MD Sobia Ansari,MD
Section Editor: Casey Clements, MD, PhD
Submission history: Submitted July 14, 2021; Revision received April 4, 2022; Accepted June 30, 2022 Electronically published September 15, 2022
Full text available through open access at http://escholarship.org/uc/uciem_westjem DOI: 10.5811/westjem.2022.6.54144.
Introduction: The pandemic has been difficult on physicians, with two fifths of doctors in one survey reporting that their mental health is now worse than before the pandemic. It is likely that a significant proportion of these physicians are parents of children necessitating childcare, as approximately 32% of the US workforce has someone in their household under the age of 14. We sought to study the impact of the coronavirus 2019 (COVID-19) pandemic on physician parents in academia. Our goal was to investigate the intersection of professional and personal challenges, as well as perceived impact on domestic life and professional development secondary to the COVID-19 pandemic.
Methods: Using Survey Monkey, we developed a 37-question survey to address the aim of this study. Questions were grouped into four categories: demographics; impact on childcare; impact on care; and impact on mental health/wellness. Most of the questions were multiple choice with a few fill-in-the-blank options to allow participants to provide additional information related to their experiences as physicians during the pandemic. A link to the survey was disseminated via email to physicians at our home institution, Rush University Medical Center (Chicago), via our own intra- and interdepartmental communications, We used private social media accounts such as Facebook physician groups to reach out to physicians at other academic medical centers. Survey responses were voluntary and collected anonymously over an eight-week period, without identifiable data. Inclusion criteria included any physician identifying themselves as working full or full or part time in an academic facility in the US and caregivers for children <18 years.
Results: Survey respondents were mostly female (83.2%), practicing in the Midwest (61.2%), and ranked as assistant professor (59.5%). The majority of respondents had two children (65.1%) who were <11 years in age (85.6%). Most respondents worked full time with 72.8% working over 50% clinically. Childcare was disrupted for 171 of 232 respondents (73.7%); 62.9% struggled with balancing work with childcare; 81.9% worried often or very often about fulfilling their responsibilities. A vast majority, 210 of 232 respondents (90.5%) had some degree of concern about feeling overburdened by their roles. More than half (57.3%) worried that their professional advancement was impacted by the pandemic, and 53.9% considered making adjustments to their clinical workload/. Over half (51.6%) thought that increased domestic responsibilities impacted their professional advancement .
Conclusion: In the survey, which was completed primarily by early-career women physicians practicing in a variety of specialties and geographic regions, we noted that childcare disruption amidst the pandemic was extremely prevalent. The majority of respondents reported full-time equivalent work; thus, it is reasonable to assume that significant workloads and limitations in remote work in combination with childcare constraints resulted in significant burden. A large number felt the challenges were negatively impacting their professional development and felt overburdened by their various roles. [West J Emerg Med. 2022;23(5)678–683.]
Rush Medical University Center, Department of Emergency Medicine, Chicago, Illinois
Western Journal of Emergency Medicine 678 Volume 23, no. 5: September 2022
Report
INTRODUCTION
There are over half a million active physicians in the United States.1 The coronavirus 2019 (COVID-19) pandemic has been difficult for them, with two fifths of doctors in one survey reporting that their mental health is now worse than before the pandemic.2 Both anxiety and depression were found in over 22% of healthcare workers and insomnia in over 38%. Female healthcare workers exhibited higher rates of these symptoms compared to their male colleagues.3 It is likely that a significant proportion of these physicians are parents of children necessitating childcare, as approximately 32% of the US workforce has someone in their household <14 years old.4 The impact of the pandemic on parents, physicians or otherwise, has been significant. Due to large-scale school and daycare closures, as well as social distancing restrictions, many working parents were left without options for childcare and forced to balance their parental responsibilities with professional obligations.5 An October 2020 survey-based study found that since March 2020, almost a quarter of parents reported worsening mental health, and 14% reported worsening behavioral issues for their children.5
While the impacts of the COVID-19 pandemic have been far reaching, we sought to study its impact specifically on physician parents in academia, irrespective of gender. Our goal was to investigate the burden of professional and personal obligations. We also surveyed their perceived professional and personal challenges secondary to the COVID-19 pandemic, as a result of the increased intersection between work and domestic roles. Finally, we sought to inquire about their mental health challenges and any changed perceptions of value in their professional careers.
METHODS
Study Design and Participants
We developed a survey consisting of 37 questions, using SurveyMonkey (Momentive, San Mateo, CA). The questions were grouped into four categories: demographics; impact on childcare; impact on career; and impact on mental health/ wellness. The first 12 questions focused on demographics, including the survey participants’ gender, number of children and their ages, profession and academic position, marital status, and geographic location. The seven questions in the second category – impact on childcare – focused on survey participants’ baseline childcare requirements, changes brought on due the pandemic, and challenges in balancing professional and childcare duties. The 10 questions in the third category – impact on career – focused on changes in workload, ability to meet professional responsibilities, and perceived impact on professional advancement. The final category included eight questions focused on mental and physical stressors related to working as a physician during the COVID-19 pandemic. Most of the questions were multiple-choice format with a few fill-in-the-blank options to allow participants to provide additional information related to their experiences as physicians during the pandemic.
Population Health Research Capsule
What do we already know about this issue?
Two-fifths of doctors in one survey reported worse mental health than pre-pandemic Female healthcare workers exhibited higher rates of anxiety and depression compared to male colleagues.
What was the research question?
We sought to investigate mental health challenges and perceptions of value in career for parents in academia due to the pandemic.
What was the major finding of the study?
Childcare was disrupted for 73.7%, 81.9% worried about fulfilling responsibilities and 90% felt overburdened by personal and professional roles.
How does this improve population health?
Mental health stressors, prevalent in this cohort, could impact quality of care, safety, and clinical outcomes and reduced engagement, which in turn could impact professional advancement.
Data Collection
A link to the survey was disseminated via email to physicians at our home institution, Rush University Medical Center (Chicago), via intra- and interdepartmental communications. We used private social media accounts such as Facebook physician groups to reach out to physicians at other academic medical centers. Inclusion criteria for participation in the survey study included academic physicians who were also parents working in the US and able to self-administer the survey. Survey responses were voluntary and collected anonymously via SurveyMonkey over an eight-week period, without identifiable data. Responses were password protected with only study investigators having access to the data collected. Inclusion criteria included any physician identifying themselves as working full or part time in an academic facility in the US and caregivers for children <18 years.
RESULTS
Survey respondents were mostly female (83.2%), practicing in the Midwest (61.2%), and ranked as assistant professor (59.5%). The majority of respondents had two children (65.1%) who were <11 years in age (85.6%) and did not have special needs (89.2%). Most respondents had a consistent partner to assist in childcare (94.8%) and worked 81-100% total full-time equivalent (FTE) (83.2%) with 72.8%
Volume 23, no. 5: September 2022 679 Western Journal of Emergency Medicine Shah et al. Trends of Pandemic Parenting in Medical Academia
Trends of Pandemic Parenting Medical Academia
working over 50% clinically; 108 out of 232 respondents (46.65%) were dual physician households. Physicians from 26 specialties responded, with the top five representing pediatrics, emergency medicine, internal medicine, family medicine, and otolaryngology (Table 1).
Table 1. Demographic Data of Survey Respondents.
Total respondents 232
Number of children
1 33 14.2%
2 151 65.1%
3 41 17.7%
4 or more 7 3.0%
Age of children
0-4 152
5-7 105 8-11 71 12-15 30 16-19 18 19+ 7
Providers with children who have special needs
Yes 25 10.8%
No 207 89.2%
Partner in childcare
Yes 220 94.8%
Partial 3 1.3% No 9 3.9%
Academic title
Instructor 28 12.1%
Assistant Professor 138 59.5%
Associate Professor 40 17.2%
Professor 6 2.6%
Other 20 8.6%
Current total full time equivalents (FTE)
81 to 100% 193 83.2%
51 to 80% 33 14.2%
0 to 50% 6 2.6%
Clinical specific FTE
76 to 100% 103 44.4%
51 to 75% 67 28.9%
26 to 50% 39 16.8%
0 to 25% 23 9.9%
Gender Male 38 16.4%
Female 193 83.2%
Other/ not listed 1 0.4%
Table 1. Continued.
Total respondents 232
Geographical areas
Midwest 142 61.2%
South 43 18.5% Northeast 31 13.4% West 16 6.9%
Top 5 reporting specialties
Internal Medicine 23 9.9%
Pediatrics 59 25.4%
Family Medicine 21 9.1%
Emergency Medicine 39 16.8%
Otolaryngology 13 5.6%
Total of these specialties 155 66.8%
Dual physician households
Respondents with 2 physician households 108 46.6%
Top 5 childcare arrangements
Full time school with or without after school activities 97 41.8%
Full time nanny or au pair 82 35.3%
Full time daycare 67 28.9%
External family member assisting in childcare 42 18.1%
Part time nanny 30 12.9%
Domestic Duties and Well-being
During the pandemic, childcare was disrupted for 171 of 232 respondents (73.7%) and difficult to secure or maintain for 129 respondents (56.6%) (Figures 1A, 1B). A total of 62.9% struggled with balancing work with childcare ,with 21.6% taking on most of the new childcare responsibilities themselves and 25% splitting new responsibilities with their spouse/ partner. We found that 81.9% of respondents worried often or very often”about fulfilling their responsibilities; and 210 of 232 respondents (90.5%) expressed some degree of concern about feeling overburdened by their roles, with 47.4% endorsing often or very often not getting enough sleep (Figure 1C). About 41% said that challenges with childcare have had a negative impact on their ability to perform their jobs. An overwhelming 87% of respondents expressed some concern about exposing immediate family members to COVID-19 (Figure 1C).
Professional Impact
Survey participants were mixed in their responses to how their clinical workload was affected by the pandemic. When asked whether their clinical workload had increased, 35% disagreed or strongly disagreed, 32.3% agreed or strongly agreed, and 24.6% neither agreed or disagreed. More than half
Western Journal of Emergency Medicine 680 Volume 23, no. 5: September 2022
in
Shah et al.
Figure 1. Domestic duties and wellbeing of survey respondents. (A) Respondents who experienced a disruption in childcare. (B) Respondents who experienced difficulties securing childcare. (C) Respondents who experienced indicators of physician burnout.
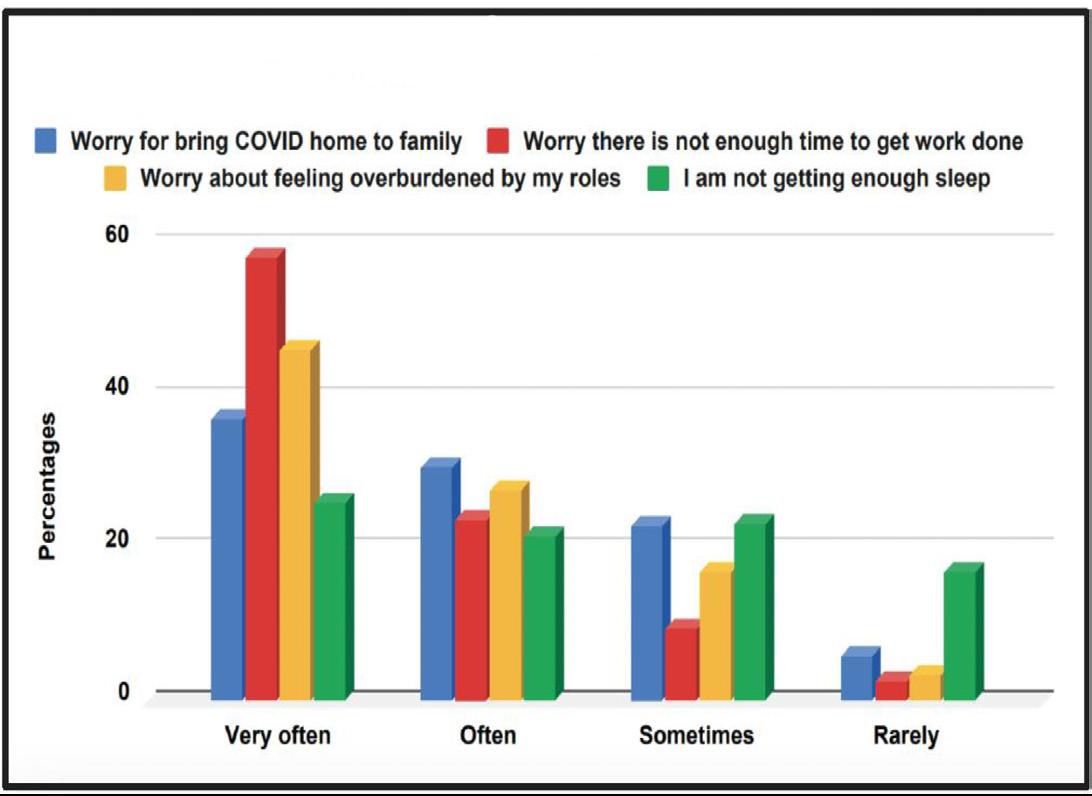
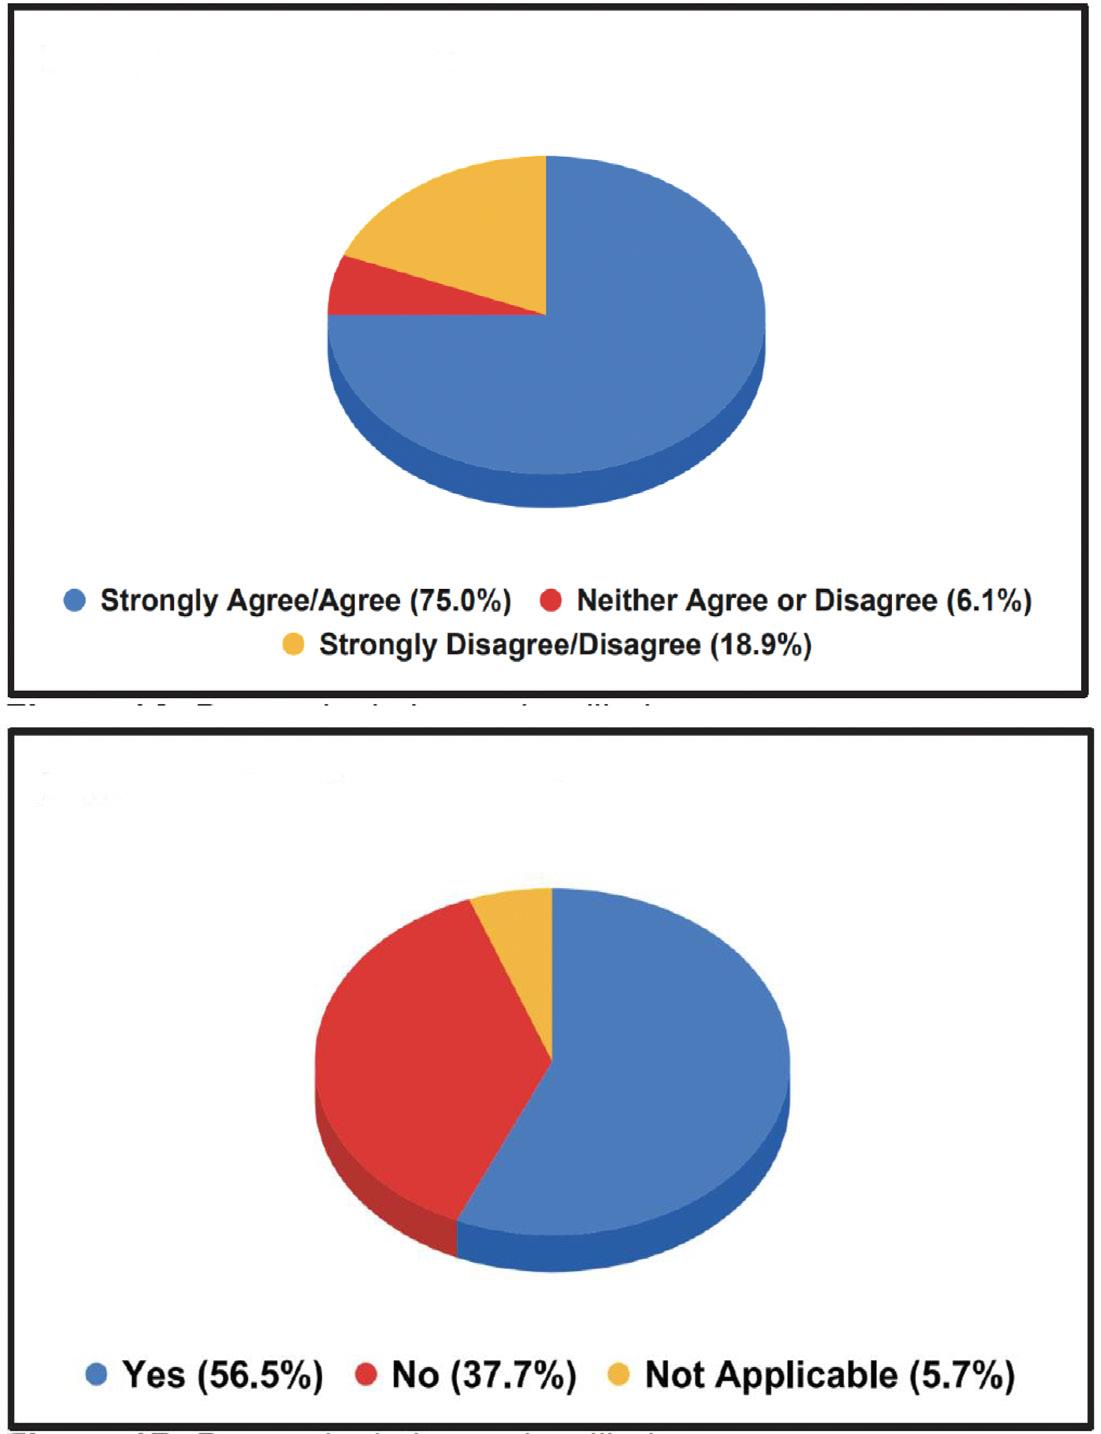
of respondents (53.55%) thought their non-clinical workload increased, and 37.9% disagreed or strongly disagreed that non-clinical work completed from home was equally valued to in-person work. More than half (57.3%) worried that their professional advancement was impacted by the pandemic (Figure 2), and 53.9% considered making adjustments to their
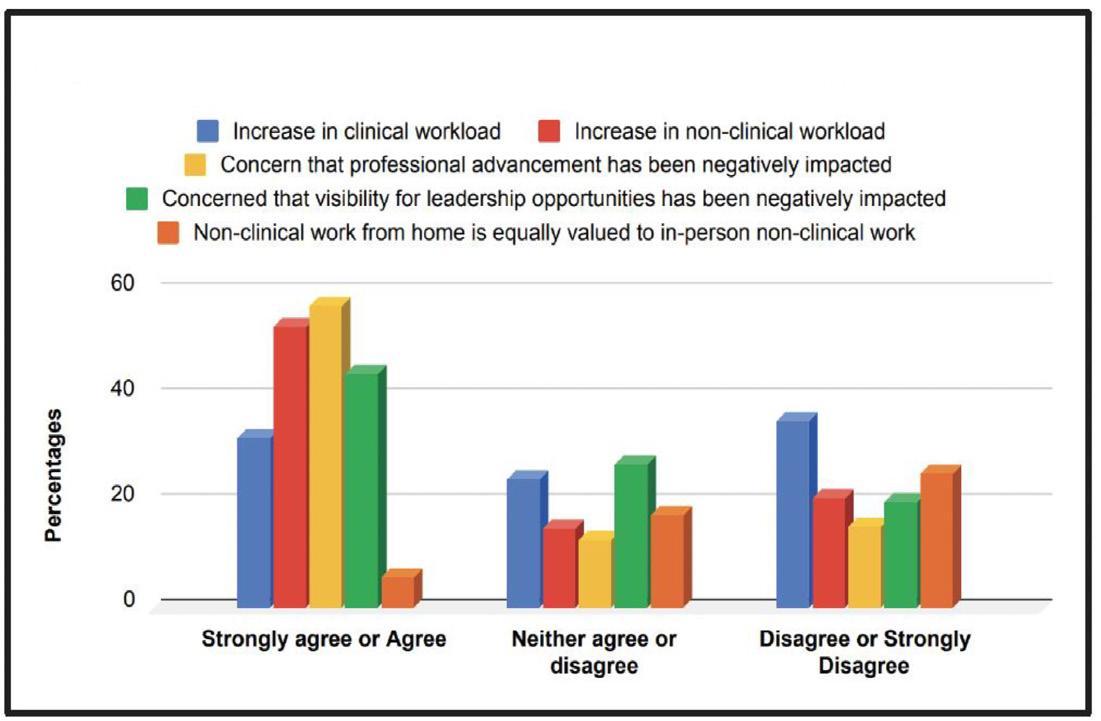
clinical workload/FTE (Table 2). Of the respondents, 44.4% worried that their visibility for leadership opportunities had been impacted, and over half (51.6%) thought that increased domestic responsibilities impacted their professional advancement.
Table 2. Professional impact of the COVID-19 pandemic.
Considerations of Professional Shifts in Medicine Due to Pandemic
In the past 4 months I have considered making adjustments to my clinical workload/FTE
Yes 125 53.9%
Factors impacting worry about professional advancement
Increased domestic responsibilities 113 48.7%
Home-schooling requirements 89 38.4%
Increased use of virtual meeting platforms 76 32.8%
Inability to do non-clinical work from home 61 26.3%
Pandemics Affect on Professional Advancement
Those who strongly agree or agree that the pandemic has negatively impacted their professional advancement. 133 57.3%
FTE, Full-time equivalent.
DISCUSSION
In this survey study completed primarily by early-career women physicians practicing in a variety of specialties and geographic regions, we noted that childcare disruption amidst the pandemic was extremely prevalent and about half of all respondents endorsed difficulty securing childcare, in line with previous studies during the pandemic.6 Considering that the majority of our respondents reported full-time work, it is reasonable to assume that significant clinical workloads, limitations in remote work, and childcare constraints (including remote learning environments) resulted in significant burden.
Figure 2. Professional impact of the COVID-19 pandemic.
Volume 23, no. 5: September 2022 681 Western Journal of Emergency Medicine Shah et al. Trends of Pandemic Parenting in Medical Academia
Worrying about the exposure of COVID-19 to immediate family members seemed to be an additional stressor.
It is likely that dual-earner couples had to determine how to take on extra childcare responsibilities based on their employment situation and family dynamics. Pre-pandemic data illustrated that one working spouse (usually the female) did the majority of childcare and more housework in the family.7 In a study of young physician-researchers of married or partnered respondents with children, women spent 8.5 more hours per week on domestic activities. For those with partners employed full time, women were more likely to take time off during disruptions of usual childcare arrangements than men.8 The concern here again is that women may have been increasingly more impacted in these family units based on historic data and our survey findings.
With regard to certain social and economic factors, working women have been affected more than men during this pandemic. For example, women are more at risk of unemployment,9 and for the first time one in four women considered stepping out of the workforce or downshifting their careers, with women in senior roles, working mothers, and women of color most at risk.10 The outcome of this trend has also been studied by Edwards, who found that women, parents, and women who are parents would leave the workforce in rising order, resulting in the loss of significant wages.11 Considering the findings of these prior studies, the responses of the parents in our survey, and the fact that individuals identifying as female make up 37% of US physicians, there is significant concern for ongoing deleterious impacts on this group.12
Many participants also noted increased factors in burnout, clinical or non-clinical workloads (Figure 2). Almost half reported poor sleep and felt their work was negatively impacted. These mental health stressors could lead to reduced quality of care, safety, and clinical outcomes for patients13 and reduced engagement, which in turn could impact professional advancement and leadership opportunities. The perception that the pandemic had negatively impacted professional development was a concern for the majority of our respondents, which we found alarming. With approximately 30% of healthcare workers having had thoughts of leaving the profession during the pandemic,14 it is imperative that institutions and federal agencies address the short- and longterm impacts of the COVID-19 pandemic on this cohort.
This study provides insights into how physicians, in particular women and parents, experienced the COVID-19 pandemic in the US during the first wave. Future studies could assess the immediate and long-term impacts in the personal and professional arenas as well as impacts on the healthcare system at large including physician availability, wellness and retention.
LIMITATIONS
We acknowledge certain limitations in our study. There were only 232 respondents, and the majority were female and
from non-surgical specialties. A higher response rate with more survey responses from male physicians and physicians from surgical specialties would improve generalizability. Second, the survey was distributed in June when most children were not in school. Responses related to childcare stressors might have been different if the survey were performed during the school year and parents were actively trying to home-school or balance school year activities with professional responsibilities.
CONCLUSION
We found that childcare disruption amidst the pandemic was prevalent among early-career women physicians, most of whom practiced full time in a variety of specialties and geographic regions. These findings led us to conclude that significant workloads and limitations in remote work, in combination with childcare constraints, resulted in significant burden. A large number of survey respondents felt the challenges were negatively impacting their professional development and that they felt overburdened by their various roles
Address for Correspondence : Meeta Shah, MD, Rush University Medical Center, Department of Emergency Medicine, 1750 W. Harrison St., Suite 108 Kellogg, Chicago, IL 60612. Email: Meeta_Shah@rush.edu.
Conflicts of Interest: By the WestJEM article submission agreement, all authors are required to disclose all affiliations, funding sources and financial or management relationships that could be perceived as potential sources of bias. No author has professional or financial relationships with any companies that are relevant to this study. There are no conflicts of interest or sources of funding to declare.
Copyright: © 2022 Shah et al. This is an open access article distributed in accordance with the terms of the Creative Commons Attribution (CC BY 4.0) License. See: http://creativecommons.org/ licenses/by/4.0/
REFERENCES
1. Association of American Medical Colleges (AAMC). Active Physicians with a U.S. Doctor of Medicine (U.S. MD) Degree by Specialty. 2015. Available at: https://www.aamc.org/data-reports/workforce/ interactive-data/active-physicians-us-doctor-medicine-us-md-degreespecialty-2015. Accessed April 3, 2021.
2. Rimmer A. Covid-19: Two fifths of doctors say pandemic has worsened their mental health. Br Med J. 2020;371:m4148.
3. Pappa S, Ntella V, Giannakas T, et al. Prevalence of depression, anxiety, and insomnia among healthcare workers during the COVID-19 pandemic: a systematic review and meta-analysis. Brain Behav Immun. 2020;88:901-7.
4. Dingel J, Patterson C, Vavra J. Childcare obligations will constrain many workers when reopening the US economy. 2020. Available at: https://bfi.uchicago.edu/wp-content/uploads/BFI_WP_202046.pdf Accessed April 3, 2021.
Western Journal of Emergency Medicine 682 Volume 23, no. 5: September 2022 Trends of Pandemic Parenting in Medical Academia Shah et al.
Trends of Pandemic Parenting in Medical Academia
5. Patrick SW, Henkhaus LE, Zickafoose JS, et al. Well-being of parents and children during the COVID-19 pandemic: a national survey. Pediatrics. 2020;146(4):e2020016824.
6. U.S. Chamber of Commerce Foundation. Piecing Together Solutions: Working Parents, Childcare, and COVID-19. 2020. Available at: https://www.uschamberfoundation.org/sites/default/files/mediauploads/EarlyEd_Minis_Report1_FINAL_081120_appndx%20 %28002%29.pdf Accessed April 3, 2021.
7. Pew Research Center. Modern Parenthood - Roles of Moms and Dads Converge as They Balance Work and Family. Chapter 5: Americans’ Time at Paid Work, Housework, Child Care, 1965 to 2011. 2013. Available at: https://www.pewresearch.org/ social-trends/2013/03/14/chapter-5-americans-time-at-paid-workhousework-child-care-1965-to-2011/. Accessed April 3, 2021.
8. Jolly S, Griffith KA, DeCastro R, et al. Gender differences in time spent on parenting and domestic responsibilities by high-achieving young physician-researchers. Ann Intern Med. 2014;160(5):344-53.
9. Madgavkar M, Krishnan M, White O, et al COVID-19 and gender equality: countering the regressive effects. 2020. Available at: https:// www.mckinsey.com/featured-insights/future-of-work/covid-19-andgender-equality-countering-the-regressive-effects# Accessed April 3, 2021.
10. McKinsey and Company. Women in the Workplace. 2020. Available at: https://wiw-report.s3.amazonaws.com/Women_in_the_ Workplace_2020.pdf. Accessed April 3, 2021
11. Edwards KA. Women are leaving the labor force in record numbers. 2020. Available at: https://www.rand.org/blog/2020/11/women-areleaving-the-labor-force-in-record-numbers.html Accessed April 3, 2021.
12. Kaiser Family Foundation. Professionally Active Physicians by Gender. 2020. Available at: https://www.kff.org/other/state-indicator/ physicians-by-gender/?dataView=1¤tTimeframe=0&selectedDi stributions=female&sortModel=%7B%22colId%22:%22Location%22, %22sort%22:%22asc%22%7D Accessed April 3, 2021.
13. Tawfik DS, Profit J, Morgenthaler TI, et al. Physician burnout, wellbeing, and work unit safety grades in relationship to reported medical errors. Mayo Clin Proc. 2018;93(11):1571-80.
14. Washington Post – Kaiser Family Foundation. KFF and Washington Post Frontline Healthcare Workers Survey. 2021. Available at: https:// www.washingtonpost.com/context/washington-post-kff-frontlinehealth-care-workers-survey-feb-11-march-7-2021/ba15a233-949547a9-9cdd-e7fa1578b1ca/. Accessed April 22, 2021.
Volume 23, no. 5: September 2022 683 Western Journal of Emergency Medicine Shah et al.
Stage-of-change Assessment Predicts Short-term Treatment Engagement for Opioid Use Disorder Patients Initiated on Buprenorphine
Quentin Reuter, MD*‡
Gregory L. Larkin, MD*
Michael Dubé
Suman Vellanki, MD†
Amanda Dos Santos, MD*‡
Jamie McKinnon, MBA, RN†
Nicholas Jouriles, MD*‡
David Seaberg, MD*‡
Section Editor: Erin Dehon, PhD
* † ‡
Summa Health System, Department of Emergency Medicine, Akron, Ohio Summa Health System, Department of Psychiatry, Akron, Ohio US Acute Care Solutions, Canton, Ohio
Submission history: Submitted May 12, 2021; Revision received March 16, 2022; Accepted March 30, 2022
Electronically published June 29, 2022
Full text available through open access at http://escholarship.org/uc/uciem_westjem DOI: 10.5811/westjem.2022.3.53197
Introduction: The emergency department (ED) is an effective setting for initiating medication for opioid use disorder (MOUD); however, predicting who will remain in treatment remains a central challenge. We hypothesize that baseline stage-of-change (SOC) assessment is associated with short-term treatment retention outcomes.
Methods: This is a longitudinal cohort study of all patients enrolled in an ED MOUD program over 12 months. Eligible and willing patients were treated with buprenorphine at baseline and had addiction medicine specialist follow-up arranged. Treatment retention at 30 and 90 days was determined by review of the Prescription Drug Monitoring Program. We used uni- and multivariate logistic regression to evaluate associations between patient variables and treatment retention at 30 and 90 days.
Results: From June 2018–May 2019, 279 patients were enrolled in the ED MOUD program. Of those patients 151 (54.1%) and 120 (43.0%) remained engaged in MOUD treatment at 30 and 90 days, respectively. The odds of treatment adherence at 30 days were significantly higher for those with advanced SOC (preparation/action/maintenance) compared to those presenting with limited SOC (precontemplation/contemplation) (60.0% vs 40.8%; odds ratio 2.18; 95% confidence interval 1.15 to 4.1; P <0.05). At 30 days, multivariate logistic regression determined that advanced SOC, age >40, having medical insurance, and being employed were significant predictors of continued treatment adherence. At 90 days, advanced SOC, non-White race, age > 40, and having insurance were all significantly associated with higher likelihood of treatment engagement.
Conclusion: Greater stage-of-change was significantly associated with MOUD treatment retention at 30 and 90 days post index ED visit. [West J Emerg Med. 2022;23(5)684–692.]
INTRODUCTION
The opioid epidemic currently claims more than 180 lives per day in the United States, with deaths topping over 46,000 in 2018.1-6 Due to the mounting societal, economic, and health consequences, the opioid epidemic was declared a national public health emergency in 2017.7 Despite national awareness
for this growing emergency, the majority of patients with opioid use disorder (OUD) don’t have access to addiction medicine services.8
For patients with OUD, the emergency department (ED) represents a critical access point for receiving medical care and, thus, an important opportunity to reach OUD patients.
Western Journal of Emergency Medicine 684 Volume 23, no. 5: September 2022 Original Research
Medication for opioid use disorder (MOUD) has been shown to decrease mortality, reduce overdoses, increase treatment retention, and decrease the costs associated with addressing the opioid epidemic.9-15 Further research, including work done by the authors, has described the implementation and short-term results of other ED-initiated MOUD programs.16-19 Despite these efforts, treatment retention remains a significant challenge to successfully initiating MOUD from the ED. For example, D’Onofrio et al reported encouraging 30-day treatment retention outcomes in a well-resourced academic medical center program, but these rates fell to less than 50% at 6 and 12 months.20 Other ED-initiated MOUD programs show an even greater decline in treatment retention after the initial 30-day follow-up period.16-19
Predicting who will remain in MOUD treatment continues to be a vexing challenge for the medical system. Various patient characteristics have been reported to predict MOUD treatment success, albeit many of these associations are inconsistent across the literature. Younger age, male gender, Black ethnicity, concomi-tant substance use disorders (SUD), hepatitis C, previous opioid overdoses, homelessness, unemployment, and criminal activity have all been associated with higher rates of treatment failure.21-28 Despite these reports, no data exists regarding predictive characteristics for MOUD treatment success in ED populations.
The transtheoretical model, also known as stage-ofchange (SOC), was developed decades ago by Prochaska and DiClemente to better assess a patient’s willingness to address high-risk behaviors and has shown predictive value across numerous settings including stress management, medication adherence, psychotherapy, weight management, and SUD.29-36 The SOC is assessed by addiction medicine professionals via in-depth interviews discerning a patient’s desire for recovery, level of self-awareness, and exhibited actions toward addiction recovery. Assessment of a patient’s readiness for recovery from SUD using SOC has never been studied in ED OUD patients.
Against this background, the objective of this study was to examine the association of SOC to predict treatment retention at 30 and 90 days for patients enrolled in a community hospital-based ED-initiated MOUD treatment program.
METHODS
Study Design
This is a prospective observational study of patients enrolled in MOUD from the ED. As MOUD is viewed as standard of care, this study was reviewed and received an exemption from the institutional review board.
Study Setting and Population
Participants were enrolled at one community hospital with over 33,000 annual ED visits over a 12-month period (June 2018–May 2019). Patients >18 years old were eligible for enrollment if they had OUD and a positive clinical opioid
Population Health Research Capsule
What do we already know about this issue?
Emergency department-initiated medication for opioid use disorder (MOUD) is a safe and effective treatment modality for opioid use disorder.
What was the research question? Does stage-of-change (SOC) assessment predict 30- and 90-day treatment retention in ED patients started on MOUD?
What was the major finding of the study?
Patients with advanced SOC were 2.18 times more likely to be in treatment at 30 and 90 days compared to MOUD patients with limited pre-contemplation.
How does this improve population health?
Assessment for SOC can help identify ED MOUD patients at high risk for treatment failure and thus guide more aggressive interventions.
withdrawal score (COWS) of ≥ 8 as measured by an ED nurse and verified by an emergency physician. Patients were identified either by self-referral or by physician/nursing identification.
Patients who were already established in a SUD treatment program, including those who tested positive for methadone or who had a history of methadone use on their Ohio Prescription Drug Monitoring Program (PDMP) report, were excluded and referred back to their treatment program. Pregnant patients were not enrolled but rather were transferred to high-risk maternal fetal medicine for further management. We also excluded all patients requiring admission to the hospital. Patients who did not clinically qualify for MOUD were evaluated by the addiction care coordinator (ACC) and provided a referral to a clinically appropriate treatment option.
Data including patient demographics, SOC level, confidence in ability to quit, and COWS score were collected and documented in the medical record by the ACC during the ED visit. Patients’ SOC was assessed via in-depth ACC interviews with them to discern their readiness for change. For example, patients in denial or who were unaware of their addiction would be considered to be in the “precontemplation” phase. Patients experimenting with small behavioral changes and collecting information about recovery services are generally deemed to be in “preparation” phase. Finally, individuals demonstrating direct actions, such as seeking out addiction medicine services, were considered to be in the “action” phase.
Volume 23, no. 5: September 2022 685 Western Journal of Emergency Medicine Reuter et al. Short-term Treatment Engagement for Patients Initiated on Buprenorphine
Study Protocol
All patients who met inclusion criteria were evaluated and medically cleared by the emergency physician or advance practice provider. Initial Emergency Medical Treatment and Active Labor Act screening was similar to that performed on any other ED patient but additionally, per protocol, included complete blood counts, comprehensive metabolic panel including liver function tests, ethanol level, pregnancy test if indicated, and urine drug screening.
After the patient completed the medical screening exam, they were seen by the ACC, a nurse with specialized training in addiction medicine. The ACC conducted a thorough interview with eligible patients and evaluated each criterion of the American Society of Addiction Medicine (ASAM) sixdimension assessment. The ASAM six-dimension assessment evaluates a patient’s acute intoxication and/or withdrawal potential, biomedical conditions, emotion/behavioral/cognitive conditions, readiness to change, relapse potential, and living environment. Each of the six dimensions is assigned a risk rating to help identify the greatest barriers to recovery and formulate a treatment plan. After the patient was first introduced to the idea of addiction recovery, the ACC then provided the patient with personalized feedback, attempted to enhance patient motivation, and finally negotiated and advised on a specific treatment plan. The ACC used motivational interviewing to help patients explore their understanding, desire, and barriers to positive behavior change.
The SOC was also assessed via an extensive interview to elicit the patient’s desire for recovery, motivations behind seeking treatment, and actions planned or already taken to rehabilitate. Based on these factors, a patient was assigned a specific SOC. If the patient was eligible, the ACC directly connected the patient with an addiction medicine referral and reviewed and ensured the patient’s eligibility for addiction services and insurance clearance, as well as helped arrange transportation. If a patient’s COWS score was <8, the ACC still evaluated the patient, provided addiction medicine education and counseling. The patient was instructed to return to the ED later that day or the next for induction into the program.
If a patient was deemed eligible, and consented to enrollment in the MOUD program, treatment with buprenorphine was initiated during the index ED visit. Treatment consisted of buprenorphine 8 milligrams (mg)/2mg for one dose followed by two hours of observation. If their repeat COWS score at two hours was still >8, the patient received a second dose of buprenorphine. Once the patient’s withdrawal symptoms were controlled, they were observed for approximately 1.5 hours and discharged.
Urgent outpatient addiction medicine follow-up was arranged by the ACC. This follow-up included office-based opioid treatment for buprenorphine management and an intensive outpatient program for counseling.
The MOUD program was staffed by four ACC nurses with a total of 2.2 full-time equivalents (FTE). Our program
coordinator, at 0.25 FTE, was also required to organize training, monitor data collection, and complete administrative tasks. Education for the ACCs consisted of 18 hours of instruction covering topics in addiction, stigma, MOUD treatment modalities, SBIRT (Screening, Brief Intervention and Referral to Treatment), harm reduction, and peer support. In total, costs for salary and benefits for administrative and ACC personnel, as well as their training, was $246,616/year.
Measures
Baseline patient demographics including age, gender, race/ethnicity, and medical and/or psychiatric comorbidities at the time of MOUD induction were collected via chart review. At the index visit the ACC assessed and recorded the patient’s COWS, highest level of education, insurance status, employment type, SUD type, tobacco use, pregnancy status, baseline SOC, marital status, financial and legal concerns, residence type, and spirituality. These data elements were extracted via chart review. Using the PDMP, we assessed treatment retention at 30 and 90 days. Treatment retention was defined as patients receiving regular buprenorphine/naloxone prescriptions at 30 and 90 days from index ED visit date.
Regarding chart review methodology, the abstractors included four physicians involved in the evaluation of the MOUD project. These abstractors were not blinded to the hypothesis. Prior to data extraction, the abstractors were adequately trained in the chart review methodology, including data element identification. Standardized abstraction forms were used, and any missing data was identified as such. We conducted duplicate chart review assessments to help ensure accurate data extraction.
Data Analysis
The primary outcome of interest was the association of patient baseline SOC and engagement in treatment measured at 30 and 90 days post index ED visit. Secondary outcomes included associations of patient demographic factors and treatment retention at 30 and 90 days. We determined univariate differences of proportion using Fisher’s exact test. Candidate covariates were screened at the P ≤ 0.1 level of significance. Multivariate models were run on the field of candidate variables using backward stepwise logistic regression to evaluate the strength of association between patient variables and treatment retention at 30 and 90 days. Variables were retained in the model if significant at the P < 0.05 level. We conducted all analyses using SPSS Statistics version 27 (IBM Corp., Armonk, NY).
RESULTS
From June 2018–May 2019 the ACCs evaluated patients during 691 visits, screened 571 unique patients, and enrolled 279 patients in the ED MOUD program (Figure). Of the patients enrolled, 196 (70.3%) were male, and ages ranged from 18-74, with 193 (69.2%) being younger that 40 years
Western Journal of Emergency Medicine 686 Volume 23, no. 5: September 2022 Short-term Treatment Engagement for Patients Initiated on Buprenorphine Reuter et al.
Figure 1 Patient enrollment and retention in a medication for opioid use disorder program at 30 and 90 days.
old. Ethnicity mirrored that of the surrounding community and was largely White: 253 (90.7%). Only 85 (31.8%) had education beyond high school or GED, 148 (53.6%) were unemployed, and 54 (19.6%) were self-pay. A total of 180 (70%) reported financial concerns, 42 (16.1%) were married, 171 (66.5%) reported having children, and 46 (16.5%) were undomiciled (Table). The average ED length of stay for the 279 patients enrolled in the MOUD program was 283 minutes.
At 30 days post ED enrollment, 151 (54.1%) of the patients enrolled in the MOUD program were engaged in treatment (Figure), The odds of treatment adherence at 30 days were significantly higher for those with advanced SOC (preparation/action/maintenance) compared to those presenting with limited SOC (precontemplation/ contemplation) (60.0% vs 40.8%; odds ratio [OR] 2.18; 95% confidence interval [CI] 1.15 to 4.1; P <0.05). Multivariate logistic regression determined that younger age (<40 years; OR 0.52; 95% CI, 0.28-0.98; P <0.01) and being uninsured (OR 0.29; 95% CI 0.14-0.58; P <0.01) were significant risk factors for disengagement at 30 days while both advanced SOC (OR 2.4; 95% CI 1.2-4.7; P <0.05) and baseline employment (OR 1.9; 95% CI 1.06-3.4; P <0.01) were significant predictors of continued treatment adherence.
At 90 days post enrollment, 120 (43.0%) patients were engaged in treatment (Figure 1). Advanced SOC (OR 2.65; 95% CI 1.3-5.5; P <0.01), non-White race (OR 2.7; 95% CI 1.02-7.1; P <0.05), age > 40 (OR 2.2; 95% CI 1.2-3.9; P <0.01), and having insurance (OR 2.56; 95% CI,1.26-5.2; P <0.01) were all retained in the multivariate logistic regression model and associated with significantly higher likelihood of treatment engagement at 90 days. Self-reported confidence in ability to quit, gender, having children, mental health
ED, emergency department.
Total patient visits assessed by Addiction Care Coordinator (ACC) 691
Unique patients 571
Repeated ED visits excluded 120
Patients declined or met exclusion criteria 292 (51.1%)
Index Enrollments 279 (48.9%)
Did not attend first appointment 69 (24.7%)
Attended first appointment 210 (75.3%)
Treatment engagement 30 days 151 (54.1%)
Not enrolled at 30 days 128 (45.9%) Not enrolled at 90 days 159 (57.0%)
Treatment engagement 90 days 120 (43.0%)
Figure. Patient enrollment and retention in a medication for opioid use disorder program at 30 and 90 days. ED, emergency department.
Table. 30-day and 3-month treatment retention rates related to various patient factors.
Patient variables
Gender
Enrollment status over time
N (%) Retention at 30 days n (%) Retention at 90 Days n (%)
Male 196 (70.3) 101(51.5) 80(40.8)
Female 83 (29.7) 50 (60.2) 40(48.2)
Age (years) Mean (SEM): 36.7 (0.66) Range: 18-67
Mean age (SEM) Enrolled: yes vs no 38.9(0.95) v. 34(0.85)** 39.7(1.1) v. 34.3(0.77)**
< 40 years 193 (69.2) 92 (47.7)** 72 (37.3)**
≥ 40 years 86 (30.8) 59 (68.6) 48 (55.8)
Race
White 253 (90.7) 134 (53) 105(41.5)*
Other 26 (9.3) 17 (65.4) 15 (57.7)
*= P <0.05; **= P <0.01. SEM, standard error of mean; GED, general education development; PTSD, post-traumatic stress disorder; psych, psychiatric.
Volume 23, no. 5: September 2022 687 Western Journal of Emergency Medicine Reuter et al. Short-term Treatment Engagement for Patients Initiated on Buprenorphine
Table. Continued.
Education
Patient variables Enrollment status over time N (%) Retention at 30 days n (%) Retention at 90 Days n (%)
Lower (High school/GED or less) 182 (68.2) 95 (52.2) 71 (39)
>Post high school education 85 (31.8) 52 (61.2) 45 (52.9)
Employment
Unemployed 148 (53.6) 68 (45.9)** 56 (37.8)
Employed 128 (46.4) 82 (64.1) 63 (49.2)
Insurance status
Insured 225 (80.6) 133 (59.1) 107 (47.6)
Self-pay 54 (19.4) 18 (33.3)** 13 (24.1)**
Psychiatric comorbidities
Depression 76 (27.2) 44 (57.9) 38 (50)
Anxiety/PTSD 74 (26.5) 42 (56.8) 35 (47.3)
Bipolar 31 (11.1) 16 (51.6) 14 (45.2)
Schizophrenia 10 (3.6) 3 (30) 3 (30)
History of suicide attempt 5 (1.8) 1 (20) 1 (20)
Any psych comorbidity 118 (42.3) 8 (57.6) 56 (47.5)
No psych comorbidity 161 (57.7) 83 (51.6) 64 (39.8)
Social demographics
Married 42 (16.1) 29 (69) 20 (47.6)
Unmarried 219 (83.9) 117 (53.4) 94 (42.9)
Children 171 (66.5) 102 (59.6) 76(44.4)
No children 86 (33) 43 (50) 36 (41.9)
Legal concerns 78 (30.4) 36 (46.2)* 31 (39.7)
No legal concerns 179 (69.6) 108 (60.3) 81 (45.3)
Financial concerns 180 (70) 95 (52.8) 70 (38.9)*
No financial concerns 77 (30.0) 49 (63.6) 42 (54.5)
Homeless 46 (16.5) 16 (34.8)** 16 (34.8)
Domiciled 233 (83.5) 135 (57.9) 104 (44.6)
Confidence in ability to quit
Less confidence 97 (39.6) 52 (53.6) 41 (42.3)
Extremely confidence (10/10) 148 (60.4) 86 (58.1) 66 (44.6) Stage of change
Precontemplation 2 (1) 0 0
Contemplation 47 (18.5) 20 (42.6)* 13 (27.7)*
Preparation 99 (39.0) 56 (56.6) 49 (49.5)
Action 96 (37.8 60 (62.5) 44 (45.8)
Maintenance 10 (3.9) 7 (70) 5 (50)
Limited stage of change: Pre-contemplation/contemplation 49 (19.3) 20 (40.8)* 13 (26.5)**
Advanced stage of change Preparation/action/maintenance 205 (80.7) 123 (60) 98 (47.8)
TOTAL 279 (100) 151 (54.1) 120 (43)
*= P <0.05; **= P <0.01.
SEM, standard error of mean; GED, general education development; PTSD, post-traumatic stress disorder; psych, psychiatric.
Western Journal of Emergency Medicine 688 Volume 23, no. 5: September 2022 Short-term Treatment Engagement for Patients Initiated on Buprenorphine Reuter et al.
comorbidities, and presenting to ED with an overdose were not significantly associated with staying in treatment at either 30 or 90 days.
DISCUSSION
This longitudinal cohort study of patients enrolled in an ED-initiated MOUD program describes 30- and 90day treatment retention outcomes. We also describe the factors associated with treatment retention– importantly advanced SOC. Our patient population was generally poor and underinsured with over half being unemployed, nearly 20% being self-pay, and 70% reporting financial concerns. Demographic factors associated with treatment retention included age >40, having medical insurance, and being employed. Interestingly, advanced SOC was also associated with higher levels of treatment retention at 30 and 90 days, while patient-reported level of confidence in ability to quit was not.
The ED represents our healthcare system’s safety net and cares for patients with SUD on a frequent basis. Broadly deploying evidence-based treatment strategies in EDs, such as MOUD, is a vital strategy for combating the opioid epidemic. Prior to the implementation of the MOUD program, our ED clinicians had relatively little to offer OUD patients that directly addressed their underlying addiction. While anecdotal, we believe that by using MOUD, we have begun to rebuild trust between OUD patients and the medical system. A once generally negative relationship between OUD patients and our ED staff has been replaced with a hopeful rapport, confident that recovery for these patients is a distinct possibility. This therapeutic relationship con-tinues to grow and we believe will lead to long-term sustained recovery for many of our OUD patients in the surrounding community.
The predictive utility of SOC assessment in patients with SUD has produced inconclusive results.35-41 Regarding ED patients with SUD specifically, we found no literature to date that describes the utility of assessing SOC in this population. Of the mixed results in the literature, numerous publications have provided positive evidence for SOC assessment in SUD patients. Henderson et al found the ability of SOC to predict treatment outcomes in patients receiving buprenorphine for OUD was nearly statistically significant.35 In adolescents admitted to a 28-day residential treatment program for alcohol, marijuana, cocaine, and amphetamine use disorder, Callaghan et al reported less advanced SOC to be predictive of treatment dropouts.38 DiClemente found SOC was predictive of alcohol use disorder recovery outcomes at 12 months.42 Our work further validates the utility of SOC assessment in SUD patients, specifically in ED patients with OUD.
Other research has been unsuccessful in reproducing these positive findings relating SOC to SUD treatment outcomes. Siegal et al failed to show a relationship between SOC and treatment retention in veterans with cocaine use disorder undergoing a month of residential treatment.43
Similarly, Gossop et al found no association between initial SOC and self-reported opioid and stimulant use at one year post induction in a large patient cohort of 1075 patients with SUD. 40
Our work differs from these studies in numerous ways. Our patient population consists of community ED patients with OUD, rather than other primary SUDs in various other clinical settings. It is possible the ED OUD population represents a particularly motivated group of patients urgently seeking recovery services, and thus SOC assessment at their initial evaluation is more predictive of treatment retention. Furthermore, our intervention consisted of outpatient treatment with agonist therapy rather than inpatient and residential interventions. It may be more useful to measure SOC in the outpatient arena as compared to inpatient programs, which use more intensive treatment interventions that may override the impact of a patient’s initial readiness to change. Moreover, our outcomes are not reported by patients but rather defined as patients receiving agonist therapy from an addiction medicine clinician, strengthening the validity that SOC has predictive utility. Finally, it would be difficult to show a link between a single SOC assessment and outcomes 12 months later, as the Gossop paper attempted to evaluate.
Our results suggest that evaluating SOC at baseline may help identify patients more and less likely to remain in treatment and thus could offer innovative opportunities to tailor care to this population. More intensive resources, closer monitoring, and more frequent interactions with medical care could be used to improve treatment retention in patients with less advanced SOC. Conversely, patients with advanced SOC may represent a patient population truly committed to overcoming the challenges of OUD and may warrant additional resources to address social and monetary barriers to recovery. While more work is needed to verify the utility of SOC in this setting, we believe our findings represent an exciting and novel avenue for delivering personalized care to ED patients with OUD.
Interestingly, SOC was predictive of a patient’s ability to stay in recovery, while a patient’s self-reported confidence in their ability to quit was not. An antonym of false self-assurance is self-effacement or humility. Post et al describe the importance of patient humility on their ability to successfully navigate recovery in the Alcoholics Anonymous (AA) program.44 Step One in AA is “We admitted we were powerless over alcohol—that our lives had become unmanageable.” One’s ability to accept some level of powerlessness and fully embrace the coming struggle and need for assistance on their journey to sobriety represents a self-aware and open mindset that can optimize one’s chance for success. Future research is needed to confirm whether a denial of powerlessness or over-confidence in one’s ability to quit represents a lack of humility and thus leads to a higher risk of recidivism.
Volume 23, no. 5: September 2022 689 Western Journal of Emergency Medicine Reuter et al. Short-term Treatment Engagement for Patients Initiated on Buprenorphine
LIMITATIONS
There are various limitations to our study. First, our work is a prospective observational study, and as such there was no control group or randomization. Our study population was from a single community hospital and may not be generalizable to other clinical settings. The ACCs are specially trained nursing staff with an expertise in addiction medicine and were vital to the success of the program. While it may not be feasible for every community hospital to create ACC positions, assessing SOC in OUD patients is a relatively simple process and may be automated as well. We used four different data extractors and didn’t complete duplicate chart reviews for the vast majority of the patients. To help ensure consistent data collection, however, we used a standardized data extraction form and performed a limited number of duplicate chart reviews. Using the PDMP may have undercounted the number of patients still engaged in treatment as it may not have revealed individuals receiving treatment from inpatient and day programs.
We were significantly limited by the number of patients in groups “pre-contemplation” and “maintenance” (2 and 10 patients, respectively). Thus, we needed to dichotomize the SOC assessment to conduct a meaningful statistical analysis, which was a novel SOC application and may not be generalizable. Finally, given the limited data on the factors associated with MOUD retention in ED populations, we decided to evaluate all variables collected by the ACC at time of enrollment using our multivariate model rather than examining independent variables with a plausible role in a sequential process. We felt this would prevent us from cherrypicking potential variables and result in an assessment of our specific patient population that was relatively free from bias.
CONCLUSION
Predicting who will remain in treatment is a central challenge in caring for ED patients initiated on medications for opioid use disorder. Advanced state of change was sig nificantly associated with MOUD treatment retention at 30 and 90 days, while self-reported confidence in one’s ability to quit was not associated with treatment adherence. Future work should validate the SOC risk metric in this patient population and determine methods to help nudge patients from pre-contemplation/contemplation to action. Capturing SOC data may allow for more tailored treatment of patients at highest risk of disengagement and overall non-adherence.
ACKNOWLEDGMENTS
The authors would like to acknowledge Dr. Joseph Varley, Dr. Jay Patel, Dr. Jordan Miller, the ACC nursing team (Kayla Akin, Shannon Brown, Jessica France, Angel Hill, Lindsay McKinnon, LaVita Miller, Michael Slater, Brenda Weltlich), and Nicoleta Stoicea for their help in the preparation of this manuscript.
Address for Correspondence: Quentin R. Reuter, MD, Summa Health, Department of Emergency Medicine, 151 N Forge St, Akron, OH 44304. Email: reuterq@usacs.com.
Conflicts of Interest: By the WestJEM article submission agreement, all authors are required to disclose all affiliations, funding sources and financial or management relationships that could be perceived as potential sources of bias. No author has professional or financial relationships with any companies that are relevant to this study. There are no conflicts of interest to declare. This project received funds from two grants, one from the Ohio Department of Mental Health and Addiction Services (OhioMHAS) and one from the United Way of Summit County (UWSC). Summa Health System was the awardee of these funds, with CEO Dr. T. Clifford Deveny listed as the executive director and Jaimie McKinnon listed as the principal investigator. The Addiction Care Coordinator position was funded by the OhioMHAS and the UWSC funds. The UWSC also helped fund the peer recovery service coaches. These funding sources were also used to provide assistance with patient transportation, sober housing, childcare during appointments, and a cellphone for patients to help manage appointments and transportation.
Copyright: © 2022 Reuter et al. This is an open access article distributed in accordance with the terms of the Creative Commons Attribution (CC BY 4.0) License. See: http://creativecommons.org/ licenses/by/4.0/
REFERENCES
1. Centers for Disease Control and Prevention. National vital statistics system mortality data. 2015. Available at: http:// wwwcdcgov/nchs/deathshtm3. Accessed March 22, 2021.
2. Centers for Disease Control and Prevention. Vital signs: today’s heroin epidemic. 2015. Available at: http://wondercdcgov/wonder/ help/mcdhtml. Accessed March 22, 2021.
3. Centers for Disease Control and Prevention. QuickStats: Rates of deaths from drug poisoning and drug poisoning involving opioid analgesics — United States, 1999–2013. 2015. Available at: http:// wwwcdcgov/mmwr/preview/mmwrhtml/mm6401a10htm4 2015. Accessed March 22, 2021.
4. Scholl L, Seth P, Kariisa M, et al. Drug and opioid-involved overdose deaths - United States, 2013-2017. MMWR Morb Mortal Wkly Rep. 2018;67(5152):1419-27.
5. National Institute on Drug Abuse. Overdose death rates. Available at: https://nida.nih.gov/drug-topics/trends-statistics/overdosedeath-rates. Accessed April 2, 2021.
6. Wilson N, Kariisa M, Seth P, et al. Drug and opioid-involved overdose deaths - United States, 2017-2018 . MMWR Morb Mortal Wkly Rep . 2020;69(11):290-7.
7. Mercia D. Trump declares opioid epidemic national public health emergency. 2017. Available at: https://www.cnn. com/2017/10/26/politics/donald-trump-opioid-epidemic/index.html. Accessed April 3, 2021.
8. Volkow N, Koob G, McLellan A. Neurobiologic advances from the brain disease model of addiction. N Engl J Med. 2016;374(4):363-71.
Western Journal of Emergency Medicine 690 Volume 23, no. 5: September 2022 Short-term Treatment Engagement for Patients Initiated on Buprenorphine Reuter et al.
9. Mattick R, Breen C, Kimber J, et al. Buprenorphine maintenance versus placebo or methadone maintenance for opioid dependence. Cochrane Database Syst Rev. 2014;(3):CD002207.
10. Amato L, Minozzi S, Davoli M, et al. Psychosocial combined with agonist maintenance treatments versus agonist maintenance treatments alone for treatment of opioid dependence . Cochrane Database Syst Rev. 2011;(10):CD004147.
11. Sordo L, Barrio G, Bravo M, et al. Mortality risk during and after opioid substitution treatment: systematic review and meta-analysis of cohort studies. BMJ. 2017;357:j1550.
12. Schwartz R, Gryczynski J, O’Grady K, et al. Opioid agonist treatments and heroin overdose deaths in Baltimore, Maryland, 1995-2009. Am J Public Health. 2013;103(5):917-22.
13. Kimber J, Copeland L, Hickman M, et al. Survival and cessation in injecting drug users: prospective observational study of outcomes and effect of opiate substitution treatment. BMJ . 2010;341:c3172.
14. Pierce M, Bird S, Hickman M, et al. Impact of treatment for opioid dependence on fatal drug-related poisoning: a national cohort study in England. Addiction . 2016;111(2):298-308.
15. Corsi K. Opiate substitute treatment is associated with increased overall survival among injecting drug users. Evid Based Ment Health . 2010;13(4):111.
16. Bogan C, Jennings L, Haynes L, et al. Implementation of emergency department-initiated buprenorphine for opioid use disorder in a rural southern state. J Subst Abuse Treat 2020;112S:73-8.
17. Hu T, Snider-Adler M, Nijmeh L, et al. Buprenorphine/naloxone induction in a Canadian emergency department with rapid access to community-based addictions providers. CJEM. 2019;21(4):492-8.
18. Kaucher K, Caruso E, Sungar G, et al. Evaluation of an emergency department buprenorphine induction and medicationassisted treatment referral program . Am J Emerg Med 2020;38(2):300-4.
19. Reuter Q, Smith G, McKinnon J, et al. Successful medication for opioid use disorder (MOUD) program at a community hospital emergency department. Acad Emerg Med . 2020;27(11):1187-90.
20. D’Onofrio G, Chawarski M, O’Connor P, et al. Emergency department-initiated buprenorphine for opioid dependence with continuation in primary care: outcomes during and after intervention. J Gen Intern Med . 2017;32(6):660-6.
21. O’Connor A, Cousins G, Durand L, et al. Retention of patients in opioid substitution treatment: a systematic review. PLoS One 2020;15(5):e0232086.
22. Manhapra A, Agbese E, Leslie D, et al. Three-year retention in buprenorphine treatment for opioid use disorder among privately insured adults. Psychiatr Serv . 2018;69(7):768-76.
23. Manhapra A, Petrakis I, Rosenheck R. Three-year retention in buprenorphine treatment for opioid use disorder nationally in the Veterans Health Administration. Am J Addict . 2017;26(6):572-80.
24. Hser Y, Saxon A, Huang D, et al. Treatment retention among patients randomized to buprenorphine/naloxone compared to methadone in a multi-site trial. Addiction. 2014;109(1):79-87.
25. Weinstein Z, Kim H, Cheng D, et al. Long-term retention in office based opioid treatment with buprenorphine. J Subst Abuse Treat. 2017;74:65-70.
26. Samples H, Williams A, Olfson M, et al. Risk factors for discontinuation of buprenorphine treatment for opioid use disorders in a multi-state sample of Medicaid enrollees . J Subst Abuse Treat . 2018;95:9-17.
27. Kelly S, O’Grady K, Mitchell S, et al. Predictors of methadone treatment retention from a multi-site study: a survival analysis. Drug Alcohol Depend . 2011;117(2-3):170-5.
28. Heidebrecht F, MacLeod M, Dawkins L. Predictors of heroin abstinence in opiate substitution therapy in heroin-only users and dual users of heroin and crack. Addict Behav . 2018;77:210-6.
29. Evers K, Prochaska J, Johnson J, et al. A randomized clinical trial of a population- and transtheoretical model-based stressmanagement intervention. Health Psychol. 2006;25(4):521-9.
30. Johnson S, Driskell M, Johnson J, et al. Transtheoretical model intervention for adherence to lipid-lowering drugs. Dis Manag 2006;9(2):102-14.
31. Johnson S, Driskell M, Johnson J, et al. Efficacy of a transtheoretical model-based expert system for antihypertensive adherence. Dis Manag. 2006;9(5):291-301.
32. Johnson S, Paiva A, Cummins C, et al. Transtheoretical modelbased multiple behavior intervention for weight management: effectiveness on a population basis. Prev Med . 2008;46(3):238-46.
33. Levesque D, Van Marter D, Schneider R, et al. Randomized trial of a computer-tailored intervention for patients with depression. Am J Health Promot . 2011;26(2):77-89.
34. Velicer W, Redding C, Sun X, et al. Demographic variables, smoking variables, and outcome across five studies. Health Psychol. 2007;26(3):278-87.
35. Henderson M, Saules K, Galen L. The predictive validity of the University of Rhode Island change assessment questionnaire in a heroin-addicted polysubstance abuse sample. Psychol Addict Behav. 2004;18(2):106-12.
36. Norcross J, Krebs P, Prochaska J. Stages of change. J Clin Psychol. 2011;67(2):143-54.
37. Serafini K, Shipley L, Stewart D. Motivation and substance use outcomes among adolescents in a school-based intervention. Addict Behav . 2016;53:74-9.
38. Callaghan R, Hathaway A, Cunningham J, et al. Does stageof-change predict dropout in a culturally diverse sample of adolescents admitted to inpatient substance-abuse treatment? A test of the transtheoretical model. Addict Behav. 2005;30(9):183447.
39. Belding M, Iguchi M, Lamb R. Stages and processes of change as predictors of drug use among methadone maintenance patients. Exp Clin Psychopharmacol. 1997;5(1):65-73.
40. Gossop M, Stewart D, Marsden J. Readiness for change and drug use outcomes after treatment. Addiction. 2007;102(2):301-8.
41. Cady M, Winters K, Jordan D, et al. Motivation to change as a predictor of treatment outcome for adolescent substance abusers.
Volume 23, no. 5: September 2022 691 Western Journal of Emergency Medicine Reuter et al. Short-term Treatment Engagement for Patients Initiated on Buprenorphine
Short-term Treatment Engagement for Patients Initiated on Buprenorphine
Journal of Child & Adolescent Substance Abuse . 1996;5:73–91.
42. Carbonari J, DiClemente C. Using transtheoretical model profiles to differentiate levels of alcohol abstinence success. J Consult Clin Psychol. 2000;68(5):810-7.
43. Siegal H, Li L, Rapp R, et al. Measuring readiness for change
among crack cocaine users: a descriptive analysis. Subst Use Misuse. 2001;36(6-7):687-700.
44. Post S, Pagano M, Lee M, et al. Humility and 12-step recovery: a prolegomenon for the empirical investigation of a cardinal virtue in Alcoholics Anonymous. Alcohol Treat Q . 2016;34(3):262-73.
Western Journal of Emergency Medicine 692 Volume 23, no. 5: September 2022
Reuter et al.
#WhyIDoIt: A Multidisciplinary Wellness Initiative in an Academic Emergency Department
Nancy Jacobson, MD Riley Westein, MD Rachel Nordstrom, MD Alicia Pilarski, DO
Section Editor: David Lee, MD
Medical College of Wisconsin, Department of Emergency Medicine, Milwaukee, Wisconsin
Submission history: Submitted December 28, 2021; Revision received March 19, 2022; Accepted April 18, 2022
Electronically published August 10, 2022
Full text available through open access at http://escholarship.org/uc/uciem_westjem
DOI: 10.5811/westjem.2022.4.55813
Introduction: Healthcare clinicians in critical care settings such as the emergency department (ED) experience workplace stressors and are at high risk for burnout. This correlates with substance abuse, suicidality, career dissatisfaction, early retirement, and suboptimal patient care. Therefore, recognizing, and mitigating, burnout is critical to a healthcare worker’s health and wellbeing. While gratitude and positive psychology are shown to increase resilience and decrease burnout, no prior studies have examined specific ED care team motivators for continued career satisfaction and workplace engagement. To increase the wellness in our ED, we implemented a wellness initiative titled #WhyIDoIt. Our goal was to have all care team members share what motivates them to work in our ED.
Methods: Participants were asked what motivates them in the workplace. We gathered responses each February for three consecutive years, 2017-2019, at our academic Level I trauma center. Emergency department clinicians, nurses, and staff were recruited to participate at grand rounds, nursing huddles, and sign out. Participants self-selected to contribute by writing their response on a sticky note and posting it in the department. After three years of implementing this initiative, we analyzed the collected qualitative data using thematic analysis based on grounded theory. Submissions were subjectively categorized into initial themes and then reconciled into three overarching classifications.
Results: In total, we collected 149 responses. Themes included team work (35, 23.5%), pride in a unique skill set (26, 17.4%), helping patients in a time of need (26, 17.4%), teaching/learning opportunities (15,10.1%), humor and levity (14, 9.4%), building relationships with patients (11,7.4%), financial motivation (9, 6.0%), patient gratitude (7, 4.7%), and philosophical and moral motivators (6, 4.0%). These themes were reconciled into three overarching classifications including team-centered motivators (76, 51%), patient-centered motivators (37, 24.8%), and reward-centered motivators (36, 24.2%).
Conclusion: Responses that showed the greatest motivator for ED clinicians and nurses were team-centered. This highlights the importance of relationship building and a sense of shared purpose and suggests that future workplace well-being initiatives should include strengthening and maintaining professional team relationships. [West J Emerg Med. 2022;23(5)693–697.]
INTRODUCTION
Burnout is defined as a psychological syndrome with emotional exhaustion, depersonalization, and reduced
personal accomplishment.1 Less than 10 years after its initial definition, this concept was applied to the healthcare field. Emergency physicians (EP) are consistently exemplars of one
Volume 23, no. 5: September 2022 693 Western Journal of Emergency Medicine Original Research
of the most burned-out specialties.2 Additionally, 29-44% of emergency department (ED) nurses experience burnout.3,4 A growing body of literature identifies contributors to EP burnout. Shift work results in the loss of sleep and circadian rhythm. This has correlated to diminished personal wellbeing, decreased job satisfaction, and pitfalls in patient care. Workrelated factors include high intensity work, task switching, uncertainty, second victim syndrome, and patient and colleague disrespect.5 Emergency physicians fear litigation and face more malpractice claims than the average physician.6 While no specific study focuses on the prevalence or sources of burnout in ED care team members such as advanced practice providers, pharmacists, technicians, social workers, unit coordinators, or environmental services employees, these team members are exposed to many of the same burnout risks as EPs and ED nurses.
Burnout results in significant consequences. It correlates with an increase in medical errors, lower quality patient care, and decreased patient satisfaction.7 Emergency physicians experiencing burnout are more likely to reduce their work hours, pursue administrative positions, or leave healthcare completely.8,9 Rates of depression for EPs vary from 12.1–19.3%. This leads to increased substance abuse and suicidal ideation. It is estimated that 300-400 physicians die by suicide each year.2,5 While EPs clearly experience the consequences of burnout, other care team members experience consequences as well. Burnout in nurses correlates with ineffectiveness, depression, apathy, absenteeism, and attrition. As it does in physicians, burnout in nurses negatively impacts patient safety and patient satisfaction. Specific data on the consequences of burnout for other ED care team members does not exist; however, similar stressors are present throughout an entire healthcare team.
Due to the negative impacts of burnout on healthcare professionals, much effort has been dedicated to burnout mitigation. Prior research in this field has identified gratitude, team-based support, and resiliency as successful burnout mitigation techniques.10,11 Gratitude exercises, thankful events, and other motivational programs have been shown to increase enthusiasm and interest in patient care and alleviate depression.10 Teamwork initiatives consistently improve physician burnout and increase physician job satisfaction. Team-based efforts additionally minimize stress, improve peer-to-peer communication, and create a culture of appreciation, support, and engagement.11 Resiliency is the ability to adapt, rebound, and overcome adversity, and is a proven burnout mitigator. Mindfulness, gratitude, and positive psychology have been shown to increase resiliency and decrease burnout.
To date, research has not specifically aimed to identify protective motivating factors in the workplace for ED care team members. Our aim was to increase the wellbeing of our ED care team members and identify common workplace motivators. To achieve these objectives, we implemented a
Population Health Research Capsule
What do we already know about this issue?
Emergency department healthcare team members experience high rates of burnout, with downstream effects. Dedicated efforts have been made toward burnout mitigation.
What was the research question?
Identify workplace motivators of an ED healthcare team in a challenging clinical environment.
What was the major finding of the study?
The most frequent workplace motivator was team-centered (51%), followed by patient- and reward-centered motivators (25% each).
How does this improve population health?
Future efforts to improve healthcare team wellness should focus on proven workplace motivators. In the ED, team-based motivation is prevalent.
wellness initiative titled #WhyIDoIt. Our goal was to invite all care team members to share each day what inspires and motivates them to work in the challenging clinical environment of the ED.
METHODS
This was an observational study of a convenience sample of ED care team members, which took place during the month of February for three consecutive years, 20172019, at a Level I academic trauma center ED in a midsized midwestern city. All ED care team members were invited to participate regardless of team role, scope of practice, level of training, clinical experience, or full-time employment. Participants were asked what motivates them in the workplace. We recruited ED healthcare professionals (physicians, residents, nurse practitioners, and physician assistants) and staff (nurses, emergency technicians, social workers, health unit coordinators, pharmacists, security, environmental services, transportation, registration) to participate via e-mail and in person at grand rounds, nursing huddles, and sign out. Clinicians and staff were invited to participate as many times as they wished. Participants self-selected to contribute by writing their response(s) on a sticky note and posting it on a board in the department. Responses were either anonymous or identified at the submitter’s discretion.
Western Journal of Emergency Medicine 694 Volume 23, no. 5: September 2022 Multidisciplinary Wellness Initiative in an Academic Emergency Department Jacobson et al.
After three years of implementing this initiative, we analyzed the collected qualitative responses using thematic analysis. Most were submitted anonymously, without identifying information. For submission in which the participant included their name or role, this portion of the submission was disregarded during coding. Submissions were then analyzed and categorized into clusters of meaning by open coding. We assembled these clusters of meaning into initial themes and then reconciled them into three overarching classifications. The first year of submissions was coded in completion prior to coding the subsequent two years’ submissions. This allowed the addition of submissions until theoretical saturation was achieved. Coding was conducted by the authors of this study.
RESULTS
In total, we collected 149 responses. Themes included teamwork (n = 35, 23.5%); pride in a unique skill set (n = 26, 17.4%); helping patients in a time of need (n = 26, 17.4%); teaching/learning opportunities (n = 15, 10.1%); humor and levity (n =14, 9.4%); building relationships with patients (n = 11, 7.4%); financial motivation (n = 9, 6.0%); patient gratitude (n = 7, 4.7%); and philosophical and moral motivators (n = 6, 4.0%). These themes were reconciled into three overarching classifications including “team-centered motivators” (n = 76, 51%), “patient-centered motivators” (n = 37, 24.8%), and “reward-centered motivators” (n = 36, 24.2%). The figure illustrates the distribution of these themes.
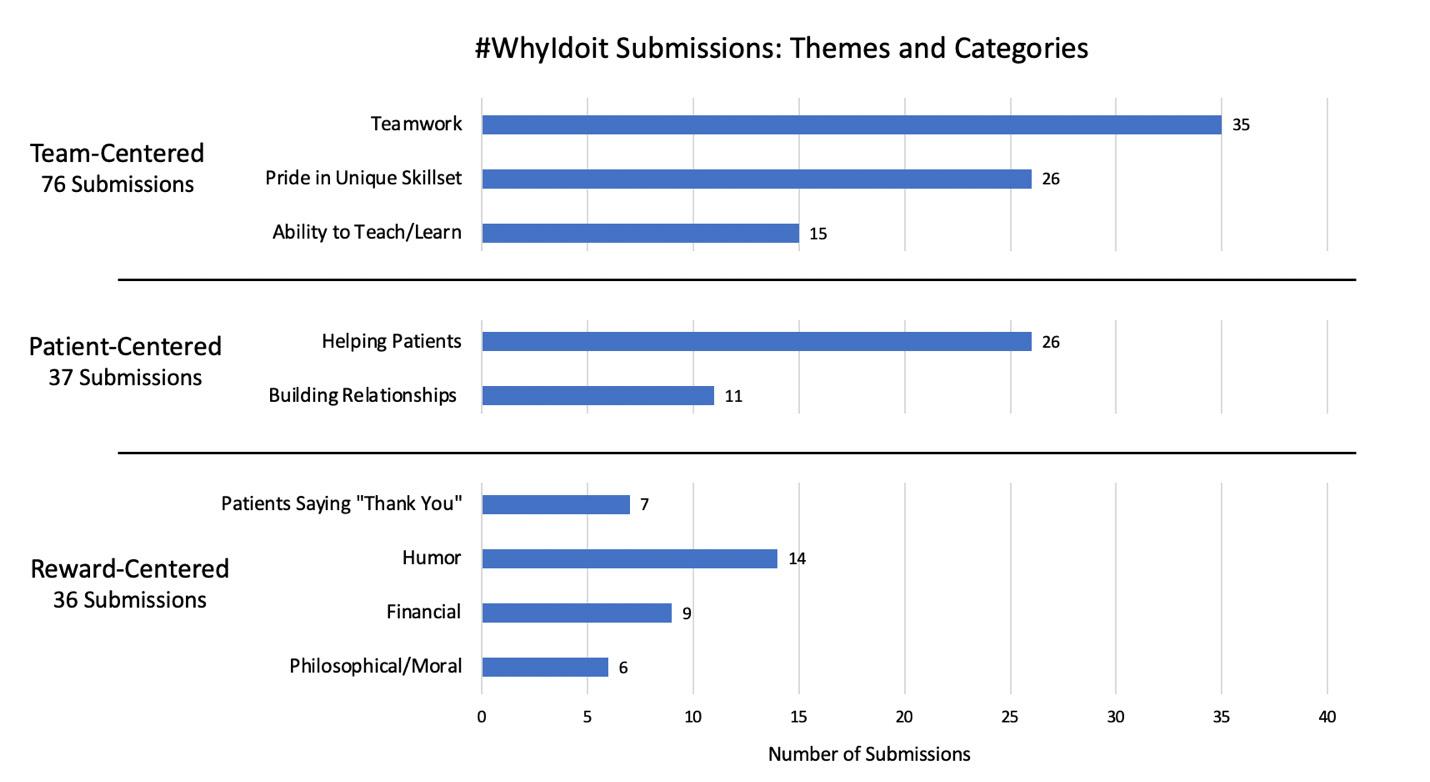
DISCUSSION
The most frequently referenced workplace motivators for ED care team members in the #WhyIDoIt initiative were team-centered. This confirms a growing body of literature demonstrating a strong correlation between both physician and nursing well-being and colleague support.
“I love the people and I am so blessed to work with brilliant minds both at the faculty level and staff level. It’s like a second family, and if I have to be here, it should be a warming and welcoming place and it most certainly is!”
“Because I love being part of such a great team!”
“Together we are amazing.”
“I get to work with some of the most amazing, supportive, and caring ED Staff.”
“Working with residents and realizing that the future of EM is bright. “
Colleague support not only improves well-being independently but can also mitigate burnout. Social support of colleagues is positively correlated with job satisfaction, wellbeing, and reducing job stress.11 Additionally, social belonging
Figure. Total number of #WhyIdoit submissions per theme for team-centered, patient-centered, and reward-centered categories.
Volume 23, no. 5: September 2022 695 Western Journal of Emergency Medicine Jacobson et al. Multidisciplinary Wellness Initiative in an Academic Emergency Department
was associated with well-being among surgical residents, and engagement in students in the STEM fields (medicine and all the biological sciences as well as mathematics, engineering, and computer science).12 Nursing well-being and compassion satisfaction are correlated with manager support.13 Nonetheless, clinical care in the modern era is increasingly isolating. Physicians spend more time in front of computers, with fewer in-person interactions with colleagues. The results of this study, within the context of the pre-existing literature, would suggest that future workplace initiatives to maintain and improve team relationships would be beneficial.
While the most common reason cited by physicians for choosing a career in medicine was to help patients, this comprised only 17.4% of total submissions in the #WhyIDoIt initiative as part of the patient-centered category.
“To add comfort to a person’s worst day.”
“Because I can make a difference in someone’s life.”
“I do this job for the people! Oh, and the great stories!”
Interestingly, prior research shows the strongest correlator with physician well-being is the physician-patient relationship.14 Significant positive and negative correlations are described, suggesting this relationship provides the most gratifying experiences but also causes emotional stress. Emergency physicians often do not have a longitudinal relationship with their patients and are faced with giving bad news or meeting patients under stressful circumstances. Additionally, the patients whom EPs help the most on any given shift are often the sickest and may not remember their ED encounter at all. This unique aspect of EM may impact the extent to which EPs are motivated by building a patient relationship.
The least frequently occurring workplace motivators were reward-centered. Healthcare professionals have previously been cited as contributing to their own lack of well-being by prioritizing work and patients over self-care.5
“When you get a sweet patient who thanks you for taking care of them.”
“When you have the patients that truly appreciate everything you do!”
“I do it for the little old ladies
who hold your hand and say thank you.”
Interestingly, only 24.2% of submissions mention personal reward as a workplace motivator. Most submissions are patient- or team-centered motivators, meaning most submitters are motivated by interpersonal relationships, or being of benefit to someone else. Perhaps this speaks to the altruism of professionals who pursue a career in healthcare “to help others.” Perhaps the “other” is not always the patient, but a colleague, a care team member, or trainee. This suggests that future efforts may be directed toward developing skillsets that empower care team members to support each other, such as pairing new trainees with mentors, teaching team building as a learned skill, developing peer support, or allowing time for team recognitions at clinician or staff meetings. The results of this study suggest that a care team member may experience motivation not only from receiving support from a peer but also giving support to others.
LIMITATIONS
Qualitative research is inherently subjective because the data analysis and interpretation is done by the research team. The research team for this study was comprised entirely of emergency medicine (EM)-trained physicians, while the convenience sample of study subjects included all care team members. Further, this initiative was performed at a Level I academic trauma center ED. This clinical practice environment may foster a greater team-centered approach, and some of the responses were related to working with EM residents and medical students. Consequently, generalizability to a non-academic setting may be limited. Additionally, the described wellness initiative was developed through the EM resident wellness committee. This may introduce a proclivity towards physician-centered thinking. However, messaging was sent via email by staff leadership, and participation was encouraged in staff meetings and department-wide huddles. Collaborating with respective staff leaders to message and encourage participation may have increased submissions from a variety of care team members.
Participants self-selected to participate in this wellness initiative and study. One may surmise that care team members who are burned out may be less likely to participate in workplace initiatives. Therefore, results may disproportionately represent the less burned-out members of the ED care team. This was mitigated by including #WhyIDoIt at physician, nursing, and other staff sign-outs. This may have prompted individuals to submit responses who were not otherwise internally motivated to participate.
CONCLUSION
Responses show the most frequent workplace motivators for ED care team members are team-centered. Meanwhile, reward-centered motivators were the least frequently
Western Journal of Emergency Medicine 696 Volume 23, no. 5: September 2022 Multidisciplinary Wellness Initiative in an Academic Emergency Department Jacobson et al.
Jacobson Wellness Initiative
mentioned. This highlights the importance of relationship building and a sense of shared purpose and suggests that future workplace well-being initiatives should include strengthening and maintaining professional team relationships.
Address for Correspondence: Riley Westein, MD, Medical College of Wisconsin, Hub for Collaborative Medicine, 8701 Watertown Plank Road, Milwaukee, Wisconsin 53226. Email: rwestein@mcw.edu
Conflicts of Interest: By the WestJEM article submission agreement, all authors are required to disclose all affiliations, funding sources and financial or management relationships that could be perceived as potential sources of bias. No author has professional or financial relationships with any companies that are relevant to this study. There are no conflicts of interest or sources of funding to declare.
Copyright: © 2022 Jacobson. This is an open access article distributed in accordance with the terms of the Creative Commons Attribution (CC BY 4.0) License. See: http://creativecommons.org/ licenses/by/4.0/
nurses: a systematic review and meta-analysis. Int Emerg Nurs 2018;39:46-54.
5. Stehman CR, Testo Z, Gershaw RS, et al. Burnout, drop out, suicide: physician loss in emergency medicine, Part I West J Emerg Med 2019;20(3):485-94.
6. Jena AB, Seabury S, Lakdawalla D, et al. Malpractice risk according to physician specialty. N Engl J Med. 2011;365(7):629-36.
7. Panagioti M, Panagopoulou E, Bower P, et al. Controlled interventions to reduce burnout in physicians: a systematic review and meta-analysis. JAMA Intern Med. 2017;177(2):195-205.
8. Landon BE, Reschovsky JD, Pham HH, et al. Leaving medicine: the consequences of physician dissatisfaction. Med Care 2006;44(3):234-42.
9. Page, L. Tired of medicine? 20 nonclinical career options. 2018. Available at: https://www.medscape.com/viewarticle/893481_4. Accessed on November 18, 2021.
10. Aryankhesal A, Mohammadibakhsh R, Hamidi Y, et al. Interventions on reducing burnout in physicians and nurses: a systematic review. Med J Islam Repub Iran. 2019;33:77.
11. DeChant PF, Acs A, Rhee KB, et al. Effect of organization-directed workplace interventions on physician burnout: a systematic review. Mayo Clin Proc Innov Qual Outcomes. 2019;3(4):384-408.
REFERENCES
1. Maslach C, Jackson SE. The measurement of experienced burnout. J Organ Behav. 1981;2(2):99-113.
2. De Hert S. Burnout in Healthcare Workers: Prevalence, Impact, and Preventative Strategies. Local and Regional Anesthesia. 2020;13:171-83.
3. Gómez-Urquiza JL, De la Fuente-Solana EI, Albendín-García L, et al. Prevalence of burnout syndrome in emergency nurses: a metaanalysis. Crit Care Nurse. 2017;37(5):e1-e9.
4. Li H, Cheng B, Zhu XP. Quantification of burnout in emergency
12. Salles A, Wright RC, Milam L, et al. Social belonging as a predictor of surgical resident well-being and attrition. J Surg Educ 2019;76(2):370-7.
13. Hunsaker S, Chen HC, Maughan D, et al. Factors that influence the development of compassion fatigue, burnout, and compassion satisfaction in emergency department nurses. J Nurs Scholarsh 2015;47(2):186-94.
14. Tak HJ, Curlin FA, Yoon JD. Association of intrinsic motivating factors and markers of physician well-being: a national physician survey. J Gen Intern Med. 2017;32(7):739-46.
Volume 23, no. 5: September 2022 697 Western Journal of Emergency Medicine
et al. Multidisciplinary
in an Academic Emergency Department
Original
The Accuracy of Sepsis Screening Score for Mortality Prediction at Emergency Department Triage
Karn Suttapanit, MD Sirasit Satiracharoenkul, MD Pitsucha Sanguanwit, MD Thidathit Prachanukool, MD
Section Editor: Stephen Liang, MD
Mahidol University, Faculty of Medicine Ramathibodi Hospital, Department of Emergency Medicine, Bangkok, Thailand
Submission history: Submitted March 14, 2022; Revision received June 15, 2022; Accepted June 20, 2022
Electronically published August 11, 2022
Full text available through open access at http://escholarship.org/uc/uciem_westjem DOI: 10.5811/westjem.2022.6.56754.
Introduction: Sepsis has a mortality rate of 10-40% worldwide. Many screening tools for sepsis prediction and for emergency department (ED) triage are controversial. This study compared the accuracy of the scores for predicting 28-day mortality in adult patients with sepsis in the triage area of the ED.
Methods: Adult patients who presented to the ED of a tertiary-care university hospital from January–December 2019 with an initial diagnosis of sepsis or other infection-related conditions were enrolled. We calculated predictive scores using information collected in the ED triage area. Prognostic accuracy was measured by the area under the receiver operating characteristic curve (AUROC) for predicting 28-day mortality as a primary outcome. The secondary outcomes included mechanical ventilation usage and vasopressor usage for 28 days.
Results: We analyzed a total of 550 patients. The 28-day mortality rate was 12.4% (n = 68). The 28-day mortality rate was best detected by the National Early Warning Score (NEWS) (AUROC = 0.770; 95% confidence interval [CI]: 0.705-0.835), followed by the quick Sequential Organ Failure Assessment (qSOFA) score (AUROC = 0.7473; 95% CI: 0.688-0.806), Search Out Severity (SOS) score (AUROC = 0.749; 95% CI: 0.685-0.815), Emergency Severity Index (ESI) triage (AUROC = 0.599; 95% CI: 0.542-0.656, and the Systemic Inflammatory Response System (SIRS) criteria (AUROC = 0.588; 95% CI: 0.522-0.654]). The NEWS also provided a higher AUROC and outperformed for 28-day mechanical ventilator usage and 28-day vasopressor usage.
Conclusion: The NEWS outperforms qSOFA, SOS, SIRS, and ESI triage in predicting 28-day mortality, mechanical ventilator, and vasopressor usage of a patient with sepsis who is seen at ED triage. [West J Emerg Med. 2022;23(5)698–705.]
INTRODUCTION
Sepsis is a clinical syndrome of life-threatening organ dysfunction caused by a dysregulated host response to infection.1 Over the past 30 years, sepsis has increasingly become an area of interest both in diagnosis and management because of its high mortality rate. Despite this increased focus, the mortality rate of sepsis is still high,2 averaging 39% worldwide.3 The Third International Consensus Definitions for Sepsis and Septic Shock (Sepsis-3) recommended the
application of the Sequential Organ Failure Assessment (SOFA) to identify organ dysfunction or failure in sepsis patients.1 When SOFA was compared with the original Systemic Inflammatory Response Syndrome (SIRS) criteria, SOFA outperformed SIRS in predicting hospital mortality. The consensus suggested quick sequential organ failure assessment (qSOFA) as a screening tool in patients who are likely to have sepsis; qSOFA was proven to offer predictive validity similar to SOFA.4
Western Journal of Emergency Medicine 698 Volume 23, no. 5: September 2022
Research
In 2016 the Surviving Sepsis campaign recommended the implementation of sepsis screening, which has been shown to improve outcomes and reduce the mortality rate.5 Many predictive scores, such as the National Early Warning Score (NEWS), were developed and implemented to detect deterioration in sepsis patients.4 These scores can be used as a general screening tool as well as an early warning tool in the emergency department (ED), guiding collaboration with other areas in the hospital and the patient care system. The Emergency Severity Index (ESI) triage tool is a five-level ED triage algorithm that provides clinically relevant stratification of patients from 1 (the most emergent priority) to 5 (the least urgent priority) based on acuity and resource needs.6. However, the ESI triage tool was not specifically designed for severity classification in sepsis patients. The Search Out Severity (SOS) score was the early sepsis score used in Thailand. It has been shown that the implementation of a combined SOS score for screening with a checklist for sepsis bundles could decrease the mortality rate in Thailand.2
This study compares the accuracy of qSOFA, NEWS, SOS, SIRS, and ESI triage for predicting 28-day mortality in adult patients with sepsis, with the goal of designing an appropriate screening tool for use in the ED triage area.
METHODS
Study Design and Setting
This was a retrospective cross-sectional study. We collected data in the ED of a tertiary-care university hospital, between January–December 2019. The study was approved by the Ethics Committee of our institution.
Study Population
The study included patients >18 years who presented to the ED with a diagnosis of sepsis or infection-related conditions (Appendix 1) and had been treated with the sepsis protocol in the ED. We enrolled patients by day and alternated the days of the ED visit to reach the calculated sample size. The exclusion criteria were patients who transferred from other hospitals or areas of the hospital and patients with incomplete 28-day follow-up data.
Data Measurement and Outcomes
Data collection included patient demographics, presenting symptoms, vital signs recorded at the triage area, provisional diagnosis, hemoculture status, site of infection, 28-day intubation status, 28-day vasopressor time, and 28-day mortality. The variables of qSOFA, NEWS, SOS, SIRS, and ESI triage were recorded using the information gathered from the triage area of the ED (Appendix 2). The primary outcome was 28-day mortality. The secondary outcomes were mechanical ventilator usage within 28 days and vasopressor usage within 28 days.
Suspected sepsis was defined by physicians in the ED using the sepsis protocol, including qSOFA in Sepsis-3 criteria1 or physicians’ clinical judgment in the ED. Some physiologic parameters were not used because our goal was to compare
Population Health Research Capsule
What do we already know about this issue? Many screening tools are available at the triage area of the emergency department.
What was the research question? Which triage screening tool is the most accurate for predicting mortality in patients with sepsis?
What was the major finding of the study?
The National Early Warning Score outperforms other sepsis screening tools (area under the receiver operator characteristic curve of 0.77) in predicting mortality, need for ventilator and vasopressors for patients evaluated at ED triage.
How does this improve population health?
Using the most accurate screening tool at ED triage could enhance the healthcare of the population, including patients with sepsis.
predictive scores, which were used as a screening tool in the ED triage area. Thus, for example, the maximum score for SIRS was 3 because white blood cell count was disregarded, and the SOS score did not include urine output. Furthermore, a Barthel index of 20 was used to define totally dependent activities of daily living (ADL), and heart failure with reduced ejection function (HFrEF) was defined as a left ventricular ejection fraction of 40% on transthoracic echocardiography, which was documented in the medical records.
Sample Size and Data Analysis
We calculated the sample size for this study by using the equation N = Zα/2 2p(1 − p)/d2, with the standard normal variate (Zα/2) at 5%, the probability of expected sensitivity (p) equals 0.9. A two-sided test concluded that the minimum sample size would be 139 samples. The mortality rate for sepsis is 39%, as reported in a previous study.3
Statistical Analysis
We compared the survival and the nonsurvival groups by using the chi-square or Fisher’s exact test for categorical variables and the t-test for continuous variables. The data was presented as a percentage for categorical data and as a mean with standard deviation or median with interquartile range, as appropriate, for numerical data. The area under the receiver operating characteristic curve (AUROC), with a 95% confidence interval (CI), was depicted to evaluate the discrimination performance of each score. Sensitivity
Volume 23, no. 5: September 2022 699 Western Journal of Emergency Medicine Suttapanit et al. Accuracy of Sepsis Screening Score for Mortality Prediction at ED Triage
and specificity were calculated for each score as well. A P -value less than 0.05 was considered significant. We used STATA version 16.1 for statistical analysis (StataCorp LLC, College Station, TX).
RESULTS
In total, 550 patients were included in the analysis. A protocol flow chart is shown in Figure 1. The overall 28day mortality was 12.4%. The overall 28-day mechanical ventilator usage and 28-day vasopressor usage were 23.2% and 18.1%, respectively. The mean age was 69 years, and 46.7% of patients were male. The three most common comorbidities were diabetes mellitus (31.6%), solid-organ malignancy (25.8%), and totally dependent ADL (19.8%). The mortality was significantly higher in comorbidities such as the solid organ tumor group, the hematologic malignancy group, and HFrEF group. Vital signs such as higher heart rate (118 vs 106, P <0.001) and respiratory rate (27 vs 24), P <0.001) and lower systolic blood pressure (112 vs 106, P <0.001) and oxygen saturation (92 vs 96), P <0.014) were significant in mortality. The patient demographic data in the survival and nonsurvival groups, is summarized in Table 1.
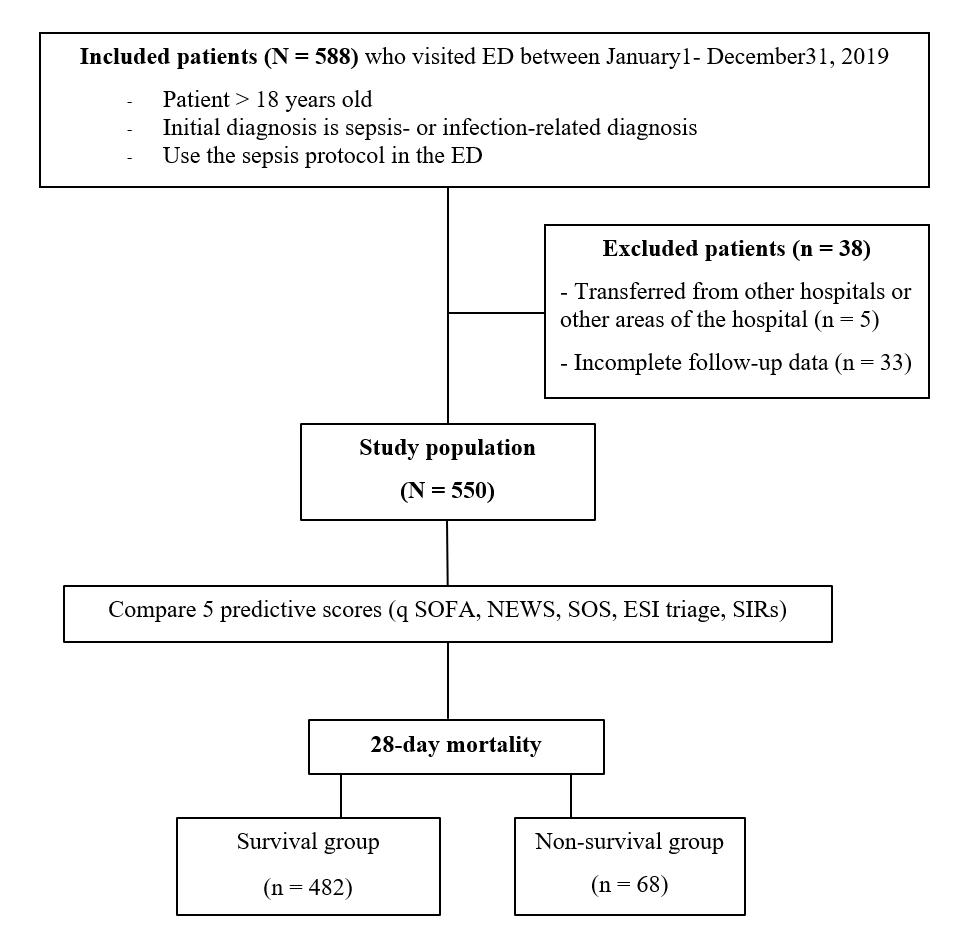
The primary outcome, 28-day mortality, was best detected by NEWS (area under the receiver operating characteristic curve [AUROC] = 0.770; 95% CI: 0.705-0.835), followed by SOS (AUROC = 0.749; 95% CI: 0.685-0.815, qSOFA
(AUROC = 0.7473; 95% CI: 0.688-0.806]), ESI triage (AUROC = 0.599 ;95% CI: 0.542-0.656), and SIRS (AUROC = 0.588; 95% CI: 0.522-0.654], as shown in Table 2 and Figure 2. The sensitivity and specificity for predicting the 28-day mortality rates of all predictive scores at different threshold are presented in Table 3.
Figure 1. Protocol flow chart for sepsis screening study at emergency department triage. ED, emergency department; qSOFA, quick Sequential Organ Failure Assessment; NEWS, National Early Warning Score; SOS, Search Out Severity; ESI, Emergency Severity Index; SIRs, Systemic Inflammatory Response syndrome.
For the secondary outcomes, 28-day mechanical ventilator usage and vasopressor usage, NEWS provided a high AUROC and outperformed as shown in Table 2 and Figures 3, 4. 0.00 0.25 0.50 0.75 1.00 Sensitivity 0.00 0.25 0.50 0.75 1.00
28-day mortality
1-Specificity
NEWS (ROC area: 0.7701) SOS (ROC area: 0.7499) qSOFA (ROC area: 0.7473) SIRs (ROC area: 0.5884) ESI triage (ROC area: 0.5988) Reference
Figure 2. The AUROC of the predictive scores for predicting 28day mortality.
AUROC, Area Under the Receiver Operating Characteristic curve; ROC, receiver operating characteristic; NEWS, National early warning score; SOS, Search Out Severity Score; qSOFA, quick Sequential Organ Failure Assessment; SIRS, Systemic Inflamma tory Response Syndrome; ESI, Emergency Severity Index.
DISCUSSION
Our study demonstrates that NEWS has the best predictive performance for the 28-day mortality of sepsis patients at the triage area of the ED. In the same way, Omar et al reported that NEWS outperformed both SIRS (AUROC 0.95 vs 0.89; P 0.001) and qSOFA (AUROC 0.95 vs 0.87; P 0.001) in predicting death in only the severe sepsis and septic shock groups in the ED. 7 Anniek et al determined that NEWS performed substantially better than qSOFA and SIRS in predicting both 10-day mortality (AUROC = 0.837, 0.744, and 0.646, respectively) and 30-day mortality (AUROC = 0.779, 0.697, and 0.631, respectively). 8 Furthermore, NEWS showed a high performance in predicting 28-day mechanical ventilator and 28-day vasopressor used. These results were in accordance
Figure 1 Protocol flow chart
Western Journal of Emergency Medicine 700 Volume 23, no. 5: September 2022 Accuracy of Sepsis Screening Score for Mortality Prediction at ED Triage Suttapanit et al.
Accuracy of Sepsis Screening Score for Mortality Prediction at ED Triage
Table 1. Baseline characteristics of patients stratified by 28-day mortality
Characteristic
All (N = 550) Survivor (n = 482) Non-survivor (n = 68) P-value
Age, year, mean (SD) 69 (16.5) 68 (16.9) 72 (12.9) 0.105
Male, n (%) 257 (46.7) 216 (44.9) 39 (57.4) 0.066
Comorbidities, n (%)
Cirrhosis 29 (5.3) 28 (5.8) 1 (1.4) 0.692
Diabetes mellitus 174 (31.6) 155 (32.2) 18 (26.1) 0.296
Hematologic malignancy 38 (6.9) 29 (6.0) 9 (13.0) 0.033
Solid-organ malignancy 142 (25.8) 110 (22.9) 32 (46.4) <0.001
AIDS with opportunistic infection 8 (1.5) 8 (1.7) 0 (0.0) 0.280
Transplant status 19 (3.5) 19 (4.0) 0 (0) 0.093
Immunocompromised 55 (10.0) 49 (10.2) 6 (8.7) 0.692
ESRD on RRT 51 (9.3) 47 (9.8) 4 (5.8) 0.284
COPD group D 26 (4.7) 22 (4.6) 4 (5.8) 0.661
Heart failure 23 (4.2) 13 (2.7) 10 (14.5) <0.001
Neuromuscular disease 2 (0.4) 2 (0.4) 0 (0) 0.592
Totally dependent ADL 109 (19.8) 93 (19.3) 16 (23.2) 0.464
Chief complaint, n (%)
Fever 294 (53.5) 267 (55.7) 27 (39.1) 0.010
Alteration of consciousness 61 (11.1) 47 (9.8) 14 (20.3) 0.010
Dyspnea 98 (17.8) 74 (15.4) 22 (31.9) 0.001
Cough 5 (0.9) 5 (1.0) 0 (0) 0.395
Malaise 7 (1.3) 7 (1.5) 0 (0) 0.313
Nausea/Vomiting 10 (1.8) 9 (1.9) 1 (1.4) 0.804
Abdominal pain 25 (4.5) 23 (4.8) 2 (2.9) 0.480
Other 50 (9.1) 47 (9.8) 3 (4.3) 0.141
Vital signs, mean (SD)
Heart rate, per minute 107 (23.9) 106 (23.2) 118 (26.4) <0.001
Temperature, Celsius 38.0 (3.2) 38.1 (3.0) 37.5 (4.2) 0.089
Respiratory rate, per minute 24 (4.8) 24 (4.5) 27 (5.9) <0.001
Systolic blood pressure, mmHg 130 (33.2) 133 (31.8) 112 (37.4) <0.001
Diastolic blood pressure, mmHg 71 (16.2) 72 (15.4) 65 (19.9) 0.001
Oxygen saturation, % 96 (7.8) 96 (7.7) 92 (8.0) 0.014
Mental status, n (%)
Alert 404 (73.5) 367 (76.6) 35 (50.7) <0.001
Response to verbal 88 (16.0) 71 (14.8) 17 (24.6) 0.045
Response to pain 35 (6.4) 28 (5.8) 7 (10.1) 0.135
Unconsciousness 23 (4.2) 13 (2.7) 10 (14.5) <0.001
Venous lactate, mmol/dL, mean (SD) 2.5 (1.8) 2.3 (1.8) 3.8 (2.9) <0.001
Disposition, n (%)
Discharge 290 (53.1) 283 (59.5) 7 (10.1) <0.001
General ward 144 (26.4) 132 (27.7) 12 (17.4) 0.073
SD, standard deviation; IQR, interquartile range; AIDS, acquired immunodeficiency syndrome; ESRD, end-stage renal disease; RRT, renal replacement therapy; COPD, chronic obstructive pulmonary disease; ADL, activities of daily living; mm Hg, millimeters of mercury; mmol/dL, millimoles per deciliter; NEWS, National Early Warning Score; SOS, Search Out Severity Score; qSOFA, quick Sequential Organ Failure Assessment; SIRS, Systemic Inflammatory Response Syndrome; ESI, Emergency Severity Index; CRBSI, catheterrelated bloodstream infection.
Volume 23, no. 5: September 2022 701 Western Journal of Emergency Medicine Suttapanit et al.
Accuracy of Sepsis Screening Score for Mortality Prediction Triage
Table 1. Continued. Characteristic
All (N = 550) Survivor (n = 482) Non-survivor (n = 68) P-value
Intensive care ward 78 (14.3) 56 (11.8) 21 (30.4) <0.001
Dead at emergency department 6 (1.1) 0 (0) 6 (8.7) <0.001
Palliative care ward 28 (5.1) 5 (1.1) 23 (33.3) <0.001
Length of hospital stay in hours, median (IQR) 68 (11,233) 56 (11,199) 142 (63,342) 0.045
Predictive score, median (IQR)
NEWS 5 (3,7) 5 (3,7) 8 (6,10) <0.001
SOS 4 (2,5) 3 (2,5) 6 (4,7) <0.001
qSOFA 1 (1,2) 1 (1,2) 2 (1,2) <0.001
SIRS 2 (2,3) 2 (1,3) 2 (2,3) 0.017
ESI 2 (2,3) 2 (2,3) 2 (2,2) 0.001
Hemoculture status, n (%)
Hemoculture positive 76 (13.8) 65 (13.1) 13 (18.8) 0.222
Gram positive cocci 26 (4.7) 19 (4.0) 7 (10.1) 0.024
Gram positive bacilli 1 (0.2) 0 (0) 1 (1.4) 0.008
Gram negative cocci 1 (0.2) 1 (0.2) 0 (0) 0.705
Gram negative bacilli 48 (8.7) 43 (8.9) 5 (7.2) 0.635
Secondary outcome, mean (SD)
28-day intubation free day, day 28 (8.1) 28 (2.2) 4 (3.1) <0.001
28-day vasopressor free day, day 28 (7.2) 28 (2.0) 6 (2.4) <0.001
Source of infection, n (%)
Pulmonary system 188 (34.2) 151 (31.4) 36 (52.2) 0.001
Urinary tract system 114 (20.7) 104 (21.6) 10 (14.5) 0.168
Gastrointestinal system 74 (13.5) 65 (13.5) 9 (13.0) 0.905
Cardiovascular system 3 (0.5) 2 (0.4) 1 (1.4) 0.278
Skin and soft tissue 40 (7.3) 34 (7.1) 6 (8.7) 0.634
Gynecologic system 2 (0.4) 2 (0.4) 0 (0) 0.592
Neurological system 7 (1.3) 6 (1.2) 1 (1.4) 0.892
Viral infection 38 (6.9) 37 (7.7) 1 (1.4) 0.055
Ear/nose/throat system 4 (0.7) 4 (0.8) 0 (0) 0.447
Unknown source of infection 70 (12.7) 65 (13.5) 5 (7.2) 0.142
CRBSI 9 (1.6) 9 (1.9) 0 (0) 0.252
SD, standard deviation; IQR, interquartile range; AIDS, acquired immunodeficiency syndrome; ESRD, end-stage renal disease; RRT, renal replacement therapy; COPD, chronic obstructive pulmonary disease; ADL, activities of daily living; mm Hg, millimeters of mercury; mmol/dL, millimoles per deciliter; NEWS, National Early Warning Score; SOS, Search Out Severity Score; qSOFA, quick Sequential Organ Failure Assessment; SIRS, Systemic Inflammatory Response Syndrome; ESI, Emergency Severity Index; CRBSI, catheterrelated bloodstream infection.
with the previous study by Churpek et al,9 which showed that general early warning scores (EWS) are more accurate than qSOFA in predicting adverse outcomes of sepsis outside the intensive care unit setting.
In the triage area of the ED, qSOFA was easier to assess by less experienced medical professionals.1 However, qSOFA has a limited ability to predict poor outcomes in sepsis patients.10,11 Additionally, the metrics used in EWS are
standard measures that can be readily and rapidly performed throughout the healthcare system as well as in the ED triage area. The NEWS also demonstrates a higher performance than the SOS score, which necessitates information not available in the triage area. Chompunot et al2 conducted a study in the hospital referral system that did not focus on the triage area. Their study found that the ESI score, which is commonly used as the general screening tool at ED triage,
Western Journal of Emergency Medicine 702 Volume 23, no. 5: September 2022
at ED
Suttapanit et al.
Suttapanit
Accuracy of Sepsis Screening Score for Mortality Prediction at ED Triage
Table 2. The area under the receiver operating characteristic curve with 95% confidence interval of predictive scores for predicting 28day mortality, 28-day mechanical ventilator used, and 28-day vasopressor used.
Scores AUROC (95% CI) 28-day mortality 28-day mechanical ventilator usage 28-day vasopressor usage
NEWS 0.770 (0.705, 0.835) 0.750 (0.700, 0.800) 0.763 (0.706, 0.819)
SOS 0.750 (0.685, 0.815) 0.751 (0.701, 0.801) 0.755 (0.697, 0.812)
qSOFA 0.747 (0.688, 0.806) 0.734 (0.689, 0.779) 0.741 (0.690, 0.791)
ESI triage 0.599 (0.542, 0.656) 0.642 (0.600, 0.683) 0.624 (0.576, 0.672)
SIRs 0.588 (0.522, 0.654) 0.581 (0.529, 0.632) 0.579 (0.521, 0.637)
CI, confidence interval; AUROC, area under the receiver operating characteristic curve; NEWS, National Early Warning Score; SOS, Search Out Severity Score; qSOFA, quick Sequential Organ Failure Assessment; SIRS, Systemic Inflammatory Response syndrome; ESI, Emergency Severity Index.
Table 3. Sensitivity and specificity for each predictive score for predicting 28-day mortality
Score News SOS Sensitivity Specificity Sensitivity Specificity
≥1 98.55 2.49 97.10 3.95 ≥2 95.65 6.86 95.65 12.68 ≥3 94.20 15.38 89.86 27.65 ≥4 91.30 28.69 85.51 49.90 ≥5 86.96 45.74 68.12 70.89 ≥6 78.26 61.12 53.62 83.99
≥7 72.46 74.64 36.23 91.89 ≥8 56.52 85.24 23.19 96.05 ≥9 40.58 90.23 11.59 97.71 ≥10 27.54 96.05 1.45 99.38
Score qSOFA SIRS Sensitivity Specificity Sensitivity Specificity ≥1 94.20 24.53 95.65 5.61 ≥2 69.57 74.84 85.51 25.78 3 17.39 96.47 49.28 65.07
Level ESI Triage
NEWS,
Specificity 1 17.39 92.1 2 89.96 26.82 3 100 1.04 100 0.21
Sensitivity
was inferior to NEWS, SOS, and qSOFA in predicting sepsis-related 28-day mortality, 28-day mechanical ventilator, and 28-day vasopressor used. Moreover, determining ESI at triage requires evaluator experience, as well as differing cut-off values of the parameters with other tools from other patient care systems.
Because of its strong predictive accuracy and simplicity, our findings support the use of NEWS as a screening tool in ED triage.5,12–15 An automatic calculation in the sepsis alert system likewise correctly uses NEWS.16 A NEWS cut-off prediction score of > 4 (sensitivity 91.30%, specificity 28.69%) and > 5 (sensitivity 86.96%,
Volume 23, no. 5: September 2022 703 Western Journal of Emergency Medicine
et al.
4
National Early Warning Score; SOS, Search Out Severity Score; qSOFA, quick Sequential Organ Failure Assessment; SIRS, Systemic Inflammatory Response syndrome; ESI, Emergency Severity Index.
28-day mechanical ventilator
Sensitivity
0.00 0.25 0.50 0.75 1.00
0.00 0.25 0.50 0.75 1.00
1-Specificity
NEWS (ROC area: 0.7503)
qSOFA (ROC area: 0.7341)
SOS (ROC area: 0.7507)
SIRs (ROC area: 0.5806)
ESI triage (ROC area: 0.6416) Reference
Figure 3. The AUROC of the predictive scores for predicting 28day mechanical ventilator usage.
AUROC, Area Under the Receiver Operating Characteristic curve; ROC, receiver operating characteristic; NEWS, National early warning score; SOS, Search Out Severity Score; qSOFA, quick Sequential Organ Failure Assessment; SIRS, Systemic Inflammatory Response Syndrome; ESI, Emergency Severity Index.
specificity 45.74%) predicted sepsis-related 28-day mortality, according to our findings. The score has the highest sensitivity (90%) and specificity (25%) for activating sepsis alarms.
LIMITATIONS
This was a retrospective, single-center study. Second, it should be noted that substantial numbers of patients had advanced-stage malignancies, including solid organ and hematologic malignancies, which had a higher mortality rate. Additionally, patients who did not resuscitate were not excluded from our study, which could have affected the outcome.
CONCLUSION
The National Early Warning Score outperforms qSOFA, SOS, SIRS, and ESI triage scores in predicting 28-day mortality, mechanical ventilator usage, and vasopressor usage of a patient with sepsis in the triage area of the ED.
ACKNOWLEDGMENTS
We thank Lucy McClellan, MIA, from Edanz (https:// www.edanz.com/ac), for editing a draft of this manuscript.
Address for Correspondence: Thidathit Prachanukool, MD, Mahidol University, Department of Emergency Medicine, 270 Rama VI Road, Ratchathewee, Bangkok, Thailand 10400. Email: thidathit.pra@mahidol.ac.th
Sensitivity
0.00 0.25 0.50 0.75 1.00
0.00 0.25 0.50 0.75 1.00
1-Specificity
NEWS (ROC area: 0.7625)
qSOFA (ROC area: 0.7406)
ESI triage (ROC area: 0.6243) Reference vasopressor
SOS (ROC area: 0.7547)
SIRs (ROC area: 0.5788)
Figure 4. The AUROC of the predictive scores for predicting 28day vasopressor usage.
AUROC, area under the receiver operating characteristic curve; ROC, receiver operating characteristic; NEWS, National Early Warning Score; SOS, Search Out Severity Score; qSOFA, quick Sequential Organ Failure Assessment; SIRS, Systemic Inflammatory Response syndrome; ESI, Emergency Severity Index.
Conflicts of Interest: By the WestJEM article submission agreement, all authors are required to disclose all affiliations, funding sources and financial or management relationships that could be perceived as potential sources of bias. No author has professional or financial relationships with any companies that are relevant to this study. There are no conflicts of interest or sources of funding to declare.
Copyright: © 2022 Prachanukool et al. This is an open access article distributed in accordance with the terms of the Creative Commons Attribution (CC BY 4.0) License. See: http:// creativecommons.org/licenses/by/4.0/
REFERENCES
1. Singer M, Deutschman CS, Seymour CW, et al. The Third International Consensus definitions for sepsis and septic shock (Sepsis-3). JAMA. 2016;315(8):801-10.
2. Champunot R, Kamsawang N, Tuandoung P, et al. Saving 500 Lives Campaign: another way to improve the mortality rate of patients with severe sepsis and septic shock. Crit Care. 2012;16(Suppl 3):P105.
3. Beale R, Reinhart K, Brunkhorst FM, et al. Promoting Global Research Excellence in Severe Sepsis (PROGRESS): lessons from an international sepsis registry. Infection. 2009;37(3):222-32.
4. Keep JW, Messmer AS, Sladden R, et al. National early warning score at emergency department triage may allow earlier identification of patients with severe sepsis and septic shock: a retrospective
Western Journal of Emergency Medicine 704 Volume 23, no. 5: September 2022 Accuracy of Sepsis Screening Score for Mortality Prediction at ED Triage Suttapanit et al.
28-day
Suttapanit et al.
observational study. Emerg Med J. 2016;33(1):37-41.
Accuracy of Sepsis Screening Score for Mortality Prediction at ED Triage
5. Mearelli F, Orso D, Fiotti N, et al. Sepsis outside intensive care unit: the other side of the coin. Infection. 2015;43(1):1-11.
6. Tanabe P, Gilboy N, Travers DA. Emergency Severity Index version
4: clarifying common questions. J Emerg Nurs. 2007;33(2):182-5.
7. Usman OA, Usman AA, Ward MA. Comparison of SIRS, qSOFA, and NEWS for the early identification of sepsis in the emergency department. Am J Emerg Med. 2019;37(8):1490-7.
8. Brink A, Alsma J, Verdonschot RJCG, et al. Predicting mortality in patients with suspected sepsis at the emergency department; A retrospective cohort study comparing qSOFA, SIRS and National Early Warning Score. PLoS One. 2019;14(1):e0211133.
9. Churpek MM, Snyder A, Han X, et al. Quick Sepsis-related Organ Failure Assessment, Systemic Inflammatory Response Syndrome, and Early Warning Scores for detecting clinical deterioration in infected patients outside the intensive care unit. Am J Respir Crit Care Med. 2017;195(7):906-11.
10. Khwannimit B, Bhurayanontachai R, Vattanavanit V. Comparison of the performance of SOFA, qSOFA and SIRS for predicting mortality and organ failure among sepsis patients admitted to the intensive
care unit in a middle-income country. J Crit Care. 2018;44:156-60.
11. Raith EP, Udy AA, Bailey M, et al. Prognostic accuracy of the SOFA score, SIRS criteria, and qSOFA score for in-hospital mortality among adults with suspected infection admitted to the intensive care unit. JAMA. 2017;317(3):290-300.
12. Williams JM, Greenslade JH, McKenzie JV, et al. Systemic Inflammatory Response Syndrome, Quick Sequential Organ Function Assessment, and Organ Dysfunction: Insights from a prospective database of ED patients with infection. Chest. 2017;151(3):586-96.
13. Gyang E, Shieh L, Forsey L, et al. A nurse-driven screening tool for the early identification of sepsis in an intermediate care unit setting. J Hosp Med. 2015;10(2):97-103.
14. Manaktala S, Claypool SR. Evaluating the impact of a computerized surveillance algorithm and decision support system on sepsis mortality. J Am Med Inform Assoc. 2017;24(1):88-95.
15. Thiel SW, Rosini JM, Shannon W, et al. Early prediction of septic shock in hospitalized patients. J Hosp Med. 2010;5(1):19-25.
16. Makam AN, Nguyen OK, Auerbach AD. Diagnostic accuracy and effectiveness of automated electronic sepsis alert systems: a systematic review. J Hosp Med. 2015;10(6):396-402.
Volume 23, no. 5: September 2022 705 Western Journal of Emergency Medicine
Direct vs Video Laryngoscopy for Difficult Airway Patients in the Emergency Department: A National Emergency Airway Registry Study
*
Brandon T. Ruderman, MD*
Martina Mali, MD†
Amy H. Kaji, MD, PhD‡
Robert Kilgo, MD†
Susan Watts, PhD†
Radosveta Wells, MD†
Alexander T. Limkakeng, Jr, MD, MHSc*
Joseph B. Borawski, MD, MPH*
Andrea E. Fantegrossi, MPH
Ron M. Walls, MD§
Calvin A. Brown III, MD§
Duke University Medical Center, Department of Emergency Medicine, Durham, North Carolina
Texas Tech University Health Sciences Center, Department of Emergency Medicine, El Paso, Texas Harbor-UCLA Medical Center, Department of Emergency Medicine, Torrance, California
Brigham and Women’s Hospital, Department of Emergency Medicine, Boston, Massachusetts
On behalf of the National Emergency Airway Registry investigators
Section Editor: Quincy Tran, MD, PhD
Submission history: Submitted December 6, 2021; Revision received June 14, 2022; Accepted June 23, 2022 Electronically published August 19, 2022
Full text available through open access at http://escholarship.org/uc/uciem_westjem DOI: 10.5811/westjem.2022.6.55551
Introduction: Previous studies suggest improved intubation success using video laryngoscopy (VL) vs direct laryngoscopy (DL), yet recent randomized trials have not shown clear benefit of one method over the other. These studies, however, have generally excluded difficult airways and rapid sequence intubation. In this study we looked to compare first-pass success (FPS) rates between VL and DL in adult emergency department (ED) patients with difficult airways.
Methods: We conducted a secondary analysis of prospectively collected observational data in the National Emergency Airway Registry (NEAR) (January 2016–December 2018). Variables included demographics, indications, methods, medications, devices, difficult airway characteristics, success, and adverse events. We included adult ED patients intubated with VL or DL who had difficult airways identified by gestalt or anatomic predictors. We stratified VL by hyperangulated (HAVL) vs standard geometry VL (SGVL). The primary outcome was FPS, and the secondary outcome was comparison of adverse event rates between groups. Data analyses included descriptive statistics with cluster-adjusted 95% confidence intervals (CI).
Results: Of 18,123 total intubations, 12,853 had a predicted or identified anatomically difficult airway. The FPS for difficult airways was 89.1% (95% CI 85.9-92.3) with VL and 77.7% (95% CI 75.7-79.7) with DL (P <0.00001). The FPS rates were similar between VL subtypes for all difficult airway characteristics except airways with blood or vomit, where SGVL FPS (87.3%; 95% CI 85.8-88.8) was slightly better than HAVL FPS (82.4%; 95% CI, 80.3-84.4). Adverse event rates were similar except for esophageal intubations and vomiting, which were both less common in VL than DL. Esophageal intubations occurred in 0.4% (95% CI 0.1-0.7) of VL attempts and 1.5% (95% CI 1.1-1.9) of DL attempts. Vomiting occurred in 0.6% (95% CI 0.5-0.7) of VL attempts and 1.4% (95% CI 0.9-1.9) of DL attempts.
Conclusion: Analysis of the NEAR database demonstrates higher first-pass success with VL compared to DL in patients with predicted or anatomically difficult airways, and reduced rate of esophageal intubations and vomiting. [West J Emerg Med. 2022;23(5)706–715.]
Western Journal of Emergency Medicine 706 Volume 23, no. 5: September 2022 Original Research
§
† ‡ §
INTRODUCTION
Background
Direct laryngoscopy (DL) has been the historical standard for airway management in the emergency department (ED); however, the use of video laryngoscopy (VL) has steadily risen over the past decade. As of 2012, about 55% of ED intubations were performed using DL, compared with 39% using VL.1 Prospective, single-center observational studies have demonstrated that VL improves glottic exposure and intubation success in ED and intensive care unit patients.2-6 Furthermore, multiple studies have shown that VL use among emergency medicine residents has been associated with fewer adverse events, including esophageal intubations.2-6 In spite of these promising results concerning VL, recent randomized trials in critical care patients and one meta-analysis of randomized trials with various patient types have not shown a clear benefit of one intubation method over the other. However, these studies do not fully represent ED populations since many studies excluded difficult airways and rapid sequence intubation or included primarily less experienced internal medicine trainees as intubators.7-10
Importance
One of the proposed advantages of VL is an absolute reduction in the number of failed intubations in patients with difficult airways, as suggested by multiple systematic reviews.11-12 Difficult airways are more likely to require multiple attempts and are associated with an increased rate of complications and peri-intubation adverse events including esophageal intubation, airway trauma, and hypoxia.13-17 Video laryngoscopy has become increasingly used in ED intubations, and variations in VL design (hyperangulated vs standard geometry blade shape) can affect the mechanics of intubation and may improve first-pass success (FPS).18
Goals of This Investigation
Our primary goal in this study was to measure the rates of FPS comparing VL vs DL intubations in adult ED patients who had an anticipated or identified anatomically difficult airway. We also sought to answer the question of whether VL design (hyperangulated vs standard geometry) influenced FPS in these patients. Our secondary goal was to determine whether there were differences in peri-intubation adverse events between these two intubation methods.
METHODS
Study Design and Setting
This was a retrospective analysis of data from the National Emergency Airway Registry (NEAR), a prospective, multicenter registry of ED intubations from 25 academic and community hospitals. Site investigators at each participating center were responsible for ensuring that data entry was completed for at least 90% of intubations performed in the ED and that the ED intubations were confirmed by comparison
Population Health Research Capsule
What do we already know about this issue?
Video laryngoscopy is the most common intubation method used in academic emergency departments, yet its benefit in patients with difficult airways remains unknown.
What was the research question?
Is video laryngoscopy associated with higher first-pass success than direct laryngoscopy in difficult airways?
What was the major finding of the study?
Video laryngoscopy had higher rates of firstpass success for difficult airways than direct laryngoscopy (89.1% [95% CI 85.9-92.3] vs 77.7% [95% CI 75.7-79.7]), respectively.
How does this improve population health?
This study supports using video laryngoscopy for difficult airways, which may lead to improved patient outcomes with fewer failed intubation attempts and adverse events.
with institutional coding data or respiratory department capture of ED intubation procedures. All participating sites obtained approval from their local institutional review boards to conduct and participate in the study prior to data collection.
Selection of Participants
All adult patients with an attempted ED intubation from January 1, 2016–December 31, 2018 were eligible for inclusion in the study. We excluded pediatric patients (defined as <15 years of age), patients who had an initial attempt with a device besides DL or VL (such as fiberoptic intubations), and those who were missing data on attempt, success, device, or patient age.
Measurements
Intubating clinicians entered all registry data into a secure, web-based data collection form requiring institution-specific login credentials and passwords (StudyTRAX; version 3.47.0011 (ScienceTRAX, Macon, GA). Variables collected included patient demographics, body habitus, estimated weight, preintubation hemodynamics, methods of preoxygenation, initial intubator gestalt of airway difficulty (ie, physician anticipation that the intubation could be challenging), observable difficult airway characteristics (eg, mouth opening, Mallampati score, neck mobility, presence of airway obstruction, etc), intubation position and device, medications and doses, operator characteristics, first-pass intubation success or failure, adverse events, and patient disposition. After data upload,
Ruderman Difficult Airway Patients in ED: National Airway
Volume 23, no. 5: September 2022 707 Western Journal of Emergency Medicine
et al. DL Vs VL for
the
A
Emergency
Registry Study
study investigators reviewed all data, using quality assurance algorithms to identify and correct data entry errors. The study coordinator performed active compliance monitoring to ensure that a 90% reporting threshold was maintained registry-wide by cross-referencing captured intubations reported by each site with their online entries. All data is reported in accordance with the Strengthening the Reporting of Observational Studies in Epidemiology (STROBE) statement (www.strobe-statement.org).
Outcomes
The primary outcome measure was FPS among adult patients with difficult airways stratified by DL and VL. We defined a difficult airway as any intubation that was either anticipated to be difficult by the operator (physician gestalt) or had at least one of the following recorded difficult airway characteristics: greater than normal body habitus (obese or morbidly obese); reduced neck mobility; Mallampati score greater than two; reduced mouth opening; thyromental distance less than two fingers; airway obstruction present; facial trauma; or blood or vomit in the airway. Further, we performed a subgroup analysis comparing FPS rates by the type of video laryngoscope used: standard geometry VL (SGVL) and hyperangulated VL (HAVL). The SGVL devices included the C-MAC (Karl Storz SE & Co., Tuttlingen, Germany) and McGrath MAC (Medtronic, Minneapolis, MN), while HAVL devices included the GlideScope (Verathon Inc, Bothell WA), King Vision (Ambu, Inc, Ballerup, Denmark), and C-MAC D-blade. An intubation attempt was defined as insertion of the device into the mouth past the alveolar ridge regardless of whether the attempt was successful or not.
Our secondary outcome was the rate of adverse events as specified by the NEAR data collection form. We reported rates for cardiac arrest (loss of pulses during or immediately after intubation), esophageal intubation, hypoxia (oxygen saturation <90% during intubation when starting at a value >90% or a decrease in oxygen saturation by 10% if starting at a value <90%), and vomiting with aspiration. We chose to highlight these adverse events as they were among the most commonly considered to be directly influenced by FPS. Additional recorded adverse events were extremely rare and, therefore, reported together as “any adverse event.” These included dental trauma, direct airway injury, epistaxis, hypotension (systolic blood pressure <100 millimeters of mercury), iatrogenic bleeding, lip laceration, laryngoscope failure, laryngospasm, mainstem intubation, pharyngeal laceration, pneumothorax, or tracheal tube cuff failure.
Statistical Analysis
We exported all study data from StudyTRAX to SAS v 9.4 (SAS Institute, Inc, Cary, NC) for statistical analysis. To account for within-site correlations, we performed a cluster analysis using the proc surveyfreq function in SAS. We first described cluster-adjusted binomial distributions of FPS, stratified by DL, VL, HAVL, and SGVL. We then described
the differences between these cohorts based upon previously described predictors that affect FPS and rates of adverse events.13 We also reported the exact binomial distributions for adverse events for DL, VL, HAVL, and SGVL.
RESULTS
During the 36-month study period, 19,071 intubations were recorded in the registry. After applying the above exclusion criteria, 18,123 remained. Of these, 12,853 (71%) were classified as difficult airways and included in the final analysis (Figure 1). Direct laryngoscopy was performed on 3,743 (29.1%) of these, and VL on 9,110 (70.9%). Patient and intubation characteristics are shown in Table 1. The overall FPS rate of VL was significantly higher than that
Figure 1. Flowsheet of intubations included and analyzed during the study period. Note that 948 intubations were excluded; neither were 5,270 intubations included in the final analysis as they did not meet criteria for a difficult airway. DL, direct laryngoscopy; VL, video laryngoscopy; FPS, first-pass success; HAVL, hyperangulated video laryngoscopy; SGVL, stan dard geometry video laryngoscopy.
of DL (89.1% vs 77.7%, P <0.00001). Approximately 72% of included patients were under 65 years old, about twothirds were male, and 70.2% were intubated for a medical indication. Nearly half (46.3%) of the intubations included obese or morbidly obese patients. The most common method of intubation used for medically indicated difficult airways was SGVL, whereas for traumatic indications HAVL was most commonly used. Of the difficult intubations, 46.9% were
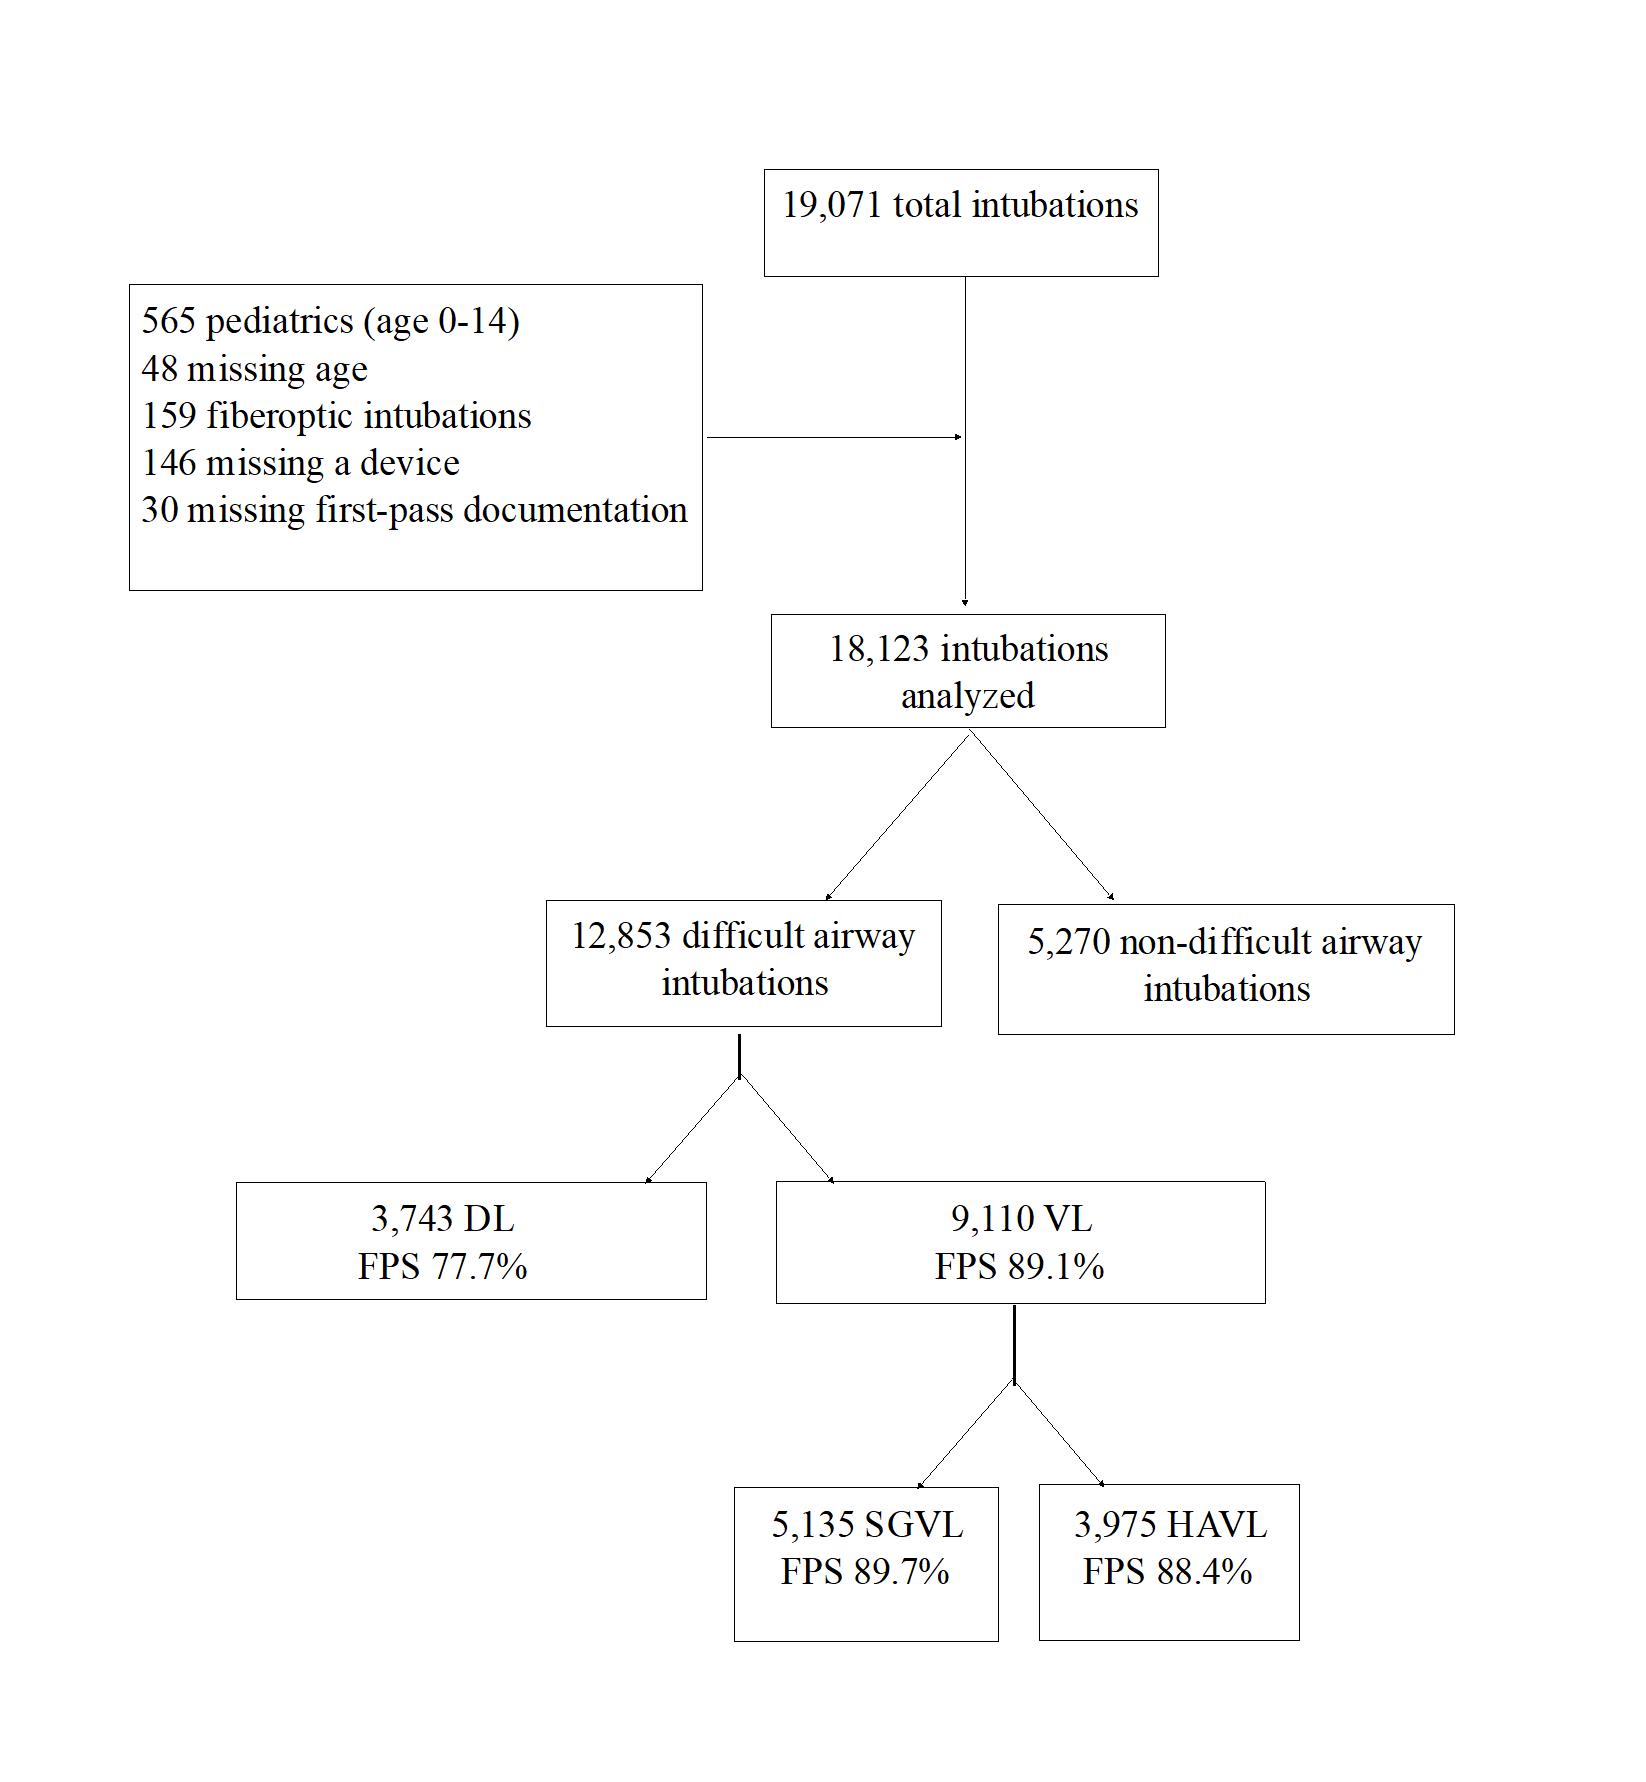
Western Journal of Emergency Medicine 708 Volume 23, no. 5: September 2022 DL Vs VL for Difficult Airway Patients in the ED: A National Emergency Airway Registry Study Ruderman et al.
Ruderman DL Vs VL for Difficult Airway Patients in the ED: A National Emergency Airway Registry
Table 1. Patient characteristics and use of DL, VL, HAVL, and SGVL* for first-pass intubation attempts among those with difficult airway characteristics.
Total N = 12,853
Age 15-65
Age > 65
9,235 (71.9, 66.976.8)
3,618 (28.1, 23.233.1)
Male 8,500 (66.2, 63.968.4)
Female 4,349 (33.8, 31.636.1)
DL n = 3,743 (29.1, 17.2-41.1)
2,698 (72.1, 65.778.5)
VL n = 9,110 (70.9, 58.9-82.8)
HAVL n = 3,975 (30.9, 20.4-41.5)
SGVL n = 5,135 (40.0, 20.2-59.7)
6,537 (71.8, 66.377.2) 2,801 (70.4, 65.375.7) 3,736 (72.8, 65.679.9)
1,045 (27.9, 21.534.3) 2,573 (28.2, 22.833.7) 1,174 (29.5, 24.334.7) 1,399 (27.2, 20.134.4)
2,463 (65.8, 62.169.6)
6,037 (66.3, 64.068.6) 2,563 (66.5, 63.169.9) 3,394 (66.1, 63.768.5)
1,279 (34.3, 30.437.9) 3,070 (33.7, 31.436.0) 1,332 (33.5, 30.136.9) 1,738 (33.9. 31.536.3)
Habitus (very thin) 371 (2.9, 2.2-3.6) 132 (3.5, 2.7-4.4) 239 (2.6, 2.0-3.3) 116 (2.9, 2.2-3.7) 123 (2.4, 1.6-3.2)
Habitus (thin) 1,519 (11.9, 9.514.2) 468 (12.5, 9.9-15.1) 1,051 (11.6, 8.914.3) 499 (12.6, 10.614.6) 552 (10.8, 7.0-14.5)
Habitus (normal) 4,991 (38.9, 35.642.2)
Habitus (obese) 4,952 (38.6, 36.141.1)
1,423 (38.1, 33.942.3) 3,568 (39.3, 35.942.7) 1,518 (38.3, 33.443.2) 2,050 (40.0, 36.543.5)
1,490 (39.9, 35.844.0) 3,462 (38.1, 35.440.8) 1,409 (35.6, 32.938.3) 2,053 (40.0, 37.342.8)
Habitus (morbidly obese) 989 (7.7, 6.3-9.1) 222 (5.9, 4.7-7.2) 767 (8.4, 6.8-10.2) 421 (10.6, 8.4-12.8) 346 (4.7, 3.8-5.5)
Medical indication 9,029 (70.2, 63.277.3)
2752 (73.4, 65.281.9) 6,358 (69.8, 62.377.3) 2,512 (63.2, 52.773.7) 3,846 (74.9, 68.781.1)
Traumatic indication 3,743 (29.1, 22.236.1) 991 (26.5, 18.134.8) 2,752 (30.2, 22.737.7) 1463 (36.8, 26.347.3) 1,289 (25.1, 18.931.3)
Anticipated to be difficult 5,987 (46.9, 42.351.5) 1,695 (45.3, 41.149.6) 4,292 (47.5, 41.853.3) 2002 (50.4, 46.554.4) 2,`290 (45.3, 37.652.9)
First-pass success 11,028 (85.8, 82.389.3) 2,908 (77.7, 75.779.7) 8,120 (89.1, 85.992.3) 3,513 (88.4, 86.989.9) 4607 (89.7, 84.794.8)
Data are reported as N (%, 95% confidence interval). *DL, direct laryngoscopy; VL, video laryngoscopy; HAVL, hyperangulated video laryngoscopy; SGVL, standard geometry video laryngoscopy.
anticipated to be difficult based on gestalt alone, indicating that the remainder of difficult intubations were classified as such due to an anatomic predictor.
First-pass success was significantly higher for VL than for DL for all difficult airway characteristics with the exception of “airway obstruction present” (Table 2). Table 2 compares FPS rates for VL and DL among all difficult airway characteristics included in the NEAR survey. For airways that were anticipated to be difficult by the operator, FPS was significantly higher for VL than DL by 13.7% (85.0% vs 71.3%). Stratifying VL by blade shape revealed a similar FPS rate for HAVL and SGVL (88.4% vs 89.7%) in difficult airway patients (Table 3). Interestingly, “blood or vomit in the airway” was the only difficult airway characteristic for which there was a statistically significant difference in FPS between HAVL (82.4%; 95% confidence interval [CI] 80.3-84.4) and SGVL (87.3%; 95% CI 85.8-88.8).
In Table 4, we show a comparison of FPS between DL, VL, HAVL, and SGVL as increasing numbers of difficult airway characteristics are added. The FPS gradually decreases for each method of intubation as the number of difficult airway
characteristics increases (Figure 2). The FPS for VL overall, as well as HAVL and SGVL individually, remains higher than the FPS for DL regardless of the number of difficult airway characteristics. When linear trendlines are added to DL and VL, the slope representing the decrease in percentage FPS as additional characteristics are added is greater for DL than for VL (-6.54, R2 0.98 vs -3.92, R2 0.99). Furthermore, there does not appear to be any significant difference in the overall FPS rates between HAVL and SGVL for any number of characteristics.
For our secondary outcome, hypoxia was the most common individual adverse event, observed at a rate of 8.0% (95% CI 6.3-9.7) for all difficult airways (Table 5). When taken as a whole, there was no observable difference in the rates of adverse events between VL and DL (12.9% vs 13.5%). However, the rates of both vomiting and esophageal intubation were significantly lower among the difficult airways intubated with VL than those with DL. Esophageal intubation was observed in 1.5% (95% CI 1.1-1.9) of difficult airways intubated with DL compared to 0.4% (95% CI 0.1-0.7) for those intubated with VL. Similarly, the DL rate of vomiting was 1.4% (95% CI 0.9-1.9) and the VL rate
Volume 23, no. 5: September 2022 709 Western Journal of Emergency Medicine
et al.
Study
Table 2. Comparative first-pass success rates of direct laryngoscopy and video laryngoscopy for each difficult airway characteristic.
DL N = 3,743 (29.1, 28.3-29.9)
DL FPS n = 2,908 (77.7, 75.7-79.7) VL N = 9,110 (70.9, 70.1-71.7) VL FPS n = 8,120 (89.1, 85.9-92.3)
Anticipated to be difficult 1,695 (45.3, 41.1-49.6) 1,208 (71.3, 69.0-73.4) 4,292 (47.5, 41.8-53.3) 3,647 (85.0, 83.9-86.0)
Habitus > normal 1,712 (45.7, 40.9-50.6) 1,312 (76.6, 74.6-78.6) 4,229 (46.4, 43.3-49.6) 3,751 (88.7, 87.7-89.6)
Reduced neck mobility 1,146 (30.6, 25.4-35.8) 883 (77.1, 74.5-79.5) 3,758 (41.5, 34.6-48.3) 3,340 (88.9, 87.8-89.9)
Mallampati score > 2 668 (51.3, 45.6-56.9) 499 (74.7, 71.2-78.0) 1,647 (50.0, 41.6-58.4) 1,429 (86.8, 85.0-88.4)
Mouth opening < normal 683 (35.2, 26.6-43.7) 479 (70.1, 66.5-73.5) 1,963 (41.8, 32.8-50.8) 1,661 (84.6, 82.9-86.2)
Thyromental distance < 2 fingers 59 (4.4, 2.3-6.5) 36 (61.0, 47.4-73.5) 187 (5.1, 3.9-6.3) 156 (83.4, 77.3-88.4)
Airway obstruction present 175 (4.7, 3.0-6.4) 118 (67.4, 60.5-74.3) 498 (5.5, 4.7-6.3) 376 (75.5, 71.5-79.2)
Facial trauma 483 (12.9, 7.6-18.2) 368 (76.2, 72.1-79.9) 1,480 (16.3, 12.9-19.7) 1304 (88.1, 86.3-89.7)
Blood or vomit in the airway 1,503 (40.2, 32.5-47.9) 1089 (72.5, 70.1-74.7) 3,273 (36.1, 33.8-38.5) 2,792 (85.3, 84.0-86.5)
Data are reported as N (%, 95% confidence interval). DL, direct laryngoscopy; VL, video laryngoscopy; FPS, first-pass success.
Table 3. Comparative first-pass success rates of hyperangulated video laryngoscopy (VL) and standard geometry VL for each difficult airway characteristic.
HAVL N = 3,975 (43.6, 42.6-44.7)
HAVL FPS n = 3,513 (88.4, 86.9-89.9)
SGVL N = 5,135 (56.4, 55.3-57.4)
SGVL FPS n = 4,607 (89.7, 84.7-94.8)
Anticipated to be difficult 2,002 (50.4, 48.8-51.9) 1,699 (84.9, 83.2-86.4) 2,290 (44.6, 43.2-46.0) 1,948 (85.1, 83.5-86.5)
Habitus > normal 1,830 (46.0, 44.5-47.7) 1,595 (87.2, 85.5-88.7) 2,399 (46.7, 45.3-48.1) 2,156 (89.9, 88.6-91.0)
Reduced neck mobility 2,024 (50.9, 49.4-52.5) 1,801 (89.0, 87.5-90.3) 1,734 (33.8, 32.5-35.1) 1,539 (88.8, 87.2-90.2)
Mallampati Score > 2 748 (18.9, 17.6-20.1) 651 (87.0, 84.4-89.4) 899 (17.5, 16.5-18.6) 778 (86.5, 84.1-88.7)
Mouth opening < normal 956 (24.1, 22.7-25.4) 818 (85.6, 83.2-87.7) 1,007 (19.6, 18.5-20.7) 843 (83.7, 81.3-85.9)
Thyromental distance < 2 fingers 99 (2.5, 2.0-3.0) 84 (84.9, 76.2-91.2) 88 (1.7, 1.4-2.1) 72 (81.8, 72.2-89.2)
Airway obstruction present 223 (5.6, 4.9-6.4) 163 (73.1, 66.8-78.8) 275 (5.4, 4.8-6.0) 213 (77.5, 72.1-82.3)
Facial trauma 732 (18.4, 17.2-19.7) 643 (87.8, 85.3-90.1) 748 (14.6, 13.6-15.6) 661 (88.4, 85.9-90.6) Blood or vomit in the airway 1,348 (33.9, 32.4-35.0) 1,111 (82.4, 80.3-84.4) 1,925 (37.5, 36.2-38.8) 1,681 (87.3, 85.8-88.8)
Data is reported as N (%, 95% confidence interval). HAVL, hyperangulated video laryngoscopy; SGVL, standard geometry video laryngoscopy; FPS, first-pass success.
was 0.6% (95% CI 0.5-0.7). There were also no observable differences in adverse event rates when comparing HAVL and SGVL for difficult airways.
DISCUSSION
Although the use of VL has risen steadily over the past few years, the advantages and disadvantages of VL and DL continue to be debated.1,5,19,20 A 2018 meta-analysis of five randomized controlled trials with data from 1,250 patients found no significant difference in the first-pass or overall intubation success rates for VL and DL.21 However, many of the included trials systematically excluded patients with difficult airways, who could potentially benefit the most from
the use of VL.7,22,23 Direct laryngoscopy requires alignment of the oral, laryngeal, and pharyngeal axes to visualize the glottis, whereas VL, depending on blade shape, either does not require the same degree of alignment (SGVL) or no alignment at all (HAVL). The SGVL uses much of the same laryngoscopic technique as DL whereas HAVL requires a distinct technique both for glottic visualization and tube delivery. The HAVL is often suggested to be useful for patients with reduced neck mobility or when optimal patient positioning cannot be achieved, as it requires less “lifting force”; however, indirect tube delivery via a video screen can make tracheal tube placement challenging. We did not find an overall difference in FPS between these two subtypes,
Western Journal of Emergency Medicine 710 Volume 23, no. 5: September 2022 DL Vs VL for Difficult Airway Patients in the ED: A National Emergency Airway Registry Study Ruderman et al.
y = 6.54x + 91.3 R² = 0.9762 y = 3.92x + 97.9 R² = 0.9893 3 ≥4
Number of Difficult Airway Characteristics VL
Figure 2. First-pass success rates for direct laryngoscopy (DL), video laryngoscopy (VL), hyperangulated VL (HAVL), and standard geometry VL (SGVL) for patients with multiple difficult airway characteristics. The percentage first-pass success is shown for DL, VL, HAVL, and SGVL for increasing numbers of distinct difficult airway characteristics. 95% confidence intervals are shown as error bars. Linear regression trendlines and their respective equations are shown for DL and VL. DL, direct laryngoscopy; VL, video laryngoscopy; FPS, first-pass success; HAVL, hyperangulated video laryngoscopy; SGVL, standard geometry video laryngoscopy.
suggesting that, in general, operators are equally likely to succeed in difficult airways with VL regardless of blade shape and technique differences. The HAVL was, however, the most common subtype used for difficult airways with a traumatic indication, likely due to its benefit in patients with cervical collars and reduced neck mobility.
To our knowledge, our study is the largest to date that investigates the differences between DL and VL specifically for difficult airways. We found that the overall FPS was
significantly higher for VL than DL by about 11.4% among patients with at least one difficult airway characteristic, and by about 13.7% for patients with anticipated difficult airways. Furthermore, the FPS for airways anticipated to be difficult was in general similar to that of anatomic predictors of difficult airways, with the exception of “airway obstruction present.” This suggests that physician gestalt for airways in the NEAR database is likely a reliable stand-alone predictor of a difficult airway, at least in terms of estimating FPS.
Volume 23, no. 5: September 2022 711 Western Journal of Emergency Medicine Ruderman et al. DL Vs VL for Difficult Airway Patients in the ED: A National Emergency Airway Registry Study
60 65 70 75 80 85 90 95 100 1 2
Percentage FirstPass Success
DL
HAVL SGVL Linear (DL) Linear (VL)
Table 4. First-pass success rates for airways with increasing number of difficult airway characteristics.
Number of difficult airway characteristics 1 2 3 ≥4
DL FPS 1,229/1,460 (84.2,82.286.0) 850/1,065 (79.8, 77.382.2) 455/648 (70.2, 66.573.7) 374/570 (65.6, 61.669.5)
VL FPS 2,965/3,171 (93.5, 92.694.3) 2,212/2,437 (90.8, 89.591.9 1,485/1,724 (86.1, 84.487.7) 1,458/1,778 (82.0, 80.183.8)
HAVL FPS 1,096/1,176 (93.2, 91.694.6) 969/1,074 (90.2, 88.391.9 687/801 (85.8, 83.288.1) 761/924 (82.4, 79.784.8)
SGVL FPS 1,869/1,995 (93.7, 92.594.7) 1,243/1,363 (91.2, 89.692.6) 798/923 (86.5, 84.188.6) 697/854 (81.6, 78.984.2)
Data is reported as ratios (%, 95% confidence interval). DL, direct laryngoscopy; VL, video laryngoscopy; FPS, first-pass success; HAVL, hyperangulated video laryngoscopy; SGVL, standard geometry video laryngoscopy.
Table 5. Adverse event rates during first-pass intubation attempts for DL, VL, HAVL, and SGVL* among difficult airways.
Total N = 12,853 DL n = 3,743 VL n = 9,110 HAVL n = 3,975 SGVL n = 5,135 Cardiac arrest 125 (1.0, 0.7-1.2) 42 (1.1, 0.8-1.5) 83 (0.9, 0.6-1.2) 38 (1.0, 0.6-1.3) 45 (0.9, 0.6-1.2) Esophageal intubation 94 (0.7, 0.4-1.0) 58 (1.5, 1.1-1.9) 36 (0.4, 0.1-0.7) 18 (0.5, 0.2-0.8) 18 (0.4, 0.1-0.7)
Hypoxia 1,027 (8.0, 6.3-9.7) 293 (7.8, 5.9-9.7) 734 (8.1, 6.2-9.9) 325 (8.2, 6.0-10.4) 409 (8.0, 5.8-10.1) Vomiting 108, (0.8, 0.7-1.0) 52 (1.4, 0.9-1.9) 56 (0.6, 0.5-0.7) 26 (0.7, 0.5-0.8) 30 (0.6, 0.4-0.8)
Any adverse event 1,676 (13.1, 10.915.3) 504 (13.5, 11.215.8) 1,172 (12.9, 10.315.5) 547 (13.8, 11.516.1) 625 (12.2, 9.0-15.5)
Data is reported as N (%, 95% confidence interval). *DL, direct laryngoscopy; VL, video laryngoscopy; HAVL, hyperangulated video laryngoscopy; SGVL, standard geometry video laryngoscopy
“Airway obstruction present” was also the only characteristic that did not show a statistically significant difference in FPS between DL and VL for difficult airways. The exact reason for this is unclear but may be partially due to the small number of included airways with this characteristic, although there does appear to be a trend toward higher FPS for VL. In a few specific situations, mechanical obstructions in airways are easier to maneuver around with direct visualization rather than using a screen. Significant obstructing upper airway pathology may also equally limit endotracheal tube insertion for all device types, reducing the power to detect a difference.
First-pass success using VL was similar whether using HAVL (88.4%) or SGVL (89.7%). These results suggest that the primary advantage that VL offers in difficult airways is improved glottic visualization and that blade shape and indirect tube placement do not significantly alter FPS rate. The FPS for SGVL was slightly higher for patients with “blood or vomit in the airway” compared to HAVL (87.3% vs 82.4%). One possible explanation for this observed difference may be that the standard geometry blades allow for more effective suction through movement and management of the tongue, whereas the angle of HAVL blades limits suctioning of the oropharynx.
An increase in the number of individual difficult airway characteristics results in an expected linear decrease in the FPS, with the lowest success rate being 65.6% for DL for airways with four or more characteristics. Interestingly, the rate of decline in FPS appears to be faster for DL than both subtypes of VL as well. When comparing airways with four or more difficult airway characteristics to those with only one, VL FPS decreases by 11.5% (93.5% to 82.0%) while DL FPS decreases by 18.6% (84.2% to 65.6%). The benefits of VL may, therefore, be additive for increasingly difficult airways. Another interesting observation is that there did not appear to be any additive benefit for HAVL compared to SGVL for increasingly difficult airways.
The rate of adverse events for all difficult airways was 13.1%, which was similar between VL and DL. The choice of hyperangulated or standard geometry VL also did not appear to result in any difference in the rate of adverse events. The five most common adverse events among all difficult airways were hypoxia, hypotension, cardiac arrest, vomiting, and esophageal intubation. The remaining adverse events listed in the NEAR survey were extremely rare. We chose not to report the rate of hypotension alone, as this was likely affected more by medication selection and underlying patient physiology and
Western Journal of Emergency Medicine 712 Volume 23, no. 5: September 2022 DL Vs VL for Difficult Airway Patients in the ED: A National Emergency Airway Registry Study Ruderman et al.
pathology rather than the type of blade used.
We did observe a small but significant difference in the rate of esophageal intubations among DL first-pass intubations compared to VL. This result is consistent with the findings from multiple other studies that demonstrated a reduction in esophageal intubation rates with the use of VL. 5.21 Fortunately, this was still a relatively rare event for difficult airways, occurring in only 0.7% of all first attempts. Esophageal intubations can be corrected on subsequent attempts if recognized, but we were unable to determine whether there was any association with other serious adverse events such as hypoxia or cardiac arrest due the small sample size of esophageal intubations. Future studies with larger numbers of esophageal intubations may help clarify whether there exists any correlation with increased risk of other adverse events. Vomiting was also more than twice as common among difficult DL intubations compared to VL (1.4% vs 0.6%). The reason for this difference is not entirely known but may be related to less lifting force (and secondary opening of the upper esophageal sphincter) as well as less direct pharyngeal and vagal stimulation with VL than with DL.
Our findings are very relevant for clinical practice in emergency medicine, as repeated intubation attempts have been shown to be associated with an increase in periintubation adverse events; thus, FPS should be the primary goal for all emergent intubations.2,15,17 While the effect of VL on FPS for routine airways is less clear and still debated, our results in this large cohort are consistent with smaller studies and suggest that VL should be the device of choice for airway management in the difficult airway in the ED.7,8,14,24
LIMITATIONS
Our study has several important limitations. Although our data suggests an association between the use of VL and higher first-pass intubation success rates for difficult airways, we cannot determine a causal relationship due to the observational nature of this study and the inherent risk of confounding bias. Selection bias may also have occurred, as while we can report the type of laryngoscope used, it is not known why an operator may have selected it for a particular patient. The majority of our data also comes from academic EDs and, therefore, the rate of VL use and expected outcomes may not be generalizable to all settings, particularly more rural locations. In the most resource-limited settings and field environments, VL may not be feasible without the appropriate infrastructure or even an electrical grid. Additionally, preference for VL in academic institutions may contribute to underdeveloped DL skills among trainees and worse performance when confronted with difficult airways. Non-academic EDs with different patient and clinician populations and laryngoscope comfort may observe different results.
We did not compare operator preferences between academic and rural settings, as the proportion of data in the
NEAR registry from non-academic settings represents too small a sample size to draw conclusions. Future studies of FPS rates among difficult airways in rural and resource-limited settings would serve as a useful comparison to our data. These studies would also better allow educators to teach intubation methods with the highest likelihood of first-pass success depending on the learner’s practice setting.
Although this study’s findings indicate that VL improves FPS in patients with difficult airways, we cannot demonstrate whether the clinician’s predictions of difficulty were correct. Further research is needed to help physicians develop their ability to predict difficult airways and choose the best approach.25-26 Our finding that FPS for airways anticipated to be difficult was similar to those with anatomic predictors suggests, however, that physician gestalt may be a relatively accurate predictor. We chose our list of difficult airway characteristics based on frequently studied attributes (mouth opening, thyromental distance, Mallampati score, obstruction, neck mobility, etc).13-14 However, other difficult airway characteristics and confounders may not be included. Additionally, all the characteristics were based on a subjective assessment by the operator. Over time this subjective assessment through experience becomes an operator’s gestalt. The “LEMON” rule has often been applied in preoperative airway assessments and has been modified in previous studies to “LEON” as the Mallampati score is often not performed in the ED setting.25-27
Finally, there is potential for self-reporting bias, as failure at first attempt intubations could have potentially influenced how the operator entered the airway characteristics into the survey. The data also may have not been entered by the operator immediately after the intubation attempt due to the emergent nature of intubation and, therefore, could have been subject to recall bias. Although there is potential for self-reporting bias with selective reporting of intubation attempts and failures, we believe that the site requirement of 90% compliance with data entry should have minimized this potential bias.
CONCLUSION
We observed a higher overall first-pass success rate when using VL compared to DL in adult ED patients with characteristics of an anticipated or anatomically difficult airway. This advantage that VL offers appears to be additive as airways become increasingly difficult. The FPS rates between hyperangulated video laryngoscopy and standard geometry video laryngoscopy were similar for all difficult airway characteristics with the exception of “blood or vomit in the airway,” in which SGVL seemed to offer a slight advantage. Overall, the adverse event rates were similar between VL and DL with only the rates of esophageal intubation and vomiting being significantly lower with VL than DL. There was no difference in adverse event rates between SGVL and HAVL. Our data suggests that video laryngoscopy, either
Ruderman et al. DL Vs VL for Difficult Airway Patients in the ED: A National Emergency Airway Registry
Volume 23, no. 5: September 2022 713 Western Journal of Emergency Medicine
Study
hyperangulated or standard geometry, should in general be the primary device used for difficult airway management in the ED. Future studies in resource-limited settings may help determine whether these benefits remain true when operators have less experience and training with VL.
ACKNOWLEDGMENTS
We would like to acknowledge the contributions of all clinicians and participating institutions who completed NEAR data entry. We would also like to acknowledge and thank Ashley Morgan for her proofreading and editing assistance.
Acad Emerg Med. 2015;22(6):700-7.
7. Driver BE, Prekker ME, Moore JC, et al. Direct versus video laryngoscopy using the C-MAC for tracheal intubation in the emergency department, a randomized controlled trial. Acad Emerg Med. 2016;23(4):433-439.
8. Silverberg MJ, Li N, Acquah SO, et al. Comparison of video laryngoscopy versus direct laryngoscopy during urgent endotracheal intubation: a randomized controlled trial. Crit Care Med. 2015;43(3):636-41.
9. Lascarrou JB, Boisrame-Helms J, Bailly A, et al. Video laryngoscopy vs direct laryngoscopy on successful first-pass orotracheal intubation among ICU patients: a randomized clinical trial. JAMA. 2017;317(5):483-93.
Address for Correspondence: Brandon T. Ruderman, MD, Duke University Medical Center, 2301 Erwin Road, 2nd Floor Emergency Department, Box 3096, Durham, NC 27710. Email: brandon.ruderman@duke.edu.
Conflicts of Interest: By the WestJEM article submission agreement, all authors are required to disclose all affiliations, funding sources and financial or management relationships that could be perceived as potential sources of bias. No author has professional or financial relationships with any companies that are relevant to this study. There are no conflicts of interest or sources of funding to declare.
Copyright: © 2022 Ruderman et al. This is an open access article distributed in accordance with the terms of the Creative Commons Attribution (CC BY 4.0) License. See: http://creativecommons.org/ licenses/by/4.0/
10. Choi HJ, Kim Y, Oh YM, et al. Glidescope video laryngoscopy versus direct laryngoscopy in the emergency department: a propensity score-matched analysis. BMJ Open. 2015;5(5):e007884.
11. Su YC, Chen CC, Lee YK, et al. Comparison of video laryngoscopes with direct laryngoscopy for tracheal intubation: a meta-analysis of randomized trials. Eur J Anaesthesiol. 2011;28(11):788-95.
12. Lewis SR, Butler AR, Parker J, et al. Video laryngoscopy versus direct laryngoscopy for adult patients requiring tracheal intubation. Cochrane Database Syst Rev. 2016;11:CD011136.
13. Kim C, Kang HG, Lim TH, et al. What factors affect the success rate of the first attempt at endotracheal intubation in emergency departments? Emerg Med J. 2013;30(11):888-92.
14. Sakles JC, Patanwala AE, Mosier JM, et al. Comparison of video laryngoscopy to direct laryngoscopy for intubation of patients with difficult airway characteristics in the emergency department. Intern Emerg Med. 2014;9(1):93-8.
REFERENCES
1. Brown CA, 3rd, Bair AE, Pallin DJ, et al. Techniques, success, and adverse events of emergency department adult intubations. Ann of Emerg Med. 2015;65(4):363-70.
2. Hypes CD, Stolz U, Sakles JC, et al. Video laryngoscopy improves odds of first-attempt success at intubation in the intensive care unit: a propensity-matched analysis. Ann Am Thorac Soc. 2016;13(3):382-90.
3. Sakles JC, Mosier JM, Chiu S, et al. Tracheal intubation in the emergency department: a comparison of GlideScope(R) video laryngoscopy to direct laryngoscopy in 822 intubations. J of Emerg Med. 2012;42(4):400-5.
4. Sakles JC, Mosier J, Chiu S, et al. A comparison of the C-MAC video laryngoscope to the Macintosh direct laryngoscope for intubation in the emergency department. Ann of Emerg Med. 2012;60(6):739-48.
5. Park SO, Kim JW, Na JH, et al. Video laryngoscopy improves the first-attempt success in endotracheal intubation during cardiopulmonary resuscitation among novice physicians. Resuscitation. 2015;89:188-94.
6. Sakles JC, Javedani PP, Chase E, et al. The use of a video laryngoscope by emergency medicine residents is associated with a reduction in esophageal intubations in the emergency department.
15. Mort TC. Emergency tracheal intubation: complications associated with repeated laryngoscopic attempts. Anesth Analg. 2004;99(2):60313.
16. Hypes C, Sakles J, Joshi R, et al. Failure to achieve first attempt success at intubation using video laryngoscopy is associated with increased complications. Intern Emerg Med. 2016;12(8):1235-43.
17. Sakles JC, Chiu S, Mosier J. The importance of first pass success when performing orotracheal intubation in the emergency department. Acad Emerg Med. 2013;20(1):71-8.
18. Sakles JC, Mosier J, Patanwala AE, et al. Learning curves for direct laryngoscopy and Glidescope® video laryngoscopy in an emergency medicine residency. West J Emerg Med. 2014;15(7):930-7.
19. Sakles JC, Mosier JM, Patanwala AE, et al. The utility of the C-MAC as a direct laryngoscope for intubation in the emergency department. J Emerg Med. 2016;51(4):349-57.
20. Levitan RM. Video laryngoscopy, regardless of blade shape, still requires a backup plan. Ann of Emerg Med. 2013;61(4):421-2.
21. Bhattacharjee S, Maitra S, Baidya DK. A comparison between video laryngoscopy and direct laryngoscopy for endotracheal intubation in the emergency department: a meta-analysis of randomized controlled trials. J Clin Anesth. 2018;47:21-6.
22. Goksu E, Kilic T, Yildiz G, et al. Comparison of the C-MAC video laryngoscope to the Macintosh laryngoscope for intubation of blunt
Western Journal of Emergency Medicine 714 Volume 23, no. 5: September 2022 DL Vs VL for Difficult Airway Patients in the ED: A National Emergency Airway Registry Study Ruderman et al.
Ruderman et al. DL Vs VL for Difficult Airway Patients in the ED: A National Emergency Airway Registry Study
trauma patients in the ED. Turk J Emerg Med. 2016;16(2):53-6.
23. Kim JW, Park SO, Lee KR, et al. Video laryngoscopy vs. direct laryngoscopy: Which should be chosen for endotracheal intubation during cardiopulmonary resuscitation? A prospective randomized controlled study of experienced intubators. Resuscitation. 2016;105:196-202.
24. Michailidou M, O’Keeffe T, Mosier JM, et al. A comparison of video laryngoscopy to direct laryngoscopy for the emergency intubation of trauma patients. World J Surg. 2015;39(3):782-8.
25. Braude D. Difficult airways are “LEMONS”: updating the LEMON mnemonic to account for time and oxygen reserve. Ann of Emerg Med. 2006;47(6):581.
26. Levitan RM, Everett WW, Ochroch EA. Limitations of difficult airway prediction in patients intubated in the emergency department. Ann of Emerg Med. 2004;44(4):307-13.
27. Ji S, Moon E, Kim T, et al. Correlation between modified LEMON score and intubation difficulty in adult trauma patients undergoing emergency surgery. World J Emerg Surg. 2018;13(33):1-6.
Volume 23, no. 5: September 2022 715 Western Journal of Emergency Medicine
Pain Assessment in the Emergency Department: A Prospective Videotaped Study
Hao-Ping Hsu, MD* Ming-Tai Cheng, MD, MPH†‡ Tsung-Chien Lu, MD, PhD†‡ Yun Chang Chen, MD§ Edward Che-Wei Liao, MD† Chih-Wei Sung, MD¶ Chiat Qiao Liew, MD† Dean-An Ling, MD† Chia-Hsin Ko, BS† Nai-Wen Ku, NP, MSN† Li-Chen Fu, PhD|| Chien-Hua Huang, MD, PhD†‡ Chu-Lin Tsai, MD, ScD†‡
Section Editor: Cortlyn Brown, MD
National Taiwan University, College of Medicine, Department of Medicine, Taipei, Taiwan
National Taiwan University Hospital, Department of Emergency Medicine, Taipei, Taiwan National Taiwan University, College of Medicine, Department of Emergency Medicine, Taipei, Taiwan
National Taiwan University Hospital Yun-Lin Branch, Department of Emergency Medicine, Hsinchu, Taiwan
National Taiwan University Hospital Hsin-Chu Branch, Department of Emergency Medicine, Hsinchu, Taiwan
National Taiwan University, Department of Computer Science and Information Engineering, Taipei, Taiwan
Submission history: Submitted December 4, 2021; Revision received May 21, 2022; Accepted June 27, 2022 Electronically published August 28, 2022
Full text available through open access at http://escholarship.org/uc/uciem_westjem DOI: 10.5811/westjem.2022.6.55553
Introduction: Research suggests that pain assessment involves a complex interaction between patients and clinicians. We sought to assess the agreement between pain scores reported by the patients themselves and the clinician’s perception of a patient’s pain in the emergency department (ED). In addition, we attempted to identify patient and physician factors that lead to greater discrepancies in pain assessment.
Methods: We conducted a prospective observational study in the ED of a tertiary academic medical center. Using a standard protocol, trained research personnel prospectively enrolled adult patients who presented to the ED. The entire triage process was recorded, and triage data were collected. Pain scores were obtained from patients on a numeric rating scale of 0 to 10. Five physician raters provided their perception of pain ratings after reviewing videos.
Results: A total of 279 patients were enrolled. The mean age was 53 years. There were 141 (50.5%) female patients. The median self-reported pain score was 4 (interquartile range 0-6). There was a moderately positive correlation between self-reported pain scores and physician ratings of pain (correlation coefficient, 0.46; P <0.001), with a weighted kappa coefficient of 0.39. Some discrepancies were noted: 102 (37%) patients were rated at a much lower pain score, whereas 52 (19%) patients were given a much higher pain score from physician review. The distributions of chief complaints were different between the two groups. Physician raters tended to provide lower pain scores to younger (P = 0.02) and less ill patients (P = 0.008). Additionally, attending-level physician raters were more likely to provide a higher pain score than resident-level raters (P <0.001).
Conclusion: Patients’ self-reported pain scores correlate positively with the pain score provided by physicians, with only a moderate agreement between the two. Under- and over-estimations of pain in ED patients occur in different clinical scenarios. Pain assessment in the ED should consider both patient and physician factors. [West J Emerg Med. 2022;23(5)716–723.]
Western Journal of Emergency Medicine 716 Volume 23, no. 5: September 2022 Original Research
* † ‡ § ¶ ||
INTRODUCTION
Acute pain is one of the most common complaints of patients presenting to the emergency department (ED).1 Pain score is a valid and reliable tool to assess pain and may lead to better pain management.2,3 Both visual analog scales and numeric rating scales (NRS) are considered appropriate measurements of self-reported pain in the ED. 4 Some professional societies suggest that pain could and should be measured as a biologic metric akin to other vital signs. 5 However, the notion of pain assessment at all clinical encounters was not universally supported by medical professionals, as some studies have shown no significant improvement in pain management associated with pain measurements.6, 7
Inappropriate pain management, such as oligoanalgesia, remains common in the ED.8,9 Oligoanalgesia could be attributed to many reasons, one of which is the underappreciation of patient self-reported pain by healthcare professionals, leading to fewer pain medications.7,10 Although self-reported pain scores are traditionally viewed as the “gold standard” in pain assessment, some research studies suggest this simplistic approach ignores the complex relationship between patients and clinicians.11,12 Instead, pain assessment should be regarded as a social transaction between patients and clinicians.13 Despite the potentially complex construct underlying pain assessment, few studies have attempted to evaluate the agreement between patient self-reported pain and physicians’ perception of patient pain in the ED. In addition, little is known regarding factors associated with the discrepancy between the two approaches. Addressing these knowledge gaps may lead to a better and more holistic understanding of pain assessment.
Therefore, in this prospective study we sought to assess the agreement between pain scores reported by patients and those gauged by physicians. In addition, we attempted to identify patient and physician factors that lead to greater discrepancies in pain assessment.
METHODS
Study Design and Setting
From May 2020–January 2021, we conducted a prospective observational study in the ED of the National Taiwan University Hospital (NTUH). The NTUH is a tertiary academic medical center with approximately 2,400 beds and 100,000 ED visits per year. Trained research personnel prospectively enrolled patients who presented to the ED using a standard protocol. Inclusion criteria were age ≥20 years (legal age of majority in Taiwan) and the ability to provide informed consent. We excluded patients who needed immediate cardiopulmonary resuscitation, those with psychiatric complaints or consciousness disturbance, or those who needed isolation for infection control. A high-sensitivity camera and a clip-on Bluetooth microphone were set up to record the entire triage process, including patient facial images
Population Health Research Capsule
What do we already know about this issue? Research suggests that pain assessment involves a complex interaction between patients and clinicians.
What was the research question? We measured the agreement between pain scores reported by patients and pain assessed by emergency physicians via video review.
What was the major finding of the study? Patients’ self-reported pain scores correlated positively with the pain score provided by physicians (correlation coefficient 0.46, kappa 0.39), with only a moderate agreement.
How does this improve population health? Under- and over-estimations of pain in ED patients occur in different clinical scenarios. Pain assessment in the ED should encompass both patient and physician factors.
and conversations between patients and triage nurses (online Supplementary eFigure).
Measurements
In Taiwan, ED triage is conducted by senior ED triage nurses who are familiar with a computerized triage software called the Taiwan Triage and Acuity Scale (TTAS). The TTAS was adapted from the Canadian Triage and Acuity Scale (CTAS) and has been validated against hospitalization, length of ED stay, and resource utilization.14 The TTAS requires the input of pain scores on a NRS of 0 to 10, with 0 being no pain and 10 being the worst pain imaginable. Pain scores were directly solicited from patients unless they were not able to report it themselves. We further categorized the NRS scores into no (0), mild (1-3), moderate (4-6), and severe (7-10) pain.15
We also retrieved the computerized TTAS system that contains information on a total of 179 structured chief complaints. Based on the computerized algorithms, the TTAS classifies patients in the following order of acuity: level 1, resuscitation; level 2, emergent; level 3, urgent; level 4, less urgent; and level 5, non-urgent. Other triage data were collected, including demographics, mode of arrival, trauma mechanisms, work-related injury, past medical history, structured chief complaints, vital signs (temperature, heart rate, systolic and diastolic blood pressure, respiratory rate, oxygen saturation), body weight, height, and levels of consciousness coded per the Glasgow Coma Scale (GCS).
Volume 23, no. 5: September 2022 717 Western Journal of Emergency Medicine Hsu et al. Pain Assessment in the ED: A Prospective Videotaped Study
Video Data and Physician Review
The recorded videos underwent quality checks to ensure adequate sound and image quality. Five emergency physician reviewers (three senior residents and two attending physicians) were recruited and trained via educational meetings. Reviewers were provided with triage electronic health records but were blinded to the pain score documented; however, they may have overheard self-reported pain scores during the video review. Reviewers were asked to provide their perceived pain scores based on not only self-reported pain scores, but also objective clues, including chief complaints, facial expressions, body posture, vocalization, and vital signs.16-18 The physician-perceived pain scores were also rated on a NRS of 0 to 10, with 0 being no pain and 10 being the worst pain. The first five videos served as pilot data (four women and one man; mean age 67 years) and were rated by each reviewer. The intraclass correlation coefficient (ICC) that quantified the inter-observer agreement on perceived pain scoring between reviewers reached 0.59 for the pilot data. Afterward, the physician reviewers independently rated video recordings. Periodic investigator consensus meetings were held to discuss and resolve pain scoring issues.
This study was approved by the NTUH Institutional Review Board, and informed consent was obtained from all participants.
Statistical Analysis
Summary statistics are presented as proportions (with 95% confidence intervals [CI]), means (with SD), or medians (with interquartile ranges [IQRs]). We examined bivariate associations using Student’s t-tests, Mann-Whitney tests, Fisher’s exact tests, and chi-square tests, as appropriate. The agreement of pain scoring was measured by the kappa statistic with quadratic weighting. We also used the ICC and Spearman’s correlation. A Bland-Altman plot was performed to assess the agreement of pain scoring between patient self-report and physician ratings of pain. We used a two-way scatterplot to depict the relationship between the two scoring approaches with a best-fit linear regression line.
Previous studies have shown that an approximately 1.30to 1.65-point is the minimal clinically important difference (MCID) in the NRS from 0-10.19-21 As such, for this study we defined a ≥2-point difference in pain score as a significant discrepancy. Patients were then divided into two groups: group A with a significantly (≥2 points) lower pain rating from physician reviewers and group B with a significantly (≥2 points) higher pain rating from physician reviewers. A subset of group B (termed a vague-pain or suffering group) consisted of patients with a self-reported pain score of zero but received at least 2 points in pain score from physician reviewers. We anticipated that the mean of differences between self-reports and physician ratings would be 0.5 and the SD of differences would be 0.65.19-21 Using the sample size calculation for assessing agreement between the two methods with an MCID of 2, a two-sided alpha of 0.05, and 90% power, we estimated that 259 subjects would need to be enrolled.22 We performed all analyses using Stata 16.0
software (StataCorp, College Station, TX). All P-values are two-sided, with P <0.05 considered statistically significant.
RESULTS
Figure 1 shows the patient selection process. In total, 860 patients were approached, and 560 patients were excluded owing to refusal to participate or ineligibility (age <20 years, psychiatric complaints, and consciousness disturbance). Among 300 enrolled patients, 16 patients were excluded because of video or sound issues, and five patients were used as pilot data. Overall, 279 patients were included in the final analysis.
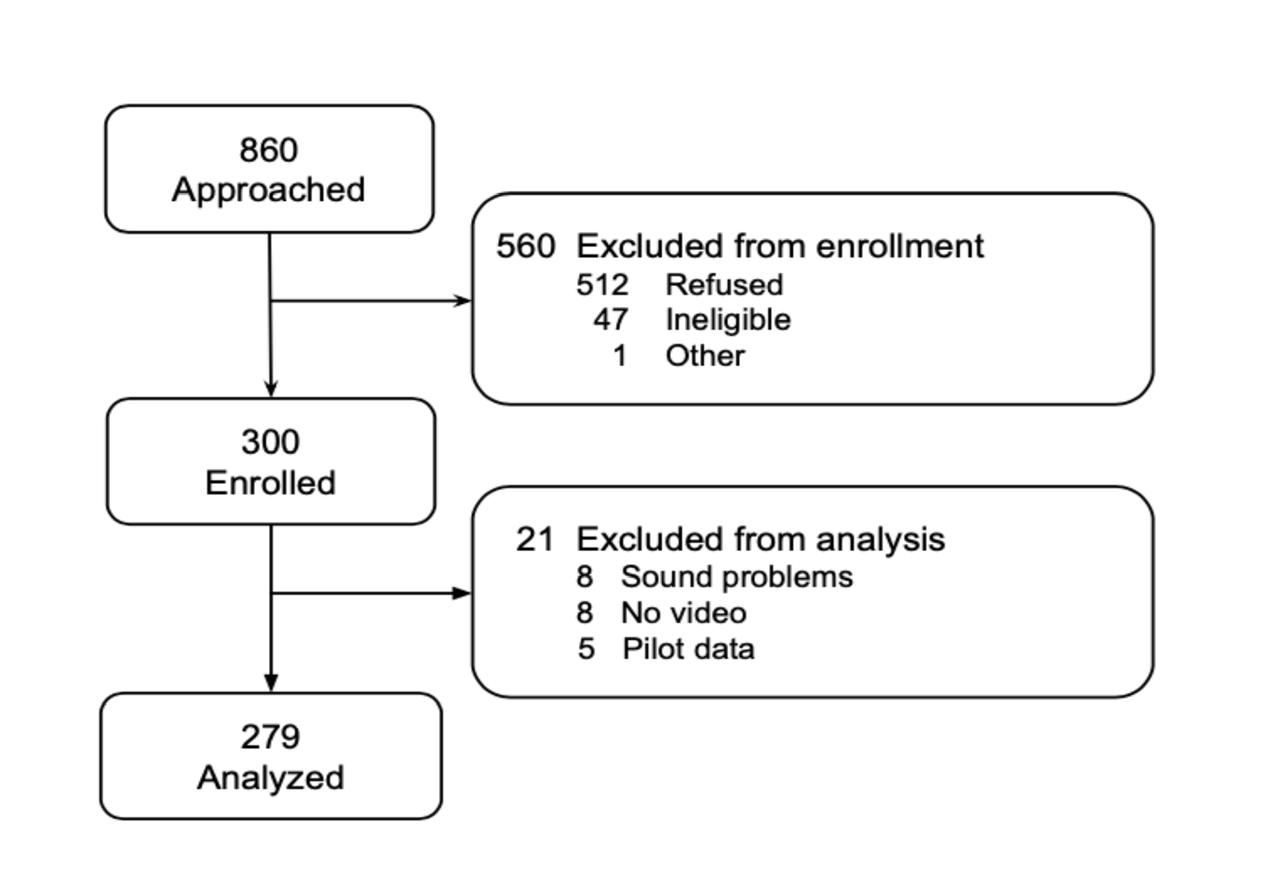
Figure 1. Flow diagram of patient selection process for study comparing patient and physician pain scoring at emergency department triage.
Table 1 presents the clinical characteristics of patients. The mean age of the patients was 53.3 years, and 138 patients (50%) were male. All patients were Asian. The median selfreported pain score was 4 (IQR 0-6). A total of 125 patients (45%) reported no pain, 14 patients (5%) reported mild pain, 92 patients (33%) reported moderate pain, and 48 patients (17%) reported severe pain. Most patients were triaged to level 3, and the triage duration was about 2-3 minutes. Trauma/injuries (14%), abdominal pain (11%), fever (8%), dizziness and vertigo (8%), and chest pain (7%) were the top five most common chief complaints.
Figure 2 represents the scatterplot of self-reported pain scores and physician ratings of pain. The relationship between the two approaches appeared to be positive (regression coefficient = 0.30; 95% CI 0.23-0.38, P < 0.001). There was a 0.3-point increase in physician rating per 1-unit increase in self-reported pain score. The correlation coefficient also showed a moderately positive correlation (0.46, P < 0.001). The ICC between the two scoring systems was 0.55. Table 2 shows the cross-tabulation of the two scoring systems. The weighted kappa coefficient was 0.39, suggesting a moderate agreement.
Figure 3 depicts the Bland-Altman plot of the physicianand self-reported pain scores. The green line represents the
Western Journal of Emergency Medicine 718 Volume 23, no. 5: September 2022 Pain Assessment in the ED: A Prospective Videotaped Study Hsu et al.
Table 1. Baseline clinical characteristics of emergency department patients.
Variable (N = 279)
Age, mean (SD), year 53.3 (19.3)
Male gender, n (%) 138 (49.5)
Asian race, n (%) 279 (100)
Self-reported pain score, median (IQR) 4 (0-6)
Self-reported pain intensity, n (%)
No pain (0) 125 (44.8)
Mild (1-3) 14 (5.0)
Moderate (4-6) 92 (33.0)
Severe (7-10) 48 (17.2)
TTAS Triage level, n (%)
1 3 (1.1)
2 38 (13.6)
3 205 (73.5)
4 28 (10.0)
5 5 (1.8)
Triage duration, median (IQR), minutes: seconds 2:42 (2:12-3:19)
Top 5 chief complaints, n (%)
Trauma/Injuries 40 (14.3)
Abdominal pain 30 (10.8)
Fever 23 (8.2)
Dizziness and vertigo 21 (7.5)
Chest pain 20 (7.2)
IQR, interquartile range; TTAS, Taiwan Triage and Acuity Scale.
mean difference between the patient and physician scores (0.74; 95% CI 0.41-1.07). The green line was slightly above zero, indicating that patients rated their pain slightly higher than physicians’ perception. Some degree of disagreement was noted, as indicated by data points ≥ the two-point MCID or even beyond the statistical limits of agreement (ie, outside the shaded box). Most of the disagreements occurred in the middle range (moderate pain).
Among the 279 patients, 102 patients were rated at a much lower pain score (group A), whereas 52 patients were given a much higher pain score (group B). The baseline characteristics of patient groups A and B are listed in Table 3 Physician raters tended to give lower pain scores to younger and less ill (ie, lower triage levels) patients. We detected no differences in patient gender between the two groups. The distributions of chief complaints were quite different between the two groups. The most common chief complaints in group A were injuries (24%), abdominal pain (20%), soft tissue redness and swelling (11%), and chest pain (10%). In contrast, the most frequent chief complaints in group B were dizziness and vertigo (19%), fever (10%), and nausea and vomiting (8%). Regarding the rater-level influences, resident-level physician raters were more likely to give a lower pain score in group A. In contrast, attending-level physician raters were more likely to provide a higher pain score in group B.
In a subgroup analysis of group B, 49 patients were considered to have vague pain (Table 4). The most common chief complaints included dizziness and vertigo (18%), fever (10%), nausea and vomiting (8%), general weakness (6%), or injuries (6%). The median score given by the physician raters was 3 (IQR 2-4).
DISCUSSION
In this prospective videotaped study, we found a moderate agreement between pain scores reported by patients and those given by physicians. In addition, physician raters tended to give lower pain scores to younger patients and patients with a lower triage level. By contrast, attending-level physician raters were more likely to provide a higher pain score, particularly for those suffering from illnesses not directly related to pain.
Figure 2. The scatterplot of self-reported pain scores and physicians’ ratings of pain. The line indicates the best-fit linear regression line. The sizes of circles are proportional to the number of observations.
For group A, the results revealed that many patients reported higher pain scores than those based on physicians’ evaluations, a finding that is consistent with previous reports.23, 24 A common explanation for this discrepancy is that healthcare professionals frequently assess pain based on their experience rather than patients’ feelings.25, 26 Therefore, physicians tend to give lower pain scores when considering chief complaints that they thought were not that painful (eg, cellulitis).24 On the other hand, previous studies have demonstrated that patients tended to report inconsistent pain scores to nurses and treating physicians. For example, patients with foot and ankle problems reported higher pain scores to the surgeon than those to the nurse, perhaps to justify the urgency of their problems and receive quicker
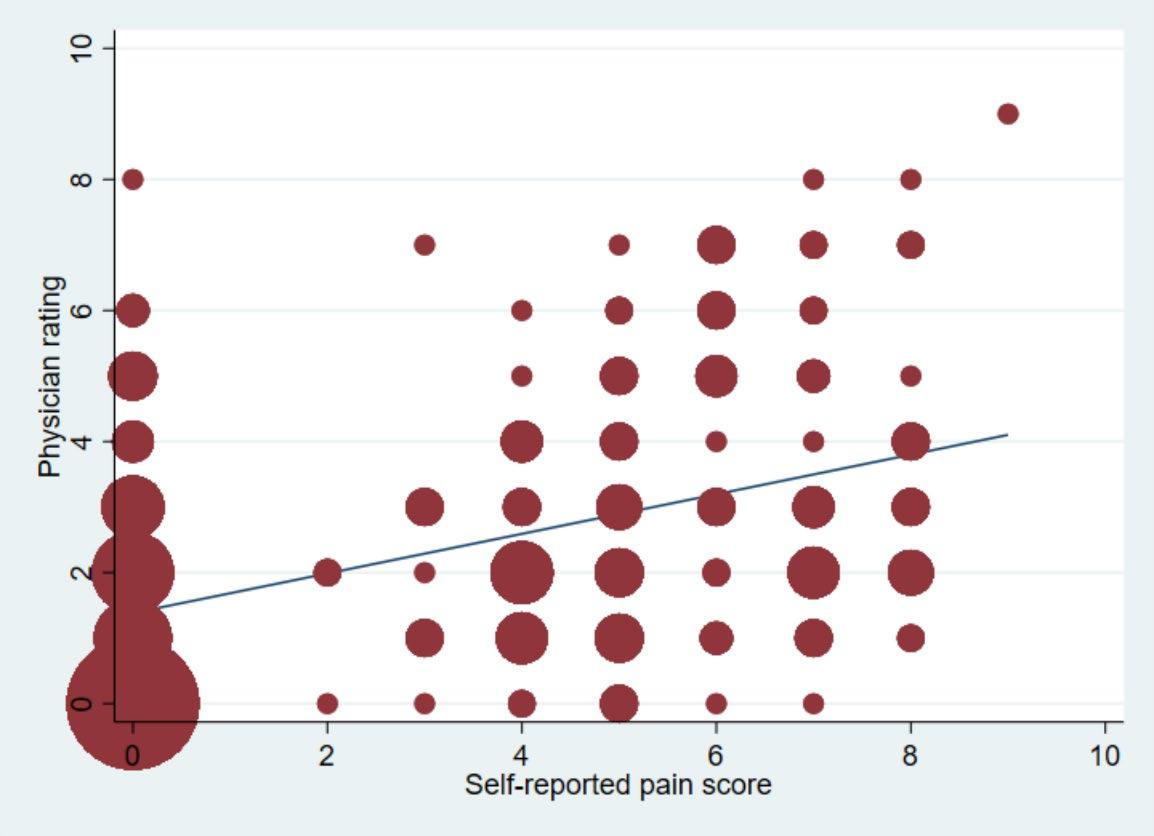
Volume 23, no. 5: September 2022 719 Western Journal of Emergency Medicine Hsu et al. Pain Assessment in the ED: A Prospective Videotaped Study
Physician ratings selfreport Pain Score
Figure 3. The Bland-Altman plot of the agreement between self-reported pain scores and physicians’ ratings of pain. The green line represents the mean difference between the patient and physician scores. The shaded box is bounded by the statistical limits of agreement (defined as the mean difference ± 1.96 SD of differences).
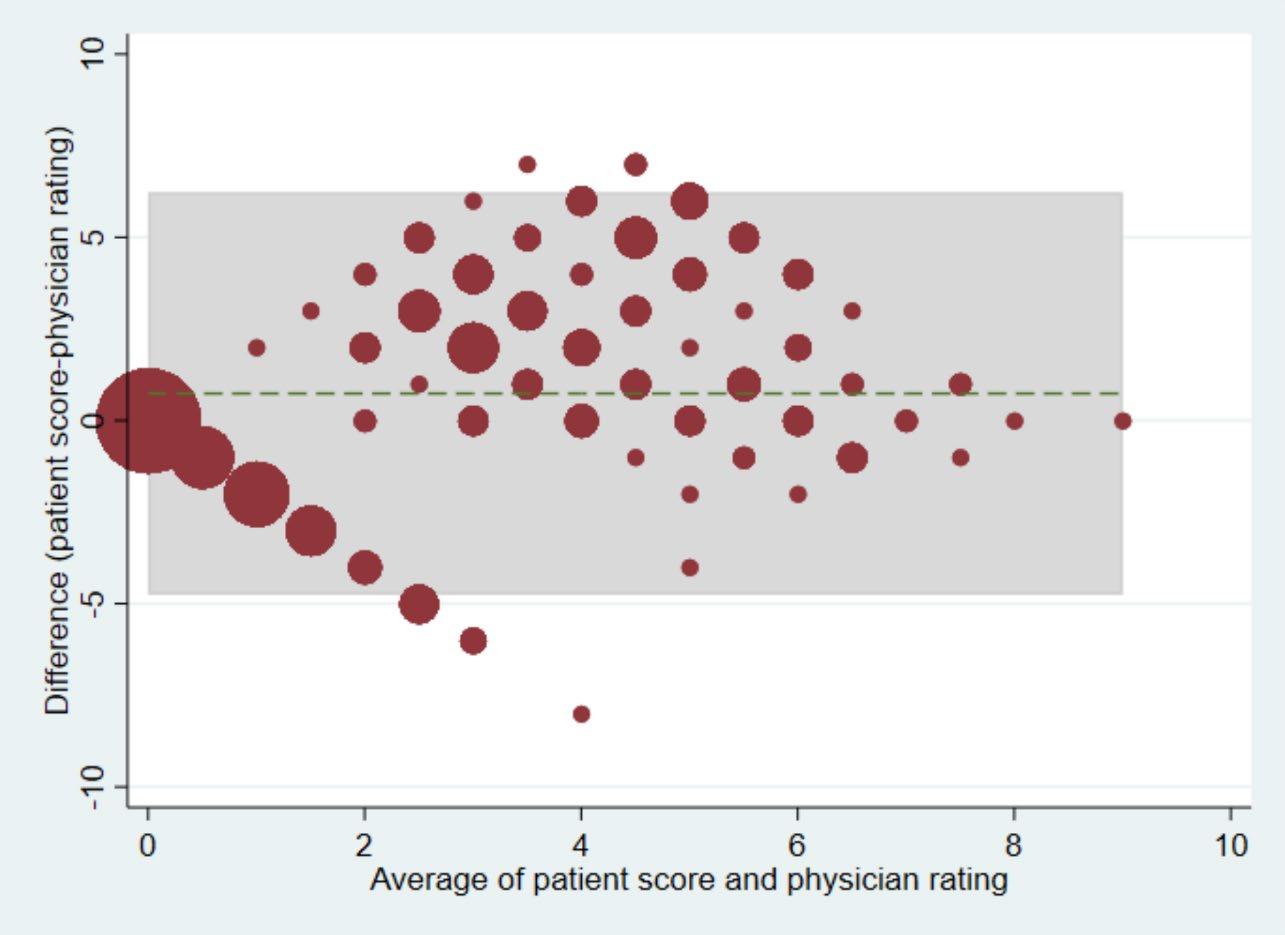
treatments. 27, 28 Alternatively, ED patients, especially those suffering from pain, might be anxious regarding their problems and hence were unable to gauge their painful feelings precisely.13 Taken together, it is prudent to evaluate pain not solely based on self-reported pain scores, which could be an overestimation and potentially lead to unnecessary analgesics.29
For group B, physician raters perceived that some patients might be experiencing a greater deal of pain than they reported. For the vague-pain group (a subset of group B), physician raters
perceived some pain when none was reported by the patient. Patients may appear to have suffered from their non-painful symptoms (eg, vertigo, vomiting), which may have resulted in the perception of pain by the physician. For example, the physician raters in our study may have noticed non-verbal cues from patients’ facial expressions, body language, and conversations with triage nurses and assigned a non-zero pain score.16 Alternatively, patients may have skipped detailed descriptions of their illnesses at ED triage until they encountered the treating physician. For example, patients presenting with nausea/vomiting might also experience headaches or abdominal pain that were not reported at triage. Regardless, ED patients may suffer from a generalized form of suffering that may not be necessarily contributed to nociceptive stimuli. Solely focusing on nociception may risk neglecting other sources of suffering, both physical (eg, vague pain) and mental (eg, stress).30, 31
Previous studies have shown that younger age, female gender, and ED diagnoses of headache and back pain were associated with higher self-reported pain scores.32, 33 Our study confirmed that younger age might be related to an overestimation of pain intensity. In addition, we also found patients with a lower triage level were also more likely to report a higher pain score. Regarding physician-level factors, previous studies have shown that female emergency physicians were more likely to administer analgesics than male physicians,34 while non-White physicians achieved better pain relief than White physicians with less analgesics.35 In this study, resident raters may tend to under-appreciate patients’ degree of pain, while senior attending physicians may be better at identifying non-verbal clues on pain intensity. These findings may again support the notion that pain
Western Journal of Emergency Medicine 720 Volume 23, no. 5: September 2022 Pain Assessment in the ED: A Prospective Videotaped Study Hsu et al.
Patient
Pain score 0 1 2 3 4 5 6 7 8 9 10 Total 0 57 19 21 12 5 7 3 0 1 0 0 125 1 0 0 0 0 0 0 0 0 0 0 0 0 2 1 0 2 0 0 0 0 0 0 0 0 3 3 1 4 1 4 0 0 0 1 0 0 0 11 4 2 8 12 4 5 1 1 0 0 0 0 33 5 4 7 7 6 4 4 2 1 0 0 0 35 6 1 3 2 4 1 5 4 4 0 0 0 24 7 1 4 8 5 1 3 2 2 1 0 0 27 8 0 2 6 4 4 1 0 2 1 0 0 20 9 0 0 0 0 0 0 0 0 0 1 0 1 10 0 0 0 0 0 0 0 0 0 0 0 0 Total 67 47 59 39 20 21 12 10 3 1 0 279 Table 2. Interrater agreement of pain scoring between patient self-reports and physician ratings of patients’ pain.
Table 3. Baseline patient characteristics by agreement status of pain scoring.
Group Aa N = 102
Group Bb N = 52 P-value
Age, mean (SD), years 49.8 (19.6) 57.4 (18.4) 0.02
Female gender, n (%) 53 (52.0) 31 (59.6) 0.37
TTAS Triage level, n (%) 0.01
1 0 (0) 2 (3.8)
2 10 (9.8) 11 (21.2)
3 78 (76.5) 37 (71.2)
4 13 (12.8) 1 (1.9)
5 1 (1.0) 1 (1.9)
Most common chief complaint, n (%)
Most common chief complaint, n (%)
Traumatic injuries 24 (23.5) Dizziness/vertigo 10 (19.2)
Abdominal pain 20 (19.6) Fever 5 (9.6)
Soft tissue redness/ swelling 11 (10.8) Nausea/vomiting 4 (7.7)
Chest pain 10 (9.8) Injuries 3 (5.8)
Fever 4 (3.9) General weakness 3 (5.8)
Teeth/gum pain 4 (3.9) Chest pain 2 (3.9)
Urinary tract symptoms 4 (3.9) Soft tissue redness/ swelling 2 (3.9)
Skin rash 3 (2.9) Edema 2 (3.9)
Flank pain 3 (2.9) Cough 2 (3.9)
Attending-level physician rater, n (%) 16 (15.7) 33 (63.5) <0.001
aPhysician rating is lower than patient self-report by at least 2 points. bPhysician rating is higher than patient self-report by at least 2 points. TTAS, Taiwan Triage and Acuity Scale.
Table 4. The most common chief complaints in the vague-pain group.
Chief complaint (N = 49) Dizziness and vertigo, n (%) 9 (18.4)
Fever, n (%) 5 (10.2) Nausea and vomiting, n (%) 4 (8.2)
General weakness, n (%) 3 (6.1)
Injuries, n (%) 3 (6.1)
assessment is the social exchange of subjective and objective meanings between the patient and clinician.13 As an alternative approach, recent studies have begun to test more objective measurement tools, such as automated pain assessment, by analyzing facial expressions via machine learning methods.36
Moreover, race and ethnicity play an important role in a physician’s perception of a patient’s pain. For example, the pain of Black Americans is often underdiagnosed and undertreated in the US, compared to that of their White counterparts.37, 38 The racial disparities may, in part, result from clinician factors.
In experimental studies, participants showed more stringent thresholds for perceiving pain on Black faces, compared to White faces.39, 40 In our study, all the participants were Asian, and only 17% of them reported severe pain. The low rate of severe pain in Asians may result from cultural beliefs of Buddhism (eg, enduring pain as a way for individual growth) and increased pain tolerance.41, 42 In the US, Asian Americans showed the lowest pain prevalence across all chronic pain conditions in the National Health Interview Survey.43 In emergency medical services treatment in Oregon, Asian and Hispanic patients were less likely to receive a pain assessment, and all racial/ethnic patients were less likely to receive pain medications compared with White patients.44 Taken together, clinicians should be aware of cultural implications of pain across racially and ethnically diverse patient populations to reduce disparities in pain assessment and treatment.
LIMITATIONS
This study has some potential limitations. First, selfreported pain scores may be limited by patients’ personal experiences, educational levels, and cognitive status.45 We
Volume 23, no. 5: September 2022 721 Western Journal of Emergency Medicine Hsu et al. Pain Assessment in the ED: A Prospective Videotaped Study
Pain Assessment in the ED: Prospective Videotaped Study
excluded patients with psychiatric complaints or consciousness disturbance, and the results cannot be generalized to them. Patients’ verbal and non-verbal reactions might also be modified by video recording (ie, the Hawthorne effect). Second, five physician raters individually scored patients and the initial ICC for agreement was relatively low. Although investigator meetings were held to strengthen consensus on pain assessment, subtle variations may still exist. Third, we did not relate pain assessment to actual pain medications during the ED stay. This information would be helpful to elucidate the role of pain assessment in ED analgesia. Fourth, we did not edit the videos to remove the self-reported pain scores, which may have affected the physician ratings. However, the reviewers were also asked to focus on the objective clues, and we were able to detect the discrepancies between self-reported pain scores and physician perceptions of a patient’s pain. Finally, during the coronavirus 2019 pandemic, patients were asked to wear a mask in our ED, which resulted in some loss of access to facial expressions and slightly altered vocalizations.
CONCLUSION
In this prospective videotaped study, patients’ selfreported pain scores correlate positively with the pain score provided by physicians, with only a moderate agreement. Under- and over-estimations of pain in ED patients occur in different clinical scenarios that deserve a closer look by the treating physician. Pain assessment in the ED requires a multifaceted approach considering both patient- and physician-related factors.
ACKNOWLEDGMENTS
We thank the NTUH triage nurses (Pei-Chun Hsieh, ChenYin Yeh, Hsiu-Yen Lin, and Yi-Shan Lin) for their support of the research and their ongoing dedication to emergency care.
Address for Correspondence: Chu-Lin Tsai, MD, ScD, National Taiwan University Hospital, Department of Emergency Medicine, 7 Zhongshan S. Rd, Taipei 100, Taiwan. Email: chulintsai@ntu.edu.tw.
Conflicts of Interest: By the WestJEM article submission agreement, all authors are required to disclose all affiliations, funding sources and financial or management relationships that could be perceived as potential sources of bias. No author has professional or financial relationships with any companies that are relevant to this study. This project was supported by grants from the Ministry of Science and Technology (110-2634-F-002-046 and 111-2314-B-002-264) and the National Taiwan University Hospital (111-CGN-0005). There are no conflicts of interest to declare.
Copyright: © 2022 Hsu et al. This is an open access article distributed in accordance with the terms of the Creative Commons Attribution (CC BY 4.0) License. See: http://creativecommons.org/ licenses/by/4.0
REFERENCES
1. Cordell WH, Keene KK, Giles BK, et al. The high prevalence of pain in emergency medical care. Am J Emerg Med 2002;20:165-9.
2. Slka PA, Roth MM, Moreno G, et al. Pain scores improve analgesic administration patterns for trauma patients in the emergency department. Acad Emerg Med. 2004;11:264-70.
3. Nelson BP, Cohen D, Lander O, et al. Mandated pain scales improve frequency of ED analgesic administration. Am J Emerg Med. 2004;22:582-5.
4. Karcioglu O, Topacoglu H, Dikme O, et al. A systematic review of the pain scales in adults: which to use? Am J Emerg Med. 2018;36:707-14.
5. Quality improvement guidelines for the treatment of acute pain and cancer pain. American Pain Society Quality of Care Committee. JAMA. 1995;274:1874-80.
6. Mularski RA, White-Chu F, Overbay D, et al. Measuring pain as the 5th vital sign does not improve quality of pain management. J Gen Intern Med. 2006;21:607-12.
7. Kutluturkan S, Urvaylioglu AE. Evaluation of pain as a fifth vital sign: nurses’ opinions and Beliefs. Asia Pac J Oncol Nurs. 2020;7:88-94.
8. Wilson JE, Pendleton JM. Oligoanalgesia in the emergency department. Am J Emerg Med. 1989;7:620-3.
9. Rupp T, Delaney KA. Inadequate analgesia in emergency medicine. Ann Emerg Med. 2004;43:494-503.
10. Miner J, Biros MH, Trainor A, et al. Patient and physician perceptions as risk factors for oligoanalgesia: a prospective observational study of the relief of pain in the emergency department. Acad Emerg Med. 2006;13:140-6.
11. de Williams AC, Davies HTO, Chadury Y. Simple pain rating scales hide complex idiosyncratic meanings. Pain. 2000;85:457-63.
12. Huber A, Suman AL, Rendo CA, et al. Dimensions of “unidimensional” ratings of pain and emotions in patients with chronic musculoskeletal pain. Pain. 2007;130:216-24.
13. Schiavenato M, Craig KD. Pain assessment as a social transaction: beyond the “gold standard.” Clin J Pain. 2010;26:667-76.
14. Ng CJ, Yen ZS, Tsai JC, et al. Validation of the Taiwan Triage and Acuity Scale: a new computerised five-level triage system. Emerg Med J. 2011;28:1026-31.
15. Boonstra AM, Stewart RE, Koke AJ, et al. Cut-off points for mild, moderate, and severe pain on the numeric rating scale for pain in patients with chronic musculoskeletal pain: variability and influence of sex and catastrophizing. Front Psychol. 2016;7:1466.
16. Chanques G, Payen JF, Mercier G, et al. Assessing pain in nonintubated critically ill patients unable to self report: an adaptation of the Behavioral Pain Scale. Intensive Care Med. 2009;35:2060-7.
17. Gélinas C, Fortier M, Viens C, et al. Pain assessment and management in critically ill intubated patients: a retrospective study. Am J Crit: an official publication, American Association of Critical-Care Nurses 2004;13:126-35.
Western Journal of Emergency Medicine 722 Volume 23, no. 5: September 2022
A
Hsu et al.
18. Odhner M, Wegman D, Freeland N, et al. Assessing pain control in nonverbal critically ill adults. Dimens Crit Care Nurs. 2003;22:2607.
19. Kendrick DB, Strout TD. The minimum clinically significant difference in patient-assigned numeric scores for pain. Am J Emerg Med. 2005;23:828-32.
20. Bahreini M, Safaie A, Mirfazaelian H, et al. How much change in pain score does really matter to patients? Am J Emerg Med. 2020;38:1641-6.
21. Bijur PE, Latimer CT, Gallagher EJ. Validation of a verbally administered numerical rating scale of acute pain for use in the emergency department. Acad Emerg Med. 2003;10:390-2.
22. Lu MJ, Zhong WH, Liu YX, et al. Sample size for assessing agreement between two methods of measurement by BlandAltman method. Int J Biostat . 2016;12(2).
23. Cakir U, Cete Y, Yigit O, et al. Improvement in physician pain perception with using pain scales. Eur J Trauma Emerg Surg. 2018;44:909-15.
24. Baharuddin KA, Mohamad N, Nik Abdul Rahman NH, et al. Assessing patient pain scores in the emergency department. Malays J Med Sci. 2010;17:17-22.
25. Vuille M, Foerster M, Foucault E, et al. Pain assessment by emergency nurses at triage in the emergency department: a qualitative study. J Clin Nurs. 2018;27:669-76.
26. Sampson FC, Goodacre SW, O’Cathain A. The reality of pain scoring in the emergency department: findings from a multiple case study design. Ann Emerg Med. 2019;74:538-48.
27. Martin KD, Van Buren JP, Wake J, et al. Comparison of visual analog pain score reported to physician vs nurse. Foot Ankle Int. 2018;39:300-3.
28. Martin KD, McBride T, Wake J, et al. Comparison of visual analog pain score reported to physician vs nurse in nonoperatively treated foot and ankle patients. Foot Ankle Int. 2018;39:1444-8.
29. Levy N, Sturgess J, Mills P. “Pain as the fifth vital sign” and dependence on the “numerical pain scale” is being abandoned in the US: Why? Br J Anaesth. 2018;120:435-8.
30. Body R, Kaide E, Kendal S, et al. Not all suffering is pain: Sources of patients’ suffering in the emergency department call for improvements in communication from practitioners. Emerg Med J. 2015;32:15-20.
31. Body R, Foex BA. Optimising well-being: Is it the pain or the hurt that matters? Emerg Med J. 2012;29:91-4.
32. Marco CA, Nagel J, Klink E, et al. Factors associated with selfreported pain scores among ED patients. Am J Emerg Med. 2012;30:331-7.
33. Marco CA, Kanitz W, Jolly M. pain scores among emergency department (ED) patients: comparison by ED diagnosis. J Emerg Med. 2013;44:46-52.
34. Safdar B, Heins A, Homel P, et al. Impact of physician and patient gender on pain management in the emergency department--a multicenter study. Pain Med. 2009;10:364-72.
35. Heins A, Homel P, Safdar B, et al. Physician race/ethnicity predicts successful emergency department analgesia. J Pain. 2010;11:6927.
36. Hassan T, Seus D, Wollenberg J, et al. Automatic detection of pain from facial expressions: a survey. IEEE Trans Pattern Anal Mach Intell. 2021;43:1815-31.
37. Knoebel RW, Starck JV, Miller P. Treatment disparities among the Black population and their influence on the equitable management of chronic pain. Health Equity. 2021;5:596-605.
38. Tsai CL, Sullivan AF, Gordon JA, et al. Racial/ethnic differences in emergency care for joint dislocation in 53 US EDs. Am J Emerg Med. 2012;30:1970-80.
39. Mathur VA, Richeson JA, Paice JA, et al. Racial bias in pain perception and response: experimental examination of automatic and deliberate processes. J Pain. 2014;15:476-84.
40. Mende-Siedlecki P, Qu-Lee J, Backer R, et al. Perceptual contributions to racial bias in pain recognition. J Exp Psychol Gen. 2019;148:863-89.
41. Chen LM, Miaskowski C, Dodd M, et al. Concepts within the Chinese culture that influence the cancer pain experience. Cancer Nurs. 2008;31:103-8.
42. Meints SM, Cortes A, Morais CA, et al. Racial and ethnic differences in the experience and treatment of noncancer pain. Pain Manag. 2019;9:317-34.
43. Zajacova A, Grol-Prokopczyk H, Fillingim R. Beyond Black vs White: racial/ethnic disparities in chronic pain including Hispanic, Asian, Native American, and multiracial US adults. Pain. 2022.
44. Kennel J, Withers E, Parsons N, et al. Racial/ethnic disparities in pain treatment: evidence from Oregon emergency medical services agencies. Med Care. 2019;57:924-9.
45. Bijur PE, Chang AK, Esses D, et al. Problems with measurement of the minimum clinically significant difference in acute pain in elders. Acad Emerg Med. 2011;18:135-9.
Volume 23, no. 5: September 2022 723 Western Journal of Emergency Medicine Hsu et al. Pain Assessment in the ED: A Prospective Videotaped Study
Where Have All the FLOWERS Gone? A Multicenter Investigation of Frequent Users of Midwest Emergency Department Services During the COVID-19 Stay-at-home Orders
Howard W. Levitin, MD Bruce G. Jones, DO Marie M. Lockhart, PhD Christopher M. Lloyd, DO Meenal D. Sharkey, MD Paul A. Willette, DO Andrew F. Kalnow, DO
Section Editor: Jeremy Hess, MD, MPH
OhioHealth Doctors Hospital, Department of Emergency Medicine, Columbus, Ohio
Submission history: Submitted December 16, 2021; Revision received June 14, 2022; Accepted July 19, 2022
Electronically published September 15, 2022
Full text available through open access at http://escholarship.org/uc/uciem_westjem DOI: 10.5811/westjem.2022.7.55727
Introduction: In this study we aimed to determine the impact of the mandatory coronavirus disease 2019 (COVID-19) pandemic stay-at-home order on the proportional makeup of emergency department (ED) visits by frequent users and super users.
Methods: We conducted a secondary analysis of existing data using a multisite review of the medical records of 280,053 patients to measure the impact of the COVID-19 pandemic stay-athome order on ED visits. The primary outcomes included analysis before and during the lockdown in determining ED use and unique characteristics of non-frequent, frequent, and super users of emergency services.
Results: During the mandatory COVID-19 stay-at-home order (lockdown), the percentage of frequent users increased from 7.8% (pre-lockdown) to 21.8%. Super users increased from 0.7% to 4.7%, while non-frequent users dropped from 91.5% to 73.4%. Frequent users comprised 23.7% of all visits (4% increase), while super user encounters (4.7%) increased by 53%. Patients who used Medicaid and Medicare increased by 39.3% and 4.6%, respectively, while those who were uninsured increased ED use by 190.3% during the lockdown.
Conclusion: When barriers to accessing healthcare are implemented as part of a broader measure to reduce the spread of an infectious agent, individuals reliant on these services are more likely to seek out the ED for their medical needs. Policymakers considering future pandemic planning should consider this finding to ensure that vital healthcare resources are allocated appropriately. [West J Emerg Med. 2022;23(5)724–733.]
INTRODUCTION
Background
On March 13, 2020, the United States issued a National Emergency Declaration to slow the spread of the severe acute
respiratory syndrome coronavirus 2 (SARS-CoV-2), the causative agent of the infectious coronavirus disease 2019 (COVID-19). Most state governors executed this declaration by implementing stay-at-home orders designed to limit
Western Journal of Emergency Medicine 724 Volume 23, no. 5: September 2022 Original Research
people’s movement in public and reduce viral spread.1 These orders, directly and indirectly, resulted in a 42% reduction in emergency department (ED) visits nationally for a broad range of medical conditions and patient concerns.2-6
What is unknown about the lockdown is whether the decrease in ED visits was uniform across all patient demographics or whether there were specific subgroups, such as frequent ED users (FEDU), whose habits deviated from this trend. Frequent ED users are patients who historically consume a significant percentage of acute care resources.7,8 In general, these individuals have four or more ED visits per year, are more likely to suffer from three or more chronic medical conditions, have a higher incidence of mental health problems and substance use disorder, and account for a disproportionate amount of healthcare costs.9-12 The FEDU tend to be socioeconomically disadvantaged and have higher usage rates of outpatient offerings (eg, social work services, addiction treatment, psychiatric counseling) than non-frequent ED users (NFEDU).10,11 Overall, persons who seek out acute care more than four times per year represent between 3.5-29% of all ED patients but constitute 12.1-67% of all ED visits made.12
A subset of frequent users visits the ED 10 or more times per year. These ED super users (EDSU) account for only 2.6-6.1% of all ED patients but comprise 16.2% of Medicare patients (≥65 years), 26.2% of Medicare patients (age 1 to 64 years), 16.7% of Medicaid patients, and 10.5% of those patients with private insurance. Only 3.7% of all Medicaid ED patients were super users, but they accounted for more than five times the average ED charge.12
The frequent utilization of midwest emergency room services (FLOWERS) study is a retrospective analysis of the effects of the stay-at-home order on the use of ED services by FEDU and EDSU during the early phase of the COVID-19 pandemic. This investigation included 20 EDs with diverse demographics, economic bases, and hospital types (eg, tertiary referral hospitals, trauma centers, academic and community hospitals, and freestanding EDs).
Importance
Barriers to accessing healthcare services more commonly affect the impoverished, children, those with chronic illnesses, immigrants, the uninsured, and those with psychiatric and substance abuse disorders. Such barriers often lead to poorer health outcomes.13 When access to primary medical care is limited or reduced, patients commonly seek out services in the ED.14,15 The COVID-19 stay-at-home order was an emergency public health measure implemented in Ohio to help reduce community spread of disease during the pandemic. This measure created a broad, temporary barrier to healthcare access and a unique opportunity to assess its impact on at-risk patients who frequently use the ED for their healthcare needs.
The COVID-19 pandemic resulted in a marked drop in ED visits throughout the US and most of the world.2 This reduction occurred against a backdrop of rising morbidity and
Population Health Research Capsule
What do we already know about this issue?
COVID stay-at-home orders implemented by state governors contributed to a 42% reduction in ED visits nationally for a broad range of medical conditions and patient concerns.
What was the research question?
Was the decrease in ED visits during the COVID-19 lockdown uniform across all patient demographics?
What was the major finding of the study?
During the COVID-19 lockdown the percentage of ED visits by frequent users increased by 179% while visits by super users increased by 571%.
How does this improve population health?
Policymakers need to understand the impact on individuals’ mental and physical health when they are discouraged from seeking medical care during an infectious disease outbreak.
mortality from COVID-19 and untreated medical emergencies. How individuals choose to address their medical needs and concerns during a government-imposed lockdown has broad implications for the healthcare market and mode of medical service delivery. It also influences the focus of emergency management and public health planning, resource allocation, and community support assistance in the future.
Goals of This Investigation
Our primary goal in this investigation was to determine the impact of the COVID-19 pandemic stay-at-home order on use of the ED by people who were FEDUs and EDSUs prior to the pandemic lockdown. We hypothesized that FEDUs and EDSUs would increase their ED use during the emergency declaration. Our secondary outcomes were to determine whether unique patient demographics and encounter characteristics differed between non-frequent, frequent, and super users of ED services before and during the stay-at-home order.
METHODS
Study Design and Setting
The FLOWERS study was a secondary analysis of existing data for ED visits to a charitable Midwest healthcare system. This not-for-profit system has a network of 20 EDs (hospital-based, including a Level I and Level II trauma center and freestanding EDs) spanning 47 counties in Ohio
Volume 23, no. 5: September 2022 725 Western Journal of Emergency Medicine Levitin et al. Where Have All the FLOWERS Gone?
Where Have All the FLOWERS Gone?
with a combined annual ED census of 492,650 visits by patients ≥18 years of age. The study was conducted with the approval of the hospital’s institutional review board. The interval for the analysis included a designated 12-month period before and a 9-week interval during the mandatory COVID-19 stay-at-home order. Ohio’s stay-at-home order was implemented on March 23, 2020. The order included ceasing operation of all non-essential business, prohibition of all public and private gatherings, limitation of travel, closure of schools, cancellation of elective medical procedures, and implementation of social-distancing measures. Therefore, March 23, 2020, was selected as the initial reference point to begin assessing the impact of this public health measure on peoples’ willingness to seek ED care during the beginning of the mandatory lockdown. The cancellation of the order on May 29, 2020, was the end date in the study because it represented a transition point between lockdown and the resumption of business activities.
The purpose of this study was to determine the impact of the mandatory COVID-19 pandemic stay-at-home order on the proportional makeup of ED visits by FEDUs and EDSUs. We used the total number of ED visits each registered person made over the prior 12 months (March 23, 2019–March 22, 2020) to categorize each patient into one of three user groups (Figure 1). We then compared the proportional makeup
All Patients Registered at ED 3/23/2019 3/22/2020 N=320,065
the ED registration process, each patient’s ethnicity was determined by inquiring whether they identified as being Hispanic or non-Hispanic. Patients were also asked about their race identification. Patients who self-identified as White or Caucasian were entered as the former, while the options Black or African American were entered as both. Patients who did not provide their race were given the following choices: White, African American or Black, American Indian or Alaska Native, Asian, Native Hawaiian or other Pacific Islander, or other designation (unknown, declined to specify, or two or more races). We collected race and ethnicity data to determine whether specific groups were impacted differently during the COVID-19 stay-at-home order.
Selection of Participants
Exclusion Criteria: <18 years old (39,834)
Registered at ED, Never Arrived (0) LWBS before triage (499) John/Jane Doe (27)
All Patients Meeting Inclusion Criteria
Non Frequent Users (1 3 visits)
Frequent Users (4 9 visits)
Super Users (≥10 visits) (0.7%)
Figure 1. Flowchart outlining inclusion and exclusion criteria and methodology for assigning study participants into user groups. ED, emergency department; LWBS, left without being seen.
of each group during the prior 12 months to the 9-week emergency declaration period (March 23–May 29, 2020).
The study compared patient and admission characteristics for both periods. This information included ethnicity, race, ED disposition, insurance status, and arrival means. During
Subjects for this study included 280,053 eligible individuals who registered to be evaluated in any of the 20 designated EDs during a 12-month period (March 23, 2019–March 22, 2020). These patients were identified by an electronic health record (EHR) query performed by a trained data analyst in the Quality and Patient Services (QPS) Department. The study excluded participants if they were <18 years of age, registered as John/Jane Does, were designated as a hospital transfer who never arrived at one of the study locations, left without being seen by a clinician, or were evaluated in an urgent care facility. The principal investigator and designated study staff reviewed a subset of records for inclusion/exclusion criteria to determine the accuracy of the QPS data query. The identified participants were subdivided into three groups based on their number of visits during the 12 months preceding the stay-at-home order: NFEDUs (<4 visits); FEDUs (4-9 visits); and SEDUs (≥10 visits). For each patient within the three groups, we compared their prior ED use to their ED visits during the Ohio stay-at-home declaration in response to COVID-19, a nine-week period from March 23–May 29, 2020.
Measurements and Analysis
Trained hospital data analysts collected patient and admission level data via a system-level query of the EHR (Epic Systems Corporation, Verona, WI) (Table 1). The study team validated a subset of records using manual health records review to ensure data accuracy for each set of inclusion and exclusion criteria added to the query. Emergency department encounter characteristics of interest for this study included means of arrival, insurance status, and disposition, while patient-specific characteristics included gender, age, ethnicity, and race. We summarized all patient- and encounter-level data using means, percentages, and 95% confidence intervals. Missing data points were omitted from the calculation of percentages. For patients with repeat visits, we only reported data from a patient’s first encounter during each period (before and during the stay-at-home order). We analyzed all data with R version 4.1.1 (R Foundation for Statistical Computing, Vienna, Austria).16
Western Journal of Emergency Medicine 726 Volume 23, no. 5: September 2022
Levitin et al.
N=280,053
n=256,157 (91.5%)
n=21,837 (7.8%)
n=2,059
Variable Value
Ethnicity Not Hispanic or Latino, Hispanic or Latino, Declined
Race White, African American or Black, American Indian or Alaska Native, Asian, Native Hawaiian or other Pacific Islander, Other (including unknown, declined to specify, two or more races)
ED disposition Discharge, Left before final disposition, Hospitalize transfer to another facility, Left against medical advice, Left without being seen after triage, Expired, Sent to labor and delivery
Insurance status Private insurance (including motor vehicle, accident, commercial, marketplace exchange), Medicaid, Medicare, Not covered (including self pay and hospital charity), Other (including VA, incarcerations, worker’s compensation)
Means of arrival Ambulance (including medical flight transport), Personal vehicle, Public transportation (including taxi), Other (police, wheelchair, other) ED, emergency department; VA, Veterans Affairs. dictionary
Patient Demographics and Encounter Characteristics Pre-lockdown
A summary and comparison of demographic data from each group for the one-year preceding the COVID-19 lockdown period (ie, pre-lockdown) is presented in Table 2. In general, patient demographics between the groups were similar. Most of the ED patients in each group were female (55-62%), White (approximately 70%), and of a similar age range, with over 92% self-identified as neither Hispanic nor Latino. Those of Black descent had a slightly higher representation among FEDU and EDSU patients (25.6% and 27%, respectively) than the NFEDU patients (20.2%). Asian Americans demonstrated a corresponding reduction in the two groups (FEDU, 1.3%; EDSU, 0.9%; NFEDU, 1.9%).
Outcomes
We examined four outcomes in an analysis of ED use before and during the mandatory COVID-19 stay-athome lockdown: 1) proportion of NFEDUs (<3 annual ED visits); 2) proportion of FEDUs (4-9 annual ED visits); 3) proportion of EDSUs (≥10 annual ED visits); and 4) unique patient characteristics during the defined periods. These outcomes were chosen to determine whether the impact of the government-issued COVID-19 lockdown on ED visits were uniform across all patient demographics or whether there were specific subgroups whose ED use deviated from that of others.
RESULTS
Patient Emergency Department Use Groups
Figure 1 outlines the assignment of patients into three groups based on frequency of ED use. During this one-year period, 280,053 patients met the study criteria by registering for evaluation in one of 20 EDs within a single Midwestern healthcare system. Most patients (91.5%) were designated as NFEDU, while 7.8% and 0.7% were classified as FEDU and EDSU, respectively.
Government-sponsored programs (Medicaid and Medicare) provided health insurance coverage to 52% of NFEDUs, 74% of FEDUs, and 83% of EDSUs. Individually, Medicaid use was less prevalent in NFEDUs (26.5%) than FEDUs and EDSUs (45.2% and 52.6%, respectively), while the use of Medicare among all groups remained steady (25.6-30.7%). Private insurance was used by 40.5% of FEDUs, 18% of NFEDUs, and 9.8% of EDSUs. Compared to NFEDUs, FEDUs and EDSUs were more likely to be uninsured (2.8% vs 5.5% and 5.3%, respectively). In addition, EDSU patients were more likely to be hospitalized, leave against medical advice, leave without being seen after triage, and leave before final disposition. The EDSU patients arrived at the ED by ambulance more frequently than NFEDU and FEDU patients (26.8% vs 17.9% and 19.6%, respectively). The EDSU patients used public transportation to arrive at the ED more often than NFEDU and FEDU patients (3.4% vs 0.9% and 1.4%, respectively), and EDSU patients arrived by a personal vehicle less commonly than NFEDU and FEDU patients (65% vs 79.1% vs 76.1%, respectively).
Pre-Lockdown vs Lockdown
To determine whether the percentage of patients in each usage group changed during the mandatory lockdown, we compared the proportional makeup of each group between the two time periods. We included only known users who previously registered for ED care in the prior 12 months in this data analysis. Throughout the mandatory COVID-19 lockdown, the percentage of registered patients previously identified as FEDUs climbed from 7.8% (pre-lockdown) to 21.8% during lockdown (a 179% increase). The number of EDSUs grew by 571% (0.7% to 4.7%), while the number of NFEDUs dropped from 91.5% to 73.4% (a 19.8% decrease) during the lockdown (Table 3).
In comparing the proportions of ED visits for each group, we found that NFEDUs comprised 66.8% of all visits (a 6% decrease), FEDUs comprised 23.7% of all visits (a 3.9% increase), while EDSU encounters (9.5%) increased by 53% (Table 4). Overall, the combination of FEDUs and EDSUs in the pre-lockdown period comprised 8.5% of registered ED patients yet constituted 29% of all ED encounters. These two
Volume 23, no. 5: September 2022 727 Western Journal of Emergency Medicine Levitin et al. Where Have All the FLOWERS Gone?
Table 1. Data
Where Have All the FLOWERS Gone?
Table 2. Emergency department usage groups.
Demographics
Gender, % (CI)
Non-Frequent n = 256,157
Frequent n = 21,837 Super n = 2,059
Male 44.6 (44.4-44.8) 38.1 (37.5-38.7) 43 (40.9-45.1)
Female 55.4 (55.2-55.6) 61.9 (61.3-62.5) 57 (54.9-59.1)
Unknown <0.01 0 0
Age in years, mean (CI) 46.9 (46.8-47.0) 46.4 (46.1-46.7) 45.9 (45.2-46.6)
Ethnicity, % (CI)
Not Hispanic or Latino 91.8 (91.7-91.9) 95.1 (94.8-95.4) 96.5 (95.7-97.3) Hispanic or Latino 3.9 (3.8-4.0) 3.2 (3.0-3.4) 3.1 (2.4-3.8)
Declined 4.3 (4.2-4.4) 1.7 (1.5-1.9) 0.5 (0.2-0.8)
Race, % (CI)
White 70.6 (70.4-70.8) 68.6 (68.0-69.2) 69.3 (67.3-71.3)
African American or Black 20.2 (20.0-20.4) 25.6 (25.0-26.2) 27 (25.1-28.9)
American Indian or Alaska Native 0.2 (0.18-0.22) 0.2 (0.14-0.26) 0.2 (0.07-0.4)
Asian 1.9 (1.8-2.0) 1.3 (1.1-1.5) 0.9 (0.5-1.3) Native Hawaiian or other PI 0.2 (0.18-0.22) 0.2 (0.14-0.26) 0.1 (-0.4-0.2)
Other 6.9 (6.8-7.0) 4.1 (3.8-4.4) 2.6 (1.9-3.3)
Insurance Status, % (CI)
Private insurance 40.5 (40.3-40.7) 18.0 (17.4-18.5) 9.8 (8.5-11.1)
Medicaid 26.5 (26.3-26.7) 45.2 (44.5-45.8) 52.6 (50.4-54.8)
Medicare 25.6 (25.4-25.7) 29.2 (28.6-29.8) 30.7 (28.7-32.7)
Not covered 2.8 (2.7-2.9) 5.5 (5.2-5.8) 5.3 (4.3-6.2)
Other 4.7 (4.6-4.8) 2.1 (1.9-2.3) 1.7 (1.1-2.2)
Disposition, % (CI)
AMA 1.1 (1.06-1-1.4) 1.6 (1.4-1.8) 2.2 (1.6-2.8)
Discharge 73.6 (73.4-73.8) 70.5 (69.9-71.1) 67.8 (65.8-69.8)
Expired 0.2 (0.18-0.22) 0 0
Hospitalize 19.3 (19.1-19.5) 21 (20.5-21.5) 23.1 (21.3-24.9)
Left before final disposition 0.8 (0.77-0.83) 1.3 (1.1-1.5) 1.5 (1.0-2.0)
LWBS after triage 0.3 (0.28-0.32) 0.5 (0.4-0.6) 0.7 (0.3-1.1)
Sent to L&D 0.1 (0.08-0.11) <0.1 0
Transfer 4.7 (4.6-4.8) 5.1 (4.8-5.4) 4.7 (3.8-5.6)
Arrival, % (CI)
Ambulance 17.9 (17.8-18.0) 19.6 (19.1-20.1) 26.8 (24.9-28.7)
Personal 79.1 (78.9-79.3) 76.1 (75.5-76.7) 65 (62.9-67.1)
Public 0.9 (0.86-0.94) 1.4 (1.2-1.6) 3.4 (2.6-4.2)
Other 2.2 (2.1-2.3) 2.9 (2.7-3.1) 4.8 (3.9-5.7)
ED, emergency department; CI, confidence interval; AMA, against medical advice; LWBS, left without being seen; L&D, labor and delivery; PI, Pacific Islander.
combined groups accounted for 26.5% of ED patients and 33.2% of ED encounters during the lockdown.
We also compared demographics and patient-level encounter characteristics between the two periods (Tables 5 and 6). We saw a slight decrease in the proportion of male patients who
registered for ED care during lockdown (41.4% vs 44%), with a corresponding increase in female registrants (58.6% vs 56%). During the lockdown, the percentage of patients who self-identified as White reduced from 70.4% to 67.7%, while those identifying as either African American or Black increased
Western Journal of Emergency Medicine 728 Volume 23, no. 5: September 2022
Levitin et al.
Table 3. Emergency department utilization groups pre-lockdown vs during lockdown.
ED Utilization Groups
Pre-Lockdown N = 280,053
Lockdown N = 24,242 % Change
Non-frequent users (n) % (CI) 256,157 91.5 (97.4-97.6) 17,795 73.4 (72.8-74) -19.8%
Frequent users (n) % (CI) 21,837 7.8 (7.7-7.9) 5,288 21.8 (21.3-22.3) +179%
Super users (n) % (CI) 2,059 0.7 (0.67-0.73) 1,159 4.7 (4.4-5.0) +571% ED, emergency department; CI, confidence interval.
Table 4. Proportion of total encounters by patient groups.
Encounters Pre-Lockdown N = 492,650 Lockdown N = 49,188 % Change
All encounters (N) 492,650 49,188
New/unknown (n) 16,190
Returning (n) 32,988
Non-frequent users (n) % (CI) 350,135 71.1 (70.9-71.2) 22,050 66.8 (66.3-67.3) -6.0%
Frequent users (n) % (CI) 112,135 22.8 (22.6-22.9) 7,821 23.7 (23.2-24.1) +3.9%
Super users (n) % (CI) 30,377 6.2 (6.1-6.3) 3,127 9.5 (9.1-9.8) +53.2% CI, confidence interval.
from 20.8% to 25.4%. Age and ethnicity remained relatively unchanged before and during the lockdown.
The proportion of individuals with private insurance dropped from 38.4% during pre-lockdown to 22% during lockdown (a decrease of 42.7%), while the percentage of uninsured ED visitors rose from 3.1% to 9% (an increase of 190.3%). The proportion of patients covered by Medicaid increased from 28.2% to 39.3% (an increase of 39.3%), while the proportion of Medicare users remained essentially unchanged. A greater proportion of patients arrived by ambulance during the lockdown than before the lockdown (22% vs 18%), while fewer were transported to the ED by private vehicle (73.2% vs 78.7%). Patient disposition varied little between the two periods except for a slight increase in the proportion of those who left against medical advice (1.4% vs 1.1%), those who were hospitalized (21.4% vs 19.4%), and those patients sent to labor and delivery (0.1% vs 0.04%) during the lockdown.
A total of 16,190 new patient encounters occurred during the lockdown. These ED visits were by individuals who had
not previously registered for care during the prior year. As a result, these new patients were not included when calculating patient encounters and demographic data during the lockdown.
DISCUSSION
In 1955, the legendary songwriter and folk singer Pete Seeger wrote “Where Have All the Flowers Gone?”—an antiwar song about how wars can destroy an entire generation of young people. In the lyrics, young girls picked flowers to put on their boyfriends’ graves, all of whom had died in battle. The song was translated into over 30 languages and helped define a generation.18 Like war, pandemics also impact generations of people. The spread of SARS-CoV-2 resulted in over 255 million cases of COVID-19, and five million deaths worldwide, including 47.5 million cases in the US and over 768,000 deaths as of November 18, 2021.19 The virus caused widespread economic hardships and exacerbated long-standing systemic health and social inequalities, placing individuals from racial and ethnic minorities at higher risk of getting sick and dying from COVID-19.20,21
To curb the spread of disease, most governors throughout the US implemented mandatory stay-at-home orders. Healthcare systems followed suit by canceling elective procedures and limiting clinic and private practice hours. These actions, combined with the practices of social distancing, remote working, business, and school closures, and diminished vehicular usage, likely contributed to the nearly 40% curtailment in ED visits throughout the country. This reduction in ED patient volume during the declared national emergency appeared to impact all demographics and led to a uniform drop in routine, non-COVID-19-related medical emergencies (eg, myocardial infarctions, strokes, chronic obstructive pulmonary disease exacerbations, and critical patient admissions).3-6,22 This dramatic change prompted our question: “Where have all the patients gone?”
The FLOWERS study was a large, multicenter, singlestate, healthcare system retrospective investigation of the impact of the initial COVID-19 pandemic stay-at-home order on ED use by historically frequent users of emergency services. The objective was to determine whether the reduction in visits during this period was uniform for all patients, including those who historically are frequent users of ED services. We gathered data from 20 EDs (hospital-based and freestanding) spanning 47 counties, including 280,053 patients with 492,650 ED visits.
The FEDUs are often chronically ill individuals with several active comorbidities, socioeconomically disadvantaged, and high users of both ED and outpatient services. Any barrier to accessing routine medical care, such as the COVID-19 stayat-home order, should have increased ED visits from all patient groups, especially among frequent users of these services. However, we found that while patients who historically used ED services frequently did so more often during the lockdown, patients who were not frequent users tended to use ED services
Volume 23, no. 5: September 2022 729 Western Journal of Emergency Medicine Levitin et al. Where Have All the FLOWERS Gone?
Where Have All the Gone?
Table 5. Patient demographics pre-lockdown vs lockdown.
Demographics
Gender, %(CI)
Pre-lockdown N = 280,053
Lockdown N = 24,242 % Change
Male 44 (43.8-44.2) 41.4 (40.8-42.0) -5.9%
Female 56 (55.8-56.2) 58.6 (58.0-59.2) 4.6%
Age, mean (CI) 46.9 (46.8-46.9) 46.1 (45.9-46.3) -1.7%
Ethnicity, %(CI)
Not Hispanic or Latino 92.1 (92-92.2) 94.2 (93.9-94.4) 2.3%
Hispanic or Latino 3.8 (3.7-3.9) 3.6 (3.4-3.8) -5.3%
Declined 4.1 (4.0-4.2) 2.2 (2.0-2.4) -46.3%
Race, %(CI)
White 70.4 (70.2-70.6) 67.7 (67.1-68.3) -3.8%
African American or Black 20.8 (20.6-21) 25.4 (24.9-25.9) 22.1%
American Indian or Alaska Native 0.2 (0.18-0.22) 0.2 (0.14-0.26) 0
Asian 1.9 (1.8-2.0) 1.7 (1.5-1.9) -10.5%
Native Hawaiian or other PI 0.2 (0.18-0.22) 0.1 (0.06-0.14) -50%
Other 6.6 (6.5-6.7) 4.9 (4.6-5.2) -25.8% CI, confidence interval; PI, Pacific Islander.
Table 6. Patient-level encounter characteristics. Encounter data Pre-lockdown N = 280,053 Lockdown N = 24,242 % Change
Insurance Status, %(CI)
Private insurance 38.4 (38.2-38.5) 22.0 (21.5-22.5) -42.7%
Medicaid 28.2 (28.1-28.4) 39.3 (38.6-39.9) 39.3%
Medicare 25.9 (25.7-26.1) 27.1 (26.5-27.7) 4.6%
Not covered 3.1 (3.0-3.11) 9.0 (8.6-9.3) 190.3%
Other 4.4 (4.36-4.51) 2.7 (2.5-2.9) -38.6%
Disposition, %(CI)
AMA 1.1 (1.06-1.14) 1.4 (1.3-1.5) 27.3%
Discharged 73.4 (73.2-73.6) 71.4 (70.8-72.0) -2.7%
Expired 0.2 (0.18-0.22) 0.2 (0.14-0.25) 0
Hospitalized 19.4 (19.3-19.5) 21.4 (20.9-21.9) 10.3%
Left before final disposition 0.8 (0.77-0.83) 0.5 (0.4-0.59) -37.5%
LWBS after triage 0.3 (0.28-0.32) 0.2 (0.14-0.26) -33.3
Sent to L&D 0.04 (0.033-0.047) 0.1 (0.06-0.14) 150%
Transferred 4.7 (4.6-4.8) 5 (4.7-5.3) 6.4%
Arrival, %(CI)
Ambulance 18.1 (18.0-18.2) 22.2 (21.7-22.7) 22.7%
Personal 78.7 (78.5-78.9) 73.2 (72.6-73.8) -7.0%
Public 0.9 (0.87-0.93) 1.4 (1.3-1.5) 55.6%
Other 2.3 (2.2-2.4) 3.2 (3.0-3.4) 39.1%
CI, confidence interval; AMA, against medical advice; LWBS, left without being seen; L&D, labor and delivery.
even less during the lockdown. The increased use among FEDUs and EDSUs was likely due to the reduced availability of other healthcare options.
Public health measures to reduce the spread of SARSCo-V-2 likely impacted healthcare systems’ ability to provide routine medical services such as disease screening, health
Western Journal of Emergency Medicine 730 Volume 23, no. 5: September 2022
FLOWERS
Levitin et al.
maintenance therapy, and mental health counseling. These community-based mitigation efforts, combined with deferred and delayed presentations of non-pandemic-related illnesses and pathologies, had negative implications worldwide.23
According to the World Health Organization, 42% of countries had disruptions in cancer care, 49% had disruptions in diabetes care, and 31% for cardiovascular disease services during the early phase of the pandemic. These routine clinical services reductions likely contributed to excess deaths from treatable and preventable non-COVID-19-related health conditions and illnesses.24-27 In addition, barriers to accessing routine healthcare services were likely the impetus for frequent users to seek out the ED in more significant numbers during the COVID-19 lockdown. Suppose these barriers and regular healthcare avoidance behaviors continued because of ongoing infection spread. In that case, patients could likely miss opportunities for acute medical interventions and necessary ongoing management of chronic conditions, vaccinations, and early screening for new medical problems that could worsen outcomes.25
Delays or avoidance in seeking medical care might have also contributed to excess deaths during lockdown periods. A web-based survey conducted from June 24-30, 2020 estimated that 40.9% of US adults aged ≥18 years avoided care during the pandemic due to concerns over COVID-19. This forestalling included 12% who avoided urgent or emergency care and 31.5% who avoided routine care. Avoidance of urgent and emergent care was highest among unpaid adult caregivers, individuals with two or more underlying health conditions, persons with health insurance, Black and Hispanic patients, young adults, and persons with disabilities. Those falling under one or more of these categories also represent those who were at increased risk of developing severe COVID-19.25,28
As a corollary, the reduction in healthcare utilization during the mandatory stay-at-home order may have had an unintended net positive effect on an individual’s health. According to a physician survey conducted in 2017, an interpolated median of responses revealed that 20.6% of overall medical care might be unnecessary, including 22% of prescription medications, 24.9% of tests, and 11.1% of procedures. The top reasons cited for overtreatment included fear of malpractice (84.7%), patient pressure/request (59%), and difficulty assessing medical records (38.2%).26 Also, individuals with higher incomes tend to undergo more expensive and extensive cancer screening exams to detect smaller abnormalities that lead to more follow-up testing and biopsies with little to no impact on mortality.29 Additionally, as many as one-third of hospitalized patients may experience harm or an adverse event, often from preventable errors. In 2009, total excess costs in US healthcare exceeded $750 billion due to perceived unnecessary and inefficiently delivered services, excess administrative costs, too high prices, missed prevention opportunities, and fraud.30
Data gathered from this study will be incorporated into future efforts to assess the impact of confounding factors to
determine whether the lockdown disproportionately impacted the morbidity and mortality of NFEDUs and FEDUs. This ongoing research will also focus on community resources, family support systems, telemedicine, or other self-help strategies that either group may have used during the lockdown as an alternative to seeking emergent medical care. Such information may be useful in addressing these patients’ needs in the future.
LIMITATIONS
There were several potential limitations to our study. There may have been an over-reporting of return visits in patients who were registered in the ED but left before completing evaluation only to return at a later time. This action could have increased their visit count by one, and if this patient visit was repeated, the accumulative effect might have incorrectly shifted them into one of the higher use groups. There is also a possibility that return visits may have been artificially elevated for patients whom the treating clinician requested that they return for a scheduled re-evaluation. These visits are typically not patientcentric decisions, as they are often the result of shared decisionmaking between the patient and the clinician. In addition, the exclusion of unidentified patients (ie, John/Jane Doe) from the study may have impacted the dataset if their number of ED admissions were significant. These individuals were each assigned a unique health record number that could be used to identify them upon return to the ED. The EHR system used by our health system is routinely updated to combine duplicate charts. If the data pull was redone now, there may be fewer John/Jane Doe in the dataset due to correction of errors by chart compilers. In our original dataset, there were 13 patients with John/Jane Doe status. Therefore, their inclusion in the study would not have impacted the results.
Another potential limitation involves the applicability of the study results to health systems in other states and locales. The government-issued, COVID-19 stay-at-home orders were not coordinated at the national level, which created the potential for implementation and impact variability. Although this variability was inherent to the process, the order’s overall negative effect on patients’ access to health services was generally uniform throughout the US.17 For example, delaying elective procedures and organ transplants were a common patient surge management strategy deployed by most healthcare systems.17 As a result of the stay-at-home order, dental offices closed and, in many states, nearly 80% of non-COVID-19 clinical trials were stopped or interrupted, including 400 clinical trials involving more than 200,000 cancer patients.17 In addition, there was a marked reduction in preventive screening procedures (eg, colonoscopies, mammograms, and routine lab tests for the management of chronic disease) because of community mitigation measures during the early phase of the COVID-19 pandemic. 17
This study did not assess for confounding factors beyond the mandatory COVID-19 stay-at-home order that may have
Volume 23, no. 5: September 2022 731 Western Journal of Emergency Medicine Levitin et al. Where Have All the FLOWERS Gone?
Where Have All the FLOWERS Gone?
impacted ED use, such as access to telemedicine, treatment advice offered online, and access to clinics that may have played a role in reducing the number of ED visits evaluated in the study. In addition, the data collected did not address other factors that may have influenced a patient’s decision to seek repeated ED care, including limited access to health services in the evenings or on weekends and holidays, referral by a primary care physician or specialist, perceived quality of care, or insurance status. We hope to explore these confounding factors to assess their impact on patients’ decisions to seek emergency care during a public health emergency in future work. We suspect that the study’s large sample size mitigated the potential influence of these limitations.
CONCLUSION
It is incumbent upon clinicians and public health officials to better understand the impact on individuals’ mental and physical health when society’s most vulnerable are discouraged from using needed medical services during an infectious disease outbreak. An important part of this realization is addressing the implications of temporary disruptions in access to medical care during considerable periods of disease transmission. When barriers to accessing healthcare are implemented as part of a broader measure to reduce the spread of an infectious agent, individuals reliant on these services are more likely to seek out the ED for their medical needs. Future pandemic planning should consider this finding to ensure that vital healthcare resources are allocated appropriately.
January 1, 2019-May 30, 2020. MMWR Morb Mortal Wkly Rep 2020;69(23):699-704.
3. Abi Fadel F, Al-Jaghbeer M, Kumar S, et al. The impact of the state of Ohio stay-at-home order on non-COVID-19 intensive care unit admissions and outcomes. Anaesthesiol Intensive Ther 2020;52(3):249-252.
4. Lantelme P, Couray Targe S, Metral P, et al. Worrying decrease in hospital admissions for myocardial infarction during the COVID-19 pandemic. Arch Cardiovasc Dis. 2020;113(6-7):443-7.
5. Boserup B, McKenney M, Elkbuli A. The impact of the COVID-19 pandemic on emergency department visits and patient safety in the United States. Am J Emerg Med. 2020;38(9):1732-6.
6. Venkatesh AK, Janke AT, Shu-Xia L, et al. Emergency department utilization for emergency conditions during COVID-19. Ann Emerg Med. 2021;78(1):84-91.
7. Giannouchos TV, Kum HC, Foster MJ, et al. Characteristics and predictors of adult frequent emergency department users in the United States: a systematic literature review. J Eval Clin Pract 2019;25(3):420-33.
8. Castillo EM, Brennan JJ, Killeen JP, et al. Identifying frequent users of emergency department resources. J Emerg Med 2014;47(3):343-7.
9. Vinton DT, Capp R, Rooks SP, et al. Frequent users of US emergency departments: characteristics and opportunities for intervention. Emerg Med J. 2014;31(7):526-32.
10. Jiang HJ, Weiss AJ, Barett ML. Characteristics of emergency department visits for super-utilizers by payer, 2014. 2017. Available at: https://www.hcup-us.ahrq.gov/reports/statbriefs/sb221-SuperUtilizer-ED-Visits-Payer-2014.jsp Accessed September 23, 2020.
Address for Correspondence: Howard Levitin, MD, OhioHealth Doctors Hospital, Department of Emergency Medicine, 5100 W. Broad Street, Columbus, Ohio 43228. Email: levitinh@usacs.com.
Conflicts of Interest: By the WestJEM article submission agreement, all authors are required to disclose all affiliations, funding sources and financial or management relationships that could be perceived as potential sources of bias. No author has professional or financial relationships with any companies that are relevant to this study. There are no conflicts of interest or sources of funding to declare.
Copyright: © 2022 Levitin et al. This is an open access article distributed in accordance with the terms of the Creative Commons Attribution (CC BY 4.0) License. See: http://creativecommons.org/ licenses/by/4.0/
11. Hunt KA, Weber EJ, Showstack JA, et al. Characteristics of frequent users of emergency departments. Ann Emerg Med. 2006;48(1):1-8.
12. Krieg C, Hudon C, Chouinard MC, et al. Individual predictors of frequent emergency department use: a scoping review. BMC Health Serv Res. 2016;16(1):594.
13. Devoe JE, Baez A, Angier H, et al. Insurance + access not equal to health care: typology of barriers to health care access for low-income families. Ann Fam Med. 2007;5(6):511-8.
14. Cecil E, Bottle A, Cowling TE, et al. Primary care access, emergency department visits, and unplanned short hospitalizations in the UK. Pediatrics. 2016;137(2):e20151492.
15. Hsia RY, Niedzwiecki M. Avoidable emergency department visits: a starting point. Int J Qual Health Care. 2017;29(5):642-5.
16. R Core Team. R: A language and environment for statistical computing. 2003. Available at: https://www.R-project.org. Accessed November 10, 2021.
REFERENCES
1. National Academy for State Health Policy. Each State’s COVID-19 Reopening and Reclosing Plans and Mask Requirements. 2020. Available at: https://www.nashp.org/governors-prioritize-health-forall/. Accessed October 17, 2020.
2. Hartnett KP, Kite-Powell A, DeVies J, et al. Impact of the COVID-19 pandemic on emergency department visits - United States,
17. TRACIE. COVID-19 Healthcare Delivery Impacts. 2021. Available at: https://files.asprtracie.hhs.gov/documents/covid-19-healthcaredelivery-impacts-quick-sheet.pdf. Accessed June 12, 2022.
18. Seeger P. (2009). Where Have All the Flowers Gone: A Singalong Memoir. New York: W. W. Norton & Company.
19. Johns Hopkins University. COVID-19 map - Johns Hopkins Coronavirus Resource Center. 2021. Available at: https://coronavirus.
Western Journal of Emergency Medicine 732 Volume 23, no. 5: September 2022
Levitin et al.
Levitin et al. Where Have All the FLOWERS Gone?
jhu.edu/map.html Accessed October 10, 2021.
20. Norman C, Mello M, Choi B. Identifying frequent users of an urban emergency medical service using descriptive statistics and regression analyses. West J Emerg Med. 2016;17(1):39-45.
21. Tai DBG, Shah A, Doubeni CA, et al. The disproportionate impact of COVID-19 on racial and ethnic minorities in the United States. Clin Infect Dis. 2021;72(4):703-6.
22. Leow SH, Dean W, MacDonald-Nethercott M, et al. The Attend study: a retrospective observational study of emergency department attendances during the early stages of the COVID-19 pandemic. Cureus. 2020;12(7):e9328.
23. Solis E, Hameed A, Brown K, et al. Delayed emergency surgical presentation: impact of coronavirus disease (COVID-19) on nonCOVID patients. ANZ J Surg. 2020;90(7-8):1482-3.
24. Beaney T, Clarke JM, Jain V, et al. Excess mortality: the gold standard in measuring the impact of COVID-19 worldwide? J R Soc Med. 2020;113(9):329-34.
25. Czeisler MÉ, Marynak K, Clarke KEN, et al. Delay or avoidance of medical care because of COVID-19-related concerns - United States, June 2020. MMWR Morb Mortal Wkly Rep. 2020;69(36):1250-7.
26. Schirmer CM, Ringer AJ, Arthur AS, et al. Delayed presentation of acute ischemic strokes during the COVID-19 crisis. J Neurointerv Surg. 2020;12(7):639-42.
27. Monti S, Delvino P, Bellis E, et al. Impact of delayed diagnoses at the time of COVID-19: increased rate of preventable bilateral blindness in giant cell arteritis. Ann Rheum Dis. 2020;79(12):1658-9.
28. Tai DBG, Shah A, Doubeni CA, et al. The disproportionate impact of COVID-19 on racial and ethnic minorities in the United States. Clin Infect Dis. 2021;72(4):703-6.
29. Lyu H, Xu T, Brotman D, et al. Overtreatment in the United States. PLoS One. 2017;12(9):e0181970.
30. Smith M, Saunders R, Stuckhardt L, et al Best Care at Lower Cost: The Path to Continuously Learning Health Care in America Washington (DC): National Academies Press (US). 2013.
Volume 23, no. 5: September 2022 733 Western Journal of Emergency Medicine
Original
Geriatric Falls: Patient Characteristics Associated with Emergency Department Revisits
Dustin D. Cox, MD* Rachna Subramony, MD† Ben Supat, MD, MPH† Jesse J. Brennan, MA† Renee Y. Hsia, MD, MSc‡,§ Edward M. Castillo, PhD, MPH†
Section Editor: Luna Ragsdale, MD
* † ‡ §
University of California, San Diego, School of Medicine, San Diego, California University of California, San Diego, Department of Emergency Medicine, San Diego, California
University of California, San Francisco, Department of Emergency Medicine, San Francisco, California
University of California, San Francisco, Philip R. Lee Institute for Health Policy Studies, San Francisco, California
Submission history: Submitted December 12, 2021; Revision received May 30, 2022; Accepted June 15, 2022 Electronically published September 12, 2022
Full text available through open access at http://escholarship.org/uc/uciem_westjem DOI: 10.5811/westjem.2022.6.55666
Introduction: Falls are the leading cause of traumatic injury among elderly adults in the United States, which represents a significant source of morbidity and leads to exorbitant healthcare costs. The purpose of this study was to characterize elderly fall patients and identify risk factors associated with seven-day emergency department (ED) revisits.
Methods: This was a multicenter, retrospective, longitudinal cohort study using non-public data from 321 licensed, nonfederal, general, and acute care hospitals in California obtained from the Department of Healthcare Access and Information from January 1–December 31, 2017. Included were patients 65 and older who had a fall-related ED visit identified by International Classification of Diseases codes W00x to W19x. Primary outcome was a return visit to the ED within a sevenday window following the index encounter. Demographics collected included age, gender, ethnicity/ race, patient payer status, Charlson Comorbidity Index (CCI), psychiatric diagnoses, and alcohol/ substance use disorder diagnoses. We performed multivariate logistic regression to identify characteristics associated with seven-day ED revisit.
Results: We identified a total of 2,758,295 ED visits during the study period with 347,233 (12.6%) visits corresponding to fall-related injuries. After applying exclusion criteria, 242,572 index ED visits were identified, representing 206,612 patients. Of these, 24,114 (11.7%) patients returned to an ED within seven days (revisit). Within this revisit population, 6,161 (22.6%) presented to a facility that was distinct from their index visit, and 4,970 (18.2%) were ultimately discharged with the same primary diagnosis as their index visit. Characteristics with the largest independent associations with a seven-day ED revisit were presence of a psychiatric diagnosis (odds ratio [OR] 1.75; 95% confidence interval [CI] 1.69 to 1.80), presence of an alcohol or substance use disorder (OR 1.70; 95% CI 1.64 to 1.78), and CCI ≥ 3 (OR 2.79; 95% CI 2.68 to 2.90).
Conclusion: In this study we identified 24,114 elderly fall patients who experienced a sevenday ED revisit. Patients with multiple comorbidities, a substance use disorder, or a psychiatric diagnosis exhibited increased odds of experiencing a return visit to the ED within seven days of a fall-related index visit. These findings will help target at-risk elderly fall patients who may benefit from preventative multidisciplinary intervention during index ED visits to reduce ED revisits. [West J Emerg Med. 2022;23(5)734–738.]
Western Journal of Emergency Medicine 734 Volume 23, no. 5: September 2022
Research
INTRODUCTION
Falls are the leading cause of traumatic injury among geriatric patients and are responsible for significant healthcare costs, loss of independence, and mortality.1 In the United States, more than one in four adults above the age of 65 fall each year with roughly 32% resulting in serious injury.1,2 Older adult falls have been estimated to produce an economic burden of 50 billion dollars, with Medicare bearing most of the cost.3 The prevalence of falls and their associated costs are expected to rise with the growth of the geriatric population. One study recently demonstrated that emergency department (ED) visits for falls and fall-related injuries among the elderly increased over 27% between 2003–2010.4 In 2019, non-fatal falls among older adults were estimated to result in nearly three million ED visits nationally.5 As the ED increasingly plays a larger role in the care of older fall patients, there has been an effort to reduce preventable ED recidivism by identifying patients at risk of developing complications post-fall.
Prior studies suggest that a history of falling is associated with increased risk of subsequent falls, recurrent ED visits, hospitalization, and death.6,7 Sri-on et al found more than half of elderly fall patients experienced an adverse event within six months post-fall.6 Liu and colleagues reported that a third of geriatric patients who presented to the ED after a fall either revisited the ED or died within one year.7 Several studies have identified an increased number of comorbidities, psychoactive drug use, and substance use order as factors associated with patients likely to revisit an ED post-fall.6-9 However, previous research exploring factors associated with fall complications has been limited by small sample sizes and an inability to examine patients across various healthcare systems, thereby limiting the generalizability of findings.
The purpose of this multicenter, retrospective cohort study was to a) characterize geriatric patients who were discharged from the ED after sustaining a fall-related ED visit, and b) identify patients at risk of returning to the ED within seven days of discharge.
METHODS AND MATERIALS
Study Design
This was a multicenter, retrospective, longitudinal cohort study using non-public data from 321 licensed, nonfederal, general, and acute care hospitals in California obtained from the Department of Healthcare Access and Information, formerly known as the Office of Statewide Health Planning and Development. The dataset used for this study combined the Patient Discharge Dataset and Emergency Department Dataset. This study was approved by the institution’s Human Research Protections Program.
Study Population
The study population included patients who visited any of the 321 California nonfederal EDs from January 1–December 31, 2017. Index visits were defined as ED discharges featuring
Population Health Research Capsule
What do we already know about this issue?
Falls are the leading cause of preventable traumatic injury among elderly adults in the US, representing a significant source of morbidity and mortality.
What was the research question?
We wanted to identify fall patients at risk of returning to the ED within seven days of discharge.
What was the major finding of the study?
11.7% of elderly fall patients returned to the ED within seven days. Patients with multiple comorbidities (OR 2.79), a substance use disorder (1.70), or a psychiatric diagnosis (1.75) were more likely to return to the ED.
How does this improve population health?
Targeted risk assessment tools and interventions in the ED could help reduce revisits among elderly fall patients.
patients aged ≥65 years with a diagnosis of a fall-related injury as identified by International Classification of Diseases, 10th Revision, Clinical Modification (ICD-10-CM) codes W00x to W19x. Multiple visits by the same patient were linked by using unique patient-record linkage numbers. We excluded patient visits without valid record linkage numbers and visits that occurred within the last seven days of the study period. Visits in which the patient was discharged to shortterm general care hospitals for inpatient care, left against medical advice, died, or was sent to a psychiatric hospital were not included as index ED visits.
Main Outcome Measure
The primary outcome was any return visit to the ED within seven days following an index visit. Patients could have more than one seven-day ED revisit during the study period, but only one seven-day ED revisit per unique eligible index discharge was counted. However, each revisit could also be an eligible index discharge. Patient demographic variables are based upon the first ED visit within the study period and included age, gender, ethnicity/race, and expected payer. Patient-level Charlson Comorbidity Index (CCI), primary and secondary psychiatric diagnoses, and alcohol/substance use disorder diagnoses were based on all ED visits during the study period.
Statistical Analysis
Descriptive statistics are presented as counts and percent of total by those patients with a seven-day ED revisit and those
Volume 23, no. 5: September 2022 735 Western Journal of Emergency Medicine Cox et al. Geriatric Falls: Patient Characteristics Associated with ED Revisits
without a seven-day ED revisit. We assessed independent associations associated with a seven-day all-cause revisit after a fall-related ED visit using multivariate logistic regression. Predictors included age, gender, race/ethnicity, expected payer source, presence of a psychiatric disorder, presence of an alcohol/substance use disorder, and CCI. The most common primary diagnoses associated with seven-day ED revisits are summarized. We also report the most common conditions that make up the CCI among those with a seven-day revisit.
RESULTS
We identified a total of 2,758,295 ED visits during the study period with 347,233 (12.6%) visits corresponding to fall-related injuries. After applying exclusion criteria, we included 242,572 index ED discharges, representing 206,612 patients. Of the 206,612 patients who were discharged from an ED following a fall-related injury, 24,114 (11.7%) returned to an ED within seven days (revisit). Among those who experienced a seven-day ED revisit, 6,161 (22.6%) returned to a facility that was distinct from their index visit and 4,970 (18.2%) were ultimately discharged with the same primary diagnosis as their index visit. Among these revisits, a total of 17,115 (62.7%) were discharged, 8,016 (29.4%) were admitted or transferred for continued care, and 1,409 (5.2%) were transferred to a skilled nursing facility, intermediate care facility, inpatient rehabilitation facility, or nursing facility.
Patient-level characteristics based on the initial visits are shown in Table 1. Patient characteristics were similar across age groups; the majority of patients were female and nonHispanic White. Relative to those not experiencing a sevenday ED revisit, greater proportions of patients experiencing a seven-day ED revisit had a psychiatric diagnosis (50.3% vs 27.8%), alcohol or substance use disorder diagnosis (16.3% vs 8.2%), and a CCI of ≥3 (43.5% vs 22.4%).
Independent associations with having a seven-day revisit after a fall-related ED visits are reported in Table 2. Ethnicities other than Non-Hispanic White were less likely to experience a seven-day ED revisit, except non-Hispanic other/unknown, which featured no significant difference. Patients with a psychiatric diagnosis (odds ratio [OR] 1.75; 95% 1.69 to 1.80) and patients with an existing alcohol or substance use disorder (OR 1.70; 95% 1.64 to 1.78) were more likely to have a seven-day revisit after a fall-related ED visit. Patients with a CCI score of 1 (OR 1.5; 95% 1.44 to 1.570), 2 (OR 2.01; 95% 1.92 to 2.11), and ≥3 (OR 2.79; 95% 2.68 to 2.90) featured an increased odds of seven-day revisit relative to those with a score of zero.
The five most common CCI diseases associated with seven-day ED revisits are reported in Table 3. Of these, the two most common comorbidities were dementia (18.2%), followed by renal disease (16.0%). The most common diagnoses among seven-day ED revisits are reported in Table 4. Among these, the two most common diagnoses were open wound of the head (4.7%) and other septicemia (3.2%).
Table 1. Patient demographics of geriatric fall patients who were initially discharged with a fall-related injury and those with a seven-day emergency department (ED) revisit and without a seven-day ED revisit.
7-day ED revisit (n = 24,114) No 7-day ED revisit (n = 182,498)
Patient characteristics Patients % Patients % Age
65-74 7,707 32.0 65,679 36.0 75-84 8,088 33.5 61,097 33.5 ≥85 8,319 34.5 55,722 30.5 Women 14,723 61.1 120,979 66.3
Race/Ethnicity
Non-Hispanic White 16,509 68.5 119,331 65.4 Hispanic/Latino 3,823 15.9 32,054 17.6
Non-Hispanic Black 1,160 4.8 7,961 4.4
Non-Hispanic Asian/ Pacific Islander 1,638 6.8 14,941 8.2
Non-Hispanic Other/ Unknown 984 4.1 8,211 4.5
Psychiatric diagnosis 12,139 50.3 50,805 27.8 Substance use disorder diagnosis 3,941 16.3 15,026 8.2
Charleston Comorbidity Score
0 5154 21.4 79,460 43.5 1 4,843 20.1 41,063 22.5 2 3,552 14.7 20,770 11.4
≥ 3 10,565 43.8 41,205 22.6
Table 2. Independent associations with a seven-day emergency department revisit among geriatric patients.
Patient characteristics OR 95% CI P-value Age
65-74 reference 75-84 1.04 1.005-1.078 .025 ≥85 1.07 1.03-1.11 <0.001 Women 0.88 0.86-0.91 <0.001
Race/Ethnicity
Non-Hispanic White Reference Hispanic/Latino 0.88 0.85-0.91 <0.001
Non-Hispanic Black 0.88 0.83-0.94 <0.001
Non-Hispanic Asian/Pacific Islander 0.87 0.87-0.92 <0.001
Non-Hispanic Other/ Unknown 0.95 0.88-1.01 0.126
Psychiatric diagnosis 1.75 1.69-1.80 <0.001 OR, odds ratio, CI, confidence interval.
Western Journal of Emergency Medicine 736 Volume 23, no. 5: September 2022 Geriatric Falls: Patient Characteristics Associated with ED Revisits Cox et al.
Table 2. Continued.
Patient characteristics OR 95% CI P-value
Alcohol or substance use disorder diagnosis 1.70 1.64-1.78 <0.001
Charlson Comorbidity Score
0 Reference 1 1.50 1.44-1.57 <0.001
2 2.01 1.92-2.11 <0.001
≥ 3 2.79 2.68-2.90 <0.001
OR, odds ratio, CI, confidence interval.
Table 3. Top five Charlson Comorbidity Index diseases associated with seven-day emergency department revisits.
Disease diagnosis N %
Dementia 4,958 18.2%
Renal disease 4,374 16.0%
Chronic pulmonary disease 4,316 15.8%
Diabetes w/o complications 4,042 14.8%
Congestive heart failure 3,639 13.3%
Table 4. Top five primary diagnoses associated with seven-day emergency department revisits.
Primary diagnoses (ICD 10)
Number %
S01 Open wound of head 1,287 4.7
A41 Other septicemia 883 3.2
S42 Fracture of shoulder and upper arm 720 2.6
S32 Fracture of lumbar spine and pelvis 716 2.6
N39 Other disorders of urinary system 697 2.6
All Other visits 22,991 84.2
Total visits 27,294 100.0
ICD, International Classification of Diseases 10th revision.
DISCUSSION
Overall, we identified 206,612 geriatric patients who were discharged from an ED following a fall-related injury, 24,114 (11.7%) of whom experienced a recurrent ED visit within seven days. Of those who returned to an ED within seven days, 6,161 (22.6%) did so at a different facility than that recorded in their index visits. This indicates that single-center or single-system studies may underestimate the prevalence of geriatric falls and their sequelae. Similarly, interventions geared toward addressing recurrent geriatric falls may need to account for visits across multiple sites and multiple health systems. To reduce post-fall complications it is important to identify elderly fall patients at risk of returning to the ED prior to discharge.
The majority of elderly fall patients who had a seven-day ED revisit were women and non-Hispanic White. However, regression analysis revealed that women were less likely to experience a seven-day ED revisit. The inference here may be that while women may have increased prevalence among the geriatric fall population, individual risk for recurrent fall may in fact be higher among men than women. Our findings are consistent with prior literature demonstrating a significantly increased OR of male patients returning to the ED post-fall.7-9 Most ethnicities, compared to Non-Hispanic White, were less likely to return to the ED within seven days (Table 2). This finding is in contrast to a recent review of risk factors associated with ED recidivism, which found that ethnicity was not predictive of revisits in older adults.9 This review, however, included a variety of index ED visits not exclusive to falls or post-fall complications. The reason for this discrepancy is unclear; however, given the extent of our sample size it is possible that specifically fall-related revisits may be more likely in the nonHispanic White population and present a topic for future inquiry. Age also appeared to be positively correlated with risk of return visit, which is expected given that increased age is associated with a loss of functional reserve. Our study showed a significant association between psychiatric and substance use disorder diagnoses and a seven-day ED revisit. Similar associations have been described elsewhere.6-9 Geriatric patients with psychiatric and substance use disorders are known to be at increased risk of frequent ED use, thus highlighting the importance of effective interventions to avoid potentially preventable emergencies.10, 11 There is some literature to support the use of case management interventions to reduce ED recidivism in this population.10 Furthermore, the increasing prevalence of geriatric EDs may improve access and referral to geropsychiatric and substance abuse resources for this group of patients.12
The strongest independent association for seven-day ED revisit was an increased CCI. It has been shown elsewhere that increased CCI is significantly associated with ED recidivism and death among elderly patients.7, 9 The top comorbidities reflect the chronic diseases prevalent among older US adults.13 According to recent data from the US Centers for Disease Control and Prevention, among adults aged ≥65 years 23.9% have one chronic disease and 63.7% have ≥2 chronic diseases.13 As the prevalence of older adults with comorbidities continues to grow with the aging population, proper management of existing chronic diseases may offer an approach to reduce ED recidivism among fall patients.
A recent consensus statement on geriatric fall prevention found multifactorial interventions to be most efficacious, focusing on medication review, exercise programs, and elimination of environmental hazards.14 This supports the importance of geriatric EDs, where several dedicated specialists such as pharmacists, physical therapists, and case managers are available to evaluate patients as needed.12 Also, a recent randomized control trial showed that an ED-initiated geriatric fall intervention reduced ED revisits by using pharmacists and
Volume 23, no. 5: September 2022 737 Western Journal of Emergency Medicine Cox et al. Geriatric Falls: Patient Characteristics Associated with ED Revisits
physical therapists to assess patients prior to discharge.15 Lastly, close follow-up with primary care physicians has also been shown to reduced ED recidivism among the elderly.16
LIMITATIONS
We obtained the data presented in this study from a statewide database in California, which has a small proportion of invalid identifiers that lack patient-level reporting from federal healthcare hospitals and does not include visit characteristics such as urgency. However, California is a diverse state representing 12% of the US population. While not wholly generalizable, the data may provide useful insight for other regions. Second, this data was limited to acute care hospitals in California; other complications necessitating other forms of less acute medical care are not represented. Lastly, it is possible that fall-related visits were not assigned the appropriate ICD 10 code, thereby resulting in underestimation of the number of fall-related index visits in this study.
CONCLUSION
As the number of elderly fall patients continues to increase it will be vital for EDs to identify those most susceptible to a seven-day ED revisit and to meaningfully intervene prior to discharge. Within this study, patient characteristics strongly associated with a seven-day ED revisit were an existing substance use disorder diagnosis, a psychiatric diagnosis, and the presence of multiple comorbidities. More than 1/5 sevenday revisits occurred at a different facility from the index visit, highlighting the need for interventions and further study to look beyond the limits of a single center or healthcare system. Our hope is that, with the generalizability of a statewide database, these findings will help inform continued development of risk assessment tools to facilitate targeted interventions and, ultimately, reduce ED revisits among geriatric fall patients.
REFERENCES
1. Bergen G, Stevens MR, Burns ER. Falls and fall injuries among adults aged ≥65 years - United States, 2014. MMWR Morb Mortal Wkly Rep. 2016;65(37):993-8.
2. Sterling DA, O’Connor JA, Bonadies J. Geriatric falls: injury severity is high and disproportionate to mechanism. J Trauma 2001;50(1):116-9.
3. Florence CS, Bergen G, Atherly A, et al. Medical costs of fatal and nonfatal falls in older adults. J Am Geriatr Soc. 2018;66(4):693-8.
4. Shankar KN, Liu SW, Ganz DA. Trends and characteristics of emergency department visits for fall-related injuries in older adults, 2003-2010. West J Emerg Med. 2017;18(5):785-93.
5. WISQARS (Web-based Injury Statistics Query and Reporting System). 2020. Available at: https://www.cdc.gov/injury/wisqars/ index.html. Accessed August 20, 2021.
6. Sri-On J, Tirrell GP, Bean JF, Lipsitz LA, Liu SW. Revisit, subsequent hospitalization, recurrent fall, and death within 6 months after a fall among elderly emergency department patients. Ann Emerg Med. 2017;70(4):516-521.e2.
7. Liu SW, Obermeyer Z, Chang Y, et al. Frequency of ED revisits and death among older adults after a fall. Am J Emerg Med 2015;33(8):1012-8.
8. Martin-Gill C, Reiser RC. Risk factors for 72-hour admission to the ED. Am J Emerg Med. 2004;22(6):448-53.
9. Sheikh S. Risk factors associated with emergency department recidivism in the older adult. West J Emerg Med. 2019;20(6):931-8.
10. Castillo EM, Brennan JJ, Howard J, et al. Factors associated with geriatric frequent users of emergency departments. Ann Emerg Med. 2019;74(2):270-5.
11. Kumar GS, Klein R. Effectiveness of case management strategies in reducing emergency department visits in frequent user patient populations: a systematic review. J Emerg Med. 2013;44(3):717-29.
12. Southerland LT, Lo AX, Biese K, et al. Concepts in practice: geriatric emergency departments. Ann Emerg Med 2020;75(2):162-70.
Address for Correspondence: Dustin D. Cox, MD, University of California, San Diego, School of Medicine, 200 West Arbor Dr., MC 8676, San Diego, CA 92103. Email: dustindavidcox@gmail.com.
Conflicts of Interest: By the WestJEM article submission agreement, all authors are required to disclose all affiliations, funding sources and financial or management relationships that could be perceived as potential sources of bias. No author has professional or financial relationships with any companies that are relevant to this study. There are no conflicts of interest or sources of funding to declare.
Copyright: © 2022 Cox et al. This is an open access article distributed in accordance with the terms of the Creative Commons Attribution (CC BY 4.0) License. See: http://creativecommons.org/ licenses/by/4.0/
13. Boersma P, Black LI, Ward BW. Prevalence of multiple chronic conditions among US adults, 2018. Prev Chronic Dis. 2020;17:E106.
14. Hammouda N, Carpenter CR, Hung WW, et al. “Moving the needle on fall prevention: a Geriatric Emergency Care Applied Research (GEAR) Network scoping review and consensus statement.” Acad Emeg Med. 2021;28(11):1214-27.
15. Goldberg EM, Marks SJ, Resnik LJ, et al. Can an emergency department-initiated intervention prevent subsequent falls and health care use in older adults? a randomized controlled trial. Ann Emerg Med. 2020;76(6):739-50.
16. Magidson PD, Huang J, Levitan EB, et al. Prompt outpatient care for older adults discharged from the emergency department reduces recidivism. West J Emerg Med. 2020;21(6):198-204.
Western Journal of Emergency Medicine 738 Volume 23, no. 5: September 2022 Geriatric Falls: Patient Characteristics Associated with ED Revisits Cox et al.
Low Rates of Lung and Colorectal Cancer Screening Uptake Among a Safety-net Emergency Department Population
Nicholas Pettit, DO, PhD DuyKhanh Ceppa, MD Patrick Monahan, PhD
Indiana University School of Medicine, Department of Emergency Medicine, Indianapolis, Indiana
Section Editor: Jacob Manteuffel, MD
Submission history: Submitted November 10, 2021; Revision received March 24, 2022; Accepted May 22, 2022 Electronically published August 11, 2022
Full text available through open access at http://escholarship.org/uc/uciem_westjem DOI: 10.5811/westjem.2022.5.55351
Introduction: A suspected diagnosis of cancer through an emergency department (ED) visit is associated with poor clinical outcomes. The purpose of this study was to explore the rate at which ED patients attend cancer screenings for lung, colorectal (CRC), and breast cancers based on national guidelines set forth by the United States Preventive Services Task Force (USPSTF).
Methods: This was a prospective cohort study. Patients were randomly approached in the Eskenazi Hospital ED between August 2019–February 2020 and were surveyed to determine whether they would be eligible and had attended lung, CRC, and breast cancer screenings, as well as their awareness of lung cancer screening with low-dose computed tomography (LDCT). Patients who were English-speaking and ≥18 years old, and who were not critically ill or intoxicated or being seen for acute decompensated psychiatric illness were offered enrollment. Enrolled subjects were surveyed to determine eligibility for lung, colorectal, and breast cancer screenings based on guidelines set by the USPSTF. No cancer screenings were actually done during the ED visit.
Results: A total of 500 patients were enrolled in this study. More participants were female (54.4%), and a majority were Black (53.0%). Most participants had both insurance (80.2%) and access to primary care (62.8%). Among the entire cohort, 63.0% identified as smokers, and 62.2% (140/225) of the 50- to 80-year-old participants qualified for lung cancer screening. No patients were screened for lung cancer in this cohort (0/225). Only 0.6% (3/500) were aware that LDCT was the preferred method for screening. Based on pack years, 35.5% (32/90) of the patients who were 40-49 years old and 6.7% (6/90) of those 30–39 years old would eventually qualify for screening. Regarding CRC screening, 43.6% (218/500) of the entire cohort was eligible. However, of those patients only 54% (118/218) had been screened. Comparatively, 77.7% (87/112) of the eligible females had been screened for breast cancer, but only 54.5% (61/112) had been screened in the prior two years.
Conclusion: Many ED patients are not screened for lung/colorectal/breast cancers even though many are eligible and have reported access to primary care. This study demonstrates an opportunity and a need to address cancer screening in the ED. [West J Emerg Med. 2022;23(5)739–745.]
INTRODUCTION
Obtaining a diagnosis of cancer through an emergency department (ED) visit is associated with poor outcomes and health disparities, and results in worse outcomes when
compared to cancer diagnoses that are obtained through scheduled screenings.1 Various administrative database studies have demonstrated that diagnosing cancer through an emergent presentation is a common occurrence for ED clinicians,
Volume 23, no. 5: September 2022 739 Western Journal of Emergency Medicine Original Research
particularly in rural and urban EDs. While 20-50% of cancer diagnoses are made during an ED visit, little research has focused on strategies to encourage early screening to decrease the number of emergency presentations of cancer.1 Improved cancer screening rates across all racial and ethnic groups reduces the stage at diagnosis, with an earlier stage of diagnosis being associated with improved outcomes.2, 3
The United States Preventive Services Task Force (USPSTF) has published screening guidelines for common cancers. 4 For lung cancer, annual low-dose computed tomography (LDCT) is recommended for adults 50-80 years old, with a smoking history within the prior 15 years of at least 20-pack years.4, 5 These guidelines were recently from the previous screening recommendation of those 55-80 years old with a 30-pack year smoking history. Annual lung cancer screening with LDCT has demonstrated a reduction in lung cancer-specific mortality of 20.0%. 6 To detect colorectal cancer the USPSTF recommends screening between ages 50-75 with either direct visualization or a fecal immunochemical test (FIT). Lastly, the USPSTF recommends biennial screening mammography for women between the ages of 50-74. It has been reported that ED patients are disproportionately non-adherent with the USPSTF cancer screening recommendations.7
Disparities in cancer screening, including socioeconomic status (SES) and racial/ethnic status are pervasive in the literature, and has been further exacerbated by the coronavirus 2019 pandemic.8 Despite the fact that EDs serve as a safety net for vulnerable populations who suffer from health disparities, limited work has explored the missed opportunities for cancer screening among ED patients. The adherence to the recommended USPSTF cancer screening guidelines among ED populations is not known. Herein, we attempt to determine what percentage of our safety-net ED population (a lower socioeconomic, racially diverse, urban population, which we define as vulnerable) were screened for lung, colorectal, and breast cancers prior to coming to the ED, based on the USPSTF cancer screening recommendations. Knowing rates of screening for outpatients can inform ED interventions, such as cancer screening in the ED or cancer screening education.
METHODS
This study was an observational cohort analysis, performed at Eskenazi Hospital, an inner-city, Level I trauma center/academic hospital in downtown Indianapolis. The population is racially diverse (44.5% Black) and of low SES (low income and primarily insured by Medicare/Medicaid/ self-pay).The study was performed from August 2019–February 2020, under exempt status from the Indiana School of Medicine Institutional Review Board (IRB protocol #1909893946). Patients were approached and, following verbal consent to participate, were asked a series of up
Population Health Research Capsule
What do we already know about this issue?
Emergency department patients are thought to be less adherent to national cancer screening guidelines. However data are limited.
What was the research question?
What is the percent uptake of cancer screening for lung, colorectal, and breast cancers among a safety-net ED population.
What was the major finding of the study?
Many ED patients are not getting appropriate cancer screening, even though many are high risk, and have reported access to primary care.
How does this improve population health?
This work offers an opportunity for intervention to improve the cancer screening uptake among an at-risk ED population.
to 20 questions (fewer if not female, or non-smokers) to determine the patient’s adherence to known cancer screening guidelines. We obtained demographic information in addition to cancer screening questions. Previous CT was confirmed in the electronic health record. Patients were enrolled between the hours of 7 am - 3 am. Exclusion criteria were as follows:: age <18 years; non-English speaking; prisoner status; pregnant status; decompensated psychiatric illness; and critically ill or hospice status.
Sample size was determined to provide 80% power, alpha = 0.05, using a test of sample proportion compared to a known population, based upon national averages for known screening modalities. For lung cancer, 6.1% was used as the national average for 2017, and <1% was estimated for our study population, requiring a sample size of 60 eligible for cancer screening.9 For colorectal cancer, 63% was used for the average, and we estimated an expected rate of 50%, needing a sample size of 111.10 Lastly, for breast cancer, the national average is 71.6% and we estimated 50% of our population would be screened, needing a sample size of 36.11 It took 500 active enrolled patients to meet the total number of eligible patients for each individual cancer screening based on age because we included patients >18 years old. A random number generator was used to identify random beds in the ED for our research staff to approach the patients.
Outcomes
The primary outcome was the rate at which patients are screened for lung, colorectal, and breast cancers in accordance
Western Journal of Emergency Medicine 740 Volume 23, no. 5: September 2022 Colorectal and Lung Cancer Screening Uptake in Safety-net Emergency Population Pettit et al.
with the USPSTF cancer screening recommendations. Secondary outcomes included comparison between age groups for the lung cancer screening cohort (<30 years old, 30-39 years old, 40-49 years old, 50-80 years old, and 80+ years old), awareness that LDCT is the preferred method for lung cancer screening, and frequency at which patients will eventually qualify for lung cancer screening once they come of age.
Analysis
We used Microsoft Excel statistical package (Microsoft Corp., Redmond, WA) for descriptive statistics. The 95% normal-approximated confidence intervals (CI) were calculated surrounding the sample proportions. A z- test comparing the single sample proportion for patients screened was compared to the above-mentioned known published population proportions.
RESULTS
Table 1 demonstrates the descriptive analysis of the examined cohort, divided into age groups. In total, 639 patients were approached, nine declined participation, and 130 were excluded. The median age was 46.6 years old, 54% were female, and 53% Black, 42.8% White, and 7.4% Hispanic/ Latino; 62.8% reported having access to a primary care physician, and 80.2% had an active insurance provider. The younger cohorts had lower rates of access to primary care and insurance.
Adherence to Screening
Table 2 presents the adherence and outcome data for the lung cancer screening questions. We found that 63% (315/500) of participants were current smokers, with 73.8% (166/225) of 50–80-year-olds reporting smoking within the prior 15 years.
Table 1. Demographics and characteristics for the study population.
Demographics
Overall, N = 500 (total number) 95% CI for sample proportion for entire population <30 years old (n = 89) 30-39 years old (n = 90) 40-49 years old (n = 90) 50-80 years old (n = 225) 80+ years old (n = 6)
Median age 46.6 23.5 34 45 59 83.5
Female 54.4% (270) 0.49-0.58 59.6% (53) 50.0% (45) 56.6% (51) 51.5% (116) 83.3% (6)
Race
Black 53.0% (265) 0.48-0.57 55.1% (49) 41.1%( 46) 41.1%( 46) 52.9%( 46) 16.6% (1)
White 42.8% (214) 0.38-0.47 38.2% (34) 45.5% (41) 44.4% (90) 43.6% (98) 83.3% (5) Other 7.4% (37) 0.02-0.06 12.4% (11) 11.1% (10) 7.8% (7) 4.0% (9) 0% (0)
Access to primary care physician - yes 62.8% (314) 0.33-0.41 43.8% (39) 44.4% (40) 60% (54) 77.8% (175) 100% (6) Have insurance - yes 80.2% (401) 0.76-0.83 70.8% (63) 63.3% (57) 77.7% (70) 91.1% (205) 100% (6)
CI, confidence interval.
Table 2. Outcomes data for lung cancer screening.
Overall, N = 500 (total number) 95% CI for sample proportion <30 years old (n = 89) 30-39 years old (n = 90) 40-49 years old (n = 90) 50-80 years old (n = 225) 80+ years old (n = 6)
Active smoker within 15 years - yes 63.0% (315) 0.59-0.67 41.6% (37) 57.8% (90) 64.4% (58) 73.8% (166) 33.3% (2) Average pack years 17.1 2.1 7.01 13.1 28.2 25.8
Qualify for LDCT (by pack years) 36.6% (183) 1.1% (1) 6.7% (6) 35.5% (32) 62.2% (140) 66.7% (4) Had a CT chest 7.6% (38) 0.05-0.10 2.2% (2) 3.3% (3) 5.6% (5) 12.0% (27) 16.7% (1)
Had LDCT for lung cancer screening 0.2% (1) <0.001-0.10 0% 0% 0.4% (1) 0% 0%
Do you know lung cancer screening exists? -yes 9.2% (46) 0.07-0.12 2.2% (2) 1.1% (1) 10% (9) 14.7% (33) 16.7% (1)
Correctly stated CT scan is preferred for screening 0.6% (3) 0.002-0.02 0% 0% 0% 1.3% (3) 0%
CI, confidence interval; CT, computed tomography; LDCT, low-dose computed tomography.
Pettit
Colorectal and Lung Cancer Screening Uptake in Safety-net
Volume 23, no. 5: September 2022 741 Western Journal of Emergency Medicine
et al.
Emergency Population
Additionally, the average pack years for tobacco use for the entire cohort was 17.1 pack years; among 50–80-year-olds the average tobacco use was 28.2 pack years. Of the entire cohort, 36.6% (183/500) qualified for lung cancer screening based on the number of pack years; 62.2% (140/225) of 50–80-yearolds were eligible for lung cancer screening. Of those eligible for LDCT, no patients had been screened with a LDCT, with the one patient who had LDCT completed being under 50 years old. Meanwhile, 35.5% (32/90) of 40–49-year-olds and 6.7% (6/90) 30–39-year-olds would qualify for LDCT once they come of age, based on the USPSTF guidelines. Only 0.6% (3/500) of the entire population correctly identified that LDCT is the preferred method for lung cancer screening, despite 9.2% (46/500) stating that they knew lung cancer screening exists. Lastly, a proportion test was used to compare the one person who had been screened, albeit incorrectly, for lung cancer to the previously recorded rate of 6.1%, which resulted in a significant P-value of <0.001 (95% CI: <0.1%2.2%).
Table 3 presents the screening attendance for colorectal and breast cancers, respectively. Focusing on colorectal cancer, the number of patients who would meet screening criteria by age (ie, 50-75 years old) was 43.6% (218/500). These patients reported having high rates of primary care access and insurance, 77.5% and 91.3%, respectively. However, of those eligible for CRC screening, only 54.1% (118/218) had been screened for colorectal cancer, compared to a national average of 63% (P = 0.008; 95% CI: 47.3%61.0%). Similar rates of screening attendance were observed
for both Black and White patients with 54.7% of eligible White patients having been screened, compared to 51.3% of Black patients screened.
Lastly, focusing on breast cancer screening, of the 270 patients in the study, 112 met the age criteria from the USPSTF guidelines (50-74 years old). In this study 77.7% of the eligible had undergone a mammogram, which was not statistically different from the published rate of 71.6% (P = 0.17; 95% CI: 68.8%-85.0%). However, removing those females who last had a mammogram longer than two years prior only 54.5% (61/112, P <0.0001, 0.45-0.63) of eligible females were screened, which is significantly different from the published rate. The recommendation is biennial screening mammography, and the minimum/median/maximum years since the last mammogram were <0 years, 1 year, and 28 years, respectively. Thus, 77.7% is artificially higher than the likely observed adherence to the national guidelines. Again, there was a high rate of reported primary care access (89%) among this female cohort; however, there was a wide range of when females had last been screened. The observed rate of breast cancer screening in this cohort was not statistically different from the published rate of 71.6%. Lastly, 59.0% of Black patients had been screened for breast cancer in the prior two years, compared to 37.8% of White patients having been screened.
DISCUSSION
In this study conducted within a safety-net ED healthcare system, we sought to determine the rate at which patients Percent (total number) 95% CI for sample proportion
Colorectal Cancer Screening Adherence
How many 50-75 43.6% (218) 0.39-0.48
Of 218, has primary care physician (PCP) 77.5% (169) 0.71-0.82
Has insurance 91.3% (199) 0.87-0.95
Of 218, screened for CRC? 54.1% (118) 0.47-0.61
Frequency of White patients screened 54.7% (52/95) 0.47-0.65
Frequency of Black patients screened 51.3% (60/117) 0.42-0.63
Breast Cancer Screening Adherence
Number of females 54% (270/500) 0.50-0.58
Number of females meeting screening criteria 41.5% (112/270) 0.36-0.48
Have PCP 89% (241/270) 0.85-0.93
Screened for breast cancer with mammogram 77.7% (87/112) 0.69-0.85
Screened for breast cancer with mammogram within last 2 years 54.5% (61/112) 0.45-0.63
Number of years since last mammogram (min/median/max) 0, 1, 28 years
Frequency of white patients screened within last 2 years 37.8% (17/45) 0.24-0.52
Frequency of black patients screened within last 2 years 59.0% (36/61) 0.47-0.71
CI, confidence interval; PCP, primary care physician; CRC, colorectal cancer.
Table 3. Adherence to colorectal and lung cancer screening guidelines.
Western Journal of Emergency Medicine 742 Volume 23, no. 5: September 2022 Colorectal and Lung Cancer Screening Uptake in Safety-net Emergency Population Pettit et al.
are screened for three of the most common, treatable, and detectable cancers based on the USPSTF cancer screening recommendations. We identified that lung cancer is uncommonly screened for despite a large portion of our ED patient population having access to primary care. There is a well-recognized predilection for heavy smoking among low SES patients, and this study adds to the body of literature suggesting a need for increased awareness of lung cancer screening within this population.12 Socioeconomic status, racial, and ethnic inequities among cancer screening are well established in the existing literature, and with a growing need to reduce health disparities, there is a demand to create interventions to improve cancer care for this patient population.13 Emergency department utilization is high among low SES populations, and thus the ED serves as a unique venue for targeting cancer screening interventions. Additionally, we included all adult patients in this study to get a sense of the rate of patients who would be eligible for lung cancer screening by pack years due to the known high rates of tobacco abuse.
Although more prevalent than lung cancer screening, colorectal cancer screening in this population still fell below the national average, at 54%. We did not differentiate between FIT tests and direct visualization, although it is likely that within this group some were overdue for their screenings. Again, while the USPSTF guidelines are well established, they don’t account for demographics or SES. Patients of lower SES and racial minorities have known lower adherence to screening guidelines, which is the patient population served by our ED.14 Cancer screening guidelines continually get updated, such as the recent USPSTF changes to lung cancer screening. The USPSTF very recently amended the colorectal cancer guidelines to include persons 45-49 years old, which would only further increase the number of ED patients eligible for CRC screening.15
Lastly, breast cancer screening appears to be the most adhered to in this study but was still below the national rate. This is likely due to more public knowledge and awareness of breast cancer and breast cancer screening. For example, national mammography screening programs and awareness interventions have led to increased self-examinations and increased likelihood of attending breast cancer screening.16 Comparatively, a physician usually cannot palpate an undiagnosed lung cancer as they would a breast mass; however, increasing awareness of screening and risk factors for lung cancer has been demonstrated with public campaigns in the United Kingdom, which could easily be replicated in US EDs.17
Lengths of stay (LOS) in the ED vary, with anecdotal examples demonstrating >6 hours for even benign problems such as wrist factures.18 Most of the patient time in the ED is spent waiting for laboratory/radiology testing, consultation, or even for the discharge process, leaving a large amount of time where additional services or interventions could be
provided to the patient.19 This study demonstrates an unmet need for increasing access to cancer screening and prevention among our safety-net ED population. Increasing evidence has demonstrated that the ED is in a unique position to address disparities in cancer prevention and screening.7 As demonstrated in this work, ED patients are disproportionally non-adherent with the USPSTF cancer screening recommendations and, thus, the ED is a desirable location to reach these populations that otherwise would not have access to preventive services.20 Examples of success in addressing cancer prevention/screening in the ED include a randomized controlled trial by Adler et al.21 Their study demonstrated the feasibility and efficacy of a behavioral intervention to increase uptake of cervical cancer screening among ED patients at an urban, academic ED.21
Within our study, we observed high rates of tobacco abuse. The ED may be a suitable opportunity to intervene on these issues, which could have impacts on not only reducing cancer, but other health issues associated with obesity and tobacco use. For example, ED-initiated tobacco control has been effective in promoting continual tobacco-use abstinence up to 12 months, as demonstrated by a 2017 systematic review and meta-analysis.22 Additional interventions can be proposed such as ED-based screening and referral to known cancer screening programs (eg, a lung cancer screening clinic), or even cancer screening education.23 This concept would be to use the ED space and ED visit for comprehensive care, expanding the role that EDs could play, especially among those suffering from health disparities. Similar ideas in using the ED space for care beyond emergencies has been demonstrated for other chronic and treatable medical conditions, such as ED-based HIV screening fir human immunodeficiency virus.20 To accomplish this, resourceneutral interventions must be developed, as to not overburden ED clinicians, who in many instances are already resource limited. Peer recovery coaches are frequently used in the ED to address opioid use disorder; similar coaches or patient advocates could be used to discuss cancer screening and prevention with patients, thereby not overburdening ED clinicians.24 While we should focus on reducing ED crowding and LOS, especially for minor complaints, the ED visit may represent the only time that many uninsured and underserved patients access healthcare.25
LIMITATIONS
Our results likely overestimate the percentage of patients screened as we eliminated non-English speaking patients. Eskenazi serves a large Latin-X, Spanish-speaking, population, many of whom use the ED as their primary source of medical care. This was a convenience sample; however, patients were enrolled between the hours of 7 am-3 am, and the overall demographics are similar to the general population seen in the Eskenazi ED. Additionally, we included 500 patients in this study to reach the required number of patients
Volume 23, no. 5: September 2022 743 Western Journal of Emergency Medicine Pettit et al. Colorectal and Lung Cancer Screening Uptake in Safety-net Emergency Population
who would meet the screening guidelines, which included many younger individuals who do not usually need to be aware of CRC or lung cancer screening for some time. To that end though, this gives us some insight into the social risks including tobacco use among this patient population, as well as obesity, which affords opportunities for public health interventions. Lastly, recall bias is a possible limitation in that interviewers were relying on patient recollection for actual cancer screening. Overall, we believe this study is likely generalizable to other inner-city, county hospitals, as most county hospitals serve a similar population; however, these results are likely not generalizable outside of that context.
CONCLUSION
This study demonstrates that among a random sample of ED patients with a high rate of tobacco use, there are poor rates of cancer screening attendance for lung, colorectal, and breast cancers. Additionally, our safety-net ED population demonstrates cancer screening attendance rates lower than the national average. Earlier detection of asymptomatic malignancies is associated with higher likelihood of survival and cure rates; thus, this work provides the framework for novel ED-based interventions using a patient’s ED visit as a window of opportunity for intervention.2 Furthermore, many younger ED patients (ages 30-49) would qualify for lung cancer screening based on their tobacco use. Knowledge of the rates of cancer screening attendance for outpatients who frequent the ED can guide ED interventions, such as ED cancer screening or cancer screening education.
Address for Correspondence: Nicholas Pettit, DO, PhD, Indiana University School of Medicine, Department of Emergency Medicine, 720 Eskenazi Ave, Indianapolis, Indiana 46202. Email: NRPettit@iu.edu
Conflicts of Interest: By the WestJEM article submission agreement, all authors are required to disclose all affiliations, funding sources and financial or management relationships that could be perceived as potential sources of bias. No author has professional or financial relationships with any companies that are relevant to this study. There are no conflicts of interest or sources of funding to declare.
Copyright: © 2022 Pettit et al. This is an open access article distributed in accordance with the terms of the Creative Commons Attribution (CC BY 4.0) License. See: http://creativecommons.org/ licenses/by/4.0/
Public Health. 2006;96(12):2165-72.
3. Hiom SC. Diagnosing cancer earlier: reviewing the evidence for improving cancer survival. Br J Cancer. 2015;112.
4. U.S. Preventive Services Task Force. A & B Recommendations. 2002. Available at: https://www.uspreventiveservicestaskforce. org/uspstf/recommendation-topics/uspstf-a-and-b-recommen dations?fbclid=IwAR3uUlrUCA9_wFrJFJZzLQes3r2nXPIpKNtVeh9loEU8ayNtheUiSW9Kwo. Accessed August 4, 2022.
5. Ito Fukunaga M, Wiener RS, Slatore CG. The 2021 US Preventive Services Task Force Recommendation on Lung Cancer Screening: the more things stay the same…. JAMA Oncol. 2021;7(5):684-6.
6. National Lung Screening Trial Research Team, Aberle DR, Adams AM, et al. Reduced lung-cancer mortality with low-dose computed tomographic screening. N Engl J Med. 2011;365(5):395-409.
7. Adler D, Abar B, Chiao E. Emergency department-based cancer screening interventions. Emerg Cancer Care. 2022;1.
8. Carethers JM, Sengupta R, Blakey R, et al. Disparities in cancer Ppevention in the COVID-19 era. Cancer Prev Res (Phila) 2020;13(11):893-6.
9. Okereke IC, Nishi S, Zhou J, et al. Trends in lung cancer screening in the United States, 2016-2017. J Thorac Dis. 2019;11(3):873-81.
10. NIH. Colorectal Cancer Screening. 2022. Available at: https:// progressreport.cancer.gov/detection/colorectal_cancer?fb clid=IwAR1dl0qpOklLah2c0LeAkeAzCMMHgnu6d8OIQflq8JtnNt2f0YKESaqi4M. Accessed August 4, 2022.
11. NIH. Colorectal Cancer Screening. 2022. Available at: https:// progressreport.cancer.gov/detection/colorectal_cancer?fb clid=IwAR1dl0qpOklLah2c0LeAkeAzCMMHgnu6d8OIQflq8JtnNt2f0YKESaqi4M. Accessed August 4, 2022.
12. Schütte S, Dietrich D, Montet X, et al. Participation in lung cancer screening programs: Are there gender and social differences? A systematic review. Public Health Rev. 2018;39:23.
13. de Klerk CM, Gupta S, Dekker E, et al. Socioeconomic and ethnic inequities within organised colorectal cancer screening programmes worldwide. Gut. 2018;67(4):679-87.
14. Warren Andersen S, Blot WJ, Lipworth L, et al. Association of race and socioeconomic status with colorectal cancer screening, colorectal cancer risk, and mortality in Southern US adults. JAMA Netw Open. 2019;2(12):e1917995.
15. Davidson KW, Barry MJ, Mangione CM, et al. Screening for Colorectal Cancer: US Preventive Services Task Force Recommendation Statement. JAMA. 2021;325(19):1965-77.
16. Anastasi N, Lusher J. The impact of breast cancer awareness interventions on breast screening uptake among women in the United Kingdom: A systematic review. J Health Psychol. 2019;24(1):113-24.
REFERENCES
1. Zhou Y, Abel GA, Hamilton W, et al. Diagnosis of cancer as an emergency: a critical review of current evidence. Nat Rev Clin Oncol 2017; 14: 45-56.
2. Sassi F, Luft HS, Guadagnoli E. Reducing racial/ethnic disparities in female breast cancer: screening rates and stage at diagnosis. Am J
17. Kennedy MPT, Cheyne L, Darby M, et al. Lung cancer stage-shift following a symptom awareness campaign. Thorax. 2018;73(12):112836.
18. Mercer MP, Singh MK, Kanzaria HK. Reducing emergency department length of stay. JAMA. 2019;321(14):1402-3.
19. van der Veen D, Remeijer C, Fogteloo AJ, et al. Independent
Western Journal of Emergency Medicine 744 Volume 23, no. 5: September 2022 Colorectal and Lung Cancer Screening Uptake in Safety-net Emergency Population Pettit et al.
Pettit et
Colorectal and Lung Cancer Screening Uptake in Safety-net Emergency Population
determinants of prolonged emergency department length of stay in a tertiary care centre: a prospective cohort study. Scand J Trauma Resusc Emerg Med. 2018;26(1):81.
20. Haukoos JS, Lyons MS, Rothman RE. The evolving landscape of HIV screening in the emergency department. Ann Emerg Med 2018;72(1):54-6.
21. Adler D, Abar B, Wood N, et al. An intervention to increase uptake of cervical cancer screening among emergency department patients: results of a randomized pilot study. J Emerg Med. 2019;57(6):836-43.
22. Lemhoefer C, Rabe GL, Wellmann J, et al. Emergency departmentinitiated tobacco control: update of a systematic review and
meta-analysis of randomized controlled trials. Prev Chronic Dis 2017;14:E89.
23. Maskell K, McDonald P, Paudyal P. Effectiveness of health education materials in general practice waiting rooms: a cross-sectional study. Br J Gen Pract. 2018;68(677):e869-e876.
24. Samuels EA, Baird J, Yang ES, et al. Adoption and utilization of an emergency department naloxone distribution and peer recovery coach consultation program. Acad Emerg Med. 2019;26(2):160-73.
25. Rocovich C, Patel T. Emergency department visits: Why adults choose the emergency room over a primary care physician visit during regular office hours? World J Emerg Med. 2012;3(2):91-7.
Volume 23, no. 5: September 2022 745 Western Journal of Emergency Medicine
al.
Original
Emergency Services Capacity of a Rural Community in Guatemala
Matthew Hughes, MD Jessica Schmidt, MD, MPH James Svenson, MD, MS
University of Wisconsin School of Medicine and Public Health Department of Emergency Medicine, Madison, Wisconsin
Section Editor: Taylor Burkholder, MD, MPH
Submission history: Submitted January 8, 2022; Revision received May 24, 2022; Accepted July 19, 2022
Electronically published September 12, 2022 Full text available through open access at http://escholarship.org/uc/uciem_westjem DOI: 10.5811/westjem.2022.7.56258
Introduction: Access to emergency care is an essential part of the health system. Improving access to emergency services in low- and middle-income countries (LMIC) decreases mortality and reduces global disparities; however, few studies have assessed emergency services resources in LMICs. To guide future improvements in care, we performed a comprehensive assessment of the emergency services capacity of a rural community in Guatemala serving a mostly indigenous population.
Methods: We performed an exhaustively sampled cross-sectional survey of all healthcare facilities providing urgent and emergent care in the four largest cities surrounding Lake Atitlán using the Emergency Services Resource Assessment Tool (ESRAT).
Results: Of 17 identified facilities, 16 agreed to participate and were surveyed: nine private hospitals; four public clinics; and three public hospitals, including the region’s public departmental hospital. All facilities provided emergency services 24/7, and a dedicated emergency unit was available at 67% of hospitals and 75% of clinics. A dedicated physician was present in the emergency unit during the day at 67% of hospitals and 75% of clinics. Hospitals had a significantly higher percentage of available equipment compared to clinics (85% vs 54%, mean difference 31%; 95% confidence interval (CI) 23-37%; P = 0.004). There was no difference in availability of laboratory tests between public and private hospitals or between cities. Private hospitals had access to a significantly higher percentage of medications compared to clinics (56% vs 27%, mean difference 29%; 95% CI 9-49%; P = 0.024).
Conclusion: We found a high availability of emergency services and universal availability of personal protective equipment but a severe shortage of critical medications in clinics, and widespread shortage of pediatric equipment. [West J Emerg Med. 2022;23(5)746–753.]
INTRODUCTION
Emergency services are an essential part of the health system and serve as the first point of contact for many around the world. It is estimated that emergency services as defined by the World Health Organization (WHO)1 could directly impact over half of the mortality in low- and middle-income countries (LMIC)2; improving emergency services has been shown to lead to decreases in mortality.2,3 For over a decade, there has been a growing international focus on improved access to trauma and emergency services starting with the
World Health Assembly Resolution of 2007 (WHA60.22).4 However, disparities in access to and availability of emergency services still exist and are accentuated in LMICs.5
Importance
Our study focuses on rural Guatemala, which provides its own unique healthcare challenges. Overall, half of Guatemala’s population is indigenous.6 Despite having the biggest economy in central America, Guatemala has one of the highest inequality rates in Latin America and ranks among
Western Journal of Emergency Medicine 746 Volume 23, no. 5: September 2022
Research
the worst countries in the Central American region for several major health indicators.7,8 Emergency services in Guatemala are still in the early stages. There are few organized prehospital services and most people have to rely on public or self-transport to access emergency care.9 Although previous work has evaluated hospitals in urban areas,10 and focused studies on limited scopes of service such as trauma or surgery have been done,11–15 the ability to provide a standardized set of emergency services, or “emergency services capacity” in rural areas of Central and South America has not been systematically studied.
Goals of This Investigation
In this study our purpose was to assess the emergency services capacity of a rural community in Guatemala serving a mostly indigenous population, using a tool adapted to acute care settings in LMICs.
METHODS
Study Design and Setting
This is a cross-sectional study of healthcare facilities in San Lucas Tolimán and the other three largest cities surrounding Lake Atitlán in the Sololá department of Guatemala. San Lucas Tolimán is situated in South-Central Guatemala on the shores of Lake Atitlán. The town and its surrounding communities are home to a mostly indigenous, highland Mayan population. A recent history of civil war and genocide has left these mountain villages impoverished, with entrenched cultural and socioeconomic barriers limiting access to education, basic sanitation, and healthcare.16,17 San Lucas Tolimán has a population of 17,000 people living in the town proper, with an additional 14,000 people spread among 19 surrounding rural communities. The average yearly income is less than 1,000 US dollars (USD), or the equivalent of $3 USD per day. An established health promoter program, managed by the central San Lucas Tolimán hospital, helps to provide basic medical care and health education to neighboring communities.18
Guatemala has a nationalized healthcare system that is free to all citizens (Ministry of Public Health and Welfare). There is also a system of clinics and hospitals available to government and non-government salaried employees and their families (Guatemalan Institute of Social Security, or IGSS in Spanish).19
Selection of Participants
We used the snowball method to establish an exhaustive sample of public and private healthcare facilities that provide urgent or emergent care in the cities of Sololá, Panajachel, Santiago Atitlán, and San Lucas Tolimán. Facilities included public hospitals, private hospitals, and public clinics. Facilities providing care within the nationalized system of IGSS were considered public institutions for this study. Other facilities, including private for-profit, non-governmental, traditional medicine practitioners, and missions were considered private
Population Health Research Capsule
What do we already know about this issue?
Prior work has focused on the emergency services capacity of countries on the African continent, but only one small study has been performed in Latin America.
What was the research question?
What is the emergency services capacity of a rural region in Guatemala?
What was the major finding of the study?
We found a widespread lack of pediatric equipment and large gaps in basic supplies in clinics.
How does this improve population health?
This is the most comprehensive study of emergency services capacity in Latin America to date and offers suggestions for capacity improvement in similar communities.
institutions.19 A hospital was defined as a facility designed to care for at least one patient overnight. We included clinics in this study due to the local practice of patients presenting first to their nearest clinic for even life-threatening conditions and from there being transferred by ambulance or private vehicle to a higher level of care.
Data Collection
We identified the medical director of each facility who was informed of the study protocol and given a copy of the survey tool. Verbal consent was obtained from each facility’s medical director. A single, bilingual investigator performed all surveys in Spanish through in-person site visits lasting one to three hours, which consisted of interviews of facility staff, direct visual inspection of medications and equipment, and review of documents regarding staffing and available services. Facility staff interviewed consisted of at least the medical director and the emergency unit charge nurse, as well as on occasion financial administrators and various technicians when primary interviewees were unable to answer a question. We conducted the survey in January 2020 employing the Emergency Services Resource Assessment Tool (ESRAT), developed by the Strengthening Emergency Systems Program team of the Columbia University Mailman School of Public Health. The tool is well adapted to our study setting as it has been previously used in a Central American setting and is available in Spanish.10
The ESRAT uses key informant interviews and direct
Volume 23, no. 5: September 2022 747 Western Journal of Emergency Medicine Hughes et al. Emergency Services Capacity of a Rural Community in Guatemala
inspection of logs, medications, and equipment to assess a healthcare facility’s ability to address 76 quality indicators related to seven clinical conditions (trauma, sepsis, acute respiratory compromise, shock, altered mental status, pain, and obstetrical bleeding).20 The ESRAT consists of 330 questions regarding infrastructure, staffing, staff professional development, medications, laboratory studies, and equipment. The Spanish version of the ESRAT uses the term sala de emergencias [emergency room], which in practice refers to any physical space in which emergencies are treated. As the WHO uses the term “emergency unit” (EU),21 we have done the same in this paper. We modified the tool for the local context through an extensive pilot survey of the first participating facility, and the resultant modified tool was used for subsequent surveys. Of the 41 modifications to the survey tool, 33 (80%) were differences in translation due to the unique vocabulary used by the local population. The survey tool also specified whether laboratory and/or blood bank services were available in-house or via contract with an external vendor. Additionally, the tool was used to specifically ask whether there was a dedicated EU. Finally, we removed one laboratory study and two medications as malaria is not endemic in the studied region, nor is it home to venomous snakes that would pose a risk of snake bites.
Analysis
We summarized infrastructure and staffing in narrative form due to the heterogenous nature of the various facilities with regard to these categories. Performance was quantified for equipment, labs, and medications and given as a percentage of the number of observed items in that category, divided by the total number of items in that category in ESRAT. We assigned a total score as a percentage of total possible points, and points were assigned to each survey item response as specified in the survey tool. The total score category was designed to capture the survey’s multiple small categories, which would otherwise be difficult to report individually; included in this category, for example, would be whether a facility required patients to pay prior to receiving care or whether a facility had quality improvement protocols. We grouped studied facilities by facility level and funding source with the three resultant groups: private hospital; public hospital; and public clinic. Hospitals were analyzed separately from clinics due to hypothesized differences in resource availability. We analyzed public and private hospitals separately due to the known underfunding of public healthcare in Guatemala22 and thus hypothesized a lower level of resources. No private clinics were identified that provided urgent or emergent care. Facilities were then grouped by city in which they were located to ascertain whether there was a difference in level of available care between cities.
Data were entered into Microsoft Excel version 2006 (Microsoft Corporation, Redmond, WA). We used a 3x4 factorial ANOVA with Tukey’s honest significant difference
test to compare group means between facility types and cities for equipment, labs, medications, and total score. All subgroup analyses were defined a priori. There were no missing data. Adjusted P-values are reported to account for multiple comparisons. An alpha value of 0.05 was considered significant. We performed data analysis and visualization in R version 4.0.1 (R Foundation for Statistical Computing, Vienna, Austria).
Ethics
This study was reviewed and determined exempt by the institutional review board of the University of Wisconsin. This research did not receive any specific grant from funding agencies in the public, commercial, or not-for-profit sectors.
RESULTS
Characteristics of Study Subjects
We identified 17 facilities in the target region, of which 16 agreed to participate. Among the 16, there were nine private hospitals, four public clinics, and three public hospitals, including the region’s public departmental hospital located in Sololá (Table).
Table. Number of facilities of each type in the four studied Guatemalan cities.
City Private hospitals (N) Public hospitals (N) Public Clinics (N) Sololá 2 2 1 Panajachel 3 1 0 Santiago 2 0 1 San Lucas Tolimán 2 0 2
Infrastructure All facilities provided emergency services 24/7, and a dedicated EU was available at 67% of hospitals and 75% of clinics. Access to consistent electricity and running water was near universal, with one clinic reporting only “sometimes” having running water instead of “always.” In addition to emergency services, almost all hospitals offered ambulatory (100%), surgical (92%), and pharmacy (100%) services, whereas only about half offered blood bank (58%) and radiologic services (58%). Among clinics, only pharmacy was a consistent service (75%).
Staffing
A general physician was assigned to every facility and on call 24/7 for the entire facility. In addition, most hospitals had an anesthesiologist (75%), an obstetrician (83%), and a surgeon (83%) on staff. Only 33% of hospitals had a radiologist on staff. No clinic had any specialist physicians. A dedicated physician was in the EU during the day at 67% of hospitals and 75% of clinics. When a physician was not present, a registered nurse or nurse assistant was in the unit.
Western Journal of Emergency Medicine 748 Volume 23, no. 5: September 2022 Emergency Services Capacity of a Rural Community in Guatemala Hughes et al.
After hours, every hospital and 75% of clinics had a physician in-house or on call 24/7, specifically for the EU.
Equipment
In general, availability of equipment was high in all facilities (Figure 1). Access to personal protective equipment (PPE), including masks and non-sterile gloves as well as basic wound care supplies, was universal among facilities. Among
availability between public and private hospitals (P = 0.57) or between cities (P = 0.80).
Laboratory Tests
Availability of lab tests was generally high among hospitals but very low among clinics (Figure 1, 76% vs 8%, mean difference 67%, 95% CI 41-93%; P = 0.004). The one clinic with any laboratory services only offered basic point-of-care
Figure 1. Performance by facility type and category. The displayed values are as follows: whiskers - 1.5* interquartile range; hinges25th and 75th percentile; middle - median.
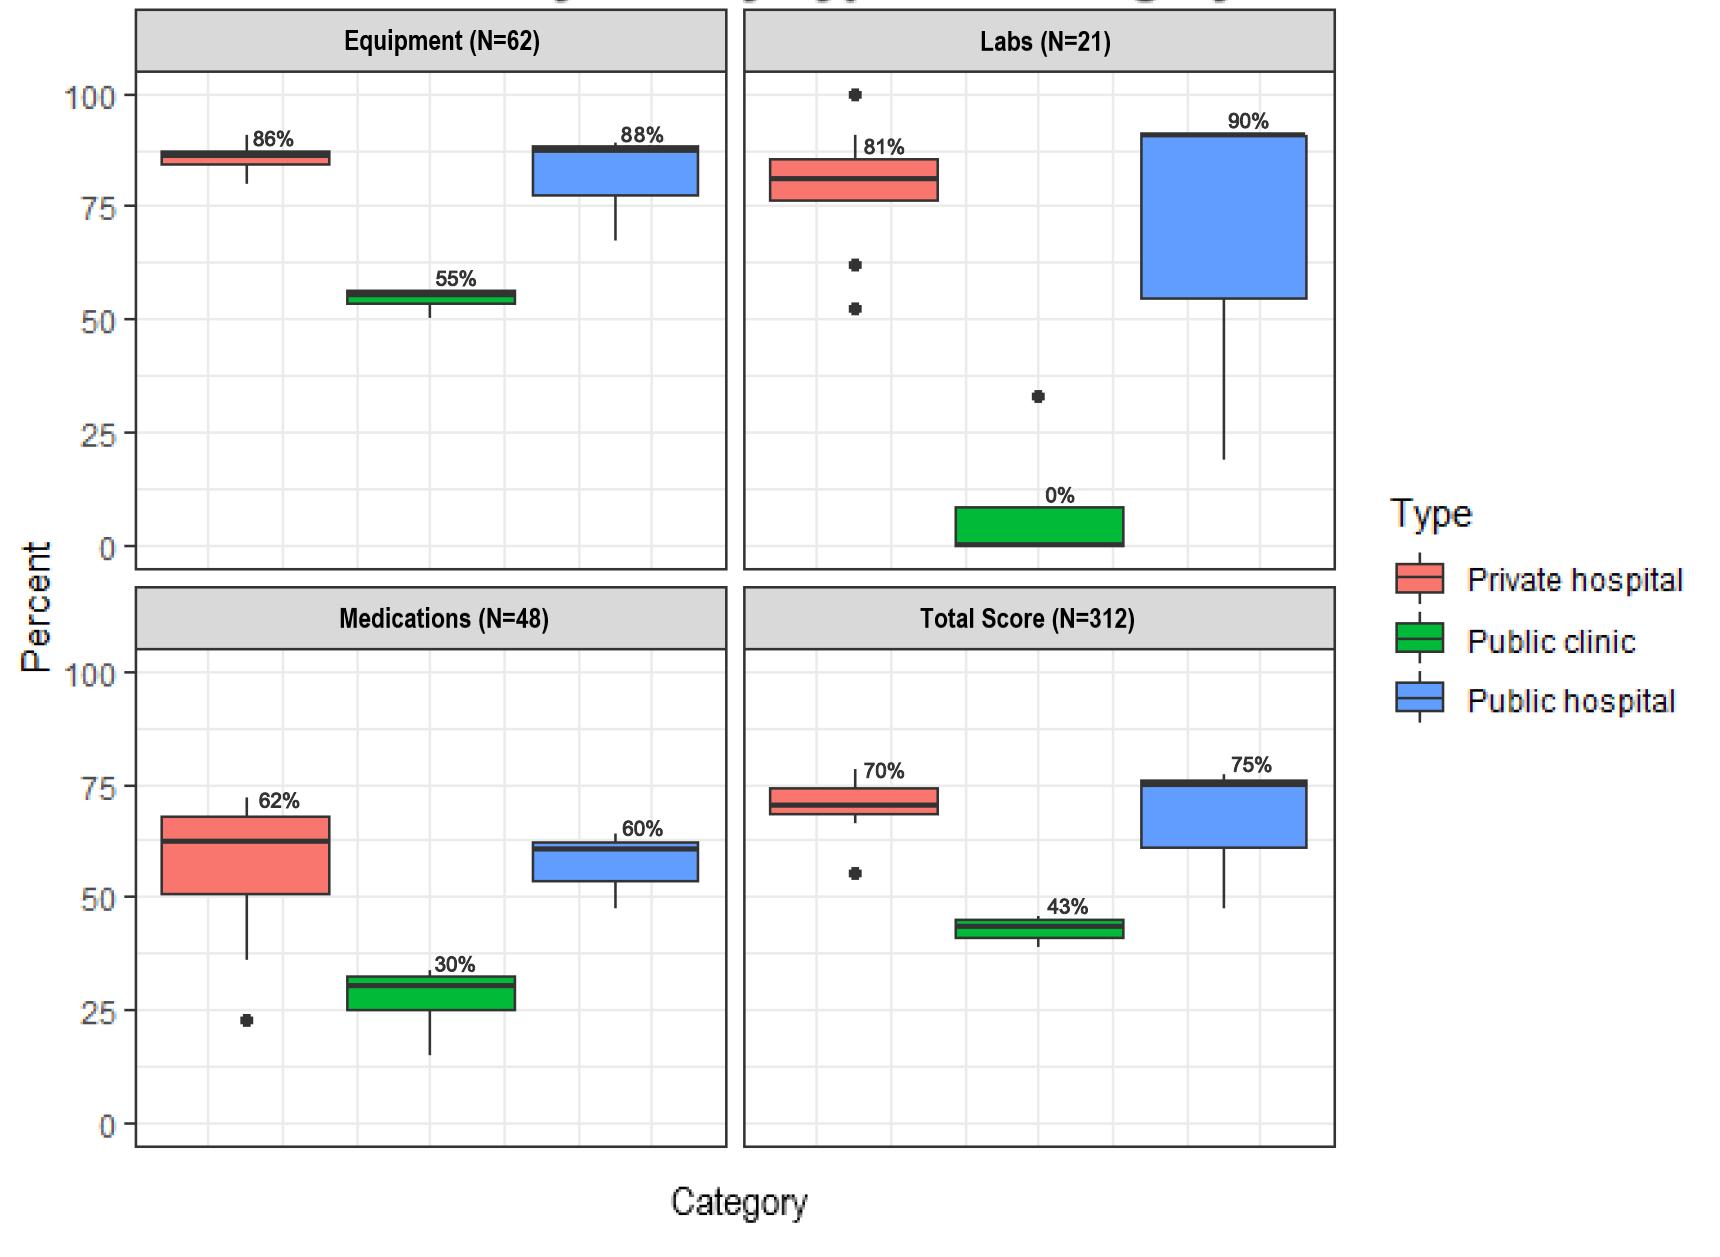
clinics, the largest deficit was in airway equipment (0-50% depending on item) and trauma equipment such as C-collars (0%), splints (0%), and large-bore intravenous (IV) needles (18G or larger, 75%). Among hospitals, the largest deficit was in pediatric equipment such as C-collar (8%), blood pressure cuff (83%), and intubation equipment (75-83%, depending on item).
Availability of larger equipment—such as electrocardiogram machine, ultrasound machine (point of care or comprehensive), and suction machine—was more variable among hospitals and almost non-existent among clinics. Eleven of 16 facilities had at least 70% of surveyed equipment. Hospitals had a significantly higher percentage of available equipment compared to clinics (85% vs 54%, mean difference 31%; 95% confidence interval (CI) 23-37%; P = 0.004). There was no difference in equipment
labs. Among hospital laboratories, most labs were available at every facility. The largest shortcomings were regarding bacterial cultures, as well as anything related to cerebrospinal fluid (including microscopy, basic studies, and culture). There was no difference in laboratory test availability between public and private hospitals (P = 0.66) or between cities (P = 0.43).
Medications
The weakest measure among a facility’s physical assets was medications, even for hospitals (Figure 1). Only a quarter of facilities checked medication stocks daily, although every facility reported appropriate storage and refrigeration of medications. Hospitals had good access to oxygen (100%), inhaled bronchodilators (100%), IV fluids (100%), and
Volume 23, no. 5: September 2022 749 Western Journal of Emergency Medicine Hughes et al. Emergency Services Capacity of a Rural Community in Guatemala
antibiotics (25-83%, depending on item) vs clinic availability of 25%, 50%, 100%, and 0-100%, respectively. Epinephrine and regular insulin were not always available (mean of 92% and 67% for hospitals and 50% and 25% for clinics, respectively). Only two of 16 facilities had at least 70% of surveyed medications. Private hospitals had access to a significantly higher percentage of medications compared to clinics (56% vs 27%, mean difference 29%; 95% CI 9-49%; P = 0.024). However, there was no difference in medication access between clinics and public hospitals (P = 0.06), public and private hospitals (P = 0.99), or between cities (P = 0.634).
Total Score
Given the large number and heterogenous nature of survey tool items, the total score category was created to allow comparison of these multiple smaller categories. We report here a subset of these items. (For a full list see the tool in Supplemental Materials.) An ambulance was available at all hospitals but at only 50% of clinics. Of the facilities with an ambulance, hospitals’ ambulances had a mean of 37% of surveyed equipment, while clinics’ ambulances had a mean of 23%. All public facilities had triage protocols for the EU, compared to only 67% of private hospitals. The average frequency of professional training opportunities among all facilities was 9.6 trainings per year for both nurses and physicians. Twenty-two percent of private hospitals required payment before providing services, even in cases of emergency, although no public facility reported this practice. Only 63% of facilities had a mass casualty plan, but none had practiced the plan within the prior year. Hospitals had a greater availability of all survey items (total score) than clinics (69% vs 43%, mean difference 26%; 95% CI 15-36%; P = 0.008). There was no difference in total score between public and private hospitals (P = 0.82), or between cities (P = 0.51).
DISCUSSION
This study describes the regional, self-reported availability of emergency services in a rural area of Guatemala serving a predominantly indigenous population. This is the first systematic assessment of capacity in rural Central and South America. Previous work was limited to one study of emergency services in an urban area in El Salvador10 and other studies in South America with limited scopes of assessment such as trauma or surgery.11–15 In our study we found some areas of adequate capacity including in supplies such as PPE and staffing infrastructure. However, there were also major deficiencies including a severe shortage of critical medications in clinics, and a widespread shortage of pediatric equipment.
In terms of positive findings, we found high availability of basic PPE in all surveyed facilities, similar to conditions in Myanmar23 and Ghana.24 It should be noted, however, that our study was conducted before the coronavirus 2019 pandemic and may not reflect global changes and shortages of PPE.25 Our survey also reflected broadly high availability of general emergency supplies such as airway equipment, IV equipment,
and vitals monitoring equipment. This finding is similar to others in the region including a survey of facilities in El Salvador 10 and in other areas of the globe including surveys of hospitals in Kenya,26 Sierra Leon,27 and Zambia.28
The access to a physician in the EU was surprisingly high, in contrast to other studies where after-hours access was as low as 38% of facilities.10 However, in our population there were no emergency medicine (EM)-trained physicians available at any time. While there are no studies comparing the outcomes of EM board-certified physicians to general practitioner physicians, the three major US EM professional societies have policy statements regarding the superior care from an EM board-certified physician in an emergency setting.29–31 However, access to an EM-trained physician is limited in Guatemala, as there are only two EM residencies in the country, the first of which was founded in 2017, and both of which are based in the capital Guatemala City.32
We found a significant shortcoming in the availability of critical medications such as oxygen and epinephrine in surveyed clinics, and even hospitals had barely greater than half of medications available. This is compared to 60% medication availability in El Salvador.10 A similar study in urban and rural Myanmar found universal availability of oxygen and oral antibiotics at all facility levels,23 although in that study and all others, the availability of epinephrine was not assessed in clinics.23,24,27,28,33
Like the limitations in medication and oxygen, we also found a significant deficiency in pediatric equipment availability across all facilities. Previous studies have not conducted comprehensive pediatric emergency assessments, and this is the first report to do so. Pediatric emergency services are often cited as an area in need of improvement both in LMIC countries34 and high-resource countries such as the US.35 Our recommendation for improvement in this area is to increase the priority of pediatric supplies when making funding decisions.
Significant work in assessing causes of stockouts in the Guatemalan healthcare system has been undertaken by the US Agency for International Development, and its most recent Health Systems Assessment19 has several pertinent recommendations, which we would echo. While the need for increased funding is a constant refrain, other interventions would be to automate inventory management, focus on providing medications and supplies that are actually being used, and focus on stocking a smaller number of core medications and supplies. Reassuringly, we found no significant variation between availability of services between private and public facilities or between cities in this region, in contrast to the inferiority of public facilities reported in Sierra Leone.27
Although the ESRAT has been used in a variety of LMICs, it has not been formally validated. However, it is similar to other emergency systems survey tools such as the Emergency Care Assessment Tool36 and the Hospital Emergency Unit Assessment Tool33 and covers every clinical category in those surveys (termed “signal functions” by those tools) with the addition of obstetrical bleeding.
Western Journal of Emergency Medicine 750 Volume 23, no. 5: September 2022 Emergency Services Capacity of a Rural Community in Guatemala Hughes et al.
The major findings of our assessment were a high availability of emergency services, universal PPE availability, a severe shortage of critical medications in clinics, and widespread shortage of pediatric equipment. Medication availability was the largest area of need, as only two facilities met the 70% target set by the WHO for supply of basic emergency medications.24 Equipment and supplies fared much better, with 11 of 16 facilities meeting the 70% target. Although many clinic settings reported providing acute care services 24/7, there was limited availability of personnel, medications, and equipment. Both public and private hospitals reported similar capabilities.
Although there are a number of settings where residents of the Atitlán area can access emergency services, the actual access of and use by residents of the region to these facilities is not clear. There is no prehospital system within this area (and it is still limited in much of Guatemala),9 so that patients self-triage to various facilities. Understanding the factors that lead patients to use one facility over another — geography,37,38 expense,39,40 or perceived acuity — is important for further defining emergency services within the area.
The flow of patients within this system from one facility to another is also unclear, including whether some of these facilities function mostly as triage to the larger hospitals or provide definitive care. Although the ESRAT was not designed to assess clinics, we included these facilities in this assessment because they reported providing emergency services, and public clinics are often the only option for people with limited financial means as the only public hospitals in the region are located in Sololá and Panajachel, which both require a lengthy boat or car ride to be reached from other studied areas. Additionally, due to the mountainous setting, roads may be impassable following natural disasters, and patients may not be able to reach a hospital. Indeed, in the immediate aftermath of Hurricane Stan in 2005, it was reported in a community in Sololá’s neighboring department that 61% of the population was unable to get to a hospital for injuries sustained from the hurricane.41 Thus, it was essential to assess and improve the ability of clinics to provide basic management and stabilization before transfer as patients are presenting to them with emergency needs. Notably, access to basic life-saving capabilities such as oxygen was very low in these clinics.
LIMITATIONS
While we believe we identified all facilities providing emergency services in the area, there may be facilities that were missed, and one facility did not agree to participate in our study. The facility that declined to participate was a private hospital in Sololá which, based on public marketing materials and preliminary conversations with hospital leadership, provided services similar to the other private hospitals surveyed.
Some results of the survey are self-reported and thus limited by personal knowledge of the respondents. This was in part mitigated by interviewing more than one person at each facility, performing all counts of resources (infrastructure, supplies, and medications) by direct inspection, and directly
visualizing staffing rosters. Another limitation is that the ESRAT evaluates only the presence of items and not personnel trained in their use. Thus, our findings are likely an overestimation of each facility’s true capacity. Finally, it should be noted that the survey used was not originally developed in Spanish; therefore, some errors in translation and transcription may be present, although these were mitigated by the survey optimization process and the use of a single bilingual surveyor.
These results address only one rural area in Guatemala, which limits generalizability. It is unclear whether the deficiencies identified in this area are universal to all regions in Guatemala. We suspect that they may in fact be more pronounced in this region given the largely indigenous population and known disparities that exist in the healthcare system between urban and rural areas.42 Because Guatemala does have a national healthcare system, it is possible that the availability of resources would be similar in public healthcare facilities across the country.
CONCLUSION
We found that emergency units serving a rural, largely indigenous population in Guatemala demonstrated several critical deficiencies, most prominently in medications and pediatric-specific equipment. There were also large discrepancies between hospitals and clinics, such as availability of specialists and laboratory services, While such discrepancies may be expected, they also pose challenges for patients who do not know or understand these variations. As emergency services develop across Central and South America, it is important to understand the critical shortages facing these facilities, especially in rural areas. Future studies in acute care use and patient outcomes are needed to better understand how to improve emergency services for rural populations.
ACKNOWLEDGMENTS
We wish to thank Dr. Rafael Tun, MD, and Dr. Sean Duffy, MD, for their contributions to our understanding of the context of the local community.
Address for Correspondence : Matthew Hughes, MD, Department of Emergency Medicine Administrative Offices, 1950 W. Polk St., 7th Floor, Chicago, IL 60612. Email: matthew.hughes@cookcountyhealth.org.
Conflicts of Interest: By the WestJEM article submission agreement, all authors are required to disclose all affiliations, funding sources and financial or management relationships that could be perceived as potential sources of bias. No author has professional or financial relationships with any companies that are relevant to this study. There are no conflicts of interest or sources of funding to declare.
Copyright: © 2022 Hughes et al. This is an open access article distributed in accordance with the terms of the Creative Commons Attribution (CC BY 4.0) License. See: http://creativecommons.org/ licenses/by/4.0/
Volume 23, no. 5: September 2022 751 Western Journal of Emergency Medicine Hughes et al. Emergency Services Capacity of a Rural Community in Guatemala
REFERENCES
1. World Health Organization. World Health Assembly First Special Session. 2006. Available at: https://apps.who.int/gb/ebwha/pdf_files/ WHASSA_WHA60-Rec1/E/WHASS1_WHA60REC1-en.pdf. Accessed February 15, 2021.
2. Henry JA, Reingold AL. Prehospital trauma systems reduce mortality in developing countries: a systematic review and meta-analysis. J Trauma Acute Care Surg. 2012;73(1):261-8.
3. Anderson PD, Suter RE, Mulligan T, et al. World Health Assembly Resolution 60.22 and its importance as a health care policy tool for improving emergency care access and availability globally. Annals of Emergency Medicine. 2012;60(1):35-44.e3.
4. Mock C. WHA resolution on trauma and emergency care services. Inj Prev. 2007;13(4):285-6.
5. World Health Organization. Fact file on health inequities. Available at: https://www.who.int/sdhconference/background/news/facts/en/. Accessed February 15, 2021.
6. Hughes J. Gender, equity, and indigenous women’s health in the Americas. 2004. Available at: https://www.paho.org/hq/ dmdocuments/2011/gdr-gender-equity-and-indigenous-womenhealth-americas.pdf. Accessed February 15, 2021.
7. The World Bank. The World Bank in Guatemala. 2017. Available at: https://www.worldbank.org/en/country/guatemala/overview. Accessed February 15, 2021.
8. INE. Mapas de pobreza rural en Guatemala 2011. 2013. Available at: https://www.ine.gob.gt/sistema/uploads/2015/09/28/ V3KUhMhfgLJ81djtDdf6H2d7eNm0sWDD.pdf. Accessed February 15, 2021.
9. Hess A, Thomas T, Contreras R, et al. Development of emergency medical services in Guatemala. Prehosp Emerg Care. 2004;8(3):308-12.
10. Cioe-Pena E, Fling N. Emergency services rapid assessment tool in San Salvador, El Salvador. Prehosp Disaster Med 2017;32(S1):S59-S59.
11. Aboutanos MB, Mora F, Rodas E, et al. Ratification of IATSIC/WHO’s Guidelines for Essential Trauma Care Assessment in the South American region. World J Surg. 2010;34(11):2735-44.
12. Edmundo Rosales-Mayor, Miranda JJ, Lema C, et al. Recursos y capacidades de servicios de emergencia para atención de lesiones por traumas en Perú. Cadernos de Saúde Pública. 2011;27(9):1837-46.
13. Markin A, Barbero R, Leow JJ, et al. A quantitative analysis of surgical capacity in Santa Cruz, Bolivia. J Surg Res 2013;185(1):190-7.
14. LeBrun DG, Saavedra-Pozo I, Agreda-Flores F, et al. Surgical and anesthesia capacity in Bolivian public hospitals: results from a national hospital survey. World J Surg. 2012;36(11):2559-66.
15. Solis C, León P, Sanchez N, et al. Nicaraguan surgical and anesthesia infrastructure: survey of Ministry of Health hospitals. World J Surg. 2013;37(9):2109-21.
16. Chickering WH. A guide for visiting clinicians to Guatemala: common presenting symptoms and treatment. J Transcult Nurs 2006;17(2):190-7.
17. Chamarbagwala R, Morán HE. The human capital consequences of
civil war: evidence from Guatemala. J Dev Econ. 2011;94(1):41-61.
18. Friends of San Lucas. Health Care. 2020. Available at: https:// sanlucasmission.org/programs/healthcare/. Accessed February 16, 2020
19. Avila C, Bright R, Gutierrez J, et al. (2015). Health Finance & Governance Project. Guatemala Health System Assessment. Abt Associates Inc.
20. Broccoli MC, Moresky R, Dixon J, et al. Defining quality indicators for emergency care delivery: findings of an expert consensus process by emergency care practitioners in Africa. BMJ Glob Health 2018;3(1):e000479.
21. World Health Organization. Seventy-Second World Health Assembly. 2019. Available at: https://apps.who.int/iris/bitstream/ handle/10665/331821/A72_REC1-en.pdf?sequence=1&isAllowed=y. Accessed February 15, 2021.
22. Fagan T. Fiscal space for health in Guatemala: prospects for increasing public resources for health. 2017. Available at: http://www. healthpolicyplus.com/ns/pubs/7169-7307_GuatemalaFiscalSpace. pdf. Accessed February 15, 2021.
23. Seo D, Kim H, Kim K, et al. Status of emergency signal functions in Myanmar hospitals: a cross-sectional survey. West J Emerg Med 2019;20(6):903-9.
24. Japiong KB, Asiamah G, Owusu-Dabo E, et al. Availability of resources for emergency care at a second-level hospital in Ghana: a mixed methods assessment. Afr J Emerg Med. 2016;6(1):30-7.
25. Burki T. Global shortage of personal protective equipment. Lancet Infect Dis. 2020;20(7):785-6.
26. Burke TF, Hines R, Ahn R, et al. Emergency and urgent care capacity in a resource-limited setting: an assessment of health facilities in western Kenya. BMJ Open. 2014;4(9):e006132-e006132.
27. Coyle RM, Harrison HL. Emergency care capacity in Freetown, Sierra Leone: a service evaluation. BMC Emerg Med. 2015;15(1).
28. Chavula C, Pigoga JL, Kafwamfwa M, et al. Cross-sectional evaluation of emergency care capacity at public hospitals in Zambia. Emerg Med J. 2019;36(10):620-4.
29. AAEM. Use of non-emergency medicine specialists in the emergency department. 2009. Available at: https://www.aaem.org/resources/ statements/position/use-of-non-emergency-medicine-specialists-inthe-emergency-department. Accessed February 15, 2021.
30. Chisholm C, Baumann B. SAEM Position Statement on the Qualifications for Unsupervised Emergency Department Care. Acad Emerg Med. 2000;7(8):929.
31. American College of Emergency Physicians. Providers of unsupervised emergency department care. 2019. Available at: https://www.acep.org/ patient-care/policy-statements/providers-of-unsupervised-emergencydepartment-care/. Accessed February 15, 2021.
32. Paniagua-Avila MA, Messenger E, Nelson CA, et al. The GuatemalaPenn Partners: an innovative inter-institutional model for scientific capacity-building, healthcare education, and public health. Front Public Health. 2017;5:70.
33. Pigoga JL, Joiner AP, Chowa P, et al. Evaluating capacity at three government referral hospital emergency units in the Kingdom of
Western Journal of Emergency Medicine 752 Volume 23, no. 5: September 2022 Emergency Services Capacity of a Rural Community in Guatemala Hughes et al.
Eswatini using the WHO Hospital Emergency Unit Assessment Tool. BMC Emerg Med. 2020;20(1):33.
34. Obermeyer Z, Abujaber S, Makar M, et al. Emergency care in 59 lowand middle-income countries: a systematic review. Bull World Health Organ. 2015;93(8):577-586G.
35. Institute Of Medicine. IOM report: the future of emergency care in the United States health system. Acad Emerg Med. 2006;13(10):1081-5.
36. Bae C, Pigoga JL, Cox M, et al. Evaluating emergency care capacity in Africa: an iterative, multicountry refinement of the Emergency Care Assessment Tool. BMJ Glob Health. 2018;3(5):e001138.
37. Ebener S, Stenberg K, Brun M, et al. Proposing standardised geographical indicators of physical access to emergency obstetric and newborn care in low-income and middle-income countries. BMJ Glob Health. 2019;4(Suppl 5):e000778.
38. Ouma PO, Maina J, Thuranira PN, et al. Access to emergency
hospital care provided by the public sector in sub-Saharan Africa in 2015: a geocoded inventory and spatial analysis. Lancet Glob Health 2018;6(3):e342-e350.
39. Fraser MS, Wachira BW, Flaxman AD, et al. Impact of traffic, poverty and facility ownership on travel time to emergency care in Nairobi, Kenya. Afr J Emerg Med. 2020;10(1):40-5.
40. Suriyawongpaisal P, Atiksawedparit P, Srithamrongsawad S, et al. Closing the equity gap of access to emergency departments of private hospitals in Thailand. Emerg Med Int. 2018;2018:6470319.
41. Lin JY, King R, Bhalla N, et al. Assessment of prehospital care and disaster preparedness in a rural Guatemala clinic. Prehosp Disaster Med. 2011;26(1):27-32.
42. Pan American Health Organization. Country Report: Guatemala. 2017. Available at: https://www.paho.org/salud-en-las-americas2017/?page_id=127. Accessed July 31, 2020.
Volume 23, no. 5: September 2022 753 Western Journal of Emergency Medicine Hughes et al. Emergency Services Capacity of a Rural Community in Guatemala
COVID-19 and Serious Bacterial Infection in Febrile Infants Less Than 60 Days Old
David Guernsey III, DO, MPH Matthew Pfeffer, MD, MS James Kimpo, DO, MPH Hector Vazquez, MD, MSc Jessica Zerzan, MD
Maimonides Medical Center, Department of Emergency Medicine, Brooklyn, New York
Section Editor: Ioannis Koutroulis, MD, MBA, PhD
Submission history: Submitted;September 24, 2021; Revision received June 13, 2022; Accepted June 20, 2022
Electronically published August 10, 2022
Full text available through open access at http://escholarship.org/uc/uciem_westjem
DOI: 10.5811/westjem.2022.6.54863
Introduction: The pandemic caused by severe acute respiratory syndrome coronavirus 2 (SARSCoV-2) led to the coronavirus disease 2019 (COVID-19) pandemic that drastically impacted the United States. The evidence was not clear on how SARS-CoV-2 infection impacted children, given the high prevalence of SAR-CoV-2 infection. Febrile infants less than 60 days old are an ongoing challenge to risk-stratify for serious bacterial infection (SBI), including urinary tract infection (UTI), bacteremia, and meningitis. We hypothesized there would be a lower rate of SBI in SARS-CoV-2 positive febrile infants compared to those SARS-CoV-2 negative.
Methods: This was a retrospective chart review with a nested, age-matched, case-control study performed from March 2020–June 2021. Infants less than 60 days old presenting with fever were assigned groups based on SARS-CoV-2 infection. Blood, urine, and cerebrospinal fluid cultures were used as the gold standard to diagnose SBI. We compared overall rate of SBI as well as individual rates of SBI between each group. We performed a subgroup analysis evaluating the age group 29-60 days old.
Results: A total of 164 subjects met criteria for analysis: 30 COVID-19 positive and 134 COVID-19 negative subjects. Rate of SBI was 17.9% (95% confidence interval [CI]: 11.8-25.5%) in the COVID-19 negative group compared to 0% (95% CI: 0.0%-11.1%) in the COVID-19 group, which demonstrated statistical significance (p = 0.008). In the age-matched data, we found statistical significance for any SBI (p = <0.001). For individual rates of SBI, we found statistical significance for UTI (p = <0.001) and bacteremia (p = <0.001). The 29- 60 days-old subgroup analysis did not achieve statistical significance (p = 0.11).
Conclusion: This study demonstrated the utility of including SARS-CoV-2 infection as part of the risk stratification of febrile infants less than 60 days old. While overall there is a low incidence of bacteremia and meningitis in this age group, these results can contribute to existing literature and potentially help decrease invasive testing and exposure to broad-spectrum antibiotics. [West J Emerg Med. 2022;23(5)754–759.]
INTRODUCTION
In early March 2020, severe acute respiratory syndrome coronavirus 2 (SARS-CoV-2), a novel single-stranded RNA virus, led to a pandemic of coronavirus disease 2019
(COVID-19).1 Maimonides Medical Center (MMC) is an urban, community-based, academic hospital located in Brooklyn, NY, with the only children’s hospital in the largest borough of the largest city in the United States. At one point
Western Journal of Emergency Medicine 754 Articles in Press Original Research
it was one of the epicenters of the COVID-19 pandemic. The pediatric emergency department (PED) is nested within the main ED staffed by pediatric emergency medicine-trained physicians with approximately 35,000 visits annually prior to the COVID-19 pandemic. The effect COVID-19 had on infants varied on presentation, symptoms, and severity of illness.2-4
Infants less than 60 days old presenting to the PED with fever are some of the most vulnerable patients due to their risk for serious bacterial infections (SBI), which include urinary tract infections (UTI), bacteremia, and bacterial meningitis. The reported rates of SBI for infants less than 60 days old ranges from 7.0-12.5% for low-risk infants to as high as 20% for high-risk infants.5,6 Clinicians are tasked with identifying those neonates who are high risk given the need for advanced testing and management in these patients. In 2019, the Febrile Infant Working Group of the Pediatric Emergency Care Applied Research Network (PECARN) published new criteria to help identify infants at low risk for SBI. Specifically, PECARN helped to risk-stratify infants 29-60 days old.7
Recently, the American Academy of Pediatrics (AAP) updated its guidelines for the evaluation and management of febrile infants 8-60 days old to further clarify risk stratification, creating new age-group definitions.8 This literature speaks to the ongoing evolution and discussion of the best approach to this patient population. Clinical prediction rules such as the AAP guidelines help guide patient management and disposition.9 Multiple studies have shown that febrile infants with viral infection such as respiratory syncytial virus (RSV) or influenza are at a lower risk of SBI when compared to those infants without viral infection.10,11 Recently published data evaluating the effect of SARS-CoV-2 infection on the risk for SBI has yielded similar results.12
The emergence of a new infectious disease presents challenges in the risk assessment of any patient, but particularly in this age group. Our goal in this paper was to identify the rate of SBI in febrile infants less than 60 days old presenting to the ED who were COVID-19 positive and then compare it to the rate of SBI in febrile infants less than 60 days old who were COVID-19 negative. We hypothesized that infection with SARS-CoV-2 in febrile infants ≤60 daysold would be associated with a lower risk of SBI than febrile infants ≤60 days old without SARS-CoV-2 infection.
METHODS
This was a retrospective cohort study of febrile infants ages 60 days old or less who presented to the PED. Fever was considered any rectal temperature of 38oC (100.4oF) or greater in the prior 24 hours either at home or during the PED visit. The study period encompassed March 2020–June 2021. We identified patients by querying the electronic health record (EHR) for all infants ≤60 days old who presented to the PED during the defined study period. We reviewed each variable and how to extract the information from the subject’s chart. Patients were excluded if they were afebrile at home and during the PED visit,
Population Health Research Capsule
What do we already know about this issue?
The impact of COVID-19 on children has been less severe compared to adults, but the impact on high-risk, febrile neonates has not been clearly documented.
What was the research question?
What impact did concurrent COVID-19 infection on febrile neonates less than 60 days old have on serious bacterial infections?
What was the major finding of the study?
Rate of SBI for concurrent COVID-19 infection was 0% (95% CI 0-11%), statistically significantly lower (p = 0.008) than 18% (1226%) found in COVID-19 negative patients.
How does this improve population health?
Febrile neonates are at high risk for serious bacterial infection. COVID 19 positive neonates may have a lower incidence of SBI, and allow for improved risk stratification and management.
had received antibiotics within 48 hours of arrival to the PED, had a recent diagnosis of SBI, gestation age less than 35 weeks, or comorbidities such as congenital heart disease, chronic lung disease, or ventriculoperitoneal shunts, which place those patients at higher risk of complicated illness.
The PECARN and AAP guidelines vary in their recommendations on the evaluation and management of these infants, including laboratory studies, treatment, and disposition from the PED.7,8 This variation in recommendations and guidelines has led to inconsistent practice by physicians. As this study was a retrospective chart review, it had no impact on the physician’s evaluation and management decisions. Thus, we excluded those patients whose evaluation did not include a SARS-CoV-2 test and at least one bacterial culture (urine, blood, and/or cerebrospinal fluid [CSF]). Infants were classified based on their COVID-19 status as determined by real-time reverse transcription–polymerase chain reaction (RT-PCR) testing of nasopharyngeal specimens, performed using one of several platforms including BioFire Respiratory 2.1 Panel (BioFire Diagnostics LLC, Salt Lake City, UT), Respiratory Pathogen Panel 2 (GenMark Diagnostics, Inc, Carlsbad, CA), and Xpert Xpress SARS-CoV-2/Flu/RSV (Cepheid, Sunnyvale, CA). The decision to test for SARS-CoV-2 was at the discretion of the treating physician; however, all hospitalized neonates required COVID-19 testing prior to bed assignment.
Articles in Press 755 Western Journal of Emergency Medicine Guernsey III et al. COVID-19 and Bacterial Infection in Febrile Infants
Data was collected directly from the EHR and stored in Microsoft Excel (Microsoft Corp, Redmond, WA). Data collected included demographics, chief complaint, preceding signs and symptoms, maximum temperature, ED disposition, International Classification of Diseases, 10th Revision, code diagnoses, length of stay if admitted to the hospital, and antibiotic therapy if treated with at least one dose. Laboratory data collected included white blood cell count, absolute neutrophil count, procalcitonin, urinalysis, urine culture, blood culture, CSF culture, respiratory viral panel (RVP), SARS-CoV-2 result, and chest radiograph result. The primary outcome was the presence of SBI, specifically urinary tract infection (UTI), bacteremia, or bacterial meningitis. A UTI was defined as a urine culture with at least 50,000 colonyforming units per milliliter of a single pathogen obtained via sterile catheterization. Bacteremia and bacterial meningitis were defined as growth of a single pathogen on either blood or CSF culture. We did not consider enteritis as part of SBI due to the low incidence at our institution and the lack of routine stool cultures.
Subjects were assigned to their respective group based on SARS-CoV-2 result. We analyzed the rate of overall SBI between COVID-19 positive and COVID-19 negative patients. A subgroup analysis was also performed examining the rate of each SBI (UTI, bacteremia, and meningitis) and the rate of invasive bacterial infections (IBI), which is defined as bacteremia and bacterial meningitis. We performed a nested, age-matched (+/- 2 days) case-control analysis on the data. An age-specific group of 29-60 days old analysis was completed comparing the rate of SBI between COVID-positive and negative groups. Finally, we completed an analysis in which subjects were assigned to viral infection positive or viral infection negative groups based on RVP results. The rate of any SBI, each individual SBI (UTI, bacteremia, and meningitis), and IBI were compared between the two groups.
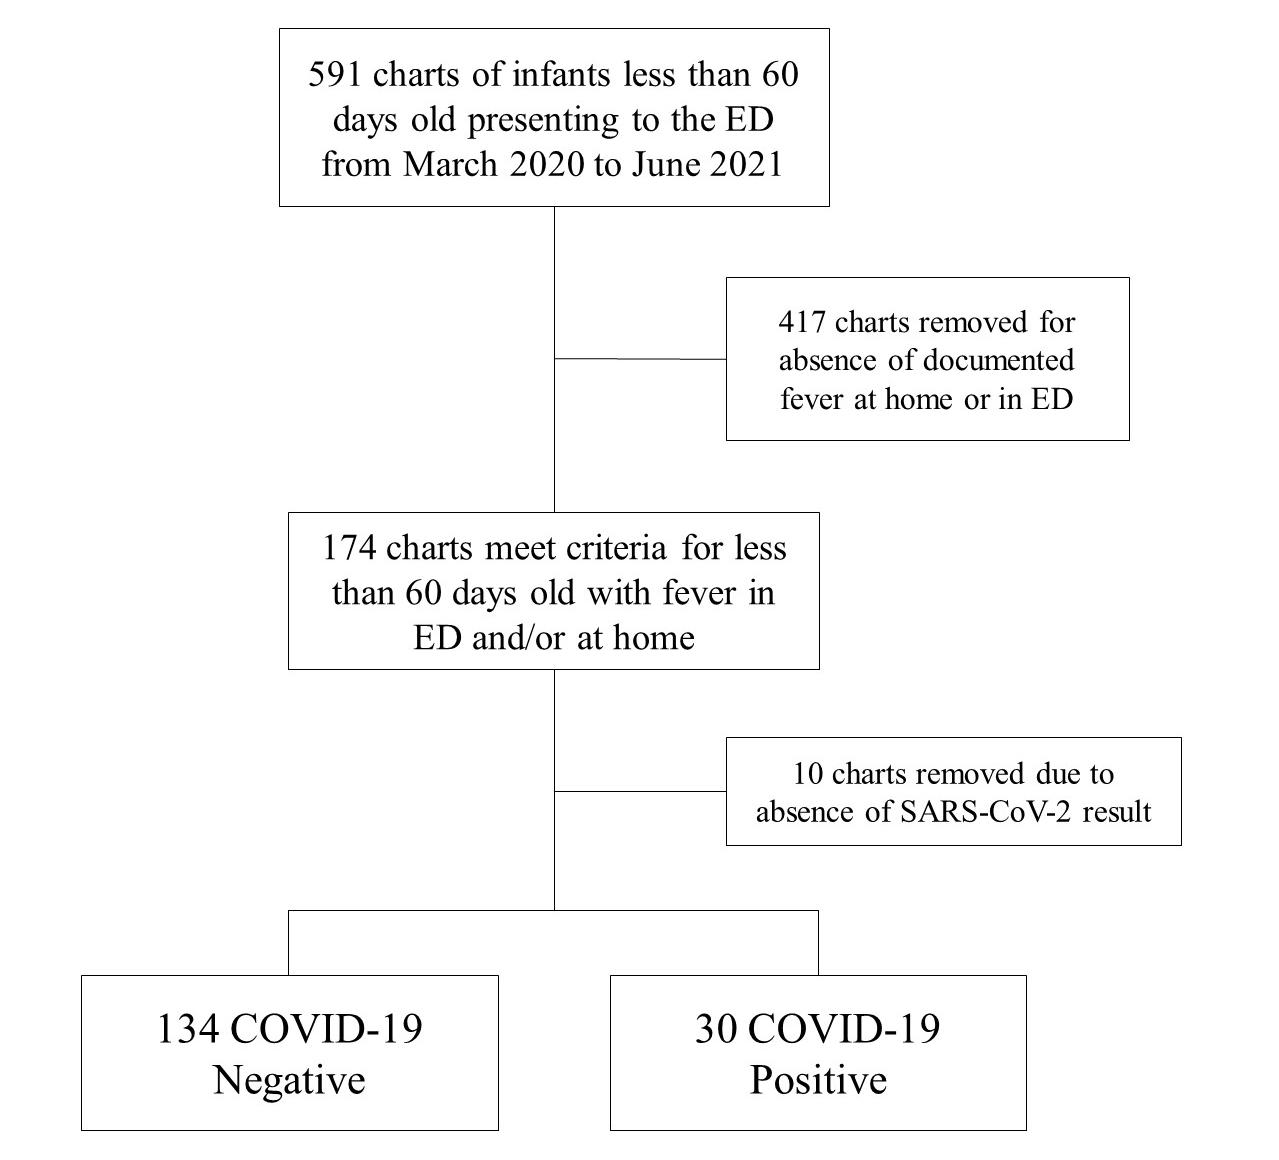
We summarized all continuous variables with medians and interquartile ranges, and categorical variables were summarized with frequency and count. We used the MannWhitney U test to compare continuous variables. Chi-square or Fisher’s exact test was used when comparing categorical variables. For the matched data analysis, we performed McNemar’s test. All statistical analysis was performed using SPSS statistical software (IBM Corporation. Armonk, NY) Alpha was set at 0.05. This study was approved under expedited review by the institutional review board at MMC.
RESULTS
We pulled 591 charts from the EHR that met age criteria. A total of 174 subjects met fever criteria for data collection. Of those, 10 subjects were removed because of absence of a SARS-CoV-2 result. No subject was excluded due to having at least one bacterial culture. All infants had urine and blood collected, while 49 (29.9%) of the patients did not have CSF collected. A complete RVP was not always readily available, and 23 patients (14.0%) did not receive a complete RVP. A total of 164 patients were included in the statistical analysis:
30 COVID-19 positive subjects and 134 COVID-19 negative subjects (see Figure). Subject characteristics between the two groups are presented in Table 1.
Table 1. Summary of study participants’ characteristics by group.
Figure. Flow diagram showing the selection of patients for inclusion in study. COVID-19 negative COVID-19 positive n = 134 n = 30
Age in days 34 (21 - 44) 34 (25 - 49) Gender Female 53 (39.6%) 15 (50%) Male Race 81 (60.4%) 15 (50%)
White 96 (71.6%) 20 (66.7%) Non-White
Ethnicity 38 (28.4%) 10 (33.3%)
Not Hispanic or Latino 114 (85.1%) 26 (86.7%)
Hispanic or Latino 6 (4.5%) 2 (6.7%)
Unknown 14 (10.4%) 2 (6.7%)
Maximum temperature (Celsius) 38.3 (38.1 - 38.8) 38.3 (38.1 - 38.6) White blood cell count (x103/UL) 12.6 (8.7 - 15.2) 8.4 (6.5 - 11.7)
Absolute neutrophil count (x103/UL) 4.13 (2.50 – 6.80) 2.60 (1.60 – 4.40) Procalcitonin (ng/mL) 0.65 (0.4 - 1) 0.65 (0.45 - 1.25)
Note: All numeric variables summarized with median and 25th-75th percentile. All categorical variables summarized with frequency and percentage.
UL, units per liter; ng/mL, nanograms per milliliter.
Western Journal of Emergency Medicine 756 Articles in Press COVID-19 and Bacterial Infection in Febrile Infants Guernsey III et al.
The rate of SBI in the COVID-19 negative group was 17.9% (95% confidence interval [CI]: 11.8-25.5%) compared to 0% (95% CI: 0.0%-11.1%) in the COVID-19 positive group. Of the SBI in the COVID-19 negative group, 21 subjects had UTI, five had bacteremia, and two had meningitis. For the IBI, three cases of bacteremia were associated with a concurrent UTI, and one case of meningitis was associated with bacteremia and UTI.
There was a statistically significant lower rate for any SBI, and specifically for UTI, in the COVID-19 positive group compared to the COVID-19 negative group. When evaluating those with IBI, we found no statistical significance between the COVID-19 positive and COVID-19 negative groups. The results are presented in Table 2. When we performed the subgroup analysis with the infants 29-60 days-old, we found a total of 80 COVID-19 negative patients with a total of 11 SBI. There were 20 COVID-19 positive patients, none of whom had SBI. When the two groups were compared, we found no statistical difference (P > 0.05) for any SBI, each of the individual SBI, and IBI. The results are presented in Table 3.
For the age-matched analysis, a total of 30 COVID-19 negative patients were matched to the 30 COVID-19 positive patients. There were zero SBI found in the COVID-19 positive group and a total of six SBI in the COVID-19 negative group. The number of individual SBI was six UTI, one bacteremia, and zero meningitis. Comparing these two groups, the P-value was less than 0.05 between all groups except for meningitis as there were no cases in either group (see Table 2).
Table 2. Results from unmatched and matched data analyses.
The last analysis compared SBI rates between patients with any viral infection on RVP vs those with a negative RVP. A total of 21 SBI were found in those with a negative RVP and three SBI in those with concurrent viral infection. When comparing the positive RVP group to the RVP negative, there was a statistically significant lower rate of SBI in the positive RVP group. When looking at the specific SBI, there remained only a statistically significant lower rate of UTI in the positive RVP group compared to the negative RVP group. Of note, there were also seven cases of viral meningitis, which were not included in or calculated as part of the patients with meningitis as this investigation was looking exclusively at IBI. All the patients who tested positive for viral meningitis had a negative bacterial culture and were COVID-19 negative.
DISCUSSION
The COVID-19 pandemic challenged us with a new disease as well as how to risk-stratify a COVID-19 positive, febrile infant less than 60 days old. Infants less than 60 days old are a vulnerable population for SBI and often need invasive evaluation and treatments. There has been progress in risk-stratifying these infants to avoid more invasive and unnecessary testing. A concurrent viral infection such as RSV has been shown to place febrile infants at a lower risk for SBI.11 In this study we aimed to determine whether an infection with SARS-CoV-2 could be used to risk-stratify our patients.
Matched Data
COVID-19 negative (n = 134) COVID-19 positive (n = 30) P-value
COVID-19 negative (n = 30) COVID-19 positive (n = 30) P-value
Any SBI 24 0 0.008 6 0 <0.001
Bacteremia 5 0 0.59 1 0 <0.001
UTI 21 0 0.02 6 0 <0.001
Bacterial meningitis 2 0 1.00 0 0 n/a
Invasive bacterial infection 6 0 0.59 1 0 <0.001
Note: The variables are summarized with each count. For the unmatched data, the groups were compared using Fisher’s exact test. For the matched data, the groups were compared using McNemar’s test. SBI, serious bacterial infection; UTI, urinary tract infection.
Table 3. Results from subgroup analysis of 29-60 days old.
COVID-19 negative (n = 80)
COVID-19 positive (n = 20) P-value
Any serious bacterial infection 11 0 0.11
Bacteremia 1 0 1.00
Urinary tracty infection 11 0 0.11
Bacterial meningitis 0 0 n/a
Invasive bacterial infection 1 0 1.00
Note: The variables are summarized with each count. The groups were compared using Fisher’s exact test.
Articles in Press 757 Western Journal of Emergency Medicine Guernsey III et al. COVID-19 and Bacterial Infection in Febrile Infants
Our results are promising and in line with other published studies that have attempted to address this question. There were zero SBI in any of the COVID-19 positive subjects, and the rate of SBI in the COVID-19 negative subjects is consistent with the rate of SBI in the United States. Moreover, we were able to show a statistically significant difference in any SBI infection between the COVID-19 negative group and COVID-19 positive group. This was in large measure driven by the rate of UTI. The incidence of bacteremia and meningitis has fallen significantly in the US. While the low rate of IBI in the population makes it difficult to obtain findings of statistical significance, we were able to complete a matched analysis that demonstrated a statistically significant lower rate for any SBI and a statistically significant lower rate of UTI and bacteremia in the COVID-19 positive group.
The overall rate of SBI we found in this investigation is similar to the findings in previously published data.5,6 Moreover, the childhood vaccination rate for Brooklyn’s school district (Kings County) is 94.5%, a sufficiently high level for herd immunity.13 The organisms isolated for UTI were Escherichia coli, Enterococcus faecalis, and Klebsiella pneumoniae, while in bacteremia and meningitis the organisms were Escherichia coli and Group B Streptococcus. These findings are parallel to the current published data.5,14 The significance of the seven cases of viral meningitis remains unclear. These were COVID-19 negative patients whose bacterial cultures were all negative. New diagnostic testing with PCR allows earlier detection of certain viral pathogens in CSF, which could lead to shorter courses of antibiotics and hospitalizations.
Infants 29-60 days old are of importance as risk stratification based on preliminary laboratory data and urinalysis determines whether more invasive testing with a lumbar puncture is indicated.7 Unfortunately, in our investigation, when evaluating this specific age group, we were unable to determine whether SARS-CoV-2 infection affects the subject’s probability of SBI, due to the small sample size.
The AAP’s recently updated guidelines enhance our ability to risk stratify these infants. These guidelines created additional age-group classifications and include specific laboratory studies for inflammatory markers to consider, such as absolute neutrophil count, procalcitonin, and C-reactive protein.8 Of note, neither these guidelines nor the PECARN febrile infant guidelines include viral panel results in risk stratification. Respiratory viral panels are becoming more accurate and readily available. With this new information, we must determine how it can be used for the benefit of these vulnerable patients. The use of RVPs will enable us to minimize invasive testing and the use of broad spectrum antibiotics, as well as unnecessary hospitalizations.
LIMITATIONS
There are several limitations that exist with this study. Retrospective studies are not as strong as prospective studies.
However, in this global pandemic with the development of a new illness, it is important to share what is known. It was performed at a single study site, which has inherent limitations including smaller sample size, and which led in turn to an extension of our initial time frame to include more patients. Moreover, our sample size was further reduced due to lower pediatric ED volumes since the beginning of the pandemic. The small sample size limited our ability to describe statistical significance when it comes to bacteremia or bacterial meningitis. Nonetheless, we argue that lack of any bacteremia or bacterial meningitis in the COVID-19 positive cohort is clinically significant.
Lastly, our institution does not routinely screen for invasive intestinal illness given the low prevalence in our community, which may have resulted in missed SBI. Our study highlights the need for additional work to further evaluate and better risk stratify these vulnerable patients, particularly in the context of concurrent viral illnesses. Furthermore, the understanding of the effect of SARS-CoV-2 continues to evolve. The impact that it has had on the pediatric patient continues to increase as new information comes to light.
CONCLUSION
This investigation contributes to our understanding of the impact of concurrent viral infections on the rate of serious bacterial infection in febrile infants. As advancements in medicine and research evolve, we will improve upon riskstratification tools for this vulnerable population. Despite the low incidence of SBI in this population, the mortality and morbidity remain significant. While limitations exist within our results and sample size, we believe our study provides a framework to continue the discussion and drive future research on this topic. Several challenges remain in the creation of clear guidelines to risk stratify febrile infants less than 60 days old. We hope that each investigation will contribute to an ever-growing body of knowledge that will establish clear, evidence-based practice for these clinically challenging patients.
Address for Correspondence: David Guernsey III, DO, MPH, Department of Emergency Medicine, 4802 10th Avenue, Brooklyn, NY 11219. Email: dguernsey@maimonidesmed.org.
Conflicts of Interest: By the WestJEM article submission agreement, all authors are required to disclose all affiliations, funding sources and financial or management relationships that could be perceived as potential sources of bias. No author has professional or financial relationships with any companies that are relevant to this study. There are no conflicts of interest or sources of funding to declare.
Copyright: © 2022 Guernsey III. This is an open access article distributed in accordance with the terms of the Creative Commons Attribution (CC BY 4.0) License. See: http://creativecommons.org/ licenses/by/4.0/
Western Journal of Emergency Medicine 758 Articles in Press COVID-19 and Bacterial Infection in Febrile Infants Guernsey III et al.
REFERENCES
1. CDC. Coronavirus Disease 2019 (COVID-19). Centers for Disease Control and Prevention. 2020. Available at: https://www.cdc.gov/ coronavirus/2019-ncov/index.html Accessed April 5, 2021.
2. Kanburoglu MK, Tayman C, Oncel MY, et al. A multicentered study on epidemiologic and clinical characteristics of 37 neonates with communityacquired COVID-19. Pediatr Infect Dis J. 2020;39(10):e297-302.
3. Zeng L, Xia S, Yuan W, et al. Neonatal early-onset infection with SARSCoV-2 in 33 neonates born to mothers with COVID-19 in Wuhan, China. JAMA Pediatr. 2020;174(7):722-5.
4. Mithal LB, Machut KZ, Muller WJ, et al. SARS-CoV-2 Infection in infants less than 90 days old. J Pediatr. 2020;224:150-2.
5. Biondi E, Evans R, Mischler M, et al. Epidemiology of bacteremia in febrile infants in the United States. Pediatrics. 2013;132(6):990-6.
6. Aronson PL, Thurm C, Alpern ER, et al. Variation in care of the febrile young infant <90 days in US pediatric emergency departments. Pediatrics. 2014;134(4):667-77.
7. Kuppermann N, Dayan PS, Levine DA, et al. A clinical prediction rule to identify febrile infants 60 days and younger at low risk for serious bacterial infections. JAMA Pediatr. 2019;173(4):342-51.
8. Pantell RH, Roberts KB, Adams WG, et al. Evaluation and management
of well-appearing febrile infants 8 to 60 days old. Pediatrics 2021;148(2).
9. Bachur RG, Harper MB. Predictive model for serious bacterial infections among infants younger than 3 months of age. Pediatrics 2001;108(2):311-6.
10. Byington CL, Enriquez FR, Hoff C, et al. Serious bacterial infections in febrile infants 1 to 90 days old with and without viral infections. Pediatrics. 2004;113(6):1662-6.
11. Levine DA, Platt SL, Dayan PS, et al. Risk of serious bacterial infection in young febrile infants with respiratory syncytial virus infections. Pediatrics. 2004;113(6):1728-34.
12. Payson A, Etinger V, Napky P, et al. Risk of serious bacterial infections in young febrile infants with COVID-19. Pediatr Emerg Care 2021;37(4):232-6.
13. New York State Department of Health. School Immunization Survey: Beginning 2012-13 School Year. Albany, NY: NYS Department of Health. 2021. Available at: https://health.data.ny.gov/Health/SchoolImmunization-Survey-Beginning-2012-13-Schoo/5pme-xbs5. Accessed June 4, 2022.
14. Weems MF, Wei D, Ramanathan R, et al. Urinary tract infections in a neonatal intensive care unit. Am J Perinatol. 2015;32(7):695-702.
Articles in Press 759 Western Journal of Emergency Medicine Guernsey III et al. COVID-19 and Bacterial Infection in Febrile Infants
Economic Evaluation of Ultrasound-guided Central Venous Catheter Confirmation vs Chest Radiography in Critically Ill Patients: A Labor Cost Model
Enyo A. Ablordeppey, MD, MPH*†
Adam M. Koenig, BS‡
Abigail R. Barker, PhD§
Emily E. Hernandez, MPH§
Suzanne M. Simkovich, MD, MS¶||
James G. Krings, MD MSCI#
Derek S. Brown, PhD**
Richard T. Griffey, MD, MPH†
Washington University School of Medicine, Department of Anesthesiology, St. Louis, Missouri
Washington University School of Medicine, Department of Emergency Medicine, St. Louis, Missouri
Washington University School of Medicine, St. Louis, Missouri
Washington University, Center for Health Economics and Policy at the Institute for Public Health, St. Louis, Missouri
Medstar Health Research Institute, Division of Healthcare Delivery Research, Hyattsville, Maryland Georgetown University School of Medicine, Department of Medicine, Washington, DC Washington University School of Medicine, Division of Pulmonary Critical Care Medicine, Department of Medicine, St. Louis, Missouri
Washington University in St. Louis, Brown School, St. Louis, Missouri
Section Editor: Laura Walker, MD
Submission history: Submitted February 20, 2022; Revision received June 23, 2022; Accepted July 4, 2022
Electronically published September 15, 2022
Full text available through open access at http://escholarship.org/uc/uciem_westjem
DOI: 10.5811/westjem.2022.7.56501
Introduction: Despite evidence suggesting that point-of-care ultrasound (POCUS) is faster and non-inferior for confirming position and excluding pneumothorax after central venous catheter (CVC) placement compared to traditional radiography, millions of chest radiographs (CXR) are performed annually for this purpose. Whether the use of POCUS results in cost savings compared to CXR is less clear but could represent a relative advantage in implementation efforts. Our objective in this study was to evaluate the labor cost difference for POCUS-guided vs CXR-guided CVC position confirmation practices.
Methods: We developed a model to evaluate the per patient difference in labor cost between POCUS-guided vs CXR-guided CVC confirmation at our local urban, tertiary academic institution. We used internal cost data from our institution to populate the variables in our model.
Results: The estimated labor cost per patient was $18.48 using CXR compared to $14.66 for POCUS, resulting in a net direct cost savings of $3.82 (21%) per patient using POCUS for CVC confirmation.
Conclusion: In this study comparing the labor costs of two approaches for CVC confirmation, the more efficient alternative (POCUS-guided) is not more expensive than traditional CXR. Performing an economic analysis framed in terms of labor costs and work efficiency may influence stakeholders and facilitate earlier adoption of POCUS for CVC confirmation. [West J Emerg Med. 2022;23(5)760–768.]
INTRODUCTION
Five million central venous catheters (CVC) are inserted in the United States annually.1 Following placement of CVCs,
confirmation of its position and exclusion of an iatrogenic pneumothorax are typically required for safety prior to use of the catheter for fluid or medication administration. The
Western Journal of Emergency Medicine 760 Articles in Press Original Research
* † ‡ § ¶ || # **
majority of such confirmation checks are performed by chest radiograph (CXR) at an estimated annual cost of >$500 million.2,3 Emerging literature supports deimplementing the current practice of obtaining a CXR after CVC insertion if point-of-care ultrasound (POCUS) is used to confirm catheter position and exclude a pneumothorax.4-9 Current standard of care recommends POCUS guidance during CVC insertion 10-12 Evidence now also supports the use of POCUS for CVC confirmation 4-9 POCUS-guided confirmation can be rapidly conducted immediately following the POCUS-guided insertion, making practical sense for workflow.
Waiting for CXR to be obtained in a critically ill patient can delay catheter use for delivery of critical medical interventions (ie, antibiotics, vasopressors, etc) and can increase morbidity and mortality.13-19 Indeed, faster initiation of patient care interventions is the most clear and substantial benefit of POCUS-guided CVC confirmation. The CVC confirmation by CXR traditionally requires 1) a technician to capture the image on a portable CXR machine and 2) a radiologist to interpret the image and bill for the interpretation. In contrast, POCUS-guided confirmation does not require additional equipment or personnel beyond what is required for the insertion itself, does not expose patients to radiation, and can be completed rapidly.20-22 In addition, use of a POCUSguided confirmation protocol obviates exposure of additional personnel (the radiology technician) to patients in the context of a pandemic.23
Three recent meta-analyses found that POCUS-guided CVC confirmation is feasible, fast, and accurate with diagnostic similarity to CXR confirmation.13,24,25 Yet, POCUS for CVC confirmation has not enjoyed wide adoption for reasons including organizational culture, care delivery routines, and clinical inertia.26,27 Demonstration of potential cost savings using the POCUS approach would provide additional impetus for its adoption. While cost savings measured by a reduction in CXR have been reported, there has not been an analysis of the costs associated with these CVC confirmation strategies from a personnel and time perspective. We hypothesized that a POCUS-guided CVC confirmation protocol, instead of a CXR protocol, decreases labor costs associated with CVC confirmation.
METHODS
The cost assessment analysis compared labor costs associated with the standard process (CXR) to the proposed alternative (POCUS) and followed the Consolidated Health Economics Evaluation Reporting Standards (CHEERS) reporting guideline (Supplemental File 1).28 The multistep processes of both CVC confirmation techniques are described below.
Setting
We conducted the study at a large (~1200 hospital beds) academic, urban, residency-affiliated, tertiary care medical center. Chest radiographs are routinely obtained
Population Health Research Capsule
What do we already know about this issue?
Millions of chest radiographs (CXR) are performed annually to confirm position and exclude pneumothorax after central venous catheter (CVC) placement.
What was the research question?
We evaluated the difference in labor cost of pointof-care ultrasound (POCUS)-guided vs CXRguided CVC position confirmation practices.
What was the major finding of the study?
POCUS-guided confirmation of central line placement is less expensive than chest radiograph ($14.66 vs. $18.48 on average, - 21%).
How does this improve population health?
This lower labor cost may facilitate earlier adoption of POCUS for CVC confirmation.
for patients in the emergency department and intensive care units after CVC insertion.
Protocol A: Traditional X-ray Confirmation
1. Clinician requests a CXR after CVC placement.
2. Request is received by the radiology department and a technician is sent to the patient’s bedside.
3. The technician performs a digital portable CXR.
4. The radiograph image is then available for the bedside clinician to review. In the absence of an obvious malposition or pneumothorax, the clinician will initiate use of the CVC.
5. The radiograph is interpreted by a radiologist. If evidence of a complication is detected at any point, catheter use may be suspended, and corrective action may be taken.
Protocol B: The Three-Step Protocol for POCUSGuided Confirmation
The POCUS-guided protocol evaluates the CVC position using three steps performed by the clinician placing the CVC (Figure 1): confirm venous placement; rule out catheter malposition; and rule out pneumothorax.13,14,24,29-31
1. Obtain a subcostal or apical four-chamber view of the heart while an assistant rapidly injects 10 milliliters of normal saline into the distal catheter lumen, confirming placement in or near
Articles in Press 761 Western Journal of Emergency Medicine Ablordeppey et al. Economic Evaluation of Ultrasound-guided CVC Confirmation vs CXR
the superior vena cava if turbulent flow, known as the “swirl sign”, is observed in the right atrium within two seconds of catheter flush.32
2. Obtain a view of the patient’s neck vessels (internal jugular and carotid) contralateral to the catheter location, and the assistant rapidly injects saline. A swirl sign should not be observed in the internal jugular or carotid during this step. If present, this may indicate catheter tip malposition.13,24,25
3. Obtain a mid-clavicular view of the pleura on the same side of the chest relative to the catheter location to demonstrate lung slide and exclude a pneumothorax.33 Visualization of pleural movement medial and lateral to the mid-clavicular point excludes an anterior pneumothorax.34,35
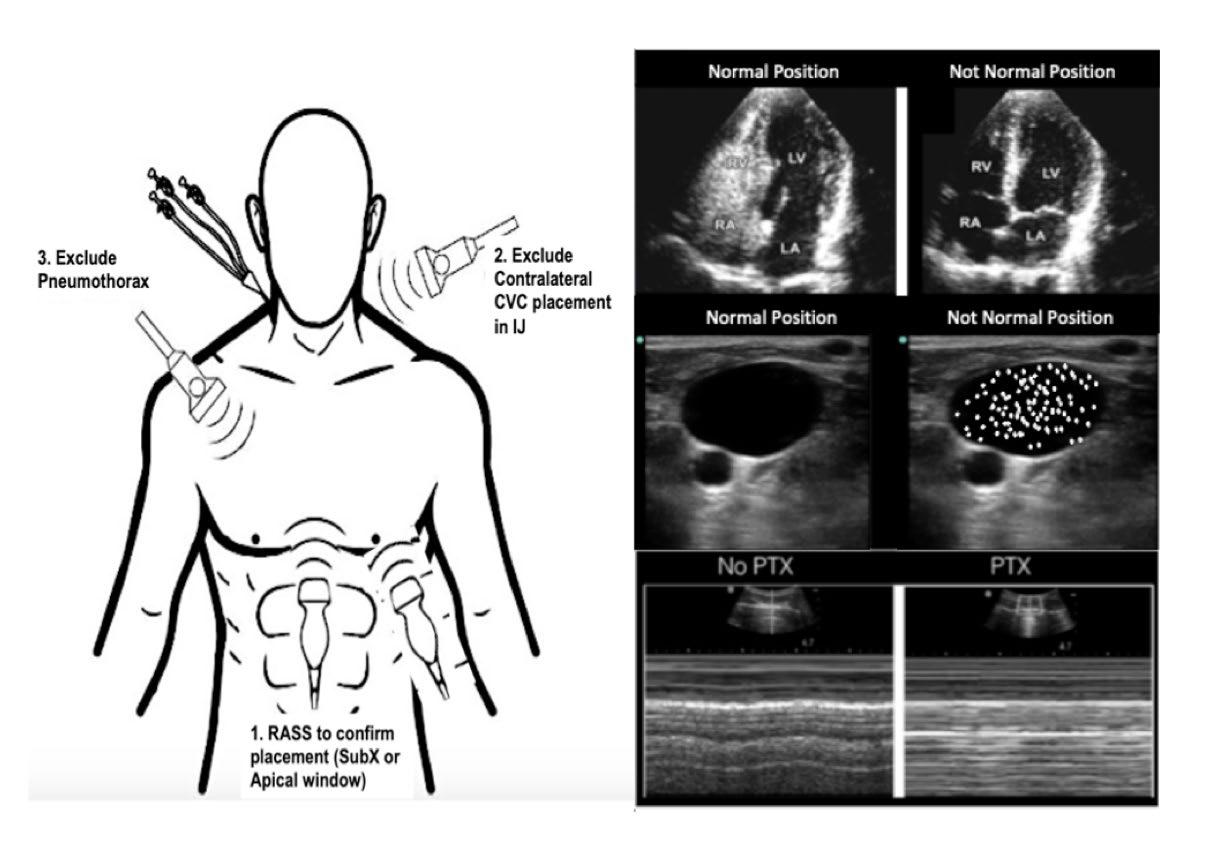
Model Description
We constructed a decision tree-based model (Figure 2) from current practice for CVC confirmation, comparing CXRguided to the proposed three-step POCUS-guided confirmation protocol. Modeling assumptions are made explicit in the text below and were tested using sensitivity analyses. See Table 1 for model variables. We used personnel costs in each protocol based on the common practice at our institution, and their roles were defined by standard processes at our local institution. Median salary data (total cash compensation) for relevant specialties (emergency medicine, critical care medicine, surgery, radiology) and ranks were obtained from the Association of American Medical Colleges list of large, research-intensive academic medical centers.36 Faculty physician salaries were assumed to compensate for approximately a 60-hour work
week.37-39 To focus the model on billable labor costs associated with POCUS we did not use the salaries of physicians in training and advance practice practitioner in the model. For registered nurses and radiology technicians, wage rates were taken from the Bureau of Labor Statistics for those occupations working in hospital settings.40,41 We then integrated labor costs per unit time with time data to quantify actual labor costs for each segment of the decision tree.
Table 2a demonstrates probability variables based on both internal and external data.24,25,42 We conducted one-way and two-way sensitivity analyses based on input from the literature about process steps within the protocols (Table 2b).24 Salary ranges are based on 25th and 75th percentiles from national sources while the times are based on reported standard deviation when available and estimated based on experience of practicing clinicians. Sensitivity analyses were not performed for salary data as these figures should be distributed equally across protocols and should change proportionally in other settings. In addition, we account for the potential for some cases in the POCUS-guided protocol to be diverted back to routine care (traditional CXR) after an unsuccessful attempt to confirm catheter position by POCUS. We make the assumption that ultrasound and CXR machines at our institution will be retired due to obsolescence before they are retired due to wear and tear and that changes in usage will not alter maintenance schedules. Thus, we did not examine costs associated with equipment purchase or maintenance. Furthermore, we did not measure the cost of training operators (or radiograph technicians) or disposable equipment.
RESULTS
The labor cost per patient from our model using protocol A (CXR) was $18.48, while the expected labor cost per patient
Figure 1. Point-of-care ultrasound-guided catheter confirmation protocol. Image modified from Montrief 20213 CVC, central venous catheter; IJ, internal jugular; RASS, right atrial swirl sign; SubX, subcostal view; LV, left ventricle; RV, right ventricle; RA, right atrium; LA, left atrium; PTX, pneumothorax.
Western Journal of Emergency Medicine 762 Articles in Press Economic Evaluation of Ultrasound-guided CVC Confirmation vs CXR Ablordeppey et al.
Figure 2. A decision tree model comparing protocol A (traditional X-ray confirmation) vs protocol B (POCUS-guided confirmation). CVC, central venous catheter; CXR, chest radiograph; POCUS, point-of-care ultrasound; MD, medical doctor.
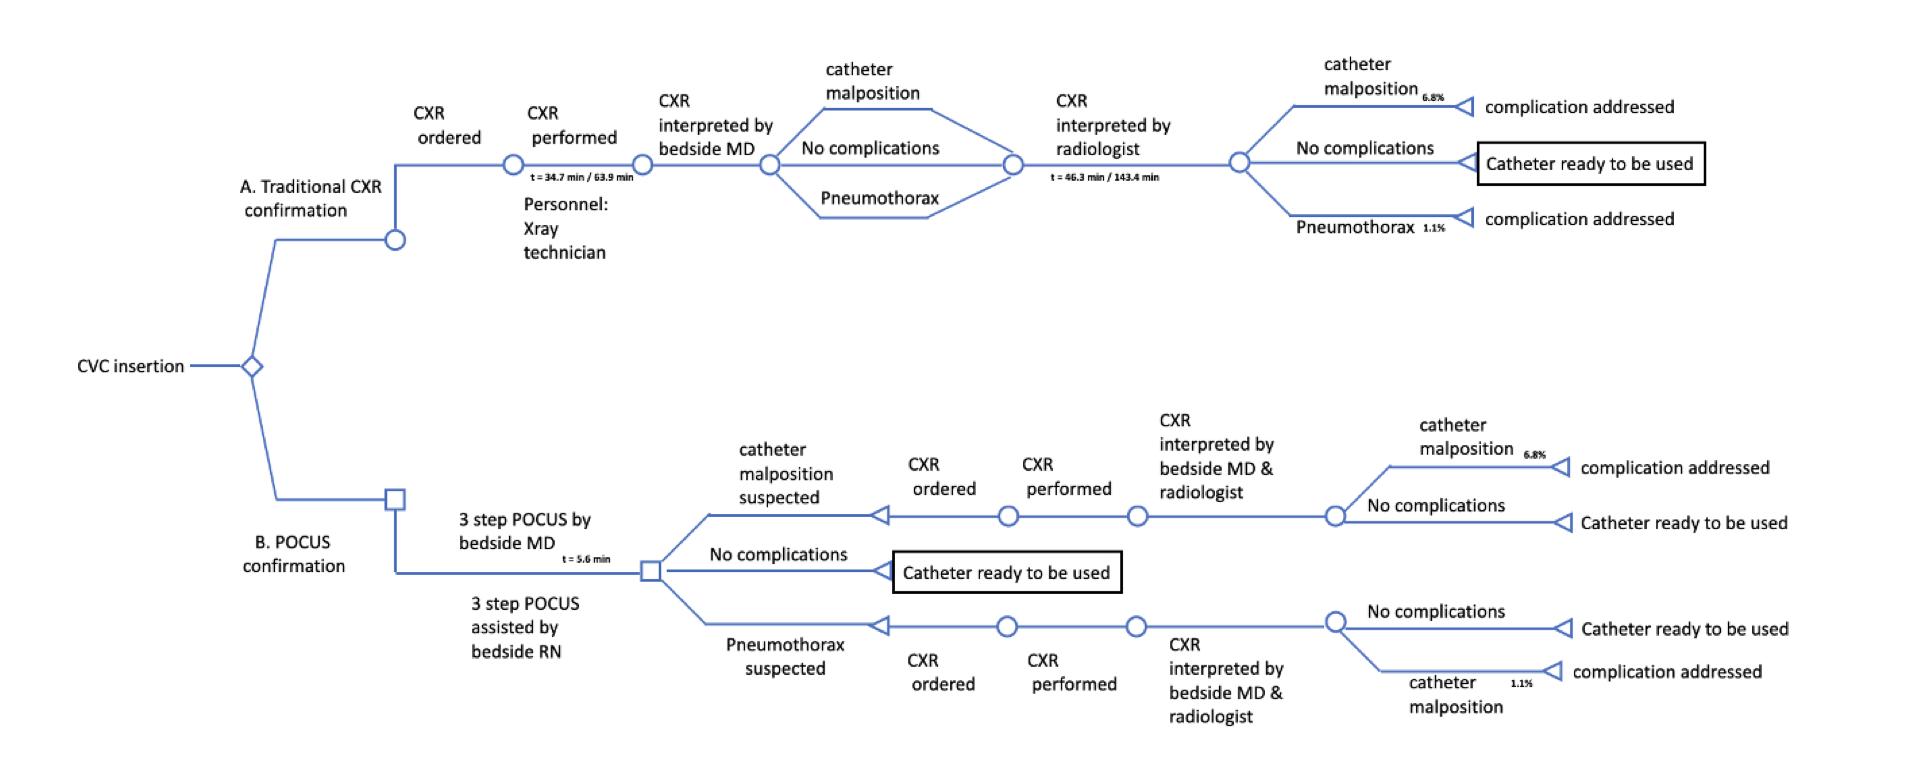
Table 1. Model variables.
Parameter
Central Estimate Range Used in Sensitivity Analysis
Bedside MD time per Protocol A 3.0 minutes 2 - 4
Bedside MD time per Protocol B 5.6 minutes 3.1 - 8.1
Radiology MD time for radiograph interpretation 3.0 minutes 2 - 4
RN time per Protocol B 5.6 minutes 3.1 - 8.1 Radiology technician time per Protocol A 15.0 minutes 10 - 20
Bedside MD labor cost ($/minutes)* 1.72 1.41 - 1.99
Radiology MD labor cost ($/minutes)* 1.89 1.66 - 2.06
RN labor cost ($/ minutes)** 0.64 0.52 - 0.79
Radiology technician labor cost ($/minutes)** 0.51 0.42 - 0.63
MD, medical doctor; RN, registered nurse.
*MD labor costs per minute were determined using annual salary estimates and dividing by estimated annual minutes.
Our sensitivity analysis used annual salary as a fixed variable and calculated pay ranges using a range of annual minutes worked. **RN and radiology technician labor costs and ranges were taken directly as hourly pay and converted to pay in minutes.
under protocol B (POCUS) was $14.66. The estimated cost savings, in labor, for switching to protocol B is $3.82 (21%) per patient (Table 3). The primary driver of savings was replacing the radiology technician labor costs with nursing
labor costs in the POCUS-based protocol. Cumulative physician labor costs were also less in the POCUS-based protocol due to slightly less overall time required (radiologist plus bedside physician) and payment differential for bedside physicians vs radiologists. A portion of the cost savings with the CXR-based protocol was negated by the possibility of patients in the POCUS-based protocol diverting to a CXR due to suspected complications seen on POCUS. We estimate that 7.9% of patients are diverted to CXR during the three-step protocol.25 Still, the costs saved on care of the remaining 92% of POCUS-protocol patients outweigh the additional cost of diverted patients.
In our institution, there were 3,069 CVC placements in one year, approximately 2,045 of which used a CXR for catheter position confirmation and pneumothorax exclusion.43 Thus, the cost of protocol A using CXR to confirm CVC was $37,792 compared to the cost of $29,984 if we used protocol B with POCUS guidance. For our hospital, this would result in a savings of $7,808 per year. Of the five million CVCs placed annually in the US, we estimate that 66%, or 3.3 million, are supradiaphragmatic CVCs eligible for POCUS-guided confirmation.43 Generalizing these costs across the entire US healthcare system with 3.3 million eligible CVCs per year, the cumulative labor costs of protocol A (CXR-based) are $61.0M vs $48.4M for protocol B (POCUS-based). By making the transition to using POCUS, there would be estimated savings (from labor cost only) to the US healthcare system of $12.6 million annually.
Sensitivity Analysis
We assessed two-way sensitivity using a tornado diagram (Figure 3). Our sensitivity analysis revealed a robust cost savings that persists at the extremes of most variables
Articles in Press 763 Western Journal of Emergency Medicine Ablordeppey et al. Economic Evaluation of Ultrasound-guided CVC Confirmation vs CXR
Table 2. Complication probability (2a) and time (2b) variables of chest radiograph and point-of-care ultrasound use for catheter confirmation
a. Complication Incidence
Detection Method Complication
Meta-Analysis, Smit 2018 25 Meta-Analysis, Ablordeppey 2017 24 Internal (Ablordeppey, 2019)
Radiology Interpretation of CXR (+) Malposition 6.80% 17.60% 2.60%
Radiology Interpretation of CXR (+) PTX 1.10% 1.10% 3.20%
b. Time Intervals
Interval Start Interval End
Meta-Analysis, Smit 2018 25 Meta-Analysis, Ablordeppey 2017 24 Internal (Ablordeppey, 2019)
CXR ordered CXR performed 34.7 min [32.6 -36.7] 63.9 min ± 57.1 29 min [1-269]
CXR ordered Radiology read complete 46.3 min [44.4 - 48.2] 143.4 min ± 123.7 POCUS confirmation initiated POCUS confirmation complete 2.83 min [2.77 - 2.89] 5.6 min ± 2.5 9 min [8.5 - 9.5]
CXR, chest radiograph; POCUS, point-of care ultrasound; PTX, pneumothorax; min, minute.
Table 3. Cost comparison between Protocol A versus B.
Variable Protocol A (CXR) Costs Protocol B (POCUS) Costs Cost Difference
CXR by radiology technician 15 minutes × $0.51/minute = $7.65
Cost of uncomplicated confirmation
CXR review by bedside MD 3 minutes × $1.72/minute = $5.16
CXR review by radiologist 3 minutes × $1.89/minute = $5.67
POCUS confirmation by bedside MD 5.6 minutes × $1.72/minute = $9.65
POCUS confirmation assisted by bedside RN 5.6 minutes × $0.64/minute = $3.57 - $5.26
Cost of diverting to CXR protocol due to malposition 0.0681 × $18.48 = $1.26
Cost of diverting to CXR protocol due to pneumothorax (1-0.068) × 0.011 × $18.48 = $0.19 + $1.45
Total cost per patient $18.48 $14.66 - $3.82 (-21%)
Estimated annual total cost for hospital (n = 2045)2 $37,792 $29,984 - $7,808
Estimated cost per 1 million CVCs $18.5M $14.7M - $3.8M
CVC, central venous catheter; CXR, chest radiograph; POCUS, point-of-care ultrasound; MD, medical doctor; RN, registered nurse.
1From Smit meta-analysis, 2018; 2From Ablordeppey internal data, 2019.
(Supplemental Tables 1 and 2). The exception is that protocol B (POCUS based) would be 3% more costly at the upper extreme of bedside physician time. Ultimately, our model strongly suggests that implementation of protocol B would result in lower labor costs in the vast majority of scenarios.
DISCUSSION
Rising healthcare costs in the US necessitate that health systems identify opportunities to optimize resources such as labor-associated costs during patient care.44 Our findings suggest that POCUS is faster and has associated workflowefficiency benefits, and that regarding labor costs the use
of CXR for CVC confirmation is slightly more expensive compared to POCUS. Other studies have looked at equipment cost, 22,45,46 but to our knowledge our study is the first costcomparison study to evaluate the organizational labor costs of POCUS-guided CVC confirmation compared to standard of care (CXR). Labor costs are more informative for such decisions, as radiographs and ultrasound are readily available in large academic medical centers and thus are not marginal costs to consider. While on an individual basis, the cost differences are marginal, these values become more substantial when considering the annual average number of CVC insertions performed. Our data also suggests that
Western Journal of Emergency Medicine 764 Articles in Press Economic Evaluation of Ultrasound-guided CVC Confirmation vs CXR Ablordeppey et al.
Figure 3. Tornado chart depicting percent change in total cost with variation in individual variables. Each bar depicts deviation in the total cost of a protocol that follows variation of an individual variable. MD, medical doctor; CXR, chest radiograph; POCUS, point-of-care ultrasound.
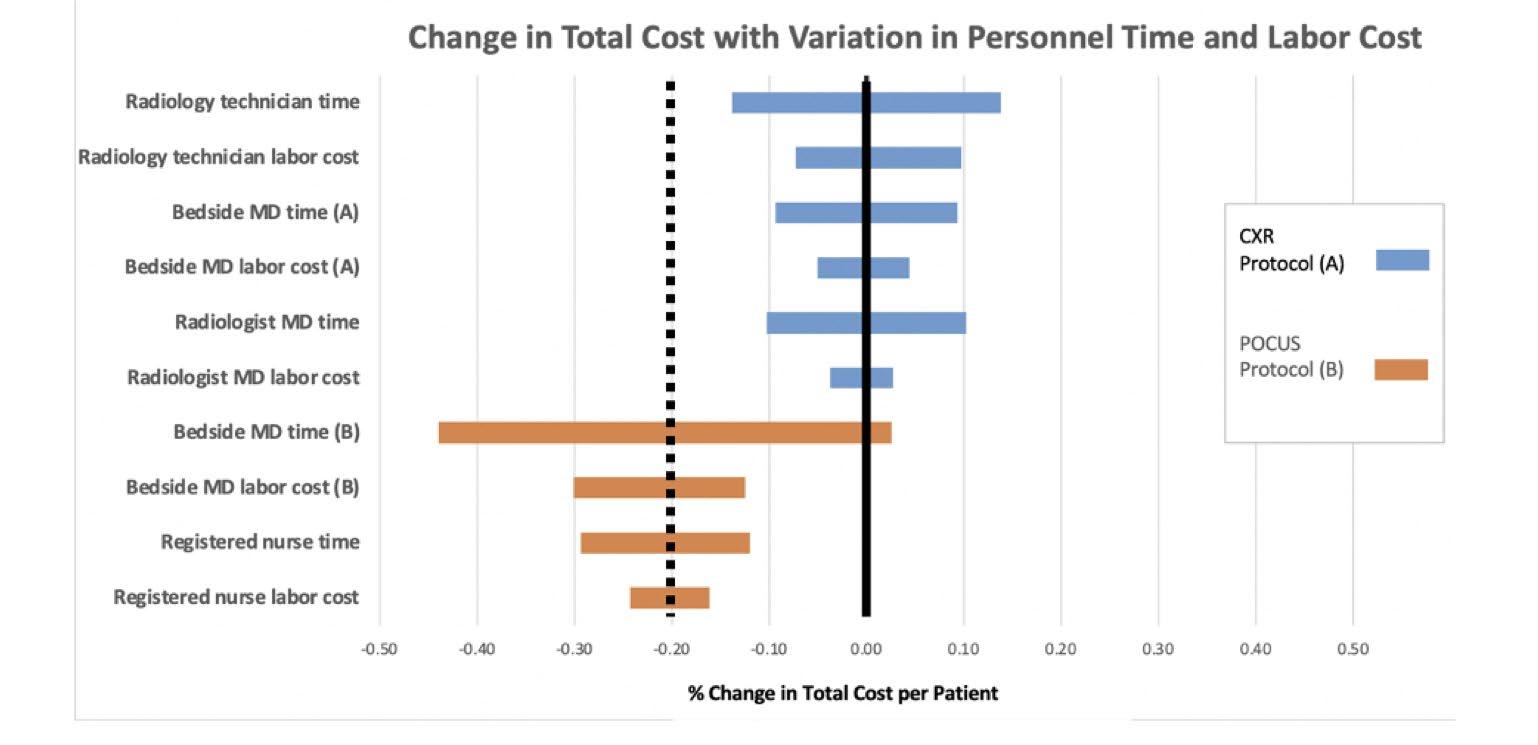
POCUS-guided CVC confirmation decreases time to initiate care, which can yield improvements in patient safety and further improve internal efficiencies and lower costs.
In our sensitivity analyses, varying time assumptions consistently yielded cost savings using the POCUS strategy, indicating that the results of our modeling appear to be robust and that savings occur at extremes of time and salary for the majority of variables. Our analysis used faculty salary data and did not account for the possibility of trainees (residents) or advanced practice practitioners conducting the POCUSbased protocol, which would further lower costs. Chui et al reported that healthcare costs associated with CXRs after CVCs are high and had an excessive number needed to treat suggesting that postprocedural CXR is an expensive screening test. In their study, 286 CXRs would be needed after POCUSguided right internal jugular vein CVC to detect one additional malpositioned catheter requiring intervention and 866 CXRs would be needed to detect a pneumothorax that required tube thoracostomy.7 We have a similar incidence of catheter malposition and pneumothorax at our institution suggesting similar numbers of CXRs needed to prevent one CVCrelated mechanical complication requiring intervention.43,47 Alternatively, Hirshberg et al used billing data to estimate a hypothetical hospital-wide cost savings of $54,494 per year by using POCUS for CVC confirmation instead of CXR, suggesting that whether measuring by facility cost, billing data, or labor cost, using POCUS is associated with a cost savings.48 Our data suggests that in addition to these other cost perspectives, from a labor cost point of view, POCUS is less costly than CXR for CVC confirmation.
Secondary safety improvements achieved using POCUSguided CVC confirmation are harder to quantify but are likely to reduce costs. Most notably, facilitating earlier patient care initiatives (using the CVC for its intended purpose) results in better outcomes for high-acuity patients. For example, it is
estimated that delayed vasopressor administration in cardiac arrest or sepsis translates to a 10% per minute decline in the odds of hospital discharge with a favorable outcome.49-51 Using POCUS as the first-line screening for CVC-related mechanical complications accepts a higher rate of false positives for patient safety. In this way the benefit of earlier medical management after CVC confirmation is present, and delays associated with CXR are avoided in most patients. When mechanical complications are a possibility (minority of patients), the delay is accepted and a CXR is necessary to determine whether intervention is needed. As reported in the literature, most mechanical complications (malposition, pneumothorax) in fact do not require reposition or tube thoracostomy. Other safety benefits of POCUS include limiting exposures for patients and technicians using POCUS rather than CXR confirmation and reducing the risk of transmission of infectious agents (including COVID-19) and the propagation of nosocomial infections.52,53 And notably, CXR exposes patients to ionizing radiation (albeit low level) while POCUS does not.
Finally, POCUS-guided CVC confirmation seen in our study can streamline physician workflow and significantly improve internal efficiency. The POCUS protocol’s linear workflow avoids the need to switch between unrelated tasks. A clinician can place a CVC, confirm placement, and initiate care all in one sitting without leaving the patient’s bedside. In contrast, the CXR confirmation protocol leaves significant time between completion of CVC placement and completion of the CXR, thus requiring the clinician to task switch during downtime before returning to the task of confirming CVC placement and initiating care.24 Task-switching is known to increase error rates,54,55 and is estimated to contribute to costs of over $280 million per year in the US.56 Ultimately, physician workflow during CVC confirmation can also be improved by eliminating CXR when POCUS has already
Articles in Press 765 Western Journal of Emergency Medicine Ablordeppey et al. Economic Evaluation of Ultrasound-guided CVC Confirmation vs CXR
been used to confirm the CVC. One survey of emergency and critical care physicians found that many already use POCUS to evaluate for pneumothorax (15% always; 58% sometimes) or catheter misplacement (20% always; 49% sometimes).27 Reducing this redundancy during CVC confirmation and using POCUS alone as a first-line screen will likely reduce the number of CXRs needed and associated costs.
LIMITATIONS
Our study has several limitations. We conducted this study at a single-center, large, urban, academic trauma center. Cost differences observed will likely vary by setting. Our analysis is based on labor costs only, not accounting for professional or facility charges associated with either protocol. In addition, our analysis relies on modeling, which by definition implies the simplification of reality, and simplifying assumptions were made in the model presented.57 Our model makes the assumption that training costs of the following variables would not change from standard operating costs in either protocol: 1) training for a clinician to use POCUS to insert CVCs and interpret CXR; and 2) training a clinician to use POCUS to insert and confirm a CVC.
Our analyses are calculated and projected, as standard care at our hospital currently uses CXR for CVC confirmation. Values are based on probability and not actual costs at our institution. We did make efforts to minimize bias by providing comprehensive assessments and analysis that would most mimic our local environment. We did not measure opportunity costs (nor implementation cost) associated with a new POCUS-guided CVC confirmation protocol. For example, our analysis assumes that a POCUS machine is widely available, training in bedside diagnostics is present, and a high number of CVC insertions occur annually. Finally, this was not a cost effectiveness analysis. We believe labor costs alone comprise a sufficient portion of the overall cost to allow inferences that the overall costs per patient would be lower. However we cannot make this case with absolute certainty. Further investigation would involve a more robustly defined measure of effectiveness. Although we evaluated the healthcare cost to the health system, there are other benefits of POCUS-guided CVC confirmation not captured in our analysis: less radiation exposure and quicker utilization of the catheter, for example, which have potentially greater value than just cost savings to the healthcare system.
CONCLUSION
Our study found modest labor cost savings by using point-of-care ultrasound to confirm central venous catheter position and exclude pneumothorax in the emergency department and intensive care unit. In addition to features of the POCUS approach such as time savings and workflow efficiency, which also likely have cost implications, labor cost is another consideration conferring an advantage to this approach to CVC confirmation and may serve as a facilitator
to its adoption. Future studies should characterize the resource implications of substituting POCUS-guided CVC confirmation more fully by conducting a comprehensive assessment of the costs of development, implementation, and maintenance of this change in process.
Address for Correspondence: Enyo Ablordeppey, MD, MPH, Washington University School of Medicine, 660 South Euclid Ave, St. Louis, MO 63110. Email: ablordeppeye@wustl.edu.
Conflicts of Interest: By the WestJEM article submission agreement, all authors are required to disclose all affiliations, funding sources and financial or management relationships that could be perceived as potential sources of bias. No author has professional or financial relationships with any companies that are relevant to this study. There are no conflicts of interest or sources of funding to declare.
Copyright: © 2022 Ablordeppey et al. This is an open access article distributed in accordance with the terms of the Creative Commons Attribution (CC BY 4.0) License. See: http:// creativecommons.org/licenses/by/4.0/
REFERENCES
1. McGee DC, Gould MK. Preventing complications of central venous catheterization. N Engl J Med. 2003;348(12):1123-33.
2. Pikwer A, Bååth L, Perstoft I, et al. Routine chest X-ray is not required after a low-risk central venous cannulation. Acta Anaesthesiol Scand. 2009;53(9):1145-52.
3. Montrief T, Auerbach J, Cabrera J, et al. Use of point-of-care ultrasound to confirm central venous catheter placement and evaluate for postprocedural complications. J Emerg Med 2021;60(5):637-40.
4. Lessnau KD. Is chest radiography necessary after uncomplicated insertion of a triple-lumen catheter in the right internal jugular vein, using the anterior approach?. Chest. 2005;127(1):220-3.
5. Woodland DC, Randall Cooper C, Farzan Rashid M, et al. Routine chest X-ray is unnecessary after ultrasound-guided central venous line placement in the operating room. J Crit Care. 2018;46:13-6.
6. Hourmozdi JJ, Markin A, Johnson B, et al. Routine chest radiography is not necessary after ultrasound-guided right internal jugular vein catheterization. Crit Care Med. Sep 2016;44(9):e804-8.
7. Chui J, Saeed R, Jakobowski L, et al. Is routine chest x-ray after ultrasound-guided central venous catheter insertion choosing wisely? Chest. 2018;154(1):148-56.
8. Chang TC, Funaki B, Szymski GX. Are routine chest radiographs necessary after image-guided placement of internal jugular central venous access devices?. AJR Am J Roentgenol. 1998;170(2):335-7.
9. Smit JM, Haaksma ME, Lim EHT, et al. Ultrasound to detect central venous catheter placement associated complications: a multicenter diagnostic accuracy study. Anesthesiology. 2020;132(4):781-94.
Western Journal of Emergency Medicine 766 Articles in Press Economic Evaluation of Ultrasound-guided CVC Confirmation vs CXR Ablordeppey et al.
10. Saugel B, Scheeren TWL, Teboul JL. Ultrasound-guided central venous catheter placement: a structured review and recommendations for clinical practice. Crit Care. 2017;21(1):225.
11. Seleznova Y, Brass P, Hellmich M, Stock S, Müller D. Costeffectiveness-analysis of ultrasound guidance for central venous catheterization compared with landmark method: a decision-analytic model. BMC Anesthesiol. 2019;19(1):51.
12. Augoustides JG, Cheung AT. Pro: ultrasound should be the standard of care for central catheter insertion. J Cardiothorac Vasc Anesth 2009;23(5):720-4.
13. Bou Chebl R, Kiblawi S, El Khuri C, et al. Use of contrastenhanced ultrasound for confirmation of central venous catheter placement: systematic review and meta-analysis. J Ultrasound Med 2017;36(12):2503-10.
14. Amir R, Knio ZO, Mahmood F, et al. Ultrasound as a screening tool for central venous catheter positioning and exclusion of pneumothorax. Crit Care Med. 2017;45(7):1192-8.
15. Wilson SP, Assaf S, Lahham S, et al. Simplified point-of-care ultrasound protocol to confirm central venous catheter placement: A prospective study. World J Emerg Med. 2017;8(1):25-8.
16. Blans MJ, Endeman H, Bosch FH. The use of ultrasound during and after central venous catheter insertion versus conventional chest X-ray after insertion of a central venous catheter. Neth J Med 2016;74(8):353-7.
17. Küchle C SY, Wen M. Placement of central venous dialysis catheters without X-ray: safety and feasibility. J Nephrolog Ren Dis. 2017;1(1).
18. Plurad DS, Talving P, Lam L, et al. Early vasopressor use in critical injury is associated with mortality independent from volume status. J Trauma Acute Care Surg. 2011;71(3):565-72.
19. Hidalgo DC, Patel J, Masic D, et al. Delayed vasopressor initiation is associated with increased mortality in patients with septic shock. J Critical Care. 2020;55:145-8.
20. Gekle R, Dubensky L, Haddad S, et al. Saline flush test: Can bedside sonography replace conventional radiography for confirmation of above-the-diaphragm central venous catheter placement? J Ultrasound Med. 2015;34(7):1295-9.
21. Vezzani A, Brusasco C, Palermo S, et al. Ultrasound localization of central vein catheter and detection of postprocedural pneumothorax: an alternative to chest radiography. Crit Care Med. 2010;38(2):533-8.
22. Matsushima K, Frankel HL. Bedside ultrasound can safely eliminate the need for chest radiographs after central venous catheter placement: CVC sono in the surgical ICU (SICU). J Surg Res 2010;163(1):155-61.
23. Schrift D, Barron K, Arya R, et al. The use of POCUS to manage ICU patients with COVID 19. J Ultrasound Med. 2021;40(9):1749-61.
24. Ablordeppey EA, Drewry AM, Beyer AB, et al. Diagnostic accuracy of central venous catheter confirmation by bedside ultrasound versus chest radiography in critically ill patients. Crit Care Med 2017;45(4):715-24.
25. Smit JM, Raadsen R, Blans MJ, et al. Bedside ultrasound to detect central venous catheter misplacement and associated iatrogenic complications: a systematic review and meta-analysis. Critical Care
2018;22(1).
26. Ablordeppey EA, Drewry AM, Theodoro DL, et al. Current practices in central venous catheter position confirmation by point of care ultrasound: a survey of early adopters. Shock . May 2019;51(5):613-8.
27. Tran QK, Foster M, Bowler J, et al. Emergency and critical care providers’ perception about the use of bedside ultrasound for confirmation of above-diaphragm central venous catheter placement. Heliyon. 2020;6(1):e03113.
28. Husereau D, Drummond M, Petrou S, et al. Consolidated health economic evaluation reporting standards (CHEERS) statement. Cost Effectiveness and Resource Allocation. 2013;11(1):6.
29. Meggiolaro M, Scatto A, Zorzi A, et al. Confirmation of correct central venous catheter position in the preoperative setting by echocardiographic “bubble-test.” Minerva Anestesiol. Sep 2015;81(9):989-1000.
30. Raman D, Sharma M, Moghekar A, et al. Utilization of thoracic ultrasound for confirmation of central venous catheter placement and exclusion of pneumothorax: a novel technique in real-time application. J Intensive Care Med. 2019;34(7):594-8.
31. Baviskar AS, Khatib KI, Bhoi S, et al. Confirmation of endovenous placement of central catheter using the ultrasonographic “bubble test”. Indian J Crit Care Med. 2015;19(1):38-41.
32. Weekes AJ, Johnson DA, Keller SM, et al. Central vascular catheter placement evaluation using saline flush and bedside echocardiography. Acad Emerg Med. Jan 2014;21(1):65-72.
33. Lichtenstein DA, Menu Y. A bedside ultrasound sign ruling out pneumothorax in the critically ill. Lung sliding. Chest 1995;108(5):1345-8.
34. Xirouchaki N, Magkanas E, Vaporidi K, et al. Lung ultrasound in critically ill patients: comparison with bedside chest radiography. Intensive Care Med. 2011;37(9):1488.
35. Volpicelli G. Sonographic diagnosis of pneumothorax. Intensive Care Med. 2011;37(2):224-32.
36. Colleges AoAM. AAMC Faculty Salary Report. 2019. Available at: https://www.aamc.org/data-reports/workforce/report/aamc-facultysalary-report. Accessed August 9, 2022.
37. Staiger DO, Auerbach DI, Buerhaus PI. Trends in the work hours of physicians in the United States. JAMA. 2010;303(8):747-53.
38. Ly DP, Seabury SA, Jena AB. Hours worked among US dual physician couples with children, 2000 to 2015. JAMA Intern Med 2017;177(10):1524-5.
39. Colleges AoAM. Physician Work Hours. 2020. Available at: https:// www.aamc.org/cim/explore-options/specialty-profiles. Accessed August 9, 2022.
40. Statistics USBoL, Statistics OE, Wages OEa. Bureau of Labor Statistics for registered nurses. Available at: https://data.bls.gov/cgibin/print.pl/oes/current/oes291141.htm. Accessed August 9, 2022
41. Statistics USBoL, Statistics OE, Wages OEa. Bureau of Labor Statistics of radiology technicians. Available at: https://data.bls.gov/ cgi-bin/print.pl/oes/current/oes292034.htm. Accessed August 9, 2022
42. Ablordeppey EA, Drewry AM, Anderson AL, et al. Point-of-care
Articles in Press 767 Western Journal of Emergency Medicine Ablordeppey et al. Economic Evaluation of Ultrasound-guided CVC Confirmation vs CXR
ultrasound-guided central venous catheter confirmation in ultrasound nonexperts. AEM Educ Train. 2020;5(3):e10530.
43. Ablordeppey E, Willman M, Ruble L, et al. 1027: Central venous catheter insertion: updates on mechanical complications. Critical Care Med. 2019;47(1):491.
44. Morgan DJ, Brownlee S, Leppin AL, et al. Setting a research agenda for medical overuse. Br Med J. 2015;351.
45. Woodland DC, Randall Cooper C, Farzan Rashid M, et al. Routine chest X-ray is unnecessary after ultrasound-guided central venous line placement in the operating room. J Crit Care. 2018;46:13-6.
46. Hirshberg E, Kuttler K, Lanspa M, et al. D22 Quality improvement: admission to discharge: ultrasound confirmation of central venous catheter placement could reduce hospital costs. Am J Resp Critical Care Med. 2014;189:1.
47. Ablordeppey E, Doctor R, Wakefield B, et al. 1320: Is it really a malposition? The central venous catheter tip position controversy continues. Critical Care Med. 2020;48(1):637.
48. Hirshberg EL, Kuttler K, Lanspa MJ, et al. Ultrasound Confirmation Of Central Venous Catheter Placement Could Reduce Hospital Costs. Am J Resp Critical Care Med. 2014;189:1.
49. Hubble MW, Tyson C. Impact of Early vasopressor administration on neurological outcomes after prolonged out-of-hospital cardiac arrest. Prehosp Disaster Med. 2017;32(3):297-304.
50. Beck V, Chateau D, Bryson GL, et al. Timing of vasopressor
initiation and mortality in septic shock: a cohort study. Critical Care 2014;18(3):R97.
51. Marik PE, Farkas JD. The changing paradigm of xepsis. Critical Care Med. 2018;46(10):1690-2.
52. Niu Y, Xian J, Lei Z, et al. Management of infection control and radiological protection in diagnostic radiology examination of COVID-19 cases. Radiat Med Prot. 2020;1(02):75-80.
53. Ilyas F, Burbridge B, Babyn P. Health care–associated infections and the radiology department. J Med Imaging Radiat Sci 2019;50(4):596-606. e1.
54. Raban MZ, Walter SR, Douglas HE, et al. Measuring the relationship between interruptions, multitasking and prescribing errors in an emergency department: a study protocol. BMJ Open 2015;5(10):e009076.
55. Skaugset LM, Farrell S, Carney M, et al. Can you multitask? Evidence and limitations of task switching and multitasking in emergency medicine. Ann Emerg Med. 2016;68(2):189-95.
56. Jones J, Wilkins M, Caird J, et al. An experimental study on the impact of clinical interruptions on simulated trainee performances of central venous catheterization. Adv Simul (Lond). 2017;2:5.
57. Calvert N, Hind D, McWilliams RG, et al. The effectiveness and cost-effectiveness of ultrasound locating devices for central venous access: a systematic review and economic evaluation. Health Technol Assess. 2003;7(12):1-84.
Western Journal of Emergency Medicine 768 Articles in Press Economic Evaluation of Ultrasound-guided CVC Confirmation vs CXR Ablordeppey et al.
Blood Pressure Variability and Outcome in Traumatic Brain Injury: A Propensity Score Matching Study
Quincy K. Tran, MD, PhD*
Hannah Frederick, BS† Cecilia Tran, BS*
Hammad Baqai† Tucker Lurie, MD†¶
Julianna Solomon, BS† Ayah Aligabi, BS†
Joshua Olexa, MD|| Stephanie Cardona, DO** Uttam Bodanapally, MD‡ Gary Schwartzbauer, MD, PhD‡|| Jessica Downing, MD
Section Editor: Pierre Borczuk, MD
University of Maryland School of Medicine, Baltimore, Maryland
University of Maryland School of Medicine, Research Associate Program in Emergency Medicine & Critical Care, Department of Emergency Medicine, Baltimore, Maryland
The R. Adams Cowley Shock Trauma Center, University of Maryland School of Medicine, Baltimore, Maryland
University of Maryland School of Medicine, Department of Emergency Medicine, Baltimore, Maryland
Wellspan York Hospital, Department of Emergency Medicine, York, Pennsylvania
University of Maryland School of Medicine, Department of Neurosurgery, Baltimore, Maryland Mount Sinai Hospital, Department of Critical Care Medicine, York, New York
The R. Adams Cowley Shock Trauma Center, University of Maryland School of Medicine, Baltimore, Program in Trauma/Surgical Critical Care, Baltimore, Maryland
Submission history: Submitted December 6, 2021; Revision received June 24, 2022; Accepted June 27, 2022
Electronically published August 19, 2022 Full text available through open access at http://escholarship.org/uc/uciem_westjem DOI: 10.5811/westjem.2022.6.55549
Introduction: Patients with tIPH (used here to refer to traumatic intraparenchymal hemorrhagic contusion) or intraparenchymal hemorrhage face high rates of mortality and persistent functional deficits. Prior studies have found an association between blood pressure variability (BPV) and neurologic outcomes in patients with spontaneous IPH. Our study investigated the association between BPV and discharge destination (a proxy for functional outcome) in patients with tIPH.
Methods: We retrospectively reviewed the charts of patients admitted to a Level I trauma center for ≥ 24 hours with tIPH. We examined variability in hourly BP measurements over the first 24 hours of hospitalization. Our outcome of interest was discharge destination (home vs facility). We performed 1:1 propensity score matching and multivariate regressions to identify demographic and clinical factors predictive of discharge home.
Results: We included 354 patients; 91 were discharged home and 263 to a location other than home. The mean age was 56 (SD 21), 260 (73%) were male, 22 (6%) were on anticoagulation, and 54 (15%) on antiplatelet therapy. Our propensity-matched cohorts included 76 patients who were discharged home and 76 who were discharged to a location other than home. One measure of BPV (successive variation in systolic BP) was identified as an independent predictor of discharge location in our propensity-matched cohorts (odds ratio 0.89, 95% confidence interval 0.8-0.98; P = 0.02). Our model demonstrated good goodness of fit (P-value for Hosmer-Lemeshow test = 0.88) and very good discriminatory capability (AUROC = 0.81). High Glasgow Coma Scale score at 24 hours and treatment with fresh frozen plasma were also associated with discharge home.
Conclusion: Our study suggests that increased BPV is associated with lower rates of discharge home after initial hospitalization among patients with tIPH. Additional research is needed to evaluate the impact of BP control on patient outcomes. [West J Emerg Med. 2022;23(5)769–780.]
Volume 23, no. 5: September 2022 769 Western Journal of Emergency Medicine Original Research
†‡§
††
* † ‡ § ¶ || ** ††
INTRODUCTION
Traumatic brain injury (TBI) is the leading cause of disability and neurologic impairment among trauma survivors in the United States.1 Several prior studies have demonstrated that patients who experienced even mild TBI face persistent neurologic symptoms, functional limitations, and decreased quality of life for years after the injury, while those with more severe TBI—including tIPH (which we use here to refer to traumatic intraparenchymal hemorrhage or hemorrhagic contusion)—have higher mortality rates as well.2-5 Moreover, despite a decrease in the incidence of TBI, improved survival rates have resulted in an increasing population of TBI survivors with persistent neurologic sequelae.6 Much of the existing literature highlights the role of social, demographic, or injury-specific factors in determining outcomes associated with TBI: older age at the time of injury; the presence of preexisting medical and psychiatric comorbidities, low initial Glasgow Coma Scale (GCS) score; and initial injury severity have all been associated with increased mortality and poorer functional outcomes.7-13 Although each of these factors can serve as important markers of risk, as well as epidemiological and public health tools, none is directly impacted by initial treatment in the inpatient setting. There is limited evidence regarding the impact of initial resuscitation interventions and goals on outcomes among TBI patients.
The treatment of patients with tIPH is primarily supportive, focusing on the prevention of “secondary injury” caused by hypotension, intracranial hypertension, and hypoxia.14 Prior studies have demonstrated an association between blood pressure variability (BPV) and poor outcomes among patients with spontaneous IPH (sIPH), who face similarly high rates of morbidity and mortality after the initial insult as patients with tIPH.15-17 In the first hour after TBI, patients are thought to experience impaired cerebral autoregulation, which limits their ability to maintain cerebral blood flow in the face of BPV and has been associated with poor neurologic outcomes.15 Although prior studies have suggested that systolic hypotension is associated with worse neurologic outcomes among patients with TBI, 16-19 there is no current literature investigating the impact of BPV on neurologic outcomes in this population.
The term BPV refers to the magnitude of change in blood pressure over a defined period of time. There are three main forms of BPV: 1) successive variation in systolic BP (SBPSV); 2) SD in SBP (SBPSD); and 3) coefficient variation in SBP (SBPCV). Each of these three measurements examine the change in blood pressure in a slightly different way. The SBPSV is the average absolute difference between successive BP measurements and represents the “steepness” of change between sequential measurements of SBP.20-23 The SBPSD and SBPCV measure variation of BPV over time and capture how tightly the BP is controlled.21-23 Blood pressure variability can be calculated using either SBP, diastolic BP, or mean arterial pressure (MAP); here we have focused on SBP, as blood pressure targets for patients with traumatic brain injury and intracranial hemorrhage at our institution focus on SBP.
Population Health Research Capsule
What do we already know about this issue?
Blood pressure variability has been associated with worse outcomes in spontaneous intracranial hemorrhage and stroke; its impact in traumatic brain injury (TBI) is unknown.
What was the research question?
Does blood pressure variability impact discharge destination for patients with TBI?
What was the major finding of the study?
For patients with traumatic brain injury, blood pressure variability is associated with lower rates of discharge home (OR = 0.89) compared to matched controls.
How does this improve population health?
This suggests that clinicians may be able to improve functional outcomes in TBI by reducing blood pressure variability.
In this study, we used propensity score matching to investigate the association between systolic BPV within the first 24 hours of admission with discharge destination (used in part as a proxy for functional outcome at hospital discharge) among patients admitted to a Level I trauma center with tIPH. While this investigation did not examine the degree to which the impact of BPV on neurologic outcomes is modifiable (or even BPV itself), our aim was to identify risk factors with the potential to be clinically modifiable to inform future research on initial care for TBI patients.
METHODS
Study Design and Patient Selection
This was a retrospective study of adult patients (age ≥18 years) who sustained isolated TBI with tIPH on computed tomography (CT) and were admitted to our institution for at least 24 hours between January 1, 2018–December 31, 2019. We included patients admitted to intensive care units (ICU), as well as those admitted to intermediate care or “step-down” units. We excluded patients who had only one CT during their hospitalization, as we were interested in the association between hematoma progression (here referring to volume expansion) and functional outcomes at discharge. We excluded patients with traumatic extraparenchymal (epidural, subdural, or subarachnoid) intracranial hemorrhage because the management for these conditions, when severe, is often surgical and thus less reliant on supportive measures. We did not exclude patients who underwent surgical management (namely, external ventricular drain
Western Journal of Emergency Medicine 770 Volume 23, no. 5: September 2022 BP Variability and Outcome in TBI: A Propensity Score Matching Study Tran et al.
placement or craniectomy) for intracranial hypertension as the result of tIPH. We also excluded patients with other concomitant traumatic injuries or with incomplete records. Our study was approved by our institutional review board (HP-00089624).
Study Setting
This study was conducted at an academic Level I regional trauma center in Maryland. Most patients admitted at our institution are transported directly from the field, although we also accept transfers from several regional non-trauma centers. Upon arrival, patients are immediately evaluated by the trauma and neurosurgical teams. Patients with intracranial injury identified on initial CT are typically monitored with a repeat CT within 24 hours of admission; those without cognitive impairment or significant change in tIPH on repeat CT are often discharged home within 24 hours of admission, while those with cognitive impairment or worsening tIPH are admitted.
Independent Variables
We obtained demographic and clinical data for each patient from our institution’s electronic health records. Data included age, gender, treatment with anticoagulation (AC) or antiplatelet therapy, past medical history, mechanism of injury, GCS score, initial laboratory values, and all recorded SBPs within 24 hours of admission to our institution. Our institution requires that BP be documented for all patients admitted for TBI at least once per hour for the first 24 hours of admission. This protocol begins in our trauma bay at the time that any intracranial hemorrhage is identified and is continued in the ICU or an intermediate care unit. Using these values, we calculated SBPSV, SBPSD, and SBPCV. We also identified the lowest SBP and the highest SBP during the first 24 hours of admission.
We collected data regarding patient’s mode of arrival to our trauma center, classified as “direct admission,” defined presentation to our trauma center directly from the field via emergency medical services, or “transfer” from an outside hospital or ED. We included data regarding medical interventions provided during the first 24 hours of hospital admission, including the placement of arterial lines and administration of vasopressors or antihypertensive medications, as well as hematoma and contusion volumes, which were calculated using the ABC/2 method.24 The placement of arterial lines was left to the discretion of the treating physicians; it is our typical practice to place arterial lines in patients with head injury who require titration of medications to maintain their blood pressure within a target range (typically, MAP >65 and SBP <180). Those who maintain their SBP within target without intervention are often not given arterial lines. We used a standardized Excel spreadsheet (Microsoft Corporation, Redmond, WA) to record data.
Outcomes
Our primary outcome of interest was discharge destination. For the majority of our analysis, this was dichotomized as
“discharged home” or “not discharged home.” Prior studies have demonstrated a correlation between discharge home from acute hospitalization and better long-term neurologic outcomes.7,8,25 At our institution, TBI patients participate in a rigorous multidisciplinary evaluation process to determine discharge disposition; this process begins shortly after hospital admission. All patients with TBI who were admitted for longer than 24 hours are evaluated by specialists in physical therapy (PT), occupational therapy (OT) and, often, speech and language pathology. Based on these specialists’ assessments, patients might be discharged home with or without services (such as PT therapy or nursing), to an acute or subacute rehabilitation center, or to a skilled nursing facility. Discharge recommendations are primarily determined by mobility level, ability to perform activities of daily living (ADL), cognitive ability, and home environment and available assistance.
Cognition is assessed using the Rancho Los Amigos Scale (RLAS) and is often the key driver of discharge recommendations among patients with TBI. The RLAS is a widely accepted tool used specifically in the assessment of patients with TBI. It characterizes patients’ level of awareness, response to and interaction with the environment (including clinicians), and emotional response and regulation, and independence. It has previously been shown to have utility in both characterizing initial injury and predicting rehabilitation needs and outcomes.26,27 Typically, RLAS scores of 1-3 are considered to reflect coma emergence at the time of discharge planning, and often result in a recommendation of discharge to subacute rehabilitation. Scores of 4-6 indicate a clinical state characterized by confusion and inappropriate behavior, often recommended for discharge to acute TBI rehabilitation. An RLAS score >7 indicates purposeful interaction and appropriate behavior; these patients can often be discharged home. If a patient with baseline impairment (RLAS <7) is determined to be at their neurologic baseline, they will often be discharged home (or back to their prior facility) regardless of RLAS score, if a safe home setup has been confirmed.
The Activity Measure for Postacute Care (AM-PAC) “6-Clicks” Basic Mobility and Daily Activity score—which measure basic mobility, applied cognition, and independence in daily activity, and has been previously validated as a predictor of discharge destination for a variety of disease states—is also integrated into final discharge recommendations, primarily for patients with higher RLAS scores who may be appropriate for discharge home.28 The AM-PAC “6-Clicks” scores are calculated at each PT and OT session and used to monitor progress and guide discharge planning.
Patients discharged shortly after 24 hours of observation receive the same evaluation by PT and OT and are generally determined to have no or only mild deficits or to be at their neurologic baseline, and appropriate for discharge home or to the same facility from where they originally presented. Patients are only eligible for discharge at or shortly after 24 hours if CT imaging remains stable and no intravenous or as
Volume 23, no. 5: September 2022 771 Western Journal of Emergency Medicine Tran et al. BP Variability and Outcome in TBI: A Propensity Score Matching Study
needed medications are required for pain, behavior, or blood pressure control.
Data Collection and Management
All research team members were trained in data collection by the principal investigator and senior investigators. Researchers began by collecting data from patient charts in sets of 10; their data was then compared to those collected by a senior investigator until an interrater agreement of at least 90% was achieved. A senior investigator subsequently checked 10% of each researcher’s data randomly to ensure persistent agreement. Researchers collected data in segments to reduce bias; for example, a researcher collecting BP measurements would not have access to discharge disposition, and vice versa.
Sample Size Calculation
Given the lack of prior studies regarding BPV in patients with tIPH, we based our sample size calculation on a previous study by Tuteja et al that compared BPV among patients with sIPH.29 Tuteja et al demonstrated a difference of 12 millimeters of mercury (mm Hg) (SD 20 mm Hg) in SBPSV between survivors and non-survivors. Based on this finding, we estimated a sample size of at least 90 patients (45 in each group) would be required to detect the same effect size with a power of 80% and α = 0.05. Given the difference in pathology between our patient population and that investigated by Tuteja et al, we aimed to collect data from as many patients as possible during our study period to improve the accuracy of our analysis.
Data Analysis
We presented our patients’ data using descriptive analyses with mean (±SD) or median (interquartile range), as appropriate according to the distribution of the data. We analyzed continuous data using the t test or the MannWhitney U test, as appropriate, and categorical data via the chi-square or Fisher’s exact test as indicated. We constructed logistic regression models to identify patients with similar demographic and clinical backgrounds and calculate each patient’s propensity score for the outcome of discharge home. We performed 1:1 propensity score matching without replacement and used a stricter caliper width of 0.1, instead of the recommended width of 0.2,30 for the logistic regression for propensity score matching for discharge home. We selected a priori the following patient characteristics to construct the logistic regression for propensity score:
•
•
•
•
•
• External ventricular or craniectomy during hospitalization.
We subsequently used stepwise multivariable logistic regressions to identify associations between demographic and clinical factors and outcomes among patients in the unmatched and matched groups. The independent variables were selected prior to statistical analysis and are reported in Appendix 1. Independent variables identified as significant by our stepwise multivariable logistic regressions were reported as odds ratio (OR), with 95% confidence interval (CI) when available. We assessed the goodness of fit of our regressions via the Hosmer-Lemeshow test, with P-value ≥0.05 indicating good fit for the independent variables. We also assessed the collinearity of our independent variables using the variance inflation factor (VIF). Any factors with VIF >5 were considered to have collinearity and were removed from the regression models. We further assessed the discriminatory capability of our regressions using the area under the receiver operating characteristic curve (AUROC), with a regression model having AUROC of 1 suggesting perfect discriminatory capability and AUROC of 5 suggesting poor discriminatory capability between the dichotomous outcomes.
Ordinal logistic regression was also performed to assess associations of demographic and clinical factors with discharge destination. We used the same independent variables as listed in Appendix 1. We reported the results of the ordinal regression with the coefficients, 95% CI, and the Somers’ delta and Goodman-Kruskal gamma tests for goodness of fit. For ordinal regressions, discharge destinations were classified as 0 (home), 1 (acute rehabilitation), 2 (skilled nursing facility), and 3 (hospice or in-hospital death). Positive coefficients indicate that as the independent variable increases, lower ranked discharge destinations (such as discharge home) become more likely, while negative coefficients indicate that as the variable increases, higher ranked discharge destinations (such as skilled nursing facility or death) become more likely. Values for the Somers’ delta and Goodman-Kruskal gamma tests range between -1 and 1. Values approaching maximum indicates good predictive ability.
We used XLSTAT to perform our propensity score matching (https://www.xlstat.com/en/; Addinsoft, Paris, France). All other statistical analyses were performed with Minitab version 19 (Minitab LLC, State College, PA). All analyses with two-tailed P-value ≤ 0.05 were considered statistically significant.
RESULTS
We electronically identified 473 patients; a total of 354 patients (unmatched) were included in our logistic regression for propensity score matching (Figure 1). The mean age was 56 (SD 21), and 260 (73%) were male. Twenty-two patients (6%) were on AC therapy, and 54 (15%) on antiplatelet therapy. There were 234 patients (66%) who had contusions alone. Our propensity-matching analysis matched 76 patients who were discharged home with 76 patients who were discharged to a location other than home. In the unmatched cohorts, patients
Western Journal of Emergency Medicine 772 Volume 23, no. 5: September 2022 BP Variability and Outcome in TBI: A Propensity Score Matching Study Tran et al.
Age • GCS score at admission
Hematoma and/or contusion volume at admission
Active AC therapy at the time of injury
Type of hemorrhage
Intubation during hospitalization
drain
Figure 1. Patient selection diagram. CT, computed tomography; IPH, intraparenchymal contusion or hemorrhage.
who were discharged home were younger and less likely to be on AC or antiplatelet therapy (Table 1). They were less likely to have received hyperosmolar therapy, blood transfusion, or craniectomy, were less likely to have had an arterial line placed or to have been treated with vasopressors or antihypertensives, and were less likely to require ICU admission (Table 2). Patients who were discharged home had significantly lower BPV and higher
RLAS and AM-PAC “6-Clicks” scores (Table 3). There were no significant differences between the propensity-matched cohorts with respect to the demographic characteristics we examined (Table 1), interventions within 24 hours of admission, including administration of vasopressors or antihypertensive medications (Table 2). There was no difference with respect to 24-hour BPV (Table 3). Patients who were discharged home had higher median GCS scores at 24 hours and on hospital day 5 and higher AMPAC “6 Clicks” scores and RLAS scores (Table 3).
Primary Outcome: Discharge Destination Unmatched Cohorts
Stepwise multivariable logistic regression of the unmatched cohorts reported seven independent variables as significant for the regression (Table 4). SBPSV was considered important for the regression but did not show a statistically significant association with discharge home (OR 0.94, 95% CI 0.88-1.009; P = 0.09). No other components of BPV were identified as having an association with our primary outcome. This model showed good fit of the independent variables (P value for Hosmer-Lemeshow test = 0.84) and very good discriminatory capability (AUROC = 0.91). All factors had low variance inflation factor (VIF), demonstrating no collinearity.
Propensity-Matched Cohorts
We performed stepwise multivariable logistic regressions of the matched cohorts and identified six independent
Unmatched cohorts Propensity-matched cohorts
All patients (N = 354) Discharged home (n = 91) Not discharged home (n = 263) P Discharged home (n = 76) Not discharged home (n = 76) P
Demographics
Age, mean (SD) 56 (21) 47 (19) 58 (21) < 0.001 50 (19) 50 (20) 0.91
Male, n (%) 260 (73) 72 (79) 188 (71) 0.15 62 (82) 56 (74) 0.24
BMI, mean (SD) 26 (5) 25 (5) 26 (5) 0.50 25 (5) 25 (5) 0.91
Direct admission, n (%) 262 (74) 63 (69) 199 (76) 0.22 53 (70) 62 (82) 0.09
Transfer, n (%) 91 (26) 27 (30) 64 (24) 0.31 23 (30) 14 (18) 0.09
Past medical history, n (%)
Any AC therapy 22 (6) 1 (1) 21 (8) 0.019 1 (1) 2 (3) 0.56
Any antiplatelet therapy 54 (15) 7 (8) 47 (18) 0.02 7 (9) 10 (13) 0.44
Hypertension 135 (38) 30 (33) 105 (40) 0.23 29 (38) 25 (33) 0.49
Diabetes mellitus 45 (13) 7 (8) 38 (14) 0.10 7 (9) 10 (13) 0.44
Type of injury, n (%)
Hemorrhage only 93 (26) 14 (15) 79 (30) 0.01 15 (20) 13 (17) 0.67
Contusion only 234 (66) 73 (80) 161 (61) 0.001 58 (76) 59 (78) 0.84
Hemorrhage and contusion 27 (8) 4 (4) 23 (9) 0.18 3 (4) 4 (5) 0.69
Table 1. Characteristics of 354 patients with traumatic intraparenchymal contusion or hemorrhage by discharge location, matched and unmatched cohorts.
AC, anticoagulation; body mass index; international normalized ratio; range; motor vehicle collision.
Volume 23, no. 5: September 2022 773 Western Journal of Emergency Medicine Tran et al. BP Variability and Outcome in TBI: A Propensity Score Matching Study
BMI,
INR,
IQR, interquartile
MVC,
Table 1. Continued.
Unmatched cohorts Propensity-matched cohorts
All patients (N = 354) Discharged home (n = 91) Not discharged home (n = 263) P Discharged home (n = 76) Not discharged home (n = 76) P
Mechanism of injury, n (%)
Fall 200 (56) 52 (57) 148 (56) 0.89 46 (61) 36 (47) 0.10
MVC 91 (26) 17 (19) 74 (28) 0.09 16 (21) 25 (33) 0.10
Other blunt trauma 43 (12) 20 (22) 23 (9) 0.001 13 (17) 11 (14) 0.65
Any penetrating trauma 7 (2) 0 (0) 7 (3) 0.11 0 (0) 2 (3) 0.15
Unknown 13 (4) 2 (2) 11 (4) 0.38 1 (1) 2 (3) 0.56
Laboratory values at admission
Lactate, mmol/L, median (IQR) 2.5 (1.6-3.6) 2.2 (1.6-3.4) 2.6 (1.6-2.2) 0.23 2.3 (1.5-3.6) 2.3 (1.7-3.7) 0.59
INR, mean (SD) 1.1 (0.4) 1.0 (0.1) 1.2 (0.5) < 0.001 1.0 (0.2) 1.1 (0.2) 0.02 AC, anticoagulation; BMI, body mass index; INR, international normalized ratio; IQR, interquartile range; MVC, motor vehicle collision.
Table 2. Comparison of interventions provided in the first 24 hours of hospitalization by discharge location, matched and unmatched cohorts. Unmatched cohorts Propensity-matched cohorts
All patients (N = 354)
Discharged home (n = 91) Not discharged home (n = 263) P Discharged home (n = 76) Not discharged home (n = 76) P
Mechanical ventilation, n (%) 202 (57) 30 (33) 172 (65) < 0.001 33 (43) 33 (43) 0.99
IV crystalloids, n (%) 310 (88) 81 (89) 229 (87) 0.62 69 (91) 67 (88) 0.59
24-h crystalloid administration, mL, mean (SD) 1927 (1772) 1532 (1238) 2063 (1906) 0.003 1798 (1334) 1696 (1597) 0.67
Fluid balance at 24-h, mL, mean (SD) 1236 (2188) 864 (1880) 1365 (2274) 0.04 931 (1965) 1192 (1685) 0.38
Any AED, n (%) 86 (25) 19 (21) 67 (26) 0.34 13 (17) 16 (21) 0.53
Phenytoin, n (%) 73 (21) 16 (18) 57 (22) 0.40 11 (14) 14 (18) 0.51 Levetiracetam, n (%) 13 (4) 3 (3) 10 (4) 0.82 2 (3) 2 (3) 0.99
Any hyperosmolar agent, n (%)a 118 (33) 11 (12) 107 (41) < 0.001 13 (17) 11 (14) 0.65 3% saline, n (%) 108 (31) 11 (12) 97 (37) < 0.001 13 (17) 11 (14) 0.65 Mannitol, n (%) 10 (3) 0 (0) 10 (4) 0.06 0 (0) 1 (1) 0.99
Invasive BP monitoring, n (%) 151 (43) 15 (15) 136 (53) < 0.001 13 (17) 23 (30) 0.09
Any antiHTN medication, n (%) 121 (34) 20 (22) 101 (38) < 0.001 21 (26) 21 (27) 0.99
AntiHTN infusion, n (%) 60 (17) 4 (4) 56 (21) < 0.001 4 (5) 4 (5) 0.99
Any vasopressor, n (%) 113 (32) 17 (19) 96 (37) <0.001 16 (21) 21 (27) 0.45
57 (16) 4 (4) 53 (20) < 0.001 4 (5) 7 (9) 0.34
Any blood products, n (%)a 106 (30) 10 (11) 96 (37) < 0.001 10 (13) 15 (20) 0.27 pRBC, n (%)
FFP, n (%)
11 (3) 2 (2) 9 (3) 0.56 2 (3) 1 (1) 0.56 Platelets, n (%) 38 (11) 4 (4) 34 (13) 0.02 4 (5) 7 (9) 0.34
EVD, n (%) 80 (23) 3 (3) 77 (29) < 0.001 6 (8) 4 (5) 0.51
Opening pressure, cm H2O, mean (SD)
15 (8) 11 (8) 15 (8) 0.61 11 (5) 18 (9) 0.20
Craniectomy, n (%) 53 (15) 3 (3) 50 (19) < 0.001 5 (7) 5 (7) 0.99
ICU admission, n (%) 214 (60) 36 (40) 178 (68) < 0.001 31 (41) 43 (56) 0.07
aPatients could receive more than one product.
IV, intravenous; mL, milliliter; cm, centimeter; AED, antiepileptic drug; antiHTN, anti-hypertensive; BP, blood pressure; EVD, external ventricular drain; FFP, fresh frozen plasma; ICU, intensive care unit; IV, intravenous; pRBC, packed red blood cells.
Western Journal of Emergency Medicine 774 Volume 23, no. 5: September 2022 BP Variability and Outcome in TBI: A Propensity Score Matching Study Tran et al.
Table 3. Comparison of clinical characteristics by discharge location, matched and unmatched cohorts. Unmatched cohorts Propensity-matched cohorts
All patients (N = 354) Discharged home (n = 91) Not discharged home (n = 263) P Discharged home (n = 76) Not discharged home (n = 76) P
BPV
SBPmax, mean (SD) 178 (31) 165 (24) 182 (32) < 0.001 170 (24) 173 (27) 0.38
SBPmin, mean (SD) 91 (28) 100 (26) 89 (28) < 0.001 100 (26) 95 (29) 0.32
SBPmax−min, mean (SD) 87 (41) 66 (32) 94 (41) < 0.001 70 (31) 78 (40) 0.16
SBPSV, mean (SD) 14 (6) 11 (4) 15 (6) < 0.001 12 (4) 13 (6) 0.09
SBPSD, mean (SD) 17 (7) 13 (7) 18 (7) < 0.001 14 (7) 15 (7) 0.47
SBPCV, mean (SD) 16 (6) 13 (5) 17 (7) < 0.001 13 (5) 15 (7) 0.11
Hematoma/contusion volume
Initial (cm3), mean (SD) 0.5 (0.4) 1.3 (2.2) 9.1 (23) < 0.001 3 (4) 4 (11) 0.07
Progression, n (%) 160 (45) 40 (44) 120 (46) 0.78 35 (46) 31 (41) 0.51
GCS score, median (IQR)
At admission 13 (7-14) 14 (12-15) 11 (6-14) < 0.001 14 (10-15) 14 (10-14) 0.71
At 24 hours 11 (7-14) 15 (14-15) 10 (7-14) < 0.001 14 (13-15) 13 (10-15) < 0.001
Functional assessments, mean (SD)
RLAS 5.3 (1.8) 6.4 (1.5) 4.9 (1.7) < 0.001 6.4 (1.6) 5.7 (1.2) < 0.001
AM-PAC “6-Clicks” score 15 (6) 20 (4) 12 (5) < 0.001 20 (4) 15 (4) < 0.001 Discharge disposition, n (%)
Home 91 (26) 91 (100) NA NA 76 (100) NA NA
Acute rehabilitation 167 (47) NA 167 (63) NA NA 53 (70) NA
Skilled nursing home 34 (10) NA 34 (13) NA NA 14 (18) NA Hospice/death 52 (15) NA 52 (20) NA NA 6 (8) NA
Other 10 (3) NA 10 (4) NA NA 3 (4) NA AM-PAC, Activity Measure for Postacute Care; BPV, blood pressure variability; GCS, Glasgow Coma Scale; IQR, interquartile range; NA, not applicable; RLAS, Rancho Los Amigos Scale; SBPCV, coefficient variation in systolic blood pressure; SBPSD, SD in systolic blood pressure; SBPSV, successive variation in systolic blood pressure; SBPmax, maximum systolic blood pressure; SBPmin, mini mum systolic blood pressure.
variables as important (Table 4). SBPSV (OR 0.89, 95% CI 0.8-0.98, P = 0.02) was significantly associated with discharge home. A SBPSV of 10 mm Hg over the first 24 hours of hospitalization was associated with a 37% likelihood of discharge home, while a SBPSV of 20 mm Hg over the same timeframe was associated with an 11% likelihood of discharge home (Figure 2). There was goodness of fit of the independent variables (P value for Hosmer-Lemeshow test = 0.88) and very good discriminatory capability (AUROC = 0.81). The included variables did not show collinearity; all had low VIF. In addition, high GCS score at 24 hours (OR 1.5, 95% CI 1.2-1.9; P = 0.001) was associated with higher likelihood of discharge home.
Our ordinal logistic regressions identified six variables significantly associated with discharge destination (Table 5). Among the matched cohorts, higher SBPSV was associated with lower likelihood of discharge to destinations requiring higher levels of independence, such as home or acute rehabilitation
(OR 0.90, 95% CI 0.82, 0.99; P = 0.05). No other measures of BPV were significantly associated with discharge location.
DISCUSSION
Our study identified few independent factors that were associated with discharge home (a proxy for good functional outcome at hospital discharge) among patients who sustained isolated TBI with IPH. Of the independent variables, one component of BPV, the SBPSV, was significantly associated with likelihood of discharge home among the propensitymatched cohorts.
Blood pressure has previously been considered an important predictor of outcomes among patients with neurologic injury. Traditionally, researchers have focused on absolute blood pressure values. Rasmussen et al, for example, demonstrated an association between both hypertension (MAP >90 mm Hg) and hypotension (MAP <70 mm Hg) and poor neurologic outcomes among patients with ischemic strokes treated with endovascular
Volume 23, no. 5: September 2022 775 Western Journal of Emergency Medicine Tran et al. BP Variability and Outcome in TBI: A Propensity Score Matching Study
BP Variability and Outcome in TBI: A Propensity Score Matching Study
Table 4. Results of stepwise multivariable logistic regressions to measure associations between patient characteristics, clinical course, and discharge location, matched and unmatched cohorts.
Unmatched cohortsb Propensity-matched cohortsc
Variablea OR 95% CI P VIF OR 95% CI P VIF
Age 0.95 0.93-0.97 0.001 1.5 NS NS NS NS
SBPSV 0.94 0.88-1.009 0.09 1.1 0.89 0.8-0.98 0.02 1.7
Hematoma/contusion volume at admission 0.90 0.83-0.98 0.03 1.1 0.92 0.8-1.01 0.11 1.2
INR at admission NS NS NS NS 0.03 0.001-0.6 0.02 1.6
Direct admission 0.29 0.13-0.69 0.005 1.4 0.14 0.05-0.39 0.001 1.4
GCS score at 24 hours 1.5 1.3-1.8 0.001 1.2 1.5 1.2-1.9 0.001 2.7
FFP transfusion NS NS NS NS 52 3.7-50+ 0.003 2.0
Mechanism of injury: MVC 0.33 0.13-0.82 0.02 1.3 NS NS NS NS EVD 0.23 0.06-0.93 0.04 1.1 NS NS NS NS
aOnly variables considered significant for the regression were reported.
bHosmer-Lemeshow test: degrees of freedom 8, chi-square 4, P = 0.84; AUROC = 0.91. cHosmer-Lemeshow test: degrees of freedom 8, chi-square 4, P = 0.88; AUROC = 0.81. AUROC, area under the receiver operating characteristic curve; EVD, external ventricular drain; FFP, fresh frozen plasma; GCS, Glasgow Coma Scale; INR, international normalized ratio; MVC, motor vehicle collision; EVD, external ventricular drain; NS, not significant; OR, odds ratio; SBPSV, successive variation in systolic blood pressure; VIF, variance inflation factor.
therapy.31 Brenner et al found that even mild hypotension (SBP <120 mm Hg) was associated with poor neurologic outcomes in patients with severe TBI.32 Systolic hypertension has similarly been associated with both hematoma growth and poor outcomes in patients with sIPH,33 for whom early control of SBP has been recommended as a mainstay of supportive care.34 Blood pressure variability has been shown to have important impacts on the neurologic outcomes of patients with both ischemic strokes and sIPH.20,22,23,33,35-37 To our knowledge, ours is the first investigation into the impact of BPV specifically among patients with tIPH. Our findings overlap with those previously demonstrated among patients with spontaneous (most often hypertensive) hemorrhage. Tanaka et al conducted a multicenter prospective observational study to investigate the impact of systolic BPV during the initial 24 hours after intracranial hemorrhage.22 All included patients with SBP > 160 mm Hg received intravenous nicardipine during this period. We found that both increased SBPSD and SBPSV were associated with neurologic deterioration (defined as a decrease in GCS score of 2 or more points or an increase in National Institutes of Health Stroke Scale38 by 4 or more points), as well as that increased SBPSV was associated with unfavorable neurologic outcomes at three months. Chung et al reported a similar association of BPV (including the three key components studied here: SBPSV, SBPSD, and SBPCV) with poor neurologic outcome at three months in both of what they describe as the hyperacute (0 to 4-6 hours) and acute (0 to 24-26 hours) stages among 386 patients with intracerebral hemorrhage.23
Our results vary from those reported in these studies in that, in our study SBPSV was the only BPV component associated with neurologic outcomes. While SBPSD and SBPCV reflect BPV over the entire reported time period, SBPSV is related to the sequence of BP measurements and thus more precisely
reflects variation between measurements. In this study, SBPSV provides a measurement of variability on an hourly basis. Our findings suggest that steeper “swings” in SBP may be more important than overall variation in patients with tIPH, whereas both types of variability are relevant for patients with sIPH. This difference may be reflective of the etiology of the initial injury, as hypertension is one of the most common risk factors for sIPH.39 Preexisting cardiovascular disease may predispose patients with sIPH to increased sensitivity to even slow changes in BP relative to those with TBI.
In addition, we used a different endpoint to reflect neurologic status than the majority of prior investigations into BP and BPV in neurologic insult, which primarily rely on the modified Rankin scale,38 Glasgow Outcome Scale,41 or Glasgow Outcome Scale-Extended42 several months after the insult.
Each of these measures provides insight into patients’ level of functioning and disability, particularly with respect to ADL. Several components of post-TBI care—most notably PT, OT, and cognitive therapy—have important impacts on patients’ ultimate neurologic recovery and functional status.
By focusing on discharge destination, we hoped to highlight an outcome that is 1) more directly related to inhospital care, particularly in the early stages of the patient’s injury; 2) reflective of the patient’s functional status and recovery trajectory; and 3) in itself meaningful to both patients and the healthcare system, where discharge planning has taken on additional importance due to increased concerns over hospital-acquired infections and other complications, as well as length of stay and inpatient reimbursement. Because discharge destination is largely driven by in-depth assessments by rehabilitation specialists using a variety of validated scoring tools as well as individualized assessment
Western Journal of Emergency Medicine 776 Volume 23, no. 5: September 2022
Tran et al.
Figure 2. Probit and logit analysis demonstrating the probability of discharge home according to SBPSV (mm Hg). SBPSV, successive variation in systolic blood pressure.
risk factor with the potential to be directly impacted by medical care. This is true in both traumatic and spontaneous injuries, including those examined in our unmatched analysis. Prior studies have demonstrated that close control of hypertension and BPV using intravenous agents such as nicardipine may improve outcomes among patients with sIPH. Our results support a similar association among patients with tIPH, although further research is needed to specifically investigate the role and impact of BP control, rather than BPV alone, among patients with tIPH. Our findings further suggest that management of tIPH should emphasize slow and steady control that avoids rapid swings in BP.22,23
of each patient’s status and capabilities, we expect it adequately meets these requirements. Prior studies have demonstrated that demographic, social, and nonmodifiable clinical factors (such as injury severity) play an important role in discharge destination.9-11,43-46 To our knowledge, this is the first paper to identify a potentially modifiable risk factor for discharge destination.
Implications for Future Research
Unlike many predictors of neurologic outcomes among patients with neurologic injury, BPV is a possibly modifiable
It may be the case that greater BPV reflects the severity of the underlying injury as well as contributes to poorer outcomes. A prior study demonstrated that dynamic cerebral autoregulation—the mechanism by which cerebral blood flow is quickly restored in response to rapid changes in perfusion pressure—may be impaired in brain tissue affected by large infarcts.43 Intracerebral hemorrhage has also been associated with decreased “baroreflex sensitivity,” resulting in greater BPV in patients experiencing intracerebral hemorrhage when compared to healthy controls; this decreased baroreflex sensitivity has been associated with increased likelihood of hematoma expansion and poor neurologic outcomes.44 Although evidence to date suggests that increased BPV impacts outcomes, BPV may itself reflect impairment in cerebral autoregulation due to more severe initial injury. Further studies are needed to examine the degree to which BPV, and its impact on neurologic outcomes, are truly modifiable.
LIMITATIONS
In the setting of critical illness or injury, hemodynamics often change rapidly. Our results highlight the importance of the speed of this change, as well as its magnitude, for neurologic outcomes in patients with TBI. However, we
Table 5. Results of ordinal logistic regression to measure the association between patients’ characteristics, clinical course, and their hospital disposition. The hospital dispositions were ranked from 0 (Discharged home directly), 1 (Acute Rehabilitation), 2 (Skilled Nursing Home), 3 (Hospice or Dead). Only significant factors were reported here, in increasing order of unmatched variables’ coefficients. Unmatched cohorts1
Propensity-matched cohorts2
Variables Coefficient OR 95% CI P Coefficient OR 95% CI P
INR at admission -1.07 0.34 0.12, 0.97 0.04 -2.7 0.07 0.01, 0.76 0.03
EVD -0.83 0.44 0.23, 0.82 <0.001 -1.7 0.18 0.04, 0.77 0.02
Platelet transfusion -0.77 0.46 0.24, 0.91 0.03 -1.3 0.27 0.07, 0.99 0.05
Any craniectomy -0.74 0.48 0.24, 0.94 0.03 NS NS NS NS
Hematoma/contusion volume at admission -0.02 0.97 0.96, 0.99 <0.001 -0.04 0.96 0.92, 0.999 0.04
SBPsv NS NS NS NS -0.10 0.90 0.82, 0.999 0.05
1Somer’s delta = 0.64; Goodman-Kruskal gamma = 0.64. 2Somer’s delta = 0.50; Goodman-Kruskal gamma = 0.50. OR, odds ratio; CI, confidence interval; INR, international normalized ratio; EVD, external ventricular drain; SBPsv, successive variation in systolic blood pressure.
Volume 23, no. 5: September 2022 777 Western Journal of Emergency Medicine Tran et al. BP Variability and Outcome in TBI: A Propensity Score Matching Study
were able to analyze only BPs recorded in patients’ medical records, which often occurred on an hourly basis. Although we captured all BP measurements recorded within 24 hours of patient arrival, these values may not fully or accurately represent patients’ hemodynamic status. Similarly, although we have presented data regarding the use of vasopressors and antihypertensive medications, we were unable to reliably determine when these medications were started relative to the BP measurements we analyzed, and thus the impact these medications had on BP variability. Finally, although we attempted to minimize biases in our study, some forms of bias, likely due to the selection of independent variables, may have existed. As a result, we observed that SBPSV was statistically significant in the matched cohorts, but not in the unmatched cohorts, where we expect the relatively small effect size of each mm Hg was likely masked by those of other variables.
CONCLUSION
Our study suggests that increased blood pressure variability, and specifically successive variation in systolic blood pressure, is associated with lower rates of discharge home after initial hospitalization among patients with traumatic intraparenchymal hemorrhage or hemorrhagic contusion. Age and hematoma/contusion volume at admission were also associated with lower rates of discharge home among the unmatched cohorts. Further research is needed to investigate the impact of medical control of BP on discharge destination and neurologic outcomes.
ACKNOWLEDGMENTS
The authors would like to thank Eileen Connor, Maura Pannebecker, and Alexandra Hunt for their detailed descriptions of the nuances of the disposition assessment process at our institution. Deborah M. Stein, ELS, provided language editing of the manuscript.
REFERENCES
1. Centers for Disease Control and Prevention (2021). Surveillance Report of Traumatic Brain Injury-related Hospitalizations and Deaths by Age Group, Sex, and Mechanism of Injury—United States, 2016 and 2017. Available at: https://www.cdc.gov/ traumaticbraininjury/pdf/TBI-surveillance-report-2016-2017-508. pdf. Accessed September 27, 2021
2. Nelson LD, Temkin NR, Dikmen S, et al. Recovery after mild traumatic brain injury in patients presenting to US Level I trauma centers: a Transforming Research and Clinical Knowledge in Traumatic Brain Injury (TRACK-TBI) study. JAMA Neurol 2019;76(9):1049.
3. Ruet A, Bayen E, Jourdan C, et al. A detailed overview of longterm outcomes in severe traumatic brain injury eight years postinjury. Front Neurol . 2019;10:120.
4. Whiteneck GG, Eagye CB, Cuthbert JP, et al. One and five year outcomes after moderate-to-severe traumatic brain injury requiring inpatient rehabilitation: traumatic brain injury report. Available at: https://www.cdc.gov/traumaticbraininjury/pdf/CDC-NIDILRR-SelfReport-508.pdf. Accessed November 15, 2021.
5. Jacobsson LJ, Westerberg M, Lexell J. Health-related quality-oflife and life satisfaction 6-15 years after traumatic brain injuries in northern Sweden. Brain Inj . 2010;24(9):1075-86.
6. Carnevale JA, Segar DJ, Powers AY, et al. Blossoming contusions: identifying factors contributing to the expansion of traumatic intracerebral hemorrhage. J Neurosurg . 2018;129(5):1305-16.
7. Colantonio A, Escobar MD, Chipman M, et al. Predictors of postacute mortality following traumatic brain injury in a seriously injured population. J Trauma . 2008;64(4):876-82.
8. Peck KA, Calvo RY, Sise CB, et al. Death after discharge: predictors of mortality in older brain-injured patients. J Trauma Acute Care Surg . 2014;77(6):978-83.
9. Coronado VG, Thomas KE, Sattin RW, et al. The CDC traumatic brain injury surveillance system: characteristics of persons aged 65 years and older hospitalized with a TBI. J Head Trauma Rehabil . 2005;20(3):215-28.
Address for Correspondence: Jessica Downing, MD, The R. Adams Cowley Shock Trauma Center, University of Maryland School of Medicine, Program in Trauma/Surgical Critical Care, 22 S Greene Streeet, Baltimore, MD. Email: Jessica.downing@umm.edu.
Conflicts of Interest: By the WestJEM article submission agreement, all authors are required to disclose all affiliations, funding sources and financial or management relationships that could be perceived as potential sources of bias. No author has professional or financial relationships with any companies that are relevant to this study. There are no conflicts of interest or sources of funding to declare.
Copyright: © 2022 Tran et al. This is an open access article distributed in accordance with the terms of the Creative Commons Attribution (CC BY 4.0) License. See: http://creativecommons.org/ licenses/by/4.0/
10. Cuthbert JP, Corrigan JD, Harrison-Felix C, et al. Factors that predict acute hospitalization discharge disposition for adults with moderate to severe traumatic brain injury. Arch Phys Med Rehabil 2011;92(5):721-30.e3.
11. Wagner AK, Hammond FM, Grigsby JH, et al. The value of trauma scores: predicting discharge after traumatic brain injury. Am J Phys Med Rehabil . 2000;79(3):235-42.
12. Zarshenas S, Colantonio A, Alavinia SM, et al. Predictors of discharge destination from acute care in patients with traumatic brain injury: a systematic review. J Head Trauma Rehabil. 2019;34(1):52-64.
13. Chang EF, Meeker M, Holland MC. Acute traumatic intraparenchymal hemorrhage: risk factors for progression in the early post-injury period. Neurosurgery . 2006;58(4):647-56.
14. Galgano M, Toshkezi G, Qiu X, et al. Traumatic brain injury: current treatment strategies and future endeavors. Cell Transplant 2017;26(7):1118-30.
Western Journal of Emergency Medicine 778 Volume 23, no. 5: September 2022 BP Variability and Outcome in TBI: A Propensity Score Matching Study Tran et al.
15. Preiksaitis A, Krakauskaite S, Petkus V, et al. Association of severe traumatic brain injury patient outcomes with duration of cerebrovascular autoregulation impairment events. Neurosurgery 2016;79(1):75-82.
16. Chesnut RM, Marshall LF, Klauber MR, et al. The role of secondary brain injury in determining outcome from severe head injury. J Trauma . 1993;34(2):216-22.
17. Fuller G, Hasler RM, Mealing N, et al. The association between admission systolic blood pressure and mortality in significant traumatic brain injury: a multi-centre cohort study. Injury 2014;45(3):612-7.
18. Manley G, Knudson MM, Morabito D, et al. Hypotension, hypoxia, and head injury: frequency, duration, and consequences. Arch Surg . 2001;136(10):1118-23.
19. Zafar SN, Millham FH, Chang Y, et al. Presenting blood pressure in traumatic brain injury: a bimodal distribution of death. J Trauma Inj Infect Crit Care . 2011;71(5):1179-84.
20. Manning L, Hirakawa Y, Arima H, et al. Blood pressure variability and outcome after acute intracerebral haemorrhage: a post-hoc analysis of INTERACT2, a randomised controlled trial. Lancet Neurol . 2014;13(4):364-73.
21. Tran QK, Najafali D, Tiffany L, et al. Effect of blood pressure variability on outcomes in emergency patients with intracranial hemorrhage. West J Emerg Med . 2021;22(2):177-85.
22. Tanaka E, Koga M, Kobayashi J, et al. Blood pressure variability on antihypertensive therapy in acute intracerebral hemorrhage: the Stroke Acute Management with Urgent Risk-factor Assessment and Improvement-intracerebral hemorrhage study. Stroke 2014;45(8):2275-9.
23. Chung P-W, Kim J-T, Sanossian N, et al. Association between hyperacute stage blood pressure variability and outcome in patients with spontaneous intracerebral hemorrhage. Stroke 2018;49(2):348-54.
24. Kothari, RU, Brott, T, Broderick, J, Barsan, WG., Sauerbeck, LR., Zuccarello, M., Khoury, J. The ABCs of measuring intracerebral hemorrhage volumes. Stroke. 1996;27:1304-5.
25. Mellick D, Gerhart KA, Whiteneck GG. Understanding outcomes based on the post-acute hospitalization pathways followed by persons with traumatic brain injury. Brain Inj . 2003;17(1):55-71.
26. Al-Hassani A, Strandvik GF, El-Menyar A, et al. Functional outcomes in moderate-to-severe traumatic brain injury survivors. J Emerg Trauma Shock . 2018;11(3):197-204.
27. Ng YS, Chua KSG. States of severely altered consciousness: clinical characteristics, medical complications and functional outcome after rehabilitation. NeuroRehabilitation. 2005;20(2):97-105.
28. Warren M, Knecht J, Verheijde J, et al. Association of AM-PAC “6-clicks” basic mobility and daily activity scores with discharge destination. Phys Ther . 2021;101(4):pzab043.
29. Tuteja G, Jackson M, Barr J, et al. Transportation management affecting outcomes of patients with spontaneous intracranial hemorrhage. Air Med J . 2020;39(3):189-95.
30. Wang Y, Cai H, Li C, et al. Optimal caliper width for propensity
score matching of three treatment groups: a Monte Carlo study. PLoS One . 2013;8(12):e81045.
31. Rasmussen M, Schönenberger S, Hendèn PL, et al. Blood pressure thresholds and neurologic outcomes after endovascular therapy for acute ischemic stroke: an analysis of individual patient data from 3 randomized clinical trials. JAMA Neurol 2020;77(5):622-31.
32. Brenner M, Stein DM, Hu PF, et al. Traditional systolic blood pressure targets underestimate hypotension-induced secondary brain injury. J Trauma Acute Care Surg . 2012;72(5):1135-9.
33. Rodriguez-Luna D, Piñeiro S, Rubiera M, et al. Impact of blood pressure changes and course on hematoma growth in acute intracerebral hemorrhage. Eur J Neurol . 2013;20(9):1277-83.
34. Moullaali TJ, Wang X, Martin RH, et al. Blood pressure control and clinical outcomes in acute intracerebral haemorrhage: a preplanned pooled analysis of individual participant data. Lancet Neurol . 2019;18(9):857-64.
35. Mistry EA, Mehta T, Mistry A, et al. Blood pressure variability and neurologic outcome after endovascular thrombectomy: a secondary analysis of the BEST study. Stroke . 2020;51(2):511-8.
36. Yang M, Pan X, Liang Z, et al. Association between blood pressure variability and the short-term outcome in patients with acute spontaneous subarachnoid hemorrhage. Hypertens Res 2019;42(11):1701-7.
37. Lattanzi S, Cagnetti C, Provinciali L, et al. Blood pressure variability and clinical outcome in patients with acute intracerebral hemorrhage. J Stroke Cerebrovasc Dis . 2015;24(7):1493-9.
38. Ortiz GA, Sacco RL. National Institutes of Health Stroke Scale (NIHSS). Wiley StatsRef: Statistics Reference Online. 2014. Available at: https:// doi-org.proxy-hs.researchport.umd.edu/10.1002/9781118445112. stat06823. Accessed November 15, 2021.
39. Woo D, Haverbusch M, Sekar P, et al. Effect of untreated hypertension on hemorrhagic stroke. Stroke . 2004;35(7):1703-8.
40. Farrell B, Godwin J, Richards S, et al. The United Kingdom Transient Ischaemic Attack (UK-TIA) aspirin trial: final results. J Neurol Neurosurg Psychiatry . 1991;54(12):1044-54.
41. Jennett B, Bond M. Assessment of outcome after severe brain damage. Lancet . 1975;1(7905):480-4.
42. Jennett B, Snoek J, Bond MR, et al. Disability after severe head injury: observations on the use of the Glasgow Outcome Scale. J Neurol Neurosurg Psychiatry . 1981;44(4):285-93.
43. Malec JF, Mandrekar JN, Brown AW, et al. Injury severity and disability in the selection of next level of care following acute medical treatment for traumatic brain injury. Brain Inj 2009;23(1):22-9.
44. LeBlanc J, de Guise E, Gosselin N, et al. Comparison of functional outcome following acute care in young, middle-aged and elderly patients with traumatic brain injury. Brain Inj . 2006;20(8):779-90.
45. Chen AY, Zagorski B, Parsons D, et al. Factors associated with discharge destination from acute care after acquired brain injury in Ontario, Canada. BMC Neurol . 2012;12:16.
46. Schumacher R, Walder B, Delhumeau C, et al. Predictors of inpatient
Volume 23, no. 5: September 2022 779 Western Journal of Emergency Medicine Tran et al. BP Variability and Outcome in TBI: A Propensity Score Matching Study
BP Variability and Outcome in TBI: A Propensity Score Matching Study
(neuro)rehabilitation after acute care of severe traumatic brain injury: an epidemiological study. Brain Inj. 2016;30(10):1186-93.
47. Immink RV, van Montfrans GA, Stam J, et al. Dynamic cerebral autoregulation in acute lacunar and middle cerebral artery territory
ischemic stroke. Stroke . 2005;36(12):2595-600.
48. Sykora M, Diedler J, Rupp A, et al. Impaired baroreflex sensitivity predicts outcome of acute intracerebral hemorrhage. Crit Care Med . 2008;36(11):3074-9.
Western Journal of Emergency Medicine 780 Volume 23, no. 5: September 2022
Tran et al.
A Novel Technique to Identify Intimate Partner Violence in a Hospital Setting
Azade Tabaie, PhD* Amy J. Zeidan, MD Dabney P. Evans, PhD, MPH Randi N. Smith, MD, MPH Rishikesan Kamaleswaran, PhD
Emory University School of Medicine, Department of Biomedical Informatics, Atlanta, Georgia
Emory University School of Medicine, Department of Emergency Medicine, Atlanta, Georgia
Emory University, Rollins School of Public Health, Hubert Department of Global Health, Atlanta, Georgia
Emory University, Rollins School of Public Health, Department of Behavioral, Social and Health Educations Sciences, Atlanta, Georgia
Emory University School of Medicine, Department of Surgery, Atlanta, Georgia Georgia Institute of Technology and Emory School of Medicine, Department of Biomedical Engineering, Atlanta, Georgia
Section Editor: John Ashurst, DO
Submission history: Submitted March 9, 2022; Revision received July 6, 2022; Accepted July 12, 2022
Electronically published September 12, 2022
Full text available through open access at http://escholarship.org/uc/uciem_westjem DOI: 10.5811/westjem.2022.7.56726
Introduction: Intimate partner violence (IPV) is defined as sexual, physical, psychological, or economic violence that occurs between current or former intimate partners. Victims of IPV may seek care for violence-related injuries in healthcare settings, which makes recognition and intervention in these facilities critical. In this study our goal was to develop an algorithm using natural language processing (NLP) to identify cases of IPV within emergency department (ED) settings.
Methods: In this observational cohort study, we extracted unstructured physician and advanced practice provider, nursing, and social worker notes from hospital electronic health records (EHR). The recorded clinical notes and patient narratives were screened for a set of 23 situational terms, derived from the literature on IPV (ie, assault by spouse), along with an additional set of 49 extended situational terms, extracted from known IPV cases (ie, attack by spouse). We compared the effectiveness of the proposed model with detection of IPV-related International Classification of Diseases, 10th Revision, codes.
Results: We included in the analysis a total of 1,064,735 patient encounters (405,303 patients who visited the ED of a Level I trauma center) from January 2012–August 2020. The outcome was identification of an IPV-related encounter. In this study we used information embedded in unstructured EHR data to develop a NLP algorithm that employs clinical notes to identify IPV visits to the ED. Using a set of 23 situational terms along with 49 extended situational terms, the algorithm successfully identified 7,399 IPV-related encounters representing 5,975 patients; the algorithm achieved 99.5% precision in detecting positive cases in our sample of 1,064,735 ED encounters.
Conclusion: Using a set of pre-defined IPV-related terms, we successfully developed a novel natural language processing algorithm capable of identifying intimate partner violence. [West J Emerg Med. 2022;23(5)781–788.]
INTRODUCTION
Intimate partner violence (IPV) is defined as sexual, physical, psychological, or economic violence that occurs between current
or former intimate partners.1 Although men may experience IPV, women are disproportionately affected.2 Nearly 30% of women globally have experienced IPV, making it a serious public health
Volume 23, no. 5: September 2022 781 Western Journal of Emergency Medicine Original Research
†
‡§
§¶
*†||
* † ‡ § ¶ ||
concern.3 Intimate partner violence is a significant contributor to violence-related injury and a leading cause of femicide, which is the intentional killing of women based solely on their gender.4 In the United States one in four women and one in nine men have experienced a severe form of IPV at some point in their lifetime.5
Individuals who experience IPV experience both shortand long-term adverse health outcomes such as chronic pain, substance abuse disorder, and mental health disorders.6-9 People experiencing relationship violence may seek care for IPVrelated injuries in healthcare settings, including emergency departments (ED), making recognition and intervention in these facilities critical.10-11 A recent study revealed that patients experiencing IPV have considerably higher ED visit rates and injury-related hospitalization rates.12 Yet IPV is profoundly underdiagnosed in healthcare settings, limiting identification and response efforts. A number of screening tools have been successfully developed to detect IPV in ED settings; however, screening tools are inconsistently used. Emerging efforts have focused on using machine learning to aid in detection of conditions including non-accidental trauma and IPV.13-15
Information captured in the electronic health record (EHR) including clinical notes, radiology reports, and imaging tests have been widely used to predict adverse outcomes for specific medical conditions. Khurana et al proposed a machine learning algorithm that uses radiologic findings of high-risk injuries (eg, injury location and patterns specific to IPV) to identify patients who are at high risk of IPV.16,17 Using the 2016 South African Demographic and Health Survey dataset, Amusa et al developed a machine learning model using country-specific, self-reported survey data to capture common characteristics contributing to IPV.13 In our study, we propose a novel natural language processing (NLP)-based algorithm using data embedded in the EHR to detect IPV-related ED encounters.
Population Health Research Capsule
What do we already know about this issue?
Intimate partner violence (IPV) is a serious public health concern yet is underdiagnosed in healthcare settings, making identification and intervention difficult.
What was the research question?
Could we develop a natural language processing (NLP) algorithm that accurately identifies IPV-related encounters?
What was the major finding of the study?
We developed an NLP algorithm that successfully identifies positive cases of IPV with 99.5% precision using unstructured electronic health record data from clinical notes.
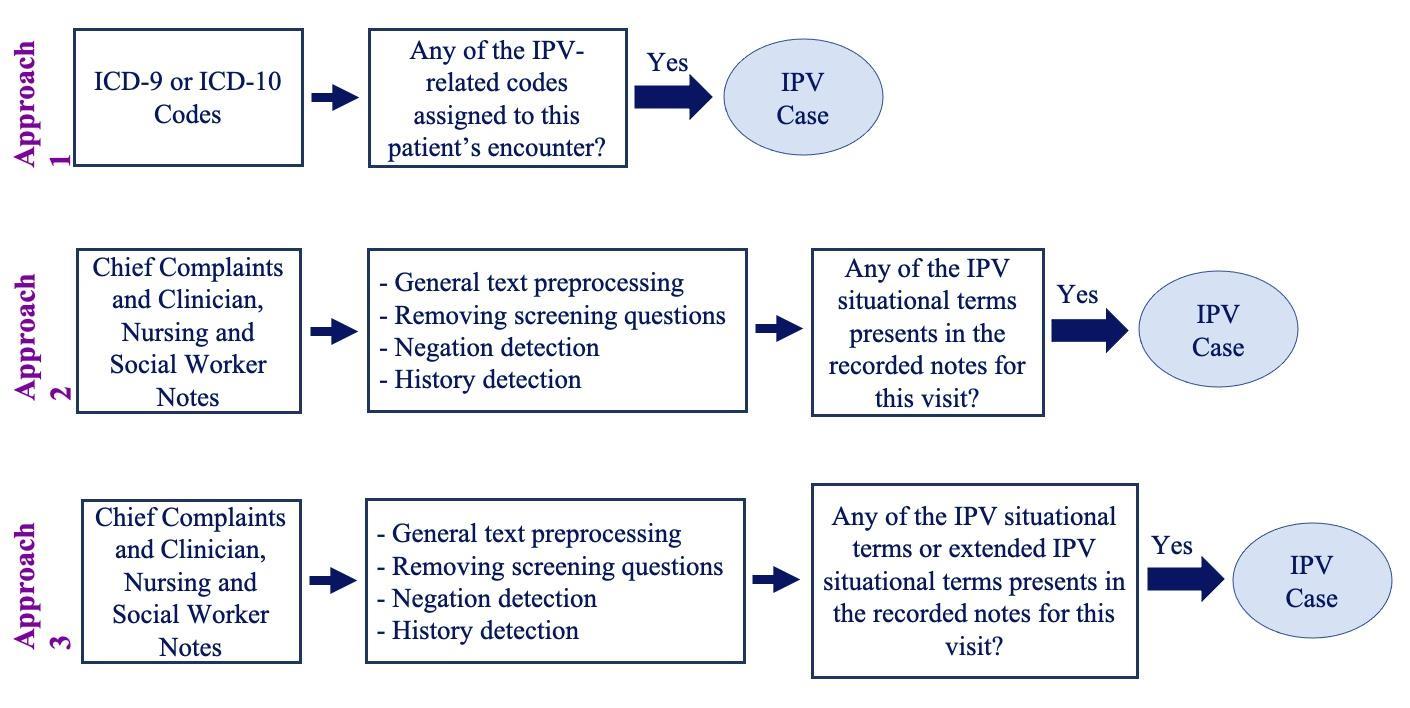
How does this improve population health?
The NLP algorithm can be used in ED settings in near-real time to identify IPV-related encounters, aid in surveillance mechanisms, and support timely interventions.
METHODS Study Population
We extracted data from an EHR for all ED encounters between January 2012–August 2020 at a US-based Level 1 trauma center. These structured data included International Classification of Diseases, 9th and 10th revisions (ICD-9
International Classification of Diseases, 9th and 10th revisions; IPV, intimate partner violence.
Figure 1. Summary of three methods for developing a natural language processing algorithm to identify intimate partner violence in a hospital setting.
Western Journal of Emergency Medicine 782 Volume 23, no. 5: September 2022 Novel Technique to Identify Intimate Partner Violence in a Hospital Setting Tabaie et al.
or ICD-10) codes, procedure and billing codes, admission diagnosis, disposition, patient status, and date of birth. Unstructured data included chief complaint and all physician and advanced practice provider (APP), nursing, and social worker notes. This research was approved by the Emory University Institutional Review Board (IRB #00432).
Detecting Intimate Partner Violence Cases
To identify IPV-related encounters, we attempted to use structured data, followed by use of the unstructured data. The three iterative approaches used to identify IPV-related encounters are further described in this paper. Figure 1 summarizes the different approaches in this analysis.
Approach 1: ICD-9/ICD-10 Codes
In the first approach, we identified IPV-related ICD-9 (2012–September 2015) and ICD-10 (October 2015–August 2020) codes (Table 1). In this analysis, if at least one of the ICD-9/ICD-10 codes appeared in an encounter, the encounter was identified as a case of IPV.
Approach 2: Intimate Partner Violence Situational Terms
Intimate partner violence is socially stigmatized and often undisclosed by those experiencing it; clinicians may also have varying levels of awareness and comfort in dealing with IPV.
As a result, ICD-9/ICD-10 codes are inconsistently used and frequently underused. Therefore, we used additional IPVrelated situational terms to identify patients experiencing IPV. A total of 23 situational terms were derived from existing IPV literature, including validated terms from IPV risk-assessment instruments and from clinician expertise for use in our second approach (Table 2).18-20 If any one of the situational terms was captured in a clinical note, the encounter was classified as IPV.
Approach 3: Intimate Partner Violence Extended Situational Terms
Using a reverse engineering approach, we identified additional IPV-related terms through review of notes from
confirmed IPV encounters and derived from the literature. A total of 49 extended terms included specific descriptions of various forms of physical abuse (ie, attack, strike, strangle) (Table 2).3,1820 If any of the situational or extended situational terms were captured in a clinical note, we classified the encounter as IPV.
Data Pre-processing: Approaches 2 and 3
A member of the study team completed a manual review of charts identified as positive IPV cases in real time when assessing approaches 2 and 3. During the application of approaches 2 and 3, several text-based scenarios identified in unstructured clinical notes led to false-positive IPV cases. As a result, additional data pre-processing steps were required to prepare the data prior to application of the algorithm. These include general and task-specific text pre-processing steps along with negation and history detection.
General and Task-Specific Pre-processing
We performed general text pre-processing steps including transforming all text to lowercase and removing numbers, extra white spaces, and words with fewer than two characters. Additionally, prepositions and time indications were removed from the text to make clinical notes consistent. For example, “assaulted last night by her husband” was changed to “assault by husband.” The following text-based scenarios led to false positives: 1) auto-populated IPV screening questions (whether completed or blank); and 2) auto-populated past medical, obstetric, or psychiatric history reflecting a history of IPV unrelated to the identified encounter. As a result, task-specific text pre-processing was required for these scenarios.
Negation Detection
Encounters in which the patient denied a history of IPV were incorrectly labeled as IPV given the inclusion of IPV terminology. To omit these false positives, we applied a negation detection algorithm, which is a simplified version of NegEx software (SourceForge, San Diego, CA).21 In this
Table 1. ICD-9 and ICD-10* to of intimate partner violence in an emergency department setting.
ICD-9
995.83
Adult sexual abuse
995.83 Adult rape
995.82
995.81
Adult emotional abuse
Adult physical abuse
995.8 Adult abuse
E967.0
E967.9
994.7
Perpetrator
Perpetrator
Asphyxiation and strangulation
ICD-10 Diagnosis
T76.21XA
T76.51XA
T76.11XA
Adult sexual abuse, suspected, initial encounter
Adult forced sexual exploitation, suspected, initial encounter
Adult physical abuse, suspected, initial encounter
T74.11XA Adult physical abuse, confirmed, initial encounter
T74.21XA Adult sexual abuse, confirmed, initial encounter
T74.51XA
T71.9XXA
Adult forced sexual exploitation, confirmed, initial encounter
Asphyxiation due to unspecified cause, initial encounter
T71.163A Asphyxiation due to hanging, assault, initial encounter
T71.193A
Asphyxiation due to mechanical threat to breathing due to other causes, assault, initial encounter
*ICD-9/10, International Classification of Diseases, 9th and 10th revisions; IPV, intimate partner violence.
Tabaie Novel Technique to Identify Intimate Partner Violence in a Hospital Setting
Volume 23, no. 5: September 2022 783 Western Journal of Emergency Medicine
et al.
Codes
Codes Code Diagnosis (Dx) Name Code
(Dx) Name
used
identify cases
Table 2. Intimate partner violence (IPV) situational terms and IPV extended situational terms to identify positive IPV cases in an emergency department setting.
IPV Situational Terms IPV Extended Situational Terms
Table 3. Negation words, terminations tokens, and history words for a natural language processing algorithm to identify cases of intimate partner violence in an emergency department setting.
intimate partner homicide, femicide, intimate partner death, spousal homicide, ipv, dv, domestic violence resources, assault by so, assault by domestic partner, assault by ex, assault by bf, assault by gf, strangle by boyfriend, strangle by girlfriend, strangle by wife, strangle by husband, strangle by spouse, strangle by domestic partner, strangle by partner, strangle by significant other, strangle by so, strangle by ex, strangle by bf, strangle by gf, strike by boyfriend, strike by girlfriend, strike by wife, strike by husband, strike by spouse, strike by domestic partner, strike by partner, strike by significant other, strike by so, strike by ex, strike by bf, strike by gf, attack by boyfriend, attack by girlfriend, attack by wife, attack by husband, attack by spouse, attack by domestic partner, attack by partner, attack by significant other, attack by so, attack by ex, attack by bf, attack by gf, violence against women IPV, intimate partner violence.
domestic violence, intimate partner violence, spouse abuse, battered woman, domestic abuse, spousal abuse, intimate partner abuse, battered, violence against women, domestic assault, domestic dispute, problems with spouse or partner, maltreatment by spouse or partner, neglect and abandonment by spouse or partner, assault by husband, assault by partner, assault by wife, assault by spouse, assault by boyfriend, assault by girlfriend, assault by significant other, referral to partnership against domestic violence, resources or shelter for domestic violence
Negation words Termination tokens History words "denies", "denied", "deny", "no", "non", "not", "without", "unable"
"?", ".", "-", ";", ":", "+", "and", "but", "complains", "did", "except", "has", "per", "pt", "reports", "secondary", "states" “history of”, “hx of”, “h/x of”, “ho of”, “h/o of”, “hx”, “h/x”, “h/o”, “ho”
approach, negation words and terminating tokens are defined. When a negation word was detected, any word between the negation word and the next terminating token was negated. For example, if the text included “Patient denies drug, alcohol use and intimate partner violence,” denies was identified as the negation word and period was the termination token. Therefore, applying the negation detection algorithm resulted in “Patient denies drug_neg, alcohol_neg use_neg and_neg intimate_neg partner_neg violence_neg.” As a result, such cases were excluded from situational and extended IPV terms and thus not labeled as IPV. Table 3 includes a list of negation words as well as termination tokens in our analysis designed according to the literature.22
History Detection
The algorithm initially detected encounters in which a patient had a history of IPV as described in the text of the EHR (separate from the auto-populated history). Similar to the approach to negation detection, encounters with a history of IPV included in the text were not labeled as IPV as this was
not the reason for the ED encounter. For example, “Patient reports a history of IPV during previous pregnancy but not currently” was not labeled as IPV. Punctuation marks were removed at the end of this step. We list IPV history detection tokens in Table 3.
Natural Language Processing Algorithm Application
To validate the performance of the proposed NLP algorithm for Approach 1 (ICD-9 and IC-10 codes) we cross referenced medical record numbers (MRNs) identified using the predetermined IPV-related ICD-10 codes with the hospital trauma registry for a set time period of 2019-2020. Encounters identified from the trauma registry labeled as positive IPV encounters by ICD-10 codes were manually reviewed by a single reviewer with knowledge of the study’s primary objective and prior training in data abstraction to determine whether the ICD-10 codes correctly labeled IPV encounters. Given the time-intensive nature of manual chart review, we selected this time period (2019-2020) as a pilot to assess the accuracy of this approach, and we used the trauma registry as most patients admitted for an IPV-related injury are admitted to the trauma service. The accuracy of this approach was poor, and thus no further charts were reviewed beyond this time period.
To validate the performance of the proposed NLP algorithm for approaches 2 and 3, manual chart reviews were conducted for the encounters labeled as IPV using situational and extended situational terms. Chart reviews were conducted by a single reviewer with knowledge of the study’s primary objective and prior training in data abstraction. Unlike in approach 1, the trauma registry was not used to narrow review as this would not allow for identification of the specific terminology identified using the NLP algorithm. Rather, manual review was required to identify terminology in the notes of encounters identified as IPV. Manual review was conducted for 25% of the identified IPV cases, and charts were reviewed randomly by year. During the initial manual review process, we determined this approach to be successful at correctly labeling IPV encounters, and thus the percentage of total charts to review (~25%) was determined based on feasibility of
Western Journal of Emergency Medicine 784 Volume 23, no. 5: September 2022 Novel Technique to Identify Intimate Partner Violence in a Hospital Setting Tabaie et al.
manual review (1,798 encounters). Notably, as the reviewer approached this number of charts, the number of false positives was negligible.
RESULTS
During the study period (January 2012–August 2020) there were 1,064,735 ED encounters (405,303 patients). To identify IPV encounters, we used all ICD-9 and ICD-10 codes and data from structured and unstructured notes to investigate the performance of the three approaches.
Approach 1: ICD-9/ICD-10 Codes
The first approach using ICD-9 and ICD-10 codes exclusively to identify cases of IPV in a ED setting resulted in the identification of 1,404 IPV encounters representing 1,299 patients over a nine-year time period.
Approach 2: Intimate Partner Violence Situational Terms
In the next approach, 23 IPV-related situational terms were used to identify IPV encounters. If any of these terms appeared in an encounter’s recorded clinical notes, the encounter was labeled as IPV. This approach yielded 6,437 IPV encounters reflecting 5,280 patients.
Approach 3: Intimate Partner Violence Extended Situational Terms
Building on the second approach, additional mechanismrelated terminology (ie, attack, strike, strangle) was added to the initial 23 terms to identify more IPV-related encounters (defined as IPV extended situational terms). The third approach using IPV extended situational terms identified 7,399 IPV-related encounters representing 5,975 patients. Notably, when comparing approach 1 and approach 3, 96 encounters identified by extended situational terms were also identified by ICD codes (corresponding to 95 patients). The terms that were listed in notes from encounters identified by ICD codes included domestic violence, DV, intimate partner violence, IPV, domestic abuse, domestic violence resources, assault by boyfriend, attack by boyfriend, assault by ex, assault by husband, attack by husband, spouse abuse, domestic dispute, and battered woman.
Validation of Approaches
For approach 1, the encounters labeled as IPV using ICD-10 codes from 2019-2020 were cross referenced with the trauma registry (552 encounters for 2019 and 2020). Of the ICD-10 codes that labeled positive IPV encounters, 85 MRNs were identified from 2019 and 114 from 2020 from the trauma registry. After completion of manual chart review of the 199 encounters, only 16 of the MRNs identified represented a confirmed encounter for IPV (8%).
For approaches 2 and 3, a random subset of 1,798 (25%) encounters of identified cases were manually reviewed to validate this approach. Nearly all of the 1,798 cases (99.5%) were confirmed IPV encounters; only five (0.3%) reported
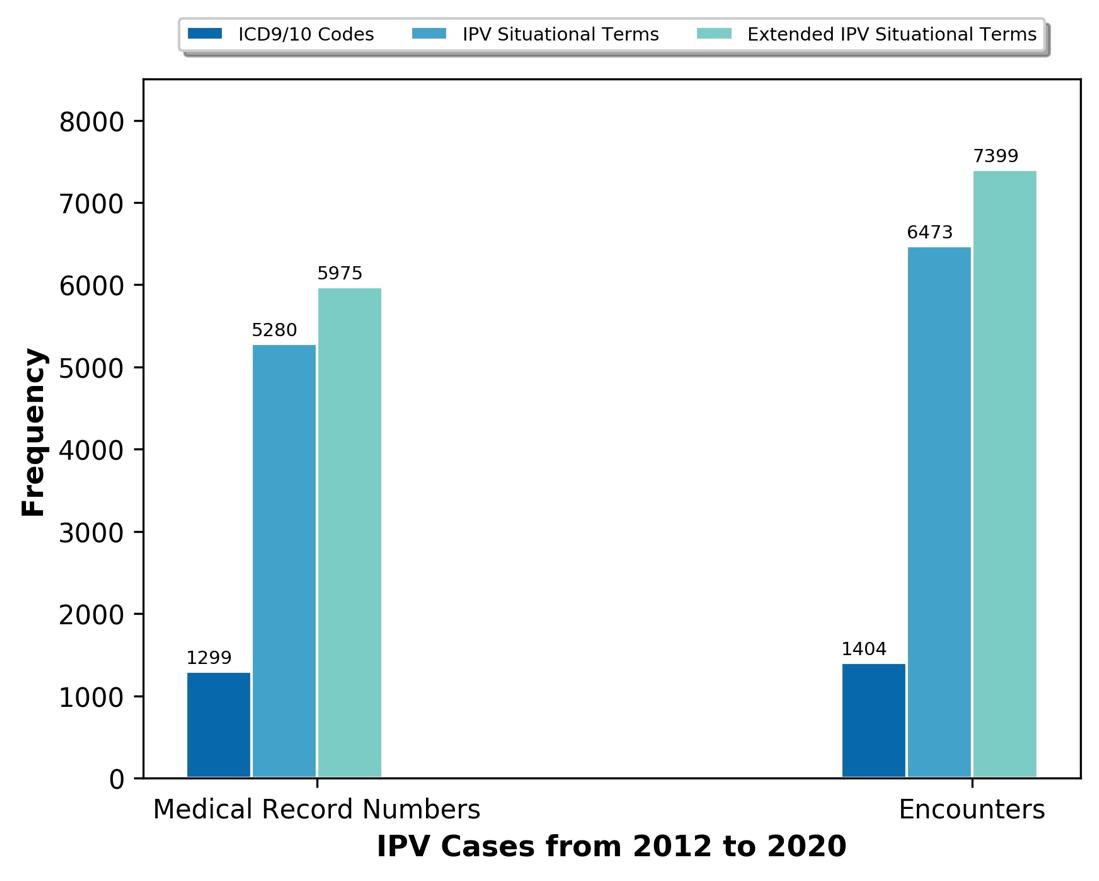
Figure 2. Identified intimate partner violence (IPV) cases using ICD-9/10 codes, IPV situational terms and extended IPV situational terms.
ICD, International Classification of Diseases, 9th and 10 revisions; IPV, intimate partner violence.
a history of IPV or domestic violence, two (0.1%) were incorrectly labeled as IPV, and there was a concern of IPV for only one (0.1%) encounter. Relative to the use of ICD codes, both the situational and extended situational terms approaches had significantly improved accuracy in identifying true IPV cases, with extended situational terms identifying more positive IPV cases without a notable difference in identifying false positives.
The number of IPV cases identified through each approach – ICD-9/10 codes, IPV situational terms, and IPV extended situational terms – are displayed in Figure 2. While an extensive analysis of patient demographic and clinical factors was beyond the scope of this study, we did explore age demographics of patients identified by IPV extended situational terms. Of the 7,399 encounters identified by IPV extended situational terms, most encounters were by adults (ages 22-64; n = 6,378), followed by young adults (ages 1421, n = 877) and older adults (age >65, n = 144).
DISCUSSION
This study used EHR data as a means of identifying possible IPV among patients presenting to the ED. Three different NLP approaches were explored to identify IPV in ED settings: 1) ICD-9/ICD-10 codes; 2) a set of 23 IPVrelated situational terms; and 3) a set of 49 IPV-related extended situational terms. Among the three approaches incorporated in this study, the use of ICD-9/ICD-10 codes alone identified the fewest IPV encounters over a nine-year time interval (n = 1,404 encounters) with the lowest accuracy. Additionally, based on clinician expertise and anecdotal experiences at the hospital site, this number of cases was
Tabaie Technique Identify Intimate Partner
Volume 23, no. 5: September 2022 785 Western Journal of Emergency Medicine
et al. Novel
to
Violence in a Hospital Setting
significantly lower than expected given the duration of time. Intimate partner violence encounters were significantly undercoded and, in some cases, IPV-related codes were used for non-IPV related encounters (ie, elder abuse). This approach is not sufficient for the accurate and meaningful identification of IPV-related encounters.
The second and third approaches using unstructured EHR data identified a greater number of IPV encounters, generated fewer false positives, and more accurately identified true positive cases. As a result, the third approach using extended situational terms generated the largest number of true IPV encounters, achieving a 99.5% precision. Furthermore, during the manual review of positive IPV cases identified through approach 3, a number of true IPV encounters did not have an associated IPV ICD-9 or ICD-10 code, verifying that these codes are under- or inappropriately used, reifying the need for more expansive detection methods beyond the use of ICD codes alone.
In a study conducted by Chen et al the authors generated an NLP predictive algorithm using radiology reports from confirmed IPV cases.17 The IPV labels were identified using IPV injury patterns and predictive words from radiologic findings. The Chen study differed from ours in that it relied only on radiologic findings to develop an algorithm rather than clinical notes. The information obtained in clinical notes provides greater context and IPV-specific terminology and is more inclusive of individuals who may not undergo radiologic imaging. Thus, our algorithm may be able to detect more cases by using a more expansive source of clinical information. Similar to our study, Blosniche et al used clinical notes to identify transgender-related terminology to better identify transgender patients.23 The methodology differed in that they first used transgender-based ICD codes to identify patients and then used clinical notes from these encounters to identify transgender-related terms. Th Blosniche study, alongside ours, demonstrates that clinician notes can be an important source of data for labeling encounters that are otherwise difficult to identify or are socially stigmatized. It should also be noted that the purpose of their study was different in that it sought to identify a population (transgender patients) rather than a condition or experience (IPV).
Unstructured EHR data with free-text formatting provides a rich source of information related to the circumstances of medical visits and related health sequelae. The data provided in clinical notes can be an important source of information to identify the social and contextual factors surrounding IPVrelated encounters, as well as providing an opportunity to appropriately identify IPV encounters. The main challenge in using this type of data is the unstructured nature of notes, which makes extracting information a complicated task. As a result, application of extensive pre-processing steps was required to ready these data for the screening process. Sequentially building our algorithm grounded first in ICD codes, and then complemented by both situational and extended terms, enabled greater specificity in identifying
IPV cases when compared to the use of ICD codes alone; the search and use of relevant terms in clinical notes was key to the success of this approach. Future efforts to improve our algorithm could incorporate active learning to identify a greater number of IPV encounters.24 This method is a process of prioritizing the data, which needs to be labeled to improve the overall performance of a predictive model.
Individuals experiencing IPV often seek care in the ED. Therefore, the early and appropriate detection of and response to such cases is critical in disrupting the cycle of abuse including IPV-related morbidity and mortality. The novel NLP-based algorithm we describe here is an innovative tool to use recorded clinical notes and identify victims of IPV in a near real-time setting with accuracy. The algorithm can be used in ED settings to identify victims of IPV for surveillance and intervention purposes. For example, the extent to which coronavirus 2019 (COVID-19) impacted IPV-related healthseeking behaviors in the US is still largely unknown.25-28 As identification of IPV in health systems is challenging, application of this algorithm could assist with understanding the impact of movement-related restrictions during the COVID-19 pandemic on IPV- related encounters.
When considering potential interventions, documentation of IPV by clinicians may not always translate to the assignment of accurate diagnostic codes, appropriate screening, referral to social work, and/or allocation of immediate and shortterm resources and follow-up. The practicality of this novel algorithm is the potential for real-time identification of individuals at risk that could trigger automatic notifications/ best practice advisories in the EHR to ensure that appropriate screening, referrals and resources are available to patients. Additionally, this algorithm could be used to develop predictive modeling allowing for the detection of those at risk of IPV. Early detection during hospital encounters could aid in novel injury-prevention strategies, ensuring that those at risk have access to support and social services.
LIMITATIONS
This study has limitations. All approaches required use of EHRs. While the use of EHRs is now standard in most US hospital settings, one limitation is that any information not captured in the EHR would not be included in our analysis. In our first approach using ICD codes, a number of encounters were found to be unrelated to IPV during manual review, resulting in false positives. Some cases were indicative of elder abuse, reflecting the inaccuracy of relying exclusively on ICD-9 and ICD-10 codes. This limitation inspired the subsequent approaches as these codes are often used inconsistently or inappropriately.
The second and third approaches relied on clinical notes and patient narratives present in the EHR; as a result, the model cannot detect IPV cases if the patient or clinician did not mention or document any of the IPV-related terms included in the algorithm. Similarly, grammatical errors,
Western Journal of Emergency Medicine 786 Volume 23, no. 5: September 2022 Novel Technique to Identify Intimate Partner Violence in a Hospital Setting Tabaie et al.
misspelling, punctuation errors, etc, can impact identification of IPV cases. In future work, deep learning-based natural language models, such as transformers, could be used to overcome these problems and boost the performance and generalizability of the IPV-detection algorithm. To most effectively capture experiences of IPV that were present in the EHR, we applied extensive text pre-processing before searching for IPV situational terms. However, if a patient or clinician stated the history of IPV in a way that was not captured by our history detection algorithm, the proposed NLP algorithm would incorrectly identify that case as IPV.
Third, the set of IPV terms that were incorporated are limited. If a patient uses terminology outside the set of predefined IPV situational terms, the algorithm will not identify the encounter. Additionally, some terms may be used in a non-IPV context. For example, domestic dispute can be used in IPV encounters but can also refer to a conflict among members of a family (eg, mother and child) and generate false positives. Furthermore, we excluded historical cases of IPV in our labeling to capture only encounters where a patient reported current IPV. As prior IPV is a risk factor for future IPV, excluding these encounters may have missed some potential cases of IPV while at the same time improved specificity of the algorithm for detecting IPV in the current encounter. While the extended situational term approach demonstrated superiority compared to the use of ICD codes alone or the use of situational terms it admittedly still missed some cases.
As conversations about the use of NLP and other technologies continue, debate over what degree of precision or sensitivity is reasonable for a model such as ours is warranted. Further, the 99.5% precision calculation in this study was the result of conducting chart reviews for a random subset of 25% of all identified IPV cases; therefore, this number may change based on the subset of charts manually reviewed. Additionally, our manual chart reviews focused on the number of true-positive and false-positive cases. As we did not review the non-IPV encounters, due to the extremely labor-intensive nature of the task, we cannot comment on the sensitivity or specificity of all the positively and negatively identified IPV cases. From our perspective, missing any cases is unacceptable. In designing any future models researchers should aim to achieve even greater sensitivity to ensure that opportunities to identify and interrupt IPV are not missed.
CONCLUSION
We developed a natural language processing algorithm that uses an extended list of situational terms for application using unstructured electronic health record data from clinical notes to accurately identify intimate partner violence encounters. This approach was superior to the use of ICD codes or a more limited list of terms. This algorithm has a high precision in detecting cases of IPV and can be incorporated as a decision support system in health system EHRs to identify IPV cases.
Address for Correspondence: Azade Tabaie, PhD, Emory University School of Medicine, Department of Biomedical Informatics, 100 Woodruff Circle, 4th Floor East, Atlanta, GA 30322. Email: a.tabaie.87@gmail.com.
Conflicts of Interest: By the WestJEM article submission agreement, all authors are required to disclose all affiliations, funding sources and financial or management relationships that could be perceived as potential sources of bias. No author has professional or financial relationships with any companies that are relevant to this study. This work was funded by the Emory Woodruff Health Sciences Center Synergy Award (PIs: Evans, Smith and Zeidan). RK was supported by the National Institutes of Health under Award Numbers R01GM139967 and UL1TR002378.There are no conflicts of interest to declare.
Copyright: © 2022 Tabaie et al This is an open access article distributed in accordance with the terms of the Creative Commons Attribution (CC BY 4.0) License. See: http://creativecommons.org/ licenses/by/4.0/
REFERENCES
1. CDC. Intimate Partner Violence. 2020. Available at: https://www.cdc. gov/violenceprevention/intimatepartnerviolence/index.html. Accessed September 29, 2021..
2. Fulu E, Jewkes R, Roselli T, et al. Prevalence of and factors associated with male perpetration of intimate partner violence: findings from the UN Multi-country Cross-sectional Study on Men and Violence in Asia and the Pacific. Lancet Glob Health. 2013;1(4):e187-207.
3. W. H. Organization. WHO multi-country study on women’s health and domestic violence against women. 2005. Available at: https://www. who.int/reproductivehealth/publications/violence/24159358X/en/. Accessed September 29, 2021.
4. United Nations. Global study on homicide. 2019. Available at: https://www.unodc.org/unodc/en/data-and-analysis/global-study-onhomicide.html. Accessed September 29, 2021.
5. NCADV. Domestic violence. 2020. Available at: https://assets. speakcdn.com/assets/2497/domestic_violence-2020080709350855. pdf?1596811079991. Accessed September 29, 2021.
6. Coker AL, Davis KE, Arias I, et al. Physical and mental health effects of intimate partner violence for men and women. Am J Prev Med 2002;23(4):260-8.
7. Campbell JC. Health consequences of intimate partner violence. Lancet. 2002;359(9314):1331-6.
8. Tollestrup K, Sklar D, Frost FJ, et al. Health indicators and intimate partner violence among women who are members of a managed care organization. Prev Med. 1999;29(5):431-40.
9. Ellsberg M, Jansen HA, Heise L, et al. Intimate partner violence and women’s physical and mental health in the WHO multi-country study on women’s health and domestic violence: an observational study. Lancet. 2008;371(9619):1165-72.
10. Renner LM, Wang Q, Logeais ME, et al. Health care providers’ readiness to identify and respond to intimate partner violence. J Interpers Violence. 2021;36(19-20):9507-34.
Volume 23, no. 5: September 2022 787 Western Journal of Emergency Medicine Tabaie et al. Novel Technique to Identify Intimate Partner Violence in a Hospital Setting
Novel Technique to Identify Intimate Partner Violence in a Hospital Setting
11. Evans DP, Shojaie DZ, Sahay KM, et al. Intimate partner violence: barriers to action and opportunities for intervention among health care providers in São Paulo, Brazil. J Interpers Violence 2019:0886260519881004.
12. Kothari CL, Rohs T, Davidson S, et al. Emergency department visits and injury hospitalizations for female and male victims and perpetrators of intimate partner violence. Adv Emrg Med 2015;2015:1-11.
13. Amusa LB, Bengesai AV, Khan HTA. Predicting the Vulnerability of Women to Intimate Partner Violence in South Africa: Evidence from Tree-based Machine Learning Techniques. J Interpers Violence. 2022 Apr;37(7-8):NP5228-NP5245.
14. Berk RA, Sorenson SB. Algorithmic approach to forecasting rare violent events: an illustration based in intimate partner violence perpetration. Criminol Public Policy. 2020;19(1):213-33.
15. Petering R, Um MY, Fard NA, et al. Artificial intelligence to predict intimate partner violence perpetration. AI and Social Work. 2018:195.
16. Khurana B, Seltzer SE, Kohane IS, et al. Making the ‘invisible’ visible: transforming the detection of intimate partner violence. BMJ Qual Saf. 2020;29(3):241-4.
17. Chen IY, Alsentzer E, Park H, et al. Intimate partner violence and injury prediction from radiology reports. Pac Symp Biocomput 2021;26:55-66.
18. Ford-Gilboe M, Wathen CN, Varcoe C, et al. Development of a brief measure of intimate partner violence experiences: the Composite Abuse Scale (Revised)—Short Form (CASR-SF). BMJ Open 2016;6(12):e012824.
19. Campbell JC. Danger Assessment. 2003. Available at: https:// www.dangerassessment.org/uploads/DA_NewScoring_2019.pdf.
Accessed October 8, 2021.
20. M. A. Straus. Conflict Tactics Scale. 2010. Available at: http:// rzukausk.home.mruni.eu/wp-content/uploads/Conflict-Tactics-Scale. pdf. Accessed October 8, 2021.
21. Chapman WW, Bridewell W, Hanbury P, et al. A simple algorithm for identifying negated findings and diseases in discharge summaries. J Biomed Inform. 2001;34(5):301-10.
22. Horng S, Sontag DA, Halpern Y, et al. Creating an automated trigger for sepsis clinical decision support at emergency department triage using machine learning. PLoS One. 2017;12(4):e0174708.
23. Blosnich JR, Cashy J, Gordon AJ, et al. Using clinician text notes in electronic medical record data to validate transgender-related diagnosis codes. J Am Med Inform Assoc. 2018;25(7):905-8.
24. Yang B, Sun JT, Wang T, et al. Effective multi-label active learning for text classification. In Proceedings of the 15th ACM SIGKDD International Conference on Knowledge Discovery and Data Mining. 2009:917-26.
25. Boserup B, McKenney M, Elkbuli A. Alarming trends in US domestic violence during the COVID-19 pandemic. Am J Emerg Med 2020;38(12):2753-5.
26. Smith RN, Nyame-Mireku A, Zeidan A, et al. Intimate partner violence at a Level-1 trauma center during the COVID-19 pandemic: an interrupted time series analysis. American Surg. 2022:00031348221083939.
27. Evans DP. COVID-19 and violence: a research call to action. BMC Women’s Health. 2020;20(1):1-3.
28. Evans DP, Hawk SR, Ripkey CE. Domestic violence in Atlanta, Georgia, before and during COVID-19. Violence Gend 2021;8(3):140-7.
Western Journal of Emergency Medicine 788 Volume 23, no. 5: September 2022
Tabaie et al.
Electronic Health Record-based COVID-19 Interprofessional Case Collaboration
Bryce Ringwald, MD* Suhair Shawar, PharmD†
Camilla Curren, MD‡
Jennifer McCallister, MD, ATSF‡
Jose Bazan, DO‡
Christopher Mead, BS, RRT§ Nicholas E. Kman, MD¶
The Ohio State University College of Medicine, Columbus, Ohio
The Ohio State University College of Medicine, Department of Internal Medicine, Columbus, Ohio
The Ohio State University College of Medicine, Department of Pharmacy, Columbus, Ohio
The Ohio State University College of Medicine, Department of Rehabilitation Sciences, Columbus, Ohio
The Ohio State University College of Medicine, Department of Emergency Medicine, Columbus, Ohio
Section Editor: Jonathan Fisher, MD
Submission history: Submitted July 7, 2021; Revision received January 5, 2022; Accepted February 16, 2022
Electronically published September 14, 2022
Full text available through open access at http://escholarship.org/uc/uciem_westjem DOI: 10.5811/westjem.22.2.53886
[West J Emerg Med. 2022;23(5)789–791.]
BACKGROUND
The Coronavirus Disease 2019 (COVID-19) pandemic led many health science colleges to remove their students from the clinical environment or discourage their involvement with COVID-19 to ensure safety.1 Additionally, the therapeutics literature for COVID-19 is rapidly evolving.2 As colleges determine student involvement in the care of patients with COVID-19, it is imperative to teach evidence-based approaches to management in an interprofessional manner before students begin caring for this patient population.
We developed an interprofessional case collaboration between medical and pharmacy students demonstrating a management plan based on the most current evidence-based approaches. Students collaborated on two clinical cases of COVID-19 pneumonia in an electronic health record (EHR) training environment.3 Students also discussed medical misinformation, scarce resource allocation, and interprofessional collaboration.
Herein, we describe how one institution piloted this curriculum into the fourth-year Emergency Medicine (EM) clerkship to prepare students for the evaluation of patients with suspected or confirmed COVID-19. We report the development, feasibility, experiences, and strategies for implementation at other academic institutions.
OBJECTIVES
By the end of this case collaboration, students should be able to:
1. Describe the therapeutic management of COVID-19 pneumonia
2. Collaborate with interprofessional team members to create
a care plan
3. Describe an approach to address medical misinformation
4. Appreciate the ethical allocation of scarce resources
CURRICULAR DESIGN
Curricular needs assessment
Like many health science colleges, students at our institution were removed from clinical duties in the first week of March 2020 to ensure learner safety. Upon reintroduction to the clinical environment in June 2020, students were initially restricted from the care of patients with suspected or confirmed COVID-19. Without clinical experience, students will not have the opportunity to participate in the direct collaborative care of patients with COVID-19 before entering residency.
Curriculum development
Kern’s six-step approach4 (Table 1) was utilized to develop an EHR-based, interprofessional, COVID-19 management curriculum. The curriculum was implemented on three separate occasions with cases being revised based on frequently changing organizational guidelines and learner feedback. Two cases of patients with COVID-19 pneumonia were created by EM, pulmonary/critical care, infectious disease, pharmacy, and respiratory therapy providers. One case (“Jane Covid”) simulated a patient with moderate COVID-19 pneumonia with few comorbidities, but stable for discharge from the emergency department (ED) and thus a candidate for monoclonal antibody therapy based on current guidelines. The second case (“Joe Covid”) simulated a patient with severe COVID-19 pneumonia with multiple comorbidities requiring critical care, and thus
Volume 23, no. 5: September 2022 789 Western Journal of Emergency Medicine Brief Educational Advances
* † ‡ § ¶
Table 1. Utilization of Kern’s six-step approach for curricular development.
Kern’s six-step approach
Step 1: Problem identification and general needs assessment
Step 2: Targeted needs assessment
Step 3: Goals and objectives
Step 4: Educational strategies
Utilization in curriculum development
Fourth-year medical students have limited contact in care for patients with COVID-19 for concerns of safety
AAMC recommendations for medical students to participate in virtual care of patients with COVID-191
1. Describe the therapeutic management of COVID-19 pneumonia
2. Collaborate with interprofessional team members to create a care plan
3. Describe an approach to address medical misinformation
4. Appreciate the ethical allocation of scarce resources
- Reading for medical and pharmacy students5-11
- Pre-collaboration case EMR interaction
- Interprofessional case collaboration
- Post-collaboration worksheet
Step 5: Implementation - Zoom platform breakout sessions12
- Small group sessions of medical students, pharmacy students, and faculty
Step 6: Evaluation and feedback - Interprofessional peer evaluation and faculty evaluation of collaboration
- Evaluation of worksheets for accuracy
- Overall curriculum evaluation
AAMC, Association of American Medical Colleges; EMR, electronic medical record.
a candidate to receive oral dexamethasone with or without intravenous remdesivir based on the collaboration. Cases were built into an EHR training environment.4
Pre-collaboration reading and case review
Fourth-year medical and pharmacy students were assigned to read our institutional clinical guidelines and current literature on dexamethasone5, remdesivir6-8, bamlanivimab9, and casirivimab/imdevimab10, and regarding combating medical misinformation.11 Learners were encouraged to review additional literature such as evidence against the use of remdesivir.7,8 Medical students were assigned one of the two cases to review prior to the collaboration.
Case collaboration
Medical students, pharmacy students, and faculty were separated into small groups with at least one representative from each discipline in Zoom12 breakout rooms. Medical students presented one of the patient cases to the group and consulted pharmacy students, serving as therapeutic consultants, for guidelines based on institutional standards of care. Groups discussed the patient’s disposition and management options. These same steps were repeated for students presenting the second patient case. Finally, group discussions regarding medical misinformation, interprofessional collaboration, and scarce resource allocation were led by the faculty members. Students were assessed based on participation, professionalism, and collaborative skills by their interprofessional peers and faculty.
Post-collaboration assessment
Students completed a worksheet with questions regarding management of patients with COVID-19. Worksheets were assessed for accuracy by a rubric.
IMPACT/EFFECTIVENESS
This interprofessional case collaboration on the management of patients with COVID-19 pneumonia was piloted three times with a total of 21 fourth-year medical students on their EM clerkship or as part of a transition to EM residency course and 5 pharmacy students on their EM clinical rotation, divided among five small group case collaborations. 15 medical students and 5 pharmacy students evaluated the exercise. Both medical students and pharmacy students rated the overall quality of the session as Very Good (4.0/5.0). They rated the instruction as Excellent (4.6/5.0).
DISCUSSION
We successfully utilized the EHR training environment4 to create an interprofessional case collaboration in the ED digital setting. This format allowed students to interact with the EHR by reviewing the patient chart, placing orders, simulating working conditions, and utilizing organization-specific checklists for medication appropriateness. In addition, we allowed students to examine conflicting evidence6-8 regarding the utilization of certain medications requiring the students to collaborate and appraise the evidence before deciding on care plans. Discussions at the end of the collaboration on medical misinformation, interprofessional collaboration, and scarce resource allocation offered rich insight into front-line experience.
We continue to improve the quality of this COVID-19 clinical case curriculum. We plan to include the utilization of screen sharing on webinar-based platforms to review the chart and guide students through their case presentation in situ Additionally, we plan and invite faculty and pharmacy students from other rotations such as infectious disease and critical care to participate. We continue to necessarily revise the cases to stay up to date with the changing evidence surrounding management
Western Journal of Emergency Medicine 790 Volume 23, no. 5: September 2022 EHR-based COVID-19 Interprofessional Case Collaboration Ringwald et al.
of COVID-19. Finally, it was evident that the collaboration was not as robust when medical or pharmacy students had not completed the pre-work, so this will be emphasized.
For this program, we built the patient cases and chart elements into a simulated EHR training environment4; however, these cases can be utilized with a paper chart format to achieve the same result. We utilized our institution’s treatment guidelines as a template for therapeutic management decisionmaking. Health science colleges with multiple hospital affiliations could instead utilize Infectious Disease Society of America13 or National Institute of Health14 treatment guidelines as a generic guide to develop their therapeutic criteria.
ACKNOWLEDGEMENTS
The development of the EMR learning environment was supported by the Health Resources and Services Administration (HRSA) of the US Department of Health and Human Services (HHS) under the Predoctoral Training in Primary Care program (D56HP20687). This information or content and conclusions are those of the authors and should not be construed as the official position or policy of, nor should any endorsements be inferred by, HRSA, HHS or the US Government.
org/news-insights/press-releases/important-guidance-medicalstudents-clinical-rotations-during-coronavirus-covid-19-outbreak. Published March 17, 2020. Accessed May 19, 2021.
2. Carvalho T, Krammer F, Iwasaki A, et al. The first 12 months of COVID-19: a timeline of immunological insights. Nat Rev Immunol 2021;21(4):245-256.
3. IHIS Learn [Computer software]. Version VP03. Verona, Wisconsin: Epic Systems Corporation; 2019.
4. Thomas PA, Kern DE, Hughes MT, et al. Curriculum Development for Medical Education: a Six-Step Approach . Baltimore, MD: Johns Hopkins University Press; 2016.
5. Horby P, Emberson J, Lim W, et al. Dexamethasone in Hospitalized Patients with Covid-19. N Eng J Med 2021;384(8):693-704.
6. Beigel J, Tomashek K, Dodd L, et al. Remdesivir for the Treatment of Covid-19 — Preliminary Report. N Eng J Med 2020;383(10):992-994.
7. Pan H, Peto R, Karim QA, et al. Repurposed antiviral drugs for COVID-19 –interim WHO SOLIDARITY trial results. N Eng J Med February 2021.
Address for Correspondence: Nicholas Kman, MD, The Ohio State University Wexner Medical Center, Department of Emergency Medicine, 410 W. 10th Avenue, Columbus, Ohio 43210. Email: Nicholas.kman@osumc.edu.
Conflicts of Interest: By the WestJEM article submission agreement, all authors are required to disclose all affiliations, funding sources and financial or management relationships that could be perceived as potential sources of bias. No author has professional or financial relationships with any companies that are relevant to this study. There are no conflicts of interest or sources of funding to declare.
Copyright: © 2022 Ringwald et al. This is an open access article distributed in accordance with the terms of the Creative Commons Attribution (CC BY 4.0) License. See: http://creativecommons.org/ licenses/by/4.0/
8. World Health Organization. WHO recommends against the use of remdesevir in COVID-19 patients. World Health Organization. https://www.who.int/news-room/feature-stories/detail/whorecommends-against-the-use-of-remdesivir-in-covid-19-patients Published November 20, 2020. Accessed May 19, 2021.
9. Chen P, Nirula A, Heller B, et al. SARS-CoV-2 Neutralizing Antibody LY-CoV555 in Outpatients with Covid-19. N Eng J Med 2021;384(3):229-237.
10. Weinreich DM, Sivapalasingam S, Norton T, et al. REGN-COV2, a Neutralizing Antibody Cocktail, in Outpatients with Covid-19. N Eng J Med . 2021;384(3):238-251.
11. Arora VM, Madison S, Simpson L, et al. Addressing Medical Misinformation in the Patient-Clinician Relationship. JAMA 2020;324(23):2367.
12. CarmenZoom [Computer Software]. Version 5.7.1. San Jose, CA: Zoom Video Communications, Inc; 2020.
13. Bhimraj A, Morgan R. COVID-19 Guideline, Part 1: Treatment and Management. IDSA Home. https://www.idsociety.org/practiceguideline/covid-19-guideline-treatment-and-management/. Published April 11, 2020. Accessed May 19, 2021.
REFERENCES
1. Prescott J. Important Guidance for Medical Students on Clinical Rotations During the Coronavirus (COVID-19) Outbreak. Association of American Medical Colleges. https://www.aamc.
14. COVID-19 Treatment Guidelines Panel. Information on COVID-19 Treatment, Prevention and Research. National Institutes of Health. https://www.covid19treatmentguidelines.nih.gov/. Accessed May 19, 2021.
Volume 23, no. 5: September 2022 791 Western Journal of Emergency Medicine Ringwald et al. EHR-based COVID-19 Interprofessional Case Collaboration
Letter
Comment on “Comparing Physician Assistant and Nurse Practitioner Practice in US Emergency Departments, 2010-2017”
Sean Croughan, MB, BCh, BAO Deirdre Glynn, MB, BCh, BAO
Section Editor: Garry Gaddis, MD
St. James Hospital, Department of Emergency Medicine, Dublin, Ireland
Submission history: Submitted January 16, 2022; Revision received April 13, 2022; Accepted March 27, 2022 Electronically published September 19, 2022
Full text available through open access at http://escholarship.org/uc/uciem_westjem DOI: 10.5811/westjem.2022.3.56163
[West J Emerg Med. 2022;23(5)792.]
To the Editor:
We read with great interest the piece by Wu and colleagues, which explores the changing landscape of emergency medicine and increasing use of non-physician healthcare professionals in recent years.1 We applaud the tremendous efforts of the authors to provide much needed quantitative data on a topic that is likely to become increasingly important. The paper raised great interest locally; Ireland has a nascent nurse practitioner programme but is also tentatively exploring physician assistant education models. Data such as this is invaluable to help management make informed decisions regarding future workforce planning.
However, we feel there are some important methodological issues that need to be considered to fully evaluate the value of the authors’ data. In the data analysis subsection of the manuscript, no details are provided of the statistical methodology that is used to compare between-group differences. From this, we assume that the authors simply computed confidence intervals for each measurement and then compared these intervals. This technique is often overly conservative, substantially increasing the risk of a type II error.2 The error arises because instead of considering the confidence interval of the difference between means (the value we are actually interested in), we are comparing the confidence intervals of each mean (separate and distinct values). A more robust method would be to perform a hypothesis test to determine the between-group difference and report the confidence intervals of this inter-group difference. This approach also allows for easy assessment of the magnitude of the inter-group difference, if any, to determine whether the effect size is clinically meaningful or merely statistically significant.
We would note that for the comparison between “physician assistant (PA) with physician involvement” and “nurse practitioner (NP) with physician involvement”, along with certain other measurements, a P-value is provided. This suggests this technique may have been used; but there is no data in the manuscript to describe what testing methodology the P-value refers to.
Without this data, interpretation of the study is limited as we are unable to confidently exclude true inter-group
differences. This becomes even more important when considering that clinically relevant differences in variables, such as frequency of diagnostic testing, imaging, procedures performed, medications prescribed and admission rates, may have been overlooked due to these methodological issues. However, it should be noted that applying previously described estimation techniques suggest no true inter-group difference.3
We would like to thank the authors for taking the time to produce a work on such an interesting and important topic to the future of emergency medicine. If the authors could expand upon the concerns highlighted above, we feel that this would greatly increase the usefulness of the data provided.
Address for Correspondence: Sean Croughan, MB, BCh, BAO, St. James Hospital, Department of Emergency Medicine, James St, Saint James, Dublin 8, D08 NHY1, Ireland. Email: scroughan@gmail.com.
Conflicts of Interest: By the WestJEM article submission agreement, all authors are required to disclose all affiliations, funding sources and financial or management relationships that could be perceived as potential sources of bias. No author has professional or financial relationships with any companies that are relevant to this study. There are no conflicts of interest or sources of funding to declare.
Copyright: © 2022 Croughan et al. This is an open access article distributed in accordance with the terms of the Creative Commons Attribution (CC BY 4.0) License. See: http://creativecommons.org/ licenses/by/4.0/
REFERENCES
1. Wu F, Darracq MA. Comparing physician assistant and nurse practitio ner practice in U.S. emergency departments, 2010–2017. West J Emerg Med. 2021;22(5):1150–5.
2. Frost J. (2020). Hypothesis Testing: An Intuitive Guide for Making Data Driven Decisions. Statistics By Jim Publishing.
3. Cumming G, Finch S. Inference by eye: confidence intervals and how to read pictures of data. Am Psychol. 2005;60(2):170–80.
Western Journal of Emergency Medicine 792 Articles in Press
to the Editor
Letter to the
Response to Comment on”Comparing Physician Assistant and Nurse Practitioner Practice in US Emergency Departments, 2010–2017”
Michael Darracq, MD, MPH Fred Wu, MHS, PA-C
University of California, San Francisco, Department of Emergency Medicine, Fresno, California
Section Editor: Mark I Langdorf, MD, MHPE
Submission history: Submitted August 17, 2022; Accepted August 17, 2022
Electronically published September 14, 2022
Full text available through open access at http://escholarship.org/uc/uciem_westjem DOI: 10.5811/westjem.2022.8.58423
[West J Emerg Med. 2022;23(5)793.]
Dear Editor:
We wish to express appreciation to the authors for their kind words regarding our research article.1 We also appreciate the opportunity to respond to the methodological concerns raised.
The authors raise the concern that in the data analysis subsection there are no details regarding the statistical methodology that is used to compare group differences. We feel that this is an incorrect statement. Proportions with 95% confidence intervals are an accepted and often recommended method of comparison between groups. We disagree that hypothesis testing, as suggested by the authors, is necessary as hypothesis testing and confidence intervals rely on the same underlying methodology. Statistical significance can be determined by P-values or confidence intervals. These two approaches always agree.2
In 2016, the American Statistical Association released a position paper describing the over reliance on P-values in medical research and considerable misuses and misconceptions regarding P-values. They also described the use of alternative methods that emphasize estimation over testing, such as confidence, prediction, or credibility intervals.3 We also chose to limit the number of statistical tests performed because of issues related to multiple comparisons. As more attributes are compared, the greater the likelihood of the groups being different on the basis of random sampling error alone.4 The few P-values reported are the result of the two-sample z test for proportion, the only statistical test that we, as nonprofessional statisticians, are aware of for comparing proportions. This was requested by the journal editors to support our statements regarding statistically significant differences.
The authors also cite a reference that describes ways to interpret a graph with error bars as it relates to confidence intervals and overlap in determining a P-value or statistical significance.5 No inference was performed on the basis of overlap of confidence intervals. As this was not the
methodology that was used in the present study, any description of inability to determine intergroup difference is not relevant.
Thank you for your comments and time on this important topic.
Address for Correspondence: Fred Wu, MHS, PA-C, UCSF Fresno, Department of Emergency Medicine, 155 N. Fresno Street, Fresno, California 93701. Email: frederick.wu@ucsf.edu.
Conflicts of Interest: By the WestJEM article submission agreement, all authors are required to disclose all affiliations, funding sources and financial or management relationships that could be perceived as potential sources of bias. No author has professional or financial relationships with any companies that are relevant to this study. There are no conflicts of interest or sources of funding to declare.
Copyright: © 2022 Darracq et al. This is an open access article distributed in accordance with the terms of the Creative Commons Attribution (CC BY 4.0) License. See: http://creativecommons.org/ licenses/by/4.0/
REFERENCES
1. Wu F, Darracq MA. Comparing physician assistant and nurse practitioner practice in U.S. emergency departments, 2010-2017. West J Emerg Med. 2021;22(5):1150-5.
2. Frost J. Hypothesis testing and confidence intervals. Statistics By Jim. Available at: https://statisticsbyjim.com/hypothesis-testing/hypothesistests-confidence-intervals-levels/ Accessed August 5, 2022.
3. Wasserstein RL, Lazar NA. The ASA statement on P-values: context, process, and purpose. The American Statistician. 2016;70(2):129-133.
4. Multiple comparisons problem. Wikipedia. Available at: https:// en.wikipedia.org/wiki/Multiple_comparisons_problem#References Accessed August 5, 2022.
5. Cumming G, Finch S. Inference by eye: confidence intervals and how to read pictures of data. Am Psychol. 2005;60(2):170-80.
Articles in Press 793 Western Journal of Emergency Medicine
Editor


JETem is an online, open access, peerreviewed journalrepository for EM educators. VISIT JETem.org to learn more about submissions or if you’re interested in being a JETem reviewer. CALL FOR SUBMISSIONS CALL FOR REVIEWERS Team Based Learning Podcasts Lectures Small Group Learning and Workshops Oral Boards Simulation Curricula Innovations
Championing individual physician rights and workplace fairness JOIN CAL/AAEM! BENEFITS Western Journal of Emergency Medicine Subscription CAL/AAEM News Service email updates Free and discounted registration to CAL/AAEM events And more! CAL/AAEM NEWS SERVICE Healthcare industry news Public policy Government issues - Legal cases and court decisions In collaboration with our official journal Join the CAL/AAEM Facebook Group to stay up-to-date: www.facebook.com/groups/calaaem www.aaem.org/calaaem AAEM-0720-255

APRIL 18, 2023 J O I N C A L I F O R N I A A C E P I N S A C R A M E N T O , C A T O A D V O C A T E O N B E H A L F O F O U R S P E C I A L T Y A N D O U R P A T I E N T S ! LEGISLATIVE LEGISLATIVE L L EADERSHIP EADERSHIP CONFERENCE CONFERENCE SAVE THE DATE
