
Italiana
International Journal of the Italian Association for Metallurgy
n. 10 ottobre 2022
Organo ufficiale dell’Associazione Italiana di Metallurgia.
Rivista fondata nel 1909
La Metallurgia Italiana
International Journal of the Italian Association for Metallurgy
Organo ufficiale dell’Associazione Italiana di Metallurgia. HouseorganofAIMItalianAssociationforMetallurgy. Rivista fondata nel 1909
Direttore responsabile/Chiefeditor: Mario Cusolito
Direttore vicario/Deputydirector: Gianangelo Camona
Comitato scientifico/Editorialpanel: Marco Actis Grande, Silvia Barella, Paola Bassani, Christian Bernhard, Massimiliano Bestetti, Wolfgang Bleck, Franco Bonollo, Irene Calliari, Mariano Enrique Castrodeza, Emanuela Cerri, Vlatislav Deev, Andrea Di Schino, Donato Firrao, Bernd Kleimt, Carlo Mapelli, Denis Jean Mithieux, Roberto Montanari, Marco Ormellese, Mariapia Pedeferri, Massimo Pellizzari, Barbara Previtali, Evgeny S. Prusov, Dario Ripamonti, Dieter Senk
Segreteria di redazione/Editorialsecretary: Marta Verderi
Comitato di redazione/Editorialcommittee: Federica Bassani, Gianangelo Camona, Mario Cusolito, Carlo Mapelli, Federico Mazzolari, Marta Verderi, Silvano Panza
Direzione e redazione/Editorialandexecutiveoffice: AIM - Via F. Turati 8 - 20121 Milano tel. 02 76 02 11 32 - fax 02 76 02 05 51 met@aimnet.it - www.aimnet.it
Immagine in copertina: Shutterstock
Gestione editoriale e pubblicità Publisher and marketing office: siderweb spa Via Don Milani, 5 - 25020 Flero (BS) tel. 030 25 400 06 - fax 030 25 400 41 commerciale@siderweb.com - www.siderweb.com

La riproduzione degli articoli e delle illustrazioni è permessa solo citando la fonte e previa autorizzazione della Direzione della rivista. Reproduction in whole or in part of articles and images is permitted only upon receipt of required permission and provided that the source is cited.
Reg. Trib. Milano n. 499 del 18/9/1948. Sped. in abb. Post. - D.L.353/2003 (conv. L. 27/02/2004 n. 46) art. 1, comma 1, DCB UD
siderweb spa è iscritta al Roc con il num. 26116
nd i ce
Editoriale / Editorial
Editoriale
A cura di Enrico Morgano.......................................................................................................................... pag.04
Memorie scientifiche / Scientific papers Trattamenti Termici e Rivestimenti/ Heat Treatment and Coatings
Nuovi sviluppi e applicazioni dei rivestimenti base carbonio (DLC)
P. Recanati, F. Rovere, O. Jarry pag.06
Resistenza a fatica di acciai basso legati al Cr-Mo nitrurati a bassa pressione D. Firrao, G. Ubertalli, E. Morgano, A. Brunelli, D. Sabena.................................................................... pag.12
Ottimizzazione del trattamento di bonifica per acciai forgiati attraverso simulazioni virtuali E. Anelli ........................................................................................................................................................................ pag.20
Comportamento ciclico di ricoprimenti in lega ad alta entropia CrMnFeCoNi depositati mediante cold spray P. Cavaliere, A. Perrone, A. Silvello.......................................................................................... pag.40
Off-topic
Application of Muon Radiography to Blast Furnaces: the BLEMAB project A. Lorenzon, P. Andreetto, P. Checchia, I. Calliari, L. Pezzato, F. Ambrosino, L. Cimmino M. D’Errico G. Saracino V. Masone, L. Bonechi, S. Bottai, C. Cialdai, R. Ciaranfi, O. Starodubtsev, L. Viliani V. Ciulli, R. D’Alessandro, S. Gonzi, G. Bonomi, D. Borselli, T. Buhles, F. Finke, A. Franzen, J. Sauerwald, U. Chiarotti, V. Moroli, F. Volzone, B. Glaser, B. V. Rangavittal, O. Nechyporuk, D. Ressegotti ................................................................................ pag.62
Mechanical properties and microstructure of Ti6Al4V Extra Low Interstitial alloy produced via laser and electron beam additive manufacturing processes E. Ghio, E. Cerri, M. Riccio, J. Sisti.............................................................................................................................. pag.69
Attualità industriale / Industry news
Flow field optimization in BOF based on bottom tuyeres arrangements edited by :L. Zhang, N. Ali, C. Zhang, A. Zhao, W. Zhang, B. Zhang, W. Ouyang pag.85
Atti e notizie / AIM news
17th International Conference on Semi Solid Processing of Alloys and Composites (S2P2023) pag.101
ToughSteel Workshop pag.102 Resoconto GdS “L’alluminio nell’automobile: la storia incontra il futuro” .... pag.104
Eventi AIM / AIM events ............................................................................................ pag.107 Comitati tecnici / Study groups ................................................................................ pag.109 Normativa / Standards ............................................................................................... pag.114
Italiana La Metallurgia n. 10 ottobre 2022 Organo ufficiale Italian Association for Metallurgy
n.10 ottobre 2022 Anno 113 - ISSN 0026-0843
i
“Il 39° Convegno Nazionale di Padova ha rappresentato lo spartiacque tra pre e post pandemia, in termini di organizzazione, interazione dei partecipanti e gestione degli spazi”.

"The 39th National Conference of Padua represented the watershed between pre and post pandemic, in terms of organization, interaction of the participants and managementofspaces".
TRATTAMENTI
TERMOCHIMICI INNOVATIVI A BASSA EMISSIONE DI CO2, SOSTENIBILITA’ AMBIENTALE, STATO DELL’ARTE E TECNOLOGIE INNOVATIVE, I TEMI DEL CONVEGNO NAZIONALE DI PADOVA
Nella bellissima location di Padova, sede, dal 1222, di una delle più prestigiose ed antiche Università del mondo, siamo ripartiti con gli eventi in presenza. La città dei 3 senza (santo senza nome, prato senza erba e caffè senza porte), ha visto la partecipazione di oltre 350 iscritti. Le due serate conviviali di apericena e cena, presso prestigiosi locali della città, quali il Caffè Pedrocchi e l’Osteria Antico Brolo, hanno rappresentato il miglior corollario della manifestazione. Una ripartenza in presenza che determinerà, sicuramente, un ottimo slancio per alimentare i vari comitati interni AIM.
Il denominatore comune delle varie sessioni tecniche è stato quello della sostenibilità ambientale e dell’economia circolare, affrontando tutto il perimetro
INNOVATIVE
In the beautiful location of Padua, home, since 1222, of one of the most prestigious and ancient universities in theworld,westartedagainwiththeeventsinattendance.
The city of the 3 without (nameless saint, lawn without grass and café without doors), saw the participation of over 350 members, coordinated very well by the AIM secretariat.
The two convivial evenings of aperitif and dinner, at prestigious clubs in the city, such as Caffè Pedrocchi and Osteria Antico Brolo, represented the best corollary of the event.
A restart of the in-person conferences that will certainly determine an excellent momentum to feed the various internal AIM committees.
The common denominator of the various technical
La Metallurgia Italiana - Ottobre 2022 pagina 4
THERMOCHEMICAL TREATMENTS WITH LOW CO2 EMISSION, ENVIRONMENTAL SUSTAINABILITY, STATE OF THE ART AND INNOVATIVE TECHNOLOGIES, THE TOPICS OF THE NATIONAL CONFERENCE IN PADUA
“
Enrico Morgano SILCO Srl, Rivalta TO
editoriale - editorial
della metallurgia come la siderurgia, i trattamenti termici innovativi, le tecniche additive, le leghe leggere, i biomateriali, la tribologia, la corrosione, la failure analysis e la storia della metallurgia.
Nel settore dei trattamenti termici e termochimici, le memorie hanno riguardato temi quali l’ottimizzazione dei trattamenti di bonifica, attraverso simulazioni virtuali su componenti forgiati, casi studio di ottimizzazione dei processi in campo automotive, acciai inossidabili, acciai legati da cementazione e ad alto silicio.

Per quanto riguarda gli impianti di trattamento termico, le discussioni nelle varie tavole rotonde e proseguite nei coffee break, hanno avuto al centro il tema della sostenibilità ambientale ed in particolare l’impiego di forni elettrici con basse emissioni di CO2, rispetto ai tradizionali a gas.
L’elevata flessibilità gestionale della tecnologia della cementazione in bassa pressione, sta prendendo ampie fette di mercato, in particolare nei paesi europei i cui governi hanno incentivato le sostituzioni dei forni a gas, come in Francia e Germania.
Dal punto di vista metallurgico, l’assenza dell’ossidazione intergranulare, dovuto alla quasi assenza di pressione atmosferica, permette di migliorare la resistenza meccanica a fatica, rispetto al processo tradizionale; ciò potrebbe rappresentare, per il progettista, una carta importante per poter scegliere un acciaio più economico (Mn-Cr) rispetto alle classiche leghe ternarie al (Cr-NiMo).
La successiva tempra in gas anziché in olio, completa la scelta e permette di cogliere tutti i vantaggi dal punto di vista ambientale, di processo e di prodotto.
sessions was that of environmental sustainability and the circular economy, addressing the entire perimeter of metallurgy such as steel, innovative heat treatments, additive technologies, light alloys, biomaterials, tribology, corrosion, failure analysis and the history of metallurgy.
In the field of heat and thermochemical treatments, the memories covered topics such as the optimization of quenching and tempering treatments, through virtual simulations on forged components, case studies for the optimization of processes in the automotive field, stainless steels, alloy steels for case-hardening and high silicon.
As for the heat treatment plants, the discussions in the various round tables and continued in the coffee breaks, focused on the theme of environmental sustainability and in particular the use of electric furnaces with low CO2 emissions, compared to traditional gas .
The high management flexibility of low pressure carburizing technology is taking large slices of the market, particularly in European countries whose governments have encouraged the replacement of gas ovens, such as in France and Germany.
From a metallurgical point of view, the absence of intergranular oxidation, due to the almost absence of atmosphericpressure,allowstoimprovethemechanical resistance to fatigue, compared to the traditional process; this could represent, for the designer, an important paper to be able to choose a cheaper steel (Mn-Cr) than the classic ternary alloys (Cr-Ni-Mo).
The subsequent quenching in gas instead of oil completes the choice and allows to reap all the advantagesfromanenvironmental,processandproduct point of view.
La Metallurgia Italiana - October 2022 pagina 5
Engineering the next generation of carbon based (DLC) coatings for demanding applications
P. Recanati, F. Rovere, O. JarryWithin the universe of wear resistant thin films, diamond-like carbon (DLC) coatings have emerged as the ideal solution for demanding physical applications where components are under high loads or subject to extreme friction, wear and contact with other parts. In these types of environments, only the high hardness of a DLC coating – along with a corresponding low coefficient of friction – can prevent parts from pitting, galling, seizing and ultimately failing in the field. Coatings within the DLC family can be highly engineered based on hydrogen content (hydrogenated or hydrogen-free), the selection of additional metallic and non-metallic doping elements, the presence of sub-layers and choice of deposition and bonding methods. Together, these factors can be precisely controlled to create a broad range of thin (typically 1 to 5 μ m) DLC coatings with a hardness of 8 – 80 GPa. In addition, the desired coefficient of friction, surface finish and even application temperature can also be manipulated.
KEYWORDS: DLC, PA-CVD, LOW FRICTION COEFFICIENT, WEAR RESISTANT COATING, TRIBOLOGICAL COATINGS;
C-BASED COATINGS CLASSIFICATION AND MAIN PROPERTIES
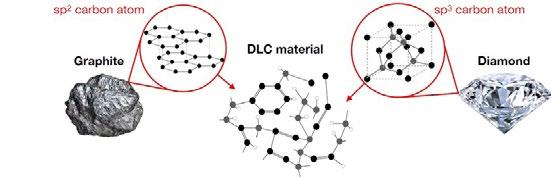
Carbon based coatings are listed in regards of the base chemical composition in the VDI 2840 [1] or ISO 20523 [2] standard norms. The next table and pictures are reporting the structures of the naturally present C-C bond types and the wide range which can be obtained artificially in a coating machine.
Paola Recanati
Product Manager Precision Components, Oerlikon Balzers Coating Italy S.p.A.
Florian Rovere
Market Segment Manager General Engineering Precision Components, Oerlikon Surface Solution AG
Olivier Jarry
Business Development Manager - Advanced Carbon Coatings, Oerlikon Balzers Coating Germany GmbH
Fig.1 - Structure of naturally present C and DLC bondings. / Schema delle ( 2) forme allotropiche naturali del carbonio e del rivestimento tipo DLC.
La Metallurgia Italiana - Ottobre 2022 pagina 6 Memorie scientifiche - Trattamenti termici e Rivestimenti
Tab.1 - Classification of the carbon films according to the VDI 2840 guideline. [1] / Classificazione dei rivestimenti base carbonio in accordo alla norma VDI 2840.
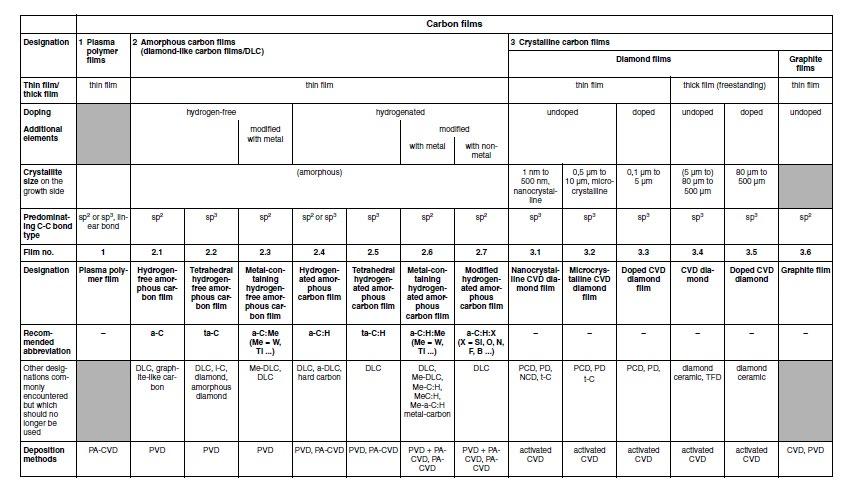
Fig.2 - Ternary phase diagram in amorphous C-H materials [3]. / Diagramma ternario di fase on leghe amorfe C-H.
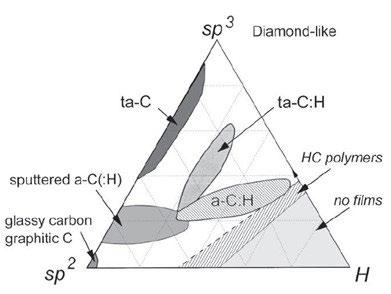
The most widely known DLC coating type, hydrogenated amorphous carbon (a-C:H), is most often applied through plasma-assisted chemical vapor deposition (PA-CVD). This deposition method causes a chemical reaction through plasma excitation and ionization that creates a coating hardness of approximately 15-30 GPa, which is on the lower end of the DLC family. These coatings can be manipulated further through doping with silicon, oxygen or metals to alter the performance and properties.
When a lower coefficient of friction is required for mated or sliding parts, or to assist in releasing items from cavities or molds, silicon doping can be a suitable approach. This creates an a-C:H:Si coating with a coating hardness of 1520 GPa. With silicon and oxygen- doping high electrical resistivity and chemical inertness can also be achieved.
Silicon-doped DLC coatings are often applied to plastic injection molds and ejector pins, blow molding parts and
La Metallurgia Italiana - October 2022 pagina 7
Scientific papers - Heat Treatment and Coatings
semiconductor wafer handling equipment.
If the DLC coatings are biocompatible and food-safe, they can be used as the ideal solution for medical instruments and food processing.
When doped with tungsten, a more ductile tungsten carbide carbon (Me-C:H) coating is created that is ideal for gear applications, ball bearings and power transmission systems that are subjected to high surface pressure and where run-in of parts may be required. On the other hand, if a harder surface is required, chromium can be used instead of tungsten.
An alternative to hydrogenated DLC coatings is a family of hydrogen-free based coatings that provide even higher hardness along with a very low coefficient of friction.
The challenge historically with hydrogen-free coatings and with ta-C deposition in particular, is that the application process produces small droplets that contribute to a rougher surface finish. As a result, coating manufacturers must complete secondary polishing processes to smoothen the surface. Because of its hardness, it is a time-consuming and expensive process that requires specialized equipment. To address this concern, some hydrogen-free DLCs are produced using a filtered cathodic arc deposition method in which an electromagnetic filter removes most droplets. Although this creates a smoother surface, a secondary polishing step is still often required, and process times are longer for the same coating thickness.
When an even smoother surface is required, hydrogen-free DLC coatings can be applied utilizing a Scalable Pulsed Power Plasma (S3p) technology.
S3p is a unique type of High Power Impulse Magnetron Sputtering (HiPIMS) technology, which can be seen as combining the advantages of the arc evaporation and sputtering methods. The very dense plasma yields hard coatings with high adhesion (at a level comparable to arc evaporation). At the same time, it results in smooth coatings due to the nature of the sputtering process, in which atoms are ejected from a target or source material.
The result is a hydrogen-free DLC coating that delivers a unique combination of high hardness, low friction and a smooth surface. The S3p technology enables the creation of coatings with a high level of “diamond” (tetrahedral) bonds with hardness up to 40 GPa (indentation hardness, HIT). In comparison, conventional DLC coatings have hardness levels in the range of 20-30 GPa for a-C:H and only 10-15 for WC/C.
The coating process operates at a lower temperature than numerous other DLC processes (< 200°C for vs up to 350°C in some cases for conventional DLC coatings). This enables the application of such coating to a much wider panel of materials, effectively bonding to aluminum and steel substrates, which opens up more options for coating applications and also lighter designs to increase performance. The higher hardness directly translates to longer component service life and higher reliability of the component.
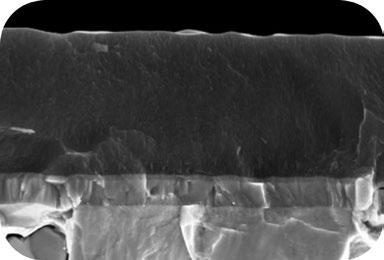
Fig.3 - SEM cross section of a S3p Hydrogen-free DLC / Sezione trasversale al SEM di DLC Hydrogen-free ottenuto con tecnologia S3p.
La Metallurgia Italiana - Ottobre 2022 pagina 8 Memorie scientifiche - Trattamenti termici e Rivestimenti
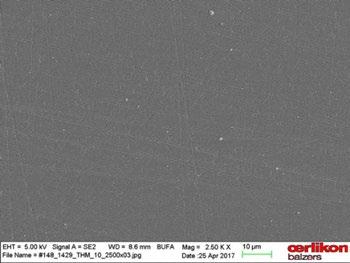
Fig.4 - SEM surface mapping of a S3p Hydrogen-free DLC / Immagine superficiale al SEM di DLC Hydrogen-free ottenuto con tecnologia S3p.
Coating as a design element
Given the number of variables involved with DLC coatings, it is important that OEMs better understand the range of options so they can select the ideal solution for the application while also taking into consideration the economics. Coatings are effectively an architecture of layers engineered to achieve specific properties. A coating is built layer by layer focused on bonding, hardness and the surface. By modifying the properties of each, one can create an
extremely wide range of surface solutions within the DLC coating family.
In the course of the last decades we have collected a wide list of successful case studies in various industries, where only one specific coating solution has successfully solved the tribological system at hand.
Carbon based coating such as BALINIT® and BALIQ® coatings cover all the possible coating composition and architecture the market can require.
Tab.2 - BALINIT® coatings properties.
Coating material Process technology Coating hardness HIT (GPA)
Typical coating thickness (µm)
Friction against steel, dry running Coating temperature (°C) Max. service temperature (°C)
BALINIT® C WC/C Sputter 8 -15 1 – 4 0.1 – 0.2 < 250 300
BALINIT® DLC a-C:H PACVD ~ 15 – 25 1 – 3 0.1 – 0.2 < 250 300
BALINIT® DYLYN a-C:H:Si PACVD ~ 15 – 25 2 – 5 0,05-0,1 180-220 350
BALIQ® CARBOS a-C S3p® 30 - 40 1 - 4 0.1 – 0.2 < 200 350
For each of the above listed coatings, a “STAR” versionwith a sputtered very ductile CrN supporting interlayer- can be selected to grant the best performances e.g., in cyclic loaded tribo-systems.
Potential applications of C-based coatings
Bearings components often suffer from severe and disproportionately distributed abrasive wear. A coating such as BALINIT® C (WC/C) is particularly suitable for case-hardening as well as ball- and roller-bearing steels because it can be applied at temperatures under 200 °C.
Similarly, cylindrical roller bearings in compressors are often exposed to low loads and vibrations, causing potential smearing. Applying WC/C coatings to the bearings removes any such possibility.
Gears experience similar wear conditions. WC/C coatings significantly reduce scuffing and pitting wear in gears as well. In fact, WC/C coatings have shown to quadruple the service life of high-speed gears.
The standard FZG C test shows that the fatigue strength is increased by 10-15% over case-hardened but uncoated gears. In the test, the failure criterion for gear service life
La Metallurgia Italiana - October 2022 pagina 9 Scientific papers - Heat
Treatment and Coatings
was defined as single-tooth wear of 4% due to pitting. The main factors in these improved figures were the lower local surface pressure (Hertzian pressure), which resulted from reduced friction in the rolling contact, and the superior running-in behavior of BALINIT® C. Coatings can also benefit worm gears, where lubrication is not always enough to protect helical-gear transmissions against friction and wear. Screw spindle-, vane-, gear-, lobe- and centrifugal pumps often function in abrasive and poorly lubricating media. This may be cooling media in grinding machines such as screw pumps and internal gear pumps. BALINIT® coated screws provide the ideal combination of hardness and low friction for preventing wear in such poorly lubricated conditions. Similarly, industrial compressor components, such as re-
ciprocating pistons, screws or valve plates can undergo extensive wear when oil-free operation, dry gases, refrigerants, high or low temperature limit the use of lubricants. In the food and beverage industry, where soft austenitic stainless steels are used widely, environmentally friendly BALINIT® coatings can improve significantly the surface performances without damaging the substrate corrosion resistance, especially when compared to Cr plating. One of the most demanding environments is high performance vehicles. Coatings play a pivotal role by reducing friction and adding surface hardness to ultimately reduce wear. New, advanced carbon coatings such as BALIQ CARBOS, providing unmatched hardness, smoothness and adhesion are going to create a new performance standard in high-wear components in supercars, motorbikes and professional motorsports.
BIBLIOGRAPHY
[1] VDI-Richtlinie 2840, Carbon Films—Basic Knowledge, Film Types and Properties (VDI, Düsseldorf, 2005)
[2] ISO 20523 : 2017 Carbon based films – Classification and designations
[3] J. Robertson, Mater. Sci. Eng., R37 (2002) 129-281
Nuovi sviluppi e applicazioni dei rivestimenti base Carbonio (DLC)
Nell’ambito dei film sottili ad elevata durezza e resistenza all’usura, la tipologia diamond- like carbon (DLC), per la loro elevata durezza e ridottissimo coefficiente di attrito, si sono molto spesso distinti come la soluzione ideale nei sistemi meccanici ove i componenti si muovono di moto relativo ad elevate pressioni di contatto, quindi ad elevato rischio di usura e grippaggio, che in ultima analisi possono determinarne un precoce fallimento. I rivestimenti base carbonio DLC sono più propriamente definibili come famiglia: contenti o meno idrogeno, dopati o meno con elementi metallici. Possono essere depositati secondo l’architettura più adatta a soddisfare quella richiesta applicativa in esercizio. Ad esempio, la creazione di specifici strati di adesione e/o supporto allo strato funzionale più esterno, può fare la differenza in sistemi sollecitati ciclicamente. Tutti questi fattori, insieme alla tecnologia con cui vengono depositati, possono essere controllati per ottenere una vasta gamma di soluzioni in termini di spessore (tipicamente 1-5 micron), durezza (8-80 GPa), coefficiente di attrito, finitura superficiale e temperatura di deposizione.
La Metallurgia Italiana - Ottobre 2022 pagina 10 Memorie scientifiche - Trattamenti termici e Rivestimenti
PAROLE CHIAVE: DLC, PA-CVD, BASSO COEFFICIENTE DI ATTRITO, RIVESTIMENTI RESISTENTI ALL’USURA, RIVESTIMENTI TRIBOLOGICI;
TORNA ALL'INDICE >
Organised by
Six years after the successful first conference on the topic, AIM, in cooperation with its sister society ASMET, organises once again a two-day event focused on the Surface Quality of continuously cast products. The surface quality of ingots, billets, blooms and slabs is a particularly important issue in order to insure the required surface quality of final rolled and forged products. This aspect is becoming increasingly significant especially nowadays, when a lot of steelmakers are refocusing their activity on the search for better surface quality or new specialty steels requiring high quality surface features. All this lays on a table of new challenges faced by steelmaking industries, when energy efficiency and consequently lower environmental impact are concerned. This international meeting aims at sharing the knowledge about the improvement of the surface quality of the continuously cast products and this scope will be achieved by clear expositions about:

• recent advances on the defect analysis; • the root cause of the defects; • innovative lubricating products;
• operations and maintenance;
• application of electromagnetic devices;
• AI applications, simulation and computing methods.
Registrations are open!
The workshop’s programme, featuring several interesting presentations by renowned University and Industry speakers, is published on the workshop website. Register by November 14 for early bird registration fees.
The Conference will be held in Bergamo at the Congress Center Giovanni XXIII, viale Papa Giovanni XXIII, 106 (http://www. congresscenter.bg.it). Bergamo greets visitors with its Venetian Walls. Surrounded by rivers and lush, verdant valleys, crossed by paths that widen to Parco dei Colli, the area’s largest park, the city looks like a lounge filed with art, culture and nature, with a fascinating and complex history just waiting to be shared with others. The “upper and lower” city reveals a mixture of pleasant surprises and unexpected encounters, such as those with Gaetano Donizetti, the great composer of international renown, Bartolomeo Colleoni, the Bergamo leader who served under the Republic of Venice and Lorenzo Lotto, among the most famous Italian Renaissance artists who lived and worked in Bergamo for over a decade.
Associazione Italiana di Metallurgia
Via F. Turati 8 - 20121 Milan - Italy t. +390276397770 • t. +390276021132 met@aimnet.it
www.aimnet.it/iwsq-2.htm
Fatigue resistance of low pressure nitrided Cr-Mo low alloy steels
D. Firrao, G. Ubertalli, E. Morgano, A. BrunelliFatigue resistance of steel parts can be improved by nitriding, the more the deeper is the layer affected by nitrogen diffusion, as stated by the Lessells-Firrao law. Low-pressure nitriding has been applied to wheel's hubs fabricated with a quenched and tempered Cr-Mo low alloy steel. N diffusion depths have been compared to similar results obtained with the same type of automotive parts subjected to classical gas nitriding. 12 h total low-pressure treatment time provided an almost 100% increase of hardened depth over 40 h gas nitrided parts. Both treatments allowed reaching an adequate fatigue life, whereas induction hardened parts did not. X-ray diffraction analysis provided phase constitution of top converted layers in both nitriding cases. A rationale based on the effect of early treatment stage top layer formation has been developed.
INTRODUCTION
The thermochemical treatment of nitriding or nitrocarburizing allows to obtain on the steel surface the formation of a thin surface layer, where γ '-Fe4N nitrides or crystals of the ε -solid solutions of the C-Fe-N system predominate. Both of these phases are characterized by slight or much higher hardness values as compared to the material that is subjected to nitrogen enrichment treatment. A thicker nitrogen diffusion layer with the precipitation of carbides or nitrides of various types follows. The formation of nitrides and carbonitrides occurs as a result of nitrogen enrichment of the steel original constituents, mainly ferrite and cementite (taking into account the metastable ternary phase diagram, Fig. 1), which, by reaching the saturation limit, cause phase changes in the material.
The surface enrichment of atomic nitrogen and the formation of these new phases leads to atomic enrichment and to a situation of atomic compression that generates negative residual stresses in the surface layers of the material, whose origin has been attributed to volume changes (precipitation and content evolutions) and thermal effects [1,2,3]. However, the mechanical components do not show substantial overall dimensional changes and do not require grinding subsequent to surface treatments.
Firrao, G. Ubertalli
DISAT, Politecnico di Torino, Torino
E. Morgano
Centro Ricerche Fiat, Torino, (ora Silco Srl, Rivalta (TO))
A. Brunelli
Tra.Ind Srl, Nichelino (TO)
La Metallurgia Italiana - Ottobre 2022 pagina 12 Memorie scientifiche - Trattamenti termici e Rivestimenti
KEYWORDS: NITRIDING; LOW PRESSURE NITRIDING; FATIGUE RESISTANCE; X-RAY DIFFRACTION; DIFFUSION DEPTHS;
D.
After the nitriding or nitrocarburizing treatment, the material shows a high surface hardness, a low tendency to scratch, a high resistance to wear, an increase in the fatigue limit and a good corrosion resistance in atmospheric,
pure water and steam environments [4,5,6].
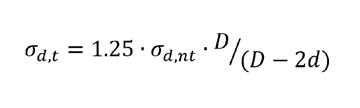
The increase in fatigue strength of the nitrided components is described by the following Lessells-Firrao law [7], (1)
σ d,t and σ d,nt represent the endurance limits under rotating bending for treated and untreated steel bars, respectively; D is the bar diameter and d the nitrogen diffusion layer thickness, respectively.
This relationship highlights that the deeper is the layer affected by nitrogen diffusion (d), the greater the fatigue strength ( σ d,t).
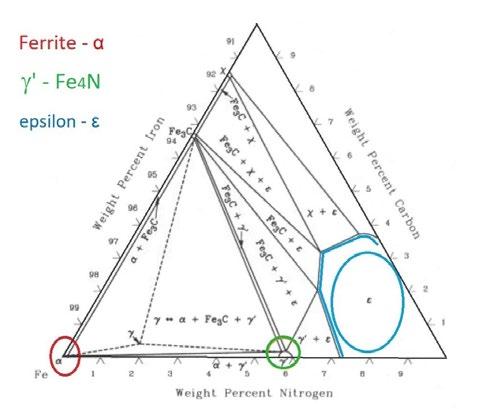
Fig.1 - Metastable Fe-C-N diagram isothermal section at 565 °C [8]. In the evidenced colored areas, there are shown the fields of existence of the ferrite, Fe4N- γ ’ and epsilon phases respectively.
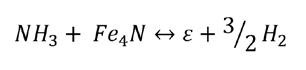
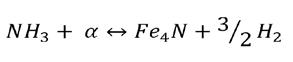
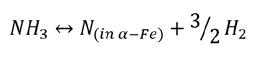
To provide nitrogen to the steel surface by a gaseous environment, the use of ammonia is necessary, by the following dissociation reaction (catalysed by Fe itself):
(2)
When N saturates α -Fe, the following successive reactions set in: (3) (4)
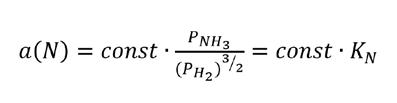
All the three reactions yield the same formal expression for the nitrogen activity a(N), (5)
La Metallurgia Italiana - October 2022 pagina 13
Scientific papers - Heat Treatment and Coatings
where obviously the constant varies with the reaction and the temperature; the nitrogen activity refers to the specific phase that is considered in the reactions (2, 3 or 4). The ratio PNH3/PH2 3/2 is often referred to as the nitriding poten-
tial and it is indicated as K N. The nitrogen activity, a(N), is first-order proportional to the ammonia partial pressure.
By writing Eq. 5 in terms of molar fractions, the following equation is obtained (6)
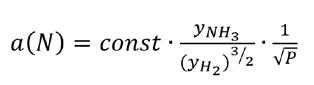
Eq. 6 shows that, by reducing the overall pressure (P), the nitrogen activity of the solids is increased, as well as the nitriding potential [9]; the equilibrium goes towards a higher nitrogen activity, i.e. a greater content of the nitrogen in the formed phases, especially in case of the ε solid solution, which has the largest field of stability. Furthermore, by lowering the pressure, the diffusion kinetics in the gaseous phase layer in contact with the surface of the components increase, because the thickness of the gaseous boundary layer increases, favoring mass transport and leading to an increase in the deposition rate. [10]
EXPERIMENTAL
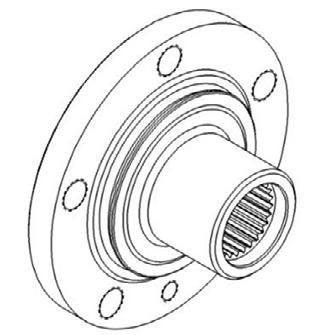
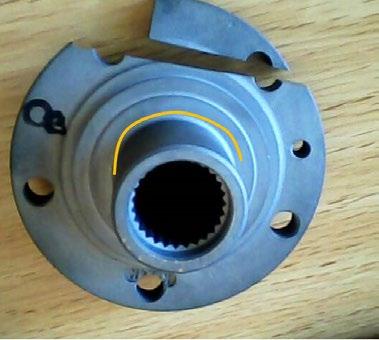
Wheel hubs of extensive production for the automotive field (Figs. 2 and 3 show the axonometric view and the real image of the component), fabricated with 42CrMo4 (EN ISO 683-2:2016) low alloy steel, roughly corresponding to SAE 4140, have been subjected to three different surfa-
ce hardening treatments. All the mechanical components had previously been quenched and tempered at 600°C. In particular, a first group of components was subjected to induction surface hardening, followed by low temperature tempering and shot peening in a specific area, highlighted in Fig. 3 with a yellow line (required hardness > 52 HRC). This is the area subjected to fatigue failure in case of the usual operating conditions of the wheel hubs.
A second group of components taken from the same batch was subjected to a gaseous 1 bar nitriding treatment with a two-stages process: a first stage at 510 °C for 20 h and with nitriding potential KN = 2.97 and a second one at 530 °C for 20 h and with a nitriding potential of KN = 0.77. A third one was subjected to a low-pressure nitriding treatment with a cycle with a first step at 520 °C for 6 h and with KN = 4.8; in the second step the temperature was 550 °C with KN = 0.79. The total process duration was 15 h at pressures that varied from 0.3 to 0.8 bar during the process.
Fig.2 - 3D view of the wheel’s hub.
Fig.3 - Real image of the wheel’s hub after nitriding and sample cutting for metallographic analysis. The yellow line shows the notch area subjected to induction hardening and shot peening.
La Metallurgia Italiana - Ottobre 2022 pagina 14
scientifiche -
e Rivestimenti
Memorie
Trattamenti termici
Scientific papers - Heat Treatment and Coatings
Taking into consideration the K N nitriding potential of the conventional treatment at 1 bar, it is possible to position the working conditions for the first stage (•) and for the second stage ( ⃰ ) on the Lehrer diagram [11] which represen-
ts, for different degrees of dissociation of the ammonia (different NH3/H2 ratios), the thermodynamic conditions among the NH3 e H2mixtures, the treatment temperatures and the phases in equilibrium.
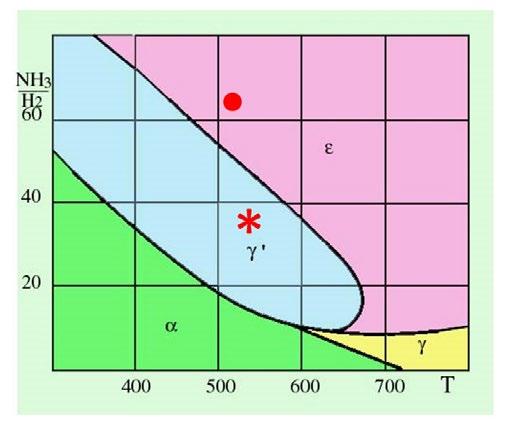
Fig.4 - Lehrer diagram for NH3 - H2 gas mixtures in equilibrium with solids of the Fe-N system ( P = 1 bar). On the diagram the nitriding potential conditions for the first (•) and second ( ⃰ ) stage in case of conventional nitriding treatment are reported.
The wheel hubs were analyzed by the Optical Emission Spectrometer (OES) - GNR—MetalLab32; in Table1 the chemical composition of the wheel hubs is reported. The results confirm that the steel is a 42CrMo4. 42CrMo4 C Si Mn Mo Cr Fe 0.43 0.27 0.82 0.21 1.03 bal.
Tab.1 - Chemical composition of the 42CrMo4 Steel (mass pct.)
After the three surface hardening treatments, the wheel’s hubs underwent rotating bending fatigue tests, with both constant radial (1055 daN) and axial loads (844 daN). Endurance up to 600,000 cycles was considered successful. Wheel’s hubs subjected to conventional or low-pressure nitriding treatments passed the fatigue limit test of 600,000 cycles, whereas most of the locally hardened induction hardened, stress relieved and shot peened hubs failed before the 600,000 cycle limit exactly at the hardened notch marked with a yellow line in Fig. 3. Given the results obtained from the fatigue tests, in order to better understand the constitution of the surface hardened layers, some samples of the wheel hubs, subjected
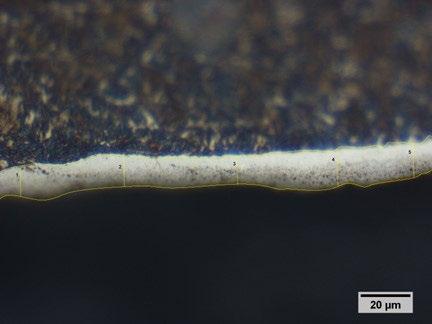
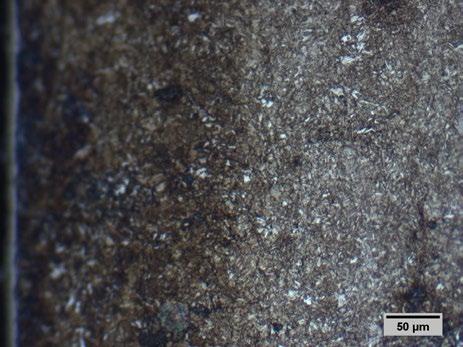
to conventional or low-pressure nitriding treatments, were subjected to metallographic and hardness analysis, as well as roentgenographic tests by a Rigaku D-MAX III diffractometer equipped with Co anode, K α 1 = 0.178899 nm, and with carbon monochromator. The metallographic observations carried out on the polished and etched transverse sections of the samples allowed to highlight the presence, for both nitriding treatments, of a homogeneous white layer – Fig. 5 -, which was found to be 12-14 μ m deep with a porosity of about 50% (Table 2). Below this layer, a thicker nitrogen diffusion layer can be observed- Fig. 6.
La Metallurgia Italiana - October 2022 pagina 15
Fig.5 - Metallographic image of the white layer of a low-pressure nitrided hub.
Fig.6 - Metallographic image of the diffusion layer of a low-pressure nitrided hub.
Tab.2 - Surface and core hardness, effective hardening depth and white layer thickness with porosity percentage after nitriding processes.
Nitriding
Surface hardness [HV 1] Core hardness [HV 10] Effective depth [mm] Top layer depth [μm]
Low pressure 732 - 752 298 - 302 0.45 12 - 14 (50% porous) Conventional 650 - 672 298 - 302 0.27 12 – 14 (50% porous)
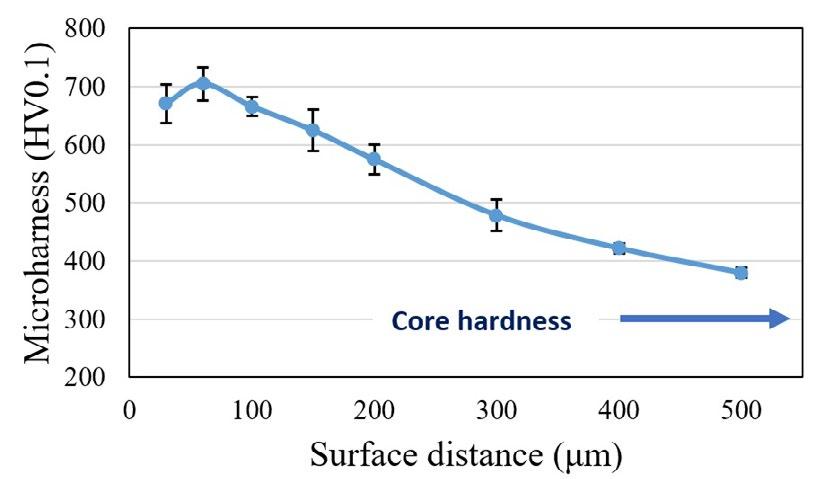
The hardness tests, carried out on the surface (load 1 kg) and at the core (load 10 kg), show that the low-pressure nitriding treatment yields higher surface hardness values (about 80 HV1 points) than the conventional one. Microhardness test profiles with 100 g load were carried
out on the transverse section of metallographic samples, what allowed to evaluate the effective hardening depth, determined at 100 HV more than the core hardness – Fig. 7.
La Metallurgia Italiana - Ottobre 2022 pagina 16 Memorie scientifiche - Trattamenti termici e Rivestimenti
Fig.7 - Low pressure nitriding microhardness profile and standard deviation ranges (HV 0.1).
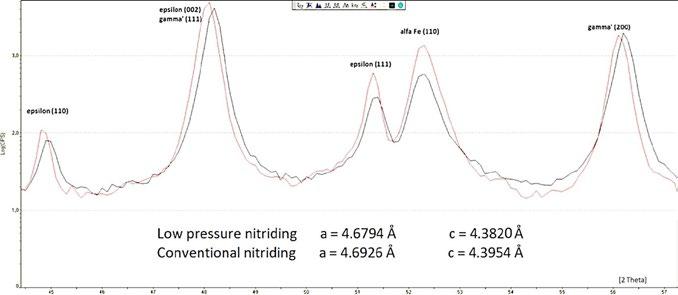
The wheel hubs, atmospheric and low-pressure nitrided, were analyzed by X-ray diffractometric methods to evaluate the constitution of the phases in the surface layers. The peaks of the ε phase and of the γ ’ phase in the white layer
and that of the α -ferrite peaks, present in the diffusion layer, were detected, confirming the modest thickness of the top layer, Fig. 8.
Fig.8 -X-ray diffraction spectra of low-pressure (------ black line) and conventionally (------ red line) nitrided samples. Below the background, the derived cell parameters of the ε -phases are reported.
The quantitative evaluations of the percentage of the three phases in the layers were carried out by measuring the areas underlying the roentgenographic peaks and by comparing them with the values obtained with mixtures of powders used as standards. In the case of hubs subjected to low pressure nitriding, it was possible to quantify as 17% the amount of the ε phase, as 60% that of γ '-Fe4N and as 23% that of α -ferrite present in the substrate. In the case of the
conventional nitriding treatment, the quantitative analysis shows 21% of the ε phase, 52% of γ '-Fe4N, and 27% of α -ferrite. The higher γ '-Fe4N phase content in the surface layer in case of the low-pressure nitriding treatment is also reflected by the higher surface hardness obtained.
From the positions of the peaks of the ε phases, the lattice constants a and c of the hexagonal cell were computed. The hexagonal lattice parameters result slightly smaller in
La Metallurgia Italiana - October 2022 pagina 17 Scientific papers - Heat Treatment and Coatings
the case of the low-pressure nitriding treatment, as reported in Fig. 8.
By using the diagram of Fig. 9, it was possible to derive the atomic interstitial content (C+N) in the epsilon phases for
both treatments, obtaining values of 25.2% in the case of low-pressure nitriding, and 25.7% in the conventional one.
Fig.9 -Graph reporting the relation between the (C+N) at % content and the hexagonal lattice parameters of ε phases [12].
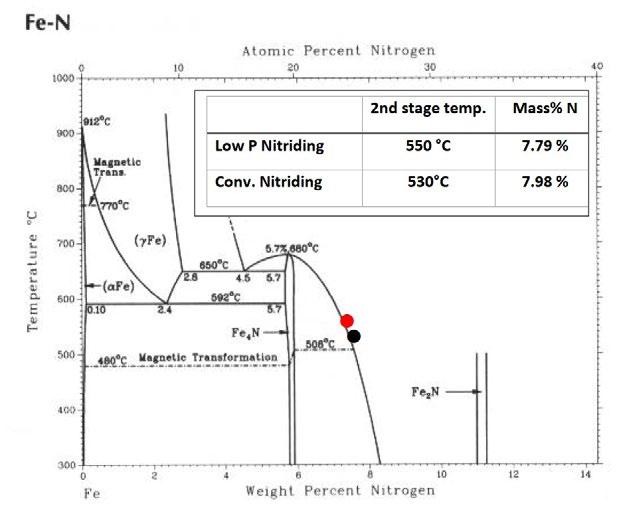
Assuming that the C content in the ε phase is the same for both the treatments, it follows that the nitrogen content is lower in the case of the low-pressure treatment, which reflects a higher temperature last stage (Fig. 10).
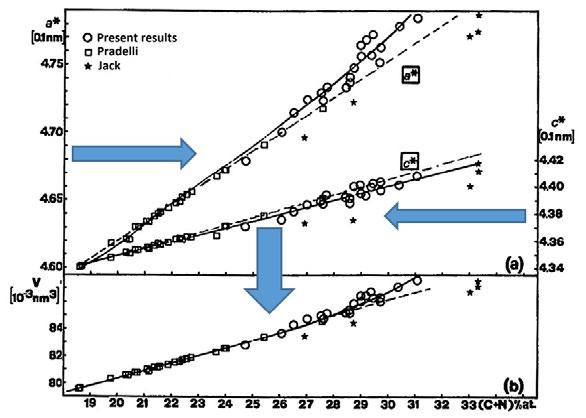
Fig.10 -Metastable Fe-N phase diagram and the mentioned nitrogen concentration for low-pressure ( • ) and conventional ( • ) treatments.
La Metallurgia Italiana - Ottobre 2022 pagina 18
Memorie scientifiche - Trattamenti termici e Rivestimenti
CONCLUSIONS
The most important findings of the experimental work on surface hardening treatments, carried out on 42CrMo4 steel (AISI 4140 steel) wheel hubs for automotive use, can be summarized as follows: Both the thermochemical treatments have made possible to obtain a fatigue life exceeding the prescription of 600,000 cycles, unlike the induction hardening plus shot peening treatment.
The low-pressure nitriding treatment allowed the formation of a hardened surface layer with a greater hardness of
REFERENCES
[1] L. Barrallier, J. Barrallis: Proceedings of ICRS4 (1994), 498-505.
about 80 HV1 points, with a nitriding treatment time of only 15 h, compared to 40 h of the conventional nitriding treatment.
Finally, the actual depth of hardening, measured with the conventional hardness of 100 HV points higher than that of the component core one, shows an almost double thickness, reaching 0.45 mm. By the Lessells-Firrao law, it indicates that the low-pressure fatigue endurance can be much higher than the one pertaining to conventional 1 bar nitriding.
[2] H. Oettel, G. Schreiber: AWT-Tagungsband, Wiesbaden, Germany (1991), 139-151.
[3] E.J. Mittemeijer, A.B.P. Vogels, P.J. van der Schaaf: J Mater Sci, Vol. 3 (1980), 153.
[4] H.C.F. Rozendaal, P.F. Colijn, E.J. Mittemeijer: Surf Eng, Vol. 5 (1985), 30.
[5] E.J. Mittemeijer: J Heat Treat, Vol. 3 (1983), 114.
[6] E.J. Mittemeijer: Mater Sci Forum, Vol. 223 (1992), 102-104.
[7] D. Firrao, D. Ugues, Mat. Sc. And Eng. A, Vol. 409 (2005), 309-316.
[8] ASM Handbook: Alloy Phase Diagram - Editor: George F. Vander Voort – ASM International -Volume 3 (2004).
[9] D. Jordan, H. Antes, V. Osterman, T. Jones, Vacuum nitriding of 4140 steel, Heat. Treat. Prog. Vol. 3–4 (2008), 33–38.
[10] Wolowiec-Korecka, Michalski, Kucharska, Kinetic aspects of low-pressure nitriding process, Vacuum Vol. 155 (2018), 292-299.
[11] E. Lehrer, Zeitschrift fuer Elektrochemie und Angewandte Physikalische Chemie Vol. 36, (1930), 383.
[12] A. BURDESE, D. FIRRAO, M. ROSSO, Gazz. Chim. Ital., Vol. 113 (1983), 265-268.
Resistenza a fatica di acciai basso legati al Cr-Mo nitrurati a bassa pressione
La resistenza a fatica dei componenti in acciaio può essere migliorata con il trattamento di nitrurazione, in entità tanto maggiore quanto più profondo è lo strato interessato dalla diffusione dell'azoto, come stabilito dalla legge di Lessell-Firrao. La nitrurazione a bassa pressione è stata applicata a mozzi di ruote fabbricati con un acciaio a bassolegato al Cr-Mo bonificato. Le profondità di diffusione dell’azoto sono state confrontate con quelle ottenute sullo stesso tipo di parti automobilistiche soggette alla classica nitrurazione a gas. Il tempo totale di trattamento a bassa pressione, di 12 ore, ha fornito un aumento di quasi il 100% della profondità indurita, rispetto alle 40 ore richieste per le parti nitrurate a gas. Entrambi i trattamenti hanno consentito di raggiungere un'adeguata durata a fatica, mentre i pezzi temprati ad induzione no. L'analisi della diffrazione dei raggi X ha fornito la costituzione degli strati superiori formatisi in entrambi i casi di nitrurazione. È stata illustrata la logica basata sull'effetto della formazione dello strato superiore nella fase iniziale del trattamento.
La Metallurgia Italiana - October 2022 pagina 19 Scientific papers - Heat
Treatment and Coatings
PAROLE CHIAVE: NITRURAZIONE, NITRURAZIONE A BASSA PRESSIONE, RESISTENZA A FATICA, DIFFRAZIONE, PROFONDITÀ DI DIFFUSIONE; TORNA ALL'INDICE
>
Ottimizzazione del trattamento di bonifica per acciai forgiati attraverso simulazioni virtuali
E. AnelliUn modello bidimensionale proprietario (2D) è stato sviluppato, calibrato e applicato a forgiati di forma semplice per prevedere la loro evoluzione termica e microstrutturale durante il trattamento di tempra e rinvenimento (Q&T). Le trasformazioni di tipo diffusivo sono state calcolate suddividendo la curva di raffreddamento in una serie di micro-isoterme e applicando le leggi di evoluzione dell’austenite (es. JMAK) valide in condizioni isoterme. La percentuale di martensite è stata calcolata in funzione del sottoraffreddamento al di sotto della temperatura di inizio formazione della martensite. Anche il software 3D FEM DEFORM-HT, in grado di calcolare il campo di sollecitazioni durante la tempra, è stato specializzato per gli acciai di interesse. I calcoli hanno mostrato un buon accordo con i dati sperimentali. L'efficacia della modellazione nel determinare le condizioni ottimali di Q&T, raggiungendo la microstruttura e il livello di resistenza desiderati, è presentata con riferimento a componenti forgiati in acciaio per i settori dell’energia e dell'oil & gas.
INTRODUZIONE
La tempra è un processo di trattamento termico industriale in cui un acciaio, dopo essere stato riscaldato a temperature relativamente elevate per formare austenite e dissolvere completamente o parzialmente i carbo-nitruri, viene rapidamente raffreddato a velocità tali da trasformare la maggior parte dell'austenite in martensite [1,2].
I parametri principali del processo di tempra sono la temperatura e il tempo di austenitizzazione e la velocità di raffreddamento [1-4]. Per una data composizione dell'acciaio, stabilite le condizioni di austenitizzazione (ossia le dimensioni dei grani austenitici), esiste una velocità di raffreddamento critica al di sopra della quale l'austenite si trasforma completamente in martensite, senza la formazione di altri costituenti come bainite, perlite e ferrite. In pratica, quando un componente in acciaio di grandi dimensioni viene temprato, generalmente immergendolo in un mezzo liquido (acqua, olio, acqua e polimero, ecc.), la superficie si raffredda più rapidamente del cuore. Ciò significa che la regione vicina alla superficie, raggiungendo delle velocità di raffreddamento superiori a quella critica si trasforma in martensite, mentre la regione centrale
La Metallurgia Italiana - Ottobre 2022 pagina 20 Memorie scientifiche - Trattamenti termici e Rivestimenti
PAROLE CHIAVE: ACCIAIO, FORGIATI, TEMPRA, RINVENIMENTO, SIMULAZIONE NUMERICA, TRASFORMAZIONE DI FASE, MICROSTRUTTURA, DUREZZA, RESISTENZA, TENSIONI RESIDUE;
Ettore Anelli
Franchini Acciai SpA, Mairano (BS)
papers - Heat Treatment and Coatings
che si raffredda meno velocemente può presentare una microstruttura mista contenente anche bainite ed eventualmente ferrite e perlite, a seconda della temprabilità dell'acciaio.
Durante la tempra, i gradienti termici e i cambiamenti di volume associati alle trasformazioni di fase inducono tensioni interne e quindi distorsioni nel componente [5].
La tempra è seguita dal rinvenimento a una temperatura inferiore a Ac1 per ridurre le tensioni residue e migliorare la tenacità e la duttilità del materiale [6,7].
Lo sviluppo della tecnologia informatica negli anni '90 e i notevoli sforzi compiuti negli ultimi vent'anni per prevedere l'evoluzione termica e microstrutturale durante il trattamento termomeccanico degli acciai hanno permesso di disporre di una sofisticata modellazione dei fenomeni termici, metallurgici e meccanici e dei loro accoppiamenti. Oggi, diversi programmi informatici possono essere utilizzati per applicazioni industriali. I pacchetti software agli elementi finiti (FEM) come ad esempio ABAQUS, ANSYS, NASTRAN, ecc.) sono in grado di prevedere il trasporto di calore insieme con le sollecitazioni e le deformazioni/ distorsioni. Oggi sono disponibili in commercio sistemi di modelli, come SYSWELD [8], DEFORM-HT [9-11] e DANTE [12-15]. DEFORM-HT è un pacchetto software, che incorpora un solutore a elementi finiti, mentre DANTE è un insieme di subroutine utente che richiede i solutori a elementi finiti ABAQUS o Kiva. Le modifiche ai parametri di processo e dei materiali da trattare sono limitate in genere dalla scelta disponibile nel database del programma. Per contro, alcune esigenze di ricerca e sviluppo sono meglio soddisfatte da un software aperto. Al giorno d'oggi, nonostante i miglioramenti nella modellazione numerica, il processo di Q&T dei forgiati in acciaio per ottenere determinate microstrutture e proprietà meccaniche è spesso progettato in base alle esperienze relative a precedenti produzioni. Pertanto, potrebbero insorgere problemi qualitativi per scarsa resistenza/tenacità, oppure per formazione di cricche da tempra, in particolare nel caso di grossi forgiati. Nel presente lavoro, sono stati sviluppati e messi a punto diversi algoritmi per calcolare, a partire dai parametri di processo, l'evoluzione termica e microstrutturale di forgiati in acciaio durante il trattamento termico di tempra e di rinvenimento. È stato sviluppato, calibrato e applicato
un modello termico-metallurgico bidimensionale (2D), a volumi finiti, per componenti di forma semplice. Anche il software commerciale FEM 3D DEFORM-HT, in grado di calcolare il campo di sollecitazioni durante la tempra, è stato specializzato per gli acciai di interesse e per vari impianti di tempra industriali.
Dopo aver descritto gli approcci di modellazione e le attività di specializzazione e validazione svolte, sono mostrate le capacità previsionali ed alcuni esempi applicativi con riferimento a componenti forgiati per i settori dell’energia e dell'oil & gas. È possibile valutare microstrutture e durezze nello spessore/raggio, senza la necessità di prove industriali preliminari. I calcoli hanno mostrato un buon accordo con i risultati sperimentali. Questo lavoro fa parte del progetto di R&S "INNOCOMP", completato nel 2020, finalizzato allo sviluppo di componenti forgiati ad alte prestazioni. Il progetto era parte di un piano di investimenti per un nuovo stabilimento in grado di realizzare prodotti personalizzati ispirati a criteri di sostenibilità ambientale [16-18].
MATERIALI E METODI Acciai
I lingotti sono stati prodotti attraverso i processi di fusione in forno elettrico, affinazione in siviera, degasaggio sotto vuoto, colaggio in sorgente. Sono stati analizzati principalmente acciai basso-legati come EN 25CrMo4, 34CrMo4, 42CrMo4, 50CrMo4, 22CrMoNiWV8-8, 30CrMoNiV5-11, 35NiCrMoV12,5 e AISI 4130. Per la convalida e l'applicazione dei modelli numerici sono stati presi in considerazione anche acciai martensitici, ricchi in Cr (8.5%-12.5%), che presentano una trasformazione di fase dell'austenite durante il raffreddamento (cioè gradi F92 e X21CrMoV12-1) e l'acciaio austenitico AISI 316 (Tab.1).
I lingotti sono stati riscaldati tra 1180 °C e 1220 °C e deformati a caldo con presse a stampo aperto.
Trattamenti termici
I trattamenti termici dei forgiati sono stati studiati sperimentalmente e simulati numericamente. I cicli tipici consistono in austenitizzazione, mantenimento a temperatura, tempra in vari mezzi (o normalizzazione, cioè raffreddamento in aria calma) e rinvenimento a temperature
La Metallurgia Italiana - October 2022 pagina 21
Scientific
inferiori ad Ac1.
Sono stati utilizzati diversi forni a camera con suola fissa, in grado di trattare termicamente pezzi forgiati di grandi dimensioni, dotati di bruciatori a basso consumo e a ridotto impatto ambientale.
I pezzi forgiati sono stati introdotti e scaricati dai forni discontinui per mezzo di caricatrici automatiche, che
migliorano la sicurezza degli operatori e consentono di realizzare tempi brevi e riproducibili di trasferimento dei pezzi dal forno alla vasca di tempra.
Due forni possono essere uniti per trattare pezzi lunghi fino a 26 m. I forni, in termini di uniformità della temperatura, sono conformi ai requisiti delle specifiche API 6A - Allegato M e AMS 2750 E.
Tab.1 - Forcella analitica (massa %) per i principali elementi degli acciai selezionati. - Chemical composition ranges (mass %) of main elements for the selected steels.
Steel C Mn Si Cr Mo Ni V Nb W Al
25CrMo4
Min 0.22 0.60 0.10 0.90 0.15 - - - -Max 0.29 0.90 0.40 1.20 0.30 - - - -34CrMo4 Min 0.30 0.60 0.10 0.90 -Max 0.37 0.90 0.40 1.20 -42CrMo4 Min 0.38 0.60 0.10 0.90 0.15 - - - -Max 0.45 0.90 0.40 1.20 0.30 - - - -50CrMo4 Min 0.46 0.50 0.10 0.90 0.15 - - - -Max 0.54 0.80 0.40 1.20 0.30 - - - -22CrMoNiWV8-8 Min 0.20 0.60 - 2.00 0.80 0.70 0.25 - 0.60Max 0.24 0.80 0.10 2.20 0.90 0.80 0.35 - 0.70 0.010 30CrMoNiV5-11
Min 0.28 0.30 - 1.10 1.00 0.50 0.25 - -Max 0.34 0.80 0.15 1.40 1.20 0.75 0.35 - - 0.010 35NiCrMoV12.5
Grade 92
Min 0.30 0.40 0.15 1.00 0.35 2.50 0.08 - - -
Max 0.40 0.70 0.35 1.40 0.60 3.50 0.20 - - -
Min 0.07 0.30 - 8.50 0.30 - 0.15 0.040 1.50 -
Max 0.13 0.60 0.50 9.50 0.60 0.40 0.25 0.090 2.00 0.02 X21CrMoV12-1
Min 0.20 0.30 - 11.0 0.80 0.30 0.25 -Max 0.26 0.80 0.20 12.5 1.20 0.80 0.35 -AISI 316 Min - - - 16.0 2.00 10.0 - - -Max 0.03 2.00 1.00 18.0 3.00 15.0 - - - -
Sono disponibili varie vasche di tempra con un volume di 800-850 m3. Come liquido di spegnimento è possibile utilizzare sia acqua che soluzioni di acqua e PolyAlkylene Glicol (PAG). La velocità di raffreddamento può essere variata in base alla temprabilità dell'acciaio e ai requisiti dei componenti, variando la concentrazione di polimero e il grado di agitazione del liquido. La temperatura delle soluzioni PAG-acqua è mantenuta nell'intervallo 30-35 °C da un sistema di riscaldamento. Per garantire una buona uniformità di temperatura del fluido di tempra, l'agita-
zione viene effettuata mediante eliche distribuite sui lati lunghi della vasca, formando due file opposte, una vicina alla parte superiore e l'altra a quella inferiore, favorendo un'adeguata circolazione del fluido. Il livello di agitazione è regolato agendo sulla potenza degli inverter che regolano la velocità del motore delle eliche. L'incremento della temperatura del liquido di raffreddamento, dovuto al calore rilasciato dalle parti calde durante la tempra, viene solitamente mantenuto al di sotto dei 5°C. In ogni caso, la temperatura del liquido di raffreddamento non supera i 40
La Metallurgia Italiana - Ottobre 2022 pagina 22 Memorie scientifiche - Trattamenti termici e Rivestimenti
°C perché se la temperatura del bagno, misurata da varie termocoppie, supera un valore target, la soluzione viene aspirata da una pompa dall'alto, trasferita a uno scambiatore di calore e reimmessa dopo il raffreddamento nella vasca dal basso.
Prove meccaniche ed esami microstrutturali
Dopo il trattamento termico, sono stati prelevati dei campioni da prolunghe o da forgiati sacrificali. Le prove di trazione e di impatto Charpy con intaglio a V sono state eseguite rispettivamente con una macchina di prova universale (Zwick/Roell Z250) e con un pendolo (Zwick/Roell RKP 450). I profili di durezza sono stati misurati nello spessore con un durometro Brinell da 3000 kg. Gli esami microstrutturali sono stati eseguiti con un microscopio ottico Olympus su campioni metallografici preparati con procedure standard. La frazione di volume dei costituenti microstrutturali è stata valutata con il metodo del conteggio a punti (point counting) secondo la norma ASTM E562.
Modello bidimensionale
Sono stati sviluppati e calibrati diversi algoritmi per calcolare l'evoluzione termica dei manufatti forgiati durante le
fasi di riscaldamento e raffreddamento. È stato sviluppato un modello termico proprietario 2D (Franchini-HT), che utilizza come solutore del campo termico un algoritmo bidimensionale a volumi finiti, in cui la maglia di calcolo viene generata con un sistema automatico. Questo modello è specifico per prodotti di forma semplice (cilindrica piena, cilindrica cava, prismatica a sezione quadrata o rettangolare) ed è adatto a prevedere l'evoluzione termo-microstrutturale di barre, alberi, tubi e piastre durante il raffreddamento. Può utilizzare due approcci a seconda delle condizioni di raffreddamento, continuo o generale (compresa la tempra interrotta), e del tipo di acciaio [16-18].
Raffreddamento continuo di acciai basso-legati Nel caso di raffreddamento continuo e acciai basso-legati, nota la velocità media di raffreddamento in un punto, calcolata con un modello termico semplificato, senza considerare in dettaglio la trasformazione di fase, la microstruttura viene determinata sulla base delle velocità critiche di raffreddamento per la formazione di frazioni definite di costituenti microstrutturali (Fig.1), stabilite mediante formule empiriche [19] e metodi di interpolazione.
Fig.1 - Velocità di raffreddamento critiche per la formazione di frazioni definite di costituenti microstrutturali stabilite da formule empiriche / Critical cooling rates for the formation of defined fractions of microstructural constituents established by empirical formulae.
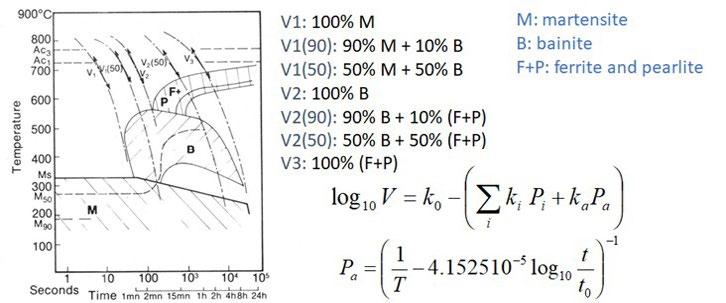
Questo approccio non richiede la conoscenza del diagramma di trasformazione isoterma (Tempo-Temperatura-Trasformazione, TTT), né sperimentale né calcolato. Inoltre, la durezza dopo il raffreddamento/tempra è sti-
mata con equazioni empiriche di letteratura originariamente sviluppate per acciai a basso e medio tenore di C (C=0.08-0.5%) con un contenuto totale di elementi di lega (Mn+Cr+Ni+Mo) inferiore al 5%. La durezza in un deter-
La Metallurgia Italiana - October 2022 pagina 23
Scientific papers - Heat Treatment and Coatings
minato punto è stimata come media pesata della durezza dei costituenti microstrutturali "puri", in base alle loro frazioni in volume. La durezza dei vari costituenti microstrutturali dipende dalla composizione dell'acciaio e dalla velocità di raffreddamento. Un altro modello empirico viene utilizzato per stimare l'effetto del successivo trattamento di rinvenimento sulla durezza [19, 20]. Solo la durezza di bainite e martensite si riduce per effetto del rinvenimento, mentre quella di ferrite e perlite non varia significativamente.
Qualsiasi tipo di acciaio e raffreddamento
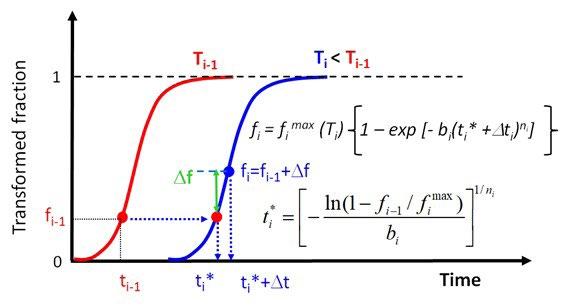
In caso di raffreddamento generale o discontinuo (ad esempio, tempra interrotta), si esegue un calcolo termo-metallurgico accoppiato utilizzando un approccio semi-empirico in cui la cinetica della trasformazione di fase è descritta dal diagramma TTT. Le formulazioni per descrivere l'evoluzione della microstruttura si basano su relazioni come la legge di Johnson-Mehl-Avrami-Kolmogorov (JMAK) [21], nel caso di costituenti formati da processi diffusivi (ad es. ferrite, perlite):
(eq.1)
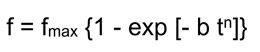
dove f è la frazione in volume del costituente al tempo t, f max è la frazione massima raggiunta in condizioni di equilibrio, b e n sono costanti per una data temperatura.
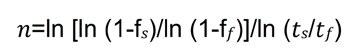
Quando è disponibile il diagramma TTT, questi parametri possono essere ottenuti mediante le seguenti relazioni: (eq.2) (eq.3)
dove f�� e f�� sono le frazioni volumetriche iniziale e finale (solitamente f��=0.01 e f��=0.99) e ���� e ���� sono i tempi di inizio e fine trasformazione a temperatura costante. Se �� nell'eq.1 rimane costante durante la trasformazione (cioè n è indipendente dalla temperatura) e b è solo una funzione della temperatura, il principio di Scheil) o regola dell’additività di Scheil) [22] può essere utilizzato per estendere il modello JMAK a condizioni non isoterme. La distribuzione della temperatura all'interno di qualsiasi regione arbitraria nel corso del tempo è ricavata utiliz-
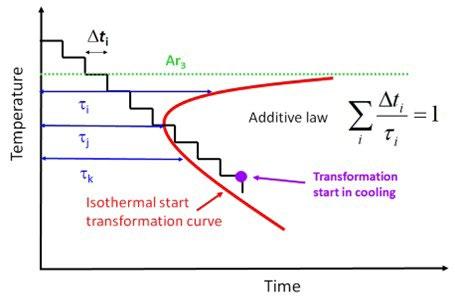
zando la legge di Fourier sulla conduzione e il trasporto del calore, insieme con la legge di conservazione dell'energia. Sono stati applicati metodi numerici per risolvere l'equazione del trasporto di calore e ottenere la distribuzione della temperatura, incorporando gli algoritmi per la descrizione delle trasformazioni di fase e il calore latente di trasformazione. L'inizio della trasformazione di fase (Fig.2a) è calcolato in base al tempo di incubazione per la nucleazione τ e alla legge additiva di Scheil [22, 23].
(a)
La Metallurgia Italiana - Ottobre 2022 pagina 24 Memorie scientifiche - Trattamenti termici e Rivestimenti
Fig.2 - (a) Inizio della trasformazione di fase in base al tempo di incubazione per la nucleazione e alla legge additiva di Scheil; (b) Calcolo della frazione trasformata approssimando il profilo termico tempo-temperatura con una sequenza di intervalli di tempo molto brevi (condizione isoterma) e utilizzando il tempo fittizio, t i*. / (a) Phase transformation start according to incubation time for nucleation τ and Scheil's additive law; (b) Calculation of the transformed fraction approximating the time-temperature thermal profile with a sequence of very short time intervals (isothermal condition) and using the fictitious time, ti*.
Secondo il principio di Scheil, la generica curva di raffreddamento è approssimata mediante incrementi di tempo infinitamente piccoli Δti. Assumendo che la frazione in volume trasformata alla temperatura Ti-1 sia nota, il tempo di trasformazione ti può essere ottenuto sommando l'incremento di tempo, Δti, e il tempo fittizio, ti*, necessario per ottenere la stessa frazione trasformata alla temperatura corrente, Ti, ossia ti = Δt + ti*, dove ti* è calcolato mediante il modello JMAK (Fig.2b).
Questo approccio è stato ampiamente adottato e in letteratura si possono trovare molti esempi, in cui vengono analizzati anche gli aspetti teorici [16-18, 23-26]. Poiché i tempi di inizio e fine trasformazione di fase in condizioni isoterme dipendono dalla dimensione dei gra-
ni austenitici e spesso si dispone di un diagramma TTT per una certa dimensione media di grano che può non coincidere con quella del trattamento di interesse, è stato sviluppato un algoritmo basato sull'approccio proposto da Kirkaldy [27], in cui l’effetto della dimensione del grano austenitico sul tempo di inizio trasformazione è espresso con un fattore 2N/8, dove N è la dimensione del grano espressa come numero ASTM.
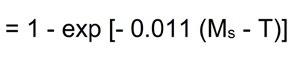
La formazione della martensite, che si sviluppa dall'austenite non trasformata, è descritta tenendo conto che è funzione solo dal sottoraffreddamento rispetto alla temperatura critica di inizio formazione della martensite (MS) mediante l'equazione proposta da Koistinen e Marburger [28, 29]:
Il modello 2D proprietario "Franchini-HT" è dotato di un modulo in grado di stimare la durezza sulla base delle frazioni volumetriche dei costituenti microstrutturali formatisi dopo raffreddamento/tempra e rinvenimento e di equazioni empiriche, simili a quelle proposte da Maynier et al. [19, 20], aggiornate in termini di coefficienti per gli acciai ad alto tenore di cromo (8-23%Cr).
Il modello proprietario 2D è veloce (il calcolo dura generalmente meno di 15 minuti) e calcola la durezza anche dopo rinvenimento, ma non fornisce informazioni su tensioni e distorsioni. Può essere efficacemente utilizzato per effettuare delle analisi preliminari di sensibilità, compreso l'effetto della dimensione dei grani austenitici, al fine di selezionare le simulazioni di trattamento termico più
La Metallurgia Italiana - October 2022 pagina 25 Scientific papers - Heat Treatment and Coatings
(b) (eq.4)
promettenti da eseguire successivamente con il software commerciale tridimensionale (3D).
Software FEM 3D
Sebbene i modelli bidimensionali (2D) possano essere sufficienti per eseguire vari studi metallurgici, nel caso di pezzi di forma complessa e asimmetrica, per il calcolo delle deformazioni/distorsioni deve essere presa in considerazione la geometria tridimensionale (3D). Inoltre, i modelli numerici per la simulazione del trattamento termico devono essere in grado di gestire condizioni al contorno complesse, dovute alla variazione del coefficiente di scambio termico (Heat Transfer Coefficient, HTC) con la temperatura superficiale e la posizione.
Il software commerciale 3D Deform-HT (versione 11.2), in grado di simulare il trattamento termico degli acciai utilizzando modelli integrati di deformazione, trasporto di calore e trasformazione di fase, è stato specializzato per gli acciai e gli impianti di tempra di interesse. In particolare, è stato applicato per la descrizione dell'evoluzione termica, microstrutturale e delle sollecitazioni di prodotti di forma complessa durante il trattamento termico.
Anche questo programma di calcolo considera l'acciaio come una miscela di costituenti microstrutturali, ciascuno con le proprie caratteristiche termomeccaniche, per definire le varie proprietà in funzione della temperatura e dei principali elementi di lega. Il modello di deformazione comprende vari approcci elastoplastici. Le trasformazioni di fase basate sulla diffusione sono descritte con le equazioni di JMAK e in base ai diagrammi TTT. Le trasformazioni di fase senza diffusione, come quella da austenite a martensite, sono rappresentate da equazioni in funzione della temperatura e dello stress. Inoltre, si tiene conto del calore latente di trasformazione e delle variazioni di volume dovute alle trasformazioni di fase. I risultati del modello includono l'evoluzione della temperatura, delle tensioni interne, della distorsione, delle frazioni volumetriche dei costituenti microstrutturali e della
durezza dopo il raffreddamento/tempra. È possibile impostare più operazioni di trattamento termico da eseguire in sequenza senza intervento manuale.
Il modello 3D, più impegnativo in termini di memoria, richiede in genere diverse ore di calcolo, ma è in grado di identificare le condizioni critiche del processo che possono portare a problemi di qualità, tra cui distorsioni eccessive e cricche da tempra. Per l'impostazione di entrambi i modelli vengono eseguite le seguenti fasi:
1. Meshing della geometria del pezzo (nel caso di Deform-HT si possono utilizzare strumenti CAD).
2. Selezione delle proprietà termofisiche, del coefficiente di espansione termica, del modulo di Young e della curva tensione-deformazione, che descrive il comportamento plastico, dal database. (le proprietà dipendono dalla temperatura e dai costituenti microstrutturali del materiale).
3. Selezione del diagramma TTT in relazione alla composizione dell'acciaio e alla dimensione dei grani di austenite. Il diagramma TTT può essere sperimentale, ottenuto da caratterizzazioni precedenti, o calcolato per una data dimensione media dei grani austenitici.
4. Inserimento dei dati di processo, come la temperatura e il tempo di austenitizzazione, il tempo di attesa in aria prima di iniziare la tempra, il mezzo di tempra, la temperatura e il tempo di rinvenimento, ecc.
5. Inserimento del coefficiente di scambio termico (HTC) per un determinato mezzo di raffreddamento. Oltre a dati di letteratura, è possibile utilizzare l'HTC effettivo per una determinata vasca di tempra (tipo di mezzo e intensità di agitazione), determinato mediante un blocco di acciaio strumentato con termocoppie. I valori di HTC sono utilizzati come condizioni al contorno dipendenti dalla temperatura e sono disponibili in un database specifico.
Determinazione dei coefficienti di scambio termico
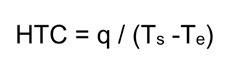
Il trasporto di calore tra un componente e l'ambiente è solitamente descritto dalla seguente equazione semplificata: (eq.5)
dove:
- HTC è il coefficiente di scambio termico [W/(m2 K)].
- q è la densità del flusso di calore [W/m2],
- T s è la temperatura della superficie del manufatto da raffreddare [K]
- T e è la temperatura ambiente [K].
Le variazioni di HTC in funzione della temperatura sono indotte da diversi fenomeni fisici che si verificano all'interfaccia tra il componente e il fluido di raffreddamento/tempra. Solitamente la determinazione di HTC durante il riscal-
La Metallurgia Italiana - Ottobre 2022 pagina 26 Memorie scientifiche - Trattamenti termici e Rivestimenti
Scientific papers - Heat Treatment and Coatings
damento in forno, il trasferimento in aria e la tempra (vari mezzi) è basato sui rilievi termici effettuati con sonde strumentate con termocoppie e metodi di analisi inversa. In primo luogo, sono stati caratterizzati diversi mezzi polimerici acquosi, misurando l'evoluzione della temperatura di una sonda cilindrica in lega Inconel 600 (UNS N06600/W. Nr. 2.4816) di geometria standard immersa in mezzi di tempra industriali in condizioni controllate di laboratorio (metodo Tensi secondo lo standard ASTM D6482) [16-18]. Il "reverse engineering" delle curve di raffreddamento è stato effettuato utilizzando il FEM per descrivere la geometria della sonda. Tuttavia, quando le condizioni fluidodinamiche tra il laboratorio e il processo industriale sono significativamente diverse e le temperature di raffreddamento sono inferiori a 40 °C, le relazioni tra HTC e temperatura devono essere migliorate. Questo risultato è stato ottenuto sulla base del valore di HTC determinato dall'analisi di Fourier inversa delle misure di temperatura effettuate su blocchi strumentati con termocoppie e raffreddati nelle vasche di tempra industriali. Questo è l'approccio preferito poiché il trasferimento di calore, soprattutto durante l'operazione di tempra, è influenzato da molti fattori, tra cui l'ossidazione della superficie, il liquido di raffreddamento (ad esempio, il tipo di polimero e sua percentuale nell'acqua), la geometria della vasca e l'intensità di agitazione del liquido di raffreddamento. Un blocco di acciaio austenitico AISI 316L, che non presenta trasformazioni di fase, è stato strumentato con cinque termocoppie per misurare le curve di raffreddamento a va-
rie profondità. I dettagli sulle prove e gli esempi dei valori di HTC in funzione della temperatura e della percentuale di polimero PAG sono riportati altrove [16-18].
Questi valori di HTC determinati durante la tempra sono specifici dell'impianto industriale utilizzato e possono essere diversi dall'HTC ottenuto con il metodo Tensi, pur utilizzando lo stesso mezzo industriale, a causa delle differenze fluidodinamiche e di temperatura. È importante disporre di un’accurata base dati sull'HTC per le varie vasche di tempra industriali, soprattutto quando, oltre all'evoluzione termica, è necessario calcolare anche le tensioni interne/residue e le distorsioni.
RISULTATI E DISCUSSIONE
Convalida del modello Evoluzione termica
Un blocco di acciaio inossidabile austenitico AISI 316L è stato strumentato con termocoppie e, dopo un riscaldamento a 900 °C, è stato immerso in una vasca industriale per alcuni minuti, quindi sollevato in aria, dove è rimasto alcuni minuti, e immerso nuovamente nel fluido di tempra agitato.
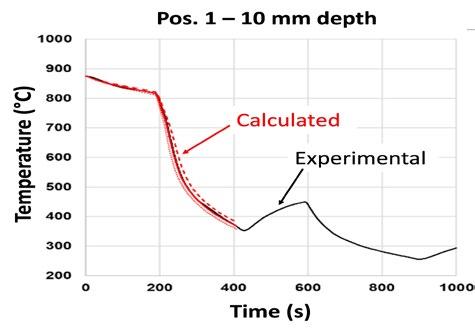
L'HTC determinato con prove di laboratorio (metodo Tensi secondo ASTM D6482), permette già di riprodurre gli andamenti termici industriali, come nell'esempio mostrato nella Fig.3a. Tuttavia, le differenze tra le temperature calcolate e quelle sperimentali si riducono significativamente se si utilizza la curva HTC determinata per la specifica vasca con prove industriali (Fig.3b).
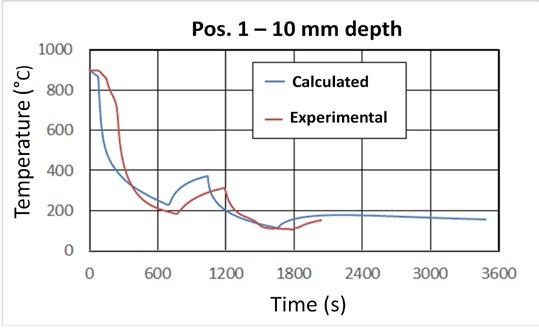
Fig.3 - Curve di raffreddamento misurate per un blocco di acciaio a 10 mm di profondità rispetto a quelle calcolate dal modello termico utilizzando l'HTC determinato con: (a) prova di laboratorio (ASTM D6482); (b) prova industriale. / Cooling curves measured for a steel block at 10 mm depth compared to those calculated by the thermal model using HTC determined by: (a) laboratory test (ASTM D6482); (b) industrial trial.
La Metallurgia Italiana - October 2022 pagina 27
Utilizzando lo stesso HTC e le stesse proprietà termiche, sia il modello 2D proprietario che il modello 3D commerciale calcolano campi termici su una sezione praticamente uguali. È stata eseguita anche una verifica sistematica, utilizzando il modello 2D, per confrontare l'evoluzione della temperatura superficiale calcolata con le misure effettuate mediante pirometri su barre tonde/alberi di vari diametri durante appositi trattamenti termici industriali. Questi materiali, dopo l'austenitizzazione, sono stati sottoposti a una sequenza di immersioni in liquido agitato, separate da emersioni in aria (cicli multipli di tempra interrotta). Durante i periodi di permanenza in aria, sono state effettuate varie misurazioni con un pirometro utilizzando un valore
di emissività costante (impostato a 0.95). Un esempio di curva di raffreddamento calcolata alla superficie di un albero in acciaio basso-legato 35NiCrMoV12-5 così trattato è mostrato in Fig.4, insieme alle misure sperimentali con pirometro.
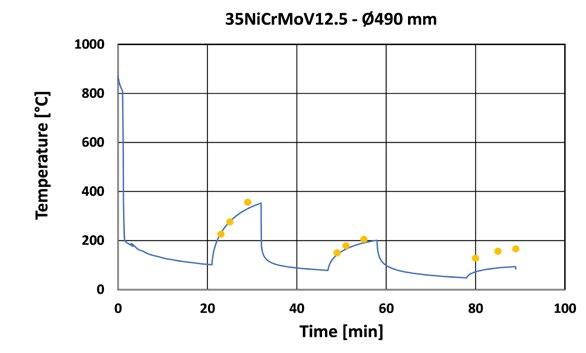
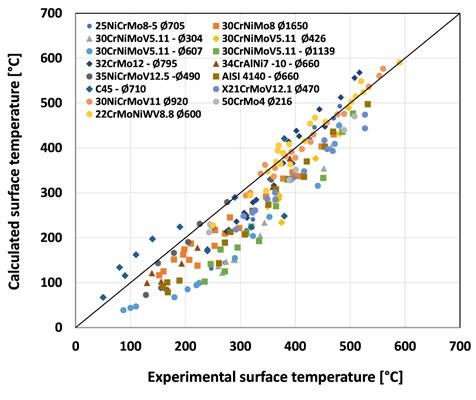
Un confronto simile è stato effettuato su vari alberi e barre di diametro compreso tra 300 mm e 1650 mm, realizzati con diversi acciai. Tutti i risultati sono riassunti nella Fig.5. Si nota una tendenza a sottostimare i valori sperimentali. Alle alte temperature superficiali il modello di calcolo sembra più accurato, mentre alle basse temperature (< 470 °C) si notano delle differenze che arrivano a volte a superare 80 °C.
Fig.4 - Esempio di curva di raffreddamento calcolata sulla superficie di un albero di 490 mm di diametro in acciaio 35NicrMoV12-5. I punti indicano le misure effettuate con il pirometro. / Example of cooling curve calculated at the surface of a shaft of 490 mm diameter in 35NicrMoV12-5 steel Experimental measurements by pyrometer are also shown as dots.
Fig.5 - Evoluzione della temperatura superficiale calcolata rispetto a quella sperimentale per alberi e barre di vari acciai con diametri diversi (ϕ in mm) durante tempra multipla interrotta. / Calculated vs experimental surface temperature evolution for shafts and bars made of various steels with different diameters (ϕ in mm) during multiple interrupted quenching.
La Metallurgia Italiana - Ottobre 2022 pagina 28
Memorie scientifiche - Trattamenti termici e Rivestimenti
Questo risultato può essere attribuito a vari effetti: − accuratezza delle misure pirometriche, che sono influenzate dalla distanza, dalle condizioni superficiali dei pezzi e dalla presenza di vapore; − emissività, che cambia quando la temperatura superficiale diminuisce.
Tuttavia, queste prove industriali, nonostante le difficoltà nelle misurazioni di temperatura, indicano che il modello è sensibile alle variazioni di processo, come il tempo di immersione nel fluido di tempra e il periodo di mantenimento in aria, ed è in grado di fornire indicazioni utili sull'evoluzione termica durante i trattamenti termici industriali.
Durezza
Per la validazione del modello nel caso di raffreddamento continuo di acciai basso-legati, i valori calcolati della durezza sono stati confrontati con quelli sperimentali ri-
cavati dai diagrammi di trasformazione in raffreddamento continuo (Continuous cooling Transformation, CCT) di 63 acciai con diversa temprabilità. È stato utilizzato il modello proprietario insieme all'approccio empirico di Maynier [19, 20], cioè senza utilizzare il diagramma TTT specifico. Nel complesso, sono stati esaminati 311 casi (curve di raffreddamento).
Il confronto tra i dati calcolati e quelli sperimentali (Fig.6) è da considerarsi soddisfacente, considerando l'accuratezza delle equazioni empiriche utilizzate.
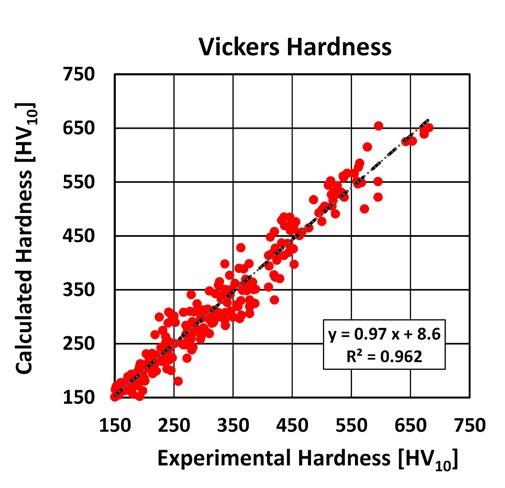
Pertanto, il modello empirico può essere utilizzato per eseguire rapidamente calcoli per una stima iniziale della durezza che può essere ottenuta nel prodotto quando viene sottoposto a raffreddamento continuo (ad esempio, tempra), senza conoscere il diagramma TTT sperimentale o calcolato dell'acciaio in esame.
Fig.6 - Raffreddamento continuo di acciai basso-legati: confronto tra i valori di durezza calcolati e sperimentali dalle curve CCT. / Continuous cooling of low-alloy steels: comparison between calculated and experimental hardness values from CCT curves.
Per quanto riguarda la stima della durezza dopo il rinvenimento, la Fig.7 mostra il confronto tra i valori di durezza sperimentali e calcolati per campioni Jominy per i quali
erano disponibili i profili di durezza dopo il raffreddamento con acqua e dopo rinvenimento a varie temperature comprese tra 550 °C e 650 °C.
La Metallurgia Italiana - October 2022 pagina 29
Scientific papers - Heat Treatment and Coatings
Fig.7 - Valori di durezza sperimentali e calcolati per provini Jominy grezzi di tempra e dopo rinvenimento per vari acciai basso-legati. / Experimental and calculated hardness values from as-cooled and tempered Jominy specimens for various low-alloy steels.
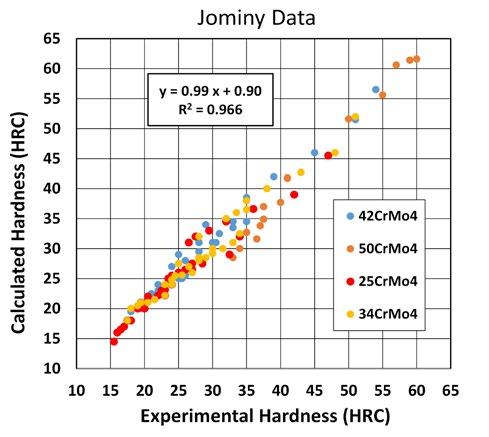
La stima della durezza per la curva Jominy, sia dopo tempra che dopo rinvenimento a varie temperature, è adeguata, essendo tutti i valori compresi in una banda di +/- 4 HRC.
Microstruttura
Per calcoli più accurati, nel caso di acciai basso e alto legati è consigliabile utilizzare il diagramma TTT dell'acciaio in esame e il modello accoppiato termico-microstrutturale. Ad esempio, questo approccio è stato applicato a delle barre in acciai basso-legati per Oil & Gas.
Il modello 2D proprietario è stato utilizzato per simulare la tempra e il rinvenimento di barre tonde piene e cave, realizzate in acciaio AISI 4130 (simile a EN 34CrMo4). Le velocità di raffreddamento e i profili di durezza attraverso il raggio/spessore sono stati calcolati per varie dimensioni di barre piene e forate (Tab.2). I valori di durezza previsti sono stati confrontati con quelli sperimentali. Anche le microstrutture reali sono state valutate a profondità dalle superfici raffreddate selezionate per verificare l'affidabilità del modello.
Tab.2 - Dimensione delle barre piene e dei tondi forati considerati per le simulazioni e il calcolo delle velocità di raffreddamento minime previste tra 800 °C e 500 °C. / Size of solid bars and hollows considered for the simulations and calculation of the minimum cooling rates between 800 °C and 500 °C.
La Metallurgia Italiana - Ottobre 2022 pagina 30 Memorie scientifiche - Trattamenti termici e Rivestimenti
Geometry Outside Diameter, OD [mm] Inner Diameter, ID [mm] Radius or mid-thickness [mm] Calculated minimum cooling rate [°C/s]
Solid round 250 - 125 0.85 300 - 150 0.59 Hollow round 440 160 70 1.20 550 180 92.5 0.69
Le simulazioni termiche (Tab.2) mostrano che la velocità di raffreddamento minima, calcolata tra 800 °C e 500 °C, è più bassa in corrispondenza del centro della barra piena avente 300 mm di diametro (0.59 °C/s). Valori leggermente superiori sono previsti a metà spessore della barra forata avente 550 mm di diametro esterno e 180 mm di spessore (0.69 °C/s); la velocità di raffreddamento minima calcolata aumenta a 0.85 °C/s al centro della barra piena di diametro 250 mm ed è di 1.2 °C/s a metà spessore della barra forata con 440 mm di diametro e 140 mm di spessore. Per velocità di raffreddamento di circa 0.6-0.8 °C/s, si sti-
ma la formazione di 10%-30% di ferrite dai diagrammi di trasformazione di fase disponibili in letteratura. Tuttavia, spesso questi diagrammi sono costruiti per condizioni di austenitizzazione che portano a grani di austenite relativamente fini (10-15 μ m), mentre in una barra forgiata la dimensione dei grani può essere maggiore. Pertanto, le curve a forma di C, di inizio e fine trasformazione di fase, si spostano verso tempi più lunghi e la formazione di ferrite è inibita.
Il modello Franchini-HT consente di stimare questo spostamento, come illustrato nell’esempio di Fig.8.
Fig.8 - Esempio di spostamento delle curve di trasformazione isotermica calcolato quando la dimensione dei grani austenitici passa da 20 μ m a 80 μ m per l'acciaio AISI 4130. / Example of calculated shift of isothermal transformation curves when austenitic grain size changes from 20 μ m to 80 μ m for AISI 4130 steel.
Per tutte le geometrie della Tab.2, il modello 2D è stato utilizzato per calcolare la percentuale di ferrite formata, oltre a martensite e bainite, a 75 mm di profondità dalla
superficie esterna dopo rinvenimento in acqua. Anche le corrispondenti durezze dopo rinvenimento a 660 °C sono state calcolate e confrontate con i valori misurati (Tab.3).
Tab.3 - Durezze e quantità di ferrite calcolate e misurate a 75 mm di profondità dalla superficie esterna di barre piene e forate in acciaio AISI 4130 dopo tempra in acqua e rinvenimento a 660 °C. / Calculated and measured hardness and ferrite amounts at 75 mm depth from the external surface of AISI 4130 bars and hollows after water quenching and tempering at 660 °C.
Geometry
OD (mm) ID (mm)
Calculated cooling rate at 75 mm depth from outer surface (°C/s)
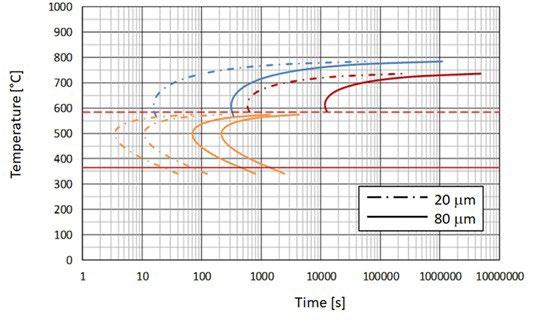
Hardness[HB] Ferrite [% in vol.]
Calc. Meas. Calc. Meas.
Solid round 250 - 0.92 209 192-201 9 10-25 300 - 0.70 190 181-192 34 30-40
Hollow round 440 160 1.20 216 206-216 0 0-10 550 180 0.72 195 195-206 28 10-20
La Metallurgia Italiana - October 2022 pagina 31
Scientific papers - Heat Treatment and Coatings
Inoltre, a 10 mm di profondità, il modello prevede l'assenza di ferrite e valori di durezza compresi tra 215 HB e 220 HB dopo rinvenimento a 650-670 °C, in accordo con i dati sperimentali (assenza di ferrite e durezza compresa tra 205 HB e 216 HB).
Per la barra piena di 250 mm di diametro, a 90 mm di profondità dalla superficie (velocità di raffreddamento locale calcolata di 0.86 °C/s), il modello stima il 21% di ferrite e una durezza di 200 HB, contro i valori sperimentali di 25%30% e 189-192 HB, rispettivamente.
Tenendo conto dell'incertezza delle misure metallografiche e della tipica variabilità da colata a colata in termini di analisi chimica e dimensione dei grani, il confronto tra valori calcolati e sperimentali è più che soddisfacente.
Applicazione dei modelli
Nei paragrafi seguenti sono riportati alcuni esempi applicativi, tra cui il riscaldamento di lingotti e forgiati, il raffreddamento / la tempra e il rinvenimento di vari componenti.
Riscaldamento di lingotti
Attualmente vi è una richiesta di produzione di componenti forgiati di grandi dimensioni per diversi settori industriali, come quello nucleare e della generazione di energia. Pertanto, lingotti di acciaio di grandi dimensioni vengono riscaldati con forni a gas e solitamente mantenuti ad alte temperature per lunghi periodi, per essere sicuri di aver raggiunto un'adeguata omogeneità termica, anche al centro del pezzo, prima di iniziare la forgiatura. Gli strumenti
di simulazione, che tengono conto della variazione della conducibilità termica con la temperatura e il tipo di acciaio, aiutano ad analizzare il processo di riscaldamento dei lingotti al fine di minimizzare i costi (consumo di combustibile). L'obiettivo è aumentare le velocità di riscaldamento e ridurre i tempi di mantenimento, evitando elevati gradienti termici, che potrebbero portare a cricche interne, e ottenendo una buona omogeneizzazione della temperatura. Di solito, i lingotti vengono preriscaldati a 600-650 °C in un forno e, dopo averli mantenuti per qualche ora a questa temperatura, riscaldati a 1200 °C, di solito utilizzando velocità di riscaldamento di 30-35 °C/h. Talvolta, dopo il preriscaldamento, il lingotto viene trasferito in un altro forno a circa 650 °C e riscaldato lentamente fino a 1200 °C. Per risparmiare tempo e ridurre al minimo il numero di forni di riscaldamento necessari, il lingotto preriscaldato può essere introdotto in un forno già a 1200 °C, dove vengono trattati altri lingotti. È stato simulato un riscaldamento rapido di un lingotto rotondo di 1200 mm di diametro, introducendolo in un forno a 1200 °C, dopo una fase di omogeneizzazione a 600 °C. Per questa simulazione è stato scelto un acciaio al C-Mn contenente 0.45% di C. Le curve di riscaldamento calcolate alla superficie e al centro del lingotto, utilizzando come coefficiente HTC quello determinato mediante analisi inversa dei rilievi di temperatura eseguiti con blocco strumentato con termocoppie durante riscaldamenti in forno, sono mostrate nella Fig.9.
Fig.9 - Curve di riscaldamento calcolate per un lingotto di acciaio con 0.45%C di 1200 mm di diametro introdotto in un forno a 1200 °C dopo una fase di omogeneizzazione a 600 °C. / Calculated heating curves for a 0.45%C steel ingot of 1200 mm diameter introduced into a furnace at 1200 °C after a homogenizing step at 600 °C.
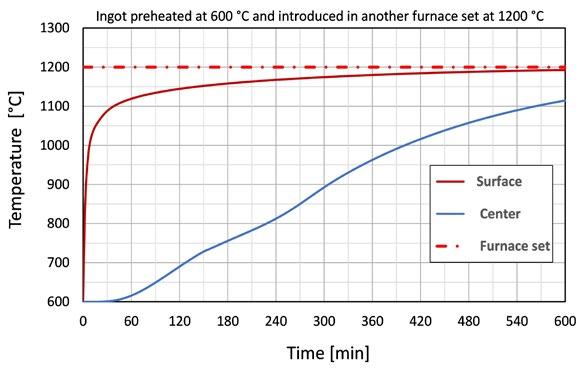
La Metallurgia Italiana - Ottobre 2022 pagina 32 Memorie scientifiche - Trattamenti termici e Rivestimenti
Scientific papers - Heat Treatment and Coatings
Dopo 10 ore, la superficie ha quasi raggiunto i 1200 °C, mentre il centro è ancora 90 °C al di sotto di questo valore. Inoltre, appena dopo 1 ora dall'ingresso del lingotto nel forno impostato a 1200 °C, la differenza di temperatura tra la superficie e il nucleo è stimata in circa 500 °C. Questo gradiente termico è eccessivo e provoca tensioni che possono favorire la formazione di cricche interne a seconda della struttura di solidificazione del lingotto. Questi difetti interni, pur presentando superfici non ossidate, potrebbe-
ro essere difficili da saldare durante la forgiatura. Pertanto, questa modalità di riscaldamento deve essere evitata e devono essere scelte pratiche di riscaldamento più graduali. Per gli acciai caratterizzati da bassi livelli di duttilità a causa della loro analisi chimica, della microstruttura di solidificazione e della segregazione, è stato messo a punto mediante simulazioni virtuali il ciclo di riscaldamento del lingotto mostrato in Fig.10.
Fig.10 - Curve di riscaldamento calcolate per un lingotto di acciaio 0.45%C riscaldato da 650 °C a 950 °C a 35 °C/h, mantenuto per 4 h (fase di omogeneizzazione) e riscaldato a 50 °C/h fino a 1200 °C. / Calculated heating curves for a 0.45%C steel ingot heated from 650 °C up to 950 °C at 35 °C/h, hold for 4 h (homogenizing step) and heated at 50 °C/h up to 1200 °C. °C.
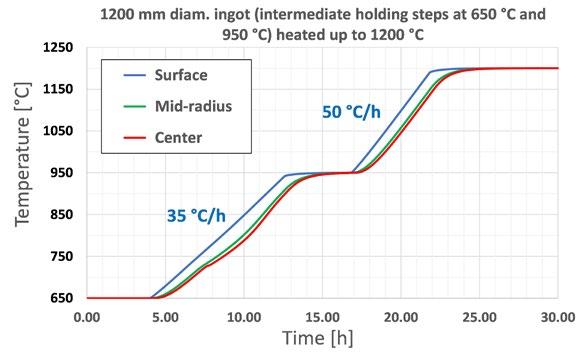
La differenza massima di temperatura tra il centro e la superficie è sempre inferiore a 80 °C e il tempo totale per riscaldare il lingotto da 650 °C a 1200 °C, assicurando il raggiungimento della temperatura target a cuore, è inferiore a 24 ore.
Riscaldamento di manufatti forgiati Un approccio simile è stato utilizzato per stabilire il ciclo di riscaldamento ottimale per alberi di grandi dimensioni realizzati con acciai basso-legati. Attraverso la modellazione, è stato calcolato il tempo di equalizzazione necessario per garantire il raggiungimento di una data temperatura di set entro tutte le sezioni in vari diametri dell'albero. Il tempo minimo di “soaking” (ossia il tempo per cui l’intero albero rimane a questa specifica temperatura) è stato stabilito in 2 ore, al fine di austenitizzare correttamente l'intero pezzo, evitando però un'eccessiva crescita dei
grani austenitici e un alto consumo di gas metano. Di conseguenza, è stabilito il tempo di “holding”, pari al tempo di equalizzazione più quello di soaking, cioè il tempo da quando la termocoppia del forno raggiunge la temperatura impostata fino a quando l'albero viene estratto dal forno.
Un esempio di calcolo per un albero in acciaio 42CrMo4, con diversi diametri lungo l’asse, è mostrato nella Fig.11. La velocità di riscaldamento iniziale è stata di 30-40 °C/h ed è stata introdotta una fase di omogeneizzazione leggermente inferiore alla temperatura di trasformazione Ac1 (ad es. 650 °C). Quando il centro del pezzo ha quasi raggiunto la temperatura di riscaldamento della prima fase, come illustrato nella Fig.11, è stato effettuato un ulteriore riscaldamento fino alla temperatura di austenitizzazione di 850 °C, sempre a una velocità di riscaldamento controllata di 30-40 °C/h.
La Metallurgia Italiana - October 2022 pagina 33
Il calcolo mostra che il ciclo di riscaldamento industriale proposto, con un tempo di holding di 20 ore, può essere applicato efficacemente, poiché la differenza tra superficie e cuore è inferiore a 5 °C per il diametro massimo. Si tratta di un tempo significativamente più breve rispetto al tempo di mantenimento calcolato con la regola industria-
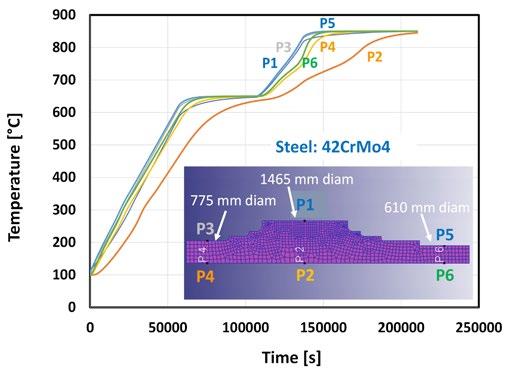
le empirica di 1 min/mm, che dà circa 25 ore. Sulla base di questi risultati, è stato eseguito un ciclo di riscaldamento industriale e le temperature reali sono state monitorate con termocoppie posizionate sull'albero durante l'austenitizzazione, dimostrando l'efficacia della simulazione virtuale [17].
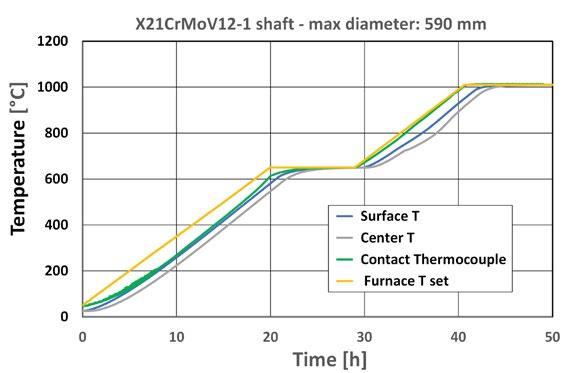
Fig.11 - Evoluzione della temperatura calcolata mediante modello durante il riscaldamento di un albero in acciaio 42CrMo4 con diversi diametri lungo l'asse (posizioni P1, P3 e P5 sulla superficie dell'albero; posizioni P2, P4 e P6 sull'asse dell'albero). / Temperature evolution calculated by model during heating of a shaft made of 42CrMo4 steel with different diameters along axis (positions P1, P3 and P5 on the shaft surface; positions P2, P4 and P6 at shaft axis).°C.
È stata simulata anche l'austenitizzazione a 1010 °C di un albero in acciaio inossidabile X21CrMoV12-1, con diametro massimo di 590 mm (Fig.12).
Fig.12 - Evoluzione della temperatura calcolata sulla superficie e al centro di un albero in acciaio inossidabile martensitico X21CrMoV12-1 durante il riscaldamento. È mostrata anche la temperatura misurata con una termocoppia a contatto, posizionata nel punto in cui il diametro è massimo. / Temperature evolution calculated at the surface and at the center of a shaft made of martensitic stainless steel X21CrMoV12-1 during heating. Even temperature measured by a contact thermocouple, placed where diameter is maximum, is shown.
La Metallurgia Italiana - Ottobre 2022 pagina 34
Memorie scientifiche - Trattamenti termici e Rivestimenti
Scientific papers - Heat Treatment and Coatings
La velocità di riscaldamento è stata di 30 °C/h con uno stadio di omogeneizzazione di 9 ore a 650 °C, prima del riscaldamento finale a 1010 °C. Anche in questo caso, si prevede che un tempo di 7 ore sia sufficiente per raggiungere la temperatura impostata (1010 °C) al centro dell'albero. Ossia un tempo di holding di 10 ore appare sufficiente per garantire l’uniformità della temperatura e la dissoluzione dei precipitati. Questo valore è significativamente inferiore rispetto al tempo calcolato con la regola empirica di 2 min/mm per gli acciai inossidabili, che suggerisce circa 19 ore.
Trattamento termico di tubi a parete spessa di grado F92
I tubi per il trasporto di vapore surriscaldato sono realizzati con acciai resistenti allo scorrimento a caldo (creep) che presentano stabilità microstrutturale ed eccellenti proprietà meccaniche ad alta temperatura. La progettazione dei tubi senza saldatura in grado 92 è progredita in modo significativo a causa della necessità di aumentare l'efficienza termica delle centrali elettriche a vapore e di soddisfare le prospettive operative degli impianti nucleari. La stabilità ad alta temperatura del grado 92 è ottenuta con l'aggiunta di elementi micro-leganti, come Mo, W, V e Nb (Tab.1). Di solito, i tubi di grado 92 vengono sottoposti a normalizzazione e rinvenimento. Il processo di normalizzazione viene generalmente effettuato nell'intervallo di temperatura compreso tra 1040 °C e 1080 °C, seguito da rinvenimento a 740 °C - 780 °C, al fine di formare una microstruttura di martensite rinvenuta e carbonitruri finemente distribuiti nella matrice, che fungono da ostacolo al movimento delle dislocazioni durante la deformazione per scorrimento [29].
Basse temperature di normalizzazione comportano una perdita di resistenza a rottura per creep a causa delle dimensioni più fini dei grani austenitici e della dissoluzione
incompleta dei carburi, mentre alte temperature favoriscono la formazione di ferrite, con conseguente perdita di resistenza meccanica.
Anche la velocità di raffreddamento dopo austenitizzazione influisce sulla trasformazione di fase. In caso di raffreddamento molto lento, si forma ferrite indesiderata, con effetti negativi sulle proprietà di scorrimento a caldo [29]. A questo proposito, la resistenza a creep dei tubi forgiati di grosso spessore potrebbe essere migliorata sostituendo il raffreddamento in aria calma con un raffreddamento in un mezzo liquido adeguato, al fine di evitare/limitare la formazione di ferrite.
Pertanto, sono state effettuate simulazioni virtuali su tubi di grado F92 con diametro esterno (OD) di 730 mm e spessore (WT) di circa 190 mm per stimare le velocità di raffreddamento e le quantità di ferrite a metà spessore in caso di raffreddamento sia in aria calma (normalizzazione) sia con mezzo liquido agitato (tempra).
Le velocità medie di raffreddamento calcolate a metà spessore tra 800 °C e 500 °C sono rispettivamente 4.2 °C/min per l'aria calma e 52 °C/min per il liquido. A metà spessore, si calcola la presenza del 3.7% di ferrite dopo raffreddamento in aria, mentre non si prevede formazione di ferrite dopo tempra. Queste simulazioni indicano che la ferrite può essere evitata o ridotta al di sotto del 3% (valore massimo richiesto) anche nei tubi forgiati di grossa parete utilizzando un raffreddamento più intenso.
Tab.4 - Valori calcolati e misurati della velocità media di raffreddamento (ACR) e della percentuale di ferrite. / Calculated and measured values of average cooling rate (ACR) and ferrite percentage.
I valori calcolati sono stati confrontati anche con i dati sperimentali relativi a spezzoni di tubi sottoposti a trattamenti sia di normalizzazione sia di tempra. Sono state utilizzate delle termocoppie per misurare l'evoluzione termica a metà spessore durante il trattamento termico e sono state eseguite delle indagini microstrutturali per determinare la frazione in volume di ferrite. I risultati, riportati in Tab.4, confermano l'affidabilità dei calcoli. Normalization
La Metallurgia Italiana - October 2022 pagina 35
Calc. Meas. Calc. Meas. Calc. Meas. Calc. Meas.
Quenching Position ACR (°C/min) Ferrite (%) ACR (°C/min) Ferrite (%)
½ WT 4.2 4 3.7 4.6± 0.16 47 40 0 0.90±0.29
Tenendo conto dell'incertezza delle misure metallografiche e della variabilità delle condizioni di processo, il confronto tra i valori calcolati e quelli sperimentali può essere considerato buono, dimostrando la validità di questo approccio. Inoltre, i dati calcolati e sperimentali suggeriscono che lo 0.5-1% della ferrite deriva dalla ferrite delta già presente prima del raffreddamento. Il raffreddamento in aria contribuisce alla formazione del 3-4% di ferrite, mentre non si sviluppa ferrite nel caso della tempra. Test specifici condotti su campioni con contenuti di ferrite dello 0.8% e del 3.2% hanno mostrato un miglioramento del comportamento a scorrimento per il materiale F92 con la minore quantità di ferrite [31]. Sulla base di questi risultati e di ulteriori simulazioni virtuali, è stato messo a punto un trattamento termico pro-
prietario per i tubi F92 a parete spessa, al fine di ottenere un raffreddamento in grado di evitare la formazione di ferrite e di cricche da tempra. Il trattamento consiste in una serie di raffreddamenti in una soluzione di acqua e polimero (PAG), interrotti da stasi in aria. I tempi di immersione nel mezzo liquido e i tempi di mantenimento in aria sono regolati in modo da avere una velocità di raffreddamento media a metà spessore di 20-40 °C/min tra 800 °C e 500 °C e un valore molto più basso quando la temperatura dei tubi si avvicina a quella di inizio formazione della martensite. Esempi di curve di raffreddamento calcolate a metà spessore e sulla superficie del tubo sono mostrati nella Fig.13, confrontati con le curve nelle stesse posizioni per il raffreddamento continuo in aria calma e in mezzo liquido.
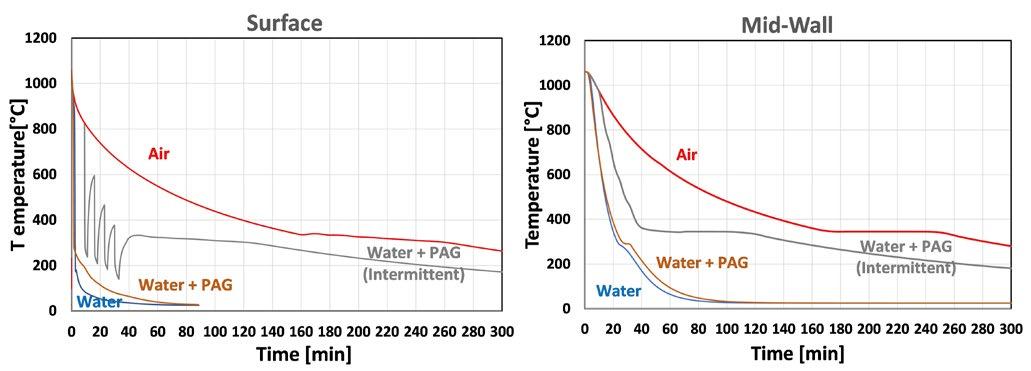
Fig.13 - Evoluzione della temperatura calcolata per un tubo di grado F92 (730 mm OD e 190 mm WT) durante il raffreddamento con diversi mezzi/condizioni di raffreddamento: (a) superficie; (b) metà spessore. / Calculated temperature evolution for F92 grade pipe (730 mm OD and 190 mm WT) during cooling by different cooling media/conditions: (a) Surface; (b) Mid-thickness.
Tempra di un albero in acciaio X21CrMoV12-1.
Al fine di impostare il ciclo di tempra per questo acciaio caratterizzato da un'elevatissima temprabilità e dal rischio di cricche da tempra, sono state simulate diverse condizioni di raffreddamento a partire da una temperatura di solubilizzazione di 1010 °C. L'evoluzione della temperatura e della frazione di austenite e le tensioni dovute ai gradienti termici e alle variazioni di volume indotte dalle trasformazioni di fase in varie posizioni dell'albero sono state calcolate per due casi significativi: immersione continua nella vasca di tempra e una sequenza di fasi di tem-
pra interrotta (immersioni da 180 s a 600 s in soluzione con PAG e da 300 s a 1200 s in aria).
I valori delle sollecitazioni principali massime, calcolate in funzione del tempo per le due condizioni di raffreddamento (continuo ed intermittente) nei punti corrispondenti al diametro massimo (900 mm) e medio (450 mm), al centro e alla superficie dell'albero, sono mostrati in Fig.14. L'evoluzione delle sollecitazioni, indica che una serie di brevi immersioni nella soluzione di acqua e polimero, separate da fasi di raffreddamento in aria calma contribuiscono a ridurre le sollecitazioni massime.
La Metallurgia Italiana - Ottobre 2022 pagina 36
Memorie scientifiche - Trattamenti termici e Rivestimenti
Scientific papers - Heat Treatment and Coatings
Le condizioni del processo industriale sono state impostate sulla base di queste simulazioni virtuali. Non sono emersi problemi qualitativi durante la tempra e le proprietà di resistenza meccanica e di resilienza ottenute dopo rinvenimento soddisfano i requisiti target.
CONCLUSIONI
Lo sviluppo e l'applicazione di strumenti di simulazione virtuale hanno permesso di migliorare la progettazione di cicli termici per forgiati medio-grandi, al fine di raggiun-
gere le microstrutture e le proprietà meccaniche desiderate, riducendo il rischio di problemi qualitativi. I valori del coefficiente di scambio termico (HTC), determinati con la modellazione inversa, hanno fornito un buon allineamento tra l'evoluzione della temperatura calcolata e i dati sperimentali (rilievi con termocoppie e pirometri). Un buon accordo è stato anche ottenuto tra valori calcolati e sperimentali delle frazioni di costituenti microstrutturali e della durezza.
Fig.14 - Valori della tensione principale massima calcolati in funzione del tempo in vari punti per le condizioni di raffreddamento continuo e intermittente. / Maximum principal stress values calculated as a function of time at various locations for continuous and interrupted cooling conditions.
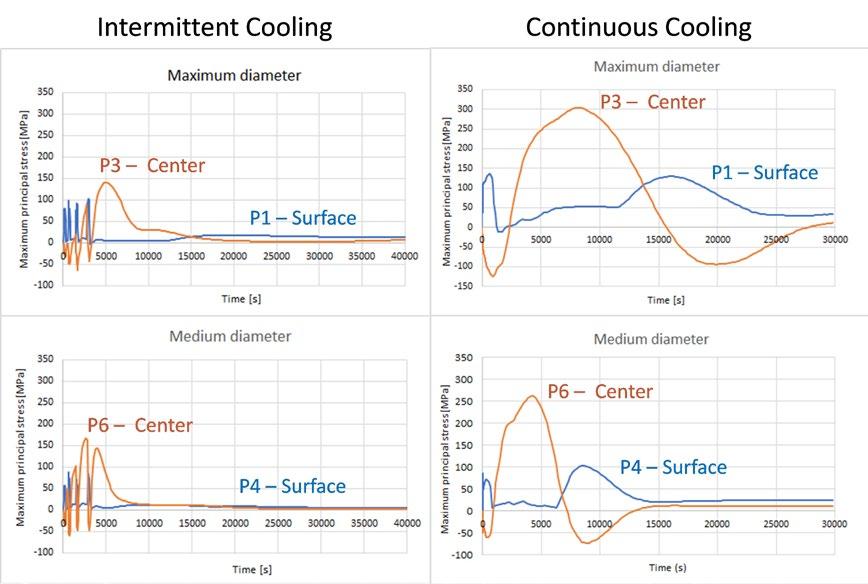
L'accuratezza della previsione può essere migliorata mediante procedure di messa a punto e calibrazione basate sui risultati di produzioni industriali. Gli algoritmi e i modelli sviluppati offrono un accesso semplice e strutturato a una serie completa di opzioni per stimare gli effetti dei parametri di trattamento termico e degli elementi di lega sull'evoluzione della temperatura, sulla trasformazione di fase e sulla microstruttura e durezza finali. Inoltre, è possibile calcolare anche le tensioni durante le fasi di riscaldamento e raffreddamento. Questi
strumenti di simulazione consentono di: − condurre un’analisi di sensibilità senza ricorrere a prove industriali che richiedono tempo e risorse; − ottimizzare i trattamenti termici in uso, al fine di ottenere la microstruttura e la resistenza meccanica desiderata, risparmiando metano; − mettere rapidamente a punto le strategie di trattamento termico per nuovi componenti (materiale e/o geometria);
− ridurre le rilavorazioni, indagando sulle cause che fa-
La Metallurgia Italiana - October 2022 pagina 37
voriscono la formazione di microstrutture indesiderate, distorsioni eccessive, oppure cricche da tempra. La disponibilità di strumenti per la simulazione numerica, unita a competenze metallurgiche, costituisce una combinazione vincente per la produzione di componenti forgiati ad alta tecnologia per i settori dell'energia e dell'oil & gas.
Finanziamenti: Questa ricerca è stata finanziata dal Ministero dello Sviluppo Economico, Progetto n. F/070014/00/
BIBLIOGRAFIA
X34.
Ringraziamenti: Si ringrazia G. Franchini per l'autorizzazione alla pubblicazione di questo lavoro, tutti i colleghi che hanno effettuato le prove industriali e contribuito alla raccolta e all'analisi dei dati. Si ringraziano inoltre P.E. Di Nunzio e G. Jochler di Rina Consulting - Centro Sviluppo Materiali per il loro contributo allo sviluppo e alla validazione del modello termo-metallurgico proprietario.
[1] Canale LCF, Totten GE. Hardening of Steels. In Quenching Theory and Technology, 2nd ed.; Liscic B, Tensi HM, Canale LCF, Totten GE, Eds. CRC Press/Taylor & Francis Group, Boca Raton, FL, USA; 2010, pp. 1–41.
[2] Totten GE, Dosset JL, Kobasko NI. Quenching of Steel. In ASM Handbook, Steel Heat Treating Fundamentals and Processes, 1st ed.; Dosset JL, Totten GE, Eds. ASM International, Materials Park, OH, USA; 2013, 4A, pp. 91–157.
[3] Blaoui MM, Zemri M, Brahami A. Effect of Heat Treatment Parameters on Mechanical Properties. Mechanics and Mechanical Engineering, 2018, 22, pp. 909-918.
[4] Nunes MM, da Silva EM, Renzetti RA, Brito TG. Analysis of Quenching Parameters in AISI 4340 Steel by Using Design of Experiments. Materials Research 2019; 22: e20180315, DOI: http://dx.doi.org/10.1590/1980-5373-MR-2018-0315
[5] Simsir C. Modeling and Simulation of Steel Heat Treatment - Prediction of Microstructure, Distortion, Residual Stresses, and Cracking. In ASM Handbook, Steel Heat Treating Technologies, 1st ed.; Dosset, J, Totten GE, Eds. ASM International, Materials Park, OH, USA; 2014, 4B, pp. 4091–466.
[6] Babu SS. Classification and Mechanisms of Steel Transformation. In Steel Heat Treatment Metallurgy and Technologies”, Totten GE Ed. Taylor & Francis Group, New York, 2007, pp. 107-108.
[7] Deng X, Ju D. Modeling and Simulation of Quenching and Tempering Process in Steels. Physics Procedia 2013, 50, pp. 368 – 374.
[8] Homepage of SYSWELD software from ESI-Group. Available online: https://www.esi-group.com/products/welding-assembly (accessed on 6 July 2022).
[9] Fu J, Li F, Li Y, Wang K, Qi H. Microstructure Simulation and Mechanical Properties of AISI 1050 Disk During Quenching Process. In Proceedings of the 2016 International Conference on Innovative Material Science and Technology (IMST), November 2016, Atlantis Press, pp. 85-93, https://doi.org/10.2991/imst-16.2016.12
[10] Morgano E, Viscardi C, Valente L. Simulation of Heat Treatment of Jominy Specimen to Improve Quality of Automotive Gear Components. Metall. Ital. 2020, 112, pp. 40–46.
[11] Homepage of Scientific Forming Technologies Corporation (SFTC), DEFORM system. Available online: http://www.deform.com/ (accessed on 6 July 2022).
[12] Ferguson BL, Li Z, Freborg AM. Modeling Heat Treatment of Steel Parts, Computational Materials Science, 2005, 34(3), pp. 274-281.
[13] Sims J, Li Z, Ferguson BL. Causes of Distortion during High Pressure Gas Quenching Process of Steel Parts. In Proceedings of the 30th ASM Heat Treating Society Conference (Heat Treat), Detroit Michigan, USA, October 15-17, 2019, pp. 228-236.
[14] Habean S, Sims J, Li Z, Ferguson BL. Quenching Process Improvement Through Modeling. In Proceedings of the 30th ASM Heat Treating Society Conference (Heat Treat), Detroit Michigan, USA, October 15-17, 2019, pp. 329-336.
[15] Homepage of DANTE, Heat Treatment Simulation Software. Available online: https://dante-solutions.com/ (accessed on 6 July 2022).
[16] Anelli E, Lucchesi M, Chugaeva A. La simulazione virtuale applicata ai trattamenti termici di forgiati, La Metallurgia Italiana n. 9, 2018, pp. 45-53.
[17] Anelli E, Lucchesi M, Chugaeva A. Application of numerical simulation to predict microstructure and hardness of Q&T steel forgings. In Proceedings of METEC and 4th ESTAD (European Steel Technology and Application Days), CCD Congress Center Düsseldorf, Germany, June 24-28, 2019, Steel Institute VDEh, TEMA Technologie Marketing AG.
[18] Anelli E, Lucchesi M, Chugaeva A. Microstructural Prediction of Heat Treated Steel Forgings for Severe Applications. Materials Science Forum 2021, Trans Tech Publications Ltd, Switzerland, ISSN: 1662-9752, Vol.1016, pp 236-242.
[19] Maynier Ph, Dollet J, Bastien P. Prediction of microstructure via empirical formulae based on CCT diagrams. In Hardenability Concepts with Applications to Steel; Doane, D.V., Kirkaldy, J.S., Eds.; AIME, Chicago, USA; 1978, pp. 163-178.
[20] Maynier Ph, Jungmann B, Dollet J. Creusot-Loire System for the Prediction of the Mechanical Properties of Low-alloy Steel Products. In Hardenability Concepts with Applications to Steel; Doane, D.V., Kirkaldy, J.S., Eds.; AIME, New York, USA; 1978, pp. 518-545
[21] Blázquez JS, Manchón-Gordón AF, Ipus JJ, Conde CF, Conde A. On the Use of JMAK Theory to Describe Mechanical Amorphization:
La Metallurgia Italiana - Ottobre 2022 pagina 38 Memorie scientifiche - Trattamenti termici e Rivestimenti
A Comparison between Experiments, Numerical Solutions and Simulations. Metals 2018, 8, 450; doi:10.3390/met8060450.
[22] Scheil E. Anlaufzeit den Austenitumwandung, Arch. Eisenhuttenwesen 1935, Vol.8, pp. 565-567.
[23] Anelli E. Application of Mathematical Modelling to Hot Rolling and Controlled Cooling of Wire Rods and Bars. ISIJ International 1992, 32, pp.440-449.
[24] Denis S, Farias D, Simon A. Mathematical Model Coupling Phase Transformations and Temperature Evolutions in Steels. ISIJ International 1992, 32, pp. 316-325.
[25] Pham TT, Hawbolt EB, Brimacombe JK. Predicting the onset of transformation under noncontinuous cooling conditions: Part I. Theory. Metall. Mater. Trans. A 1995, 26A, pp. 1987-1992.
[26] Pohjonen A, Somani M, Porter D. Modelling of austenite transformation along arbitrary cooling paths. Computational Materials Science 2018, 150, pp. 244-251.
[27] Kirkaldy JS. Diffusion-Controlled Phase Transformations in Steels, Scand. J. Met. 1991, 20, pp. 50-61.
[28] Koistinen DP, Marburger RE. A general equation prescribing extend of austenite-martensite transformation in pure Fe-C alloys and plain carbon steels. Acta Metall. 1959, pp. 59-60.
[29] Huyan F, Hedström P, Borgenstam A. Modelling of the fraction of martensite in low-alloy steels. Materials Today: Proceedings 2S 2015, pp. S561 – S564.
[30] Igwemezie VC, Ugwuegbu CC, Mark U. Physical Metallurgy of Modern Creep-Resistant Steel for Steam Power Plants: Microstructure and Phase Transformations. Journal of Metallurgy 2016, Article ID 5468292, 19 pages, http://dx.doi.org/10.1155/2016/5468292.
[31] Anelli E, Holmström SS. Heavy Wall Forged Pipes of Grade 92: Effect of Heat Treatment Conditions on Microstructure and Creep Resistance. Materials at High Temperatures, 2021, https://doi.org/10.1080/09603409.2022.2058231
Optimization of quenching and tempering treatment for steel forgings through virtual simulations
An in-house two-dimensional (2D) model was developed, calibrated and applied to forged components of simple shape in order to predict the thermal and microstructural evolution during quenching and tempering (Q&T). The diffusive transformations were determined considering the cooling curve as a series of micro-isotherms and applying the laws (e.g. JMAK) valid under isothermal conditions. Martensite percentage was calculated as a function of undercooling below martensite start temperature. Also the 3D FEM software DEFORM-HT, able to calculate the stress field during quenching, was specialized for the steels of interest. The calculated results showed a good agreement with the experimental data. The effectiveness of the model in determining optimal Q&T conditions, in order to achieve the target microstructure and strength level, is presented with reference to steel forged components for power generation and oil & gas sectors.
La Metallurgia Italiana - October 2022 pagina 39
Scientific papers - Heat Treatment and Coatings
TORNA ALL'INDICE >
KEYWORDS: STEEL, FORGINGS, QUENCHING, TEMPERING, NUMERICAL SIMULATION, PHASE TRANSFORMATION, MICROSTRUCTURE, HARDNESS, STRENGTH, RESIDUAL STRESSES;
Comportamento ciclico di ricoprimenti in lega ad alta entropia CrMnFeCoNi depositati mediante cold spray
P. Cavaliere, A. Perrone, A. SilvelloNella presente memoria viene descritto il comportamento ciclico di ricoprimenti prodotti per cold spray attraverso l’utilizzo di particelle in lega ad altra entropia equiatomica CrMnFeCoNi depositata su substrati in acciaio C40. I ricoprimenti di spessore nominale di 500 micron sono stati caratterizzati mediante microscopia elettronica in scansione e in trasmissione per valutare la deformazione plastica severa indotta nelle particelle durante l’impatto così come la porosità presente nei campioni. Le proprietà meccaniche dei ricoprimenti sono state analizzate mediante nanoindentazione. Il comportamento a fatica è stato valutato attraverso prove di flessione ciclica in tre punti a deformazione controllata a diversi valori di flessione. Le prove effettuate hanno consentito di monitorare la nucleazione e propagazione delle cricche di fatica sulla superficie dei ricoprimenti al variare della deformazione massima imposta e al variare del numero di cicli di sollecitazione. La modalità di rottura così come la propagazione delle cricche di fatica è stata analizzata mediante l’osservazione delle superfici di frattura effettuata attraverso microscopia elettronica in scansione.
INTRODUZIONE
Le leghe ad alta entropia (HEAs) consentono l'esibizione di proprietà eccezionali grazie dell'elevata entropia combinata della configurazione cristallina, della distorsione del reticolo e del cosiddetto effetto cocktail [1-3]. Queste leghe contengono almeno cinque elementi, le più comuni sono prodotte in composizione equiatomica. Le caratteristiche microstrutturali consentono di ottenere proprietà fisiche, chimiche e meccaniche mantenute anche a temperature molto elevate e molto basse [5]. Molte proprietà aggiuntive possono essere ottenute a seconda della struttura cristallina di questi materiali (FCC, BCC, FCC+BCC) [6]. Inoltre, tutte le proprietà microstrutturali e meccaniche degli HEAs possono essere amplificate se si utilizzano tecniche di metallurgia delle polveri [7, 8]. Qui, piccole modifiche composizionali possono portare a uno spostamento nella geometria del reticolo cristallino con effetti molto benefici. Infatti, una delle migliori applicazioni di queste leghe sembra essere la produzione di rivestimenti mediante tecniche di spruzzatura termica come la spruzzatura a freddo (CS) [9]. Lo spray freddo è largamente impiegato per la produzione di rivestimenti e per la riparazione [10-12]. Il principale vantaggio di questa tecni-
P. Cavaliere, A. Perrone
Department of Innovation Engineering, University of Salento, Via per Arnesano, 73100 Lecce, Italy
A. Silvello
Thermal Spray Center CPT, Universitat de Barcelona, Barcelona-Spain
La Metallurgia Italiana - Ottobre 2022 pagina 40 Memorie scientifiche - Trattamenti termici e Rivestimenti
PAROLE CHIAVE: COLD SPRAY, LEGHE AD ALTA ENTROPIA, PROPRIETÀ MECCANICHE, MICROSTRUTTURA, FRATTURA;
papers - Heat Treatment and Coatings
ca è che il rivestimento o la produzione in serie avviene a temperature ben al di sotto del punto di fusione delle particelle spruzzate, portando a proprietà molto attraenti a causa dell'evoluzione microstrutturale del materiale spruzzato come conseguenza della severa deformazione plastica sperimentata [13 -15]. Durante la spruzzatura a freddo, le particelle subiscono le loro particolari caratteristiche microstrutturali grazie alla dibattuta instabilità adiabatica a taglio che porta principalmente alla nanostrutturazione parziale o totale del materiale [16-18]. Ovviamente, questi meccanismi di deformazione conducono a stati di tensione residua molto complessi soprattutto nel caso della produzione di rivestimenti [19-21]. Le sollecitazioni residue sono generate dal forte impatto delle particelle in condizioni di spruzzatura ottimali [22]. Ovviamente, il comportamento complessivo dei rivestimenti e il loro meccanismo di deformazione in esercizio sono correlati alle proprietà a fatica in varie condizioni di carico [23]. Le leghe di alluminio ad alta resistenza, spruzzate su substrati morbidi portano a sollecitazioni residue di compressione e all'aumento della vita a fatica [24] gli autori concludono che la vita a fatica dei campioni rivestiti dipende dalla lega depositata così come dai parametri di spruzzatura. Un aumento della vita a fatica è anche sperimentato da provini rivestiti con polveri di leghe di alluminio 6082 [25]. Il rivestimento spuzzato a freddo AA7075 è molto efficace nell'aumentare la durata a fatica delle leghe di magnesio [26]. Ovviamente, solo condizioni di lavorazione ottimali sono in grado di indurre una buona durata a fatica nei rivestimenti spruzzati a freddo [27]. Lo spray freddo risulta molto efficace nel riparare le crepe superficiali andando a risolvere le crepe danneggianti nei componenti riparati [28-30]. È dimostrato che gli effetti di riparazione migliorano nel caso di substrati più duri [31, 32]. Altre evidenze scientifiche mostrano il miglioramento del comportamento a fatica degli acciai rivestiti con nichel e leghe a base di nichel [33-36]. Recentemente, i rivestimenti a spruzzo a freddo con leghe ad alta entropia hanno trovato ampio spazio nella letteratura scientifica [37, 38]. Per queste leghe, le tensioni residue e la nanostrutturazione giocano un ruolo cruciale nell'ottenimento di eccezionali proprietà meccaniche [39].
In letteratura sono disponibili molti studi sulle proprietà di elevata resistenza e duttilità della lega FeCoCrNiMn (nota
come lega Cantor), nonché sulle loro eccellenti proprietà criogeniche, tenacità alla frattura e resistenza alla corrosione [40-42]. Per quanto a conoscenza degli autori, non sono disponibili dati in letteratura sul comportamento a fatica dei rivestimenti a spruzzo a freddo di leghe ad alta entropia. Lo scopo del presente lavoro è descrivere il comportamento alla frattura di una lega FeCoCrNiMn ad alta entropia spruzzata a freddo su substrati di acciaio sotto carico di flessione monotona e ciclica.
MATERIALI E METODI
Le particelle impiegate sono state fornite da Vilory Advanced Materials Technology Ltd, CN. Le misurazioni della composizione chimica hanno confermato la natura equiatomica della lega FeCoCrNiMn ad alta entropia [9]. L'aspetto delle particelle è stato analizzato al microscopio elettronico a scansione utilizzando uno strumento ZEISS EVO40. I rivestimenti a spruzzo a freddo sono stati prodotti su substrati in lamiera di acciaio al carbonio (120X30X15 mm) utilizzando un'apparecchiatura PCS-100 (Plasma Giken Co., Ltd., Osato, Saitama, JP). Prima del processo di deposizione, i substrati sono stati smerigliati con allumina (F24), fino a rugosità Ra≈7 µm. I parametri di processo impiegati sono stati: 1100°C per la temperatura del gas di azoto, 7 MPa per la pressione del gas, 15 mm per la distanza ugelo-substrato, 500 mm/s per la velocità del robot [9]. Nel nostro precedente lavoro, queste condizioni hanno permesso di ottenere i rivestimenti più compatti tra molti altri appartenenti alla spruzzatura eseguita impiegando diversi parametri di lavorazione. La diffrazione a raggi X (XRD) è stata impiegata per la caratterizzazione delle fasi di polveri e rivestimenti utilizzando un Malvern PANalytical X'Pert PRO MPD θ/θ Bragg–Brentano con il software X'Pert (Malvern, Regno Unito) per l'analisi di fase. L’XRD è stato impiegato per la misurazione delle sollecitazioni residue in una direzione parallela a quella di spruzzatura rimuovendo strati sottili mediante elettrolucidatura prima di ogni misurazione [43]. Per fornire alcuni dettagli, le misurazioni XRD sono state eseguite passo dopo passo dopo aver rimosso 50 μm di materiale di rivestimento mediante elettrolucidatura per ogni passaggio. Ciò ha consentito la misurazione delle sollecitazioni residue al fine di rivelare il profilo in profondità. La preparazione metallografica è stata eseguita secondo ASTM E1920-03. La microstruttura dei rivestimenti è sta-
La Metallurgia Italiana - October 2022 pagina 41
Scientific
ta osservata impiegando la microscopia ottica Leica DMI 5000M (OM). L'analizzatore di immagini del microscopio Leica è stato utilizzato per calcolare lo spessore dei rivestimenti. I profili di durezza dei ricoprimenti sono stati ricavati mediante misure di nanoindentazione. Le prove di piegatu-
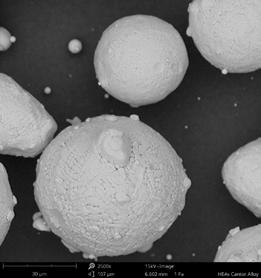
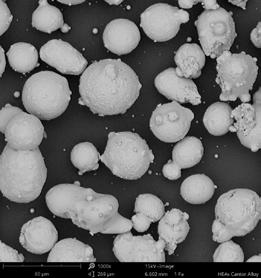
ra ciclica a 3 punti sono state eseguite sulle lastre spruzzate a freddo utilizzando una macchina di prova standard Zwick/Roell (Figura 1).
Fig.1 - Configurazione della piegatura a 3 punti / 3point bending set-up.
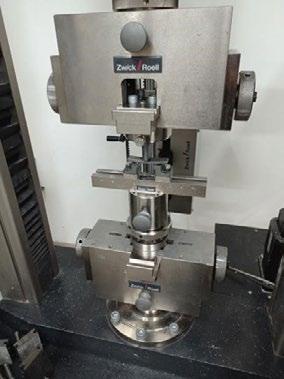
Le prove cicliche sono state eseguite sui campioni rivestiti con le dimensioni di 120X30X15mm, ovviamente, lo spessore del campione (15 mm) è aumentato di 500 μ m a causa della lega ad alta entropia spruzzata a freddo. Le prove cicliche sono state eseguite aumentando la corsa massima da 0,3 a 2,4 mm con passi di 0,3 mm ogni 200 cicli di piegatura. Altre prove di flessione in 3 punti sono state eseguite con corsa massima fissa agli stessi livelli di deformazione indicati per la prova precedente. Ogni 100 cicli il test è stato interrotto e la superficie del rivestimento è stata osservata per monitorare il comportamento alla frattura superficiale. La superficie di frattura dei rivestimenti dopo la rottura è stata osservata mediante microscopia elettronica a scansione utilizzando un SEM Zeiss EVO40 dotato di EDS. La tecnica di elettronica a trasmissione (TEM, Jeol 2100) è
stata impiegata per studiare le caratteristiche strutturali del grano dei campioni levigati. La procedura standard di preparazione del campione metallografico è stata eseguita mediante molatura su carte SiC e lucidatura meccanica con 0,05 m di silice colloidale (OPS) fino a una dimensione minima di ~ 0,1 μm. Successivamente, i campioni sono stati preparati mediante assottigliamento meccanico e ionico con fascio di Ar su macchina GATAN PIPS II.
RESULTATI E DISCUSSIONI
L'aspetto delle particelle è mostrato in figura 2. Si può evidenziare una distribuzione dimensionale molto ristretta [9]. La dimensione media delle particelle è vicina a 32 μm con d10 di 19,56 μm e d80 di 52 μm.
La Metallurgia Italiana - Ottobre 2022 pagina 42
Memorie scientifiche - Trattamenti termici e Rivestimenti
Fig.2 - Particelle impiegate a diversi ingrandimenti / Employed particels at different magnifications.
Dalla figura 2b è visibile la struttura dendritica delle particelle impiegate. La durezza di queste particelle era di 1,5 GPa [9]. La dimensione media del grano delle particelle era 1,37 μ m [44].
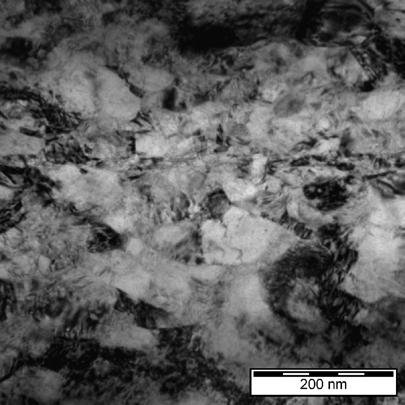
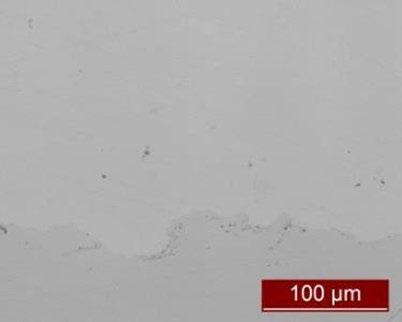
L'aspetto dei rivestimenti dopo le operazioni di spruzzatura a freddo è mostrato in Figura 3.
Fig.3 - Rivestimento e aspetto dell'interfaccia / Coating and interface aspect.
È chiaro come l'aspetto del rivestimento sia veramente compatto senza la formazione di vuoti nell'interfaccia substrato-rivestimento. Ciò è dovuto allo spiattellamento ottimale delle particelle all'impatto che porta a una porosità inferiore all'1%. Lo spessore massimo del rivestimento è stato di oltre 500 μ m. Durante la spruzzatura a freddo, le particelle assumono un aspetto simile a un pancake. Con l'asse principale prevalentemente ortogonale alla direzione di spruzzatura. Se le particelle non sono sufficientemente deformate, mostrano un ridotto appiattimento con conseguente aumento della porosità del rivestimento [36]. La porosità del rivestimento è direttamente correlata alla capacità delle polveri di deformarsi assumendo un aspetto
simile a un pancake. Questo è accompagnato da un legame metallurgico ottimale e da una riduzione dei livelli di porosità. Se vengono impiegati parametri di lavorazione non ottimali durante la spruzzatura, si osserva una deformazione plastica insufficiente delle particelle e ciò è accompagnato da una bassa instabilità adiabatica a taglio con basso appiattimento delle particelle ed elevata porosità nel rivestimento spruzzato. Dalla figura 4 si evidenzia come la deformazione sia confinata in fasce con diverso comportamento di ricristallizzazione e dimensioni dei grani differenti. Inoltre, possono essere rivelate deformazioni da geminazione, questo sarà chiarito anche dalle osservazioni della microstruttura HEA dopo i test di flessione ciclica.
La Metallurgia Italiana - October 2022 pagina 43
Scientific papers - Heat Treatment and Coatings
Fig.4 - Diverse zone ricristallizzate nella condizione spruzzata / Different recrystallized zones in the as sprayed condition.
In generale, maggiore è la temperatura di impatto delle particelle, minore è la porosità del rivestimento [45]. La porosità è fondamentale nel presente studio perché i pori potrebbero fungere da siti di nucleazione delle cricche portando a un cedimento per fatica anticipato.
Una volta rivelati i confini delle particelle spruzzate, è possibile misurare il rapporto di appiattimento come rapporto tra la larghezza e l'altezza all'interno del rivestimento. Il rapporto di appiattimento è stato misurato mediante immagini SEM dei rivestimenti come mostrato nella Figura 5.
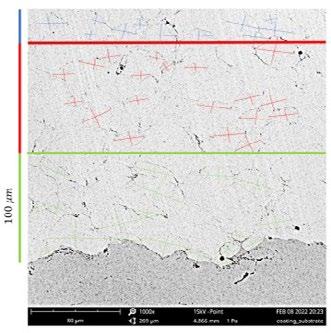
Fig.5 - Misurazione del rapporto di appiattimento / Flattening ratio measurement.
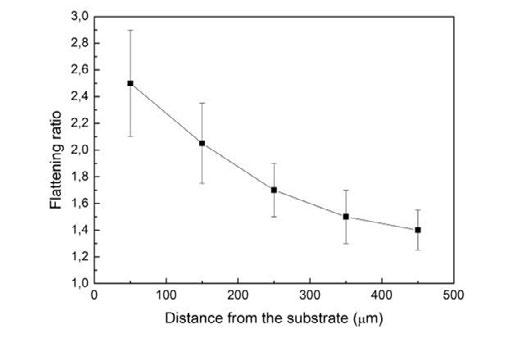
Come previsto, le particelle sono più deformate dall'interfaccia verso la parte superiore del rivestimento. Ciò è dovuto al noto fenomeno delle prime particelle che Si schiacciano al contatto con il substrato, quindi l'effetto di “peeing” delle ulteriori particelle impattanti contribuisce all'ulteriore deformazione delle particelle precedentemente depositate. Di conseguenza, le particelle sono più appiattite man mano che la loro èosizione si avvicina al substrato di acciaio [46, 47]. Questo comportamento influenzerà ovviamente le sollecitazioni residue dei rivestimenti e l'indurimento del materiale che si prevede sarà più pronunciato man mano che le misurazioni si avvicinano al substrato. Ovviamente questo è fortemente influenzato dal materiale di supporto, nel caso di supporti duri le particelle si deformano severamente all'impatto
con conseguente pronunciato rapporto di appiattimento. Al contrario, nel caso di substrati meno resistenti, molta più energia d'urto viene trasferita all'iimpatto con conseguenti minori deformazioni registrate durante l’appiattimento. Di conseguenza, nel profilo del rivestimento possono essere rilevate basse sollecitazioni residue [48]. Questo è anche legato alla modalità di deformazione delle particelle, infatti, in funzione del substrato alla durezza delle particelle, può avvenire un passaggio dall'instabilità interfacciale all'instabilità adiabatica a taglio [14, 15]. L'elevata energia all'impatto governa la severa deformazione plastica che è il principale meccanismo di formazione del rivestimento. Ciò consente l'attivazione dei meccanismi di legame e la riduzione della porosità. Sia la velocità che la temperatura delle particelle influenzano la deformazio-
La Metallurgia Italiana - Ottobre 2022 pagina 44
e
Memorie scientifiche - Trattamenti termici
Rivestimenti
ne [49]. Nel presente studio, la deposizione ad alte temperature, così come le dimensioni ottimali delle polveri consentono alle particelle di subire una forte deformazione durante la deposizione portando ad un aspetto simile a un pancake e ad un pronunciato rapporto di appiattimento. Di conseguenza vengono indotte anche elevate sollecitazioni residue nei rivestimenti [50]. L'aumento delle sollecitazioni residue consente di aumentare la vita a fa-
tica dei rivestimenti [51] anche se sono maggiori vicino ai substrati e diminuiscono verso la superficie del rivestimento. Inoltre, si ritiene che le elevate sollecitazioni residue molto vicine alla superficie del substrato migliorino l'adesione del rivestimento [52].
Il pattern XRD del rivestimento ha rivelato un notevole allargamento dei picchi anche se viene mantenuta la struttura cristallografica. (Figura 6).
Fig.6 -Modelli XRD delle polveri così come ricevute e del rivestimento spruzzato a freddo / XRD patterns of the as received powders and of the cold sprayed coating.
Dal pattern XRD del rivestimento non si osservano picchi aggiuntivi che rivelano la formazione di ossidi indesiderati. Le misurazioni XRD eseguite a diverse distanze dalla superficie rimuovendo strati di materiale progressivamen-
te hanno permesso di rivelare lo spostamento dei picchi dovuto alla presenza di sollecitazioni residue (Figura 7a). Le sollecitazioni residue risultanti, in direzione parallela a quella di spruzzatura, sono mostrate in Figura 7b.
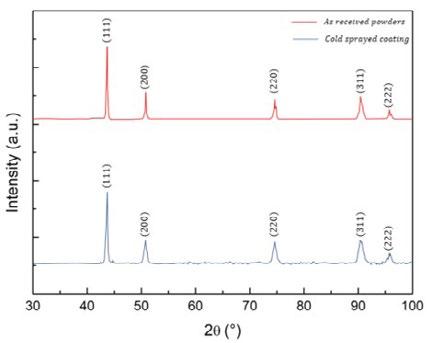
Fig.7 - Allargameno dei picchi XRD a); sollecitazioni residue misurate dalle misurazioni XRD b) - XRD peaks broadening / a); residual stresses measured from XRD measurements b).
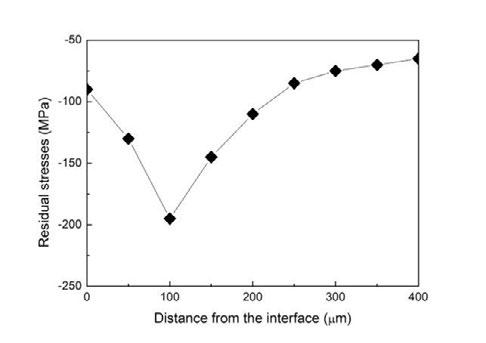
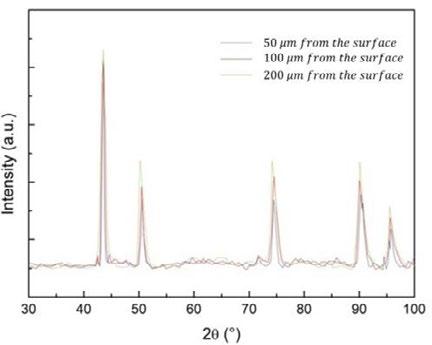
La Metallurgia Italiana - October 2022 pagina 45
Scientific papers - Heat Treatment and Coatings
Le sollecitazioni residue massime si trovano a circa 100 μ m dalla superficie del supporto. Le sollecitazioni residue diminuiscono spostandosi verso il substrato così come verso la superficie del rivestimento. Si ritiene che abbiano un buon comportamento a fatica dei rivestimenti nonché il miglioramento della forza di adesione, già valutata in lavori precedenti [9]. In generale, le sollecitazioni residue sono dovute alla forte deformazione plastica molto veloce e al rapido raffreddamento dopo l'impatto, specialmente nel caso di particelle spruzzate su substrati con diverse proprietà termiche [53]. Quindi, il motivo principale delle sollecitazioni residue nei rivestimenti a spruzzo a freddo è l'effetto del carico d'urto con conseguente velocità di deformazione ultraelevata che porta a una bassa dissipazione del calore [54]. In generale, lo sviluppo delle tensioni residue tra gli splat è molto complesso essendo correlato a complesse combinazioni di temperatura, deformazione localizzata dipendente dal tempo, [55]. Qui vengono riconosciuti e descritti tutti i meccanismi che portano all'induzione dello stato di tensioni residue di compressione. Sono legati alla deformazione elasto-plastica del suppor-
to e delle particelle (compressiva locale), alla piena plastificazione del supporto e delle particelle (simile allo shot peeing), ed infine all affinamento del grano delle particelle e all'elevata densità di dislocazione. A seconda di come questi meccanismi si evolvono e di come contribuiscono separatamente all'accumulo di sollecitazioni, il profilo e il carattere delle sollecitazioni residue possono essere ampiamente modificati.
Le sollecitazioni residue migliorano anche il comportamento a fatica del substrato poiché il rivestimento aderisce al fine di ritardare la delaminazione [56]. Ciò è principalmente attribuito al ruolo delle particelle spruzzate a freddo nel diminuire le deformazioni residue di trazione e aumentare le deformazioni di compressione nella direzione parallela a quella di spruzzatura. Ciò è amplificato dall'aumento della temperatura che porta a un maggiore appiattimento delle particelle e quindi a una migliore deformazione plastica uniforme [57]; soprattutto in materiali di rivestimento molto duri [58].
Il profilo di durezza misurato tramite nanoindentazione è mostrato in figura 8.
Fig.8 -Profilo di durezza dei rivestimenti studiati / Hardness profile of
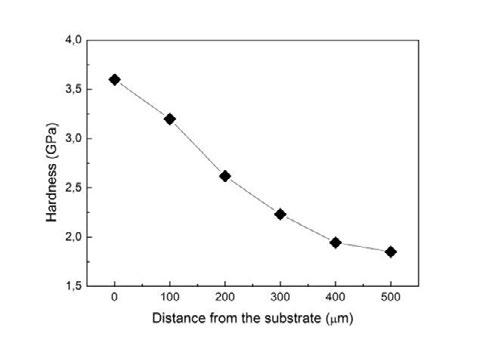
La durezza del rivestimento diminuisce da 3,6 GPa vicino all'interfaccia rivestimento-substrato a 1,6 GPa sulla superficie del rivestimento. I principali meccanismi di indurimento che avvengono nei materiali spruzzati a freddo sono l'affinamento del grano, l'incrudimento e il rafforzamento per dispersione. Ora, ogni deformazione delle particelle dipende dalla densità di energia che porta al taglio adiabatico locale che è funzione dei parametri di processo, della dimensione delle particelle e della forza delle
the studied coatings.
particelle [59]. L'ulteriore contributo dell'indurimento, rivelato dal profilo di durezza, è dovuto all'effetto “peeing” delle particelle che impattano su quelle precedentemente depositate. Un altro contributo è dovuto all'affinamento del grano più pronunciato nelle zone vicine alla superficie del substrato [60].
In generale, il comportamento a fatica dei rivestimenti spruzzati a freddo risulta difficile da indagare a causa del volume ridotto rispetto al supporto [61, 62]. Inoltre,
La Metallurgia Italiana - Ottobre 2022 pagina 46
Memorie scientifiche - Trattamenti termici e Rivestimenti
Scientific papers - Heat Treatment and Coatings
molte variabili sono legate alla geometria del campione e alla modalità di solelcitazione [63]. Inoltre, alcuni studi si concentrano sull'aspetto che la cricca si nuclea principalmente in corrispondenza dei vuoti dei rivestimenti [64]. Altre evidenze scientifiche indicano che, a seconda della preparazione della superficie del supporto, si verifica un danno da fatica in corrispondenza dei difetti superficiali [65]. Molti studi convergono sulla conclusione principale che i rivestimenti a spruzzo a freddo tendono a migliorare la vita a fatica dei campioni rivestiti [66-68]. In generale,
la modalità di deformazione e l'effetto sulla vita a fatica è dovuto alla coppia di materiali, ai parametri di processo e alla preparazione della superficie [69]. Nel presente studio, il comportamento ciclico dei rivestimenti è stato valutato attraverso prove di flessione a 3 punti condotte in vari modi. Prima di tuttop le prove sono state condotte variando la corsa massima ad un numero fisso di cicli di piegatura. Ciò è mostrato nella figura 9 dove sono tracciate le diverse curve delle curve carico-corsa.
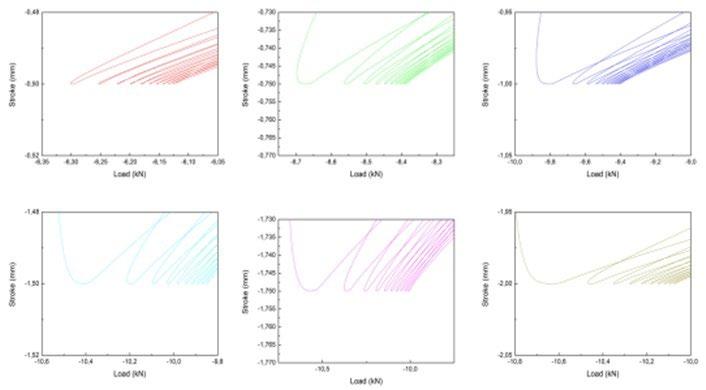
Fig.9 - Curve di flessione cicliche con corsa crescent / Cyclic bending curves with increasing stroke.
La prima corsa massima è stata fissata a 0,25 mm, dopo 200 cicli di piegatura la corsa massima è stata fissata a 0,5 mm e così via fino a 2,25 mm come mostrato in figura 8. Lo zoom per ciascuna deformazione massima e cicli selezionati è mostrato in Figura 10
Fig.10 - Curve carico-corsa per la massima deformazione e cicli selezionati / load-stroke curves for selected maximum deformation and cycles.
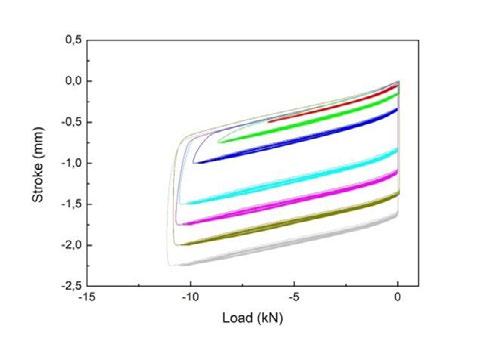
La Metallurgia Italiana - October 2022 pagina 47
Le immagini sono state acquisite interrompendo i test dopo 100 cicli. L'aspetto del rivestimento è mostrato in figura 11.
Fig.11 - Aspetto del rivestimento dopo la deformazione a flessione seguendo la procedura mostrata in figura 8 / Coating aspect after bending deformation following the procedure shown in figure 8.
Non sono state rilevate cricche sulla superficie fino a una corsa di 1,25 mm per un numero massimo di cicli di 1000. Quindi la cricca inizia al centro del provino e si propaga attraverso la massa del rivestimento portando al cedimento per distacco. Questo può essere osservato dall'aspetto del rivestimento a un ingrandimento maggiore (Figura 12).
Fig.12 - Aspetto del rivestimento dopo diversi cicli di piegatura a corsa massima crescent / coating aspect after different bending cycles at increasing maximum stroke.
Le cricche si trovano tutte nella zona di massima flessione con l'apertura centrale della fessura principale aumentando il carico massimo e il numero di cicli. Nel nostro lavoro precedente [36], il comportamento della duttilità del
rivestimento sotto flessione monotona o ciclica era correlato al numero di cricche prodotte sulla superficie prima della delaminazione del rivestimento. In questo caso la densità delle cricche prima della delaminazione è molto
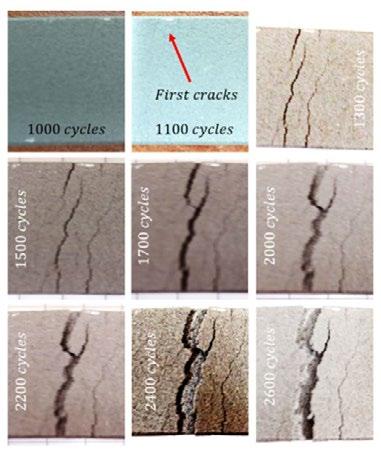
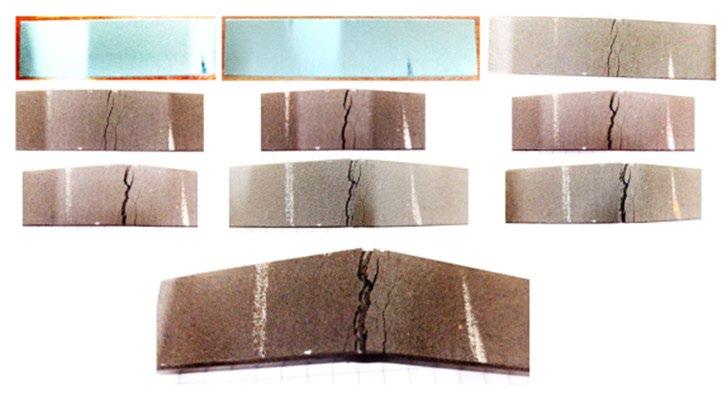
La Metallurgia Italiana - Ottobre 2022 pagina 48
scientifiche - Trattamenti termici e Rivestimenti
Memorie
Scientific papers - Heat Treatment and Coatings
bassa rivelando una macroscopica fragilità del materiale depositato. Sulla superficie del campione, infatti, prima della delaminazione, si rilevano solo due crepe principali. Ciò è dovuto principalmente al fatto che il carico ciclico porta al rilassamento delle sollecitazioni residue. Di conseguenza, le sollecitazioni residue diminuiscono perché le dislocazioni indotte dal carico ciclico convertono l'energia di deformazione della macro deformazione residua in deformazione plastica. Ciò avviene superando un dato valore critico del carico applicato e il suo effetto aumenta all'aumentare della deformazione applicata. Quindi, nel presente caso di deformazione massima ciclicamente au-
mentata, il rilassamento delle tensioni residue accelera la propagazione delle cricche. Questa è anche una spiegazione della differenza tra il comportamento delle cricche nei rivestimenti di figura 11 e quello dei rivestimenti testati con corsa massima costante che sarà descritto di seguito. Quindi, sono state condotte varie prove cicliche a diverse corse massime costanti e le prove sono state interrotte per osservare la comparsa della prima cricca, per ciascuna prova è stato registrato il numero di cicli per l'innesco di questo danno. Il riepilogo è mostrato nella figura 13 dove è tracciato il numero massimo di corse-numero di cicli rispetto alla prima comparsa della cricca.
Fig.13 - Numero di cicli in cui è stato osservato il primo danneggiamento del rivestimento con una corsa massima diversa / Number of cycles at which the first coating damage was observed at different maximum stroke. Come previsto, la prima cricca si nuclea a un numero inferiore di cicli di flessione all'aumentare della corsa massima. L'aspetto del rivestimento testato alla corsa massima di 1,5 mm per diversi cicli è mostrato in figura 14.
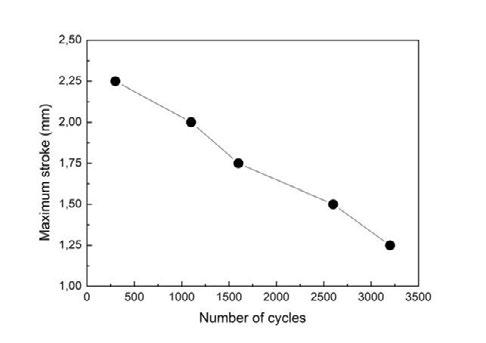
Fig.14 - Aspetto del rivestimento a diversi cicli di piegatura per una corsa massima di 1,5 mm. / Coating aspect at different bending cycles for a maximum stroke of 1.5 mm.
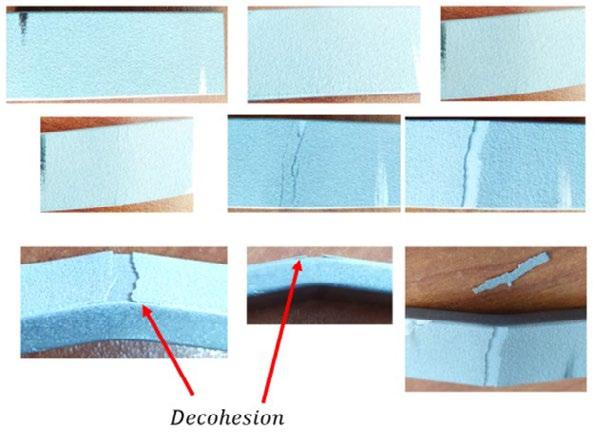
La Metallurgia Italiana - October 2022 pagina 49
Pochissimi documenti sono conclusivi come spiegazione del comportamento decoesivo dei rivestimenti spruzzati a freddo. Un modello altamente accettato considera l'energia di adesione che causa lo scollamento all'interfaccia [52]. Questa energia viene rilasciata all'interfaccia in caso di sollecitazione ciclica. Se la velocità di rilascio dell'energia di deformazione è inferiore all'energia di adesione del rivestimento, la cricca che si propaga passerebbe dal rivestimento al substrato. Al contrario, se la velocità di rilascio dell'energia di deformazione è superiore all'energia di adesione, la cricca che si propaga interagirà con lo strato di interfaccia e potrebbe verificarsi il distacco del rivestimento dal substrato. Ciò è dovuto al comportamento del rivestimento in avvicinamento all'interfaccia; come conseguenza della discontinuità del materiale, l'intensità della
cricca viene modificata e la cricca si sposta lungo l'interfaccia substrato-rivestimento [70]. In effetti, il meccanismo di decoesione del rivestimento è molto simile a quello riportato in [52] anche se nel presente caso il carico ciclico è stato eseguito in 3 punti di flessione anziché in 4 punti. Infatti, l'innesco della cricca avviene sulla superficie e porta alla ramificazione dello strato di rivestimento. Come sarà mostrato dalle osservazioni della superficie di frattura, si formano cricche sulla superficie in corrispondenza della localizzazione dei vuoti o in corrispondenza di quei difetti dovuti a particelle indeformate che rimangono inglobate nello strato di rivestimento. A maggiori ingrandimenti è possibile seguire l'evoluzione del danno che agisce sul rivestimento durante la flessione ciclica (Figura 15).
Fig.15 - Evoluzione del danno nel rivestimento dopo diversi cicli di carico a flessione con corsa massima di 1,5 mm / Damage evolution in the coating after different cycles of bending loading at 1.5 mm maximum stroke.
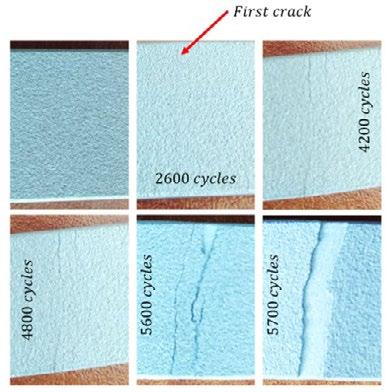
Anche in questo caso si evidenziano due principali cricche sulla superficie curvata del rivestimento che rivelano la macroscopica fragilità del materiale spruzzato prima della pronunciata delaminazione evidenziata in figura 13. Se
confrontata con le superleghe a base di Ni con substrato dentellato descritte in [36], si può notare come il presente rivestimento riveli una minore densità di cricche prima della delaminazione (Figura 16).
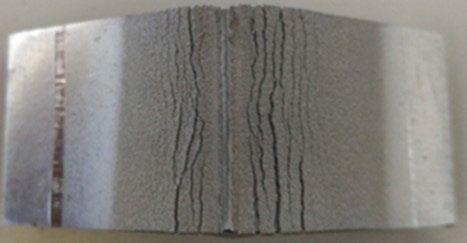
La Metallurgia Italiana - Ottobre 2022 pagina 50
Memorie scientifiche - Trattamenti termici e Rivestimenti
Fig.16 - Crepe superficiali a fatica da flessione in IN625 spruzzato a freddo su acciaio al carbonio [36]. Bending fatigue surface cracks in cold sprayed IN625 on carbon steel [36].
Scientific papers - Heat Treatment and Coatings
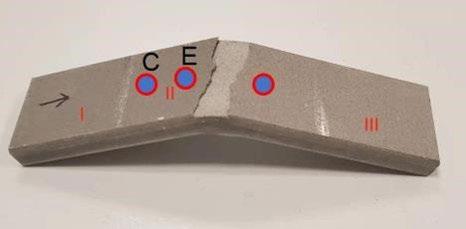
Inoltre, va osservato che nel caso di [36], il campione presentava un intaglio al centro e questo portava ad una notevole concentrazione di tensione rispetto al caso in esame. Inoltre, in [36] sono state osservate delaminazioni multiple nel campione mentre nel presente caso la cricca principale governa la delaminazione del rivestimento nelle sue vicinanze. Questo comportamento potrebbe anche essere dovuto alla migliore adesione fornita al rivestimento a causa dei parametri di processo impiegati. Infatti i materiali spruzzati erano molto simili in termini di durezza e in termini di dimensioni delle particelle di partenza. Nel caso degli HEA impiegati nel presente lavoro sono state impiegate temperature e pressioni maggiori per la deposizione dei rivestimenti. Quindi, è ragionevole che le particelle abbiano avuto un impatto con maggiore velocità subendo una deformazione plastica severa più pronunciata che porta a uno splat più elevato e una migliore adesione al substrato a causa dell'effetto peeing. Ciò può essere confermato anche dall'aumento del rapporto di appiattimento sperimentato dalle particelle del presente lavoro e descritto nella figura 3. Quindi, in conclusione, i parametri di processo impiegati (1100°C e 7 MPa) portano a un rivestimento più compatto con un notevole de-
formazione delle particelle all'impatto con conseguente elevata adesione del rivestimento al supporto. Ciò porta a un comportamento a fatica del rivestimento completamente diverso da quello rivelato da particelle di resistenza e dimensioni simili impiegate per produrre rivestimenti spruzzati a freddo ottenuti tramite temperatura e pressione inferiori. Quindi, anche se può essere rilevata una fragilità più macroscopica, si ottiene una migliore adesione del rivestimento soprattutto sotto carico ciclico. Ciò è dovuto anche all'elevata temperatura impiegata nel presente studio che porta ad un'adesione ottimale dei rivestimenti al substrato [54]. Infatti, all'aumentare della temperatura di deposizione, le multicricche sulla superficie del rivestimento tendono a scomparire e solo una fessura principale governa il comportamento alla frattura del rivestimento. Pertanto, elevate temperature di deposizione portano a una maggiore adesione e migliori prestazioni in termini di innesco delle cricche. Da un punto di vista microstrutturale, il carico di flessione ciclico porta alla concentrazione della deformazione in bande di deformazione. In effetti, sono stati ottenuti diversi campioni TEM in diverse posizioni del rivestimento piegato, come mostrato nella Figura 17.
Fig.17 - Diverse posizioni (C ed E) selezionate per le osservazioni TEM
/ Different locations (C and E) selected for the TEM observations.
Come mostrato dalla Figura 18, la deformazione si concentra in bande di deformazione caratterizzate da diverse granulometrie
La Metallurgia Italiana - October 2022 pagina 51
Fig.18 - Bande di deformazione rilevate nella zona C di figura 17 / Deformation bands revealed in the zone C of figure 17.
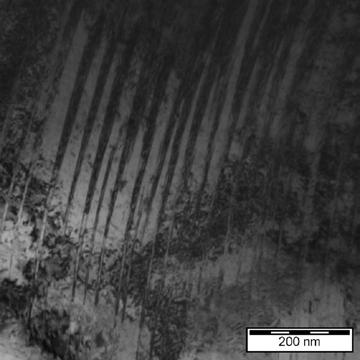
Questa concentrazione di deformazione è molto più pronunciata in quanto la zona di deformazione è più vicina alla fessura principale (zona E con deformazione maggiore, figura 19).
Fig.19 - Bande di deformazione nella zona E di figura 17 / Deformation bands in the zone E of figure 17.
Queste bande si concentrano sulle punte dei vuoti (una volta presenti) agendo come concentratori di tensione e provocando crepe (Figura 20).
Fig.20 - Bande di deformazione concentrate sulla punta del vuoto. / Deformation bands concentrating at the void tip.
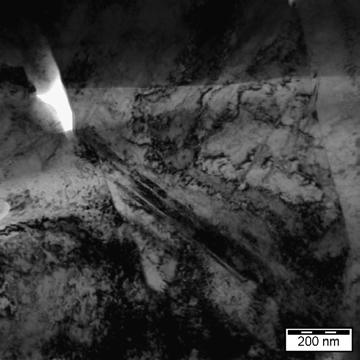
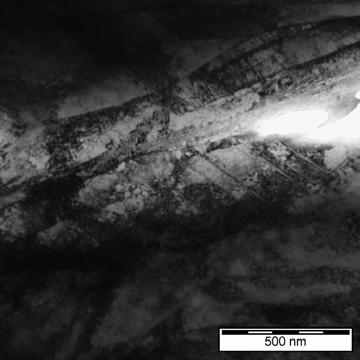
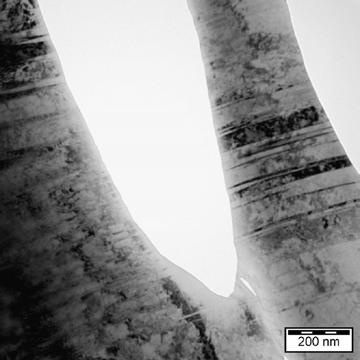
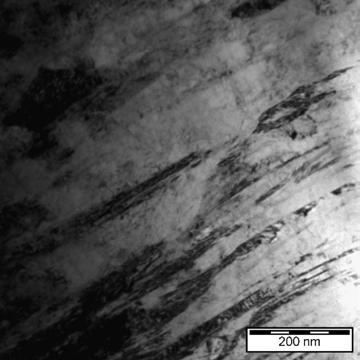
La Metallurgia Italiana - Ottobre 2022 pagina 52 Memorie scientifiche - Trattamenti termici e Rivestimenti
L'aspetto della frattura del campione testato come mostrato in figura 9 è mostrato in Figura 21.
Fig.21 - Superficie di frattura del campione testato aumentando il carico massimo flettente / Fracture surface of the sample tested by increasing the bending maximum load
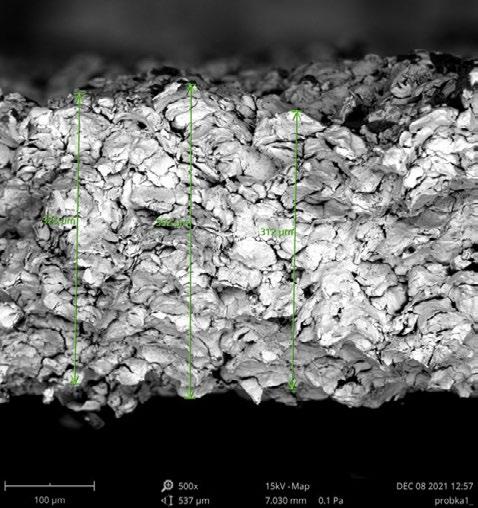
La composizione equiatomica della lega spruzzata è confermata dalle analisi EDS (Figura 22).
Fig.22 -Analisi EDS dei rivestimenti spruzzati / EDS analysis of the sprayed coatings.
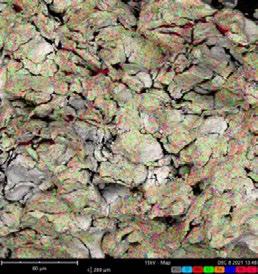
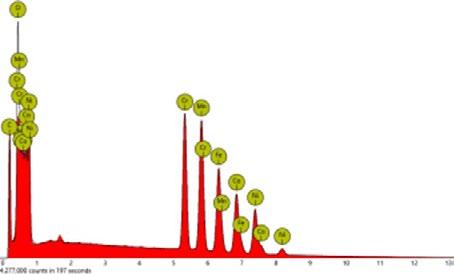
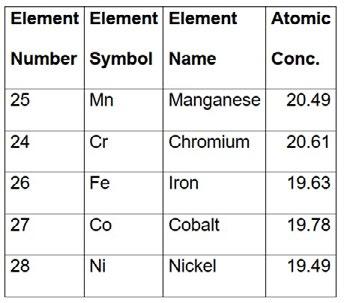
La Metallurgia Italiana - October 2022 pagina 53 Scientific papers -
Heat Treatment and Coatings
Qui, il principale meccanismo di frattura è dovuto alla decoesione particella-particella con caratteristiche di duttilità locale rivelate sulle superfici di frattura (Figura 23).
Ora, il comportamento dei meccanismi delle cricche da fatica dipende dalla sollecitazione applicata e dalla dimensione della cricca rispetto alle caratteristiche microstrutturali del materiale [71]. In molti casi, il passaggio dalla propagazione della cricca transparticellare a quella interparticellare dipende dall'intensità della sollecitazione così come dalle tensioni residue e dal profilo di durezza del ricoprimento. Ciò è attribuito al cambiamento nella dimensione della zona plastica davanti alla punta di propagazione della cricca. In questo caso, si possono incontrare particelle più deboli così come più microvuoti lungo il percorso di propagazione della cricca che porta alla decoesione particella-particella invece della frattura interparticellare. Quindi, questo comportamento generale può portare a un comportamento del rivestimento molto fragile a bassa intensità; in caso contrario, si possono osservare caratteristiche più duttili a basse intensità. Ciò è dimostrato da trattamenti termici post spray che portano ad un aumento della duttilità dei rivestimenti con conseguente diminuzione della crescita delle cricche da fatica grazie a un migliore legame tra le particelle [34]. Ciò è dovuto anche ai meccanismi di base della metallurgia delle
polveri che portano ad una diminuzione dell'effetto dei vuoti alla diffusione locale attorno ai microvuoti formatisi durante le operazioni di spruzzatura. Inoltre, diversi stati di precipitazione delle leghe trattate termicamente possono fungere da barriera alla propagazione della cricca [72]. Anche una microstruttura più fine dipendente ad una deposizione ottimale può agire come un ritardante di cricca. In generale, per le stesse polveri, i rivestimenti a spruzzo a freddo mostrano microstruttura più fine dipendente da una maggiore velocità come conseguenza della più grave deformazione plastica all'impatto. In questo caso, un rivestimento compatto accoppiato con una microstruttura fine può fornire un maggior numero di bordi di grano che impediscono lo scorrimento durante il carico [73]. Ciò è dimostrato dall'aspetto della superficie di frattura più sfaccettato dovuto alla maggiore resistenza di ciascuna particella. Molte particelle mostrano la formazione di striature locali tipiche del carico ciclico a cui sono stati sottoposti i campioni (Figura 24).
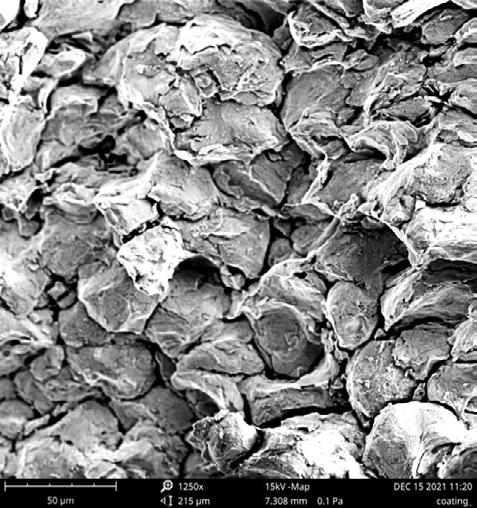
La Metallurgia Italiana - Ottobre 2022 pagina 54 Memorie scientifiche - Trattamenti
e Rivestimenti
termici
Fig.23 - Caratteristiche di duttilità locale osservate alle interfacce particella-particella dopo la frattura. / Local ductility features observed at the particle-particle interfaces after fracture.
Al contrario, le particelle che impattano con una velocità inferiore portano a rivestimenti con una forza di adesione ridotta, una tenacità alla frattura e un aspetto delle superfici di frattura molto fragile [74]. Anche in questo caso, il comportamento alla frattura è governato dalla forza di legame particella-particella. Ciò è governato dall'instabilità
di taglio all'impatto che porta a molto calore trattenuto dalle particelle portando al miglioramento della forza di legame particella-particella.
La superficie di frattura dei campioni testati ad una corsa massima di 1,5 e 2 mm è mostrata in figura 25.
Fig.25
1,5 mm (a) e 2 mm (b) / Fracture surface
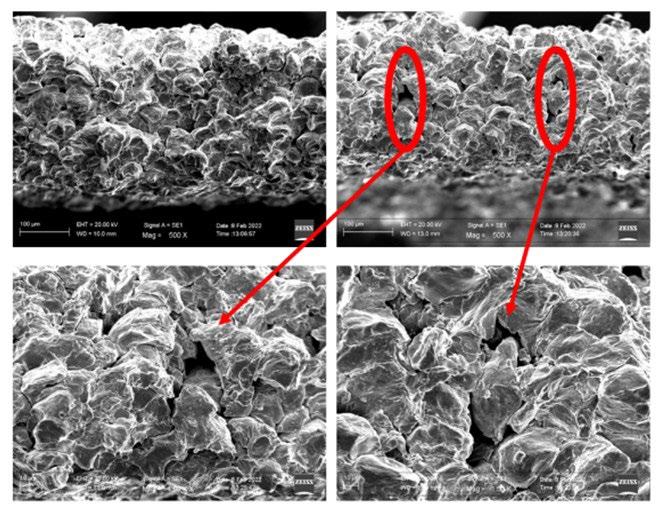
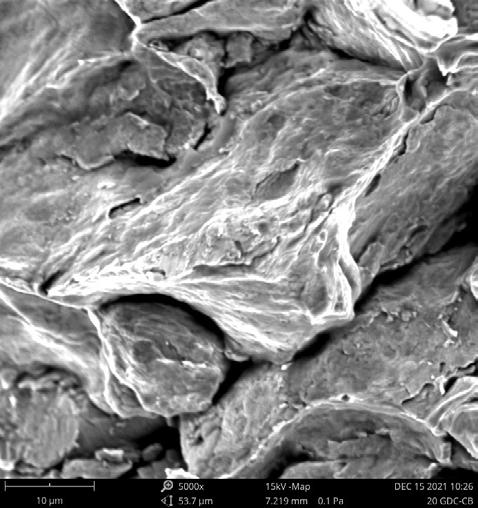
(a) and 2 mm (b).
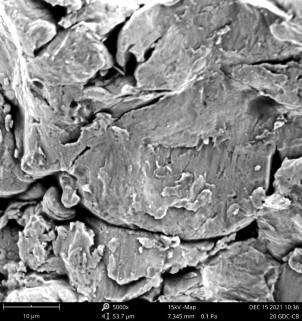
La Metallurgia Italiana - October 2022 pagina 55 Scientific papers -
Heat Treatment and Coatings
Fig.24 - Meccanismi di fatica locali osservati su singole particelle dopo la frattura / Local fatigue mechanisms observed on single particles after fracture.
- Superficie di frattura dei campioni testati in flessione ciclica alla corsa massima di
of the semples tested in cyclic bending at the maximum stroke of 1.5 mm
Anche in questo caso il principale meccanismo di frattura è dovuto alla decoesione particella-particella. La differenza principale è che all'aumentare della forza massima, au-
menta la formazione di grandi vuoti in superficie. In entrambi i casi, in ciascuna particella si osservano caratteristiche di duttilità locale (Figura 26).
Fig.26 - Meccanismi di duttilità locale sperimentati dalle particelle per una corsa massima di flessione di 1,5 mm (a) e 2 mm (b) / Local ductility mechanisms experineced by the particles for a maximum bending stroke of 1.5 mm (a) and 2 mm (b).
Osservando le zone della superficie di frattura dove sono individuati i vuoti, va evidenziato che quei vuoti tendono a formarsi dove le particelle appaiono con il loro aspetto originario (Figura 27).
Fig.27 - Formazione di vuoti alle interfacce di particelle indeformate nei campioni piegati ciclicamente alla corsa massima di 1,5 mm (a) e 2 mm (b) / Voids formation at the interfaces of undeformed particles in the samples cyclically bended at the maximu stroke of 1.5 mm (a) and 2 mm (b).
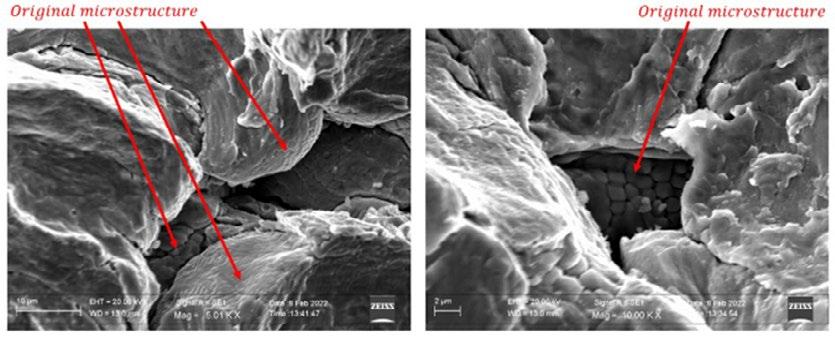
Quindi, in queste zone le particelle hanno subito una bassa deformazione e l'incastro particella-particella e la coesione locale non hanno luogo. Queste zone hanno una bassa resistenza al carico e di conseguenza si formano grandi vuoti.
Quindi, anche se i meccanismi di fatica locali possono essere individuati su ciascuna superficie delle particelle, la decoasione particella-particella avviene anche nel caso di particelle ampiamente deformate (Figura 28).
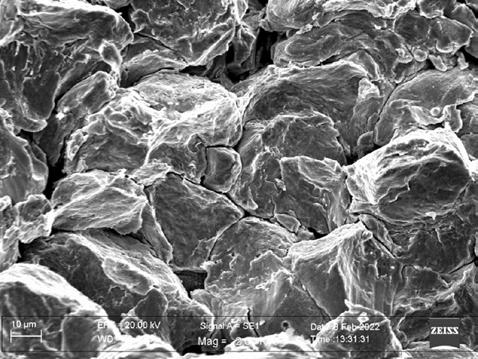
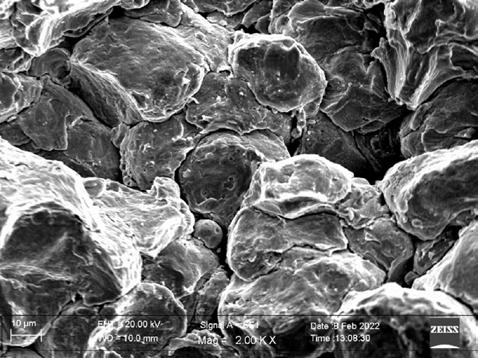
La Metallurgia Italiana - Ottobre 2022 pagina 56
Memorie scientifiche - Trattamenti termici e Rivestimenti
Fig.28 - Meccanismi di fatica nelle particelle deformate e decoesione particella-particella nel campione caricato ciclicamente in flessione alla corsa massima di 1,5 mm / Fatigue mechanisms in deformed particles and particle-particle decohesion in the sample cyclically loaded in bending at the maximum stroke of 1.5 mm.
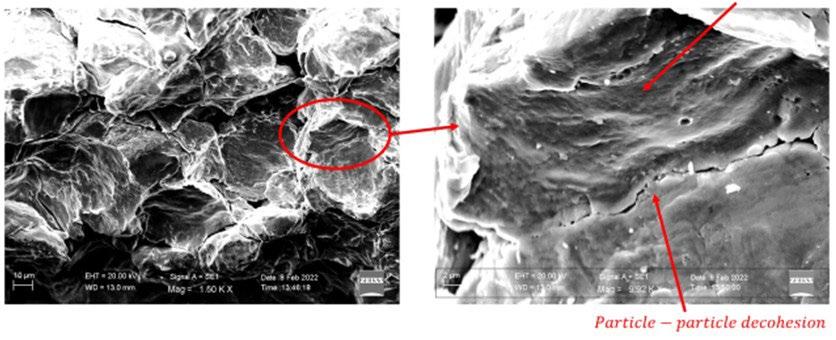
Questo comportamento è dovuto alla microstruttura delle particelle di partenza e al loro comportamento durante la fase di deformazione. Infatti la variazione della microstruttura delle particelle può portare a una diversa fisica dell'impatto e alla morfologia dell'impatto finale [75]. Infatti la morfologia delle particelle deformate può passare da semisfera perfetta con zone di getto radiale alla stessa semisfera con protuberanze irregolari a forme triangolari con simmetria tripla a forme quadrate con simmetria quadrupla. Ovviamente, al variare della morfologia anche il legame particella-particella e la resistenza complessiva del rivestimento mostrano modifiche. Questa variazione nella morfologia dipende dalla microstruttura delle particelle di partenza, man mano che la microstruttura si sposta da una equiassiale la morfologia delle particelle deformate si sposta dalla semisfera perfetta con getti radiali verso le altre. Quindi, quando la microstruttura si sposta da una a grana equiassica, le superfici di adesione particella-particella si riducono, si formano vuoti e l'aspetto della superficie di frattura appare più fragile. In quest'ottica, anche per granulometria e distribuzione di forma non uniformi, il comportamento all'impatto e all'adesione delle particelle e il conseguente aspetto di frattura possono variare notevolmente.
Un altro fattore fondamentale è rappresentato dall'effetto sull'innesco e sulla propagazione della cricca legato alle proprietà delle polveri di alimentazione [76, 77]. L'innesco della cricca poiché la frattura transparticellare dipende dallo splatting delle particelle, a carichi elevati le polve-
ri deformate di alta qualità rivelano un aspetto di frattura interparticellare mescolato con la frattura transparticellare durante la propagazione della cricca. Questo rivela la qualità del legame particella-particella anche ad elevate deformazioni. Infatti, solo le interfacce particella-particella fortemente legate sono in grado di trasferire il carico producendo la deformazione plastica locale indicata dal verificarsi di caratteristiche non fragili sulla superficie di frattura. Ciò è dimostrato da altre evidenze scientifiche in cui la propagazione della cricca è migliorata a causa di trattamenti termici post-deposizione appropriati che portano all'aumento del legame particella-particella a causa dei processi di diffusione locale che avvengono alle interfacce particella-particella [71].
CONCLUSIONI
Dai dati e dalle discussioni riportate nel presente lavoro si possono trarre le seguenti conclusioni: la spruzzatura a freddo eseguita alla temperatura di 1100 °C e 7 MPa ha permesso di ottenere rivestimenti equiatomici FeCoCrNiMn in leghe ad alta entropia con bassissima porosità ed elevata durezza con spessori di 500 μ m. Ciò è dovuto all’ elevato rapporto di appiattimento indotto nelle particelle sspruzzate grazie ai parametri di elaborazione impiegati.
Lo spostamento dei picchi XRD rivelato attraverso misurazioni strato per strato ha permesso di definire il profilo delle sollecitazioni residue lungo il rivestimento con sol-
La Metallurgia Italiana - October 2022 pagina 57 Scientific papers - Heat Treatment and Coatings
lecitazioni di compressione massime vicine a 200 MPa ad una distanza di 100 μm dall'interfaccia substrato-rivestimento.
Le prove cicliche di flessione in 3 punti, eseguite aumentando la corsa massima ad un dato numero di cicli di piegatura, hanno permesso di osservare che non si formano cricche sulla superficie fino a 1000 cicli di piegatura ad una corsa massima di 1,25 mm. Quindi una singola cricca si nuclea al centro del rivestimento e si propaga rapidamente fino al cedimento del distacco del rivestimento.
Le prove cicliche di flessione a 3 punti, eseguite ad un valore fisso della corsa massima, hanno permesso di definire il numero di cicli di comparsa della prima fessura superficiale per il valore dato della corsa massima imposta.
Come previsto, la prima cricca superficiale si nuclea con un numero minore di cicli al diminuire della corsa massima.
I meccanismi di frattura mostrano un carattere misto di fragilità del percorso di propagazione della cricca con caratteristiche duttili e di fatica locali rilevate sulla superficie della frattura. La cricca nuclea principalmente in corrispondenza dei difetti superficiali con un importante percorso transparticellare nelle prime fasi della deformazione, quindi un comportamento misto di frattura transparticellare e interparticellare viene rivelato dalla superficie della frattura. Si ritiene che i microvuoti e le particelle indeformate siano responsabili dell'accelerazione della propagazione della cricca.
REFERENCES
[1] ] J.-W. Yeh, S.-K. Chen, S.-J. Lin, J.-Y. Gan, T.-S. Chin, T.-T. Shun, C.-H. Tsau, S.-Y. Chang, Nanostructured high-entropy alloys with multiple principal elements: Novel alloy design concepts and outcomes. Adv. Eng. Mater. 6(5) (2004) 299-303. https://doi. org/10.1002/adem.200300567
[2] Y. Zhang, T.T. Zuo, Z. Tang, M.C. Gao, K.A. Dahmen, P.K. Liaw, Z.P. Lu, Microstructures and properties of high-entropy alloys. Prog. Mater. Sci. 61(1) (2014) 1-93. https://doi.org/10.1016/j.pmatsci.2013.10.001
[3] D.B. Miracle, O.N. Senkov, A critical review of high entropy alloys and related concepts. Acta Mater. 122 (2017) 488-511. https://doi. org/10.1016/j.actamat.2016.08.081
[4] F. Otto, A. Dlouhý, C. Somsen, H. Bei, G. Eggeler, E.P. George, The influences of temperature and microstructure on the tensile properties of a CoCrFeMnNi high-entropy alloy. Acta Mater. 61(15) (2013) 5743-5755. https://doi.org/10.1016/j.actamat.2013.06.018
[5] B. Gludovatz, A. Hohenwarter, D. Catoor, E.H. Chang, E.P. George, R.O. Ritchie, A fracture-resistant high-entropy alloy for cryogenic applications. Science 345(6201) (2014) 1153-1158. https://doi.org/10.1126/science.1254581
[6] Negar Yazdani, Mohammad Reza Toroghinejad,Ali Shabani, Pasquale Cavaliere, Effects of Process Control Agent Amount, Milling Time, and Annealing Heat Treatment on the Microstructure of AlCrCuFeNi High-Entropy Alloy Synthesized through Mechanical Alloying. Metals 11(9) (2021) 1493. https://doi.org/10.3390/met11091493
[7] Parisa Moazzen, Mohammad RezaToroghinejad, Pasquale Cavaliere, Effect of Iron content on the microstructure evolution, mechanical properties and wear resistance of FeXCoCrNi high-entropy alloy system produced via MA-SPS. J. Alloys Compd. 870 (2021) 159410. https://doi.org/10.1016/j.jallcom.2021.159410
[8] Parisa Moazzen, Mohammad RezaToroghinejad, Tahereh Zargar, Pasquale Cavaliere, Investigation of hardness, wear and magnetic properties of NiCoCrFeZrx HEA prepared through mechanical alloying and spark plasma sintering. J. Alloys Compd. 892 (2022) 161924. https://doi.org/10.1016/j.jallcom.2021.161924
[9] A. Silvello, P. Cavaliere, S. Yin, R. Lupoi, I. Garcia Cano, S. Dosta, Microstructural, Mechanical and Wear Behavior of HVOF and ColdSprayed High-Entropy Alloys (HEAs) Coatings. J. Therm. Spray Tech. https://doi.org/10.1007/s11666-021-01293-w
[10] Shuo Yin, Pasquale Cavaliere, Barry Aldwell, Richard Jenkins, Hanlin Liao, Wenya Li, Rocco Lupoi, Cold spray additive manufacturing and repair: Fundamentals and applications. Addit. Manuf. 21 (2018) 628-650. https://doi.org/10.1016/j.addma.2018.04.017
[11] P. Cavaliere, A. Silvello, Crack Repair in Aerospace Aluminum Alloy Panels by Cold Spray. J. Therm. Spray Technol. 26(4) (2017) 661670. https://doi.org/10.1007/s11666-017-0534-9
[12] P. Cavaliere, Cold-Spray Coatings: Recent Trends and Future perspectives. https://doi.org/10.1007/978-3-319-67183-3
[13] Hamid Assadi, Frank Gärtner, Thorsten Stoltenhoff, Heinrich Kreye, Bonding mechanism in cold gas spraying. Acta Mater. 51(15) (2003) 4379-4394. https://doi.org/10.1016/S1359-6454(03)00274-X
[14] M. Grujicic, C.L. Zhao, W.S. DeRosset, D. Helfritch, Adiabatic shear instability based mechanism for particles/substrate bonding in the cold-gas dynamic-spray process. Mater. Des. 25(8) (2004) 681-688. https://doi.org/10.1016/j.matdes.2004.03.008
La Metallurgia
-
2022 pagina 58
Italiana
Ottobre
Memorie scientifiche - Trattamenti termici e Rivestimenti
Scientific papers - Heat Treatment and Coatings
[15] M. Grujicic, J.R. Saylor, D.E. Beasley, W.S. DeRosset, D. Helfritch, Computational analysis of the interfacial bonding between feedpowder particles and the substrate in the cold-gas dynamic-spray process. Appl. Surf. Sci. 219(3-4) (2003) 211-227. https://doi. org/10.1016/S0169-4332(03)00643-3
[16] Mostafa Hassani-Gangaraj, David Veysset, Victor K. Champagne, Keith A. Nelson, Christopher A. Schuh, Adiabatic shear instability is not necessary for adhesion in cold spray. Acta Mater. 158 (2018) 430-439. https://doi.org/10.1016/j.actamat.2018.07.065
[17] Mostafa Hassani-Gangaraj, David Veysset, Keith A. Nelson, Christopher A. Schuh, In-situ observations of single micro-particle impact bonding. Scripta Mater. 145 (2018) 9-13. https://doi.org/10.1016/j.scriptamat.2017.09.042
[18] T. Stoltenhoff, H. Kreye, H.J. Richter, An analysis of the cold spray process and its coatings. J. Therm- Spray Tech. 11 (2002) 542–550. https://doi.org/10.1361/105996302770348682
[19] A. Moridi, S.M. Hassani-Gangaraj, M. Guagliano, M. Dao, Cold spray coating: Review of material systems and future perspectives. Surf. Eng. 30(6) (2014) 369-395. https://doi.org/10.1179/1743294414Y.0000000270
[20] V. Luzin, K. Spencer, M.-X. Zhang, Residual stress and thermo-mechanical properties of cold spray metal coatings. Acta Mater. 59(3) (2011) 1259-1270. https://doi.org/10.1016/j.actamat.2010.10.058
[21] Xiao-Tao Luo, Cheng-Xin Li, Fu-Lin Shang, Guan-Jun Yang, Yu-Yue Wang, Chang-Jiu Li, High velocity impact induced microstructure evolution during deposition of cold spray coatings: A review. Surf. Coat. Technol. 254 (2014) 11-20. https://doi.org/10.1016/j. surfcoat.2014.06.006
[22] Bahareh Marzbanrad, Hamid Jahed, Ehsan Toyserkani, On the evolution of substrate's residual stress during cold spray process: A parametric study. Mater. Des. 138 (2018) 90-102. https://doi.org/10.1016/j.matdes.2017.10.062
[23] P. Cavaliere, A. Silvello, Fatigue behaviour of cold sprayed metals and alloys: critical review. Surf. Eng. 32(9) (2016) 631-640. https:// doi.org/10.1179/1743294415Y.0000000100
[24] R. Ghelichi, D. MacDonald, S. Bagherifard, H. Jahed, M. Guagliano, B. Jodoin, Microstructure and fatigue behavior of cold spray coated Al5052. Acta Mater. 60(19) (2012) 6555-6561. https://doi.org/10.1016/j.actamat.2012.08.020
[25] A. Moridi, S.M. Hassani-Gangaraj, S. Vezzú, L. Trško, M. Guagliano, Fatigue behavior of cold spray coatings: The effect of conventional and severe shot peening as pre-/post-treatment. Surf. Coat. Technol. 283 (2015) 247-254. Fatigue behavior of cold spray coatings: The effect of conventional and severe shot peening as pre-/post-treatment
[26] S.B. Dayani, S.K. Shaha, R. Ghelichi, J.F. Wang, H. Jahed, The impact of AA7075 cold spray coating on the fatigue life of AZ31B cast alloy. Surf. Coat. Technol. 337 (2018) 150-158. https://doi.org/10.1016/j.surfcoat.2018.01.008
[27] P. Cavaliere, A. Silvello, Processing conditions affecting residual stresses and fatigue properties of cold spray deposits. Int J. Adv. MAnuf. Technol. 81(9-12) (2015) 1857-1862. https://doi.org/10.1007/s00170-015-7365-y
[28] K. Tetráčková, J. Kondás, M. Guagliano, Mechanical Performance of Cold-Sprayed A357 Aluminum Alloy Coatings for Repair and Additive Manufacturing. J. Therm. Spray Tech. 26 (2017) 1888–1897. https://doi.org/10.1007/s11666-017-0643-5
[29] M. Yandouzi, S. Gaydos, D. Guo, et al. Aircraft Skin Restoration and Evaluation. J. Therm. Spray Tech. 23 (2014) 1281–1290. https://doi. org/10.1007/s11666-014-0130-1
[30] P. Cavaliere, A. Silvello, Crack Repair in Aerospace Aluminum Alloy Panels by Cold Spray. J. Therm. Spray Tech. 26 (2017) 661–670. https://doi.org/10.1007/s11666-017-0534-9
[31] Sara Bagherifard, Mario Guagliano, Fatigue performance of cold spray deposits: Coating, repair and additive manufacturing cases. Int. J. Fatigue 139 (2020) 105744. https://doi.org/10.1016/j.ijfatigue.2020.105744
[32] Christopher M. Sample, Victor K. Champagne, Aaron T. Nardi, Diana A. Lados, Factors governing static properties and fatigue, fatigue crack growth, and fracture mechanisms in cold spray alloys and coatings/repairs: A review. Addit. Manuf. 36 (2020) 101371. https:// doi.org/10.1016/j.addma.2020.101371
[33] P. Cavaliere, A. Silvello, Finite element analyses of pure Ni cold spray particles impact related to coating crack behaviour. Surf. Eng. 34(5) (2018) 361-368. https://doi.org/10.1080/02670844.2017.1287555
[34] P. Cavaliere, A. Perrone, A. Silvello, Fatigue behaviour of Inconel 625 cold spray coatings. Surf. Eng. 34(5) (2018) 380-391. https://doi. org/10.1080/02670844.2017.1371872
[35] A. Silvello, P. Cavaliere, A. Rizzo, et al. Fatigue Bending Behavior of Cold-Sprayed Nickel-Based Superalloy Coatings. J. Therm. Spray Tech. 28 (2019) 930–938. https://doi.org/10.1007/s11666-019-00865-1
[36] P. Cavaliere, A. Silvello, N. Cinca, H. Canales, S. Dosta, I. Garcia Cano, J.M. Guilemany, Microstructural and fatigue behavior of cold sprayed Ni-based superalloys coatings. Surf. Coat. Technol. 324 (2017) 390-402. https://doi.org/10.1016/j.surfcoat.2017.06.006
[37] Yaxin Xu, Wenya Li, Longzhen Qu, Xiawei Yang, Bo Song, Rocco Lupoi, Shuo Yin, Solid-state cold spraying of FeCoCrNiMn highentropy alloy: an insight into microstructure evolution and oxidation behavior at 700-900 °C. J. Mater. Sci. Technol. 68 (2021) 172-183. https://doi.org/10.1016/j.jmst.2020.06.041
[38] JE. Ahn, YK. Kim, SH .Yoon, et al. Tuning the Microstructure and Mechanical Properties of Cold Sprayed Equiatomic CoCrFeMnNi High-Entropy Alloy Coating Layer. Met. Mater. Int. 27 (2021) 2406–2415. https://doi.org/10.1007/s12540-020-00886-4
[39] David Funes Rojas, Haoyang Li, Okan K. Orhan, Chenwei Shao, James D. Hogan, Mauricio Ponga, Mechanical and microstructural properties of a CoCrFe0.75NiMo0.3Nb0.125 high-entropy alloy additively manufactured via cold-spray. J. Alloys Compd. 893 (2022) 162309. https://doi.org/10.1016/j.jallcom.2021.162309
[40] Y.-K. Kim, G.-S. Ham, H. S. Kim, K.-A. Lee, High-cycle fatigue and tensile deformation behaviors of coarse-grained equiatomic CoCrFeMnNi high-entropy alloy and unexpected hardening behavior during cyclic loading. Intermetallics 111 (2019) 106486. https:// doi.org/10.1016/j.intermet.2019.106486
La Metallurgia Italiana - October 2022 pagina 59
[41] Y. P. Lu, X. Gao, L. Jiang, Z. Chen, T. Wang, J. Jie, H. Kang, Y. Zhang, S. Guo, H. Ruan, Y. Zhao, Z. Cao, T. Li, Directly cast bulk eutectic and near-eutectic high entropy alloys with balanced strength and ductility in a wide temperature range. Acta Mater. 124 (2017) 143–150. https://doi.org/10.1016/j.actamat.2016.11.016
[42] M.L. Brocq, P.-A. Goujon, J. Monnier, B. Villeroy, L. Perrire, R. Pirs, G. Garchin, Microstructure and mechanical properties of a CoCrFeMnNi high entropy alloy processed by milling and spark plasma sintering, J. Alloy. Comp. 780 (2019) 856-865. https://doi. org/10.1016/j.jallcom.2018.11.181
[43] R. Ghelichi, S. Bagherifard, D. Mac Donald, M. Brochu, H. Jahed, B. Jodoin, M. Guagliano, Fatigue strength of Al alloy cold sprayed with nanocrystalline powders. Int. J. Fatigue 65 (2014) 51–57. https://doi.org/10.1016/j.ijfatigue.2013.09.001
[44] Pengfei Yu, Ningsong Fan, Yongyun Zhang, Zhijun Wang, Wenya Li, Rocco Lupoi, Shuo Yin, Microstructure evolution and composition redistribution of FeCoNiCrMn high entropy alloy under extreme plastic deformation. Mater. Res. Lett. 10(3) (2022) 124–132. https://doi.org/10.1080/21663831.2021.2023678
[45] H. Assadi, H. Kreye, F. Gartner, T. Klassen, Cold spraying a materials perspective, Acta Mater. 116 (2016) 382-407. https://doi. org/10.1016/j.actamat.2016.06.034
[46] W. Wong, P. Vo, E. Irissou, A.N. Ryabinin, J.-G. Legoux, S. Yue, Effect of particle morphology and size distribution on cold-sprayed pure titanium coatings. J. Therm. Spray Technol. 22 (7) (2013) 1140-1153. https://doi.org/10.1007/s11666-013-9951-6
[47] H. Assadi, T. Schmidt, H. Richter, J.O. Kliemann, K. Binder, F. Gärtner, T. Klassen, H. Kreye, On parameter selection in cold spraying. J. Therm. Spray Technol. 20 (6) (2011) 1161-1176. https://doi.org/10.1007/s11666-011-9662-9
[48] K. Spencer, V. Luzin, N. Matthews, M.X. Zhang, Residual stresses in cold spray al coatings: the effect of alloying and of process parameters, Surf. Coat. Technol., 206 (2012) 4249-4255. https://doi.org/10.1016/j.surfcoat.2012.04.034
[49] P.D. Eason, J.A. Fewkes, S.C. Kennett, T.J. Eden, K. Tello, M.J. Kaufman, M. Tiryakioglu, On the characterization of bulk copper produced by cold gas dynamic spray processing in as fabricated and annealed conditions, Mater. Sci. Eng. A528 (2011) 8174-8178. https://doi.org/10.1016/j.msea.2011.07.012
[50] P. Cavaliere, A. Perrone, A. Silvello, Crystallization evolution of cold sprayed pure Ni coatings, J. Therm. Spray Technol., 25 (6) (2016) 1158-1167. https://doi.org/10.1007/s11666-016-0430-8
[51] R. Singh, S. Schruefer, S. Wilson, J. Gibmeier, R. Vassen, Influence of coating thickness on residual stress and adhesion-strength of cold-sprayed Inconel 718 coatings. Surf. Coat. Technol. 350 (2018) 64–73. https://doi.org/10.1016/j.surfcoat.2018.06.080
[52] ] B. White, W.A. Story, L. Brewer, J. Jordon, Fracture mechanics methods for evaluating the adhesion of cold spray deposits. Eng. Fract. Mech. 205 (2019) 57–69. https://doi.org/10.1016/j.engfracmech.2018.11.009
[53] E. Lin, Q. Chen, O.C. Ozdemir, et al. Effects of Interface Bonding on the Residual Stresses in Cold-Sprayed Al-6061: A Numerical Investigation. J. Therm. Spray Tech. 28 (2019) 472–483. https://doi.org/10.1007/s11666-019-00827-7
[54] Davoud M. Jafarlou, Gehn Ferguson, Kyle L. Tsaknopoulos, Andrew Chihpin Chuang,Aaron Nardi, Danielle Cote, Victor Champagne, Ian R. Grosse, Structural integrity of additively manufactured stainless steel with cold sprayed barrier coating under combined cyclic loading. Additive Manuf. 35 (2020) 101338. https://doi.org/10.1016/j.addma.2020.101338
[55] V. Luzin, O. Kirstein, S.H. Zahiri, et al. Residual Stress Buildup in Ti Components Produced by Cold Spray Additive Manufacturing (CSAM), J Therm Spray Tech 29 (2020) 1498–1507. https://doi.org/10.1007/s11666-020-01048-z
[56] J. Cizek, M. Matejkova, I. Dlouhy, F. Siska, C.M. Kay, J. Karthikeyan, S. Kuroda, O. Kovarik, J. Siegl, K. Loke, K.A. Khor, Influence of cold-sprayed, warm-sprayed, and plasma-sprayed layers deposition on fatigue properties of steel specimens, J. Therm. Spray Technol. 24 (5) (2015) 758–768, https://doi.org/10.1007/s11666-015-0240-4.
[57] Ahmed Fardan, Christopher C. Berndt, Rehan Ahmed, Numerical modelling of particle impact and residual stresses in cold sprayed coatings: A review, Surf. Coat. Technol. 409 (2021) 126835. https://doi.org/10.1016/j.surfcoat.2021.126835
[58] Rajab Ali Seraj, Amir Abdollah-zadeh, Sergi Dosta, Horacio Canales, Hamid Assadi, Irene Garcia Cano, The effect of traverse speed on deposition efficiency of cold sprayed Stellite 21, Surf. Coat. Technol. 366 (2019) 24-34. https://doi.org/10.1016/j.surfcoat.2019.03.012
[59] P.-H. Gao, C.-J. Li, G.-J. Yang, Y.-G. Li, C.-X. Li, Influence of substrate hardness on deposition behavior of single porous WC-12Co particle in cold spraying. Surf. Coat. Technol. 203 (2008) 384-390. https://doi.org/10.1016/j.surfcoat.2008.09.016
[60] V.K. Champagne, D.J. Helfritch, M.D. Trexler, B.M. Gabriel, The effect of cold spray impact velocity on deposit hardness, Modell. Simul. Mater. Sci. Eng. 18 (6) (2010) 065011. https://doi.org/10.1088/0965-0393/18/6/065011
[61] T. Schmidt, F. Gaertner, H. Kreye, New developments in cold spray based on higher gas and particle temperatures. J. Therm. Spray Technol. 15 (4) (2006) 488–494. https://doi.org/10.1361/105996306X147144
[62] A. Moridi, S.M. Hassani-Gangaraj, M. Guagliano, On fatigue behavior of cold spray coating. MRS Online Proc. Libr. 1650 (2014), https:// doi.org/10.1557/opl.2014.438.
[63] S. Bagherifard, S. Monti, M.V. Zuccoli, M. Riccio, J. Kondás, M. Guagliano, Cold spray deposition for additive manufacturing of freeform structural components compared to selective laser melting, Mater. Sci. Eng. A 721 (2018) 339–350. https://doi.org/10.1016/j. msea.2018.02.094
[64] Y. Yamazaki, H. Fukanuma, N. Ohno, Anisotropic mechanical properties of the free-standing cold sprayed SUS316 coating and the effect of the post-spray heat treatment on it. J. Jpn. Therm. Spraying Soc. 53 (3) (2016) 91–95.
[65] T.S. Price, P.H. Shipway, D.G. McCartney, Effect of cold spray deposition of a titanium coating on fatigue behavior of a titanium alloy. J. Therm. Spray Technol. 15 (4) (2006) 507–512. https://doi.org/10.1361/105996306X147108
[66] Y. Xiong, M.-X. Zhang, The effect of cold sprayed coatings on the mechanical properties of AZ91D magnesium alloys. Surf. Coat. Technol. 253 (2014) 89–95. https://doi.org/10.1016/j.surfcoat.2014.05.018
La Metallurgia Italiana - Ottobre 2022 pagina 60
Memorie scientifiche - Trattamenti termici e Rivestimenti
Scientific papers - Heat Treatment and Coatings
[67] Z.-c. Shi, X.-y. Zhang, H. Chen, F.-z. Ding, B. Yu, Z.-h. Tang, F. Lu, Properties of cold spray Al/Zn coatings on high-strength steel. J. Mater. Eng. 43 (2) (2015) 14–19. https://doi.org/10.3969/j.issn.1001-4381.2013.06.001
[68] M. Ševeček, J. Krejčí, M. Shahin, J. Petrik, R. Ballinger, K. Shirvan, Fatigue behavior of cold spray-coated accident tolerant cladding, Topfuel Prague, Czech Republic (2018).
[69] J. Cizek, O. Kovarik, J. Siegl, K.A. Khor, I. Dlouhy, Influence of plasma and cold spray deposited Ti Layers on high-cycle fatigue properties of Ti6Al4V substrates. Surf. Coat. Technol. 217 (2013) 23–33. https://doi.org/10.1016/j.surfcoat.2012.11.067
[70] T.C. Wang, 8.03 - fundamentals of interface mechanics, Comprehens. Struct. Integr. (2003) 89–135.
[71] A.G. Gavras, D.A. Lados, V.K. Champagne, R.J. Warren, Effects of processing on microstructure evolution and fatigue crack growth mechanisms in cold-spray 6061 aluminum alloy, Int. J. Fatigue 110 (2018) 49–62, https://doi.org/10.1016/j.ijfatigue.2018.01.006.
[72] T. Hussain, D.G. McCartney, P.H. Shipway, D. Zhang, Bonding mechanisms in cold spraying: The contributions of metallurgical and mechanical components. J Therm Spray Technol 18(3) (2009) 364–379. https://doi.org/10.1007/s11666-009-9298-1
[73] A.G. Gavras, D.A. Lados, V. Champagne, R.J. Warren, D. Singh, Small fatigue crack growth mechanisms and interfacial stability in cold-spray 6061 aluminum alloys and coatings, Metall. Mater. Trans. A. 49 (12) (2018) 6509–6520, https://doi.org/10.1007/s11661018-4929-0.
[74] B.B. Bangstein, M. Ellingsen, N. Scholl, Fracture toughness of cold spray aluminum 6061 deposit, south dakota school of mines and technology, Rapid City (2015).
[75] Roghayeh Nikbakht, Mohammad Saadati, Taek-Soo Kim, Mohammad Jahazi, Hyoung Seop Kim, Bertrand Jodoin, Cold spray deposition characteristic and bonding of CrMnCoFeNi high entropy alloy, Surf. Coat. Technol. 425 (2021) 127748. https://doi. org/10.1016/j.surfcoat.2021.127748
[76] O. Kovarik, J. Siegl, J. Cizek, T. Chraska, J. Kondas, Fracture Toughness of Cold Sprayed Pure Metals. J Therm Spray Technol 29(1) (2020) 147–157. https://doi.org/10.1007/s11666-019-00956-z
[77] O. Kovarik, J. Cizek, S. Yin, et al. Mechanical and Fatigue Properties of Diamond-Reinforced Cu and Al Metal Matrix Composites Prepared by Cold Spray. J Therm Spray Tech (2022). https://doi.org/10.1007/s11666-022-01321-3.
[78] Sara Bagherifard, Jan Kondas, Stefano Monti, Jan Cizek, Fabrizio Perego, Ondrej Kovarik, Frantisek Lukac, Frank Gaertner, Mario Guagliano, Tailoring cold spray additive manufacturing of steel 316 L for static and cyclic load-bearing applicationsm Mater. Des. 203 (2021) 109575. https://doi.org/10.1016/j.matdes.2021.109575
Dynamic loading behaviour of CrMnFeCoNi cold spray coatings
FeCoCrNiMn high entropy alloy powders were employed to produce coatings on carbon steel through high pressure cold spray. The microstructure of the sprayed coatings, characterized through optical and electron microscopy as well as through X-ray diffraction revealed a low porosity compact aspect of the cross sections as well as the retention of the body centered cubic crystallographic structure after particles splat. A high flattening ratio of the particles, measured by the scanning electron microscope observations, indicated an excellent adhesion of the coating to the substrate. Residual stresses of the coatings were measured through X-ray diffraction at different levels of the coating thickness; the hardness profile was revealed through nanoindentation. The cyclic behavior of the coatings was evaluated through 3 point bending tests. Cyclic tests were performed by increasing the maximum stroke from 0.3 to 2.4 mm with steps of 0.3 mm each 200 bending cycles. Other 3-point bending tests were conducted at fixed maximum stroke at the same deformation levels indicated for the previous test. Each 100 cycles the test is stopped and the coating surface is observed in order to monitor the superficial fracture behavior. The fracture surface of the coatings after rupture were observed through scanning electron microscopy in order to describe the rupture features related to the different loading conditions imposed to the coatings.
La Metallurgia Italiana - October 2022 pagina 61
TORNA ALL'INDICE >
KEYWORDS: HIGH ENTROPY ALLOY, COLD SPRAY, RESIDUAL STRESSES, MECHANICAL PROPERTIES, CYCLIC DEFORMATION, FRACTURE MECHANISMS;
Application of Muon Radiography to Blast Furnaces: the BLEMAB project
A. Lorenzon, P. Andreetto, P. Checchia, I. Calliari, L. Pezzato, F. Ambrosino, L. Cimmino M. D’Errico G. Saracino V. Masone, L. Bonechi, S. Bottai, C. Cialdai, R. Ciaranfi, O. Starodubtsev, L. Viliani V. Ciulli, R. D’Alessandro, S. Gonzi, G. Bonomi, D. Borselli, T. Buhles, F. Finke, A. Franzen, J. Sauerwald, U. Chiarotti, V. Moroli, F. Volzone, B. Glaser, B. V. Rangavittal, O. Nechyporuk, D. Ressegotti
Muon radiography is a non-invasive imaging technique that exploits cosmic ray muons to explore the content of large, dense and otherwise inaccessible volumes. The European project BLEMAB (BLast furnace stack density Estimation through on-line Muon ABsorption measurements) represents an exemplary application of this technique in the industrial field: the aim of the project is indeed to investigate the capability of muon radiography to scan the inner part of active iron-making blast furnaces. In particular, the focus of the study is the characterization of the so-called “cohesive zone”, which could be of great interest for steel-making companies. The project foresees the construction of a dedicated muon imaging detector, that will be installed at the blast furnaces in the ArcelorMittal site in Bremen (Germany). This paper describes the status of the project, including the development of software simulations and the manufacturing of the detector.
BLAST FURNACE,
INTRODUCTION: MUON RADIOGRAPHY
Muon radiography is an innovative and non-destructive imaging technique that relies on the detection of cosmic-ray muons passing through the volume to be inspected. Muons are charged elementary particles that are naturally produced in the interactions of primary cosmic rays coming from the outer space (mainly protons) with the Earth atmosphere. After the collisions of the primary particles with the nuclei in the atmosphere, a lot of secondary particles are created in cascade (air shower) and propagates down towards the Earth’s surface: the majority of these secondaries can’t reach the ground, except for muons, which enjoy a relatively long lifetime and a high penetration power. With a flux rate of ~170 Hz/m2, they are the most numerous charged particles at sea level [1]: the natural abundance and the continuous availability of muons are two key aspects that favored the development of imaging techniques exploiting these particles, such as muon radiography. Similarly to X-ray radiography, this technique allows to reconstruct the internal structure of the targeted object, but thanks to the higher penetration power of muons with respect to X-rays, muon radiography can be applied to more large, massive and dense bodies. The method is based on the measurement of the attenuation of the cosmic ray muon flux [2]: in fact, depending on the thickness and the composition of the volume under
A. Lorenzon, P. Andreetto, P. Checchia, I. Calliari, L. Pezzato University of Padua, Padua, Italy
F. Ambrosino, L. Cimmino M. D’Errico G. Saracino V. Masone
University of Naples “Federico II”, Naples, Italy
L. Bonechi, S. Bottai, C. Cialdai, R. Ciaranfi, O. Starodubtsev, L. Viliani V. Ciulli, R. D’Alessandro, S. Gonzi University of Florence, Florence, Italy
G. Bonomi
University of Brescia, Brescia, Italy - INFN, Pavia Division, Pavia, Italy
D. Borselli
University of Perugia, Perugia, Italy
T. Buhles, F. Finke, A. Franzen, J. Sauerwald
ArcelorMittal Bremen GmbH, Bremen, Germany University of Padua, Padua, Italy
U. Chiarotti, V. Moroli, F. Volzone
RINA Consulting, Centro Sviluppo Materiali SpA, Rome, Italy
B. Glaser, B. V. Rangavittal
KTH Royal Institute of Technology, Stockholm, Sweden
O. Nechyporuk
ArcelorMittal Maizières Research SA, Maizières-lès-Metz, France
D. Ressegotti
RINA Consulting, Centro Sviluppo Materiali SpA, Dalmine (BG), Italy
La Metallurgia Italiana - Ottobre 2022 pagina 62 Memorie scientifiche - Off Topic
KEYWORDS:
IMAGING, MUON RADIOGRAPHY;
inspection, a certain number of muons will be absorbed. A dedicated muon detector can be placed downstream of the target volume to get a measurement of the muon flux: by comparison with the measurement of the muon flux in the same direction but in the absence of the target (free-sky) and with numerical simulations, a 2-dimensional map of the density distribution of the target can be obtained. By repeating the measurements from different angles (or equivalently by using more muon detectors at once), a 3-dimensional reconstruction can also be performed. Since its first application in 1955 by E.P. George, who gave a measurement of the thickness of rock overlying an underground powerhouse in Australia’s Snowy Mountains Scheme by exploiting cosmic-ray muons [3], this technique has been used in a growing number of fields. A striking example dates back to 1970, when the Nobel prize winner L. W. Alvarez and his team placed a muon detector inside Chepren’s pyramid to probe its inner structure in search of secret hidden chambers [4], opening the path for muon radiography application to archaeological surveys, such as [5][6]. One of the most widespread applications of muon radiography is the imaging of volcanoes for hazard prevention: several volcanoes around the world have been monitored through cosmic-ray muons, e.g. [7][8]. Besides volcanology there are many others geological applications that have been explored by cosmic-ray muons: mineral
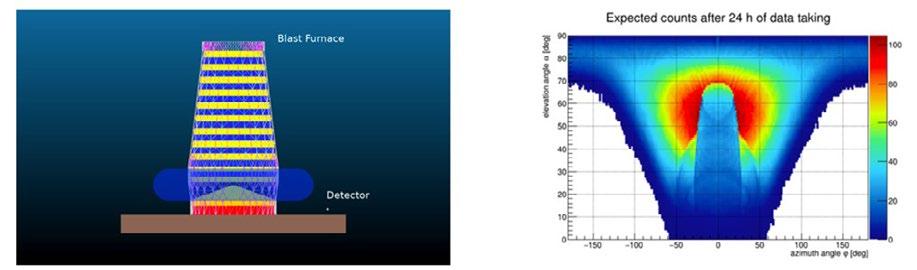
explorations [9] and research of natural caves [10], just to cite a few. This technique has been proposed also in other fields, such as nuclear controls, to inspect the content of nuclear waste containers [11], and civil engineering, where the detection of hidden underground cavities can be interesting for infrastructure stability [12]. A complete review of muon radiography applications can be found at reference [2].
THE BLEMAB PROJECT
The main goal of the BLEMAB European project (BLast furnace stack density Estimation through on-line Muon ABsorption measurements) is to test the imaging capability of the muon radiography technique on the inner volume of active blast furnaces. A blast furnace is a vertical shaft furnace used in metallurgical industries to produce liquid metals (generally pig iron but also lead and copper), for subsequent processing and industrial utilization. In an ironmaking blast furnace, iron-bearing materials (iron ore pellets) and a reducing agent (coke) are charged in layers at the top of the furnace, while a hot blast of air under pressure is introduced at the bottom. As the burden descends through the shaft and heats up, chemical reactions take place with the ascending combustion gases, to produce molten iron and slag.
A crucial region inside the blast furnace is the cohesive zone, usually located in the central part of the shaft, where temperatures are such that the iron-bearing material begins to soften until it melts completely. From dissection of quenched blast furnaces it was clear that there is an im-
portant relationship between the shape and the location of the cohesive zone and the operation conditions of the blast furnace [13], such as the distribution of the charging materials, the descent behavior of the burden and the conditions in the combustion zone: without a proper shape, the
La Metallurgia Italiana - October 2022 pagina 63
Scientific papers - Off Topic
Fig.1 - (Left) Geometry of the furnace implemented in the fast simulation tool; the elements constituting the blast furnace geometry are indicated with different colors. (Right) Expected angular distribution of muon events after 24h of data-taking. Picture from [22]. / (Sinistra) Geometria dell’altoforno implementata nel simulatore fast; i diversi colori indicano i vari elementi che costituiscono la geometria dell’altoforno. (Destra) Distribuzione angolare dei muoni prevista in 24h di presa dati. Immagine da [22].
cohesive zone would block the gas flow through the coke layers, giving rise to erratic burden descent [14]. It is a common practice in many blast furnaces to adjust the shape of the cohesive zone based on the distribution of materials at the charging, relying on indirect estimations and experience. Therefore, the development of a method to get an accurate measurement of the position and shape of the cohesive zone has become an important issue, and would be of great interest for steel-making companies as it could lead to a stable and efficient operation of blast furnaces. Currently the investigations on the cohesive zone are carried out using a combined approach based on mathematical models and direct measurements of the internal state of the furnace. In the past, several techniques of direct measurements have been developed, including (i) the tracking of radioisotopes injected into the blast furnace [13], (ii) vertical probes with conducting cables [13], (iii) multi point vertical probes (MPVP) [15], (iv) core drilling and furnace dissection [16]. In this context, muon radiography could provide a direct and accurate measurement of the cohesive zone, but with some advantages with the respects to the investigation methods mentioned above: in particular it is a non-invasive technique, it exploits a natural and freely-available source of radiation (the muons) and it is not dangerous for operators. For these reasons, in the past there have been some proposals to investigate the interior of blast furnaces with muon imaging techniques [17]
SOFTWARE SIMULATIONS
[18]. In particular, the European project Mu-Blast [19] has demonstrated the feasibility to study the inner part of blast furnaces with muon-based imaging techniques. Building on the achievements of the Mu-Blast studies, the BLEMAB project proposes to use the muon radiography technique to obtain a precise and direct information on the blast furnace inner state during its operation including the measurement of the position and the shape of the cohesive zone: for this purpose a dedicated muon detector will be constructed and installed at the blast furnaces in the ArcelorMittal site in Bremen (Germany); the collected data will be elaborated through a dedicated reconstruction software and compared with the results of simulations. The software simulations and the experimental apparatus developed for the BLEMAB project will be described in the following sections. The measurements obtained with the muon radiography technique will be compared for validation with the measurements of a new enhanced Multi Point Vertical Probe (eMPVP) and with mathematical blast furnace models. The eMPVP is developed by ArcelorMittal Maizières Research (AMMR) starting from the technology currently in use at ArcelorMittal sites and it will be able to measure the gas temperature along the whole furnace height; the mathematical modeling of the blast furnace is carried out with two different approaches by RINA Consulting - Centro Sviluppo Materiali (CSM) and the Royal Institute of Technology (KTH).
Fig.2 - Display of one event generated with the full MC simulation tool. The elements constituting the blast furnace are indicated with different colors; it is also possible to observe the generated muon trajectory and the detector’s geometry, which is reproduced in 24 copies around the blast furnace in order to maximize the number of simulated events available for the reconstruction of the density map. / Display di un evento generato con il simulatore completo. Gli elementi che costituiscono la geometria dell’altoforno sono visibili in diversi colori; è possibile osservare anche la traiettoria del muone generato e la geometria del rivelatore, che è riprodotto in 24 copie intorno alla fornace per massimizzare il numero di eventi simulati che è possibile utilizzare per la ricostruzione della mappa di densità.
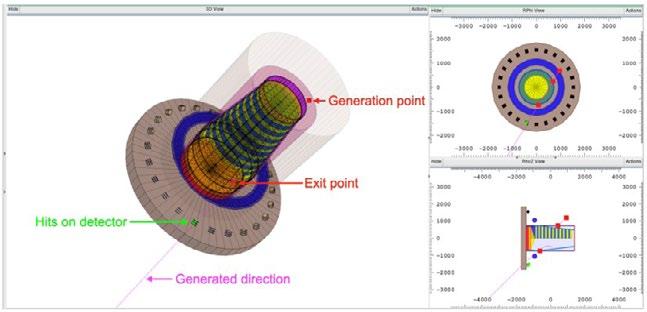
La Metallurgia Italiana - Ottobre 2022 pagina 64 Memorie scientifiche - Off Topic
In the BLEMAB project software simulations are implemented for two main reasons: firstly, to get a preliminary estimate of the muon rate, so that the characteristics of the experimental apparatus can be defined, and secondly, to perform a comparison with the experimental data and obtain the density distribution of the material inside the blast furnace. To address these issues, two different implementations has been developed: a fast simulation tool and a full Monte Carlo (MC) simulation tool. The fast simulation tool is used for the evaluation of the feasibility of the experiment; it has been developed starting from a software already available and successfully used
in other muon radiography applications [20]. This simulation contains the geometry of the blast furnace and a realistic muon generator, that was developed on the basis of the measurements conducted with the ADAMO magnetic spectrometer in Florence [21], so that the simulated muons reproduce the same energy and angular distribution of the observed ones. In this tool, the interactions of muons with the matter are not simulated, and the detector is simplified to a point-like object. Fig. 1 shows the CAD model of the furnace used for fast simulations and the expected muon counts after 24h of data-taking.
Fig.3 - (Left) Design of the BLEMAB detector: the muon tracker is made of three modules, each of them giving the (x,y) coordinates of the muon trajectory. (Center) The detector will be enclosed in an aluminum box and mounted on a rotating platform that allows to setup its inclination. (Right) The metal frame housing the detector and the cooling system is shown only partially in yellow. / (Sinistra) Design del rivelatore BLEMAB: il tracciatore è costituito da tre moduli, ognuno dei quali fornisce le coordinate (x,y) della traiettoria del muone. (Centro) Il rivelatore sarà racchiuso in un involucro di alluminio e montato su una struttura che consentirà di impostarne l’inclinazione. (Destra) In giallo è indicata la struttura metallica, qui visibile solo parzialmente, che racchiuderà il rivelatore e il sistema di raffreddamento.
The full MC simulation tool is developed inside the Virtual Monte Carlo (VMC) [23] framework, that includes the Geant4 package [24] and the ROOT package [25]. Geant4 is a toolkit widely used in particle physics to simulate the passage of particles through matter and their interactions: it offers a large range of functionalities, such as tracking particles, handling complex geometry, replicating the functioning of a detector, and it can be easily adapted in different applications. ROOT is a framework for data processing originally developed at CERN, that includes all the packages required to handle and analyze data. The BLEMAB full MC simulation contains (i) a realistic representation of a blast furnace, with all its elements and their relative material composition; (ii) a realistic representation of the detector that will be used for data-taking; (iii) a realistic muon generator, based on the EcoMug package algorithms [26].
The datasets generated with the full MC simulation tool will be used for comparison with the measurements obtained from experimental data. Fig. 2 represents an event display of one event generated with the full MC simulation tool: the muon is generated on a cylindrical surface surrounding the blast furnace (a method that has been shown to be CPU-time efficient for the production of high statistic MC samples), it travels inside the volume of the furnace and exits on the other side, where it is detected by the BLEMAB tracking system.
EXPERIMENTAL APPARATUS
In order to perform a muon radiography, a muon tracking system, i.e. a device that collects a signal of the passage of the muon and allows to reconstruct its trajectory, must be
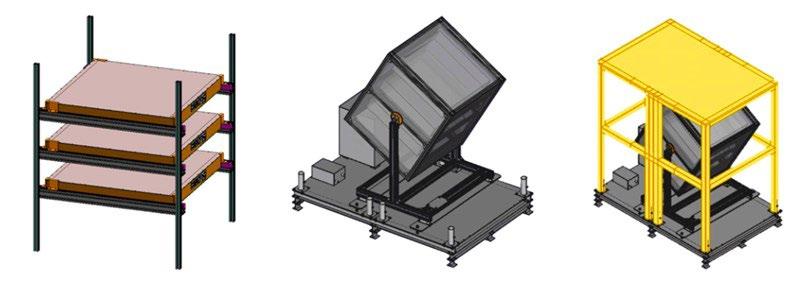
La Metallurgia Italiana - October 2022 pagina 65 Scientific papers - Off Topic
installed downstream of the object to be studied. For the BLEMAB application, two independent muon trackers will be constructed: they could both be installed at the same blast furnace, in order to get a measurement of the object from two points of view and perform a 3D reconstruction; otherwise they could be placed at two different furnaces at the same time, so that a comparative analysis of the two plants could be carried out.
The muon trackers will be developed with the same technology already used for the MURAVES [27] and the MIMA [28] projects: each of them will be made of three 80 x 80 cm2 tracking modules equally spaced. Each module will be composed by a double layer of 64 scintillator bars, a material that emits light at the passage of ionizing particles such as muons, the two layers being orthogonally oriented to give the measurement of the muon hit on a xy plane.
The scintillator bars are 80 cm long and have a triangular cross-section with a 2.5 cm base and a 1.25 cm height. The light emitted by the scintillator bars will be collected by Silicon Photomultipliers (SiPM) and transformed into electrical signals. Each tracking module will be read out by four custom data acquisition (DAQ) slave boards, housing a 32-channel Extended Analogue SiPM Integrated ReadOut Chip (EASIROC 1B [29]) and an application specific integrated circuit (ASIC) to control the transmission of data to a central custom DAQ master board, where the trigger logic and the data collection are implemented. A Raspberry PI [30] computer will be connected to the DAQ master to control the electronic chain and to write data on a physical support. The network connection provided at the ArcelorMittal site will allow online control of the detector and data synchronization on a remote network.
Fig.4 - (Left) Experimental setup for the preliminary test conducted with the prototype detector. (Right) The picture shows the detection efficiency as a function of the position along the bars where the efficiency is measured; the measured values are all greater than 99.6%. Picture from [22] / (Sinistra) Apparato sperimentale del test preliminare compiuto con il prototipo di rivelatore. (Destra) Il grafico mostra l’efficienza del rivelatore in funzione della posizione lungo le barre in cui è stata misurata; i valori misurati sono tutti superiori al 99.6%. Immagine da [22].
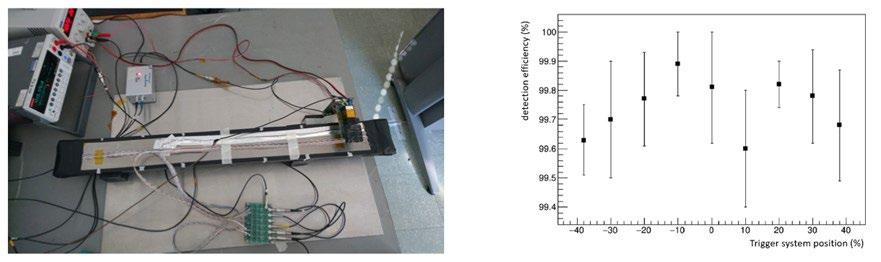
In order to cope with the harsh conditions in the proximity of a blast furnace, each muon tracker will be enclosed in an aluminum box and mounted on a platform that allows to set its altazimuth orientation. The whole system will then be hosted inside a large metal frame, completely covered by metal panels, that provides protection from liquid drops and corrosive vapors; finally a cooling system powered by a water chiller will be positioned inside the frame and put in contact with the detector’s box, in order to protect the optical sensors from the high temperatures outside the blast furnace. Fig. 3 shows the design of the BLEMAB muon tracker.
Currently, a prototype of a tracking plane consisting of five scintillator bars has been produced and tested; in particu-
lar, the detection efficiency has been measured in different positions along the 80 cm length of the bars: approximately 1000 muons were collected in each position and all the measured values of the detection efficiency are greater than 99.6% [31], as can be seen also from Fig. 4.
CONCLUSIONS
The European project BLEMAB represents an important example of the application of muon imaging techniques in the industrial field: in particular the aim of this project is to exploit the muon radiography technique to obtain an on-line map of the material distribution inside active blast furnaces, focusing on the shape and the location of the cohesive zone. This could lead to the development of a new metho-
La Metallurgia Italiana - Ottobre 2022 pagina 66 Memorie scientifiche - Off Topic
dology to get a direct information of the inner state of the furnace and to control the burden process for a stable and efficient operation, thus it could be of great interest for steel-making companies.
For this purpose, software simulations and a dedicated muon tracking system, described in the previous sections of this work, are under development; a preliminary detector prototype has already been realized and tested to provide experimental validation of the apparatus. The installation of the tracking system at the blast furnaces in the Arcelor-
Mittal site in Bremen (Germany) is scheduled for late 2022: the detectors will collect data for several months and the results obtained with the muon radiography technique will be compared for validation with the measurements of a new eMPVP and mathematical blast furnace models.
AKNOLEDGEMENTS
This project has received funding from the European Union’s Research Fund for Coal and Steel 2019 Programme, under grant agreement no. 899263.
REFERENCES
[1] Zyla PA, et al. Review of Particle Physics. PTEP. 2020;2020(8):083C01.
[2] Bonomi G, Checchia P, D’Errico M, Pagano D, Saracino G. Applications of cosmic-ray muons. Progress in Particle and Nuclear Physics. 2020;112:103768.
[3] George EP. Cosmic rays measure overburden of tunnel. Commonwealth Engineer. 1955;455.
[4] Alvarez LW, Anderson JA, El Bedwei F, Burkhard J, Fakhry A, Girgis A, et al. Search for Hidden Chambers in the Pyramids. Science. 1970 Feb;167(3919):832-9.
[5] Morishima K, Kuno M, Nishio A, Kitagawa N, M Y, Moto M, et al. Discovery of a big void in Khufu’s Pyramid by observation of cosmicray muons. Nature. 2017 Nov;552(7685):386-390.
[6] Saracino G, Amato L, Ambrosino F, Antonucci G, Bonechi L, Cimmino L, et al. Imaging of underground cavities with cosmic-ray muons from observations at Mt. Echia (Naples). Scientific Reports. 2017 04;7:1181.
[7] Tanaka H, Kusagaya T, Shinohara H. Radiographic visualization of magma dynamics in an erupting volcano. Nature Communications. 2014;5(3381).
[8] Gonidec Y, Rosas-Carbajal M, de Bremond d’Ars J, Carlus B, Ianigro JC, Kergosien B, et al. Abrupt changes of hydrothermal activity in a lava dome detected by combined seismic and muon monitoring. Scientific Reports. 2019 02;9:3079.
[9] Schouten D. Muon geotomography: selected case studies. Philosophical Transactions of the Royal Society A.2019;377(2137):20180061.
[10] Oláh L, Barnaföldi GG, Hamar G, Melegh HG, Suranyi G, Varga D. CCC-based muon telescope for examination of natural caves. Geoscientific Instrumentation, Methods and Data Systems. 2012;1(2):229-34.
[11] Ambrosino F, Bonechi L, Cimmino L, D’Alessandro R, Ireland DG, Kaiser R, et al. Assessing the feasibility of interrogating nuclear waste storage silos using cosmic-ray muons. Journal of Instrumentation. 2015 jun;10(06):T06005-5.
[12] Thompson LF, Stowell JP, Fargher SJ, Steer CA, Loughney KL, O’Sullivan EM, et al. Muon tomography for railway tunnel imaging. Phys Rev Research. 2020 Apr;2:023017.
[13] Committee on Reaction within Blast Furnace, Joint Society on Iron and Steel Basic Research, The Iron and Steel Institute of Japan. Blast Furnace Phenomena and Modelling. Elsevier Applied Science; 1987.
[14] Geerdes M, Chaigneau R, Lingiardi O. Modern Blast Furnace Ironmaking: An Introduction (2020). Ios Press; 2020.
[15] Zaimi SA, Campos T, Bennani M, Lecacheux B, Danloy G, Pomeroy D, et al. Blast Furnace models development and application in ArcelorMittal Group. Metallurgical Research & Technology. 2009;106(3):105-11.
[16] Kanbara K, Hagiwara T, Shigemi A, Kondo Si, Kanayama Y, Wakabayashi Ki, et al. Dissection of Blast Furnaces and Their Inside State Report on the Dissection of Blast Furnaces-1. Tetsu-to-Hagané. 1976;62(5):535-46.
[17] Nagamine K, Tanaka HK, Nakamura SN, Ishida K, Hashimoto M, Shinotake A, et al. Probing the inner structure of blast furnaces by cosmic-ray muon radiography. Proceedings of the Japan Academy, Series B. 2005;81(7):257-60.
[18] Åström E, Bonomi G, Calliari I, Calvini P, Checchia P, Donzella A, et al. Precision measurements of linear scattering density using muon tomography. Journal of Instrumentation. 2016 jul;11(07):P07010-0.
[19] Commissione europea, Direzione generale della Ricerca e dell’innovazione, Zanuttigh P, Vanini S, Calliari I, Hu X, Checchia P, Forsberg F, et al. Study of the capability of muon tomography to map the material composition inside a blast furnace (Mu-Blast) : final report. Publications Office; 2019. Available from: doi/10.2777/24858
La Metallurgia Italiana - October 2022 pagina 67
Off
Scientific papers -
Topic
[20] Bonechi L, Baccani G, Bongi M, Brocchini D, Casagli N, Ciaranfi R, et al. Multidisciplinary applications of muon radiography using the MIMA detector. Journal of Instrumentation. 2020;15(05):C05030.
[21] Bonechi L, Bongi M, Fedele D, Grandi M, Ricciarini S, Vannuccini E. Development of the ADAMO detector: test with cosmic rays at different zenith angles. In: 29th International Cosmic Ray Conference, Pune, India. vol. 9;2005. p. 283-286.
[22] Gonzi S, Ambrosino F, Andreetto P, Bonechi L, Bonomi G, Borselli D, et al. Imaging of the Inner Zone of Blast Furnaces Using Muon Radiography: The BLEMAB Project. Journal of Advanced Instrumentation in Science. 2022 May;2022.
[23] Hrivnacova I, Adamova D, Berejnoi V, Brun R, Carminati F, Fasso A, et al. The Virtual Monte Carlo. arXiv e-prints. 2003 May:cs/0306005.
[24] Agostinelli S, Allison J, Amako K, Apostolakis J, Araujo H, Arce P, et al. Geant4 - a simulation toolkit. Nuclear Instruments and Methods in Physics Research Section A: Accelerators, Spectrometers, Detectors and Associated Equipment. 2003;506(3):250-303.
[25] Brun R, Rademakers F. ROOT - An object oriented data analysis framework. Nuclear instruments and methods in physics research section A: accelerators, spectrometers, detectors and associated equipment. 1997;389(1-2):81-6.
[26] Pagano D, Bonomi G, Donzella A, Zenoni A, Zumerle G, Zurlo N. EcoMug: An Efficient COsmic MUon Generator for cosmic-ray muon applications. Nuclear Instruments and Methods in Physics Research Section A: Accelerators, Spectrometers, Detectors and Associated Equipment. 2021;1014:165732.
[27] D’Errico M, et al. Muon radiography applied to volcanoes imaging: the MURAVES experiment at Mt. Vesuvius. Journal of Instrumentation. 2020 3;15(03).
[28] Baccani G, Bonechi L, Borselli D, Ciaranfi R, Cimmino L, Ciulli V, et al. The MIMA project. Design, construction and performances of a compact hodoscope for muon radiography applications in the context of archaeology and geophysical prospections. Journal of Instrumentation. 2018 nov;13(11):P11001-1.
[29] École Polytechnique and CNRS/IN2P3, OMEGA - Centre de Microélectronique (website). https://portail.polytechnique.edu/omega Accessed June 24, 2022.
[30] Raspberry Pi Foundation, Raspberry Pi (website). https://www.raspberrypi.com Accessed June 24, 2022.
[31] Bonechi L, Ambrosino F, Andreetto P, Bonomi G, Borselli D, Bottai S, et al. BLEMAB European project: muon imaging technique applied to blast furnaces. Journal of Instrumentation. 2022 apr;17(04):C04031.
Applicazione della Radiografia Muonica agli Altiforni: il progetto BLEMAB
La radiografia muonica è una tecnica di imaging non invasiva, basata sull’utilizzo di muoni cosmici per esplorare il contenuto di volumi molto grandi, densi e altrimenti inaccessibili. Il progetto Europeo BLEMAB (BLast furnace stack density Estimation through on-line Muon ABsorption measurements) rappresenta un’applicazione esemplare della radiografia muonica in ambito industriale: lo scopo di questo progetto è infatti quello di studiare la capacità di questa tecnica di scansionare la parte interna di altiforni attivi. In particolare, l’analisi sarà focalizzata sulla caratterizzazione della cosiddetta “zona coesiva”, considerata di particolare interesse dall’industria siderurgica. Il progetto prevede la realizzazione di un apposito rivelatore di muoni, che verrà installato presso gli altiforni dello stabilimento ArcelorMittal a Brema (Germania). In questo articolo verrà descritto lo stato di avanzamento del progetto, in particolare lo sviluppo di simulazioni software e la costruzione del rivelatore.
PAROLE CHIAVE: ALTOFORNO, IMAGING, RADIOGRAFIA MUONICA;
La Metallurgia Italiana - Ottobre 2022 pagina 68 Memorie scientifiche - Off Topic TORNA ALL'INDICE
>
Mechanical properties and microstructure of Ti6Al4V Extra Low Interstitial alloy produced via laser and electron beam additive manufacturing processes
E. Ghio, E. Cerri, M. Riccio, J. SistiThe metal Additive Manufacturing technology is an innovative technology that allows flexibility in the sample design and optimized mechanical properties through the correct combination of the process parameters. The manufacturing of good and fully dense samples is fundamental to maximize tensile properties after appropriate heat treatments. This manuscript analyzes the microstructure and the mechanical properties of the Ti6Al4V-ELI heat-treated samples manufactured via Laser Powder Bed Fusion process (SLM Solutions). At the same time, it shows a comparative analysis of the same Ti6Al4VExtra Low Interstitial samples with other Ti6Al4V Extra Low Interstitial samples manufactured both via Laser Powder Bed Fusion (EOS machine) and via Electron Beam Melting in as built and heat-treated conditions. The microstructural analysis was conducted through optical and scanning electron microscopy, while the mechanical properties, obtained by the tensile and the Vickers microhardness tests, were compared to the ASTM F2924-14 and ASTM F136-13, respectively. The Ti6Al4V samples produced via laser powder bed fusion process (SLM Solutions) reaching 1040 ± 35 MPa and 975 ± 8 MPa of ultimate tensile strength and yield strength, respectively, and 11.1 ± 1% of elongation are placed between the laser powder bed fusion (EOS machine) samples and electron beam melted samples. Finally, it can be highlighted that the mechanical properties are related to the homogeneity, finesses, and size distribution of the β-phase at the α grain boundaries.
KEYWORDS: TI6AL4V-ELI, INDUSTRIAL HEAT TREATMENT, ADDITIVE MANUFACTURING, MECHANICAL PROPERTIES;
SOMMARIO
La tecnologia Additive Manufacturing è il punto focale di questo lavoro di ricerca. Una tecnologia innovativa che permette di avere flessibilità nella progettazione del campione e proprietà Meccaniche ottimizzate attraverso un’opportuna combinazione di parametri di processo. Solo stampando campioni completamente densi, le massime proprietà meccaniche possono essere ottenute dopo l’applicazione di appropriati trattamenti termici. In questo scenario, l’articolo analizza una la microstruttura e le proprietà meccaniche di campioni in Ti6Al4V-ELI trattati termicamente e prodotti per Laser Powder Bed Fusion. Nello stesso tempo, l’articolo mostra un’analisi comparative della microstruttura e delle proprietà meccaniche dei campioni appena menzionati e di altri cam-
Emanuele Ghio, Emanuela Cerri
Martina Riccio, Jacopo Sisti
La Metallurgia Italiana - October 2022 pagina 69 Scientific papers - Off Topic
University of Parma, Department of Engineering and Architectureemanuele.ghio@unipr.it; emanuela.cerri@unipr.it;
Beam-IT, Strada Pinzera, 17, 43045, Fornovo di Taro, PR, Italy.
pioni di Ti6Al4V-Eli stampanti per Electron Beam Melting (EBM) e Laser Powder Bed Fusion (LPBF). L’analisi microstrutturale è stata Condotta tramite microscopia ottica ed elettronica, mentre le proprietà meccaniche, ottenuto da prove a trazione e test di microdurezza Vickers, sono state comparate rispettivamente con le normative ASTM F2924-14 e ASTM F136-13. I campioni di Ti6Al4V stampanti per LPBF raggiungendo 1040 ± 35 MPa e 975 ± 8 MPa di resistenza ultima a trazione e di snervamento rispettivamente, e 11.1-1% di allungamento a rottura si inseriscono tra i campioni stampati per LPBF ed Electron Beam Melting. È possibile sottolineare che le proprietà meccaniche sono correlate con l’omogeneità, finezza e distribuzione dimensionale della fase β ai bordi grano α.
INTRODUCTION
The Additive Manufacturing (AM) is the best process satisfying the requirements of the new industry revolution, also known as Industry 4.0, also considering the other subtractive manufacturing processes [1]. AM moves in opposite direction of these conventional manufacturing processes because it add material creating a 3D physical object through the “layer-by-layer” method [2]. At the same time, AM offers different advantages such as the freedom design, the manufacturing of sample having complex geometry and also characterized by a functionally-graded material, the reduction in time, cost production and in waste material. Finally, it synthesis the assembly process through the printing of a single part [1, 2, 3, 4]. Joining to these the personalization and customization, the AM technologies are the most suitable methods into the aerospace, automotive and biomedical sectors [1]. In relation to the machine set-up, namely the energy source rather than the material feed stock, the AM process is classified into powder bed fusion and direct energy deposition processes [2, 5]. Jimènez et al. [6] highlighted that the higher percentages of studies, research and especially the industrial use are related to the laser powder (31%) and electron beam powder bed fusion (17%) processes. The present paper enriches this scenario analysing two different processes based on the powder bed fusion method: the Laser Powder Bed Fusion (LPBF) performed through two different printing machines (EOS and SLM) and the Electron Beam Melting (EBM).
The first is based on the use of a laser beam that melts the powder bed layer, where the LPBF (EOS) induces lower thermal distortions and facilitates the melting process after the powder sinterizing [6]. In the second and last considered process, the electron beam source characterizing by a high voltage (30-60 keV) melts the powder bed into a high vacuum build chamber [7, 8]. The vacuum is necessary to avoid the printed sample oxidation and to keep the electron beam concentrated; moreover, it does not disperse energy due to the absence of gal molecules. On the other hand, argon or nitrogen gaseous are used to generate an inert environment within the build chamber in the LPBF processes [5]. In this scenario, the high reactivity of the titanium alloys with the oxygen makes the LPBF, and EBM process suitable to manufacture Ti6Al4V samples [8, 9].
Ti6Al4V is an α+β alloy due to the presence of ~ 6% and ~4% of Al and V stabilizing the α and β phases, respectively, and it is widely used into aerospace, automotive and biomedical fields due to its high corrosion resistance, low density, excellent biocompatibility, and high mechanical properties [10, 8, 9]. Generally, the as built microstructure of Ti6Al4V samples varies in relation to the manufacturing processes because the molten Ti solidifies with different cooling rates. Considering the LPBF samples, the presence of the acicular α’ martensite phase, which crystallizes in hexagonal crystal system, brings the UTS (Ultimate Tensile Strength) and the YS (Yield Strength) values at ~1200÷1500 MPa and ~1100÷1200 MPa, respectively, while the elongation at ~ 5÷6% [11, 12, 13]. On the other hand, the as built electron beam melted (EBMed) samples that are formed by basketweave α+β microstructure where the α is a needle-like phase due to the cooling path (Figure 4), show a considerable decrease of the UTS and YS compared to the LPBF samples. The UTS reaches ~950÷1000 MPa, while YS ~850÷970 MPa as reported in [11, 14, 15]. Other authors have shown however the presence of the α’ martensite in these samples caused by the not complete phase transformation α’ → α + β [14, 16]. Moreover, the as built EBMed already show much lower internal residual stress than the as built LPBF samples due to the different process conditions and the obtained microstructure. Despite this, heat treatments above or below the β-transus (~ 980°C [17]) must be applied to reduce the internal stres-
La Metallurgia Italiana - Ottobre 2022 pagina 70
Memorie scientifiche - Off Topic
ses and/or to dissolve the α’ martensite and so improving the ductility to 10% (the minimum elongation reported in F2924-14 specification) [18, 19, 20].
In the present manuscript, the ASTM F136-13 and the ASTM F2924-14 specifications were considered to evaluate the HV values and the tensile strength, respectively, reached after the heat treatments under the β-transus. In addition, the as built and heat-treated LPBF Ti6Al4V-ELI (Extra Low Interstitial) samples were compared with the same samples produced by another LPBF process and
EBM and analyzed in [21].
MATERIAL AND METHOD
The gas atomized Ti6Al4V-ELI powder was used to manufacture the tensile samples analysed in the present manuscript. The chemical compositions of samples produced by the two LPBF investigated processes, commercially EOS (LPBFEOS) and SLM Solution (LPBFSLM), and EBM are shown in Table 1.
Tab.1 - Chemical compositions (weigth, %) of the Ti6Al4V-ELI powders used for the LPBFSLM process and for LPBFEOS and EBM [21] / Composizione chimica delle polveri (massa, %) di Ti6Al4V-ELI usate per i processi di LPBFSLM, LPBFEOS ed EBM [21].
Ti Al V O N H Fe C Ref.
LPBFSLM SLM280HL Bal. 5.5 – 6.5% 3.5 – 4.5% < 0.1% < 0.05% < 0.011% 0.25% < 0.08%LPBFEOS EOS M290 Bal. 5.5 – 6.75% 3.5 – 4.5% < 0.2% < 0.05% < 0.015% < 0.3% 0.01 [21]
EBM Bal. 6.47% 4.06% 0.09% 0.01% 0.001% 0.21% 0.01
The dog-bone tensile samples (Figure 1a) analyzed in the present manuscript were manufactured via LPBFSLM process, with dimensions (Figure 1b) according to the ASTM
E8/E8M standard [22]. The same geometry and printing configuration as drawn in Figure 1a (major axis parallel to the xy plane) was used for the samples analyzed in [21].
Fig.1 - a) 3D graphical representation of the dog-bone tensile sample. b) Dimensions of the dog-bone sample according to ASTM E8/E8M – 13a [31]. The sample thickness was 6 mm / Rappresentazione grafica 3D di un campione ad osso di cane. b) Dimensioni di un campione ad osso di cane in accordo con la normativa ASTM E8/ E8M-13a [31]. Lo spessore del campione era di 6mm.
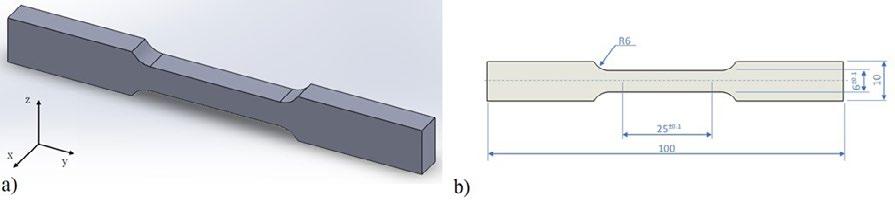
The LPBFSLM samples were fabricated with SLM Solutions SLM280HL dual machine using a 2x400 W IPG fiber lasers characterize by a spot size of 100 μm. The scan speed and the layer thickness used were 1250 mm/s and 60 μm, respectively. The entire process was performed in Ar atmo-
sphere and using a pre-heated build platform at 80°C. For a better understating of this work, the process parameters used for the other samples are shown in Table 2.
La Metallurgia Italiana - October 2022 pagina 71 Scientific papers - Off Topic
Tab.2 - Process parameters used to manufacture the LPBF and EBMed samples / Parametri di processo usati per stampare i campioni tramite LPBF ed EBM.
Process parameters
LPBFSLM EBM, [21] LPBFEOS, [21]
Laser power [W] 400 - 400
Electron beam [keV] - 60 -
Scan speed [mm/s] 1250 103 2000
Layer thickness [μm] 60 50 60
Spot laser size [μm] 100 - 100
Diameter electron beam [μm] - 150-250 -
Build platform temperature [°C] 80 - 80
Chamber temperature [°C] - 600 -
The SLMed as built samples were heat treated in a vacuum furnace at 740°C for 2h and subsequently cooled in two different steps. The former up to 530°C in 90min and the latter at room temperature in 1h using argon gas as shown in Figure 2. The same graph (Figure 2) shows the sche-
matical representation of the heat treatment curve, which is described in [21], of the samples produced via LPBFEOS process. In the following part of this manuscript, 740/530 and 730/520 will be the heat treatments nomenclature.
Fig.2 - Heat treatment schematic curves of the LPBF samples: blue curve is referred to the LPBFSLM, while the yellow curve to the LPBFEOS / Curve di trattamento termico per i campioni prodotti per LPBFç la curva blu è riferita ai campioni LPBFSLM, mentre quella gialla ai campioni LPBFEOS.
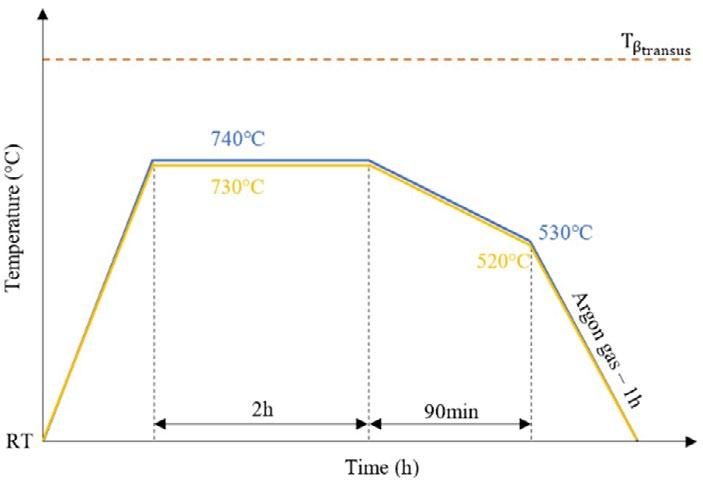
La Metallurgia Italiana - Ottobre 2022 pagina 72 Memorie scientifiche - Off Topic
The sample preparation for the metallographic analysis was performed on the resistant cross-section (xz plane) of the dog-bone sample and on the perpendicular surface (xy plane) to the build direction (z-axis). All polished surfaces were chemical etched with Keller’s reagent. For the microstructural analysis was used Leica DMi8C reverse optical microscope and Nova NanoSEM 450 scanning electron microscope. In the last case, two different images (10000x) of the heat-treated samples were converted into binary images where the α-phase and the β-phase were distinguished into black and white regions, respectively. Subsequently, the binary images were analyzed through the LAS software (LAS AF V4.0) and each area, with its equivalent diameter, was determined. The results of the β-phase size distribution were discussed and then compared to those studied in [21].
The Leica VMHT microhardness tester was used to evaluate the microhardness values of the as built and heat treated LPBFSLM samples. Each value is obtained as an average of 10 measurements. The tests were carried out on the
same polished surfaces where the microstructural analysis was conducted. For each measure the indentation time and the load applied were 15 s and 500 g, respectively, according to ISO 6507-1:2018. The tensile properties of the SLMed samples were performed on 6 samples (Figure 1) using a Zwick-Roell Z100 machine with a relative strain rate of 8∙10-3 s-1 .
RESULTS AND DISCUSSION
Figures 3a,b shows the microstructure of the as built Ti6Al4V-ELI LPBFSLM sample along the build direction (Figure 3a) and on the xy plane (Figure 3b). The prior β-grains are characterized by a columnar shape and are directed along the heat fluxes involved during the molten pool solidification process. They are place almost perpendicular to the xy-plane of the build platform and, consequently to the molten pools as highlighted by the reciprocal position of the yellow (β-grains boundaries) and blue (molten pool boundaries) dotted lines (Figure 3a).
Fig.3 - Optical micrographs representing the xz (a) and xy (b) planes of the as built Ti6Al4V ELI sample. The yellow and blue dotted lines are related to the β-grains and molten pool boundaries, respectively / Micrografie ottiche che rappresentano i piani xz (a) ed xy (b) del campione as built di Ti6Al4V-ELI. Le line tratteggiate gialle e blu rappresentano rispettivamente i bordi dei grani β e dei molten pool.
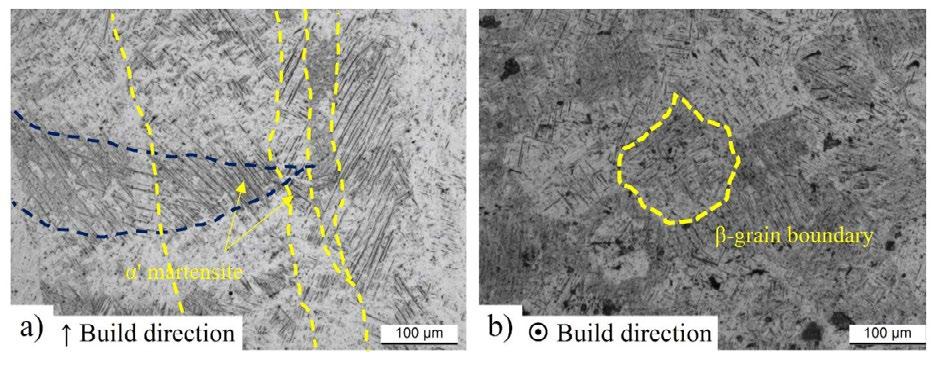
The β-grains start from the bottom region of the sample and continue up to the top keeping parallel to the build direction (z-axis) regardless of the sample position into build chamber. This growth behavior is not only caused by the heat fluxes, but also by the columnar grains formed
in the previous solidified layer (“n”) that become the nuclei of formation and growth of the subsequent β-grains during the solidification of the next layer (“n+1”) [23]. Focusing on xy plane (Figure 3b), it is possible to observe the typical equiaxed polyhedral shape of the columnar
La Metallurgia Italiana - October 2022 pagina 73 Scientific papers - Off Topic
grains. Due to the high cooling rate (105 ÷ 107 K/s), the microstructure of the as built Ti6Al4V-ELI is formed by fine acicular α’ martensite highlighted by the yellow arrows in Figure 3a and contained into columnar grains. The LPBF induces a formation of the α’ martensite phase due to the intersection between the light-blue curve and the Ms line as shown in Figure 4 where the cooling rate is > 410 °C/s.
As reported into the Handbook of titanium alloys, the line of the martensite start is at 800°C [24], while the β-transus at 980°C [17]. The grey dotted region (600-700 °C) represents the chamber temperature of the EBM process, and the green curve describes the cooling path characterizing the EBMed (Electron Beam Melted) samples.
Fig.4 - Cooling paths (light-blue and green curves) referred to the different manufacturing processes and to the microstruture formed after the cooling at room temperature. The orange dotted lines are referred to the cooling rates <410°C/s and <20°C/s / Curve di raffreddamento (azzurra e verde) riferite a differenti processi di manifattura ed a microstrutture formate dopo i raffreddamenti a temperatura ambiente. Le linee tratteggiate arancioni sono riferite a raffreddamenti <410°C/s and <20°C/s.
Once again, the diffusionless transformation β → α’ takes place due to the intersection with the Ms line; but the subsequent quasi-steady state at the chamber temperature (600 ÷ 700°C) induces a partial α’ → α + β transformation time-temperature dependent [25, 26]. Gallaraga et al. [26] showed an as built microstructure formed by α+β phase using a chamber temperature of 650°C and after 36h and 40min of build time. Normally, at the end of this manufactured process, the samples slowly cooled at room temperature. The orange dotted lines, however, represent the transfor-
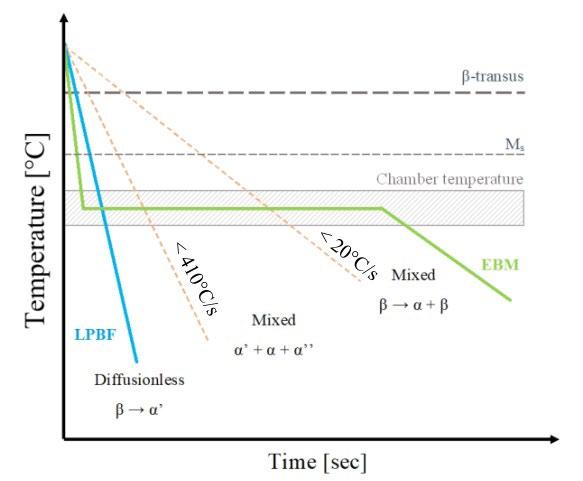
mation into α’ + α + α’’ and β → α + β at cooling rate below the 410 °C/s and 20 °C/s, respectively.
Figure 5 shows the microstructure along the build direction of the heat-treated LPBFSLM samples (Figures 5a,d) after the 740/530, and LPBFEOS samples (Figures 5b,e) samples after the 730/520. Figures 5c,f show the microstructure of the EMBed samples in as built condition.
La Metallurgia Italiana - Ottobre 2022 pagina 74 Memorie scientifiche - Off Topic
Fig.5 -Optical micrographs of the LPBFSLM samples (a, d), LPBFEOS samples (b, e) after the heat treatments: 740/530 (a, d) and 730/520 (b, e). (c, f) show the as built EBMed samples. g) (1) Example illustrating the hierarchical martensite structure of the as built SLMed Ti6A4lV sample where (2) is a magnification of (1) [27]. h) High magnification of a part of the optical micrograph in panel f / Micrografie ottiche di campioni di Ti6Al4V-ELI prodotti per SLM (a, d), DMLS (b, e) dopo trattamento termico: 740/530 (a, d) e 730/520 (b, e). (c, f) mostrano il campione prodotto per EBM g) (1) Esempio che illustra la struttura gerarchica della martensite di un campione as built di Ti6AL4V-ELI prodotto per SLM dove (2) è un ingrandimento di (1) [27]. h) Ingrandimento di una parte della micrografia in f
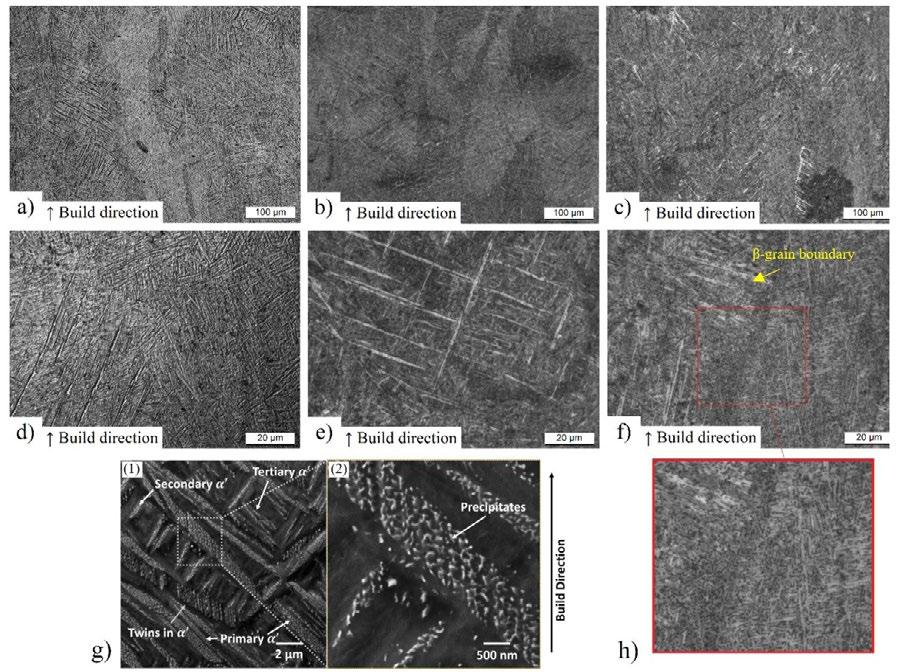
Comparing the different microstructures shown in Figures 5a-c, the columnar β-grains remain still visible even after 740/530 and 730/520 heat treatments showing that the LPBF manufacturing processes generated a columnar structure into the as built samples as well as the EBMed samples. For the SLMed samples, the columnar structures increase their thickness about 17%, while the α-phase, which is characterized by acicular and elongated shape (Figure 5d), reach values of thickness about 700 ± 10 nm due to the increase of about 40% after the 740/530. Figure 5e illustrates the microstructure of the LPBFEOS samples that is similar and more “cross-hatched” than the LPBFSLM microstructure (Figure 5c). It can be concluded that du-
ring the manufacturing process, not only the LPBFSLM, but also the LPBFEOS process induce an α’ martensitic nucleation and growth from the β-grains boundaries following a hierarchical structure (Figure 5g(1)). In addition, Figure 5g(2) shows the presence of fine precipitates within primary α’-martensitic laths [28]. Finally, comparing the high magnification micrograph (Figure 5f) representing the as built EMBed microstructure with the previously discussed Figures 5e,d, the α and β phases are differently distributed showing a typical basket-weave microstructure (Widmanstätten) as reported by [21]. In this microstructural configuration, the β-phase (dark domine in Figure 5h) separates the plate-like α-phase (bright area in Figure 5h)
La Metallurgia Italiana - October 2022 pagina 75 Scientific papers - Off Topic
and its amount reaches the 10% at room temperature. On the other hand, the quantity of the β-phase decreases to 5% and 4% respectively for the LPBFEOS and LPBFSLM sam-
ples. Consequently, the 90, 95 and 96% represent the percentage of the α-phase [21].
Fig.6 - Statistical distribution of the β-phase present into heat-treated LPBFSLM, LPBFEOS and as built EMBed Ti6Al4V-ELI samples / Distribuzione statistica della fase β presente nei campioni trattati termicamente di Ti6AL4V-ELI prodotti per LPBFSLM,LPBFEOS e nei campioni prodotti per EBM.
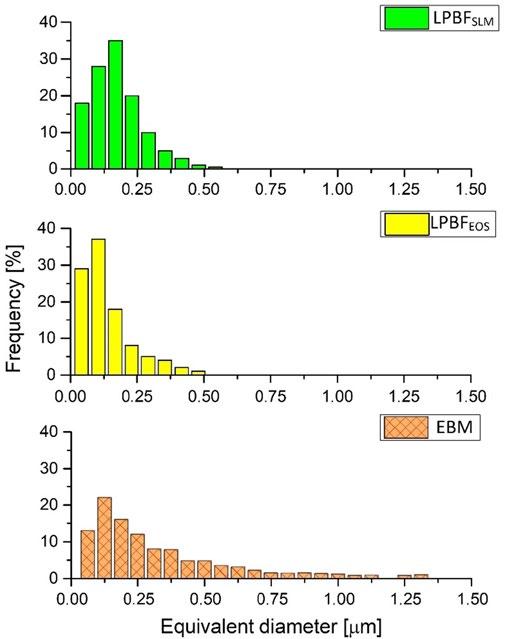
Figure 6 shows the statistical distribution related to the β-phase equivalent diameter and at the first sight, the LPBFSLM (Figure 6a) and LPBFEOS (Figure 6b) samples show higher frequencies at the lower equivalent diameters than the EBMed samples (Figure 6c). Secondly, the LPBFSLM samples show a shift to the right of the maximum frequency peak with respect to the LPBFEOS samples that show 37% at 105 nm rather than 35% at 170 nm. So, the β-phases are more fragmented into the LPBFEOS than the LPBFSLM samples indicating that the α-phases are more “cross-hatched” in the former than in latter (Figure 5 e,f). The EBMed samples are instead characterized by the maximum peak of 22% at 125 nm, but also show equivalent diameters up to 1.3μm.
The mechanical properties of the different heat-treated LPBF samples and the as built EBMed samples are compared through both the Vickers hardness measurements
(Figure 7a) and the tensile properties (Figure 7b). The HV measurements performed on the three different planes of the LPBFSLM samples do not show great differences being that the values vary between 360 ± 5 HV500 and 375 ± 8 HV500. The same results are obtained considering the samples manufactured via LPBFEOS and EBM. In addition, considering the former (398 ± 4 HV500) and the latter (345 ± 5 HV500) manufacturing processes, the LBPFSLM samples are placed between them due to the different microstructures (Figure 5) and β-phase statistical distribution (Figure 6). On the other hand, the differences in terms of α-phase distribution, β-phase fragmentation and the different heat treatment can influence the variation between the LPBFSLM and LPBFEOS samples. All HV values are in agreement with the ASMT F136-13 specification.
La Metallurgia Italiana - Ottobre 2022 pagina 76 Memorie scientifiche - Off Topic
Fig.7 - Vickers microhardness values measured along the xy, xz and yz planes (a) and tensile properties (b) for the LPBFSLM, LPBFEOS and EBMed TI6Al4V-ELI samples. / Valori di microdurezza Vickers misurati lungo i piani xy, xz e yz (a) e proprietà meccaniche (b) per i prodotti per LPBFSLM eLPBFEOS
As observed for the HV values, the tensile strengths show the same decreasing trends (Figure 7b) where the LPBFSLM samples reached 1040 ± 10 MPa and 975 ± 8 MPa for UTS and YS, respectively. The variation in terms of the elongation values between LPBF and EBM processes can be justified through the different microstructures in Figure 5 (Widmanstätten rather than the α-phase decomposed from the α’ martensite) because the plastic deformation
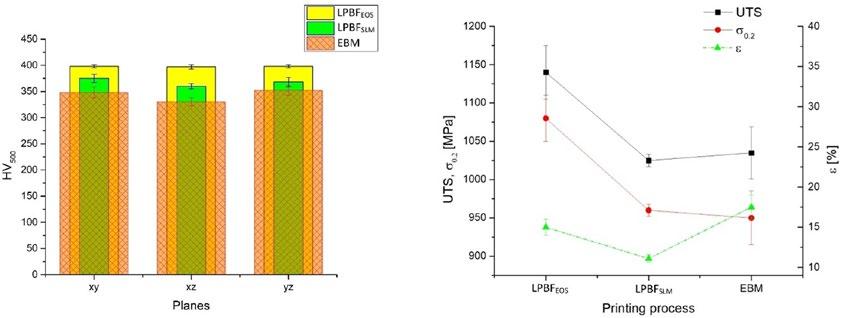
and cracks’ propagation mechanisms take place differently as studied by [29]. Despite this, the tensile properties obtained by the LPBFSLM, LPBFEOS and EBMed samples are in agreement with the ASTM F2924-14 specification and to other results shown in Table 3 where all considered conditions are formed by only one heat treatment step performed on as built samples as well as in Figure 2.
Tab.3 - Mechanical properties for Ti6Al4V samples manufactured with LPBFSLM, EBM and LPBFEOS before and after heat treatments. The properties shown into ASTM F2924-14 are also reported. WQ = Water Quenching, AC = Air Cooling, FC = Furnace Cooling. / Proprietà meccaniche per campioni di Ti6Al4V stampati con processi di LPBFSLM, EBM e LPBFEOS prima e dopo trattamento termico. Sono anche riportate le proprietà mostrate nella ASTM F2924-14. WQ = Tempra in acqua, AC = raffreddamento in aria, FC = raffreddamento in forno.
Process Condition UTS [MPa] YS [MPa] ε [%] Cooling Ref.
ASTM F2924-14 - > 860 > 795 > 6 – 10 - [20]
As built 1246 ± 134 1150 ± 67 1.4 ± 0.5[13]
As built 1421 ± 120 1273 ± 53 3.2 ± 0.5 -
1050°C / 1h 984 ± 11 875 ± 36 7.4 ± 1.5 WQ [17]
950°C / 2h 1038 ± 30 935 ± 11 8.0 ± 1.5 WQ
LPBFSLM
700°C / 1h 1115-1116 1045-1054 9.5-12.4 AC [30]
600°C / 2h 956 907 10.8 AC [31]
730°C / 2 1067 ± 2 1003 ± 8 13.7 ± 0.4 FC [32]
800°C / 4h 1064 ± 2 990 ± 2 11 ± 0.8 FC
La Metallurgia Italiana - October 2022 pagina 77 Scientific papers - Off Topic
800°C / 4h 1026 ± 2 949 ± 2 5.5 FC
550°C / 24h 1250 1150 4.5600°C / 24h 1150 1100 6.0 -
650°C / 24h 1080 1020 5.5700°C / 24h 1070 1010 4.2 -
[33]
750°C / 24h 900 880 3.0600°C / 4h 700 650 2.4600°C / 8h 1190 1125 6.0600°C / 16h 1226 1140 4.0600°C / 24h 1170 1130 6.0600°C / 32h 1152 1115 5.8[34]
482°C / 6h 1130 1060 5.6482°C / 8h 1130 1070 5.2482°C / 10h 1125 1060 4.0 -
704°C / 4h 1125 1055 4.5704°C / 5h 1040 980 5.7704°C / 6h 1038 979 5.8 -
788°C / 3h 1029 981 5.7788°C / 4h 980 950 5.9788°C / 5h 1010 960 7.0800°C / 4h 1001 952 7.6[11] 540°C / 5h 1223 ± 52 1118 ± 39 5.36 ± 2.02 WQ 850°C / 2h 1004 ± 6 955 ± 6 12.84 ± 1.36 FC 850°C / 5h 965 ± 20 909 ± 24 - FC
1020°C / 2h 840 ± 27 760 ± 19 14.06 ± 2.53 FC
705°C / 2h 1082 ± 34 1026 ± 35 9.04 ± 2.03 FC
750°C / 2h 1062 - 3.7 FC 800°C / 2h 1040 - 5.1 FC 850°C / 2h 1009 - 5.2 FC 950°C / 2h 970 - 10.1 FC 1050°C / 2h 945 - 11.6 FC
[35]
[36] 600°C / 2h 1287 - 3.2 FC
750°C / 2h 1185 - 3.4 FC 925°C / 2h 988 - 12.2 FC 1050°C / 2h 980 - 9.2 FC
750°C / 2.5h 1200 ± 10 1100 ± 10 11 ± 1 FC
[37] 850°C / 2.5 h 1180 ± 5 1020 ± 15 13 ± 1 FC
920°C / 2.5h 1020 ± 8 925 ± 10 15.1 ± 1.0 FC 1050 °C / 2.5h 1000 ± 10 830 ± 19 15.2 ± 1.2 FC 920 °C / 2.5h 1050 ± 10 870 ± 5 16 ± 1 FC
La Metallurgia Italiana - Ottobre 2022 pagina 78
Memorie scientifiche - Off Topic
EBM
As built 1117 ± 3 967 ± 10 8.9 ± 0.4 - [29]
As built 960 ± 2 850 ± 6 6.8 ± 0.5 - [38]
800°C / 2h 1000 ± 30 962 ± 30 5 ± 2 FC [39] 1000°C / 2h 945 ± 30 798 ± 30 11.6 ± 2 FC
1100°C / 0.5h 913 ± 38 774 ± 114 13 ± 2 FC 920°C / 2h 954 904 4.2 HIP1 - FC [40]
1030°C / 2h 900 830 9.0 FC 1000°C / 3h 950 840 - FC [41] 1050°C / 10h 975 850 - FC 920°C / 2h 1005 900 14 HIP2 - FC [42] 920°C / 2h 1000 905 12 FC
As built ~ 1158 ~ 924 4-5.5 FC [43] 800°C / 4h ~ 1122 ~ 805 12.6-16 FC
LPBFEOS
950°C / 1.5h 1083 ± 10 997 ± 35 - FC 800°C / 4h 1060 ± 16 - - FC [44] 800°C / 4h 1191 ± 4 - - FC
Correlating the HV and YS values of the LPBFSLM samples through the σ0.2/HV ratio, the obtained value of 2.65 ± 0.04 is comparable to 2.71 ± 0.06 and 2.68 ± 0.05 obtained by the LPBFEOS and EBMed samples, respectively [21, 45]. In addition, these values are also in agreement with those found in literature varying from 2.20 to 2.90 [38, 46, 47].
In this manuscript, different heat-treated Ti6Al4V samples produced via LPBFSLM, LPBFEOS and as built EBMed samples
were considered, and their mechanical properties were analyzed. In this scenario, the Hollomon-Jaffe parameter (HP), also known as the Larson-Miller parameter, can describe the effect induced by the heat treatment on the Ti6Al4V samples as proposed by Chao et al. [48]. Originally, J.H. Hollomon [49] proposed the following time-temperature parameter to determine the effect induced by tempering heat treatment on the hardness of steels:
HP=T[log(t)+C] (1)
where T is the temperature expressed in K, t is the time expressed in h and C is a parameter referred to the material used [49]. Figure 8 shows the obtained correlation between the mechanical properties and the time-temperature parameter considering the result discussed in this work and all
values shown in Table 3. The dotted blue line represents the time-temperature parameter related to the β-transus and considering a time of 1h. The different linear fits are reported as follows:
UTS(MPa) = - 0.0261 HP + 1538.4 (2) YS(MPa)= - 0.0309HP + 1537 (3) ε%= 7.82 ∙ 10-4 HP - 5.72 (4) HV= -3.7 ∙ 10-3 HP + 431.08 (5) and the best correlations are the Eqs. (1) and (2) due to the higher coefficient of correlations than the other ones as shown in Figures 8a-c, respectively. Figure 8c shows the elongation values where their high dispersion is caused by
different factors which are related to the load direction of the tensile test and to the different microstructure obtained at room temperature.
1Hot Isostatic Pressing heat treatment performed at 1000 bar [40].
2Hot Isostatic Pressing heat treatment performed at 1020 bar [42].
La Metallurgia Italiana - October 2022 pagina 79
Scientific papers - Off Topic
Fig.8 - Mechanical properties ((a) Ultimate tensile strength, (b) Yield strength, (c) Elongation, (d) Vickers microhardness) versus time-temperature parameter for heat-treated Ti6Al4V alloys manufactured via LPBFSLM and LPBFEOS processes. The costant C is equal to 15 [48]. The dottet blue line represent the time-temperature parameter related to the β-transus temperature (1000°C) and a time of 1h. The Vickers microhardness values are reported in [30, 32, 19, 50, 41, 51, 52, 53] / Proprietà meccaniche ((a) Carico di rottura, (b) Limite di snervamento, (c) Allungamento) rispetto al parametro di tempo-temperatura per le leghe Ti6Al4V trattate termicamente e prodotte tramite LPBFSLMe LPBFEOS . La costante C è uguale a 15 [44]. La linea blu tratteggiata rappresenta il coefficiente tempo-temperature riferito alla temperatura di β-transus e al tempo di 1h.
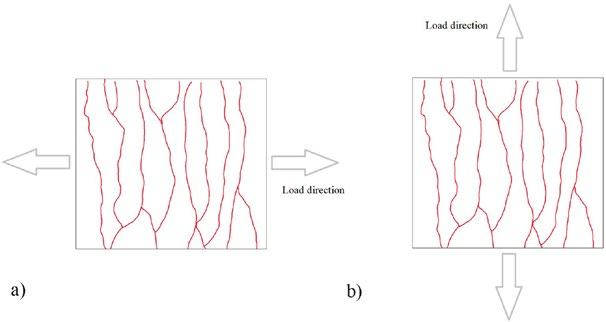
Considering a subtransus heat-treated sample (T < Tβ-transus, the columnar β-grains shape is not influenced and, consequently, the elongation can vary in relation to the load direction (Figure 9). Liu et al. [54] highlighted that the horizontal samples (Figure 9a) show lower elongations than the longitudinal samples (Figure 9b) due to the load
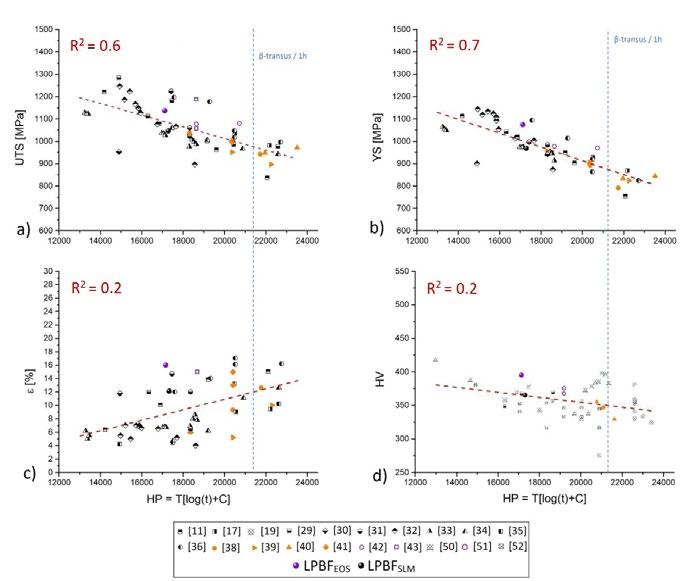
distribution along with the different axis of the columnar β-grains and with different orientation of the α-phase. On the other hand, the α’ martensite formed during the L-PBF process transforms into α+β in relation to the subtransus heat treatment temperature.
Fig.9 - Schematic representation of the columnar β-grains versus the load direction / Rappresentazione schematica dei grani colonnari β rispetto alla direzione del carico.
La Metallurgia Italiana - Ottobre 2022 pagina 80
Memorie scientifiche - Off Topic
Vrancken et al. [11] emphasized that the α’ → α+β transformation begins at 705°C and then, the α-phase tends to decrease from 87% at 780°C to 27% at 950°C. In this scenario, the residence time at these temperatures as the subsequent cooling method (water, air or furnace) do not influence incisively the grains growth because the α and β phases hinder each other [11]. On the other hand, the dislocation density and twin structures disappear as the temperature increases up to the β-transus. Tsai et al. [33] showed the presence of like-plate α and α’-martensite, which justify the low elongation obtained, after the heat treatments at 750 and 800°C for 24h (Table 3). The same authors show a considerable quantity of dislocations contained in the martensite. From the β-transus temperature the columnar β-grains are transformed in equiaxed grains, and the type of the α -phase is strictly related to the cooling method applied on the supertransus heat-treated samples (T>Tβ-transus). After solubilization at 1050°C for 1h, followed by WQ, the diffusionless transformation of β -phase in new α’ martensite occurs; while a furnace cooling induces a formation of a Widmanstätten microstructure with α+β colonies oriented in various directions [11, 17, 36]. The former microstructure induces a tensile strength improvement considering the subtransus heat-treated samples (800-900°C + AC/FC), except for the ductility. This is increased by the latter microstructural change due to the different mechanisms of slip and crack propagation as previously reported by comparing the samples produced via laser and electron beam additive manufacturing processes [29].
Finally, the presence of lack-of-fusion (LOF) pores can influence the ductility in relation to their position in the sample microstructure. The load directed perpendicularly to the LOF major axis tends to open it leading the sample to the premature failure. The other load configuration (parallel to the major axis) tends to close the pores not affecting the failure [54].
Other authors highlighted that the tensile strengths are increased at the expense of ductility due to the presence of the Ti3Al precipitates [11]. This precipitation phenomenon can occur during the additive manufacturing process or during the aging heat treatment. Figure 8d illustrates the Vickers microhardness in function of the HP parameter and, also in this case, any cor-
relation was not found due to the same consideration reported for the elongation. As matter of fact, the Vickers microhardness is most influenced by the microstructural inhomogeneity (fine, coarse or globular α-phase, presence of dislocation, α’ martensite distribution, columnar or equiaxed β-grains) and presence of pores.
CONCLUSIONS
In the present paper, the LPBFSLM Ti6Al4V-ELI samples heat-treated at 740°C for 2h were compared to the LPBFEOS and EMBed Ti6Al4V-ELI samples. Generally, it can conclude as follows:
1. The as built LPBFSLM samples show a microstructure formed by columnar β-grains containing α’martensite. The columnar shape remains still visible after the heat treatment in LPBFSLM, LPBFEOS, And into as built EBMed samples.
2. The percentage of the β-phase observed into heat-treated LPBFSLM samples is 5% and, so, comparable to the LPBFEOS samples rather than the as built EBMed samples showing a Widmanstätten microstructure with a 10% of β-phase. Moreover, the LPBFEOS samples show higher β-phase fragmentation than the LPBFSLM samples probably due to the different scan speed and heat treatment.
3. The HV microhardness are isotropic into LPBFSLM samples as well as into the other samples, and the obtained values satisfied the ASTM F136-6 specification. The UTS of 1040 ± 10 MPa, the YS of 975 ± 8 MPa and the elongation at 11.1 ± 1% are in agreement to the ASTM F2924-14.
4. The Hollomon-Jaffe parameter can be used to determine the mechanical properties of heat-treated Ti6Al4V samples independently of the manufacture processes (UTS(MPa)=-0.0261 HP +1538.4; YS(MPa))= -0.0309 HP+1537). Vickers microhardness and elongation are not correlated with the HP parameter due to the microstructural complexity obtained after different heat treatments.
La Metallurgia Italiana - October 2022 pagina 81
Scientific papers - Off Topic
REFERENCES
[1] J. Butt, «Exploring the Interrelationship between Additive Manufacturing and Industry 4.0,» Designs, vol. 4(2), p. 13, 2020.
[2] W. Frazier, «Metal Additive Manufacturing: A review,» JMEPEG, vol. 23, pp. 1917-1928, 2014.
[3] T. Maconiache, M. Leary, B. Lozanovsky, X. Zangh, M. Qian, O. Faruque e M. Brandt, «SLM lattice structures: Properties, performance, applications and challenges,» Mater. Des., vol. 183, p. 108137, 2019.
[4] C. Zhang, F. Chen, Z. Huang, M. Jia, G. Chen, Y. Ye, Y. Lin, W. Liu, B. Chen, Q. Shen, L. ZHang e E. Lavernia, «Additive manufacturing of functionally graded materials: A review,» Mater. Sci. Eng. A, vol. 764, p. 138209, 2019.
[5] T. Duda e L. V. Raghavan, «3D metal printing technology: the need to re-invent design practice,» AI & Soc, vol. 33, pp. 241-252, 2021.
[6] A. Jemènez, P. Bidare, H. Hassanin, F. Tarlochan, S. Dimov e K. Essa, «Powder-based laser hybrid additive manufacturing of metals: a review,» The international Journal of Advanced Manufacturing Technology, vol. 114, pp. 63-96, 2021.
[7] D. Gu, W. Meiners, K. Wissenbach e R. Propawe, «Laser additive manufacturing of metallic components: materials, processes and mechanisms,» Int. Mater. Rev., vol. 57, pp. 133-164, 2012.
[8] M. Kolamroudi, M. Asmaael, M. Ilkan e N. Kordani, «Develompments on electron beam melting (EBM) of Ti-6Al-4V: A review,» Transaction of the Indian Istitute of Metals, vol. 74, pp. 783-790, 2021.
[9] S. Kumar, T. S. Narayanan, S. Raman e S. eshadri, «Thermal oxidation of Ti6Al4V alloy: microstructural and electrochemical characterization,» Mater. Chem. Phys., vol. 119, pp. 337-346, 2010.
[10] L. Murr, S. Quinones, S. Gaytan, M. Lopez, A. Rodela, E. Matrinez, D. hernandez, E. Martinez e F. M. R. Wicker, «Microstructure and mechanical behavior of Ti-6Al-4V produced by rapid-layer manufactured, for biomedical applications,» J. Mech. Behavior Bio. Mat., vol. 2, pp. 20-32, 2009.
[11] B. Vrancken, L. Thjis, J. Kruth e J. Humbeeck, «Heat treatments of Ti6Al4V produced by Selective Laser Melting: Microstructure and mechanical properties,» J. All. Comp., vol. 541, pp. 177-185, 212.
[12] K. Vanmeensel, K. Lietaert, B. Vrancken, S. Dadbakhsh, X. Li, J. Kurth, P. Krakhmalev, I. Yadroitsev e J. Humbeeck, «Additively manufactured metals for medical applications,» in Additive Manufacturing: Metarials, Processes, Quantifications and Applications, 2018, pp. 261-309.
[13] B. Wysocki, P. Maj, R. Sitek, J. Buhagiar, K. Kurzydlowski e W. Swieszkowski, «Laser and electron beam additive manufacturing methods of fabricating titanium bone implants,» Appl. Sci., vol. 657, p. 7, 2017.
[14] S. Al-Bermani, M. Blackmore, W. Zhang e I. Todd, «The origin of microstructural diversity, texture, and mechanical properties in Electron Beam Melted Ti-6Al-4V,» Metall. Mater. Trans. A, vol. 41, pp. 3422-3434, 2010.
[15] J. Ran, F. Jiang, X. Sun, Z. Chen, C. Tian e H. Zhao, «Microstructure and mechanical properties of Ti-6Al-4V fabricated by electron beam melting,» Crystals, vol. 10(11), p. 972, 2020.
[16] X. Tan, Y. Kok, W. Toh, Y. Tan, M. Descoins, S. Tor, K. Leong e C. Chua, «Revealing martensitic transformation and alpha/beta interface evolution in electron beam melting three-dimentional-printed Ti-6Al-4V,» Sci. Rep., vol. 6, pp. 1-10, 2016.
[17] T. Vilaro, C. Colin e J. Bartout, «As-fabricated and Heat-treated microstructures of the Ti-6Al-4V alloy processed by Selective Laser Melting,» Met. Trans. A, vol. 42(A), pp. 3190-3199, 2011.
[18] M. Villa, J. Brooks, R. Turner, H. Wang, F. Boitout e R. Ward, «Microstructural Modeling of the α + β Phase in Ti-6Al-4V: A DiffusionBased Approach,» Metall. Mater. Trans. B., vol. 50, pp. 2898-2911, 2019.
[19] P. Lekoadi, M. Tlotleng, K. Annan, N. Maledi e B. Masina, «Evaluation of heat treatment parameters on microstructure and hardness properties of high-speed Selective Laser Melted Ti6Al4V,» Metals, vol. 11, pp. 255-270, 2021.
[20] Standard Specification for Additive Manufacturing Titanium-6 Aluminum-4 Vanadium with powder bed fusion., West Conshohocken, PA, USA, 2014.
[21] E. Cerri, T. Rimoldi, R. Gabrini e L. Righi, «Investigation of microstructure and mechanical performance of Ti6Al4V-ELI components produced by DMLS and EBM additive technologies in different geometries,» La Metallurgia Italiana, vol. 4, pp. 32-43, 2019.
[22] ASTM E8/E8M-13a: Standard test methods for tension testing of metallic materials, West Conshohocken - United Stases, 2013.
[23] A. Antonysamy, J. Meyer e P. Pragnell, «Effect of build geometry on the β-grain structure and texture in additive manufacturing of Ti-6Al-4V by selective electron beam melting,» Mat. Charact., vol. 84, pp. 153-168, 2013.
[24] R. Boyer, G. Welsh e E. Colling, Materials properties Handbook, ASM Internationalù, 1994.
[25] A. Safdar, L. Wei, A. Snis e Z. Lai, «Evaluation of microstructural development in electron beam melted Ti-6Al-4V,» Mater. Charact., vol. 65, pp. 8-15, 2012.
[26] H. Gallaraga, D. Lados, R. Dehoff, M. Kirka e P. Nandwana, «Effect of the microstructure and porosity of Ti-6Al-4V ELI alloy fabricated by electron beam melting (EBM),» Add. Man., vol. 10, pp. 47-57, 2016.
[27] E. Ghio e E. Cerri, «Additive Manufacturing of AlSi10Mg and Ti6Al4V Lightweight alloys via laser powder bed fusion: A review of heat treatments effects,» Materials, vol. 15(6), p. 2047, 2022.
[28] J. Yang, H. Yu, J. Yin, M. Gao, Z. Wang e X. Zeng, «Formation and control of martensite in Ti-6Al-4V alloy produced by selective laser melting,» Mat. Des., vol. 108, pp. 308-318, 2016.
[29] M. Simonelli, Y. Tse e C. Tuck, «Effect of the building orientation on the mechanical properties and fracture modes of SLM Ti6Al64V,» Mat. Sci. Eng. A, vol. 616, pp. 1-11, 2014.
[30] G. Kasperovich e J. Hausmann, «Improvement of fatigue resistance and ductility of Ti6Al4V processed by Selective Laser Melting,» J Mat. Proc. Techn., vol. 220, pp. 202-2014, 2015.
La Metallurgia Italiana - Ottobre 2022 pagina 82
Memorie scientifiche - Off Topic
[31] F. Wang, J. Mei, H. Jiang e X. Wu, «Laser fabrication of Ti6Al4V/TiC composites using simultaneous powder and wire feed,» Mater Sci. Eng. A., Vol. %1 di %2445-446, pp. 461-466, 2007.
[32] S. Cecchel, D. Ferrario, G. Cornacchia e M. Gelfi, «Development of Heat Treatments for Selective Laser Melting Ti6Al4V Alloy: Effect on Microstructure, Mechanical Properties, and Corrosion Resistance,» Advanced Engineering Materials, 2020.
[33] M. Tsai, Y. Chen, C. Chao, J. Jang, C. Tsai, Y. Su e C. Kuo, «Heat-treatment effects on mechanical properties and microstructure evolution of Ti-6Al-4V alloy fabricated by laser powder bed fusion,» J. Alloys Compound., vol. 816, p. 152615, 2020.
[34] F. Nalli, L. Bottini, A. Boschetto, L. Cortese e F. Veniali, «Effect of industrial heat treatment on the mechanical performance of Ti6Al4V processed by Selective Laser melting,» App. Sci., vol. 10, pp. 2280-2296, 2020.
[35] M. Thoene, S. Leuders, A. Riemer, T. Troester e H. Richard, «Influence of heat-treatment on Selective Laser Melting products – e.g. Ti6Al4V,» in Conference Proceedings and journals - International Solid Freeform Fabricartion Symposium, 2012.
[36] A. Khorasani, I. Gibson, M. Goldberg e G. Littlefair, «On the role of different annealing heat treatements on mechanical properties and microstructure of selective laser melted and conventional wrought Ti-6Al-4V,» RPJ, vol. 23(2), pp. 295-304, 2017.
[37] N. Jin, Z. Yan, Y. Wang, H. Cheng e H. Zhang, «Effects of the heat treatment on microstructrure and mechanical porperties of selective laser melted Ti-6Al-4V lattice materials,» International Journal of Mechanical Sciences, vol. 190, p. 106042, 2021.
[38] M. Koike, P. Geer, K. Owen, G. Lilly, L. Murr, S. Gaytan, E. Martinez e T. Okabe, «Evaluation of Titanium Alloys Fabricated Using Rapid Prototyping Technologies—Electron Beam Melting and Laser Beam Melting,» Mater., vol. 4(10), pp. 1776-1792, 2011.
[39] S. Leuders, M. Thoene, A. R. T. Niendorf, T. Troester, H. Richard e H. Maier, «On the mechanical behaviour of titanium alloy Ti6Al4V manufactured by selective laser melting: fatigue resistance and crack growth performance,» Inter. J. Fatig., vol. 48, pp. 300-307, 2013.
[40] A. Syed, M. Awd, F. Walther e X. Zhang, «Microstructure and mechanical properties of as-built and heat-treated electron beam melted Ti–6Al–4V,» Materials Science and Technology, vol. 35, 2019.
[41] S. Raghavan, M. Nai, P. Wang, W. Sin, T. Li e J. Wei, «Heat treatment of electron beam melted (EBM) Ti-6Al-4V: microstructure to mechanical property correlations,» RPJ, vol. 24(4), pp. 774-783, 2018.
[42] O. Teixiera, F. Silva, L. Ferreira e E. Atzeni, «A review of heat treatments on improving the quality and residual stresses of the TI-6Al4V parts produced by additive manufacturing,» Met., vol. 10(8), p. 1006, 2020.
[43] Z. Mierzejewska, R. Hudak e J. Sidun, «Mechanical Properties and Microstructure of DMLS Ti6Al4V alloy dedicated to biomedical applications,» Mater., vol. 12, p. 176, 2019.
[44] D. Srinivasan, A. Singh, A. Reddy e K. Chatterjee, «Microstructural study and mechanical characterisation of heat-treated direct metal laser sintered Ti6Al4V for biomedical applications,» Materials technology, 2020.
[45] E. Cerri e E. Ghio, «AlSi10Mg alloy produced by Selective Laser Melting: Relationships between Vickers microhardness, Rockwell hardness and mechanical properties,» La Metallurgia Italiana, vol. 112, pp. 5-17, 2020.
[46] H. Rafi, N. Karthik, H. Gong, T. L. Starr e B. Stucker, «Microstructures and Mechanical Propreties of Ti6Al4V parts fabricated by Selective Laser Melting and Electron Beam Melting,» JMEPEG, vol. 22, pp. 3872-3883, 2013.
[47] F. Azam, A. Rani, K. Altaf, T. Rao e H. Zaharin, «An In-Depth review on direct additive manufacturing of metals,» in IOP Conference Series: Materials Science and Engineering, Batu Ferringhi, Penang, 2018.
[48] Q. Chao, P. Hodgson e H. Beladi, «Thermal stability of an ultrafine grained Ti-6Al-4V alloy during post-deformation annealing,» Materials Science & Engineering A, vol. 694, pp. 13-23, 2017.
[49] J. Hollomon, «Time-Temperature relations in tempering steel,» Trans. AIME, vol. 162, pp. 223-249, 1945.
[50] S. Wu, Y. Lu, Y. Gan, T. Huang, C. Zhao, J. Lin, S. Guo e J. Lin, «Microstructural evolution and microhardness of selective-lasermelted Ti-6Al-4V alloy after post heat treatments,» J. All. Compound., vol. 672, pp. 643-652, 2016.
[51] A. Guzanova, G. Izarikova, J. Brezinova, J. Zivcak, D. Draganovska e R. Hudak, «Influence if build orientation, heat treatment, and laser power on hardness of Ti6Al4V manufactured using the DMLS process,» Met., vol. 7(8), p. 318, 2017.
[52] X. Zhang, G. Fang, S. Leeflang, A. Boettger, A. Zadpoor e J. Zhou, «Effect of subtransus heat treatment on the microstrucutre and mechanical properties of additively manufactured Ti-6Al-4V alloy,» J. All. Compound., vol. 735, pp. 1562-1575, 2018.
[53] X. Yue, H. Fukazawa, K. Maruyama, K. Matsuo e K. Kitazono, «Effect of post pheat treatment on the mechanical properties of porous Ti-6Al-4V alloys manufactured through powder bed fusion process,» Materials transactions, vol. 60(1), pp. 74-79, 2019.
[54] S. Liu e Y. Shin, «Additive manufacturing of Ti6Al4V alloy: A review,» Mat. Des. , vol. 164, p. 107552, 2019.
La Metallurgia Italiana - October 2022 pagina 83
Scientific papers - Off Topic
presentazione
La XV edizione delle Giornate Nazionali sulla Corrosione e Protezione si terrà in presenza a Torino nei giorni 5, 6 e 7 luglio 2023, presso il Politecnico di Torino.
Le Giornate rappresentano l’evento di riferimento a livello nazionale per la discussione ed il confronto sulle questioni scientifiche, tecnologiche e produttive, nell’ambito della corrosione e protezione dei materiali. In particolare, il Convegno prevede la presentazione dei risultati raggiunti da vari gruppi di studio e da numerose aziende del settore, in forma orale e poster.
aree tematiche principali
• Corrosione delle strutture metalliche esposte all’atmosfera

• Corrosione e protezione delle reti idriche interrate
• Corrosione negli impianti industriali
• Protezione catodica: progettazione, collaudo, gestione e monitoraggio
• Comportamento a corrosione di leghe di titanio, nichel e acciai inossidabili
• Corrosione delle opere in calcestruzzo armato
• Corrosione dei beni culturali
• Corrosione negli impianti Oil & Gas
• Degrado e rilascio dei biomateriali metallici
• Rivestimenti e trattamenti superficiali
• Inibitori di corrosione
• Impatto delle nuove tecnologie produttive sulla corrosione
• Tecniche di studio e monitoraggio della corrosione
• Meccanismi di corrosione
• Case histories
presentazione di memorie
Premio Cecilia Monticelli
L’AIM - Associazione Italiana di Metallurgia bandisce un premio riservato a studenti di dottorato o titolari di borsa o assegno Post Doc.

Per l’edizione 2023 il Comitato Tecnico Corrosione dell’Associazione Italiana di Metallurgia ha deciso di intitolare il premio alla memoria della Prof.ssa Cecilia Monticelli, Università di Ferrara, come riconoscimento alla sua attività di ricerca nei settori della corrosione industriale e del patrimonio culturale. Ulteriori dettagli sono disponibili sul sito dell’evento.

Gli interessati a presentare memorie scientifiche dovranno inviare entro il 30 novembre 2022, il titolo della memoria, i nomi degli autori con relative affiliazioni ed un breve riassunto. Le memorie potranno essere proposte: - compilando il form online presente sul sito dell’evento: www.aimnet.it/gncorrosione - inviando il riassunto e tutte le informazioni richieste a mezzo e-mail: info@aimnet.it
spazio aziende e sponsorizzazione
Le aziende interessate alla sponsorizzazione dell’evento o ad uno spazio per l’esposizione di apparecchiature, la presentazione dei servizi e la distribuzione di materiale promozionale, potranno richiedere informazioni dettagliate alla Segreteria AIM.
EDIZIONE ANNO SEDE · I 1992 Milano · II 1994 Milano · III 1996 Milano · IV 1999 Genova · V 2002 Bergamo · VI 2005 Senigallia · VII 2007 Messina · VIII 2009 Udine · IX · 2011 Monte Porzio Catone · X 2013 Napoli · XI 2015 Ferrara · XII 2017 Milano · XIII 2019 Palermo · XIV 2021 Torino (online) · XV 2023 Torino Tori no, 5-6-7 luglio 2023 www.aimnet.it/gncorrosione Evento patrocinato da giornate nazionali Torino 2023 e protezione corrosione le edizioni
Filippo Turati 8 · 20121 Milano t. +39
·
segreteria organizzativa Via
0276021132 +39 0276397770 info@aimnet.it
www.aimnet.it/gncorrosione
Flow field optimization in BOF based on bottom tuyeres arrangements
edited by:L. Zhang, N. Ali, C. Zhang, A. Zhao, W. Zhang, B. Zhang, W. OuyangThe effects of different arrangements of bottom tuyeres with different gas flow rate were investigated to measure the mixing time of the 210t converter by physical model experiments, while the corresponding numerical simulation was performed by using volume of fluid (VOF) model to predict the gas-liquid flow characteristics inside the converter bath. The bottom tuyere was arranged symmetrically at the trunnion reference line in 1:9.43 scaled-down BOF converter and different water model experiments were performed. The optimized bottom tuyere arrangements were investigated according to the deviation of mixing time, which was reduced by 27%, 17.44% and 22% in case of B2, A1 and C2 schemes respectively than the prototype scheme X in the combined blowing converter. The percentage volume analysis of molten steel with different velocities has reasonable evaluation for the optimization of the flow field inside the converter bath. The numerical simulation results were consistent with the physical model results indicating that the optimized bottom blowing arrangements have a great impact on the flow of molten steel.
KEYWORDS: CONVERTER, MIXING TIME, WATER MODEL, NUMERICAL SIMULATION, OPTIMIZED BOTTOM TUYERE ARRANGEMENTS;
INTRODUCTION
Top-bottom Combined blown technology is used for the efficient mixing in basic oxygen furnace (BOF). The application of combined blowing is of great importance which leads to homogenize the temperature and composition of the converter bath by the effective slag-metal interaction and the better yield. The top lance configuration, the gas flow rates and the bottom tuyeres configuration are investigated parameters of decisive importance for better mixing in the metal bath to improve steel quality and plant productivity[1]. Several researchers have carried out the optimization of bottom tuyeres for a given set of parameters to achieve better mixing in the converter bath[2-4] . Experimental[5,6] and numerical[7,8] studies were performed to investigate the gas-liquid two phase flow and the gas induced mixing behavior. Physical and mathematical models were used to simulate the combined blowing in the converter. In some cases, the results of the computational model and experimental observations had a good agreement with each other. Among the several bottom tuyeres arrangements, the one having eight tuyeres placed on the symmetric non-equiangular position was found the best with respect to mixing in the bath. Quiyoom studied the gas-liquid flow and mixing time for the optimization of bottom tuyere configuration with cold flow experiments in 6:1 scaled-down BOF converter. He performed 3D transient Euler-Lagrange (EL) simulation to investigate the static and dynamic differential flow schemes[9]. Singh et
Liqiang Zhang, Naqash Ali, Chaojie Zhang, Aonan Zhao
School of Metallurgical Engineering, Anhui University of Technology, Ma’anshan 243002, China - naqash.sanaullah322@gmail.com
Wei Zhang, Benliang Zhang, Wei Ouyang
Jiangyin China Resources Steelmaking limited company; Ningbo Steel Limited Company - kuangbiao_juan@163.com
La Metallurgia Italiana - October 2022 pagina 85 Industry news - Attualità industriale
al. performed water model experiments and mathematical modelling (discrete phase analysis) to optimize the bottom tuyeres parameters in combined blowing and observed the minimum mixing time at a PCR of 0.56, with gas flow rate of 50 lpm[10]. Zhou proposed a scheme in which bottom tuyeres were asymmetrically arranged. He employed a mathematical model to study the characteristics of the flow field, compared the existing and new scheme with respect to mixing and turbulence, whose results showed that the new scheme had a better mixing in the bath[11]. A mathematical model, combination of the volume of fluid (VOF) and discrete phase model (DPM) was established to study the gas-liquid flow in BOF converter. Three bottom tuyeres placed at a diameter of 0.3-0.4 from the centre of the bottom have high mixing efficiency than the case of two or four tuyeres[12]. The jet penetration and Thyssen Blowing Metallurgy (TBM) tuyeres configuration on the behavior of the metal bath were defined by using visual inspection and calorimetry method in order to study the combined blowing through cold model[13]. The asymmetric bottom tuyere configuration in combined converter was used for the optimization of bottom blowing and the results of physical modelling experiments showed that the shorter mixing time was obtained in case of asymmetric configuration than the symmetric bottom tuyere configuration[14]. Wentao et al. studied the inclusion behavior and mixing efficiency with different layout of tuyeres. Shorter mixing time and higher inclusion removal were obtained by dual blowing as compared to centric and eccentric blowing by using one tuyeres[15]. Eulerian multiphase models were used to investigate the effects of flow rate and bottom tuyeres configuration on the molten steel flow in the bath for better stirring efficiency[13-14]. Thaker et al. investigated the effects of combined gas blowing and sloshing interface on the dynamics of gas–liquid flow and the liquid–phase mixing by performing the PIV and PLIF measurements in a 1:6 scaled down vessel. In the cases of combined blowing, the additional energy was provided by top blowing, resulting in the increased vertical molten velocity fluctuations and the relevant turbulent kinetic energy at the upper vessel region[17]. Quiyoom investigated the effect of pitch-to circle-diameter ratio
(PCD) on the gas-liquid flow and mixing in the bath. The results showed that the mixing in the bath was minimum with 8 tuyeres located at PCD of 0.5[18]. Das et al. investigated the effect of dispersed gas bubbles on liquid phase mixing in a bottom blowing converter, and the results showed that the mixing time decreases with increasing the number of tuyeres[19]
In this paper, a series of water model experiments were performed by using a volume of fluid (VOF) model to investigate the optimization schemes. The mathematical model describes the flow characteristics of molten metal inside the converter bath with different bottom tuyere arrangements in case of optimized and prototype schemes. The optimized schemes had a shorter mixing time, which was reduced to 27 % than the prototype scheme X. Furthermore, the industrial trials were also performed, indicating the uniform mixing in the industrial BOF converter as the average [C]%×[O]% was significantly reduced than the prototype scheme X.
EXPERIMENTAL Water model experiment Experimental principle
In this study, a 1:9.43 scaled-down BOF converter model was constructed to perform the cold flow experiments. Water was filled up to 210t level correlated with liquid in the actual vessel. The specific dimensions of the converter model and actual vessel are listed in Tab. 1. The dynamic similarity of the converter model and the prototype was ensured by determining the conversion formula between model and bottom blowing gas in the actual vessel. The Reynolds (Re) number of molten steel flow was found to be greater than 5000, which undergoes into self-preserving region, and the power of liquid flowing develops due to the buoyancy of bubble for the bottom gas stirring. Therefore, experiment ensures the similar geometries of the model and prototype. The actual Froude number in this experiment was converted to a modified Froude number because of gas two-phase flow, while the gravity acts as driving force.
The modified Froude number is defined as:
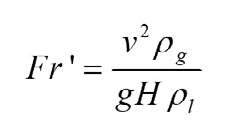
La Metallurgia Italiana - Ottobre 2022 pagina 86
industriale - Industry news
Attualità
1)
In this formula V is the characteristic velocity (ms-1), H is the height (m) of the molten pool in the vessel, ρg and ρl are the density of gas and liquid (kg.m-3) and g is the gravitational
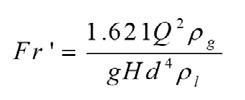
acceleration (ms-2). Gas flow velocity can be expressed as a function of gas flow rate as follow:
Where, Q is gas flow volume and d are the nozzle diameter. Equation No.1 become as follow
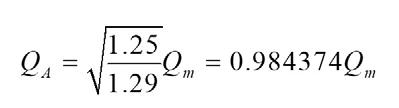 By (Fr’)m= (Fr’)
p
Where, m and p denote model and prototype.
,, lmatmlmm PPgH ρ =+ Bring into the above equation.
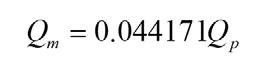
In the above equation the subscripts ρl, m and ρl, p are the water and steel densities, kg. m-3 respectively, ρg, m and ρg, p are the standard densities of oxygen and argon respectively, kg. m-3 , H m and H p are the liquid pool heights (m) in con-
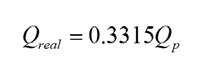
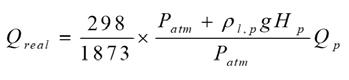
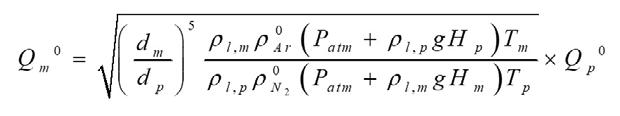
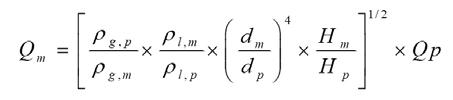
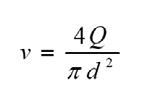
verter model and prototype and P0 and T0 are the standard pressure (101325 Pa) and temperature (20 oC). By substituting data into above equation
Subscripts Qm and QA are the actual gas flow rate and indicator value of flow meter (m3s-1) respectively. The formula of Qm is used to calculate the gas flow rate in model. The relationship between the gas flow rate at high temperature
blown into the converter and flow rate under the standard condition of bottom blowing controlled at the required temperature is as follows:
La Metallurgia Italiana - October 2022 pagina 87 Industry news - Attualità
industriale
2)
3)
4) 5)
6) 7)
8) 9)
Tab.1 - Dimensions of the converter model and prototype.
Parameters
Prototype Model
Ratio 9.43 1
Liquid depth (mm) 1800 190
Top lance height (mm) No. of bottom tuyeres 1600 8 170 8
Experimental setup and mixing time
The schematic of experimental setup is shown in Fig. 1(a). The conductivity method was used to investigate the mixing time in the converter bath under different bottom tuyere arrangements. During the experiment, nitrogen was injected into the bath through eight bottom tuyeres, arranged symmetrically on the trunnion reference line to simulate the argon blowing in the actual process. In the previous research reports only one conductivity electrode was used[20,21]. However, the conductivity values might be changed with the different electrode positions. Therefore, in this work three electrodes were placed at different positions to ensure the accurate mixing conditions of the solution, and collected the residence time distribution (RTD) curves during 180s as shown in Fig 1(b). The conductivity electrodes were calibrated before the start of experiment. One conductivity electrode was positioned into the active zone near the water level, while the other two was placed into the stagnant zone near the bottom region and bath walls. Mixing time experiments were
performed by using stimulus-response method in which tracer as 50ml of saturated KCl solution was injected into the converter and the electrode was connected to a standard conductivity meter along DJ-800 acquisition system to measure the conductance of the solution. The output signal of conductivity meter was recorded through a computer connected A/D converter amplifier. The system was considered to be homogeneously mixed when the conductivity of water reaches at a certain permissible range of the total mixed concentration. Generally, ∣Ct-C∞∣ ≤ 0.05C∞ was taken as the standard with mixing time of t0.95. Each experiment was repeated twice for reproducibility of the measurements and mixing time was determined according to the fluctuation of conductivity, which was not exceeded above 5% of the stable state value. Before determining the mixing time, a certain amount of gas was stirred into the molten pool to ensure flow stability of the entire pool. The definition of mixing time is 95% of mixing degree. The mixing time is referred as the time when the detected conductance is almost stable.
Fig.1 - Schematic diagrams: (a) experimental setup, and (b) typical RTD curves at three different positions of electrodes.
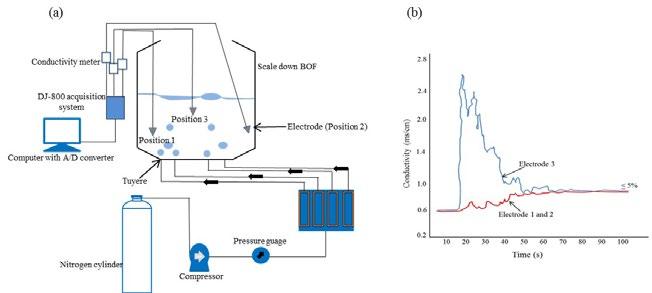
La Metallurgia Italiana - Ottobre 2022 pagina 88
industriale - Industry news
Attualità
Bottom tuyeres arrangements
The design plan for the bottom tuyeres layout of four types of flow schemes with different gas flow rates is shown in Tab. 2. The flow scheme used by the steel industry is named as prototype X scheme in which four tuyeres (θ = 70°, 110°,
250° and 290°) are located at the pitch to circle diameter (PCD) of 0.5, while six tuyeres (θ = 50°, 90°, 130°, 230°, 270° and 310) located at PCD of 0.8, are compared with different experimental bottom blowing schemes in order to investigate the optimized bottom tuyere configuration.
Tab.2 - Investigated schemes with different bottom tuyere's arrangements.
Tuyere's
Schemes
MATHEMATICAL MODEL
To investigate the effects of the converter bottom blowing arrangements on the flow of molten steel, the numerical simulation of the combined blowing for optimization of converter bath was carried out by implementing volume of fluid (VOF) model in ANSYS FLUENT 17.1. The volume of fluid (VOF) model is well known to be a powerful tool to simulate the gas stirring inside the converter bath[22]. The slag phase is not considered in the present work due to
its little effect on stirring behavior of molten bath as consistent with the work of Ersson et al., [23]. The meshing of calculation domain in geometrical model for the combined blowing converter is shown in Fig. 2. The green and purple mesh colors denote the different faces of geometrical model and were meshed with size of 100 mm and 20 mm for the bottom blowing tuyeres and top blowing oxygen inlets respectively. Furthermore, the mesh size of the elements is selected based on the several mesh refinements.
Fig.2 - Top-bottom combined blowing converter mesh: (a) overall meshing of converter model, (b, c) top blowing jet, and (d, e) bottom blowing tuyeres.
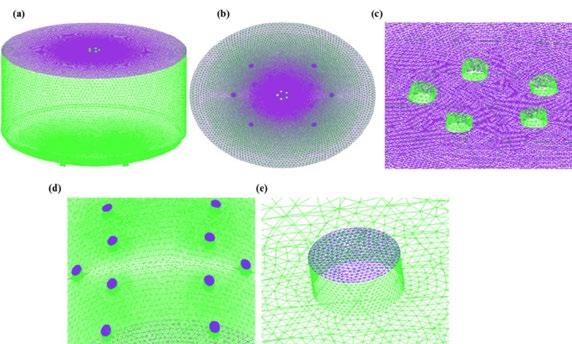
La Metallurgia Italiana - October 2022 pagina 89 Industry news - Attualità industriale
A1 √ √ √ √ √ √ √ √ √ 20/40° A2 √ √ √ √ √ √ √ √ √ A3 √ √ √ √ √ √ √ √ √ B1 √ √ √ √ √ √ √ √ √ 20° B2 √ √ √ √ √ √ √ √ √ B3 √ √ √ √ √ √ √ √ √ C1 √ √ √ √ √ √ √ √ √ 25/50° C2 √ √ √ √ √ √ √ √ √ C3 √ √ √ √ √ √ √ √ √ X √ √ √ √ √ √ √ 25° √ √ √ √ √
position PCD θ 1 2 3 4 5 6 7 8 9 10 11 12 13 14 15 16 .5 .6 .7 .8
Basic assumptions
The molten steel in the converter exhibits a complex turbulent flow. In order to establish the volume of fluid (VOF) model for the top and bottom of the converter, the basic
assumptions are: 1) molten steel is a Newtonian fluid; 2) molten steel does not chemically react with the gas; 3) the top and bottom blowing gases are incompressible gases, and 4) assume the boundary as a non-slip boundary.
Basic assumptions
The molten steel in the converter exhibits a complex turbulent flow. In order to establish the volume of fluid (VOF) model for the top and bottom of the converter, the basic assumptions are: 1) molten steel is a Newtonian fluid; 2) molten steel does not chemically react with the gas; 3) the top and bottom blowing gases are incompressible gases, and 4) assume the boundary as a non-slip boundary.
Control equation
The multiphase flow inside the converter bath was simulated by VOF model and the control equations are stated as follow[22,24,25] .
(1) Equation of continuity
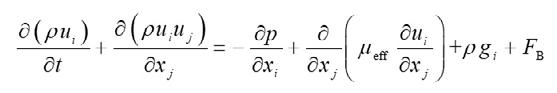
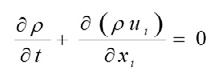
Where, ρ is the density of liquid steel (kgm-3), ui is the velocity of the molten steel in the ith direction (ms-1) and t is the time (s).
(2) Equation of the momentum conservation
Where P is the pressure (Pa), μeff is the effective dynamic viscosity (Pa.s), FB is the buoyancy term.
(3) Volume function equation
Volume function equation is used to simulate the gas two-phase flow.
In the formula, F is a volume function and F=1 represents a molten steel full state, when 0 < F < 1 represents a free surface and F = 0 represents the state without molten steel.
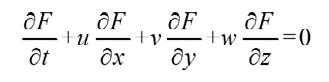
Boundary Conditions
(1) Top blowing boundary conditions
According to the top flow rate of 38000 m3/h and the geometrical size of oxygen lance (selected based on the several mesh refinement), the gas velocity at the outlet of the top lance was 780 ms-1. The pressure at the exit of the top jet was 1 × 10⁵ Pa.
(2) Bottom blowing boundary conditions
According to the bottom blowing flow rate of 500 m3/h and the geometrical size of bottom tuyeres, the gas flow rate at the outlet of the 10 bottom tuyeres was 0.563 ms-1 but for 8 tuyeres it was varied to 0.704 ms-1. The pressure at the exit of the bottom tuyeres was 1.1 × 10⁶ Pa.
La Metallurgia Italiana - Ottobre 2022 pagina 90
news
Attualità industriale - Industry
10) 11) 12)
RESULTS AND DISCUSSION Water model results
Effect of gas flow rates and tuyere's configurations on mixing time
The bottom tuyere's configuration has a crucial role on the mixing time of converter bath, as the mixing time decreases with increasing the number of tuyeres and gas flow rate[26,27]. In the present work, four types of blowing schemes (A1, B2, B3, and C2) with gas flow rate of 600 m3/h are considered based on the total mixing time in the converter bath during bottom and combined blowing. The bottom tuyeres were separated with different angles at different PCD as show in Fig. 3. The six gas flow rates of 150, 600, 700, 800, 900 and 1000 m 3/h with changing bottom tuyere's setup from PCD of 0.5 to 0.7 did a good job to investigate the optimized bottom tuyere's configuration as compared with prototype scheme X. The mixing time was increased with minimum and maximum gas flow rates of 150 m3/h and above 800 m3/h respectively as shown in Fig. 4. However, the lowest mixing time was obtained at flow rates of 600-800 m3/h with tuyere's setup at different PCD. Renato et al. found that the increase in gas flow rate does not diminish the degree of homogenization in the ladle for configurations involving one gas injection, which is contrary to the logic regarding the energy state of the system[28]. The mixing time was increased up to a critical value of gas flow rate and remained constant or slightly increased beyond the critical value, which is the function of angles between tuyeres[25], and nature of flow distribution pattern inside the converter bath[29]. Therefore, gas flow rate from 600-800 m3/h is considered as the critical value to further choose the optimization schemes based on the total mixing time in converter bath. In case of prototype X scheme, the mixing time was larger at the walls and center of the converter bath than all other investigated schemes. Furthermore, ten bottom tuyeres were placed at PCD of 0.5 and 0.8 in prototype scheme X, while the eight tuyeres were used in all other schemes. It can be inferred that the number of tuyeres has not major influence on mixing time; rather the configuration is much important. Wu et al. found that the different configurations of bottom tuyeres have a great influence on the mixing behavior of the molten steel than the number of tuyeres[8]. The different bottom blowing arrangements have decisive role on the
mixing behavior at the converter walls, which is the function of close proximity of bottom tuyeres and the nature of induced flow pattern inside the converter bath. The high proportion of stirring is observed at the center of converter in all cases. The mixing behavior at the walls and center of converter bath is further verified by simulation results of velocity distribution in the following section. Fig. 5 shows the total mixing time with only bottom blowing and combined blowing processes, which reveals that in the case of top-bottom combined blowing the mixing time of the water model was longer than the only bottom argon blowing. The possible reason for the greater mixing time was that the top blowing oxygen and the bottom blowing argon were opposite to each other and a part of momentum remained offset. The stirring kinetic energy was significantly consumed by the top blowing jet, which results in the increase of mixing time. The top blowing gas leads to the cavity formation on the liquid surface. The top blown gas jet and the bottom blowing plume increases the gas velocity at the rim of the cavity, which causes the heavier spitting and lowers the energy distribution in the blowing converter[30]. Furthermore, a rough and positive correlation was investigated between the liquid/liquid and gas/liquid mass transfer rates by a wide range of top and bottom blowing gas flow rates[31]. From moving PCD of 0.5 to 0.7, the mixing time decreases for case B in than all other cases in combined and bottom blowing, due to close proximity of bottom tuyeres, which are separated by the angles of 20°. Therefore, mixing time was reduced by 27% in the case of B2 scheme as compare to prototype scheme X. In case of schemes A1, B1, C1 and X the bottom tuyeres are located at the PCD of 0.5 below the top oxygen jet. Therefore, an interacting flow pattern is developed which significantly reduced the mixing efficiency. Li et al. found that the mixing time decreases with increasing gas flow rate from bottom tuyeres beneath the top blowing jet due to the momentum loss by the collision of bottom blowing plumes and top blowing gas [16] . The prototype scheme X has the total mixing time of 77 sec, which was reduced by 35-44% in case of investigated schemes B2, B3, A1 and C2 during pure bottom blowing. The design scheme B with eight bottom tuyeres located at the pitch to circle diameter (PCD) of 0.6 and 0.7 (for B2 and B3 respectively) and have the better mixing time than A1,
La Metallurgia Italiana - October 2022 pagina 91 Industry news - Attualità industriale
A2, and C2 schemes. It can be observed that the from Fig. 5, that the design scheme B2 have the optimal solution
Attualità industriale - Industryof mixing time in case of combined and bottom, while A1 and C2 can be referred as optional optimization schemes.
Fig.3 - Schematic of different bottom tuyeres layout consider in the present study: (a-d) schemes B2, A1, B3 and C2 respectively.
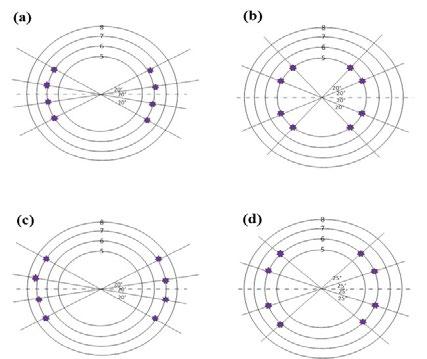
Fig.4 - Relationship between mixing time and gas flow rates: (a-c) schemes A1, A2, and A3, (d-f) schemes B1, B2, and B3, (g-i) C1, C2, and C3 (j) prototype scheme X.
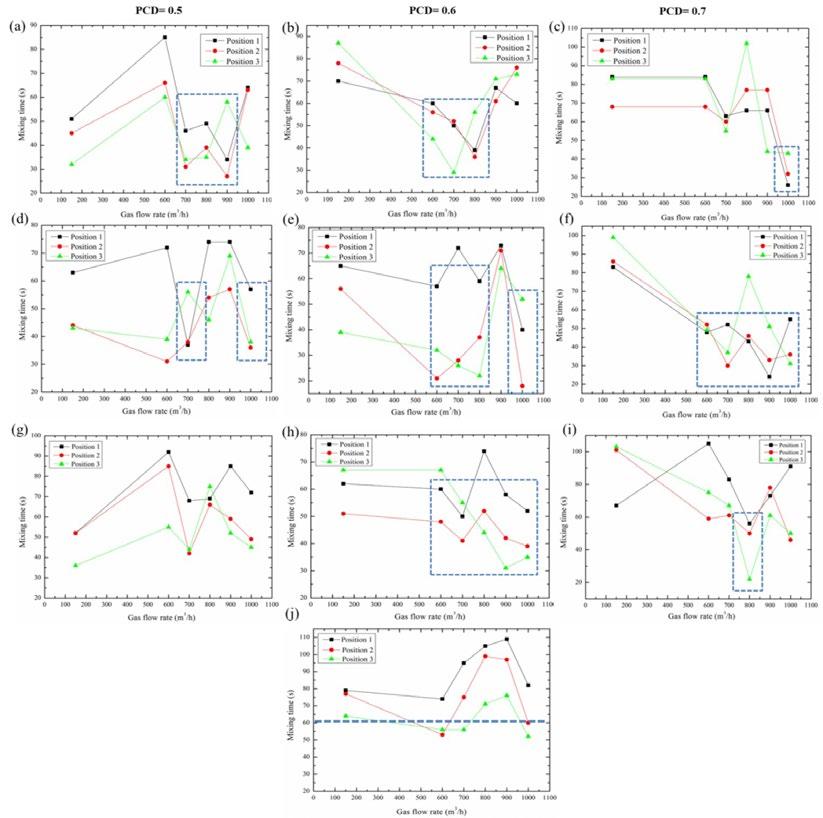
La Metallurgia Italiana - Ottobre 2022 pagina 92
news
Fig.5 - Mixing time results inside the water model during combined and bottom blowing.
RESULTS OF MATHEMATICAL MODELING
Characteristics of molten pool and velocity distribution by prototype scheme X
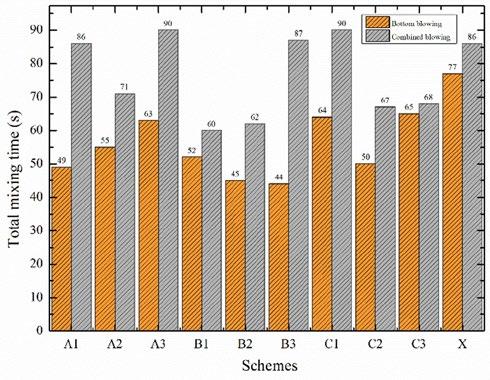
In case of prototype scheme-X, the gas-liquid interface at the cross-section of X=0 and Z=0 in the converter bath is shown in Fig. 6 (i) and liquid interface fluctuation caused by the combined blowing was observed. The velocity distribution of molten steel at the cross section of X=0 and Z=0 was compared, which exhibited the different flow characteristics. Gas flows from the bottom tuyeres into the molten pool, which drives the molten steel to the upward direction during the ascending motion of gas. The velocity of molten steel is distributed within 0-1 ms-1, which is non-uniform in the entire molten pool and has multiple turbulent eddies. Overall, greater the flow of molten steel towards the upper part of the converter, greater will be the velocity at the gas-liquid interface. The four bottom tuyeres located beneath the top blowing jet at PCD of 0.5 are separated with greater angles in case of scheme X, and consumed a high fraction of stirring kinetic energy due to the collision of top blowing gas and bottom blowing bubbles, resulting in the low circulation area at the center of the molten pool as can be seen in Fig. 6 (ii). The six tuyeres located at PCD of 0.8 also induced low-velocity distribution at the walls of the converter due to wall friction. Therefore, the region between gas flow line and both sidewalls of the converter was covered by a large number of circulation paths and the entire molten pool was divided into independent flow regions which strongly affect the
mixing uniformity. Therefore, the molten steel undergoes severe turbulence due to the combined blowing, which promotes uniformity of composition and temperature of the molten steel. However, there was still a certain region where the velocity and convection exchange with other regions was small. The velocity distribution at different cross sections in the converter is shown in Fig. 7. The gas flow rate is distributed within 10-60 ms-1, which is much larger than the flow rate of molten steel. The flow of gas is turbulent in the gas phase region which drives the molten steel to the gas-liquid interface. As can be seen in Fig. 7 (ii), there are specific regions with less velocity and dispersed gas flow, which affects the mixing efficiency of the entire molten pool due to multiple independent plume regions. Therefore, scheme X has the low gas flow rate by the bottom blowing tuyeres, which decline the stirring of converter bath, as a result mixing time of the converter bath was increased.
La Metallurgia Italiana - October 2022 pagina 93 Industry news - Attualità industriale
Fig.6 - Contours of molten steel velocity for Scheme X, (a) at section X=0, and (b) at section Z=0, (i) gas-liquid interface fluctuation, (ii) velocity line distribution, ms-1, and (iii) liquid steel flow vector distribution at section Z=0, ms-1, partial magnification.
Fig.7 -(i) Streamline distribution of gas phase, scheme X, (a) section X=0, and (b) section Z=0. (ii) gas-phase flow vector distribution, scheme X, section Z=0, (a) overall view, and (b) partial magnification.
Comparison of velocity distribution in the longitudinal section of the molten pool
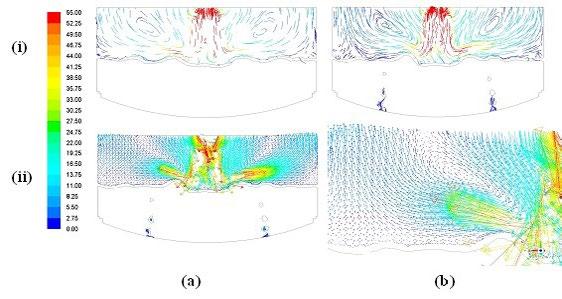
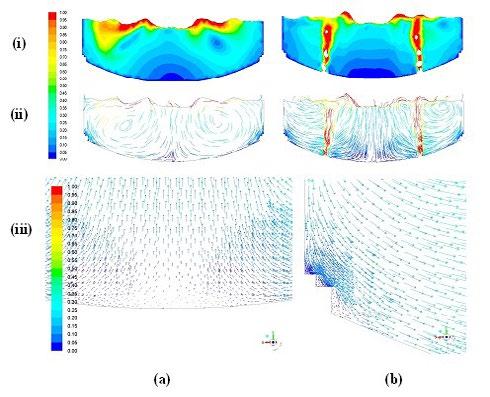
The velocity distribution of molten steel in the longitudinal section of the molten pool for X=0 and Z=0 in different combined blowing schemes is shown in Fig. 8. The top blowing oxygen has a significant impact on the bath stirring; as a result cavity was formed with velocity of 1 ms-1 . The top and bottom blowing interaction with increasing distance of bottom tuyeres to the converter center leads to the greater cavity depth at gas-liquid interface as shown in Fig. 8a. The gas bubbles blowing upward drives the molten steel around it, which exhibits the strong turbulent circulation at the center due to the flow field of neighboring tuyeres. The shape of cavity confirms the direct contact area between top blowing oxygen and liquid ste-
el, which simultaneously affects the molten metal flow[32] . The increasing number of tuyeres in prototype scheme X will have more splashing phenomenon and a non-homogeneous velocity distribution region will be formed in the molten pool in prototype scheme, while this effect was less in case of other investigated schemes with eight bottom tuyeres. The circulation of molten steel is mainly from bottom tuyeres towards the impinging cavity in case of B2, B3 and A2 schemes, which significantly improves the velocity distribution of liquid steel inside the converter bath. Furthermore, the flow field of inverted cone shape is much prominent in case of scheme B2 and B3, in which eight tuyeres are located at PCD of 0.6 and 0.7 respectively and the adjacent tuyeres are separated by an angle of 20°. But there is also a small region of low veloci-
La Metallurgia Italiana - Ottobre 2022 pagina 94 Attualità industriale - Industry news
ty between the bottom tuyeres and the wall of the converter as shown in Figure 8 (b, c). The smaller angle between the tuyeres leads the bubble plume to the centre of the combined blowing converter and the circulation between the bubble plumes and the wall of the converter becomes weak[12]. The flow field can also be hindered by the wall of the converter in scheme B3 due to less distance between converter wall and the tuyeres located at PCD of 0.7. The tracer was spread symmetrically in the converter bath owing to the symmetric flow behavior in both schemes. Both have also better velocity distribution at the centre of converter bath than X scheme due to the concentrative bottom tuyeres arrangement and also the stirring kinetic energy was not consumed by the top jet due to combined
effect of closely packed bottom tuyeres. The concentrative bottom tuyeres arrangements can reduce the barrier to the mixing and decrease the bath mixing time[14]. The arrangement of eight bottom tuyeres (at PCD of 0.5) and the converter center are much close in case of A1. Therefore, high-velocity distribution occurred at the centre of a converter than all other schemes. The kinetic energy was consumed by the collision of top blowing gas and bottom blowing bubbles, resulting in less velocity distribution at the walls. The increasing flow rate weakens the impeding force of sidewall and improve the stirring effect of the molten bath in eccentric bottom tapping region, which would decrease the mixing time and also improve the stirring ability[33] .
Effects of different bottom blowing schemes on the volume fraction of molten steel
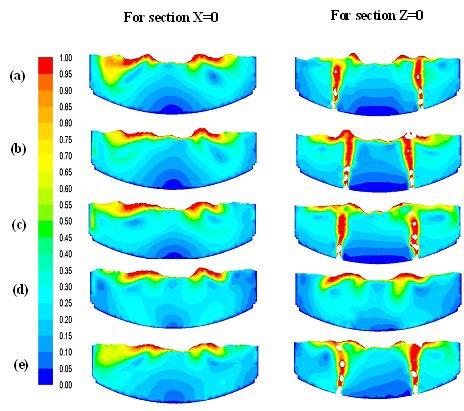
The volume fraction of molten steel at different velocity ranges can make a reasonable evaluation for the optimization of flow field inside the converter bath. Fig. 9 shows the percentage volume distribution of molten steel at low-velocity regions along horizontal axis under different bottom blowing arrangements. The ideal optimal scheme will be that in which the corresponding curves of molten steel volume have the highest fraction, for example, at different velocities, the ideal optimization scheme would be
that in which the volume ratio of molten steel is greater, but in the actual situation the ideal scheme does not exist. At the low-velocity ranges of 0-0.8 ms-1, the volume ratios for different schemes have a great fluctuation, but at higher velocity the volume ratio increases and it remain constant for each bottom blowing scheme as can be seen in Fig. 10. The volume ratios are greater in case of scheme X and C2 in bottom blowing case, but it changes significantly in case of the combined blowing converter. The greater number of bottom tuyeres increases the oscillation of the converter pool than the other schemes with
La Metallurgia Italiana - October 2022 pagina 95 Industry news - Attualità
industriale
Fig.8 - Contours of velocity distribution in the longitudinal section of molten pool at X=0 and Z=0 by different bottom blowing schemes, a) X (prototype), b) B2, c), B3, d) A1, and e) C2.
eight tuyeres in the absence of top blowing. The same situation can be seen in scheme C2 in which the bottom tuyeres were separated by greater angles and each tuyere participated individually for the stirring of its corresponding region. In all studied cases, the concentrative bottom tuyeres have not special effect for velocity distribution due to their combined effect in pure bottom blowing converter. The interaction between top blowing oxygen and bottom blowing argon increases or decreases the stirring of the molten pool, which depends on the gas flow rate,
bottom tuyere arrangements and top lance height. From above analysis, it can be inferred that the symmetrical and concentrated bottom tuyere arrangements will be more beneficial for the efficient velocity distribution in the converter bath, as its effect can be avoided by the momentum transfer from the top jet. The loss in stirring kinetic energy can be reduced in the combined blowing converter by adjusting the bottom tuyeres at a suitable pitch to circle diameter like in the A1, B2 and B3 schemes.
Fig.9 - Percentage volume of molten steel under different bottom blowing arrangements: (a) at high velocity ranges, and (b) at low velocity range.
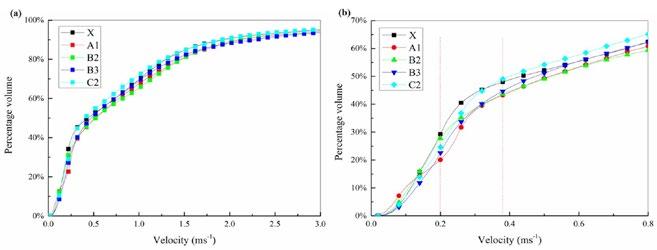
The velocity of molten steel for each scheme was calculated and a smaller volume percentage of molten steel was obtained with low velocity, and vice versa, which can be set as an efficient criterion, as it is beneficial for full mixing in the converter bath, promote the uniform stirring in the converter and increase the rate of the uniform chemical reaction. Furthermore, 0.2 ms-1, 0.4 ms-1 and 0.8 ms-1 were selected as the critical velocity values for determining the percentage volume of the molten steel. The volume of the molten steel with different velocities as <0.2 ms-1, >0.4 ms-1 and >0.8 ms-1 in different top-bottom combined blowing arrangements was also different. The quantitative relationship between the percentage volumes of molten steel at different velocities for combined blowing converter is shown in Fig. 10. The volume of the molten steel exceeds above 50 % at the velocity range of 0.4-0.8 ms -1 for all the schemes. The volume ratio was smaller in case of scheme X, when its velocity was less than 0.2 ms-1, as compared to the higher velocities >0.4 ms-1 and >0.8 ms-1. It indicates the efficient stirring of the molten steel at a low velocity less than 0.2 ms -1 in case of scheme X, than all other bottom blowing schemes. However, in case of prototype scheme X, the flow of molten steel was non-uniform in
the entire molten pool with multiple turbulent eddies at high velocity as compared to the other investigated schemes. The same situation can be seen in the case of scheme C2 whose results of volume ratio were a little better than the scheme X. In scheme C2, eight bottom tuyeres separated by a greater angle of 25°/50° leads to non-homogeneous mixing in the converter as the velocity distribution at the wall of converter bath was inactive. The scheme X and C2 are near to equivalent each other, while the schemes A1, B2, and B3 were found the superior to prototype X scheme. The volume of molten steel in case of schemes A1, B2 and B3 is larger at velocity >0.4 ms-1 , which implies the stronger and homogeneous mixing in the bath than all other schemes with different velocities. In the case of velocity >0.8 ms -1, the mixing of molten steel was compressed in the converter bath with different bottom blowing arrangements. The maximum volume of molten steel was obtained by the schemes A1, B2 and B3 under different velocity ranges. Therefore, A1, B2, and B3 can be categorized as the optimization scheme in which the mixing time was reduced to 27 % than the prototype scheme X. Furthermore, the optimization schemes also encouraged an efficient velocity distribution in the entire
La Metallurgia Italiana - Ottobre 2022 pagina 96
news
Attualità industriale - Industry
molten pool. The numerical simulation results agree with the water model results, which indicate that the optimization schemes are superior to the prototype scheme X. The experimental results showed that the mixing time of flow field in the converter was in the order of, top-bottom combined blowing > only bottom blowing. According to the analysis, the stirring kinetic energy generated by top blowing was limited, so the mixing time was larger. When the argon gas was blown from the bottom,
the bubbles were dispersed which was beneficial to the circulating flow of molten steel in the converter, and the mixing time was the shorter. When the top and bottom gases were blown together, the kinetic energy generated by the top-blown oxygen jet to the molten steel was partially offset by the kinetic energy generated by the flow of bottom-blown argon; therefore, the mixing time was longer than the bottom blowing.
Fig.10 - Percentage volume of molten steel at different velocity ranges under top-bottom combined blowing arrangements.
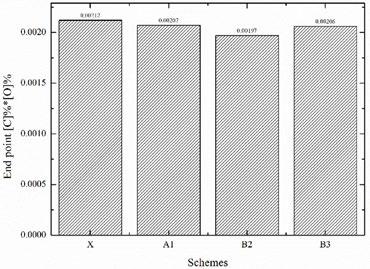
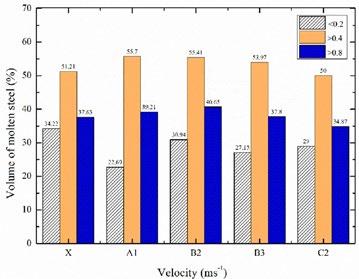
INDUSTRIAL RESULTS
The industrial results verify the correctness of our water model and numerical simulation results. The average value of endpoint equilibrium of [C]×[O] composition (wt.%) provided by steel plant is 0.00212, 0.00207, 0.00197, 0.00206 for X, A1, B2 and C2 schemes respectively as shown in Fig. 11. The average [C]%×[O]% reduced by 0.0002, 0.0005 and 0.0006 for B2, A1 and C2 schemes as compared to the prototype X scheme, which indicates that how well the reaction in the converter bath was progressed and also represented uniform mixing in the industrial BOF converter. The industrial application re-
sults demonstrated that the bottom-blowing argon in BOF converter can facilitate the carbon–oxygen reaction reaching equilibrium, which lower the carbon content in molten steel at the end of melting process and improve the molten steel quality due to its superior stirring in the molten bath. Wei et al. found that the bottom-blowing can strengthen the mixing efficiency in the molten bath and improve the molten steel quality with lower final carbon–oxygen equilibrium and lower nitrogen content[34]. Therefore, the industrial results are also consistent with the physical model and numerical simulation results.
Fig.11 - The average endpoint [C]×[O] composition (wt.%) in industrial BOF converter by prototype and optimized schemes.
La Metallurgia Italiana - October 2022 pagina 97
news
Industry
- Attualità industriale
Conclusions
The following main conclusions can be drawn as:
1. The mixing time in the converter bath is in the order of, top-bottom combined blowing > bottom blowing. The larger mixing in combined blowing is due to opposite motion of top-blowing oxygen and the bottom-blowing argon, which consumes a large part of stirring kinetic energy and also momentum was remained offset in the combined blowing converter.
2. Symmetric and closely spaced bottom tuyere arrangements have the shorter mixing time in combined blowing converter, which was reduced to 27% than the prototype bottom arrangement.
3. 3D transient simulation was performed and a good agreement between water model and simulation results was obtained, where the VOF model is evident to be a powerful tool to simulate molten metal stirring process.
4. The increasing distance between the bottom tuyere with changing PCD of 0.5 to 0.8 results in the low-ve-
locity distribution at the centre of the converter bath, which is also responsible for the low-velocity regions between the converter wall and the gas flow lines from tuyeres.
5. The obtained volume of molten steel at different velocities has a reasonable evaluation for the optimization of the flow field in the converter bath, which was greater than 50% at the velocity ranges of 0.4-0.8 ms-1 for all bottom blowing arrangements.
6. The average value of endpoint equilibrium of [C]×[O] composition (wt.%) was reduced to 0.0015, 0.0005 and 0.0006 with optimization schemes indicating uniform mixing in the BOF converter.
Acknowledgement
The successful completion of this project is benefited from the financial support provided by the Open Foundation of the State Key Laboratory of Refractories and Metallurgy (G201711), and National Natural Science Foundation of China (51874001, U1760108).
REFERENCES
[1] H. Odenthal, U. Falkenreck, J. Kempken, J. Schlüter, N. Uebber, CFD Simulation of Melt Flow Mixing Phenomena in Combined Blowing Converters. Department of Information Technology, Netherlands (2006) 121-142.
[2] S.K. Ajmani, A. Chatterjee, Cold model studies of mixing and mass transfer in steelmaking vessels, ISIJ int. 32, (2005) 515–528.
[3] J.W. Ã, L. Zeng, Numerical Simulation of Fluid Flow in Bath during Combined Top and Bottom Blowing VOD Refining Process of Stainless Steel, 83 (2012) 1–18.
[4] R. Li, S. Kuang, T. Zhang, Y. Liu, A. Yu, Numerical Investigation of Gas − Liquid Flow in a Newly Developed Carbonation Reactor, Industrial & Engineering Chemistry Research 57, (2017) 380-391.
[5] M. Martín, M. Rendueles, M. Díaz, Global and local mixing determinations for steel converter analysis, Chem. Eng. Sci. 60 (2005) 5781–5791.
[6] M. Díaz, M. Martín, Mixing in batch G-L-L reactors with top and bottom blowing, Chem. Eng. Sci. 54 (1999) 4839–4844.
[7] H.J. Odenthal, U. Thiedemann, U. Falkenreck, J. Schlueteru, Simulation of fluid flow and oscillation of the Argon Oxygen Decarburization (AOD) process, Metall. Mater. Trans. B Process Metall. Mater. Process. Sci. 41 (2010) 396–413.
[8] W. Wu, H. Yu, X. Wang, H. Li, K. Liu, Optimization on Bottom Blowing System of a 210 t Converter, J. Iron Steel Res. Int. 22 (2015) 80–86.
[9] A. Quiyoom, R. Golani, V. Singh, V. V Buwa, Effect of Differential Flow Schemes on Gas-Liquid Flow and Liquid Phase Mixing in Basic Oxygen Furnace ( BOF ), Chem. Eng. Sci. 46, (2017) 1171-1176.
La Metallurgia Italiana - Ottobre 2022 pagina 98
- Industry news
Attualità industriale
[10] V. Singh, J. Kumar, C. Bhanu, S.K. Ajmani, S.K. Dash, Optimisation of the Bottom Tuyeres Configuration for the BOF, ISIJ int. 47 (2007) 1605–1612.
[11] X. Zhou, M. Ersson, L. Zhong, P. Jönsson, Optimization of Combined Blown Converter Process, ISIJ Int. 54, (2014) 2255–2262.
[12] Y. Li, W.T. Lou, M.Y. Zhu, Y. Li, W.T. Lou, M.Y. Zhu, Numerical simulation of gas and liquid flow in steelmaking converter with top and bottom combined blowing, Ironmak. Steelmak. 40, (2016), 505-514.
[13] B.T. Maia, D. Augusto, G. De Carvalho, T. Siderar, R. Tavares, TBM tuyeres arrangements and flow - Comparison between BOF Ternium Brasil and cold model Iron Steel Technol. Iron Steel Technol. 15, (2018) 1050–62.
[14] Z. Lai, Z. Xie, L. Zhong, Influence of Bottom Tuyere Configuration on Bath Stirring in a Top and Bottom Combined Blown Converter, ISIJ Int. 48, (2008) 793–798.
[15] W. Lou, M. Zhu, Numerical Simulations of Inclusion Behavior and Mixing Phenomena in Gas-stirred Ladles with Different Arrangement of Tuyeres, ISIJ Int. 54, (2014) 9–18.
[16] M. Li, L.I.N. Li, Q. Li, Z. Zou, Modeling of Mixing Behavior in a Combined Blowing Steelmaking Converter with a Filter-Based Euler –Lagrange Model, JOM 70, (2018).
[17] A.H. Thaker, S. V. Bhujbal, V. V. Buwa, Effects of sloshing gas–liquid interface on dynamics of meandering bubble plumes and mixing in a shallow vessel: PIV and PLIF measurements, Chem. Eng. J. 386 (2020) 122036.
[18] A. Quiyoom, S.K. Ajmani, V. V Buwa, Optimization of bottom tuyere con fi guration for Basic Oxygen Furnace steelmaking through experiments and CFD simulations, Chem. Eng. J. 346 (2018) 127–142.
[19] C.A. Das, A K, RAY H.S., Role of Dispersed GasBubble Agitation in Steelmaking, ISIJ Int. 29 (1989) 284–290.
[20] M. Iguchi, R. Tsujino, K.I. Nakamura, M. Sano, Effects of surface flow control on fluid flow phenomena and mixing time in a bottom blown bath, Metall. Mater. Trans. B Process Metall. Mater. Process. Sci. 30 (1999) 631–637.
[21] M.S.C. Terrazas, A.N. Conejo, Effect of Nozzle Diameter on Mixing Time During Bottom-Gas Injection in Metallurgical Ladles, Metall. Mater. Trans. B Process Metall. Mater. Process. Sci. 46 (2015) 711–718.
[22] C.A. Llanos, S. Garcia-Hernandez, J.A. Ramos-Banderas, J.J. De Barreto, G. Solorio-Diaz, Multiphase modeling of the fluidynamics of bottom argon bubbling during ladle operations, ISIJ Int. 50 (2010) 396–402.
[23] M. Ersson, A. Tilliander, Review on CFD Simulation and Modeling of Decarburization Processes, Steel Res. Int. 89 (2018) 1–13.
[24] G. Chen, S. He, Y. Li, Investigation of the Air-Argon-Steel-Slag Flow in an Industrial RH Reactor with VOF–DPM Coupled Model, Metall. Mater. Trans. B Process Metall. Mater. Process. Sci. 48 (2017) 2176–2186.
[25] T. Haiyan, G. Xiaochen, W. Guanghui, W. Yong, Effect of Gas Blown Modes on Mixing Phenomena in a Bottom Stirring Ladle with Dual Plugs, ISIJ Int. 56 (2016) 2161–2170.
[26] F. Gonçalves, M. Ribeiro, R. Correa, R. Silva, B. Braga, B. Maia, R. Tavares, D. Carvalho, J. Schenk, Measurements methodologies for basic oxygen furnace cold modeling, J. Mater. Res. Technol. 13 (2021) 834–856.
[27] S. Chanouian, B. Ahlin, A. Tilliander, M. Ersson, Inclination Effect on Mixing Time in a Gas–Stirred Side–Blown Converter, Steel Res. Int. 92 (2021).
[28] R. González, G. Solorio, A. Ramos, E. Torres, C. Hernández, R. Zenit, Effect of the Fluid-Dynamic Structure on the Mixing Time of a Ladle Furnace, Steel Res. Int. 89 (2018) 1–9.
[29] K.Y. Chu, H.H. Chen, P.H. Lai, H.C. Wu, Y.C. Liu, C.C. Lin, M.J. Lu, The Effects of Bottom Blowing Gas Flow Rate Distribution During the Steelmaking Converter Process on Mixing Efficiency, Metall. Mater. Trans. B Process Metall. Mater. Process. Sci. 47 (2016) 948–962.
[30] S. Amano, S. Sato, Y. Takahashi, N. Kikuchi, Effect of top and bottom blowing conditions on spitting in converter, Eng. Reports. 3 (2021) 1–16.
[31] Y. Kawabe, M. Uddin, Y. Kato, M. Seok, S. Lee, Correlation between liquid/liquid and gas/liquid mass transfers in a top/bottom blowing converter, ISIJ Int. 57 (2017) 296–303.
[32] M. Lv, R. Zhu, Y.G. Guo, Y.W. Wang, Simulation of flow fluid in the BOF steelmaking process, Metall. Mater. Trans. B Process Metall. Mater. Process. Sci. 44 (2013) 1560–1571.
[33] F. Liu, R. Zhu, K. Dong, X. Bao, S. Fan, Simulation and application of bottom-blowing in electrical arc furnace steelmaking process, ISIJ Int. 55 (2015) 2365–2373.
[34] G. Wei, R. Zhu, Y. Wang, X. Wu, K. Dong, Technological innovations of electric arc furnace bottom-blowing in China, J. Iron Steel Res. Int. 7 (2018).
La Metallurgia Italiana - October 2022 pagina 99
Industry news - Attualità industriale
TORNA ALL'INDICE >
first announcement & call for papers
Heat Treatment & Surface En gine ering
GENOvA - ITALY 29-31 may 2023
AIM is glad to announce the ECHT 2023 Conference, to be held in Genova, at Magazzini del Cotone, on 29-31 May 2023! ECHT 2023 will cover all relevant topics for the Heat Treatment & Surface Engineering community. The Conference will have a special focus on SUSTAINABILITY!
Sustainability, with its three pillars - environmental, economic and social dimensions - is playing a keyrole to address the ongoing and future challenges. The metallurgical and mechanical industry are leading the way in creating a healthy development model for the environment and for the future generations. Presentations and papers from Industry, University and Research Centres on the topic will encourage the discussion and increase awareness on the matter.
We are looking forward to meeting you in beautiful Genova!

IMPORTANT DATES
Abstract Submission Deadline: December 16, 2022
Notification of acceptance: January 31, 2023
Preliminary program: February 27, 2023
Full Paper Submission Deadline: March 31, 2023
CALL FOR ABSTRACTS
Please submit your abstracts (300-400 words) via the Conference website: www.aimnet.it/echt2023.htm
EXHIBITION & SPONSORSHIP
The Conference will feature a technical exhibition that will represent many areas of industry with the latest equipments, facilities, products and services in the field of the conference topics.
CONFERENCE VENUE
The Conference will be held in Genova, at Magazzini del Cotone (https://portoantico.it/en)
Genova sits in a prime location, which encompasses the waterfront, centre and port. The city has always been a place of exchange, gatherings, trade and invention, and it is among the most musical Italian cities in terms of the number of musicians and singer-songwriters born and bred there. It offers an endless array of gastronomic specialities, imitated all around the world.
For more information visit the conference website: www.aimnet.it/echt2023.htm or contact the Organising Secretariat: aim@aimnet.it
Organised by in cooperation withVerenging voor Warmtebehandelingstechniek
SAVE THE DATE!
The next International Conference on Semi-Solid Processing of Alloys and Composites (S2P) will be held in Brescia, Italy, on
6-8 September 2023.
This edition will be the 17th of a series of conferences on semisolid processing of metals and composites started in 1990 in France.
The topics of interest will be many: development of innovative materials and composites, microstructural and mechanical characterization, semi-solid material preparation and related technologies, modelling and simulation, industrial applications, interactions between semisolid processing and additive manufacturing.
But what do we mean with semisolid processing? We are talking about foundry processes in which the mold is filled with partially solid metal, instead of liquid metal. This allows to avoid a turbulent flow of the liquid metal, leading to lower porosities due to gas entrapment, while ensuring optimum filling of the die, even when thin walls are present. Also, shrinkage porosities are reduced since the alloy is partially solid during the mold filling. These features, typical only of semisolid processing, are gaining new interests, for instance for the production of heat sinks with complex geometries and thin walls as the one used in electric vehicles.
In addition, mechanical properties are improved, as well as the corrosion and wear resistance, due to the peculiar globular microstructure, resulting in the possibility to manufacturing high-performance structural components. At the same time, the metal fills the die at a lower temperature than in conventional foundry process, resulting in a prolonged lifetime of the die. Last but not the least, the surface finish of these castings is extremely good. The participation to the conference is open not only to universities, but also to companies and research centers that are interested in the topic or active in this field, which is gaining more and more interest in the last years both for Aluminium and Magnesium alloys.
In the previous editions, the participation of companies and universities from Europe (Italy, Austria, Spain, Sweden, France, Belgium,…), America (USA, Canada, Brazil,…) and Asia (China, Taiwan,…) has been significant.
The conference is organized by the Italian Association of Metallurgy (AIM) and the University of Brescia (Italy). Many associations are supporting this event, as FACE (Federation of Aluminium Consumers in Europe). For information and to participate to the conference, go to the conference website: http://www.aimnet.it/s2p/
La Metallurgia Italiana - October 2022 pagina 101 Atti e notizie - AIM news
All accepted papers will be published in the Proceedings as a special issue of the indexed Solid State Phenomena Journal.
New testing methodologies to evaluate the fracture toughness of metal sheets and case studies presented during the 39th National Conference of AIM
participated in a ToughSteel-dedicated workshop during the 39th

Metallurgy (AIM), which was celebrated on 21st-23rd September in Padova (Italy).
During the workshop, David Frómeta, Head of Eurecat’s mechanical behaviour group and project coordinator, provided a general overview of the ToughSteel project and talked about the experimental evaluation of the essential work of fracture and its application to understanding crack-related problems in the sheet metal industry. The adoption of this methodology contributes to promoting the use of new metallic materials with enhanced properties and avoiding fractures during the manufacturing stage, as well as once the component is in service.
As for Michele Maria Tedesco, Metals manager at CRF Stellantis presented two case studies in which the Essential Work of Fracture methodology was applied in the automotive sector to improve the material used under seats beams to absorb crash energy and limit crash intrusion; and as aluminum reinforcement.
Pär Jonsén, Professor at Lulea Technology Unversity, gave a talk about numerical modelling of shear cutting in high
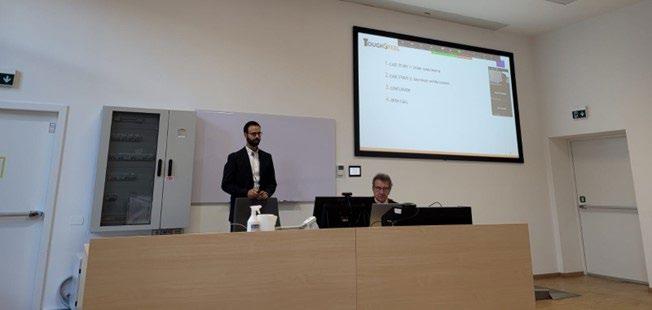
La Metallurgia Italiana - Ottobre 2022 pagina 102 Atti e notizie - AIM news
Project partners David Frómeta (Eurecat), Michele Maria Tedesco (CRF) and Pär Jonsén (Luleå University of Technology)
National Conference of the Italian Association for
strength sheets. More precisely, he discussed the plasticity, damage and cracks in numerical modelling, as well as the simulations of shear cutting.
During the event it was also promoted the Open Call of the project, open until October 31st. Through the OpenCall ToughSteel will provide to the industrial applicants a full fracture toughness material characterization in accordance with the EWF methodology to solve the cracking problems such as edgecracking, flangeability or crashworthiness issues.
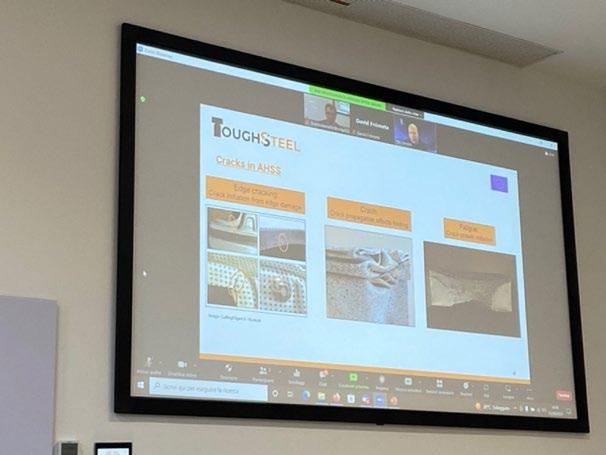
La Metallurgia Italiana - October 2022 pagina 103 Atti e notizie - AIM news
AIM National Conference is the reference initiative for company technicians, researchers and academics working in the metallurgical field. The 2022 edition has acquired a particular significance in light of the post-pandemic recovery and the increasingly strategic and transversal role that metallurgical disciplines play in the context of ecological transition, sustainable mobility, circular economy, increasingly more performance high demands on any mechanical component.
Il giorno 20 maggio 2022 si è tenuta presso il Dipartimento di Ingegneria dell’Università di Ferrara, la Giornata di Studio dal titolo “L’alluminio nell’automobile: la storia incontra il futuro”, organizzata dalla Associazione Italiana di Metallurgia (AIM) – Centro di Studio Metalli Leggeri, con il patrocinio di ASI, di AISA (Associazione Italiana per la Storia dell’Automobile), il supporto del MAUTO (Museo Nazionale dell’Automobile di Torino) e del Club Officina Ferrarese del Motorismo Storico, federato ASI.
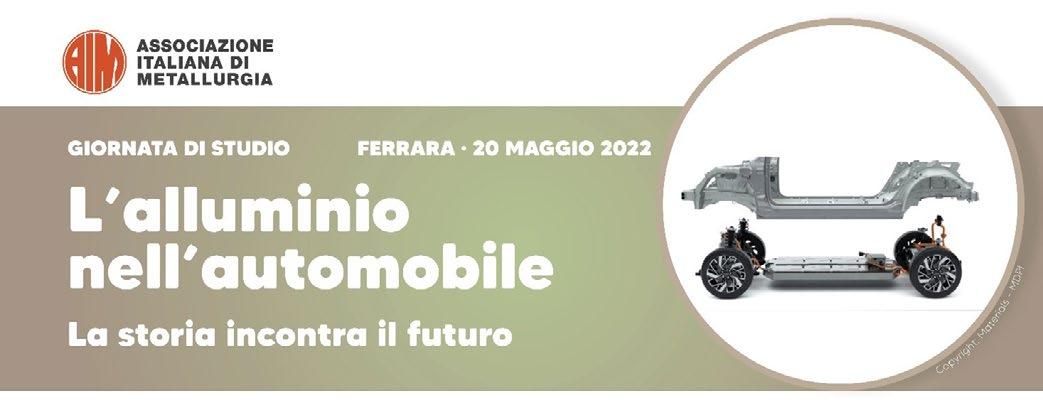
La Giornata di Studio, promossa dal gruppo di ricerca di Metallurgia del Dipartimento di Ingegneria, è stata dedicata all’analisi delle innovazioni che hanno caratterizzato il mondo dell’automobile fin dalla sua nascita, ed ha voluto rappresentare un momento di approfondimento rivolto ai materiali, in particolare metallici, impiegati nel settore dell’automotive e alle innovazioni prodotte dall’introduzione e dall’impiego di materiali sempre più leggeri e performanti, come le leghe di alluminio.
Le leghe di alluminio hanno avuto un ruolo fondamentale nell’innovazione dell’automobile, sia nella carrozzeria sia negli organi meccanici, soprattutto ai fini dell’alleggerimento e del miglioramento delle prestazioni dei veicoli. Nello stesso tempo si è avuta una profonda evoluzione delle leghe, sia da fonderia sia da lavorazione plastica, che ha permesso, da un lato di migliorare l’integrazione tra le diverse tecnologie, e dall’altro di
incrementare significativamente l’uso delle leghe leggere nel settore dei mezzi di trasporto.
Dopo l’intervento dell’Ing. Lorenzo Boscarelli, presidente di AISA, su “Le prime applicazioni dell’alluminio nell’automobile e le innovazioni nella sua storia”, si sono succeduti interessanti interventi sulle auto di interesse storico, come quello dell’Ing. Lorenzo Morello, vice presidente della Commissione Cultura di ASI su “Evoluzione del progetto e dei materiali nei principali motopropulsori automobilistici italiani” e “Il restauro dei metalli: dalle opere d’arte alla meccanica”, tenuto dalla Dott.ssa Chiara Armigliato, restauratrice presso il MAUTO di Torino
Non sono mancati gli approfondimenti legati all’impiego dell’alluminio nelle moderne vetture ad alte prestazioni, illustrati dai Prof.ri Bonollo e Timelli dell’Università di Padova-Vicenza, alla evoluzione della produzione dei cerchi in lega leggera (G.Muffatto) e sulla importanza della ricerca nel settore dei materiali legata al prossimo mondo dell’auto elettrica, a cura dell’Ing. Jacopo Tatti di CRF –Stellantis.
Dopo l’intervanto dell’Ing. Nidasio di Continuous Properzi SpA su “I collegamenti elettrici in alluminio nell’automobile”, il Dott. Alberto Pomari di Edimet, ha evidenziato gli effetti della transizione dal motore termico
La Metallurgia Italiana - Ottobre 2022 pagina 104 Atti e notizie - AIM news
al veicolo elettrico, che determinerà un cambiamento epocale, con una profonda revisione delle applicazioni delle leghe leggere nelle autovetture e quindi un ulteriore percorso di innovazione. In questo scenario, oltre al fattore alleggerimento, l’impiego delle leghe di alluminio potrà assicurare riduzione di costi di assemblaggio, ottima conducibilità e smaltimento del calore, completo riciclaggio, resistenza a corrosione e minori costi di manutenzione.
A conclusione del convegno si è tenuta una tavola rotonda su “L’attività di ricerca sulle leghe leggere nel settore automotive: le collaborazioni Aziende – Università”, alla quale hanno partecipato rappresentanti del mondo industriale e docenti del Dipartimento di Ingegneria


dell’Università di Ferrara e del Dipartimento di Tecnica e Gestione dei Sistemi Industriali (DTG) dell’Università di Padova, sede Vicenza.
La Giornata di Studio ha voluto essere anche un ricordo dell’Ing. Giorgio Valentini, progettista di vetture da competizione fin dal 1948, indipendente, eclettico ed innovativo. L’Ing. Giorgio Valentini fu anche vicepresidente del Centro di Studio AIM - Metalli Leggeri e Socio fondatore di AISA, associazione culturale che dal 1988 promuove studi e ricerche sulla storia e sulla cultura dell’automobile e della moto, con particolare attenzione alla salvaguardia dei documenti di interesse storico.
La Metallurgia Italiana - October 2022 pagina 105 Atti e notizie - AIM news
Eventi AIM / AIM events
CONVEGNI
IWSQ 2022 – 2ND INTERNATIONAL WORKSHOP ON SURFACE QUALITY OF CONTINUOSLY CAST PRODUCTS – Bergamo, 1-2 dicembre 2022 https://www.aimnet.it/iwsq-2.htm
ECHT 2023 EUROPEAN CONFERENCE HEAT TREATMENT & SURFACE ENGINEERING (SEGR-TTM-R) –Genova, 29-31 maggio 2023
XV GIORNATE NAZIONALI CORROSIONE E PROTEZIONE (SEGR-C) - Torino, 5-7 luglio 2023 http://www.aimnet.it/gncorrosione/
S2P 2023 INTERNATIONAL CONFERENCE ON SEMISOLID PROCESSING OF ALLOYS AND COMPOSITES (SEGR-P) – Brescia, 6-8 settembre 2023 http://www.aimnet.it/s2p/
CORSI E GIORNATE DI STUDIO
Giornata di Studio TRATTAMENTI SUPERFICIALI SU ALLUMINIO, A SCOPO DECORATIVO E PROTETTIVO –webinar FaReTra, 10-11 novembre
Corso PROVE NON DISTRUTTIVE – ibrido: Miano, 16-17 novembre
Giornata di Studio SFIDE TECNOLOGICHE NELLA MODIFICA SUPERFICIALE DI MANUFATTI ADDITIVE –Milano, 25 novembre
Giornata di Studio DALLA SCELTA ALLA REALIZZAZIONE DI COMPONENTI TRATTATI TERMICAMENTE: COME EVITARE PROBLEMI TECNICI E CONTRATTUALI? – Brescia, 30 novembre
Corso CREEP – Milano, 17-18 gennaio e 15 marzo
Giornata di Studio I METALLI E LO SCAMBIO TERMICO: NUOVI TREND E APPROCCI INNOVATIVI PER SCAMBIATORI DI CALORE E GESTIONE DEL CALORE – Milano, 25 gennaio
Scuola di TECNICHE ELETTROCHIMICHE PER LO STUDIO DELLA CORROSIONE “CECILIA MONTICELLI” –Ferrara, 7-8-9 febbraio
FaReTra (Fair Remote Training) - FORMAZIONE E AGGIORNAMENTO A DISTANZA
Modalità Asincrona (registrazioni)
Corso Modulare METALLOGRAFIA – I MODULO, II MODULO “METALLI NON FERROSI”
Corso modulare FONDERIA PER NON FONDITOR
I
Corso TRIBOLOGIA INDUSTRIALE – I MODULO
Giornate di Studio GETTI PRESSOCOLATI PER APPLICAZIONI STRUTTURALI
Corso DIFETTOLOGIA NEI GETTI PRESSOCOLATI: METALLIZZAZIONI
Corso ADDITIVE METALLURGY
Corso METALLURGIA PER NON METALLURGISTI
Per ulteriori informazioni rivolgersi alla Segreteria AIM, e-mail: info@aimnet.it, oppure visitare il sito internet www.aimnet. it
La Metallurgia
pagina 106 Atti e notizie - AIM news
Italiana - Ottobre 2022
Giornata di Studio PRESSOCOLATA IN ZAMA
Giornata di Studio LA SFIDA DELLA NEUTRALITÀ CARBONICA
Corso itinerante METALLURGIA SICURA
Corso modulare TRATTAMENTI TERMICI
Corso modulare I REFRATTARI E LE LORO APPLICAZIONI
Corso GLI ACCIAI INOSSIDABILI 11ª edizione
Corso FAILURE ANALYSIS 11a edizione
Giornata di Studio PERFORMANCE E DEGRADO DEI MATERIALI METALLICI UTILIZZATI IN CAMPO EOLICO: CAPIRE PER PREVENIRE
Giornata di Studio DIFETTI NEI GETTI PRESSOCOLATI: POROSITA’ DA GAS
L’elenco completo delle iniziative è disponibile sul sito: www.aimnet.it
(*) In caso non sia possibile svolgere la manifestazione in presenza, la stessa verrà erogata a distanza in modalità webinar
www.aimnet.it
La Metallurgia Italiana - October 2022 pagina 107 Atti e notizie - AIM news
MILANO 27-30 MAY 2024
International ForgeMasters Meeting
AIM and Federacciai proudly announce that the 22nd International ForgeMasters Meeting will be held in Italy in 2024.
Save the date!
The appointment will be in Milan on 27-30 May 2024.
All involved in and interested in the area of open die forging are warmly invited to attend.

At IFM 2024 the most important and current issues affecting the sector will be discussed. Experts in the fields of greatest interest will be attending and addressing such issues.
IFM is a unique forum to meet researchers, skilled technicians and decision makers; in other words IFM 2024 is an unmissable event for the forging industry!
Call for papers
Prospective authors wishing to present papers are invited to submit a tentative title and an abstract of about 400 words (in English), specifying a maximum of two topics for each proposal, to the Organising Secretariat.
Visit website www.ifm2024.org to submit your abstract.
Deadline
Submission of abstracts: 30 June 2023 Information on acceptance: 13 October 2023
Submission of full papers and speakers registration: 15 December 2023
Exhibition & sponsorship opportunities
The Conference will be enhanced by an Exhibition at which companies will have the opportunity to inform all delegates of their latest developments. The detailed exhibiting and sponsorship packages will be available on the IFM 2024 website in the following months. In the meantime, companies interested in taking part in the Exhibition or sponsoring the event may contact: e-mail: commerciale@siderweb.com tel. +39 030 2540006
Organising secretariat
Via Filippo Turati 8 - Milan - Italy t. +39 0276021132 or +39 0276397770 aim@aimnet.it - www.aimnet.it
Organised by
Comitati tecnici / Study groups
CT METALLI LEGGERI (ML) (riunione telematica del 15 luglio 2022)
Consuntivo di attività svolte
• Fortini ragguaglia i presenti circa la GdS “L’alluminio nell’automobile – La storia incontra il futuro” (Ferrara, 20 maggio 2022), con circa cinquanta partecipanti. La giornata è stata mollto soddisfacente, anche se alcuni tra i presenti fanno notare che diversi relatori non hanno inviato i testi delle presentazioni: bisogna evitare in futuro questo disservizio sollecitando per tempo i relatori. La giornata potrebbe essere ripetuta durante il prossimo Metef a fine marzo 2023.
Manifestazioni in corso di organizzazione
• Il modulo del corso di Metallografia dedicato ai metalli non ferrosi è definito e le lezioni saranno in presenza (14 ottobre) e in modalità webinar (20 e 25 ottobre).
• Il seminario webinar “Trattamenti superficiali dell’alluminio a scopo decorativo e protettivo” (coordinatori Barbarossa, Fortini, Grillo) si svolgerà il 10 e 11 novembre 2022 dalle 11.00 alle 15:00. Il programma è stato definito e la locandina sarà distribuita a breve.
Iniziative future
• Si discute su una possibile manifestazione su “Ecosostenibilità e emissioni di CO2” (coordinatore Tatti). La tematica è molto sentita in generale e tra i presenti in particolare. Il tema principale riguarderà sia i prodotti che i processi per l’alluminio nell’automobile, ma la giornata si può rendere più trasversale trattando ulteriori applicazioni quali, ad esempio, la saldatura alluminio-acciaio. Si discute animatamente sull’argomento, e il presidente Timelli chiede di posporre la discussione alla prossima riunione del CT, in attesa di evoluzioni nell’organizzazione.
• Con il CT Lavorazioni Plastiche ci sono contatti per organizzare una GdS sull’innovazione delle leghe di alluminio. Vedani, coordinatore insieme a Timelli da parte del CT ML, riferisce che la manifestazione si terrà a Brescia probabilmente nella primavera 2023 con presentazioni e visite agli impianti, e distribuisce una bozza degli interventi previsti.
CT CORROSIONE (C)
(riunione telematica del 22 settembre 2022)
Manifestazioni in corso di organizzazione
• L’organizzazione della 15° edizione delle “Giornate Nazionali sulla Corrosione e Protezione” (Torino – 2023) sarà discussa durante una riunione ad hoc del prossimo 5 ottobre.
• Il Corso sulle “Tecniche elettrochimiche per lo studio della corrosione” (Ferrara,24-26 gennaio 2023) è stato definito. La locandina sarà distribuita a breve.
• L’iniziativa “Verifiche e manutenzione di strutture metalliche storiche: aspetti strutturali e metallurgici, diagnostica e tecniche di intervento”, in collaborazione con CT Storia della metallurgia e con CTA - Collegio dei Tecnici dell’Acciaio e IIS – Istituto Italiano della Saldatura - si terrà a Milano il 21 o 23 novembre 2022. Sono stati definiti gli interventi di competenza del CT Corrosione.
• Il presidente Bolzoni ricorda che la giornata di studio Pietro Pedeferri, patrocinata da AIM, dal titolo “Corrosione sotto sforzo e infragilimento da idrogeno” si svolgerà presso il Politecnico di Milano il 2 dicembre.
Iniziative future
• Il “Corso modulare di corrosione” sarà ripreso nell’autunno 2023, preso in carico dallo stesso gruppo che ha collaborato al corso sulle tecniche elettrochimiche.
CT STORIA DELLA METALLURGIA (SM)
(riunione del 22 settembre 2022)
Notizie dal Comitato
• Viene approvato l’ingresso nel CT del prof. Paolo Matteis, del Politecnico di Torino. Vengono inoltre cancellati alcuni nominativi di Membri non più interessati alla partecipazione.
La Metallurgia Italiana - October 2022 pagina 109 Atti e notizie - AIM news
Manifestazioni in corso di organizzazione
• Viene illustrato ed approvato il programma della giornata di studio “Le ghise storiche nell’arredo urbano: arte o industria?” che si terrà a Longiano (FC) “Fondazione Neri - MIG, Museo Italiano della Ghisa” il 21 ottobre 2022, in collaborazione con il Dipartimento di Ingegneria dell'Università di Ferrara e la Fondazione Neri - MIG, Museo Italiano della Ghisa.
Iniziative future
• In occasione della nomina di Brescia e Bergamo capitali della cultura 2023, viene approvata la proposta di una GdS a Brescia. Il tema potrebbe essere: “Il ferro dei bresciani”.
• Riprendendo una iniziativa che ha avuto molto successo negli anni precedenti, si propone l’attivazione di un corso di “Metallografia per operatori dei beni culturali” che si potrebbe tenere a Venaria Reale (TO), coordinatrice Rizzi. Si pensa di coinvolgere anche i docenti del Centro Conservazione e Restauro La Venaria Reale.
• Il presidente Garagnani comunica l’organizzazione di una giornata studio in collaborazione con il CT Corrosione e Protezione dei Materiali Metallici sulla realtà dei ponti storici. La manifestazione si dovrebbe tenere al Politecnico di Milano tra fine 2022 e inizio 2023. Tale giornata sarà focalizzata sia sui problemi strutturali sia sulla capacità di mantenere nel restauro le caratteristiche storiche del manufatto.
• Vengono poi proposte altre tre tematiche da sviluppare: “Metallurgia e storia della campana”, “Arte e metallurgia nel periodo liberty” e una GdS in collaborazione con il Parco Minerario dell’Isola d’Elba ed. il Museo delle Miniere di Rio Marina.
CT TRATTAMENTI TERMICI E METALLOGRAFIA (TTM)
(riunione telematica del 29 giugno 2022)
Notizie dal Comitato
• Il neopresidente Morgano, alla sua prima riunione con questa carica, indica una linea di continuità con la passata gestione, che ha portato a risultati di eccellenza. Alcune leggere calibrazioni migliorative potranno dare ancora più spinta a collaborazioni con mondo universitario, industriale e della formazione.
• Claudio Gennari, presente come ospite, viene accettato come membro ufficiale del CT. Gennari, ricercatore nel gruppo di metallurgia dell’Università di Padova, si occupa in particolare di acciai inox e duplex e di relazione tra corrente elettrica e plasticità.
Manifestazioni in corso di organizzazione
• Il corso di Metallografia, iniziato a giugno con il primo modulo, si concluderà in ottobre a Ferrara con il secondo modulo dedicato ai metalli non ferrosi. Si tratta di quattro giornate, di cui la prima in presenza e le altre online. Ci sono già un discreto numero di iscritti, vicini alla capienza per la giornata in presenza.
• La GdS “Cementazione e nitrurazione” si terrà in presenza presso Gefran (Provaglio di Iseo – BS) il 6 ottobre 2022 – coordinatori Desario e Buzzi. Il programma prevede una panoramica a tutto tondo del mondo della cementazione e della nitrurazione, Il presidente Morgano mette in evidenza il collegamento tra il tipo di trattamento e le innovazioni nelle vetture, che passano da motori a combustione a motori elettrici, con sollecitazioni diverse sulle varie parti meccaniche.
• La GdS "Dalla scelta alla realizzazione di componenti trattati termicamente: come evitare problemi tecnici e contrattuali" – coordinatori Vicario, Gelfi, Cusolito – si svolgerà il 30 novembre 2022 in presenza presso l’Università di Brescia (con possibilità di collegamento streaming in caso di impedimenti sanitari). Il programma è definito e la locandina sarà lanciata entro la metà di ottobre.
• La Segreteria AIM organizzerà l’ECHT 2023, che si terrà a Genova nella stessa location del Congresso TT di maggio 2022. Il call for paper sarà lanciato a breve.
Iniziative future
• GdS “Il Mondo Industrial - aspetti metallurgici e metodologie di controllo”: i coordinatori sono ora Ecclesia e Tatti e verificheranno la possibilità di essere ospitati presso CNH. Visti i numerosi spostamenti della giornata, forse è opportuno programmare per primavera o addirittura autunno 2023.
• Seminario congiunto con CT Metallurgia delle Polveri e Tecnologie Additive: questo CT non si è ancora riunito, quindi l’evento resta in sospeso. Bisogna trovare la disponibilità delle due aziende ospitanti.
• A distanza di 4 anni dalla precedente manifestazione, la Piaggio di Pontedera è disponibile ad ospitare un’altra GdS con visita al museo. Il tema della manifestazione sarà definito in modo tale da tenere la giornata nella primavera del 2023.
• Diverse altre proposte, nate dalla discussione durante la riunione, saranno vagliate ed approfondite nel prossimo CT.
La
pagina 110 Atti e notizie - AIM news
Metallurgia Italiana - Ottobre 2022
CT ACCIAIERIA (A)
CT
FORGIATURA (F)
(riunione telematica congiunta del 09 giugno 2022)
Notizie dal Comitato
• il congresso “Internazional Forgemasters Meeting” sarà organizzato da Federacciai e AIM dal 27 al 30 maggio 2024 a Milano. Si sta formalizzando la composizione di un Technical Committee che comprende diversi italiani. Rampinini, presidente del CT Forgiatura, chiede uno sforzo collettivo per la riuscita della manifestazione.
• Mapelli, presidente del CT Acciaieria, ricorda che il 26-28 ottobre si terrà a Trieste il convegno internazionale Rolling-12, organizzato da AIM. Al momento si contano oltre 200 iscritti.
• Il workshop internazionale IWSQ 2, dedicato alla qualità superficiale dei semilavorati siderurgici, è previsto a Bergamo nei giorni 1 e 2 dicembre 2022.
• Progetto Tough Steel: Mapelli introduce Michele Tedesco di CRF Stellantis, partner con AIM del progetto finanziato ToughSteel (https://toughsteel.eu/). Tedesco illustra il progetto con una presentazione di slides, sottolineando che Tough Steel mira ad aumentare il valore e la consapevolezza delle aziende circa l'Approccio alla resistenza alla frattura, che si è dimostrato uno strumento efficace per affrontare le sfide legate alle cricche negli acciai ad alta resistenza (AHSS) nell'alleggerimento delle auto e ha un'elevata replicabilità in altre applicazioni di formatura della lamiera. Lo scopo è quello di diffondere ai principali attori della comunità dello stampaggio della lamiera la possibilità di misurare la tenacità alla frattura nelle lamiere sottili mediante l'Essential Work of Fracture (EWF) e utilizzarla per affrontare e risolvere efficacemente i fenomeni legati alle cricche e per selezionare e sviluppare AHSS con prestazioni di crash ottimizzate.
Manifestazioni in corso di organizzazione
• Rampinini conferma che la GdS “ITER experience for new DTT Enea Fusion Reactor” si svolgerà nella primavera del 2023, con la collaborazione dei CT MFM e CT ME.
Iniziative future
• Mapelli informa che nel 2023 riprenderà la normale programmazione dei tre Corsi itineranti di Acciaieria in presenza e con le visite alle aziende. In particolare, è previsto il Corso dedicato a Macchina fusoria.
• Rampinini conferma anche la ripresa nel 2023 del Corso Forgiatori.
• Mapelli per il 2023 propone una GdS dedicata alla Manutenzione degli impianti siderurgici, allo scopo di creare un Gruppo di Lavoro all’interno del CT che si occupi di questo tema. Invita tutti a inviare proposte di contributi per la GdS, così da poter definire un programma. Il coordinatore sarà Cosmo di Cecca del Gruppo Feralpi.
• Mapelli propone anche una GdS dedicata all’abbattimento della CO2 e al recupero energetico in siderurgia.
• Rampinini informa che sta procedendo all’organizzazione di una GdS dedicata a inox e superduplex – coordinatore Lissignoli – partendo dall’acciaieria, per passare alla forgia e arrivare a finitura e saldatura.
CENTRO RIVESTIMENTI E TRIBOLOGIA (R) (riunione del
18 maggio 2022)
Notizie dal Comitato
• La Dr.ssa Valentina Zin, ricercatrice presso la sede di Padova dell’Istituto di Chimica della Materia Condensata e di Tecnologie per l’Energia (ICMATE) del Consiglio Nazionale delle Ricerche (CNR), ha fatto richiesta di adesione al CT: è presente a questa riunione come ospite, e la sua adesione viene approvata dai presenti, pertanto diventa membro effettivo del CT.
Manifestazioni in corso di organizzazione
• La GdS su rivestimenti e additive manufacturing si potrà svolgere a fine novembre 2022, salvo conferma da parte di tutti i relatori. Viene ipotizzata una scaletta con 10 presentazioni da 30’. Il titolo sarà “Sfide tecnologiche nella modifica superficiale di manufatti additive”.
Iniziative future
• Il presidente Bolelli propone di ripartire per il prossimo anno con il nuovo ciclo di giornate studio sui rivestimenti (sottili, spessi e via umida): se ne discuterà al prossimo CT partendo dalla locandina della precedente edizione.
La Metallurgia Italiana - October 2022 pagina 111 Atti e notizie - AIM news
CT METALLI E TECNOLOGIE APPLICATIVE (MTA) (riunione telematica del 28 settembre 2022)
Manifestazioni in corso di organizzazione
• A proposito della GdS sulla sostenibilità ambientale nel campo delle costruzioni civili, il presidente Loconsolo comunica un problema legato a due memorie, ritenute importanti, i cui relatori non si riescono a contattare. Si decide di fare slittare la giornata al 2023 per completare la scaletta degli interventi e terminare nel frattempo la procedura di riconoscimento dei crediti formativi.
Iniziative future
• La GdS “Utilizzo leghe di nichel in saldatura” è ancora in fase preliminare. Per ampliare la platea dei possibili interessati, si propone di includere nel programma anche gli acciai inossidabili e gli acciai ad alta resistenza saldabili e bonificati e le tecniche di saldatura. Si valuterà inoltre la disponibilità di RINA e CSM a preparare una memoria e la possibilità di coinvolgere l’Istituto Italiano della Saldatura. Si richiede anche il contributo di qualche azienda che possa portare degli esempi industriali.
• Per la manifestazione sui metalli nel settore automotive, il presidente segnala che questo tema è già preso in esame da altri centri di studio, e inoltre la situazione attuale non è favorevole. È preferibile rimandare la GdS al 2023.
• Si discute su una possibile GdS sulle leghe di Titanio, molto impiegate nel campo biomedicale e aeronautico, ma anche per applicazioni chimiche e scambiatori di calore. Si potrebbe trattare anche il tema degli intermetallici a base titanio, così come quello delle leghe diverse dal noto grado 5. Inoltre sono interessanti anche i temi legati ai costi di manutenzione e gestione di componenti in lega di titanio così come il già trattato tema legato alle criticità geopolitiche sul mercato del titanio e non solo.
CT CONTROLLO E CARATTERIZZAZIONE PRODOTTI (CCP) (riunione
telematica del 27 settembre 2022)
Notizie dal Comitato
• La Dott.ssa Mariangela Brisotto, responsabile del laboratorio Italfond, è presente alla riunione come ospite. Dopo la presentazione viene accettata ufficialmente nel CT.
Consuntivo di attività svolte
• La GdS sulla “Microscopia elettronica applicata alla failure analysis” (Padova, 23 settembre 2022) ha avuto una buona partecipazione di pubblico, circa 50 persone. Un bilancio più dettagliato sarà tracciato alla prossima riunione, dopo aver esaminato le schede di valutazione compilate dai partecipanti.
Manifestazioni in corso di organizzazione
• Corso PdD: gli sponsor dell’edizione precedente non hanno confermato la loro disponibilità né per la sponsorizzazione né per tenere una presentazione. Si discute quindi su come riallocare le due presentazioni a loro assegnate, relative a Controlli Radioscopici e a Correnti Indotte. Vengono fatti diversi nomi da interpellare per trovare le opportune disponibilità. Il corso si terrà nei giorni 16 e 17 novembre 2022 in modalità mista: sincrona in presenza, sincrona da remoto e asincrona con registrazioni su area riservata You Tube.
Iniziative future
• La GdS sullo stato di servizio degli impianti sarà organizzata nel 2023, probabilmente in collaborazione con il CT Materiali per l’Energia, il cui contributo sarà da valutare prima di stendere un programma. Un comitato ristretto di sei persone si occuperà della organizzazione della giornata con l’obiettivo di estendere il campo dei fruitori del corso oltre la tradizionale platea AIM.
• Nel 2023 sarà riproposto nuovamente il corso di Failure Analysis, sempre con coordinatrice Valentina Ferrari. Si valuterà la possibilità di strutturarlo su due mezze giornate online e una giornata intera in presenza presso un laboratorio, del quale sarà programmata la visita.
CT AMBIENTE E SICUREZZA (AS)
(riunione telematica del 12 maggio 2022)
Notizie dal Comitato
• Si ratifica l’ingresso di Marco Panza (IPSAI) nel Comitato Tecnico Ambiente e Sicurezza, in sostituzione di Paola Cristiani.
• La consueta discussione ad inizio riunione per la condivisione di esperienze occorse ha portato ad una lunga disanima relativa alla circo-
La Metallurgia
-
2022 pagina 112 Atti e notizie - AIM news
Italiana
Ottobre
lazione veicolistica all’interno degli stabilimenti, spesso causa di incidenti anche mortali. In quasi tutte le aziende ci si rifà al codice della strada, ma all’interno degli stabilimenti siderurgici esistono aree e dinamiche che difficilmente possono essere gestite dal solo codice della strada. Il tutto è reso più complicato dal fatto che molti mezzi sono gestiti da ditte terze. Molte aziende hanno studiato approfonditamente il problema, cercando di migliorare con specifici interventi tecnici (telecamere, intelligenza artificiale) e di formazione (riunioni registrate, organizzate con varie modalità). Le ATS a volte intervengono con approfondimenti specifici sull’area dove è avvenuto il fatto, ma non possono entrare nel dettaglio dei movimenti in tutte le zone dello stabilimento. La convinzione è che in ogni infortunio ci sono almeno due cause: l’errore umano (per il quale risulta molto utile, tra l’altro, l’intervento dei colleghi che evidenziano il fatto) e l’errore aziendale (anche in questo caso le segnalazioni di chi è al corrente del pericolo sono fondamentali, insieme alla gestione della situazione fino all’eliminazione delle cause).
Consuntivo di attività svolte
• Bassani illustra il resoconto della GdS “Analisi infortuni e near miss nel settore metallurgico”, che si è svolta il 28 settembre 2022 in collaborazione con Confindustria Brescia. Il riscontro è stato ottimo: 117 presenze con 10 relatori e 8 ospiti. Anche i risultati dei questionari sono molto positivi, ed hanno prodotto richieste di temi da approfondire (tra l’altro, responsabilità dei preposti e aspetti legali).
Iniziative future Sicurezza
• Si propone di provare ad aggiungere una GdS sulla radioprotezione entro la fine di gennaio 2023, focalizzata su come le varie aziende si sono organizzate per adempiere alla nuova normativa di settore. Entro la prossima riunione si valuterà se esiste un reale interesse, interpellando anche i membri oggi assenti, fino a formare un gruppo di lavoro.
Ambiente
• Regione Lombardia ha chiesto manifestazioni di interesse nell’ambito della circular economy, oltre a quanto già fatto in passato. Nel progetto sono state inserite tematiche relative a recupero scorie bianche in cementifici, recupero altri rifiuti, impiego materiali sostitutivi del carbone, recupero energetico, più eventualmente l’idrogeno che non rientra strettamente nella circular economy. Occorre dedicare una riunione del CT a questo argomento, invitando gli Energy Manager delle aziende.
La Metallurgia Italiana - October 2022 pagina 113 Atti e notizie - AIM news
Normativa / Standards
Norme pubblicate e progetti in inchiesta (aggiornamento 29 settembre 2022)
Norme UNSIDER pubblicate da UNI nel mese di settembre 2022
UNI EN 10357:2022
Tubi di acciaio inossidabile austenitico, austeno-ferritico e ferritico saldati
UNI EN 10250-3:2022
Prodotti fucinati di acciaio per impieghi generali - Parte 3: Acciai speciali legati
UNI EN 10250-1:2022
Prodotti fucinati di acciaio per impieghi generali - Parte 1: Requisiti generali
UNI EN 10250-2:202
Prodotti fucinati di acciaio per impieghi generali - Parte 2: Acciai non legati di qualità e acciai speciali
UNI EN 10169:2022
Prodotti piani di acciaio rivestiti in continuo con materiale organico (nastri rivestiti) - Condizioni tecniche di fornitura
for pipes, valves, fittings and accessories, PN designated - Part 2: Cast iron flanges
ISO/DIS – progetti di norma internazionali
ISO/DIS 24202
Petroleum, petrochemical and natural gas industries — Bulk material for offshore projects — Monorail beam and padeye
Progetti UNSIDER al voto FprEN e ISO/FDIS – ottobre 2022
FprEN – progetti di norma europei
FprEN ISO 10113
Metallic materials - Sheet and stripDetermination of plastic strain ratio (ISO/ FDIS 10113:2019)
ISO/FDIS – progetti di norma internazionali
ISO/PRF 4698
Iron ore pellets for blast furnace feedstocks — Determination of the freeswelling index
ISO 404:2013/PRF Amd 1
Progetti UNSIDER in inchiesta prEN e ISO/DIS – ottobre 2022
prEN – progetti di norma europei
prEN ISO19901-5
Petroleum and natural gas industries - Specific requirements for offshore structures - Part 3: Topsides structure (ISO/DIS 19901-3:2022)
prEN 1092-2
Flanges and their joints - Circular flanges
Steel and steel products — General technical delivery requirements — Amendment 1
La
pagina 114 Atti e notizie - AIM news
Metallurgia Italiana - Ottobre 2022
di componenti trattati
Come evitare problemi tecnici e contrattuali
La Giornata di Studio vuole ripercorrere il processo di progettazione e produzione di un pezzo trattato termicamente, che comprende molte fasi interconnesse tra loro: si comincia con la progettazione del pezzo per proseguire con la scelta dei materiali, passaggio che richiede la conoscenza degli acciai disponibili sul mercato con le loro denominazioni e le norme di riferimento.
La scelta del trattamento termico, oltre alla terminologia esatta da utilizzare per ottenere il risultato voluto, deve comprendere un esame di fattibilità ed evidenziare le possibili non conformità che possono nascere dalla materia prima. Una importante parte della giornata sarà poi dedicata a casi di failure analysis derivanti da errori in una delle fasi ed in particolare durante i trattamenti termici, non dimenticando di evidenziare come la microscopia possa aiutare a capire il perché delle anomalie. A conclusione della giornata una tavola rotonda metterà a confronto i relatori con il pubblico per permettere una discussione interattiva.
I relatori, di estrazione prevalentemente industriale e universitaria, sono esperti nel loro campo e sono in grado di fornire indicazioni preziose per prevenire fraintendimenti ed errori durante tutto il ciclo di progettazione e produzione dei pezzi.
A CHI SI RIVOLGE
La Giornata è rivolta a tutti gli attori che intervengono nel ciclo di progettazione e di produzione, che potranno trarre utili indicazioni per beneficiare dell’interfacciamento preventivo tra fornitori ed utilizzatori, condividendo tutte le informazioni utili sull’applicazione e valutando insieme le possibili ottimizzazioni sulla base dell’esperienza dei vari attori della supply chain. Una reciproca conoscenza permette di evitare errori e incomprensioni.
Coordinatori:


Programma
8.40 Registrazione dei partecipanti
9.10 Saluti di benvenuto e introduzione alla Giornata di Studio Enrico Morgano - Presidente del CdS AIM Trattamenti Termici e Metallografia Valentina Vicario, Mario Cusolito - Coordinatori
9.30 Material selection: chi ben comincia è a metà dell’opera Costanza Colombo - Agrati Group
10.00 Designazione e classificazione dei tipi di acciaio Mario Cusolito - Consulente
10.45 Intervallo
11.00 Il glossario dei trattamenti termici e superficiali Massimo Pellizzari - Università di Trento
11.45 Analisi del flusso dall’analisi di fattibilità alla fornitura Valentina Vicario - Soliveri
12.15 Effetto della materia prima sul trattamento termico Alessandro Zago - Cogne Acciai Speciali
12.45 Pranzo
14.00 TBD Davide Barenghi, Franco Trombetta - STT
14.30 La microscopia al servizio della failure analysis Francesca Ecclesia – CRF Stellantis
15.00 Casi di failure analysis derivanti dal trattamento termico Marcello Gelfi -Università di Brescia
15.30 Intervallo
15.45 Condizioni di fornitura dei trattamenti termici di AIM a confronto con le richieste dei clienti Andrea Labruna - Cisam-Ernst
16.15 Tavola rotonda finale
30 NOVEMBRE 2022
Valentina Vicario, Mario Cusolito, Marcello Gelfi h. 8.40 > 17.15
In presenza c/o
Università degli Studi di Brescia
Dipartimento di Ingegneria Meccanica Via Branze 38 - Brescia
17.15 Termine della giornata Dipartimento di Ingegneria Meccanica
Evento organizzato in collaborazione con
Università degli Studi di Brescia
Segreteria organizzativa Associazione Italiana di Metallurgia t. +39 02 76021132 +39 02 76397770 spedizioni@aimnet.it www.aimnet.it
Dalla scelta alla realizzazione
termicamente:
GIORNATA DI STUDIO 30 NOVEMBRE 2022 Centro di Studio TRATTAMENTI TERMICI E METALLOGRAFIA


