14 minute read
Spatial-autocorrelation (SPAC) analysis using seismic ambient noise as applied to engineering applications in Alaska
E. Babcock1*, S. Pullammanappallil2, G. Speeter3 and C. Colwell 4 discuss the implementation of SPAC at different field sites in Alaska: a canyon, a hill, and a riverbed.
Introduction
Advertisement
Geophysical investigations for engineering applications often implement active-source seismic methods, such as refraction and multichannel analysis of surface waves (MASW), to estimate the depth to bedrock and bedrock competency or stiffness (Park et al., 2007). Typical sources for such engineering projects are a sledgehammer or a weight-drop mechanism. However, active seismic with such sources has limitations. For example, the maximum depth of investigation may not be sufficient for the overburden thickness, especially in fluvial environments. Low-energy sources such as sledgehammers (relative to dynamite, for example) have typical maximum depths of investigation in Alaskan soils ranging from 10 to 20 m, which are shallower than the desired depth of imaging of 30 m for engineering applications. Furthermore, site conditions may limit the implementation of active-source methods. Limitations on array length or permitting restrictions for dynamite use can reduce the effective depth of investigation even in favourable conditions.
On the other hand, passive seismic methods can provide deeper imaging than active-source seismic refraction or MASW (Stephenson et al., 2005). Passive methods have grown in popularity with recent advances in computing technology. One such method, spatial autocorrelation (SPAC) of passive seismic data, estimates the subsurface shear-wave velocity structure possibly even to depths of thousands of metres (Hayashi et al., 2021). For engineering applications, the SPAC method is applicable where the depth of investigation exceeds the capacity of available (or permissible) active sources or site conditions limit array length. Although not always easy to implement, with proper data collection, processing, and interpretation, SPAC has proven to be a robust method for our projects in Alaska. For this article, we will discuss the implementation of SPAC at different different field sites in Alaska: a canyon, a hill, and a riverbed.
Theory
Aki (1957) introduced the Spatial Autocorrelation (SPAC) method into seismology for the study of surface waves that contain microtremors or ambient noise. Potential passive ‘sources’ include road traffic, tidal action and waves, and earthquakes. The method has since been adapted to work for shallow investigations within the upper few hundred metres (for example, Roberts & Asten, 2004). The method uses a two-dimensional array composed of multiple sensors to record ambient noise and measure its spatial coherency. We then use the spatial coherency to calculate surface-wave phase velocity.
Specifically, we calculate the spatial coherency of the recorded waveforms between recording station pairs and then average it over the entire array. This normalised coherence at a particular frequency is related to the phase velocity of the propagating Rayleigh waves for the vertical component of the recorded wavefield via a Bessel function of the first kind and order zero (Okada, 2003). Using this approach on rings of recorders builds a dispersion curve, which relates frequency to the phase velocity of the propagating surface waves.
Another requirement for getting robust dispersion images is an ‘isotropic’ array. This means the separation distance between recording stations is similar and the azimuthal distribution is even. The nested triangle array used for our projects satisfies these conditions. Additionally, since this two-dimensional array configuration removes the need to know the direction of the noise source, the measured velocities are theoretically closer to the true subsurface velocities. Making Velocity-frequency picks we make on the dispersion curve thus constructed are then inverted for a horizontally layered shear-wave velocity-depth model centered underneath the array (Zhao, et al., 1995; Zhao, et al., 1999).
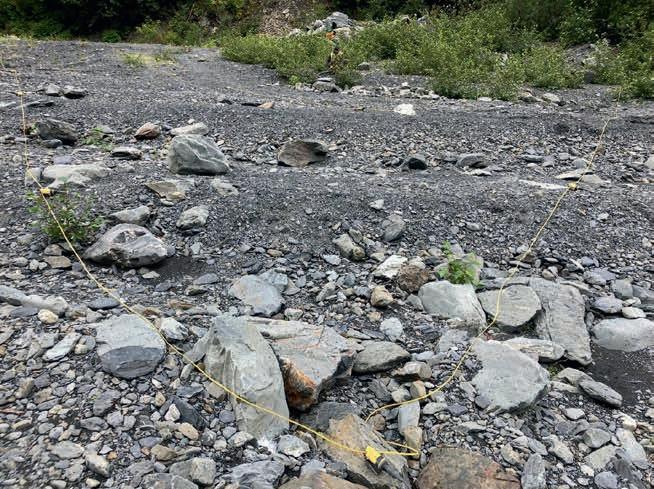
Although the SPAC method can function for data recorded using a linear (one-dimensional) array, as mentioned isotropic array shapes are preferred as they provide robust dispersion curves. Circles and nested triangles are suitable for near-surface investigations because such shapes are simple to set up in the field. ‘Simple’ is of course a relative term which depends on site conditions. Laying out the arrays may be difficult when vegetation prevents using tape measures for distances. In those conditions, creating geophone locations from a map using a GIS platform and marking those points in the field with survey-grade GPS accuracy may be a preferred alternative.
Field conditions Canyon
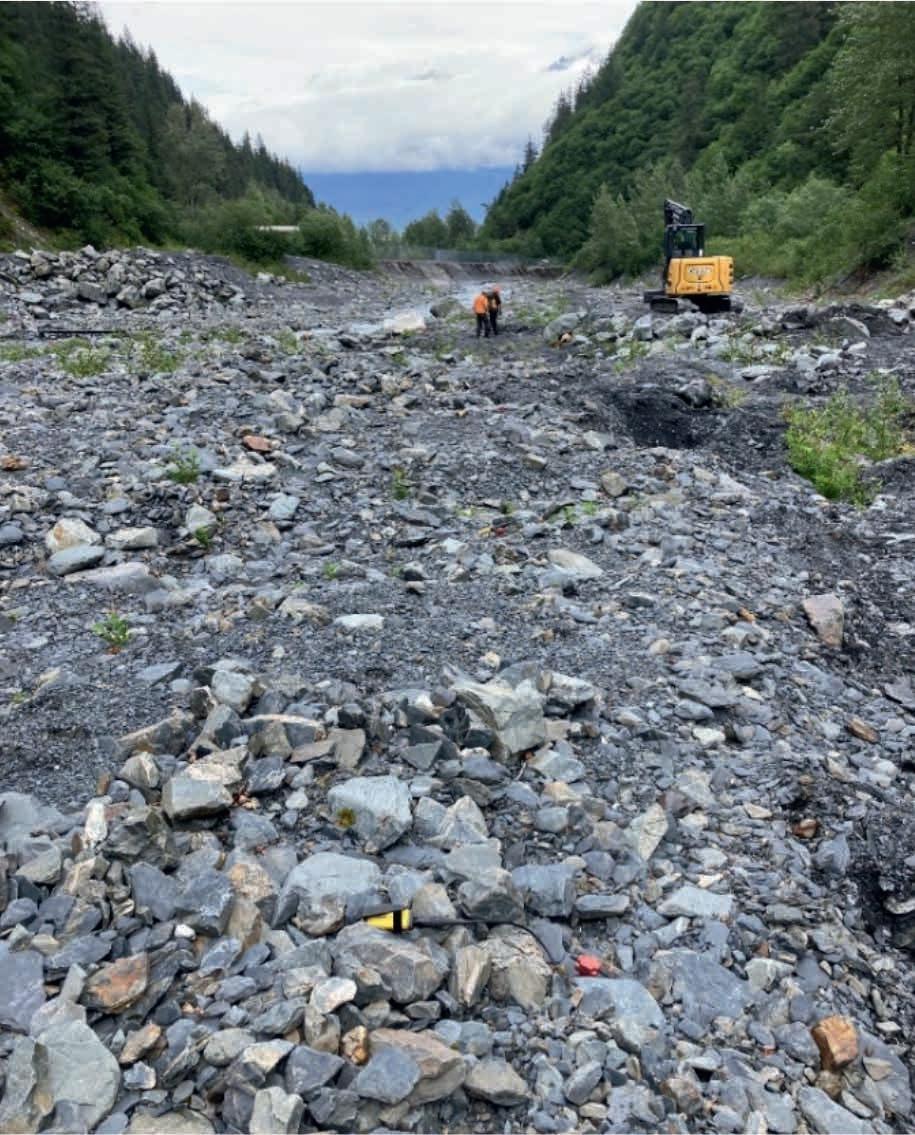
The location of the first field site was a canyon with steep walls exceeding 60° vertical (Figure 1). The soils were rocky, with size classes ranging from silt to gravel to cobbles and boulders. A stream bisected the project site. The location was approximately 500 m from the nearest roadway and 1000 m from the ocean. Tidal fluctuations in the nearby bay are 2 to 4 m. Moderate seismic activity occurs in the region.
We collected active-source refraction and MASW data in this canyon with 0.5-kg dynamite charges as the source. We deployed three seismic lines along the canyon, each about 210 m in length and three additional lines running from sidewall to sidewall, across the canyon, crossing the longer lines. The crossing lines were approximately 90 m in length, which was the maximum possible line length to fit in the canyon in this orientation. Each of the three crossing lines crossed the stream roughly in the centre of the canyon. The project campaign included drilling nine boreholes in the canyon to ground truth the seismic results.
In the upper portion of the canyon and near the sidewalls, the depths to bedrock from the seismic agreed well with the borehole measurements ranging from 3 to 15 m below surface. However, in the centre of the area of investigation, neither the MASW nor the refraction data sets were able to define the bedrock surface. Boreholes drilled in this vicinity were terminated at 30 m or more below surface without encountering bedrock. Since neither completing a longer seismic line nor using higher-energy sources were possible at the site given the conditions, the project team decided to conduct a SPAC-array passive measurement near one of the active-source seismic lines.
Hill
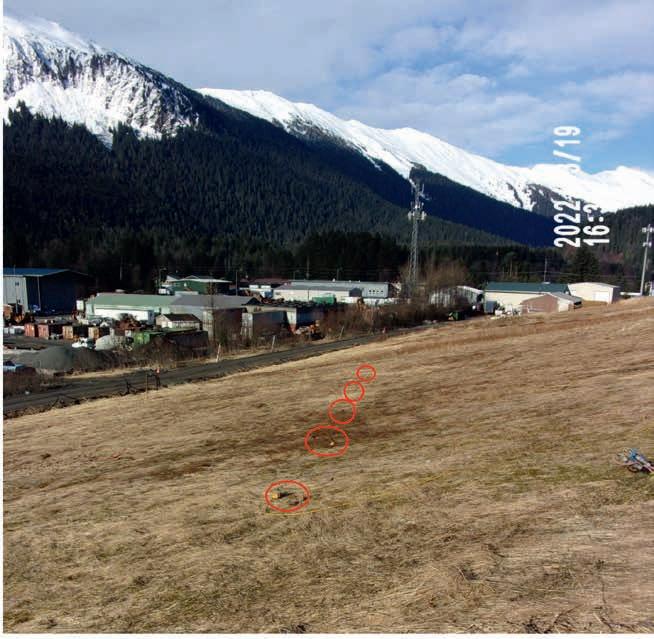
The second field site was centered on a manmade hill having approximately 20 m of relief (Figure 2). The surface was grassy; and due to heavy rainfall in the preceding days, the soils were saturated at the time of data collection. The site is adjacent to a highway and a gravel quarry, which had frequent movement of large, heavy, earth-moving vehicles during the project. The ocean is ~7 km from the seismic array, with the corresponding potential low-frequency ambient noise of both tides and waves.
The project team completed both a refraction and MASW survey over the hill, with a line about 160 m in length. At this site, the property boundaries constrained the line length. The active source was a Betsy-gun, as dynamite was not permitted at this location. The maximum depth of imaging from the refraction tomography processing was approximately 25 m, which was not deep enough to delineate bedrock. The MASW processing reached depths of 70 m below surface, revealing a potential bedrock interface between 55 and 60 m below surface. To corroborate this result, we then completed a SPAC array on the hill.
Bridge site
The final site in this article was south of Delta Junction, Alaska, which is interior to the state about 400 km northeast of Anchorage. Here the Alaska Department of Transportation (ADOT) plans to replace two bridges along the Alaska-Canada Highway. The northern bridge, Gerstle River bridge, is ~500-m long. Johnson River Bridge is 18 km southeast of Gerstle River, with a span of about 250 m. Water depth is seasonally variable.
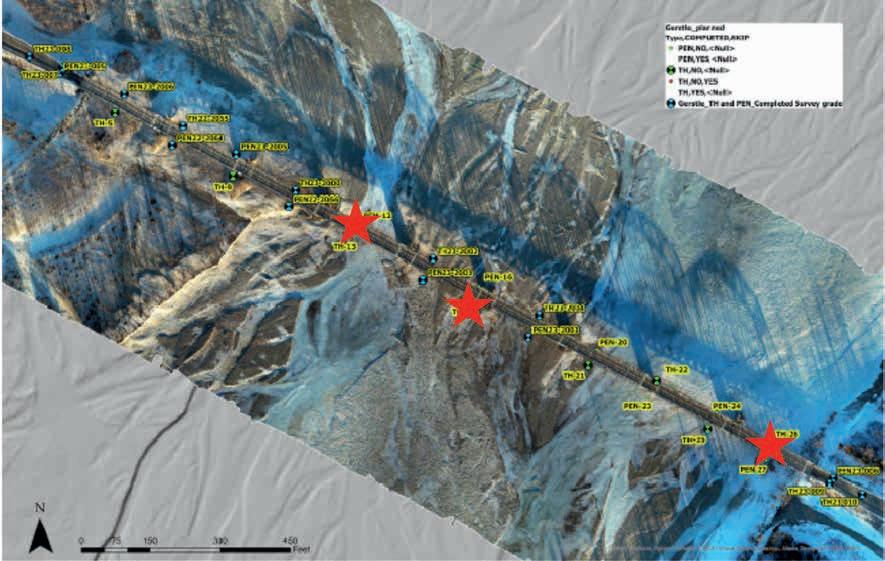
To ascertain soil properties for bridge design, ADOT conducted a drilling campaign with boreholes spaced every 30 m under each bridge. To minimise costs, ADOT requested seismic surveys to reduce the number of required boreholes (Figure 3). From the borehole data, the subsurface conditions comprise mostly gravels and sandy gravels with various size classes of cobbles. Importantly, the boreholes identified a weak, sandy layer which would impact the design. Identifying this layer in the seismic data was a key goal.
Another reason for including seismic data acquisition in this project was due to the conditions at the time of the borehole surveys. To complete boreholes on the river, ADOT conducted the drilling in wintertime when temperatures ranged from -25°C to -35°C. Even at these temperatures, or perhaps because of the temperatures, rapid aufeis accumulation occurred near the drilling rig. During the aufeis formation, excessive water on the surface of the ice was problematic for the drilling. These surface conditions precluded further drilling in February, and so the seismic crew stepped in.
At the bridge sites, the primary source of ambient noise was intermittent vehicle traffic, estimated at 1 vehicle every 5 or 10 minutes depending on the time of day. When vehicles did cross the bridges, the vibration of the bridge pilings was a high-amplitude signal.
Data collection
In addition to potentially greater depth of investigation than active methods, another advantage of this method is a reduction in crew labour compared to manning requirements for active-source campaigns. While each field site contains unique challenges such as terrain and/or vegetation, a two-person crew can complete the data collection efficiently with the appropriate seismic system.
Recent advances in cableless systems and systems with flexible geophone spacing make SPAC arrays possible in complex field conditions with limited crew numbers. Traditional cabled seismic systems with fixed takeouts are difficult to deploy for these geometric arrays. We used the Summit X1 from DMT Group and found its single, lightweight cable and unrestricted geophone attachment location are ideal for SPAC data collection and provide significant advantages to our crews. For example, in our field areas, obstructions such as trees or brushes often create the need for loops of cable where having a fixed takeout interval would be extremely difficult. In such situations the system’s flexibility shines.
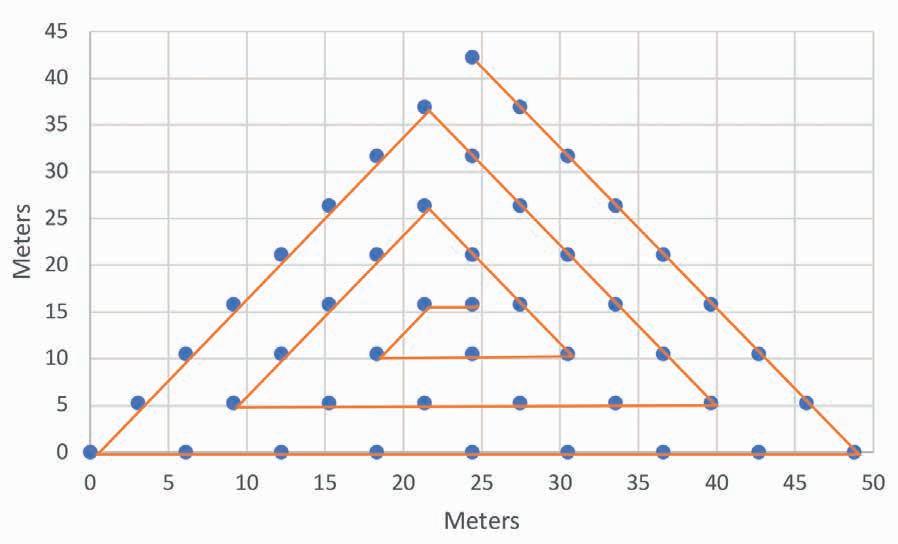
We begin by using three long tapes to determine the location of the array by defining the outer edge of the equilateral triangle created by the isotropic array (Figure 4). For ease of description, we define the top point of the triangle as it sits in Figure 4 as the ‘top’ and the side of the triangle opposite the ‘bottom’. We lay out and plant the ‘outer row’ of geophones at our desired geophone spacing (Table 1).
After the outer-row geophone placement, the crew takes the fourth tape and stretches it between the first row of geophones above the bottom of the array. Then we plant these geophones and move up to the next row above and repeat until finished. The cable runs from the top around the outside of the array,
Geophone Spacing 6 m
Sample Rate 4 milliseconds
Record Length 500 seconds
Number of Recordings 20 data collection, and breakdown of the array in less than 1.5 hours. We feel this represents a good average time estimate for most field locations although ‘quieter’ sites, such as the bridge with low traffic, will require longer collection times.
Bridges
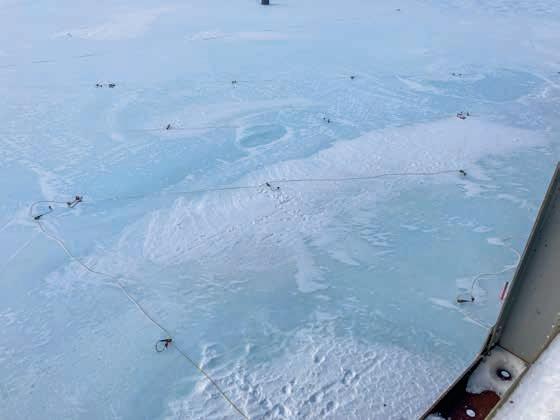
We used the same triangle array described above at the DOT bridges (Figure 5). Since the rivers were ice-covered at the time, the crew used a hand drill to make a hole in the ice for each geophone spike. The southern SPAC array location under the Johnson Creek bridge was on a frozen, sandy, gravel bar, not ice. Here we replaced the geophone spikes with a triangular base commonly used on asphalt. This base kept the geophone upright and coupled with the frozen ground.
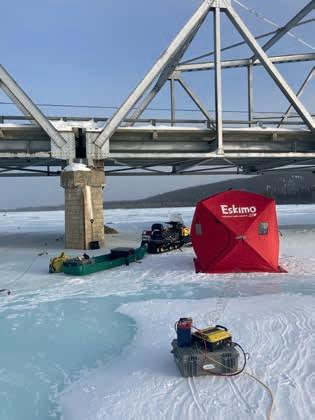
At the time of seismic data acquisition, the crew verified ice thickness with an auger at each array location. The ice thickness ranged from 0.5 to 1.2 m and was grounded at all sample points. The temperatures were ~-20°C during the seismic work with winds ranging from calm to 30 km per hour. We used a snow machine to access the site and a tent for crew warming in these conditions (Figure 6a). Although the seismic equipment performed flawlessly at these temperatures, the laptop required a tent to stay within the laptop’s operating range. The bridge provided a good vantage point for pictures of the array (Figure 6b).
Data processing
then into the next inner triangle and continues until it passes next to each geophone (Figure 4). For the Summit X1 system, laying the cable in this manner makes defining the collection channels for each geophone relatively simple. Channel 1 is at the top, and each successive geophone encountered while travelling along the spiral is the next channel until the central location at geophone 46.
At a site like the Canyon, establishing the location of the array proved to be the most difficult part of the acquisition. The river and steep impassable canyon walls created a tight space to deploy geophones (Figures 1 and 5). One helpful technique is to start with one edge of the array tight to a limiting feature and building the array from there.
After setup, we complete quality control checks and address any geophone coupling issues. For the results presented in this article, the data collection used a geophone spacing of 6 m, a sampling rate 4 milliseconds, a record length of 500 seconds, and 20 recordings (Table 1). A two-person crew completed the setup,
As described in the ‘Data Collection’ section, we recorded ambient noise using a nested triangle array configuration composed of 46 vertical, P-wave geophones. This configuration optimises the recording of diffuse ambient noise (i.e., not directionally biased) dominated by Rayleigh waves, allowing for application of the SPAC method for estimating the subsurface shear-wave velocities beneath the array.
We used the SPAC method as implemented within Surface Plus software (© Geogiga, 2023) for processing the data. The schematic below (Figure 7) outlines the steps involved in the processing. The first step is to import the multiple ambient noise records acquired for the site. The recording parameters (number of channels, sampling interval and total recording time) must be the same for all the imported data (Figure 7, Step 1). We then inspect the data to eliminate any records that show any energy that might be originating from within the array. Energy originating within the array will be a near-field non-planar wavefield violating the underlying assumptions of the method. Next, we apply survey geometry to the conditioned data run through a spectral analysis to estimate the dominant frequency range contained in the recorded noise (Figure 7, Step 2).
The input required for the SPAC analysis are the maximum velocity and maximum frequency for analysis along with the desired increments along each parameter space, usually set to 300 samples. We inspect the image visually and rerun the analysis to obtain a coherent, continuous, dispersion image (Figure 7, Step 3). Depending on the quality of the images, we have the option of either choosing the best one or a combination of good ones for picking.

We make the dispersion picks of velocity-frequency pairs by following the maximum amplitude of the dispersion image. We then input these into an automatic inversion module (Figure 7, Step 4) which iteratively calculates a best-fit layered-earth model whose response best matches the input. The final SPAC models had an average error between observed and calculated models of 9 m/s with resolution down to about 50 m below ground surface (Figure 7, Step 5). This result agrees well with the rule of thumb given by Foti et al. (2017) which states that the maximum depth of resolution is one to one-and-a-half times the distance between the farthest geophones in the array. The depth of penetration is also a function of the ambient-noise field. In our cases, signals with frequencies as low as 6 Hz were recorded allowing for deeper model resolution.
Results and discussion
Canyon (Figure 8)
Shear-wave velocities ranged up to 1766 m per second (mps) at the array in the canyon (Figure 8). The array was offset from the centre of the canyon due to the stream location. In the MASW profile closest to the SPAC array, the geotechnical team drilled one borehole at 50 m along the line. The borehole was terminated at 27 m below surface without reaching bedrock. This result implies the bedrock velocity is more than 1000 m per second, which was the shear-wave velocity from the MASW profile at the bottom of the borehole
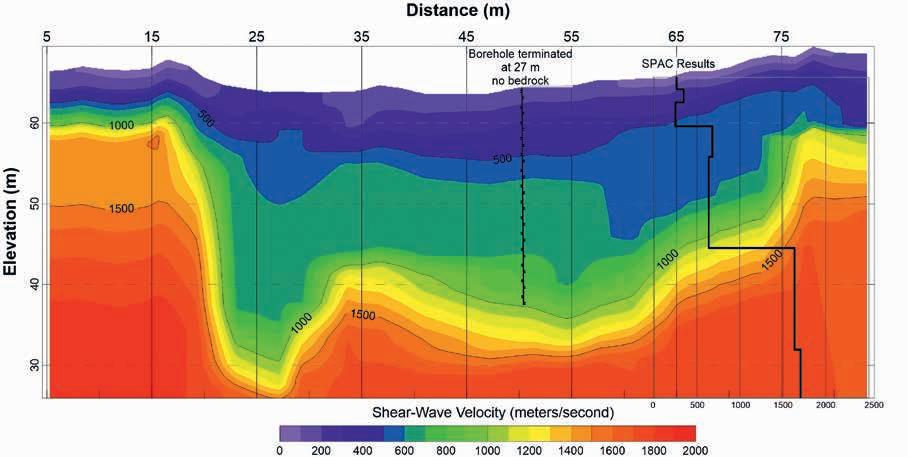
(Figure 8). The bedrock velocity interpreted from the SPAC profile was ~1500 m per second. This velocity contour in the MASW data is 33 m below surface at the borehole location. Additional drilling may occur in the summer of 2023 to validate the bedrock depths interpreted from the combination of SPAC and MASW results.
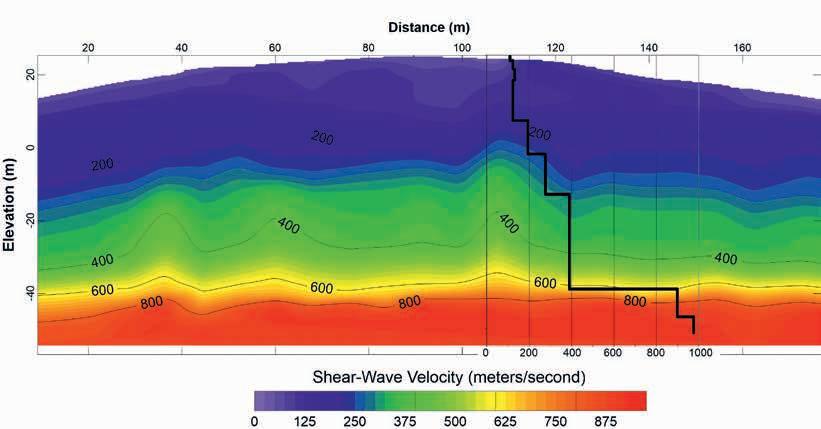
Hill (Figure 9)
Shear-wave velocities indicated the bedrock interface at approximately 65 m below surface associated with an increase in velocity to 900 m per second. Having this result supports the interpretation of the bedrock interface at the 700-800 m per second contour in the MASW section, which is approximately -40 m in elevation. The gradational changes in velocity between 300 m per second and 800 m per second observed in the MASW result are hidden by the step changes observed in the SPAC. The velocity of the bedrock recovered from the SPAC is higher than that of the MASW, ~ 900 m per second versus 700 m per second (Figure 9).
Bridges (Figure 10)
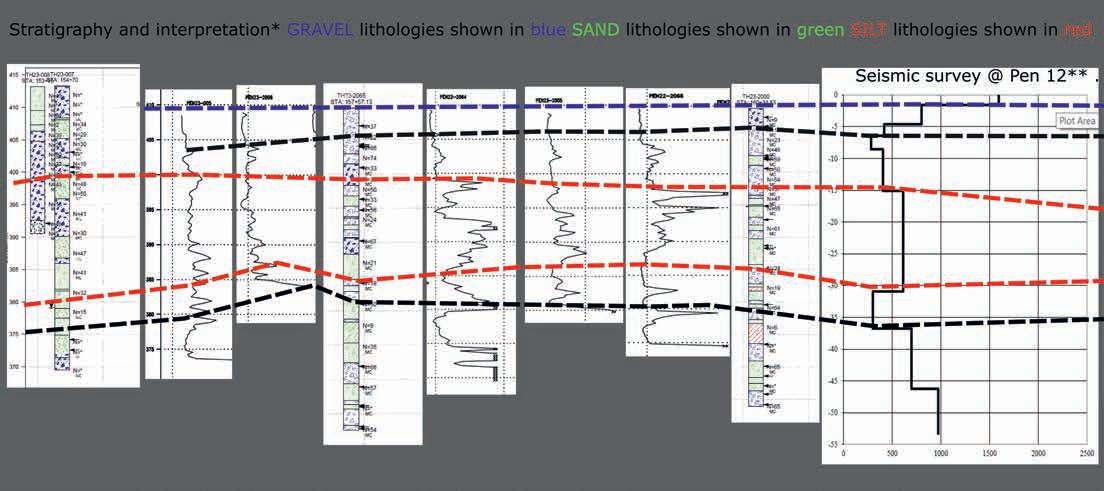
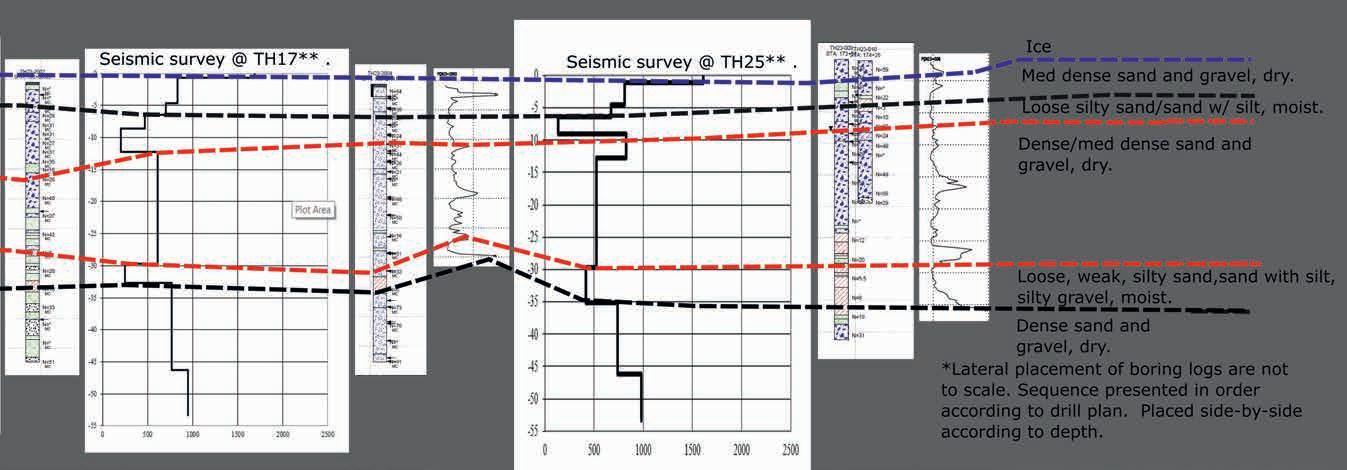
At the time of this publication, the results from Johnson Creek Bridge were not yet available. Figure 10 shows the results from Gerstle River Bridge borehole data and SPAC arrays. We group the lithology below the ice into dry sand and gravels, moist silty sandy materials, and ‘loose’ silty sand. The borehole results show a weak layer that corresponds to this ‘loose’ silty sand. The seismic results show a low-velocity layer at all three SPAC-array locations approximately 30 m below surface that corresponds to the weak layer from the borehole logs. Having the seismic data results gives confidence to the bridge design team that the weak layer continues across the river. The project team concluded that the seismic data were a suitable replacement for the borehole logs at the three completed locations, saving DOT money and time given the difficult drilling conditions.
Conclusion
We presented three different case studies at Alaskan sites showing implementation of the SPAC method for mapping the depth to bedrock and subsurface lithology. The SPAC method shows its utility in our work for difficult sites and deep bedrock mapping. Combining interpretation from SPAC and MASW where possible provides enhanced insight into site conditions. Finally, SPAC arrays may be suited for use in reducing the number of boreholes required for geotechnical site characterisation, as our final example shows.
References


Aki, K. [1957]. Space and time spectra of stationary stochastic waves, with special reference to microtremors. Bulletin of the Earthquake Research Institute, 35, 415-456.


Foti, S., Hollender, S., Garofalo, F., Albarello, D., Asten, M., Bard, P-Y., Comina, C., Cornou, C., Cox, B., Di Giulio, G., Forbriger, T., Hayashi, K., Lunedei, E., Martin, A., Mercerat, D., Ohrnberger, M., Poggi, V., Renalier, F., Sicilia, D. and Socco, V. [2017]. Guidelines for the good practice of surface wave analysis: a product of the InterPACIFIC project. Bulletin of Earthquake Engineering, 16, 2367-2420. https://doi.org/10.1007/s10518-017-0206-7.


Hayashi, K., Craig, M., Shunjia, T., Konishi, C., Suzuki, H., Tahara, M., Falkenstein, K., He, B. and Cheng, D. [2021]. Common-midpoint spatial autocorrelation analysis of seismic ambient noise obtained from a spatially unaliased sensor distribution. Geophysics, 86(4), 51-62.


Okada, H. [2003]. The Microseismic Survey Method. Geophysical Monograph Series, 12, Society of Exploration Geophysicists. https://doi. org/10.1190/1.9781560801740.fm.
Park, C.B., Miller, R.D., Xia, J. and Ivanov, J. [2007]. Multichannel analysis of surface waves (MASW)— active and passive methods. The Leading Edge, 26(1), 1-12.
Roberts, J.C. and Asten, M.W. [2004]. Resolving a velocity inversion at the geotechnical scale using the microtremor (passive seismic) survey method. Exploration Geophysics, 35,14-18. https://doi.org/10.1071/EG04014.
Stephenson, W.J., Louie, J.N., Pullammanappallil, S., Williams, R.A. and Odum, J.K. [2005]. Blind shear-wave velocity comparison of ReMi and MASW results with boreholes to 200 m in the Santa Clara Valley—implications for earthquake ground motion assessment: Bulletin of the Seismological Society of America, 95(6), 2506-2516. https://doi. org/10.1785/0120040240.
Zhao, D., Wang, G.J., Wang, X.T. and Sun, R.G. [1995]. The application of genetic algorithm to Rayleigh wave inversion (in Chinese), Geophysical & Geochemical Exploration, 19(3), 178-185.
Zhao, D., Zhong, H. and Tan, H.P. [1999]. The half-space wavefield of Rayleigh wave simulated by a point source (in Chinese), Geophysical & Geochemical Exploration, 23(2), 128-132.


