22 minute read
The role of ground penetrating radar (GPR) surveying for indoor Building Information Modelling (BIM)


Hector R. Hinojosa1*, Daniel P. Bigman2 and Sean McConnel2 present case studies illustrating how indoor 2D and 3D GPR surveys create digital information for BIM databases.
Abstract
Advertisement
Traditionally, GPR surveys are performed outdoors to identify buried or embedded objects’ location, orientation, and depth. The objects of interest are commonly linear, planar, or volumetric features of engineering, archeological, geological, or environmental context and significance. Due to constant improvements in component electronics and powerful GPR software developments, GPR hardware and software are finding indoor applications in architecture, engineering, and construction projects of historic and modern buildings and industrial infrastructure. Particularly, insights from indoor GPR surveys can non-invasively identify the embedded object and provide a high-resolution characterisation of the material properties surrounding the object, such that the output is a digital model feeding a Building Information Modelling (BIM) database. We present case studies illustrating how indoor 2D and 3D GPR surveys create digital information for such databases.
Introduction
Building Information Modelling (BIM) plays a pivotal role in fostering operation and maintenance and building facility management through the use of information and communication technology tools. However, most existing structures (i.e., modern or historic) and infrastructures lack BIM (Hossain and Yeoh, 2018). Research in creating BIM for existing buildings is receiving attention but generating BIM is complex, tedious, time-consuming, and costly. Different techniques used in capturing building data, such as imaging, 3D scanning, Ground Penetration Radar (GPR), and 2D scanned plans, have advantages and disadvantages regarding the high modelling/conversion efforts required to construct a semantically rich BIM. Moreover, most of these techniques are complex; require expert knowledge; core steps are still manual; face challenges in handling uncertain data; and BIM conversion becomes cumbersome with the BIM’s increasing level of detail (Hossain and Yeoh, 2018).
Non-destructive testing (NDT) inspection techniques such as Digital Photogrammetry (DP), Terrestrial Laser Scanner (TLS), and GPR are data acquisition technologies used to support the development of as-built information for creating BIM, whose
1 Cordillera Geo-Services LLC | 2 Bigman Geophysical LLC
* Corresponding author, E-mail: hector@cordillerageo.com
DOI: 10.3997/1365-2397.fb2023062 primary role is to capture the geometric information of exposed and embedded objects (Hossain and Yeoh, 2018; Bertolini et al., 2023). DP works by capturing static images and turning these into 3D point clouds. TLS uses multiple points of amplified light to measure distances from the scanner to its target. The capability to see through, below, and into solid anthropogenic and natural materials using non-invasive techniques has important applications in architecture, engineering, and construction, where investigations often require intrusive or destructive methods (Mellett, 1995). GPR relies on high-frequency radio signals to infer the location of objects embedded in a fabricated surface or material. These techniques for as-built data acquisition require arduous on-site surveys with manual measurement or visual assessment. They are error-prone, tediously time-consuming, unreliable, and generate uncertainty for decision-makers (Hossain and Yeoh, 2018).
Building Information Modelling and Ground Penetrating Radar
BIM is a collaborative way for multidisciplinary information storing, sharing, exchanging, and managing throughout the entire building project lifecycle, including the planning, design, construction, operation, maintenance, and demolition phase (Eastman et al., 2011). BIM methodology generates informative digital models that integrate multi-source and multi-scale information about the objects they represent (Bertolini et al., 2023). In recent years, BIM has been a widely recognised platform in the architecture, engineering, and construction sectors (Tang et al., 2017). BIM brings the industry a state-of-the-art and creative revolution to substitute conventional 2D design drawings using digital 3D modelling. The benefits of BIM in such construction sector projects can be summarised as follows: cost saving, process control, rework reduction, quantity take-off, project management, multidimensional simulation, and visualisation, which are across the whole project lifecycle from the planning and design phase to the operation and maintenance phase. BIM provides an optimal solution by letting shareholders exchange and manage information about building components throughout the lifecycle of a building; mainly, it can be used for energy
Type of principal object in BIM Example of an object in an underground investigation
Point Material sample (soil, sediment, rock, water), drill hole, geological log, well, borehole geophysical reading
Line
Area
Volume
A geophysical profile of any method (seismic, GPR, magnetics, gravity, electromagnetic induction, electrical resistivity, etcetera)
A planar surface such as interpreted bedrock surface, stratigraphic contact surface, fracture planes, joints
A volumetric body such as a void, cave, contamination plume, dry/moist/wet subsurface material, subsidence, damage zone, material variation, or separation usage analyses, defect detection, firefighting, renovation and demolition, and safety in facility management. (Hossain and Yeoh, 2018). A CoClass classification system for underground and embedded objects compatible with BIM was recently introduced by Svensson and Friberg (2019), where underground or embedded geological or geophysical targets are identified, detected, resolved, or mapped with underground characterisation or remote sensing techniques (i.e., geotechnics, rock mechanics, and engineering and environmental geophysics) are envisioned as digitisable and geo-referable points, lines, areas or volumes as summarised in Table 1.
GPR, a non-destructive geophysical technique that transmits electromagnetic pulses and records backscattered reflection echoes (Koppenjan, 2009), can enhance BIM by locating and mapping buried or embedded objects (Bigman, 2023; Drobiec et al., 2019; Hebsur, 2013; Metwaly, 2015; Rashed, 2013; Wei Jaw, 2013), and can characterise site conditions and building component defects (Bigman and Day, 2022; Dinh and Gucunski, 2021; Jiao et al., 2020; Tesic et al., 2021). Typical EM wave frequencies produced by GPR antenna will be between 10 MHz and 4 GHz (Annan, 2009; Milson and Eriksen, 2011), whereas higher frequency systems will provide higher resolution but limited inspection depths. Changes encountered in dielectric properties of materials will cause reflection events which can be recorded at the surface, interpreted, and exported to 3D BIM databases. Large differences in dielectric properties will result in large amounts of reflected energy, whereas a small difference will result in a small amount of energy being reflected. Thus, buried objects of similar properties to concrete or soil can be difficult to identify with GPR and may give false confidence in BIM models. GPR traverses collected adjacent to each other can be resampled to create pseudo-3D visuals called time-slices.
The information acquired with GPR can be included in the digitalisation process by generating digital representations of embedded objects or identified deteriorations containing crucial information, such as the type of detected distress (Bertolini et al., 2023). Recent efforts in developing linear features from GPRbased information into a BIM have focused on different targets, including rebar in concrete surfaces (i.e., columns, walls, and slabs) (Xiang et al., 2021), paved roads (D’Amico et al., 2023; Bertolini et al., 2023), and façade features of historic buildings (Solla et al., 2020). However, there are limits to the resolution of any NDT, and the physical properties of subsurface materials, surface conditions at a site, and the complexity or orientation of targets can impact the overall quality of results from a GPR survey.
Regardless of the transmitting antennas used to generate EM waves, GPR systems are sensitive to near-subsurface stratigraphy and can detect the presence of shallow-buried targets as long as there is enough electrical and magnetic contrast between the material and the surrounding matrix. Hence, the GPR technique finds applications in fields as diverse as engineering, environmental management, architecture, archaeology, geology, and mineral prospecting. The GPR method has proven successful in both urban (Mellet, 1995; Rashed and Al-Garni, 2013; Stumpf et al., 2021; Urban et al., 2014a) and remote settings (Bigman et al., 2023; Millaire and Eastaugh, 2014; Novo et al., 2014; Urban et al., 2014b) because of its versatile features including:
• Being a non-destructive, non-invasive, and cost-effective prospecting technique applicable in 2D and 3D modes
• Offering a rapid ability to map shallow-buried or embedded objects and structures of variable context or interest
• Providing valuable geo-referenced results (when possible) that assist excavation strategies by efficiently highlighting the best candidate locations and excavation depths
• Results that complement input from shallow site characterisation studies or even other near-surface geophysical methods
In the developing field of BIM, indoor and outdoor GPR surveying is a valuable and promising remote sensing technique despite its advantages and limitations.
In an indoor survey context, GPR instrumentation is versatile because of its practicality and ability to be deployed in industrial and non-industrial environments for 2D or 3D data acquisitions. GPR instruments are portable, as they can either fit in the palm of your hand, be pulled/pushed with one hand, or be pulled/pushed by one person. In the interior of buildings, GPR instrumentation functions easily and successfully because the instrument is portable and fits in most small spaces. GPR data (2D or 3D) can be gathered in tight or open spaces on horizontal, inclined, or vertical surfaces. GPR data is acquired fast, and the surface of interest is revealed in real-time. However, data processing is commonly the second step to achieving a final interpretation and gathering the required information for the decision-making process.
When used in the interior of buildings, GPR surveys are typically unable to collect geo-referenced raw data because current global positioning systems (GPS) technology compatible with GPR systems cannot acquire geographic coordinates inside the complex set of buildings. However, many manufacturers now offer systems compatible with robotic total stations. While surveyors have been able to record locations of GPR investigations or marked interpretations manually, real-time tracking using local coordinate systems and robotic total stations are now helping professionals overcome the limits of indoor positioning (Ching et al., 2021). GPR is a remote sensing technique with inherited uncertainties, much like any other non-invasive geophysical exploration techniques. So, as a rule of thumb, GPR technology can never be regarded as an entirely conclusive tool in its ability to detect and resolve buried targets or estimate target depths (Xie et al., 2022). Nearby cultural noise sources lower the signal quality of GPR investigations. The presence of conductive materials rapidly attenuates the penetration depth of a GPR investigation. For instance, high moisture in a structure (a wall or concrete slab) can cause high absorption of EM waves; salt water can cause total attenuation of the signals at shallow depths. In addition, the absence of clear embedded reflectors in a non-uniform medium can impact the successful application of GPR to obtain valid information on the geometry of the objects and on the type and size of existing irregularities in the medium.
Indoor GPR survey examples in the building environment
Traditionally, GPR surveys are done outdoors with systems either pushed or pulled by one or two people depending on the hardware type and size. However, indoor GPR surveys are becoming common across geotechnical and civil engineering projects. In the following examples, we present four different applications of GPR for investigating indoor infrastructure at four separate locations that can be used to develop or update the BIM for each facility.
Industrial site Conduit detection at coal powerplant
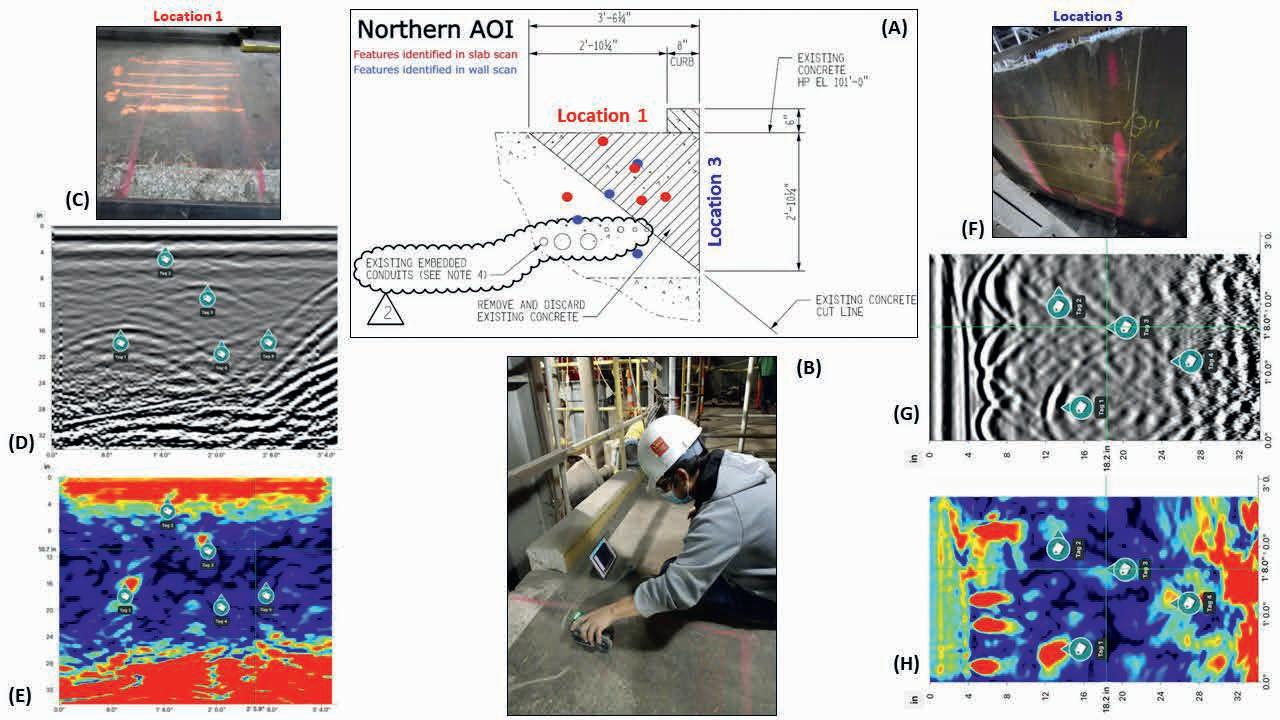
A coal power plant located in the mid-Atlantic USA needed to add grinder conveyors to facilitate processing flow and power generation. The specifications for these conveyors indicated a conflict with an already established concrete wall and floor. Original as-built drawings suggested that a row of seven existing conduits was embedded in the concrete approximately 27 inches below the surface (Figure 1A). GPR was used to identify the lateral and vertical extent of possible conduits to reduce the possibility of damage and use the recorded locations to update the facility’s BIM.
Initial testing on-site determined that the amount of electrical interference from nearby equipment, the dense proximity of multiple metal and electrical objects, and the large aggregate negatively impacted the quality of data collected by geophysical equipment. Although GPR was found to be the most effective means of investigation at this site, the signal-scattering properties of the concrete material, combined with the generation of surrounding interference, greatly reduced the clarity and depth of the signal.
This investigation used Screening Eagle GP8000 and GP8800 stepped-frequency continuous wave GPR probes (Figure 1B), which generated readable profiles to about 25 inches below the surface. The Northern area of investigation (Northern AOI) was scanned from two surfaces, labelled locations 1 and 3 (Figures 1A, 1C, and 1F). On both the horizontal slab (location 1) and the vertical surface (location 3), the GPR recorded linear features that presented hyperbolic reflection geometries whose characteristics fit that of possible conduit based on their amplitude, orientation, and depth in comparison to the diagrams provided by the customer (Figures 1D, 1E, 1G, and 1H). Numerous other readings were recorded whose characteristics were not typical for conduits, and these were not drawn on the surfaces. The metal reinforcements in the concrete were highly visible. The locations of possible conduit features discovered during data collection were marked on the surface in wax lumber crayon (Figures 1C and 1F). The location 1 surface was drawn over again in spray paint to fortify the markings versus being disturbed by work activity as people walked across the surface.
The line-mode scans used during the mark-out phase were better adapted to the survey environment, as most readings were distorted or noisy as they ran across changes in the refraction angle of energy caused by the large aggregate. The operating theory is that each pass of the GPR antenna would catch the aggregate beneath at slightly different angles, often resulting in signal scattering. The collection crew discovered that by scanning the same profile several times, a clearer image would sometimes present, which could be used to mark possible conduit. The profiles collected in line mode were tagged for possible features and recollected multiple
1 and 3 of the Northern area of investigation (C and F), objects and depths drawn on the concrete. In filtered and migrated data, GPR radargrams at location 1 (D and E) ran west to east; tagged objects were painted on the surface (D and E). GPR radargrams at location 3 (G and H) in filtered and migrated data showing tagged objects drawn on the surface (G and H). The vertical face of times to combat the unreliable signals effectively. Examples of good profiles for locations 1 and 3 are shown in Figures 1D-1E and 1G-1H, respectively, as is an approximate cross-section generated with features from both scan locations.
Non-industrial sites
Pipe detection in a high-school classroom
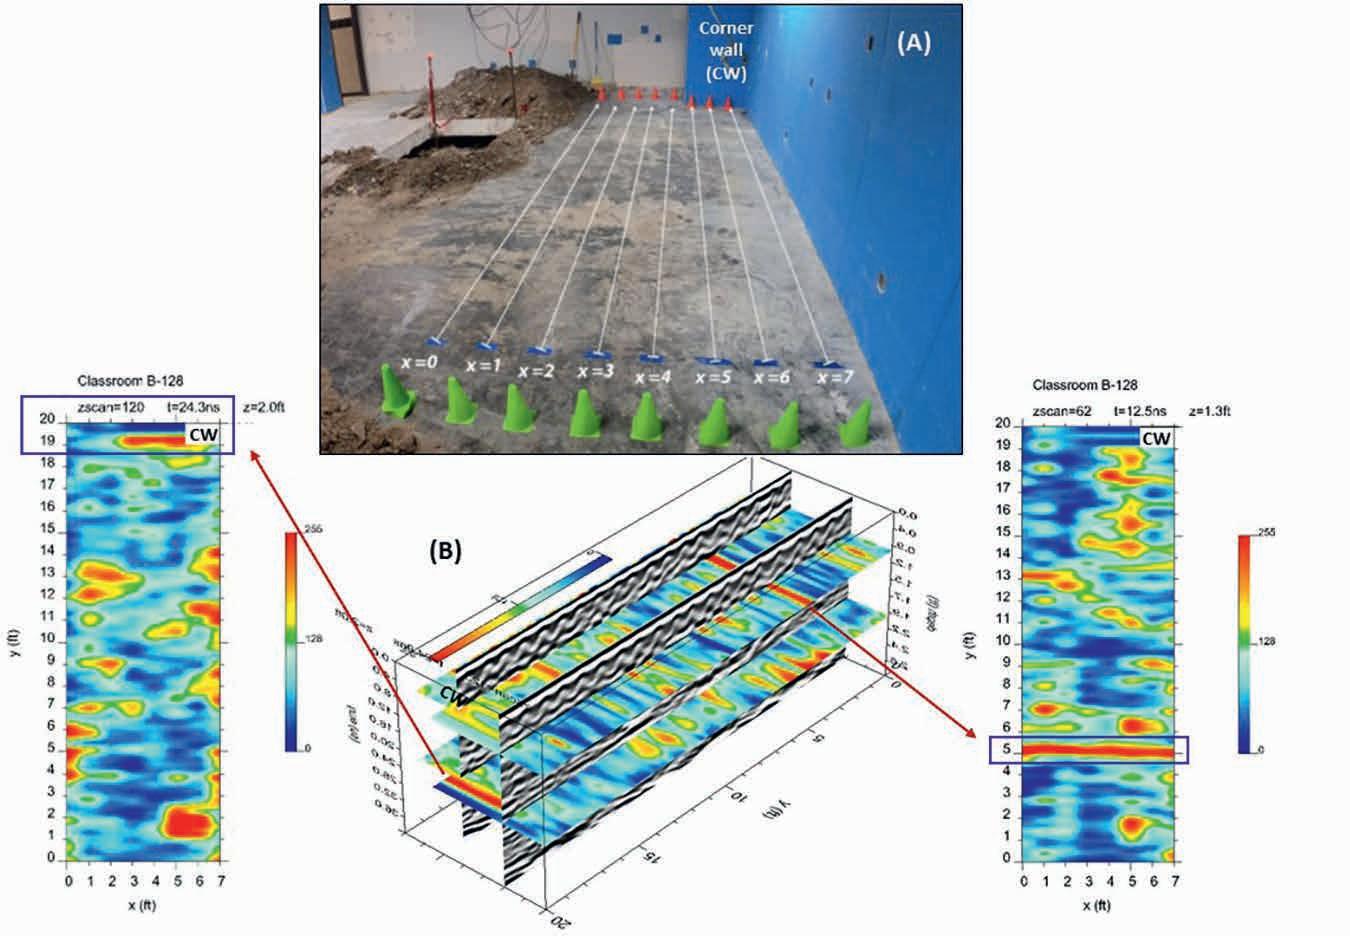
A high school located in Texas, USA, was installing additional subfloor utilities to service the students, faculty and administrators. The contractor needed to drill horizontally across three separate but adjacent classrooms without affecting an existing 4-inch diameter sewer pipe assumed to be buried less than 5 ft deep. The information on the exact location of this pipe was unknown prior to the investigation. Developing an inventory of buried utility services was critical to reduce conflicts in the design phase for the current and future projects. Here we present the results of a 3D GPR survey from one of the three rooms.
Data were acquired with the GSSI SIR-4000 connected to a 350 MHz hyperstacking transmitting antenna mounted on a 4-wheel survey cart. GPR-Slice v.7 software was used to process, analyse and visualise all GPR data. Data were only collected along the Y-direction with a 1-foot line spacing. The target area was inside a kitchen classroom, as shown in Figure 2A. This grid measured 7 ft x 20 ft.
Possible utility lines are detected along the x-axis 5 ft and 19-20 ft at a depth range of 1.1 to 1.3 ft and 1.9 ft to 2.3 ft, respectively. Figure 2B shows the resulting 3D volume and the interpreted possible utilities highlighted by blue rectangles and red lines. The analysis and interpretation of the resulting amplitude slice maps and accompanying 3D volumes suggest that the mapped GPR anomalies are consistent with the expected buried pipes. The high-amplitude anomalies are interpreted as shallow-buried pipes within the dried, hard, natural soils under the concrete slab, later confirmed by subsequent horizontal drilling. The GPR suggested that the pipes descend as they approach the wall. The locations of the detected and newly installed pipes can now be referenced in the future prior to construction or service installation.
Leak detection in a commercial office building
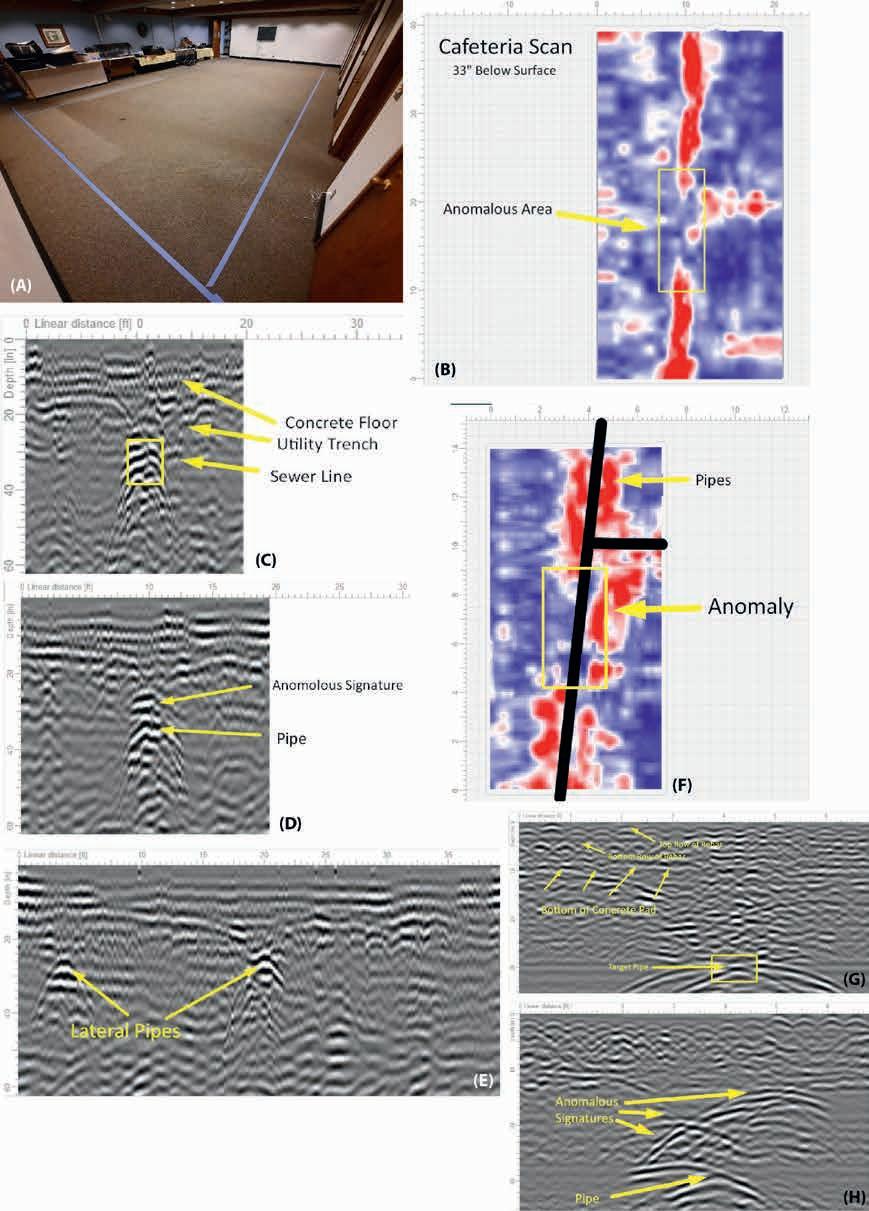
The goal was to investigate a malfunctioning sewer line beneath an operational cafeteria (Figure 3A). The sewer line had been previously investigated with an EM locator and camera with a sonde attachment. However, that equipment could not penetrate far enough into the structure to determine the location of damage. A high-pressure water cleaning system attempted to clear the line leading to the discovery of large amounts of subsoil-like material, presumed to be infiltrating from a break in the pipe. GPR was chosen to map signs of a pipe collapse or void space, identify the damage location, and allow repair work with minimal impact.
The investigation was initially conducted using Sensors and Software Findar with a 500 MHz antenna. The survey grid measured 21 ft x 39 ft, with an 18-inch transect spacing. It was found that although the building floor had two layers of metal reinforcement, the GPR signal did not attenuate until a depth of at least 6 ft, almost twice the depth of the target objects. The project data were exported to Geolitix software for data processing, slicing, and analysis (see Figure 3B).
The GPR investigation resolved the target pipe clearly with antennas and an area around the pipe that appears anomalous and indicative of a void or collapsed pipe in that location. The locations of the pipe and anomalous area were marked on-site to allow a precise excavation of the concerned area. The 500 MHz antenna penetrated between two layers of metal reinforcement and still provided a clear signal to a depth more than 6 ft below the surface. Interference from the rebar made it difficult to determine the thickness of the concrete pad, but a weak horizontal band can be seen between 8 and 10 inches below the surface, providing an approximate thickness, as shown in Figures 3C and 3D. The GPR recorded a linear reflection anomaly interpreted as the main central pipe. This location matched previously identified ones when using a pipe and cable locator (PCL) and sonde. Short linear reflection anomalies perpendicular to the main response indicated two laterals attached to the main pipe. The pipe features occurred at around 33 inches below the surface. A large anomalous signature was detected at the intersection of the main pipe and the northern lateral. The anomaly continues approximately 5 ft south of that intersection, as shown in Figure 3E. In profile, the main pipe is clear at locations outside the anomalous region but appears to be mixed with a different high amplitude response in the disturbed region. This finding is consistent with the expected void space that could have been created during the high-pressure water treatment that failed to clear the pipe.
A second grid was collected over the same area using a Proceq GP8000 SFCW GPR with a 6-inch transect spacing to create a higher resolution 3D volume designed to detail the detected anomalous signature located in the centre of the grid (Figure 3F). Two-dimensional profile plots (Figures 3G and 3H) also show that the anomalous area, which measures approximately 5 ft long, begins at the intersection of that lateral line and continues south. Identifying the locations of buried pipes, and modelling the breadth of the void space, will allow the management of the commercial building to incorporate the findings into a BIM and carry out a monitoring program at regularly scheduled intervals. Confirmation of test outcomes can be integrated and updated in the database.
Grade beam mapping in a retail shopping mall
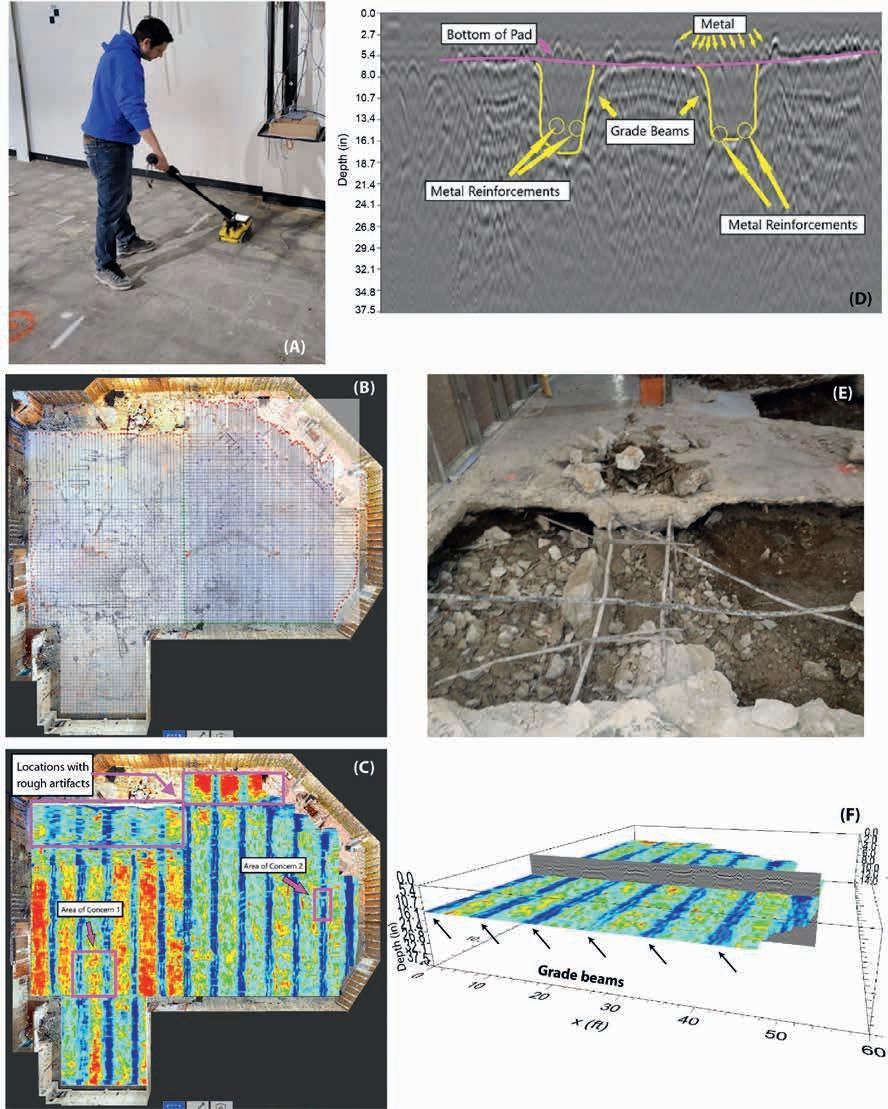
A 3D GPR investigation was conducted inside a New Orleans, Louisiana, shopping mall showroom. The project was tasked to map the locations of grade beams, identify embedded reinforcements in grade beams, and assess any signs of degradation. The purpose of the investigation was to help prevent damage during store turnover. New electrical boxes were to be installed in the concrete, and the contractors wanted to avoid contact with the grade beams. Since there was no current BIM, the data collected during this project would begin the development of an archived database. The concrete pad overlaying the grade beams contained a dense steel wire mesh which was expected to complicate data interpretation.
A Screening Eagle GP8000 was used to collect data for 3D volume creation across three articulating grids. These data were subsequently integrated with other data sets, such as terrestrial-based LiDAR, and included in the BIM. Spot checking and on-site mark-out were conducted using an IDS C-Thru (Figure 4A). These markings were captured in the LiDAR/ photogrammetry data and could be re-referenced for future store turnover. Data were collected bi-directionally at a maximum transect spacing of 1 ft, allowing a broader transect calculation to reflect the appropriate level of accuracy that could be mapped using the GP8000s on such a rough surface (Figure 4B). All data were processed with GPR-Slice v.7 software. Time-slice maps were generated from GPR profiles to create a top-down visualisation of the survey area. Additionally, time slices were interpolated into a 3D environment, which could contain and show the different data perspectives.
Figure 4C shows a plan view of the radargram for the survey area at 9.5 in below the surface. The GPR investigation yielded clean imagery in which the grade beams could be identified and mapped, and they were drawn on the surface in white spray paint. The processed images revealed areas of concern where the concrete was imaged differently, indicating possible material variation or degradation (Figure 4D). The steel mesh inside the concrete floor pad is presented clearly, such that the individual pieces of rebar can be seen clearly in the profile (Figure 4D). However, the rough surface of the exposed concrete pad prevented a smooth enough transfer of the antenna across the ground to produce slice images that could accurately map targets of such a small size. Although some slight distortion occurs in places where the antenna encountered metal fasteners and other debris, the overall shape of the grade beams appears clearly in all locations where the antenna was run over an exposed concrete pad (Figure 4C). The low amplitude response (shown as linear blue responses) indicates the locations of grade beams. The similar dielectric permittivity of the slab and poured beams would reflect only small amounts of energy, causing subtle or no amplitude response. The beams are still visible where the pad had flooring layers on top, but clarity is poor, and depth measurements are less accurate in those locations. The grade beams show up clearly in the radar profile, as the contexts around them give very different responses than the beams themselves. In particular, the responses from metal reinforcements in the concrete pad are noticeable, and the areas between the beams have a much faster velocity and appear brighter in profile images, as shown in Figures 4D and 4E. Interpretations of our GPR data were confirmed during subsequent limited demolition to expose a conduit (Figure 4F).
Discussion
It has been known for a long time that GPR can provide continuous high-resolution profiling of subsurface features and can locate objects and interfaces at various scales. GPR is extensively used worldwide for buried or embedded object identification in the subsurface or infrastructures respectively. However, because of the advantage of immediate and efficient visualisation of internal structure, the GPR method is also used in material property characterisation of ageing and adversely exposed infrastructures (Lai et al., 2011). Common characterisable factors include steel bar corrosion in concrete, hydration and water content distribution in porous concrete, brickwall (Lai et al., 2011), and the radius of reinforcing steel bars in concrete (Chang et al., 2009), among other specific applications.
Figure 4 The C-Thru GPR is used on-site to detect grade beam boundaries (white paint) (A). Acquired bi-directional GPR transects overlaid on a point cloud image (B). The two locations where returns from grade beams were inconsistent and may indicate damage (C). In this example, the interpreted grade beams are shown in a radargram showing how their tops are level, but their depths vary (D and F). Field photograph of an exposed grade beam showing the thin concrete pad with rebars at the top of the grade beam.
In BIM, the non-destructive GPR technique leads other commercially common near-surface geophysical exploration techniques (e.g., seismic methods, electrical resistivity imaging, magnetics, gravimetry, electromagnetic induction). However, GPR competes with engineering non-destructive testing techniques such as impact-echo, sonic transmission and tomography, electrical conductivity, ultrasonics, and infrared thermography. Indoor GPR surveys can provide a 2D or 3D map of linear, planar, or volumetric structures embedded in manufactured or natural surfaces within and below buildings and building facades. An indoor GPR survey is independent of the outdoor weather conditions. However, the nearby cultural noise sources are likely to be an issue of data quality which can be tackled in the data processing phase. Practicioners have a wide variety of GPR hardware and software options because most deliver the information required in BIM projects, although geophysical surveys for BIM environments are yet to become standardised. The GPR survey accuracy highly adjusts to many factors, including target size, depth, surface area, acquisition time, and budget cost. Depending on the size of the surface area of interest, an indoor 2D or 3D GPR survey can be accomplished by one person. When the target’s surface conditions are rough or bumpy, there is not a smooth transfer of the antenna across the uneven surface to produce slice images that could accurately map or resolve small-size embedded targets. So it is important to ensure a clear and clean working surface. Moreover, GPR survey results can feed an ever-evolving BIM’s 3D database, thus contributing information to the entire building life cycle.
Nonetheless, technical disciplines focusing on underground site characterisation, such as engineering and environmental geophysics, geotechnics, and rock mechanics, still need to develop standards for data formats, exchange formats, objectification, and classification of subsurface or embedded objects for construction projects in a BIM environment, compared to architecture, engineering and construction disciplines which began earlier (Svensson and Friberg, 2019). As recently proposed by Svensson and Friberg (2019), the ‘CoClass’; classification system for underground geo-related objects or targets (e.g., points, lines, areas, and volumes) integrates into the BIM environment. This classification scheme benefits from data and information acquired by technical disciplines focusing on subsurface site characterisation by sampling, drilling, excavation, or remote sensing means (geophysics). Even if a standard classification system is not industry-ready, the GPR data and results from previously acquired, continuing, or future GPR surveys would be incorporated into a project’s BIM database.
Conclusion
Indoor 2D or 3D GPR surveys effectively identify or map functional or broken objects of interest buried or embedded in fabricated or natural mediums. These objects can vary from linear, planar, or volumetric. Simultaneously, the same GPR survey can shed light on the material property conditions of the object and the medium that hosts it; for instance, rebar corrosion and moisture or fracturing in the concrete. Indoor GPR surveys are versatile because they can adapt to various site and surface conditions, despite noisy surroundings. The GPR survey resolution solely depends on the density of the survey, the choice of instrument and antenna, and the quality of the raw data, factors that are generally user-controllable. The choice of GPR software determines the capabilities of data processing, analysis, and visualisation outputs. While geo-referenced raw GPR data is not an issue for outdoor surveys, it is still a challenge for indoor surveys. A GPR survey can produce data for a BIM project even if the project’s BIM database has not been crafted.
Acknowledgements
These case studies are from private-sector projects. Thank you to the project owners who allowed these case studies’ publication. These case studies are not an endorsement of the GPR hardware and software.
References
Annan, A.P. [2009]. Electromagnetic Principles of Ground Penetrating Radar. In: Jol HM (ed) Ground Penetrating Radar: Theory and Applications, Elsevier, Amsterdam, 3-40.
Bertolini, L., D’Amico, F., Napolitano, A., Ciampoli, B., Gagliardi, V. and Manalo, J.R.D. [2023]. A BIM-Based Approach for Pavement Monitoring Integrating Data from Non-Destructive Testing Methods (NDTs). Infrastructures, 8(5), 81.
Bigman, D.P. [2023]. Evaluating the feasibility of robotic crawler deployed ground penetrating radar to assess repairs of a concrete hydroelectric dam spillway in Alabama, USA. Water, 15(10), 1858, doi.org/10.3390/w15101858.
Bigman, D.P. and Day, D.J. [2022]. Ground penetrating radar inspection of a large concrete spillway: a case-study using SFCW GPR at a hydroelectric dam. Case Studies in Construction Materials, 16, e00975, doi.org/10.1016/j.cscm.2022.e00975.
Bigman, D.P., Noble, D., Sargent, T. and Pringle, J.K. [2023]. Largescale Forensic Search for Fallen Soldier Burials from the American Revolutionary War at Kettle Creek Battlefield, Georgia, USA. Forensic Science International: Reports, 7, 100313, doi.org/10.1016/j. fsir.2023.100313.
Ching, G.P.H., Chang, R.K.W., Luo, T.X.H. and Lai, W.W.L. [2021]. GPR Virtual Guidance System for Subsurface 3D Imaging. Remote Sensing, 13, 2154.
D’Amicol, F., Bertolini, L., Napolitano, A., Ciampoli, L.B., Manalo, J.R.D., Gagliardi, V. and Calvi, A. [2023]. A possible implementation of non-destructive data surveys in the definition of BIM models for the analysis of road assets. Transportation Research Procedia, 69, 187-194.
Dinhl, K. and Gucunski, N. [2021]. Factors affecting the detectability of concrete delamination in GPR images. Construction and Building Materials, 274, 121837.
Drobiec, L., Radoslaw, J. and Mazur, W. [2019]. Accuracy of eddy-current and radar methods used in reinforcement detection. Materials, 12, 1168.


Hebsur, A.V., Muniappan, N., Rao, E.P. and Venkatachalam, G. [2013]. Application of ground penetrating radar for locating buried impediments to geotechnical exploration and piling. International Journal of Geotechnical Engineering, 7, 374-387.
Hossain, M.A. and Yeoh, J.K. [2018]. BIM for existing buildings: potential opportunities and barriers. In IOP Conference Series: Materials Science and Engineering, 371(1), p. 012051). IOP Publishing.
Jiao, L., Ye, Q., Cao, X., Huston, D. and Xia, T. [2020]. Identifying concrete structure defects in GPR image. Measurement, 160, 107839.
Koppenjan, S. [2009]. Ground Penetrating Radar Systems and Designs. In: Jol HM (ed) Ground Penetrating Radar: Theory and Applications, Elsevier, Amsterdam, 73-97.

Mellett, J.S. [1995]. Ground penetrating radar applications in engineering, environmental management, and geology. Journal of Applied Geophysics, 33, 157-166.
Metwaly, M. [2015]. Application of GPR technique for subsurface utility mapping: A case study from urban area of Holy Mecca, Saudi Arabia Measurement, 60, 139-145.
Millaire, J.F. and Eastaugh, E. [2014]. Geophysical survey on the coast of Peru: The early prehispanic city of Gallinazo Group in the Virú Valley. Latin American Antiquity, 25(3), 239-255.
Milsom, J. and Eriksen, A. [2011]. Field Geophysics, 4th edn. John Wiley & Sons Ltd. England.

Novo, A., Solla, M., Fenollós, J.L.M. and Lorenzo, H. [2014]. Searching for the remains of an Early Bronze Age city at Tell Qubr Abu al-’Atiq (Syria) through archaeological investigations and GPR imaging. Journal of Cultural Heritage, 15(5), 575-579.
Rashedl, M.A. and Al-Garni, M.A. [2013]. On the application of GPR for locating underground utilities in urban areas. Arabian Journal of Geosciences, 6(9), 3505-3511.
Solla, M., Fransisco, C., Gonçalves, L., Gonçalves, G., Puente, I., Providência, P., Gaspar, F., Puente, I. and Rodrigues, H. [2020]. Integrating GPR and geomatic data into a Building Information Modelling: The case study of the Monastery of Batalha (Portugal) Defense University Center (Spanish Naval Academy).
Stumpf, T., Bigman, D.P. and Day, D.J. [2021]. Mapping Complex Land Use Histories and Urban Renewal using Ground Penetrating Radar: A case study from Fort Stanwix. Remote Sensing, 13, 2478, doi. org/10.3390/rs13132478.
Tang, L., Chen, C., Tang, S., Wu, Z. and Trofimova, P. [2017]. Building information modeling and building performance optimization. Encyclopedia of sustainable technologies, 311-320.
Tesic, K., Baricevic, A. and Serdar, M. [2021]. Non-destructive corrosion inspection of reinforced concrete using ground-penetrating radar: A review. Materials, 14, 975.


Urban, T.M., Rowan, Y.M. and Kersel, M.M. [2014a]. Ground-penetrating radar investigations at Marj Rabba, a Chalcolithic site in the Lower Galilee of Israel. Journal of Archaeological Science, 46, 96106.
Urban, T.M., Leon, J.F., Manning, S.W. and Fisher, K.D. [2014b]. High-resolution GPR mapping of late bronze age architecture at Kalavasos-Ayios Dimitrios, Cyprus. Journal of Applied Geophysics, 107, 129-136.
Wei Jaw, S. and Hashim, M. [2013]. Locational accuracy of underground utility mapping using ground penetrating radar. Tunnelling and Underground Space Technology, 35, 20-29.
Xiang, Z., Ou, G. and Rashidi, A. [2021]. Automated Translation of Rebar Information from GPR Data into As-Built BIM: A Deep Learning-based Approach. Computing in Civil Engineering, 374381.
Xie, F., Lai, W.L.L. and Dérobert, X. [2022]. Building simplified uncertainty models of object depth measurement by ground penetrating radar. Tunnelling and Underground Space Technology, 123.