12 minute read
Environmentally friendly low impact, low carbon footprint, low power electromagnetic technique for mineral exploration
Gordon Stove1* presents the results of surveys in the north of the UK for geothermal and lithium brine exploration using a novel electromagnetic techology.
Introduction
Advertisement
Geophysicists in the 21st century now accept their commitment to being a sustainable and responsible surveyor of the Earth’s subsurface. Reducing our carbon footprint on our route to Net Zero - in the face of the challenges presented by the global pandemic and the subsequent return to work, fieldwork and international air travel - is not an easy task. Whatever our geophysicist tool of choice, we can take some basic steps to help, such as:
1. Protect the environment by lessening our impact through monitoring and reducing our carbon emissions.
2. Raise awareness throughout our own organisations of things that colleagues can do to reduce their personal carbon emissions as well as reducing carbon emissions within our organisations.
3. Engage colleagues in environmental issues and initiatives.
4. Identify environmental causes that we can support.
5. Publicly hold ourselves accountable for our carbon footprint by publishing our carbon impact on our websites and public domain media channels.
Above all, we can develop and use our geophysics tools and technologies in an environmental way. Adrok has been developing a low carbon, low impact geophysics offering for the past two decades. Over the past five years we have been letting our clients know what our carbon footprint levels are for each geoscientific survey. Multiple surveys have been performed in the north east of the UK for geothermal and lithium brine exploration using novel electromagnetic (EM) technologies. This paper will explore these surveys in more detail through a geophysical lens and an environmental lens.
Method and/or theory
Adrok’s proprietary Atomic Dielectric Resonance (ADR) technology is based on the principle that different materials will reflect and absorb electromagnetic radiation (radio waves, microwaves) at specific frequencies and energy levels. The ADR geophysical system transmits a pulse of electromagnetic energy containing a multispectral (patented) wave packet that resonates and reacts with the subsurface materials (Richards & Stove, 2020). The reflections from the subsurface are recorded as a time domain trace and provide information about the location and composition of the materials encountered.
The transmitted ADR wave packet contains several frequency components in the range of 1-100 MHz where the low frequencies achieve deep penetration, whereas the higher frequencies enhance vertical resolution (Stove, 2018). The technology measures the dielectric permittivity of the subsurface as well as characterising the nature of the rock types based on analysis of both the spectro-
1Adrok Ltd
* Corresponding author, E-mail: gstove@adrokgroup.com
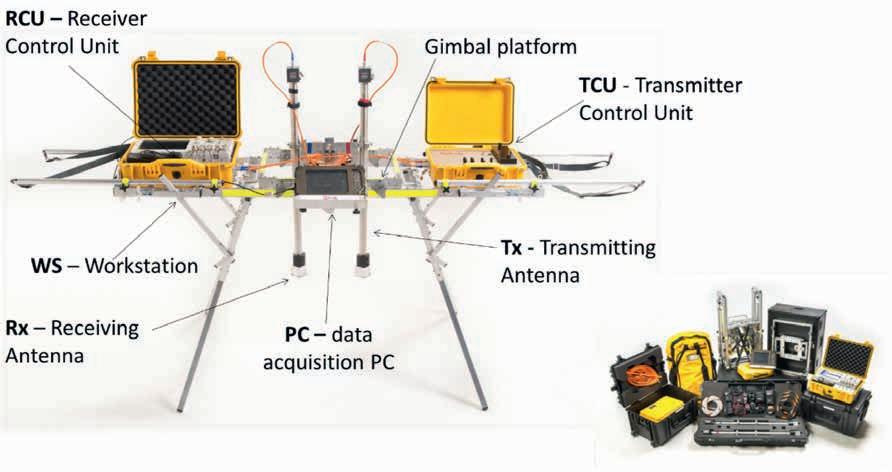
DOI: 10.3997/1365-2397.fb2023068 scopic and resonant energy responses (Doel et al, 2020). Adrok’s ADR system (Figure 1) is non-destructive and non-ionising that transmits EM wave signals directed at the ground to penetrate the Earth’s subsurface. The system’s transmission of EM waves should therefore not pose any harmful threats to persons, flora and fauna in its transmission path.
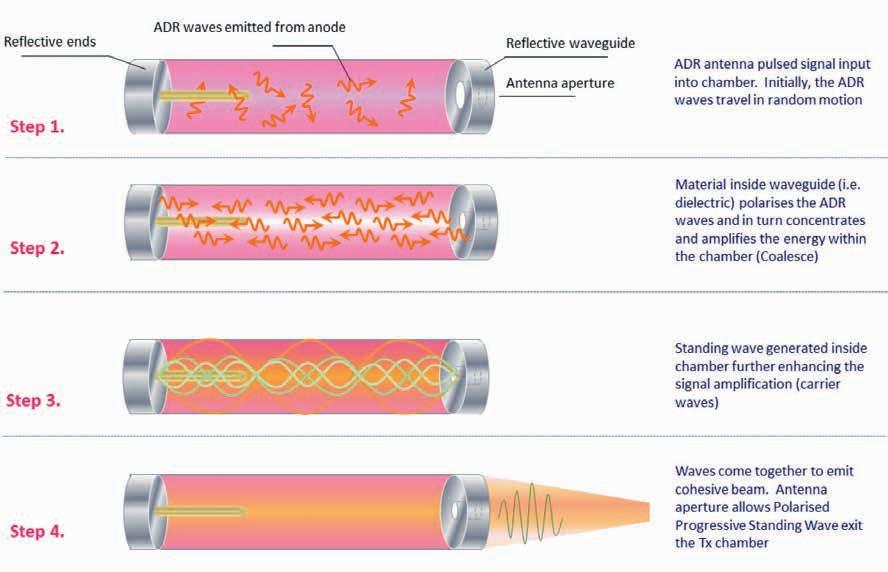
Specification of Adrok’s transmitting sensor in the field (Figure 2):
• transmits pulsed EM waves into the ground in the frequency range of 10kHz to 300GHz;
• carrier waves (or ‘Standing Waves’) are the high frequencies within the transmitting antenna, modulated by resonances between the mirrors to result in a pulse with spectral content of 1MHz to 100MHz.
• Pulse Repetition Frequency (PRF) range is 10-200kHz;
• power emitted is less than 5 milliwatts (mW). This is extremely low power and does not damage the solid material it propagates. The power consumption of the entire system is 250W;
• power supply to transmitter is 15v DC Li-Ion battery; batteries are rechargeable and recyclable;
• majority of raw materials used in the system are selected based on recyclability and reusability.
The depth of penetration of the transmitted ADR wave packets can be tuned to different transmission frequencies and energies (and two-way travel times) to suit different distance scales of propagation through solid objects. Adrok is keen to explore deep penetration applications for subsurface natural resource mapping at the geological scale as well as shallower penetration applications for close-range geotechnical imaging (for further explanations, refer to Doel & Stove, 2018; Doel et al., 2014). Depth is measured from time and velocity by ray tracing and Normal Move Out (NMO) computations, similar to the methods used in the seismic industry (Doel et al., 2014; Stove, G. D. C., Stove, G.C., and Robinson, M., 2018; Doel 2023).
In October 2022, we used the ADR Scanner to detect a reflection from the ground surface from 1100 m below the ground using reflection mode scans. The main difference with the previous study (Doel et al., 2014) is an increase of stacking by three orders of magnitude. Previously we stacked 500 traces, with our current set-up we stack almost 500,000 traces. Results show a clear reflection in the full stack near 21,500ns (Stove et al., 2023). The data gathered for this experiment is freely available at (Adrok, 2023).
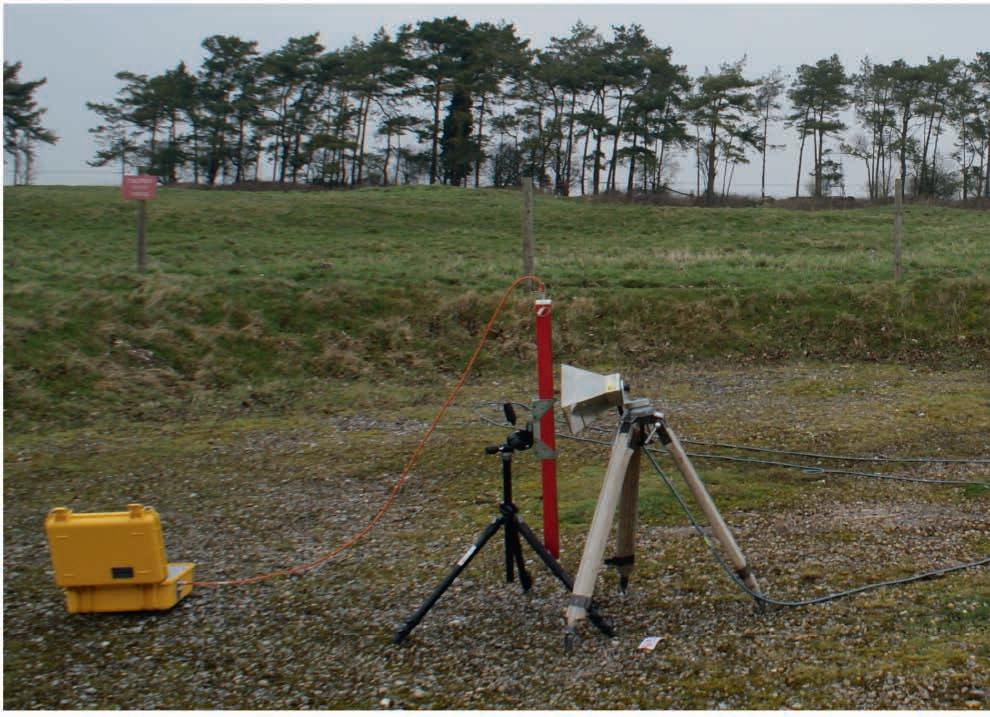
In January and June 2012, the ADR Scanner was independently assessed for signal strength and non-destructiveness by military personnel (Figure 3). E-field measurements were recorded in Volts per metre (V/m). H-field measurements were recorded in milliamps per metre (mA/m). The measurements showed that E-field readings were very weak at less than 1.0V/m at 0.1m to 2m ranges away from the Transmitting antenna. Similarly, their findings showed that the H-Field readings were very weak at less than 10.0 mA/m at 0.1m to 2m ranges away from the Adrok Scanner’s Transmitter. Based on the results of this assessment, E3A can conclude that none of the E-field, H-field or power flux density occupational reference levels were exceeded during the trial. Such low readings would not cause any harm to the ground or surrounding vegetation or fauna.
Northeast England survey (case study)
Adrok’s self-funded, inhouse research and development for subsurface geothermal heat identification in various onshore sites in the UK. There are two different types of geothermal energy; low enthalpy (low temperature) resources that can provide warm water for direct applications, and high enthalpy (high temperature) resources that can yield hot water that is capable of driving turbines and generating electricity (Gillespie et al., 2013).
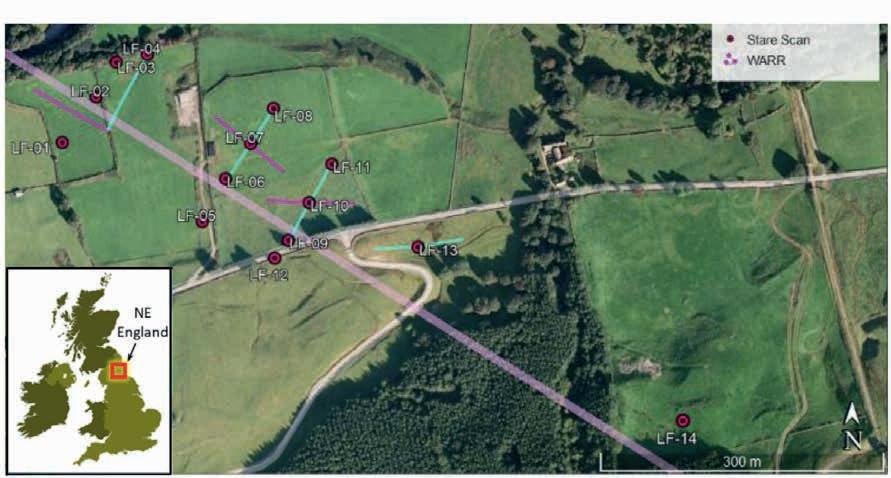
Within the sites selected in NE England (Figure 4), there are two different geological settings that have a large impact on the geothermal scenarios that may be encountered. Science Central and Bishop Auckland are both situated within successions of Carboniferous limestones and sandstones. This means that the geothermal setting is likely to be a deep aquifer related to heat transfer from the many granite batholiths in NE England. Drilling at Science Central has confirmed a high geothermal gradient of 39°C/km (13°C/km higher than the UK average), with a potential reservoir in the Fell Sandstone at 1418 m deep (Younger, 2016). Rookhope and Eastgate are both situated directly above the Weardale Granite, which drilling has pinpointed at depths of 390 m and 270 m, respectively (Manning et al, 2007). The Weardale Granite is expected to be a strong source of heat in the area, with post-drilling logging at Eastgate showing a temperature of 46.2°C at 995 m (10-15°C higher than the UK average). Significant volumes of hot saline water were also encountered during drilling at Eastgate, particularly at 411m depth (PB Power, 2005).
Adrok has developed the following statistical signal processing techniques to assist information extraction of the resonant signal returns obtained from their ADR sensors following transmission through soil, sediment and rock layers and reception by a matched bistatic ADR receiver. The resulting processed data suite is a specific set of logs which display signal frequency returns and a specific set of logs which display signal energy returns. To evaluate mathematically and statistically the exact nature of the signal oscillations through time and space (distance), Adrok has developed a series of precise ‘measures’ which examine the degree of reflectivity of the signal. E-Gamma is the basic measure of energy reflectivity. Mathematically it is described as follows:
E-Gamma = ((Emax –Emin)/ (Emax+Emin))
This means that the reflectivity of the signal energy is simply the ratio of the maximum signal difference parameters (maximum energy (%) minus minimum energy (%)) divided by the sum of the maximum signal energy (%) plus the minimum signal energy (%). The analogy is the E-Gamma, also called ‘modulation’ in the literature, of a photographic film in terms of grey level returns.
The E-Gamma results showed the most promising correlation to ground-truthing (by way of drill log results comparison) across all of the drill locations.
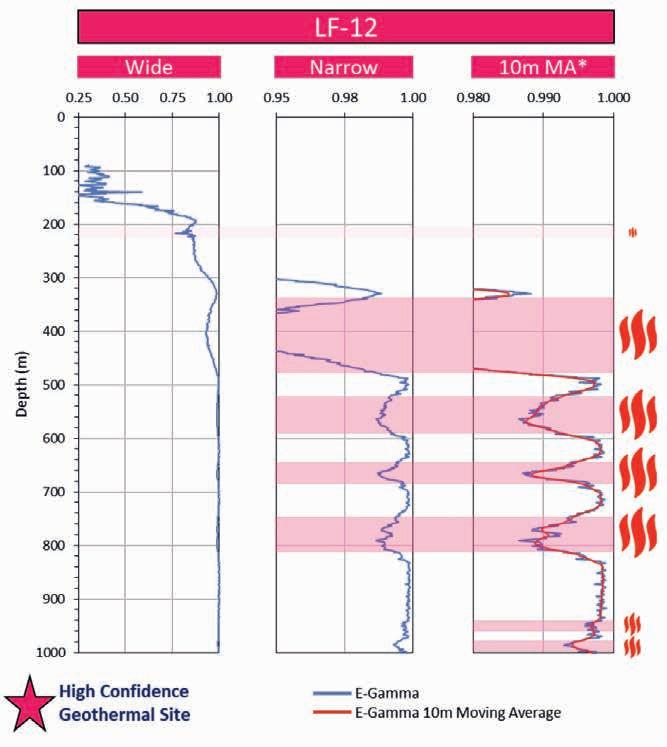
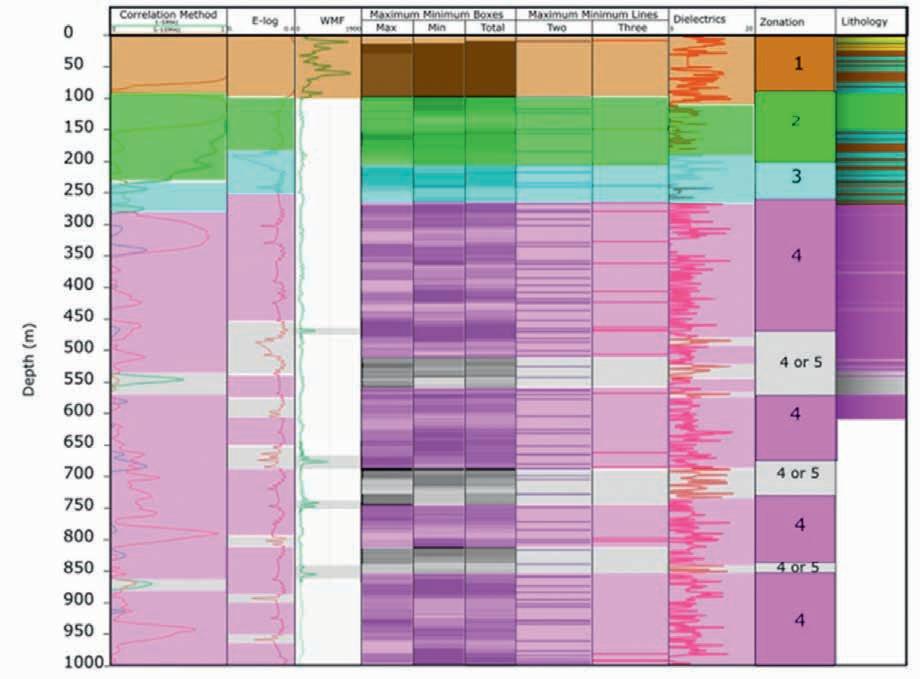
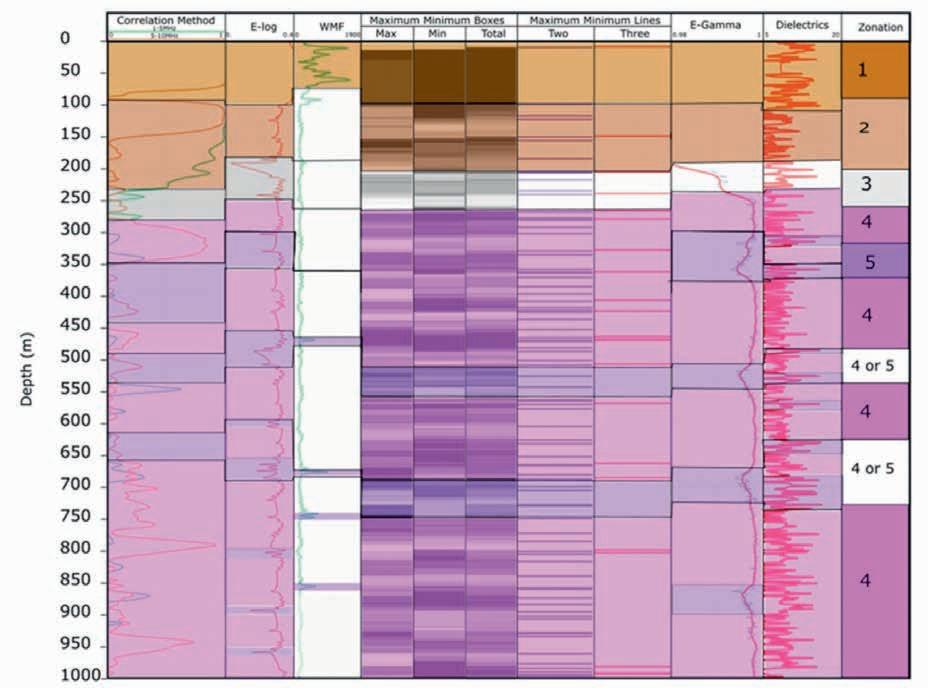
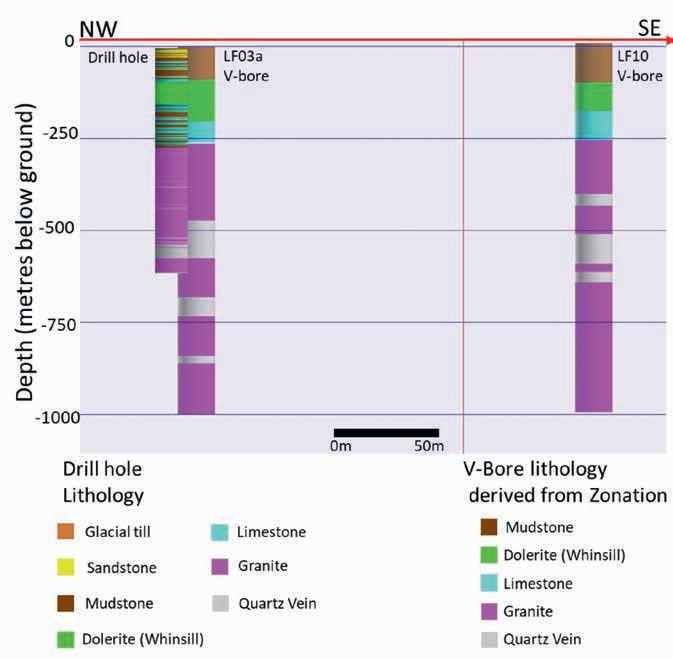
When the Eastgate 2 (EG2) sites’ E-Gamma’s are averaged, all three low E-Gamma anomalies are identified. The most significant low E-Gamma anomaly in EG2 is at a depth of 400490 m, within the Weardale Granite. This correlates well with drilling as a strong influx of warm, saline water was encountered at a depth of 411m (PB Power, 2005). The other two E-Gamma anomalies are located at depths of 530-610 m and 640-690 m. A new method has been developed in order to pinpoint the ‘hottest’ horizons with more precision and accuracy. The top 20 ‘troughs’ or low values of E-Gamma for each V-Bore (below the beam saturation) have been selected and plotted together with depth in order to gain greater insights into the areas that yield the most heat (Figure 5). The predicted lithological zones before drilling (Figure 6) and after drilling (Figure 7) by aligning multiple energy and frequency processed measurements side-by-side and highlighting similar zones, showed good confidence in the ADR Scanner. The lithology of the non-invasive V-bore is almost a digital twin of the physical drilled hole lithology interpretation. When the drill log data is plotted alongside the zonation results from LF03a and LF10, it is noted that the depths for the key lithological boundaries are consistent between the two V-bores
(Figure 8). Furthermore, the boundary between the limestone and the granite in the V-bores closely matches that of the drilled hole where it is seen at 268 m. At LF03a the boundary is seen at 263 m and at LF10 it is seen at 262.7 m. The quartz vein at 510 m at the drilled hole is also noted at similar depths in both V-bores. This geoscience survey generated a small carbon footprint of only 1.02 tCO2e.
Survey in Cornwall, England (case study)
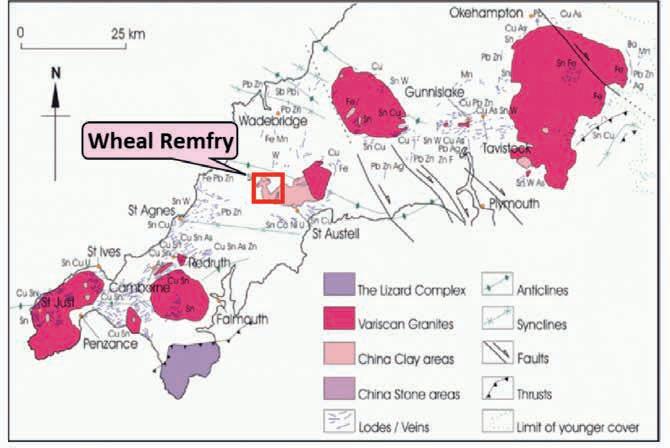
In Wheal Remfry (Figure 9), the granite has undergone kaolinisation due to a combination of hydrothermal and low-temperature weathering processes. The feldspars and micas within the granite are replaced and altered into kaolin, otherwise known as china clay. The degree of kaolinisation has a drastic effect on the required design of open pit slopes, with overall slope angles in highly kaolinised zones, which behave as soil-like material, being as low as 25 degrees whereas individual benches can be near vertical in poorly kaolinised granite in which failure is controlled by the discontinuities (joints).
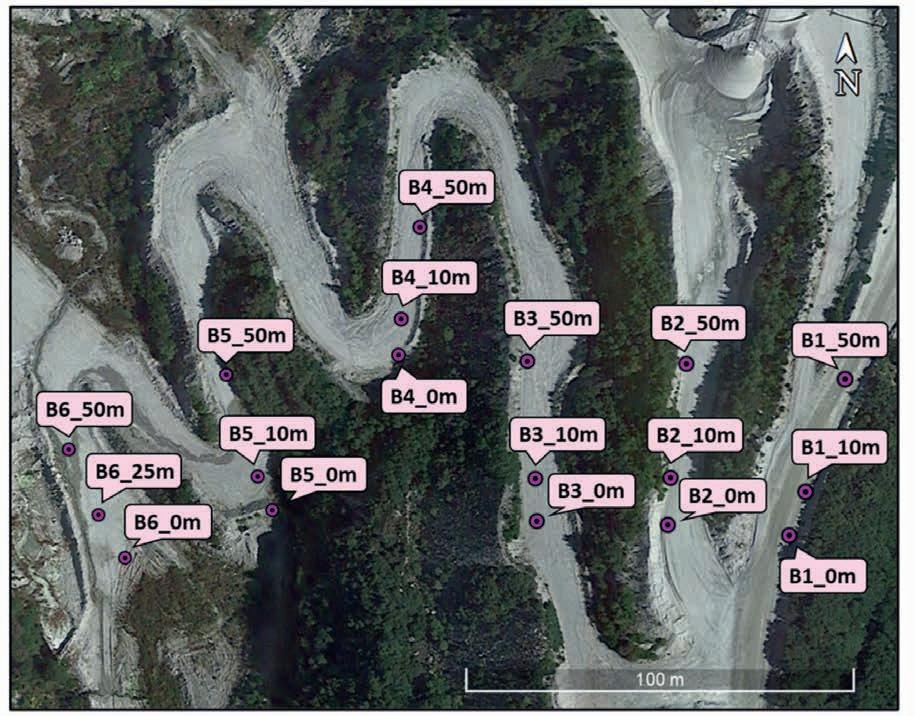
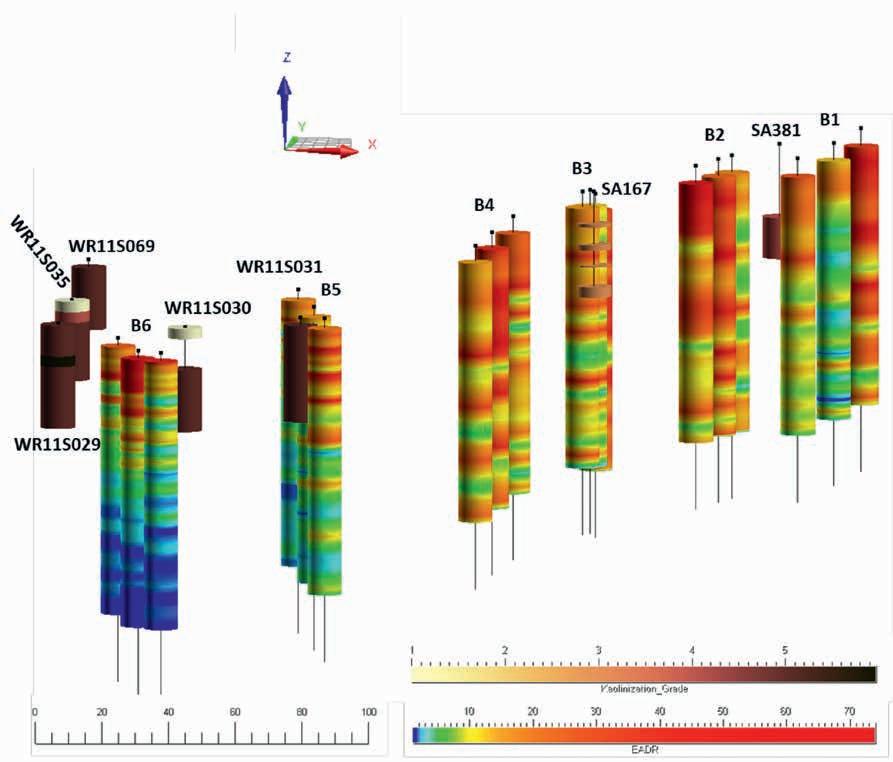
Adrok collected data in November 2014 at the Wheal Remfry open pit mine, in Cornwall, UK (Figure 10). The mine is located in between Newquay and St Austell. During the spring of 2021, the data was reprocessed and re-analysed. Interpretations of the kaolinisation grades have been made using Harmonic Analysis of the ADR signal. These harmonic signals have been interpolated into an East-West transect across the survey area, with the Frequency-Gamma harmonic chosen as Adrok’s best tool to image and track kaolinisation alteration within the area investigated. The ADR results and interpretations tie up well with the known kaolinisation grades from sonic drill logs. The general trend shows an increasing kaolinisation grade from site to site. This is highlighted well by the F-Gamma results in the Harmonics Transect. Training data is available from seven drillholes that are in close proximity to Adrok’s V-Bores. The final results are able to provide a very useful 2D view of the alteration (Figure 11). By compiling and intersecting other transects, Adrok could work to build a 3D picture of the kaolinisation.
The kaolinisation grade is displayed here from 1 to 6, and was determined using Sonic drill logs.
The lowest Kaolinisation grade is grade 3 in SA167, near B3. This increases towards B5 and B6 where the kaolinisation grades are mostly grade 5, with an occurrence of grade 6 kaolinisation in WR11S029.
Kaolinisation also increases slightly from grade 3 in SA167 (B3) to grade 4 in SA381 (B1).
The changes in kaolinisation grade in the sonic drill logs shows similar trends to what is seen in many of the ADR Harmonics logs. E-ADR is at its highest in B2, B3 and B3 (where kaolinisation grade is low), and decreases significantly towards B5 and B6 (where kaolinisation grade is very high). E-ADR also decreases from B2 to B1 (where kaolinisation grade increases). This would suggest that E-ADR has an inverse relationship with kaolinisation grade.
Kaolinisation grade may have an inverse relationship with E-ADR. Kaolinisation may also have a linear relationship with E-Gamma and F-Gamma. The decreases or increases in harmonics values do not necessarily directly correlate with the kaolinisation grades in the first 30 m of the sonic drill logs. The patterns are seen deeper in the V-Bores, where the harmonics have a faster increase/decrease in the sites that host higher grades of kaolinisation. This may be due to how the geophysical characteristics of the higher kaolinisation grades affect the ADR signal with depth.
This survey generated a carbon footprint of only 1.23 tCO2e.
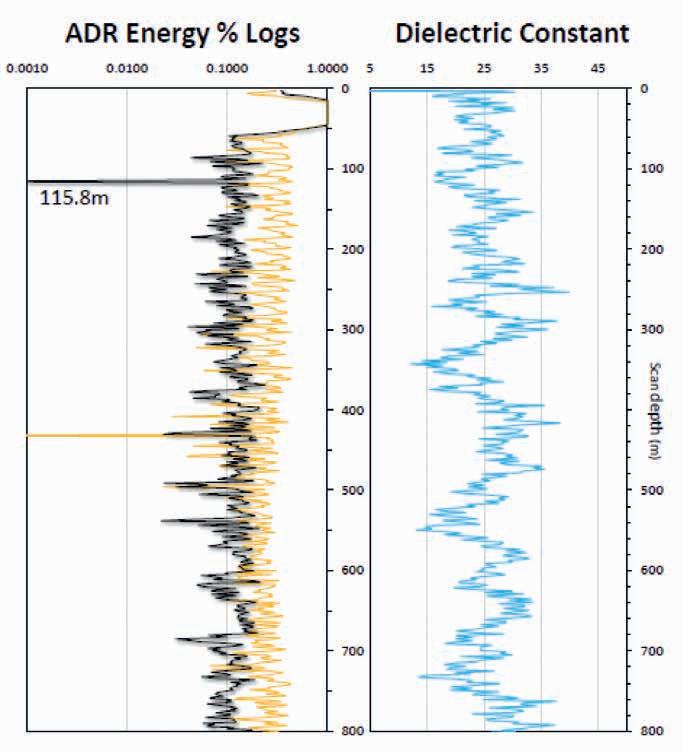
In November 2019, a pre-drilling exploratory ADR survey was performed in nearby United Downs for Cornish Lithium. In April 2020 the diamond drill hole GWDD-002 was drilled by Cornish Lithium to test the potential for lithium in brine at United Downs, within the historic Gwennap copper and tin mining district and discovered new zones of copper/tin mineralisation highlighting the regional potential for new discoveries. The diamond drill hole GWDD-002 intersected semi-massive sulphide mineralisation between 90.60m and 105.29m downhole depth. The ADR scan, which was carried out at the same collar location and was finalised before the drilling had been completed, measured a strong anomaly in the returned energy signal at 115.8 m (Figure 12).
Conclusions
Adrok’s EM technology is an environmentally friendly non-destructive way to see below the ground surface for geology. The method of deployment, on the ground, as opposed to airborne or downhole, means that there are zero emissions. The only carbon footprint is created by the transportation of the two-person survey crew and equipment to and from the survey location (ideally not by aeroplane, preferably by car or train) and a small amount of carbon generation from computer data processors.
Regarding the Northern England case study, the interpreted results show that the technology can identify the highest temperatures below the ground and prognose their depths with reasonable accuracy. Moreover, the technology demonstrates repeatability in measurements. The field measurements show encouraging potential for the technology to be applied as a pre-drilling tool in onshore geothermal plays around the world, given the ease of survey deployment and low environmental footprint.
The two southern England case studies also demonstrated the ADR technology’s non-destructive and environmentally friendly methodology. The results were ground-truthed against drill logs. No ground or vegetation was damaged in the making of these projects.
Acknowledgements
We would like to thank Imerys for granting access to the Wheal Remfry mine sites and Cornish Lithium for access to the United Downs sites in southern England, and Northern Lithium for granting access to the sites in Northern England.
References
Adrok, [2023]. https://www.adrokgroup.com/data.
Doel, van den, K., Jansen, J., Robinson, M., Stove, G.C. and Stove, G.D.C. [2014]. Ground penetrating abilities of broadband pulsed radar in the 1-70MHz range, proc. SEG, Denver.
Doel, van den, K., and Stove, G.D.C. [2018]. Modelling and Simulation of Low Frequency Subsurface Radar Imaging in Permafrost: Computer Science and Information Technology, 6(3), 40-45.
Doel, van den, K., Robinson, M., Stove, C. and Stove, G. [2020]. Subsurface Temperature Measurement Using Electromagnetic Waves and Machine Learning for Enhanced Oil Recovery, Conference Proceedings, 82nd EAGE Annual Conference & Exhibition, Volume 2020, 1-5.
Doel, van den, K. [2023]. Propagation and attenuation of EM waves in complex media, https://www.adrokgroup.com/technology/how-it-works.
Dunham, K., Beer, K.E., Ellis, R.A., Gallagher, M.J., Nutt, M.J.C. and Webb, B.C. [1978]. Mineral Deposits of Europe Volume 1: Northwest Europe, The Institution of Mining and Metallurgy, The Mineralogical Society, London, 263-317.
Gillespie, M.R., Crane, E.J. and Barron, H.F. [2013]. Study into the potential for deep geothermal energy in Scotland. www.scotland. gov.uk/Resource/0043/00437996. pdf: AECOM Energy/The Scottish Government.
Manning, D.A.C., Younger, P.L., Smith, F.W., Jones, J.M., Dufton, D.J. and Diskin, S. [2007].
Deep geothermal exploration well at Eastgate, Weardale, UK: a novel exploration concept for low-enthalpy resources. Journal of the Geological Society, 164, 371-382.
PB Power and University of Newcastle, [2005]. Eastgate Geothermal Exploration Borehole, Final Report. British Geological Survey, NY93NW97.
Richards, S. and Stove, G. [2020]. Progress towards the development of a sulphide targeting tool for mineral exploration under cover, EAGE Mineral Exploration Symposium, Sep 2020, Volume 2020, 1-3, https://doi.org/10.3997/2214-4609.202089013.
Stove, G. [2018]. Extending the reach of radio waves for subsurface water detection, CSEG Recorder, 43(6), 26-30.
Stove, G.D.C., Stove, G.C. and Robinson, M. [2018]. Radiowave method for monitoring steam injection for Enhanced Oil Recovery (EOR) and for finding sources of geothermal heat, Geothermal Resources Council (GRC) Transactions Volume 42, 1557-1567, ISSN: 01935933; ISBN: 0-934412-23-5.
Stove, G., Doel, van den, K., Edwards, T.M., Paling, S.M. and Scovell, P.R. [2023]. Deep detection range test for a low frequency subsurface radar system (with reviewable data available online), Conference Proceedings, 84th EAGE Annual 2023.
Younger, P.L., Manning, D.A.C., Millward, D., Busby, J.P., Jones, C.R.C. and Gluyas, J.G. [2016]. Geothermal exploration in the Fell Sandstone Formation (Mississippian) beneath the city centre of Newcastle upon Tyne, UK: the Newcastle Science Central deep geothermal borehole, Quarterly Journal of Engineering Geology and Hydrogeology, 49(4), 350-363.


