13 minute read
Permanent 3D data acquisition of geotechnical structures using web-based application of terrestrial LiDAR — chances and risks from an engineering geodetic point of view


Daniel Czerwonka-Schröder1* and Karsten Zimmermann1 present the integration of a LiDAR project into a web-based platform using an example from Austria
Summary
Advertisement
As part of the research project i²MON – ‘Integrated Impact MONitoring for the detection of ground and surface displacements caused by coal mining’ funded by HORIZON 2020 through the RFCS (Research Fund for Coal and Steel), the leading author, in collaboration with various European institutions, is working on the development of an integrated monitoring service for the identification and assessment of ground and slope movements associated with coalmining. The focus is on the correct integration (reliability, accuracy and integrity) of a long-range laser scanner into a continuous web-based monitoring system from an engineering geodetic point of view. The objective of this work is the development of an integrated monitoring service for the identification and evaluation of ground and slope movements in the context of coalmining, the prevention of natural hazards and protection of infrastructure. The focus is on the integration of a long-range laser scanner (1) into a continuous web-based monitoring system and (2) from an engineering geodetic point of view. In the Vals Valley in Tyrol, a permanently installed RIEGL laser scanner was successfully operated and web-based in the area of a rockfall in the summer of 2020 and 2021. The data was visualised in near real-time on a monitoring platform. This paper will describe the practical benefits of this installation. In addition to the potential of automatic data acquisition, possibilities for multi-temporal analysis with regard to spatio-temporal changes will be discussed.
Introduction
Analysis of mass movements and of geomorphic processes in general are a key subject in the prevention of natural hazards and protection of infrastructure (Bremer et al., 2019). Such events are induced by various environmental processes as drivers while their occurrence is causally linked to climate change, therefore posing an increasing risk in terms of magnitude and frequency (Huggel et al., 2012). In the context of climate change and the expansion of areas of urban settlement, e.g. in Alpine regions, the demand for high-quality, i.e. spatially and detailed datasets as well as the integration of risk management as an early warning system is increasing.
Basic procedures for measuring geometric changes have been established for decades without being a special challenge of laser scanning. A monitoring program must be individually adapted to the observed object to significantly detect geometric changes. It must be taken into account that spatial discretisation of the object must be done according to the expected displacements. Additionally, the temporal discretisation must be considered. Thus, no significant displacements may occur during a measurement epoch and no movements may remain unobserved due to the interval between two measurements. Both in the past and nowadays, manual, campaign-by-campaign measurements are preferred for certain monitoring tasks. However, this is a disadvantage if I do not know exactly which specific processes I am looking for.
Monitoring high-mountain areas is difficult and dangerous. Remote sensing techniques are preferable to achieve adequate spatial and temporal coverage (Hermle et al., 2022). The technical advancement of terrestrial laser scanning (TLS) towards communication-capable, programmable multi-sensor systems, a compact and robust design as well as economically attractive systems allow permanent laser scanning (PLS) installations in areas of interest and their integration into near real time early warning systems. Major advantages of PLS compared to measurements at selected points in time are time series which contain morphometric measures at high temporal resolution and can enable a deeper understanding of Earth surface processes (Eitel et al., 2016). With regard to the application of PLS within an early warning system, false alarms and misinterpretations of the results due to low levels of detection (LOD) or systematic deviations must be avoided. The risk of a poorly designed system may yield in a lack of acceptance by stakeholders or in incorrectly derived conclusions due to the influence of systematic errors. In this context, existing challenges in the engineering geodetic procedure of a deformation analysis apply, have to be adapted, and new restrictions become apparent in the long measurement series. Past research on point cloud
* Corresponding author, E-mail: daniel.schroeder@dmt-group.com
DOI: 10.3997/1365-2397.fb2023065
Data Sensor Acquisition interval Campaign
3D point cloud of rockfall area
3D point cloud of each prism
3D point cloud of rockfall area
3D point cloud of each prism
RIEGL VZ-2000i (MODEL A)
RIEGL VZ-2000i (MODEL B)
Meas. prog. interval of 120 min registration and atmospheric influences often only used data limited to selected points in time and in limited periods, from a few hours to a few days. The corresponding results, conclusions and recommendations derived from them can only be generalised to a limited extent. In this contribution, I present data integration of a permanent TLS installation that took place in 2020 and 2021 in Vals (Tyrol, Austria). In addition to the technical requirements for the sensor technology itself, the conditions for data integration, data storage and finally visualisation must be met within a holistic risk management system. In this context, the laser scanner complements existing sensor technology in a targeted manner and is not to be understood as a substitute.
• 1 areal scan (15 min)
• 5 prism scans (Every 21 minutes) M1
Meas. prog. interval of 180 min
• 1 areal scan (15 min)
• 2 prism scans (Every hour)
M3
In this paper I present the integration into a web-based platform using an example from Austria.
Test Site – Vals Valley in Tyrol (Austria)
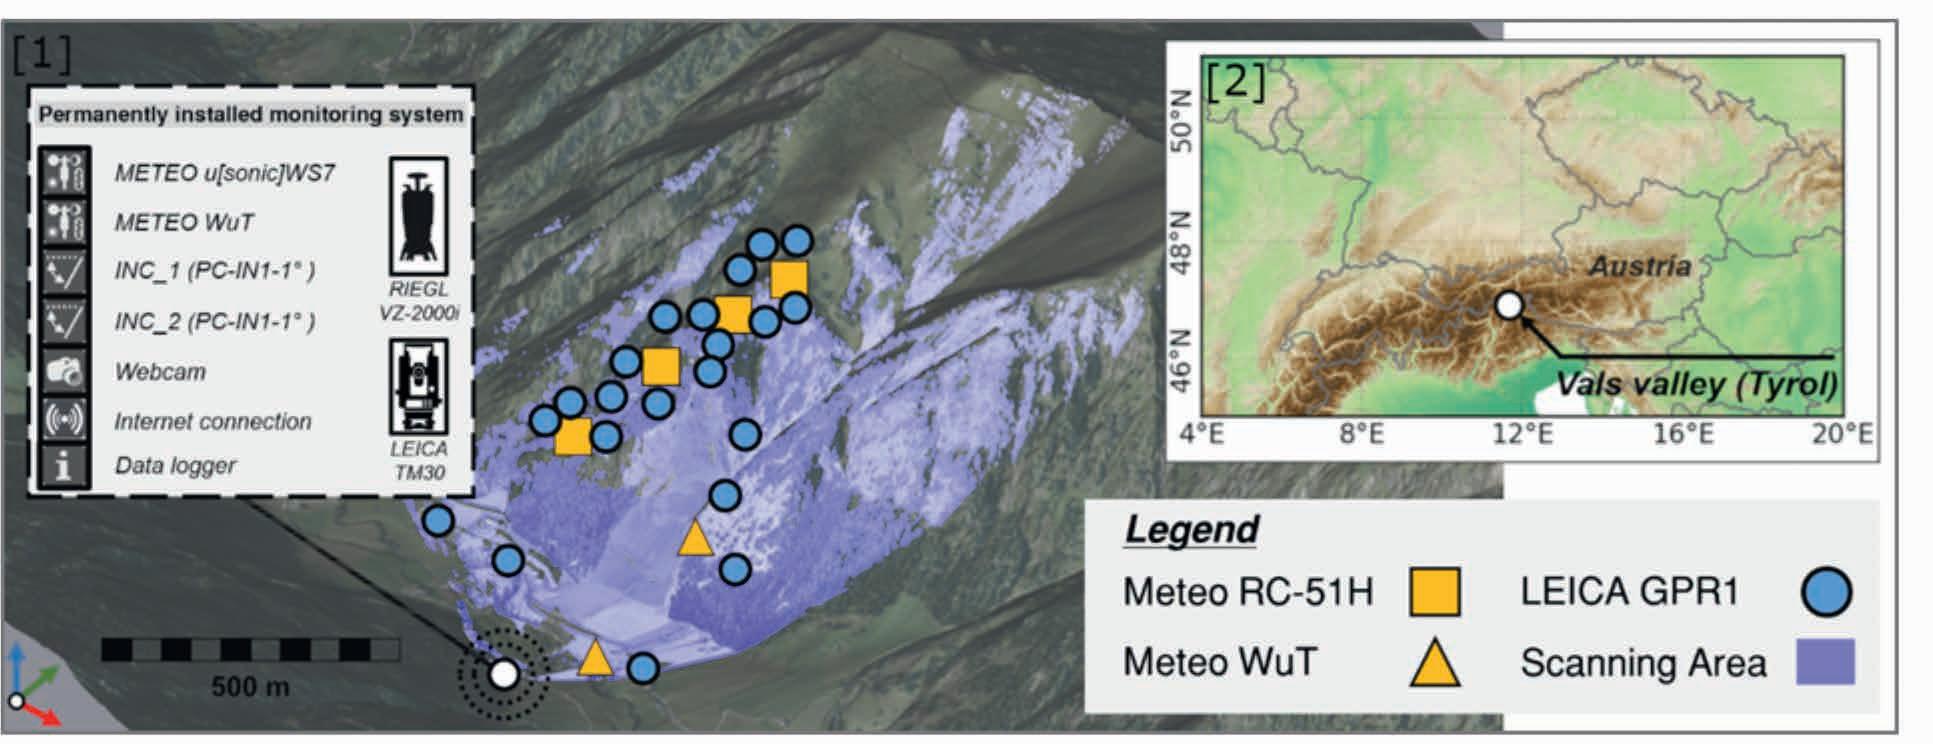
The test site is the Vals Valley in Tyrol (Austria). A rockfall occurred in this area on 24 December 2017. Though causing neither human casualties nor significant damage to buildings, a road located directly below the rockfall slope was covered with 8 m of debris and a total volume of 116,000 m3 of rock was relocated (Hartl, 2019). The local authorities set up a geodetic monitoring system, consisting of a total station with 21 corresponding prisms (Model: LEICA GPR1) and geotechnical sensors (e.g. extensom- eters) distributed on the mountain slope. As no significant rock movements were detected in the acquired data, the infrastructure of the existing monitoring system was made available for research. Point cloud data was recorded during three campaigns using two different RIEGL VZ-2000i laser scanners (referred to as Model A and B) permanently installed on a survey pillar in a shelter on the opposite slope about 800 m from the area affected by the rockfall.
• Measuring setup 1 (M1): 13 August 2020 to 08 September 2020 – bi-hourly
• Measuring setup 2 (M2): 10 May 2021 to 17 June 2021 –tri-hourly
• Measuring setup 3 (M3): 01 August 2021 to 17 December 2021 – tri-hourly
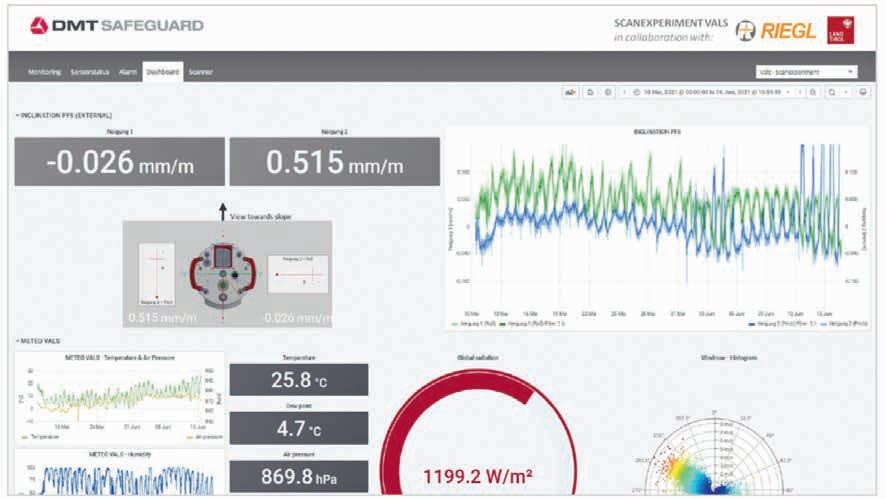
The dataset was designed for various research and development activities regarding the deployment of long-range terrestrial laser scanners within a remotely controlled, web-based monitoring system from an engineering geodetic perspective. In addition to the laser scanner, a total station (LEICA TM30), inclination sensors on the survey pillars where the scanner was mounted and aligned to the scanner-own coordinate system (PC-IN 1-1° by Position Control) and various meteorological sensors were used in the shelter and the area of the rockfall.
The additional measurements are used to verify diurnal and seasonal systematic effects on the results. Furthermore, the installed prisms of the total station monitoring as well as the functionality of the RIEGL scanners to detect these prisms as corresponding measuring points in the multitemporal scan data support different methodical approaches to verify these effects. During PLS acquisition, a high-resolution scan of the area was carried out with a resolution of 15 mdeg in azimuth and elevation at a pulse repetition rate of 50 kHz every two hours (M1) and every three hours (M2 and M3), respectively. As outlined in Table 1, fine-resolution scans of the prisms were acquired in between regular scanning. Due to logistical constraints, the more accurate web thermo-hygrobarometers by WuT were only installed in the shelter, at the valley basin and in the lower part of the rockfall-affected area. Elitech temperature loggers that require no additional power supply were installed at the top of the rockslide so that no additional power supply is needed in these areas. A different scanning instrument, but of the same type, was used for the M2 and M3 measurements.
System integration
For almost five years, a research and development field has been concerned with the further development of the a web-based monitoring software. The focus of the project is the integration of area-based sensor technology and is intended to provide the mining sector, government, citizens and all stakeholders affected by past and present mining activities with a range of advanced monitoring, measurement and analysis tools, for example to determine the impact of mining in terms of ground and slope movements and to support them with important information on the condition of the ground surface in mining and post-mining areas (Schröderand and Klonowski, 2019 and Schröder et al., 2020). One marketable solution that has emerged from this project is a LiDAR add-on for the DMT Safeguard web-based monitoring platform. This involves the integration of a permanently installed terrestrial laser scanner that captures data fully automatically, transfers it to a central server, and generates graphical representations. A reliable data acquisition service is integrated and 3D data can be acquired fully automatically, at specified time intervals, and presented in a web-based display. In this research project, data acquisition, data communication and data management have been successfully implemented. Also, first tools are on the market to provide these data visually and in the form of targeted reports to relevant stakeholders. Initial implementations in Tyrol (Austria) and in an open-pit mine in Germany demonstrate the successful implementation of this concept.
Technical description DMT Safeguard
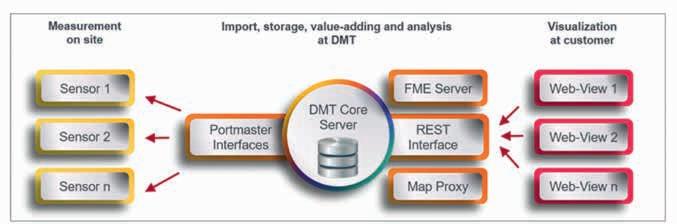
DMT Safeguard is a web-based data management and geoinformation system (IoT platform) for all types of monitoring tasks in the construction industry, mining and for infrastructure projects, with which geotechnical monitoring data can be easily collected in a common database, displayed online, analysed and archived. As an integral part of your professional risk management, it enables fast and informed decisions for any phase within your projects. The software enables the integration of data and sensors independent of the type, format, manufacturer and source. Through automated data evaluation, alarm messages, e.g. in case of detected ground movement, can be generated and submitted to the user. The monitoring platform will be set up in a virtual UNIX environment running at the company’s data centres.
The technologies used are:
• Visualisation, configuration: HTML5, JavaScript
• REST-Interface: JSON, OData, ASP.NET Web API 2, RESTier
• Rendering, Reporting: FME Server, OxyPlot, DocX, NPOI, C#
• Used database systems: Microsoft SQL Server, Redis
• OS: Microsoft Windows Server, Ubuntu Linux LTS
• Data formats: CSV, SEG2, miniSEED
• Data sources: FILE, FTP, Email, SQL Server, ODBC
• Further Frameworks: Ext JS, Openlayers, Cesium JS, ObsPy, R The web-application framework is based on two core components – backend and frontend, explained in the next chapters.
System backend and user frontend
The WebGIS-Application is developed as a client framework for spatial data infrastructures. The software is implemented in JavaScript and Node.js and built upon Ext JS and OpenLayers.
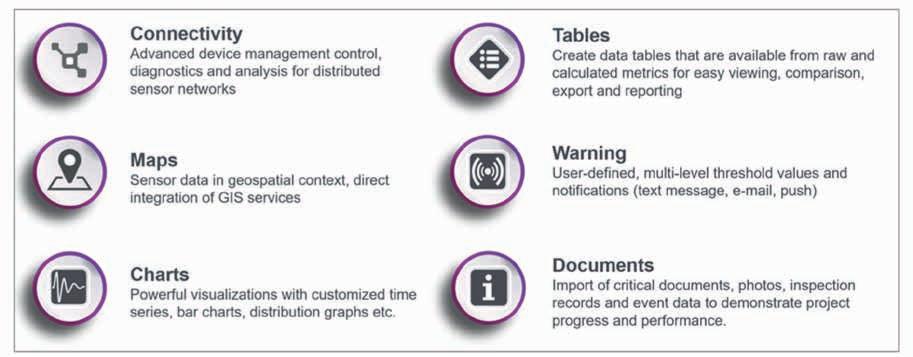
The following Figure gives an overview of the general system functions. First, and already mentioned, is the ability to connect to sensors in the field. Map functionality is integrated to provide all sensor data and information in a geospatial context. The system is therefore directly connected to a GIS system. The charts feature is important to visualise sensor data with customisable time series plots, bar charts, distribution graphs etc. The system enables data to be exported to the user’s PC – for example tables of raw and calculated metrics for further local analysis. A key feature is the alert capability. For this each sensor data channel can be set up with user-defined multi-level threshold values. If threshold values are exceeded, the system automatically sends out alert messages to the user via email or text notification. Furthermore, project-relevant documents (e.g. photos, inspection records) can be imported and distributed via the system in order to demonstrate project progress and performance.
Technical description of the LIDAR integration
With regard to the requirements of a state-of-the-art monitoring system, the integration of a permanently installed laser scanner is particularly suitable for obtaining three-dimensional information on a monitored object (e.g. open pit mine or tailing dam). In particular, our preferred solution is the VZ-2000i laser scanner from the Austrian company RIEGL. With this scanner objects can be measured contactless with a very high accuracy up to a range of 2500 m. The laser distance measurement is carried out by means of high-precision time of flight measurement. An eye-safe measuring system and a laser specified to Class 1 enable automatic, continuous measurement without any risk to people in the monitoring area or inside the mine. For integration into a monitoring platform, interfaces are provided that allow the scanner to be controlled and integrated via external software as well as via the Python programming language. The scanner’s functionality can thus be significantly extended. The scanner can be controlled remotely via cloud connectivity, enabling a contin- uous stream of data. With the solution developed, the measured values can be evaluated and visualised.
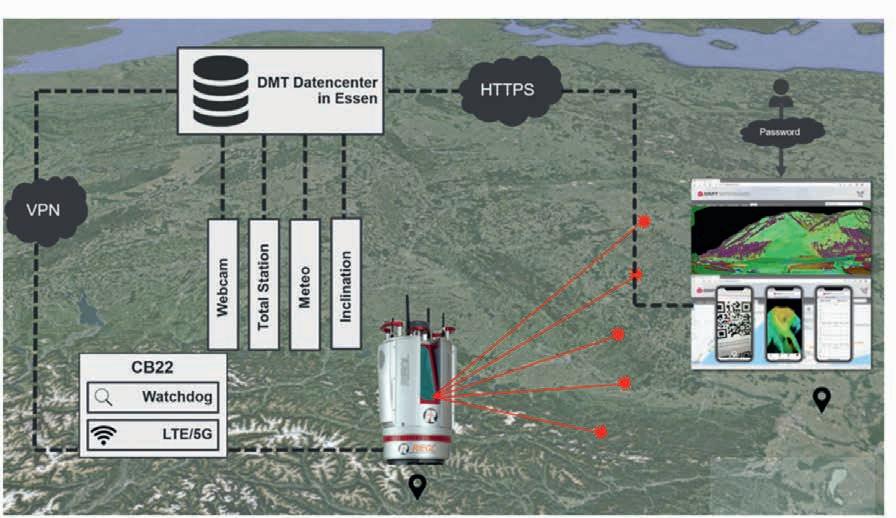
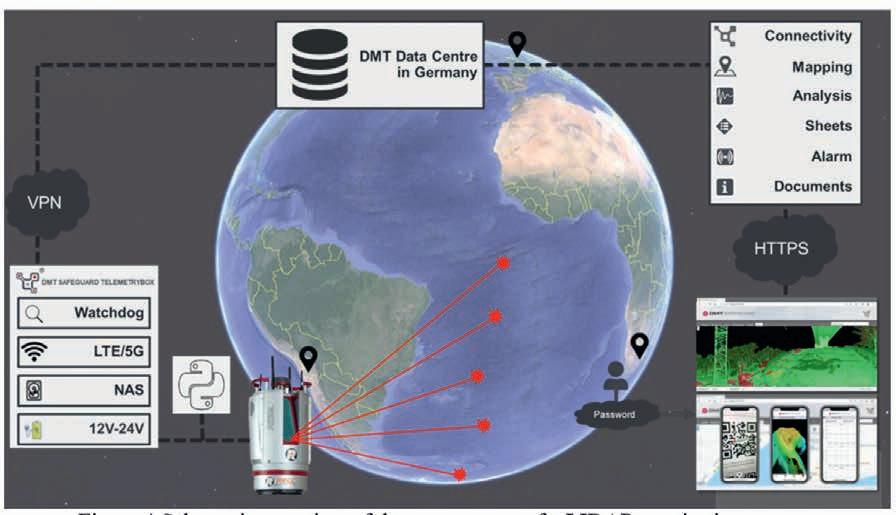
The Figure shows the system schematically. The scanner can be used worldwide and is available to many different users within a project. Nowadays, LTE, 5G or new technologies such as Starlink are available for internet connection in many locations. The scanner is equipped with a communication box. The box includes a watchdog that monitors both the internet connection and the operation of the scanner, a router for the data connection, a NAS for redundant data storage, and a power supply that can be expanded to include backup power if needed. The scanner is connected to the data centre in Germany via a secure VPN connection (IPSec). Experts initialise the system and monitor its operation. Additional VPN connections can be set up individually during project planning and configuration, so that integration into the network of a mine operator, for example, is possible. After initialisation, the scanner is able to operate and monitor automatically, or scans can be started manually via the web application. In addition, scans can be triggered by additional sensors (e.g., vibration sensors) so that, for example, a dam is scanned in near real time after an earthquake.
This allows decision makers, such as the mine operator, local civil and relief organisations or the construction manager, to quickly obtain relevant information. Using the LiDAR module, the measurement data is automatically converted into relevant information and made available to the user or decision-makers worldwide via a password-protected web platform. To ensure the real-time capability of the system, the data is displayed using a monitoring app developed by RIEGL. The app is directly integrated and the customer does not need any additional software.
Multiple users can work simultaneously in the platform, enabling collaborative teamwork at any time and in real time. In addition to the scanner, the full functionality of the web-based platform can be used and, for example, total stations, GNSS data or other geotechnical measurements can be integrated. The following is a full-featured project example from Austria. A demo access is activated for you.
Case study: LiDAR integration
The focus of the DMT Safeguard LIDAR is the integration of area-based sensor technology and is intended to provide all stakeholders with a range of advanced monitoring, measurement and analysis tools, for example, to determine the impact of a rockfall in terms of ground and slope movements and to support them with important information on the condition of the ground surface.
In this section we demonstrate in detail the data flow from the scanner to the platform. As described above, the scanner is set up and installed in the shelter on a pillar in the Vals Valley in Austria. The communication box is connected to the scanner via LAN. The box provides an appropriate power supply and internet connectivity – in the Vals Valley, this is based on an LTE connection.
The data connection to the company’s servers is realised via a secure VPN connection (IPSec), so that the scanner itself is initially only available in the internal network of the company and to selected users (e.g. HQ of RIEGL or customer networks). The scanner can be used worldwide and is available to many different users within a project.
Experts initialise the system and monitor its operation. After initialisation, the scanner is able to operate and monitor automatically, or scans can be started manually via the web application.
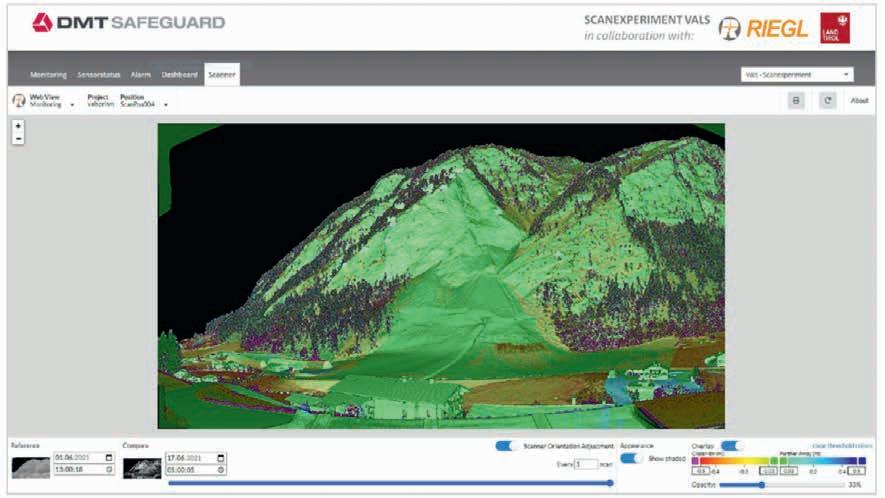
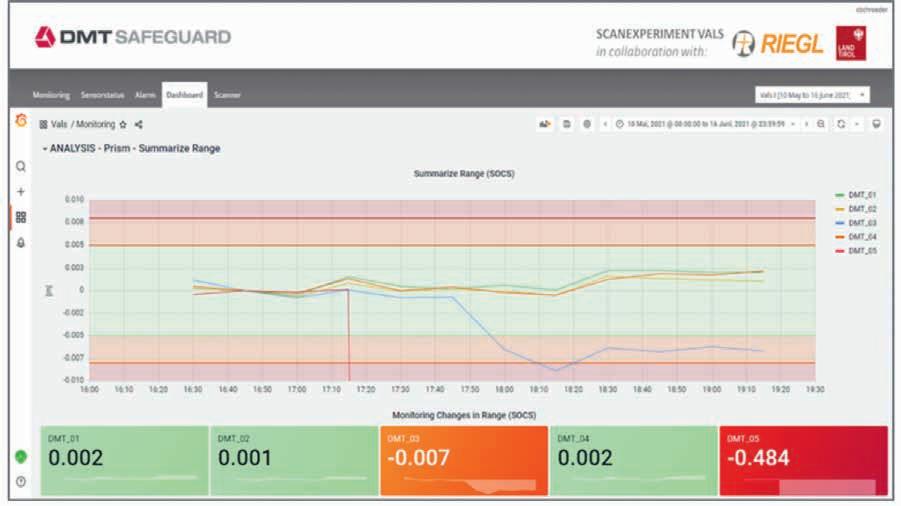
The initialisation of the measuring program includes the preparation of the RIEGL monitoring workflow, so that the monitoring app as well as the scheduler app are parameterised accordingly on the scanner. As a first result, the data of the monitoring app and the time series of the prism detection are available on the scanner as CSV. In the next step, the data is synchronised to the servers in Essen using RSYNC via the secure data connection. The RIEGL Monitoring App is integrated into the interface and is thus available to users from anywhere in the world via password-protected login. There is no necessity for a separate link to the scanner. Dashboard functionality enables intuitive as well as interactive visualisation of the time series from prism detection. In addition, all sensors can be displayed in spatial context on a map. The software allows decision makers to quickly obtain relevant information. Multiple users can work simultaneously in the platform, enabling collaborative teamwork at any time and in real time. In Vals we have extended the project in Safeguard to increase the performance for your project.
With the platform a precise integration of RIEGL laser scanners into a web-based platform is available. In addition to the functionalities presented here, the system can be expanded as desired by experts. The individual customisation options allow additional sensors to be integrated directly on site or external data sources to be integrated as well. GIS functionalities allow the integration of maps in order to display the most important data. Real-time documentation options, document management, an automated real-time assistance system including sophisticated reporting, complete the service for you.
Conclusion
Data acquisition and its automation is no longer the bottleneck. Data management and initial visualisations also no longer present any problems. It is much more important to be able to qualitatively evaluate the acquired data in the engineering geodetic sense and to refine the data into meaningful information. There is still a need for research and development in the individual fields of point cloud processing within a monitoring system with a focus on classification, segmentation and final quality assessment from an engineering geodetic point of view.
References
Bremer, M., Zieher, T., Pfeiffer, J., Petrini-Monteferri, F. and Wichmann, V. [2019]. Monitoring der Großhangbewegung Reissenschuh (Schmirntal, Tirol) mit TLS und UAV-basiertem Laserscanning Hanke, K.; Weinold, 321-33.
Eitel, J.U., Höfle, B., Vierling, L.A., Abellán, A., Asner, G.P., Deems, J.S. and Vierling, K.T. [2016]. Beyond 3-D: The new spectrum of lidar applications for earth and ecological sciences. Remote Sensing of Environment, 186, 372-392.
Hartl, S. [2019]. Analyse der Felslawinen Frank Slide und Vals mit Hilfe des Computercodes r. avaflow (Doctoral dissertation, Wien).
Huggel, C., Clague, J.J. and Korup, O. [2012]. Is climate change responsible for changing landslide activity in high mountains?. Earth Surface Processes and Landforms, 37(1), 77-91.
Hermle, D., Gaeta, M., Krautblatter, M., Mazzanti, P. and Keuschnig, M. [2022]. Performance Testing of Optical Flow Time Series Analyses
Based on a Fast, High-Alpine Landslide. Remote Sensing, 14(3), 455.
Schröder, D. and Klonowski, J. [2019]. i²mon – integrated monitoring for the detection of ground and surface displacements caused by coal mining. Proceedings of the 4th Joint International Symposium on Deformation Monitoring (JISDM 2019), 15-17 May 2019, Athens, Greece.
Schröder, D., Zimmermann, K., Bock, S. and Klonowski, J. [2020]. i²MON: development of an integrated monitoring system for the detection of ground and surface displacements caused by coal mining. 353-366. 10.36487/ACG_repo/2025_19.