13 minute read
P- and S-wave seismic imaging of a complex aquifer system in Kurikka, western Finland


Michał Malinowski1*, Niko Putkinen1, Bojan Brodic1, Viveka Laakso1, Elina Koskela1, Suvi Heinonen1, Jon Engström1 and Markku Paananen1 demonstrate that seismic data can be considered a great asset in 3D modelling of the buried valleys’ aquifer systems, reducing uncertainties introduced by conceptual models based on borehole data.
Abstract
Advertisement
The Kurikka area in western Finland is an example of the complex groundwater system with an important connection to the fractured bedrock. The leaky confined aquifer system developed in the glacial sediments overlying the bedrock. Location, dimension, and connectivity of bedrock deformation zones constitute a big uncertainty in the 3D geological model. To image sediments and bedrock structures, we acquired 2D multicomponent seismic data using a nodal system and planted 3-C geophones as receivers and an electrically driven seismic vibrator (E-vib) operating in both the P- and S-wave mode as a source. Acquired 6-C data confirm the benefits and complementary nature of the P- and S-wave imaging in such conditions. Seismic interpretation was supported by the P-wave velocity models obtained from first-arrival tomography. Seismic data enabled us to map the bedrock surface with more details, determine the width of the bedrock fracture zones and the thickness of the weathered bedrock zone. New data also prove their utility in mapping glacial sediments, providing both the structural control and lithology distribution through the changes in P-wave velocity. We demonstrate that seismic data can be considered a great asset in 3D modelling of the buried valley’s aquifer system, reducing uncertainties introduced by conceptual models based on borehole data.
Introduction
Reflection seismology is indispensable in evaluating depth, lateral extent, and heterogeneity of the shallow aquifers related to e.g., glacial sediments. Different source types and receiver configurations are used in such studies, with a recent predominance of landstreamers and P- and S-wave Vibroseis sources (e.g., Pugin et al. 2009). Some earlier efforts to use seismic reflection in groundwater studies in Finland were reported by Okkonen and Moisio (2015), but the full potential of the method was demonstrated using landstreamer-type acquisition (Maries et al. 2017, Brodic et al. 2018, Ahokangas et al. 2020). In particular, Ahokangas et al. (2020) show the benefits of using both P- and S-wave source acquisition for studying internal structure of an esker aiming at evaluating the groundwater potential and planning infiltration wells for a managed aquifer recharge (MAR)
1 Geological Survey of Finland
* Corresponding author, E-mail: michal.malinowski@gtk.fi
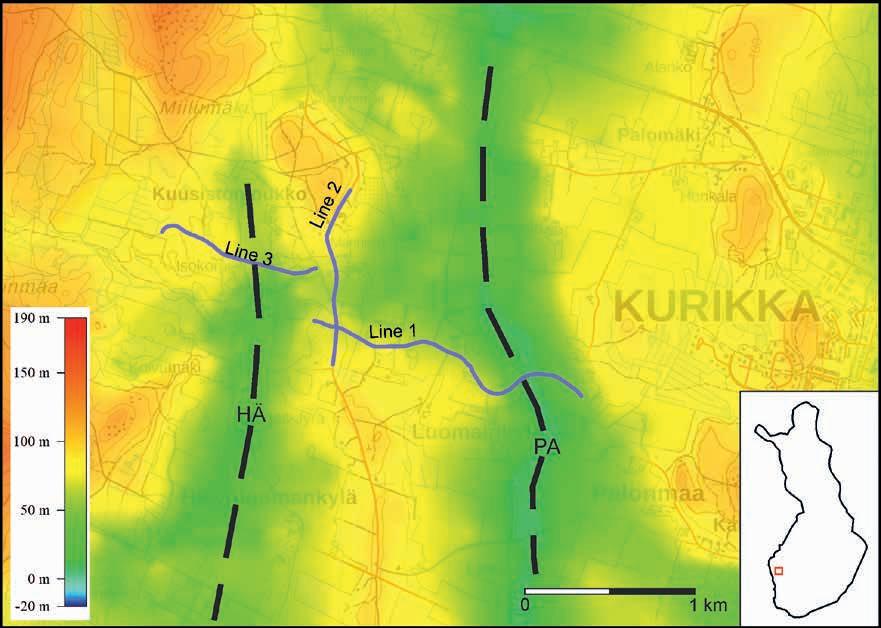
DOI: 10.3997/1365-2397.fb2023063 plant. We complement these studies further via a nodal-based, high-resolution multicomponent seismic survey in Kurikka, western Finland (Figure 1).
Kurikka area is an example of the complex groundwater system that is being systematically studied by the Geological Survey of Finland (GTK) for its potential to supply water to the nearby towns of Vaasa and Kurikka (with population around ~150000, agriculture, food production and large industries in the area). The leaky confined aquifer system developed in the glacial sediments overlying the bedrock, which is intersected by lineaments, representing different types of deformation zones (Ruuska et al. 2023). Because of the sparse outcrops, mapping of the bedrock deformation zones was primarily based on gravity data and boreholes. Location, dimension, and connectivity of those features constitute a big uncertainty in the 3D geological model, which is an essential input for groundwater flow modelling. Therefore, to test the feasibility of imaging bedrock fracture zones overlaid by thick and heterogenous sediments, we acquired multicomponent seismic data along three profiles located west of the town of Kurikka (Figure 1) (Malinowski et al. 2022). It was the first full-scale field test of the recently established Finnish national pool of seismic instruments (Flex-EPOS), consisting of nodal 3-C (three-component) recorders and 3-C geophones (https://wiki. helsinki.fi/display/FLEX/Large-N+Devices). It was also the first hardrock-site test of a small electrically driven seismic vibrator (E-vib) in both P- and S-wave mode, which earlier proved to be very effective in sedimentary environments (Brodic et al. 2019). Here we review data acquisition and processing, as well as provide initial interpretation and recommendations based on the joint analysis of P- and S-wave seismic sections and P-wave refraction tomography results.
Study area
The study area is situated in the vicinity of Kampinkylä, west of Kurikka city centre (Figure 1). Its subsurface is dominated by an ancient valley system cut in the Paleoproterozoic bedrock consisting of granodioritic-granitic-dioritic intrusive rocks and supracrustal rocks (mainly biotite paragneisses), which is filled with Pleistocene sediments (Hall et al., 2021, Ruuska et al.
2023). This system is characterised by one major elongated NNE-trending depression located within the Kyrönjoki river valley together with the NNW-SSE-trending minor tributary valley in Paloluoma (PA) and Häjyluoma (HÄ), suggesting that those structures were formed during the Svecofennian orogeny (Hall et al. 2021). The complex geological history of the area implies that the bottom of the valleys provide widespread deformation zones that contribute to the aquifer system. Since their formation, those paleovalleys experienced a long burial-erosion history and survived to present day thanks to the slowest erosion rates on Earth (Hall et al. 2021).
The highly variable sediment cover was originally described by Putkinen et al. (2012). Stratigraphy is dominated by interbedded sands and gravels that are typically surrounded by glacial tills and fine sands (Figure 2). Glacial till with matrix variation causes leaky or confined character to the aquifers existing at depths of
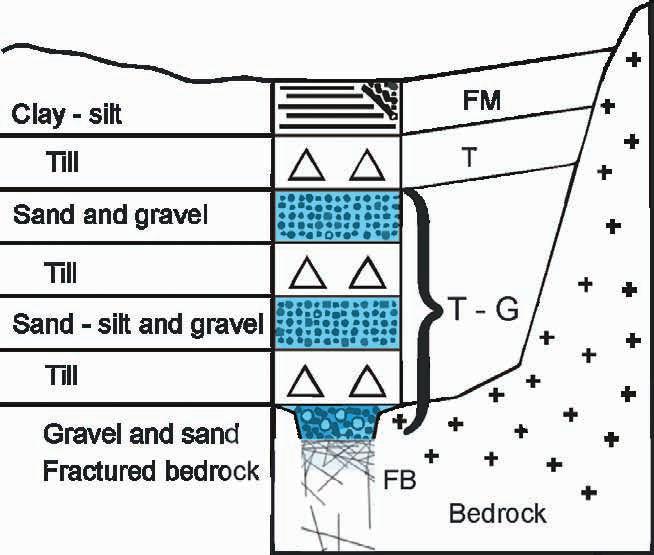
15-20 m, ~40-70 m and ~70-85 m below the ground level. Basinal sediments on top of the section seal the complex aquifer system. Sharp boundaries between different sediment units and a major unconformity between the bedrock surface and sediments provide a good target for testing seismic methods. There are also numerous data (e.g., boreholes) that can be used for calibrating seismic interpretation. Seismic data can also provide a new perspective for previously noted, but poorly examined, deformation zones and possible bedrock fracture zones that apparently have a major role in controlling the inflow and maintaining the groundwater system (Rashid, 2022).
Data acquisition and processing
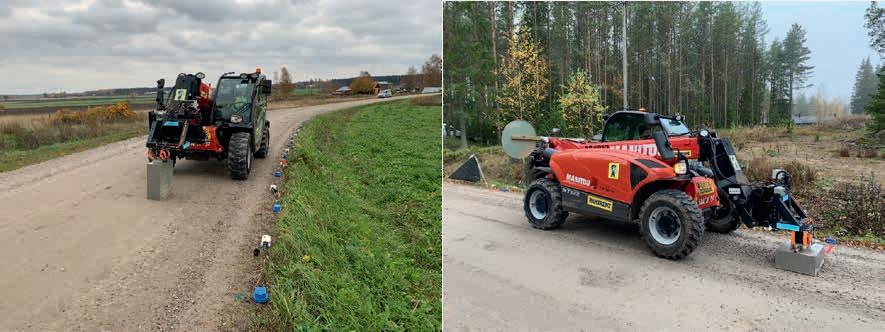
Seismic profiles were acquired along gravel roads (Figure 3). We used 500 receivers from the Flex-EPOS pool (Geospace GSB nodes and 5Hz 3-C geophones), which were consecutively deployed along Line 1 (ca. 1.8-km long) and Line 2 and 3 (each ca. 1 km-long) with 2 m spacing. A fixed spread was used for shorter profiles, while for Line 1 rolling of the receivers was necessary. The Lightning E-vib (Brodic et al., 2019) source was mounted on a telehandler (Figure 3). Vibroseis source points (VPs) were positioned collocated with every second receiver station (4 m) along all three profiles. All profiles were shot twice: in P- and S-wave mode (S2 = crossline, SH-wave mode excitation), resulting in a 6-C dataset. In the latter, we will use the following naming convention: source component (P or S) and receiver component (V = vertical, H1 = inline, H2 = crossline). It is worth noting that switching the source from P- to S-wave mode was taking only ca. 15 minutes and the source operations were smooth with no down time due to equipment malfunction (average daily productivity of ca. 270 VPs).
The Lightning belongs to a class of small E-vib sources, offering a lot of flexibility for near-surface studies as compared to hydraulically driven sources (Burschil et al. 2021). It can be used in both P- and S-wave mode offering 1.3 and 1.8kN force, respectively, with a full-force sweep frequency of 8-400 Hz.
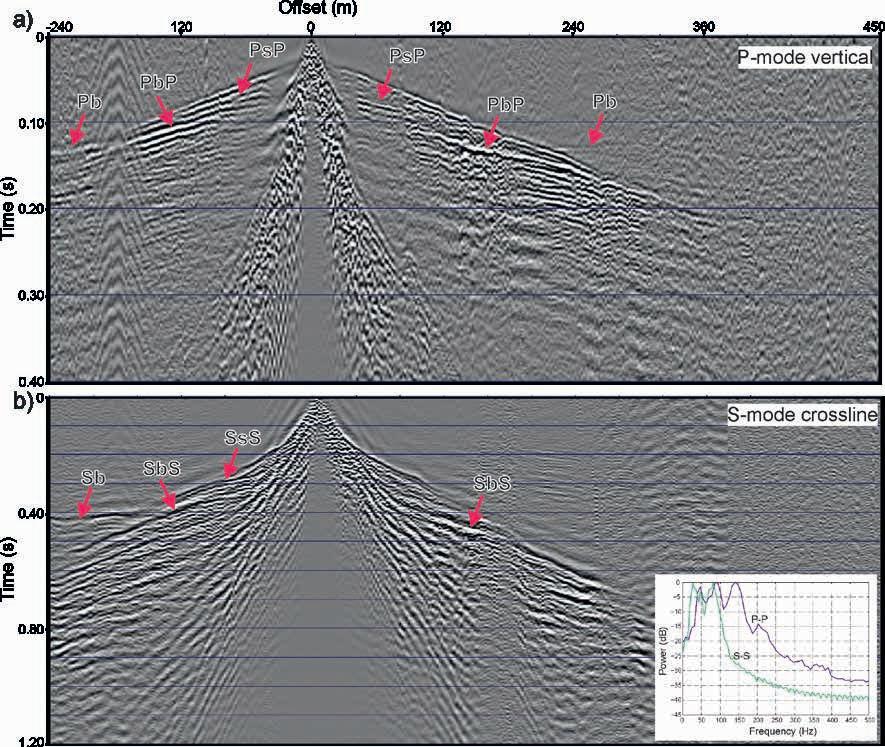
testing of the sweep parameters was performed. We implemented broadband sweeps: 30-400 Hz in P-wave mode (nonlinear sweep, +3dB per octave), 15-300 Hz in S-wave mode (linear). In both cases, sweeps were 20 s long with 0.2 s cosine tapers and repeated two times per VP. In reality, power spectra of the P-V and S-H2 data shown in inset in Figure 4 (calculated in the window focused on the bedrock reflection) exhibit rapid decay of amplitudes after 150 and 100 Hz, respectively. However, the plot for the P-V component indicates signal response up to 250 Hz. Sweep tests performed at the end of the acquisition of Line 3, indicate that, indeed, the P-wave imaging can be improved by further enhancing higher frequencies (+6dB per octave). No significant effect on S-wave imaging was noticed when focusing on lower frequencies (8-200 Hz linear sweep).
Recorded data are of good quality (Figure 4), with high-apparent velocity refraction from the bedrock (Pb) visible up to 400 m offset (Figure 4a) and traceable sometimes up to 800-900 m for P-V data. Corresponding S-wave refraction (Sb) is less pronounced (Figure 4b). However, there were record sections in which it can be traced over a similar distance as Pb phase. In case of the thick sediments, the bedrock reflection is outstanding in both P-V (PbP) and S-H2 data (SbS). Some internal reflections from the sediments (PsP, SsS) are visible in both P- and
S-wave shot records. We applied a minimalistic data processing consisting of component separation, crooked line binning (1 m CDP spacing), elevation statics, amplitude scaling through AGC (200 ms window), f-k filtering to suppress surface-waves (only for S-H2 data), band-pass filtering (40-50-150-180 Hz for P-V data, 15-25-130-150 Hz for S-H2 data), normal-moveout correction and stacking. Stacking velocities obtained from velocity analysis ranged between 1500-2000 m/s for P-waves and 300900 m/s for S-waves. Final stacks (Figures 5 and 6) were depth converted using average velocity functions.
First arrivals were picked for full offset range for P-V data. We subsequently run first-arrival traveltime tomography (Tryggvason et al., 2002) to derive P-wave velocity (Vp) models along the profiles. Although the code is inherently 3D, the tomography was performed with cell sizes of 2 or 4 m in inline (x) and 2 m in depth (z) directions, while a large cell size in crossline (y) direction was used forcing the inversion into 2D space to obtain a 2D velocity model for joint seismic interpretation purposes. The smoothness constraints were gradually released with increasing iteration number and for all the profiles, the final root-meansquared (RMS) errors were on the order of 2-3 ms after nine iterations. We also experimented with running a joint P- and S-wave tomography (Tryggvason and Linde, 2006). However, the results were less constrained as it required the same number of P- and S-wave arrivals to be present. Picking consistent refracted S-wave arrivals on the S-H2 data was more difficult and there were, depending on the profile, about 8-15% less picked arrivals overall compared to P-V data. Vp models obtained from tomography (masked by the ray coverage) are overlaid on the final depth sections to guide geological interpretation (Figures 5 and 6).
Results and interpretation
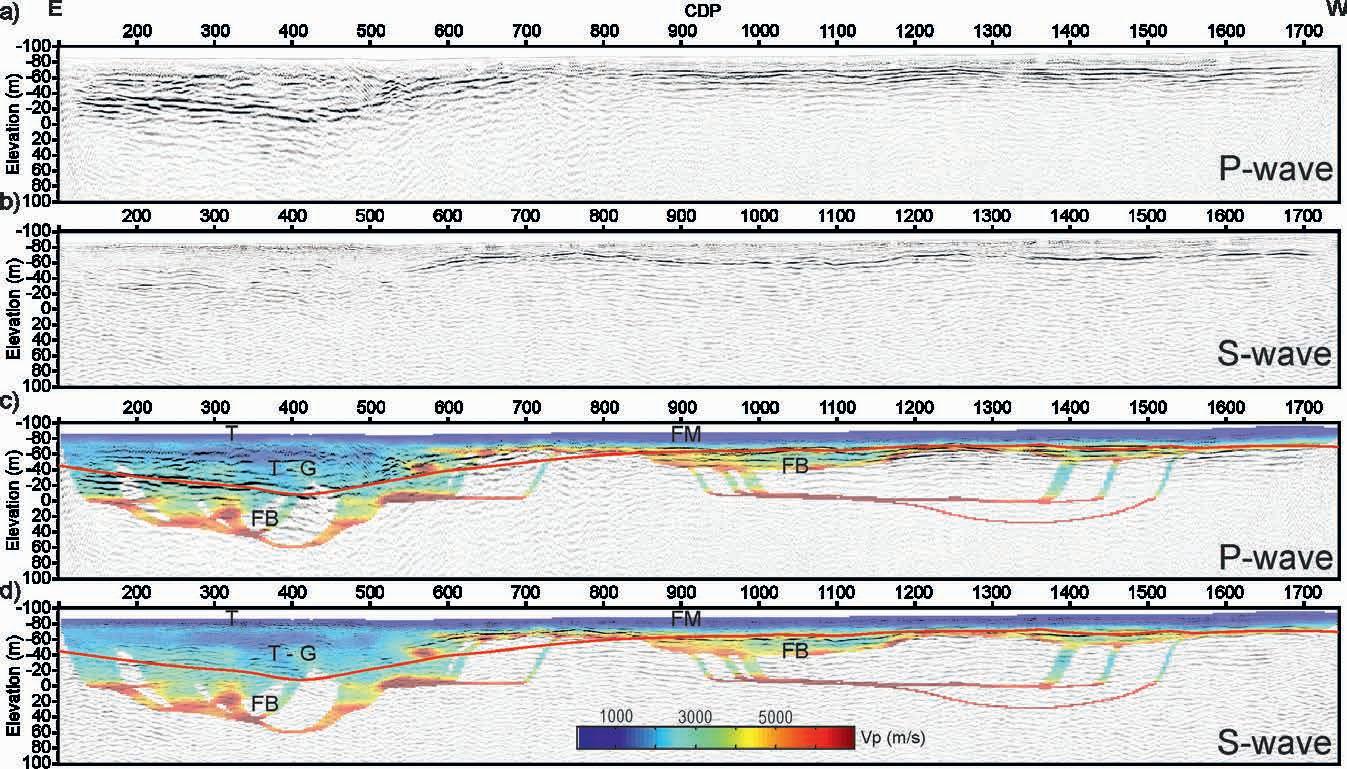
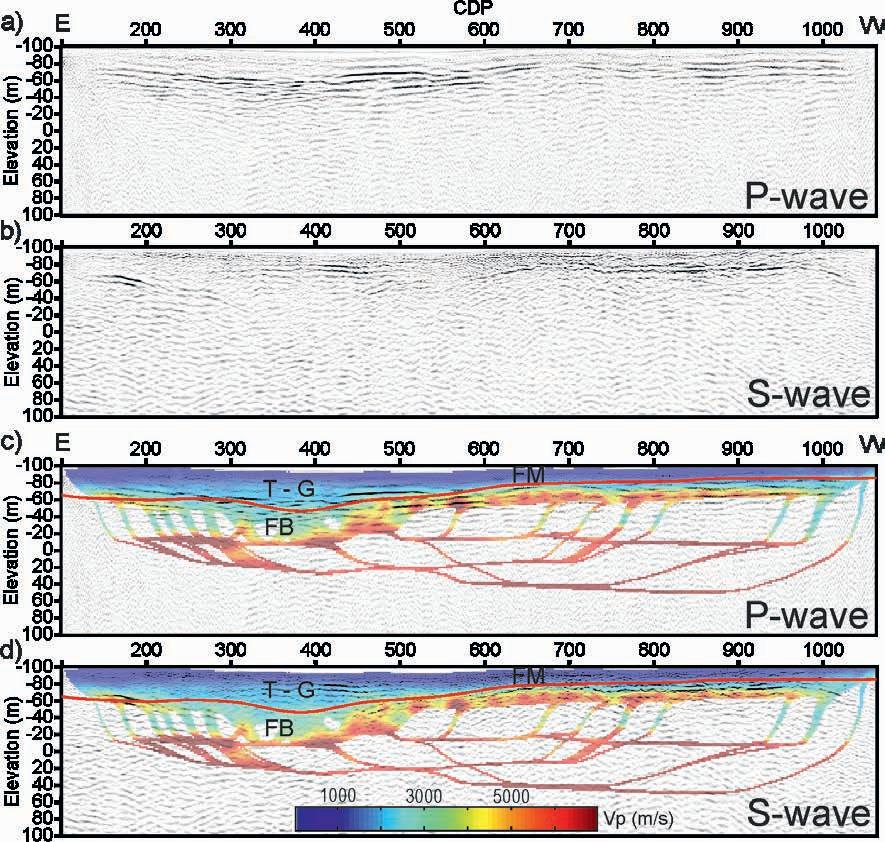
We present here results for Line 1 and Line 3, as both are intersecting the buried valleys (PA and HÄ, Figure 1). The strongest reflection in P-wave stacks (Figure 5 and 6) represents the top of the bedrock, matching reasonably well with the bedrock DEM surface from gravity inversion and boreholes (Putkinen et al. 2012; red line in Figure 5cd and 6cd). In some places, e.g., between CDP 500-700 along Line 1, there are more differences observed between the bedrock DEM and seismic response. In the shallower parts, the bedrock reflection is associated with the high P-wave velocities (ca. 5000 m/s) (Figure 5c and 6c), while in the bedrock depressions, sub-bedrock velocities are much slower (3500-4500 m/s) and the increase to Vp > 5000 m/s occurs 20-40 m below the bedrock surface. This zone is also characterised by some increased sub-bedrock P-wave reflectivity. Therefore, we hypothesise the presence of a 20-40 m thick layer of weathered and fractured bedrock in the transition zone between the deepest gravel and sand layer and the upper part of the bedrock (see Figure 2). This interpretation is also confirmed from drillings into the bedrock in the HÄ buried valley. The increased sub-bedrock reflectivity can be associated with the subhorizontal/low-angle fracturing. Shallower parts of the bedrock are also well imaged in the S-wave sections
– sometimes with more details as compared with the P-wave stacks. However, the imaging of the deepest portion of the bedrock is highly limited in S-wave stacks. This is especially evident for Line 3 (Figure 6b). It appears that the zone of the weathered bedrock as inferred from Vp and P-wave reflections, is manifested as a more transparent zone in S-wave image. On the other hand, interpreting the flanks of the bedrock depression from S-wave stack along Line 3 (between CDP 200-300 and 450-500, Figure 6b), suggests that this structure is incised much deeper as previously considered.
We also observe some reflections within the sediments with match between the P- and S-wave stacks along Line 1 (Figure 5). They also correlate with the changes in the Vp derived from tomography. The shallowest fine-grain sediments (FM, clay-silt) and the shallow till layer is associated with Vp of 1000-1800 m/s. Repeated sand-gravel and till packages (Figure 2, T-G in Figure 5) are also marked by consistent Vp changes (from top to bottom): 1500-2300 m/s, 1000-1800 m/s, 1500-2300 m/s and 2000-2700 m/s.
Discussion and conclusions
Good quality 6-C seismic data were acquired in the vicinity of Kurikka, western Finland, confirming the performance and operational efficiency of the E-vib source and nodal receivers connected to planted geophones. Thanks to the nodal deployment, long offsets were acquired, helping to constrain the velocity model below the thickest (>80 m) sediment package. In case of landstreamer acquisition, it would require a relatively long streamer (> 300 m), which is difficult to handle over crooked roads. A high number of sensors available made it possible to acquire data with relatively dense spatial sampling (2 m).
Data analysis supports the complementary nature of the P- and S-wave imaging of the groundwater system consisting of glacial sediments overlying undulating and fractured crystalline bedrock. Due to the higher resolution of the S-wave sections, the shallow bedrock is imaged more clearly in the S-wave seismic sections compared to the P-wave counterpart. On the other hand, the S-waves fail to clearly image the deepest segments of the bedrock. The reason for that can be both operational (not enough source force) and geological e.g., higher attenuation of S-waves vs P-waves. We noticed similar behaviour during S-wave survey conducted south of Kurikka (Brodic et al. 2023): only the shallower part of the bedrock and the sediments were imaged. In general, the layer of fractured bedrock inferred from P-wave data is transparent in S-wave stacks. This seems to agree with the observations made by Ahokangas et al. (2020), where the weathered bedrock was reflective in P-wave mode, while transparent in S-wave mode.
Correlation of the P- and S-wave sections allows us to determine the width of the bedrock fracture zones and provides important input to hydrogeological modelling. New data also demonstrate their utility in mapping glacial sediments, providing both the structural (geometry) control and lithology distribution through the changes of P-wave velocity obtained from tomography. Therefore, seismic can be considered a great asset in 3D modelling of the buried valleys aquifer system, reducing uncertainties introduced by conceptual models based on borehole data alone.
Acquired data offer a lot of flexibility in terms of testing different methodologies. For example, full-waveform inversion can be used to further improve resolution of Vp model in the sedimentary package (see e.g., Adamczyk et al. 2014). Dense deployment of 3-C receivers also enables application of the H/V spectral ratio method to obtain depth to the bedrock, calibrating resonance frequency – depth relation by the available S-wave velocities. Benefits of combining active seismic with the H/V method were recently presented by Dietiker et al. (2020). However, for simple structural imaging with the S-wave source, one can potentially consider replacing 3-C (or horizontal component) receivers with a fibre-optic cable and the distributed acoustic sensing (DAS) technology. Our recent experience with the data acquired using the same seismic source but with the horizontal-inline orientation, suggests that same quality S-wave reflection sections are obtained from the DAS as from the planted geophones (Brodic et al. 2023).
Acknowledgements
The FIN-EPOS and FLEX-EPOS are funded by Academy of Finland (Funding Decisions no. 328984, 328776, 328778, 328779, 328780, 328781, 328782, 328784 and 328786). Special thanks to Timo Kuusisto for his continuous support during the survey. Kurikan Vesihuolto Oy and Vaasan Vesi are acknowledged for their collaboration. SeismicMechatronics provided technical assistance in the field. Thanks goes to P. Skyttä and E. Ruuska for their participation in the fieldwork and discussions.
References
Adamczyk, A., Malinowski, M. and Malehmir, A. [2014]. High-resolution near-surface velocity model building using full-waveform inversion — A case study from southwest Sweden. Geophysical Journal International, 197, 1693-1704.
Ahokangas, E., Mäkinen, J., Artimo, A., Pasanen, A. and Vanhala, H. [2020]. Interlobate esker aquifer characterization by high resolution seismic reflection method with landstreamer in SW Finland. Journal of Applied Geophysics, 177, 104014.
Brodic, B., Malinowski, M., Koskela, E., Laakso, V., Putkinen, N. and Heinonen, S. [2023]. P- and S-wave reflection seismic imaging using DAS and nodal receivers: an example from Kurikka, Finland. 29th European Meeting of Environmental and Engineering Geophysics, Extended Abstracts
Brodic, B., De Kunder, R., Ras, P., Van den Berg, J. and Malehmir, A. [2019] Seismic imaging using electromagnetic vibrators-Storm versus Lightning. 25th European Meeting of Environmental and Engineering Geophysics, Extended Abstracts, Tu_25th_B04.
Brodic, B., Malehmir, A., Pugin, A. and Maries, G. [2018]. Three-component seismic land streamer study of an esker architecture through S-and surface-wave imaging. Geophysics, 83, B339-B353.
Burschil, T., Buness, H., Leineweber, P. and Polom, U. [2021]. Results of Performance Tests of Electrodynamic Vibratory Seismic Sources. 27th European Meeting of Environmental and Engineering Geophysics, Extended Abstracts
Dietiker, B., Pugin, A.M. and Hunter, J.A. [2020]. Combined Shear-Wave Seismic Reflection and H/V Spectral Ratio Surveys-A Case Study.
26th European Meeting of Environmental and Engineering Geophysics, Extended Abstracts


Hall, A.M., Putkinen, N., Hietala, S., Lindsberg, E. and Holma, M. [2021]. Ultra-slow cratonic denudation in Finland since 1.5 Ga indicated by tiered unconformities and impact structures. Precambrian Research, 352, 106000.
Malinowski, M., Heinonen, S., Putkinen, N., Koskela, E., Laakso, V. and Bos, J. [2022]. Multicomponent Seismic Acquisition for the Characterization of the Complex Multiaquifer System at Kurikka, Western Finland, NSG2022 28th European Meeting of Environmental and Engineering Geophysics, Extended Abstracts
Maries, G., Ahokangas, E., Mäkinen, J., Pasanen, A. and Malehmir, A. [2017]. Interlobate esker architecture and related hydrogeological features derived from a combination of high-resolution reflection seismics and refraction tomography, Virttaankangas, southwest Finland. Hydrogeology Journal, 25, 829-845.
Okkonen, J. and Moisio, K. [2015] Seismic reflection surveys in glaciofluvial deposits in Finland. Near Surface Geophysics, 13, 417433.
Pugin, A.J.-M., Pullan, S.E., Hunter, J.A. and Oldenborger, G.A. [2009]. Hydrogeological prospecting using P- and S-wave landstreamer seismic reflection methods. Near Surface Geophysics, 7, 315-327.
Putkinen, N., Putkinen, S., Valjus, T. and Leväniemi, H. [2012]. Kurikan Kuusistonloukon pohjavesialueen geologinen rakenneselvitys, report, Geological Survey of Finland
Rashid, A.B. [2022]. Towards Quantifying Groundwater Resources of the Paloluoma Buried Bedrock Valley in Western Finland Using Groundwater Modelling, MSc thesis, University of Waterloo.
Ruuska, E., Skyttä, P., Putkinen, N. and Valjus, T. [2023]. Contribution of bedrock structures to the bedrock surface topography and groundwater flow systems within deep glaciofluvial aquifers in Kurikka, Western Finland. Earth Surface Processes and Landforms, https:// doi.org/10.1002/esp.5602.
Tryggvason, A., Rögnvaldsson, S. ður T. and Flóvenz, Ó.G. [2002]. Three-dimensional imaging of the P- and S-wave velocity structure and earthquake locations beneath Southwest Iceland. Geophys. J. Int., 151(3), 848–866.
Tryggvason, A. and N. Linde [2006]. Local earthquake (LE) tomography with joint inversion for P- and S-wave velocities using structural constraints, Geophys. Res. Lett., 33, L07303.


