AUDIENCE: Intermediate
GA4 Audiences
GA4 Explorations: Custom Report Building

TRAINING


AUDIENCE: Intermediate
● GA4 Audiences
○ Audience Creation Option 1
○ Audience Creation Option 2
○ Audience Creation Option 3
● Explorations
○ Free Form Reports
○ Path Exploration Reports
○ User Explorer Reports
○ Cohort Exploration Reports

○ User Lifetime Reports
○ Segment Overlap Reports
○ Funnel Reports

Audiences are users that you group together based on any combination of attributes.

They are very similar to segments and comparisons.
You can segment by dimensions, metrics, and events to include practically any subset of users.
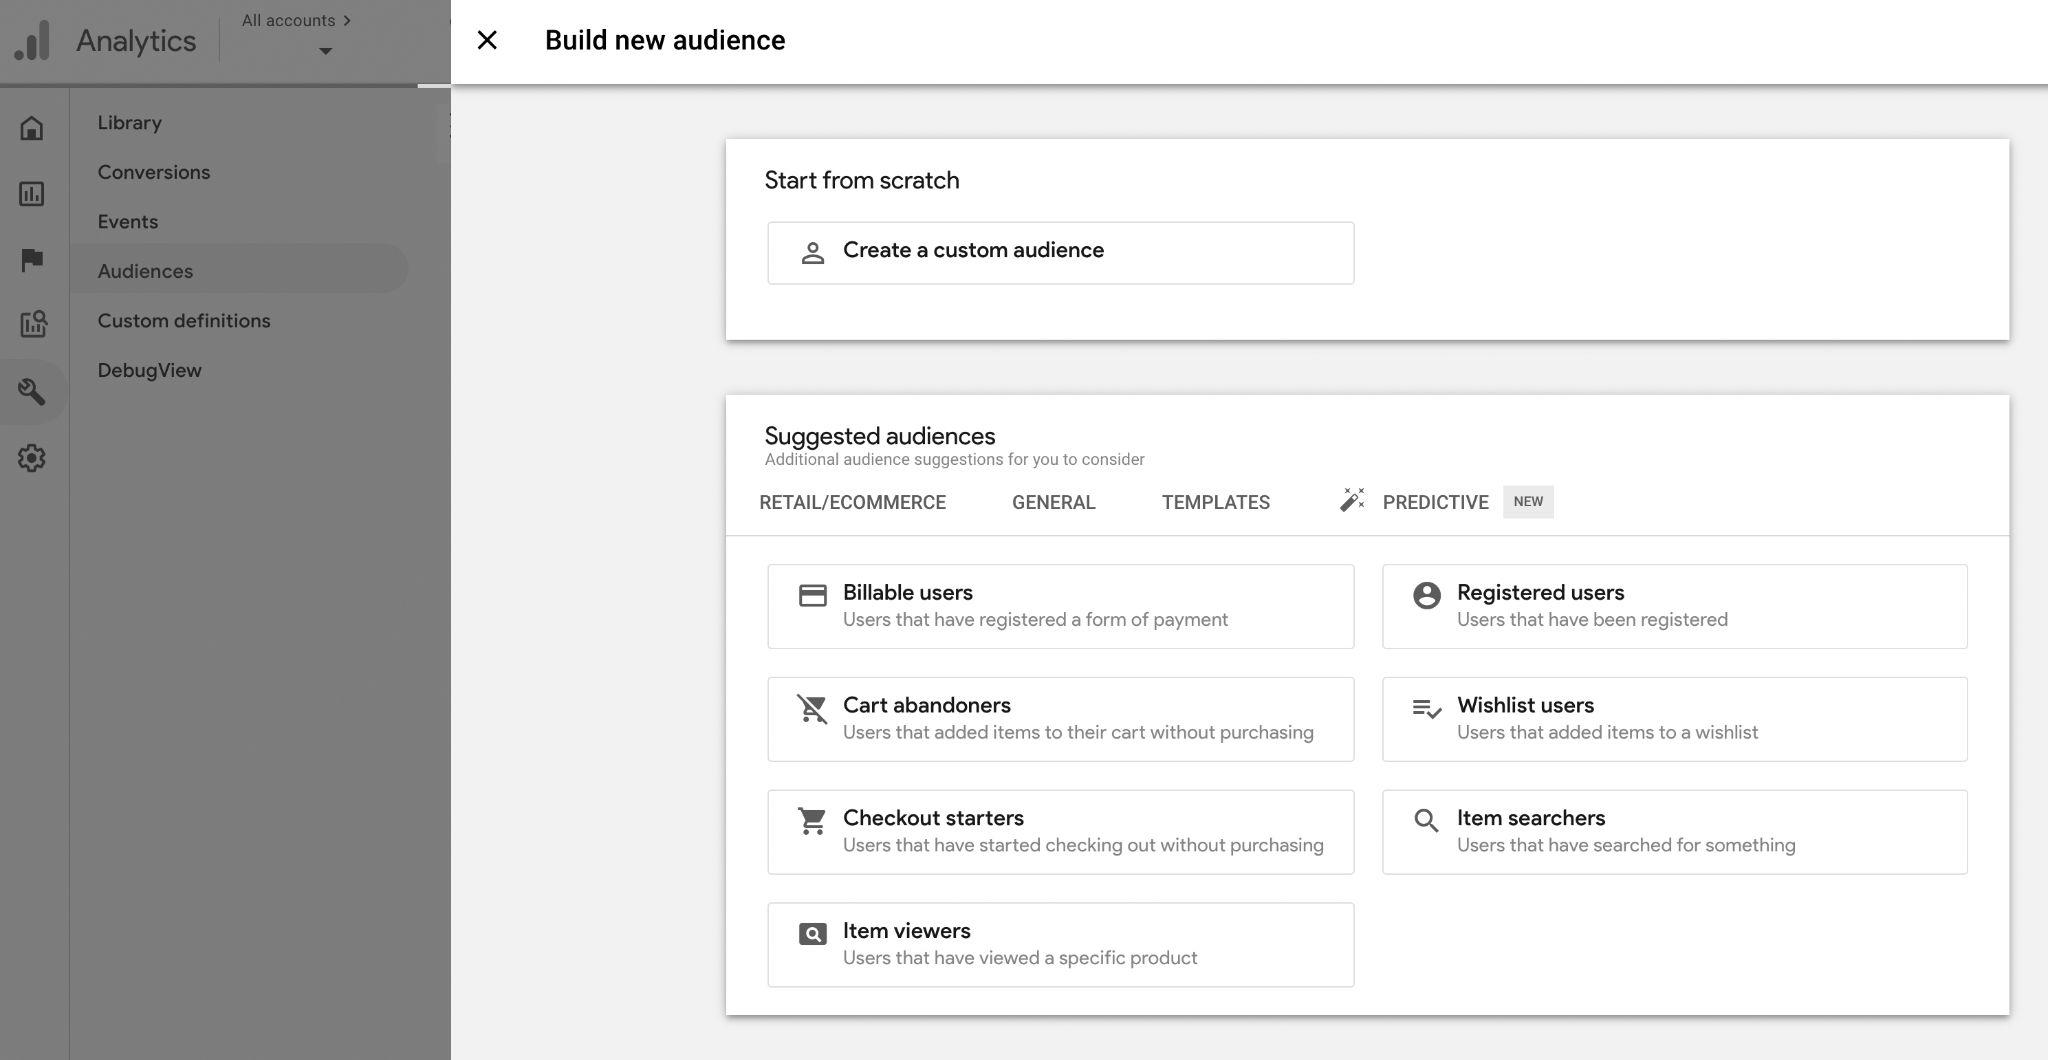
To create an audience: On the GA4 left sidebar, click Configure > Audiences > New audience.
1 2 3
Use a template and modify the existing parameters. Select a suggested audience You can use it as is, or modify it to suit your needs
Create a new audience by defining all the parameters yourself.


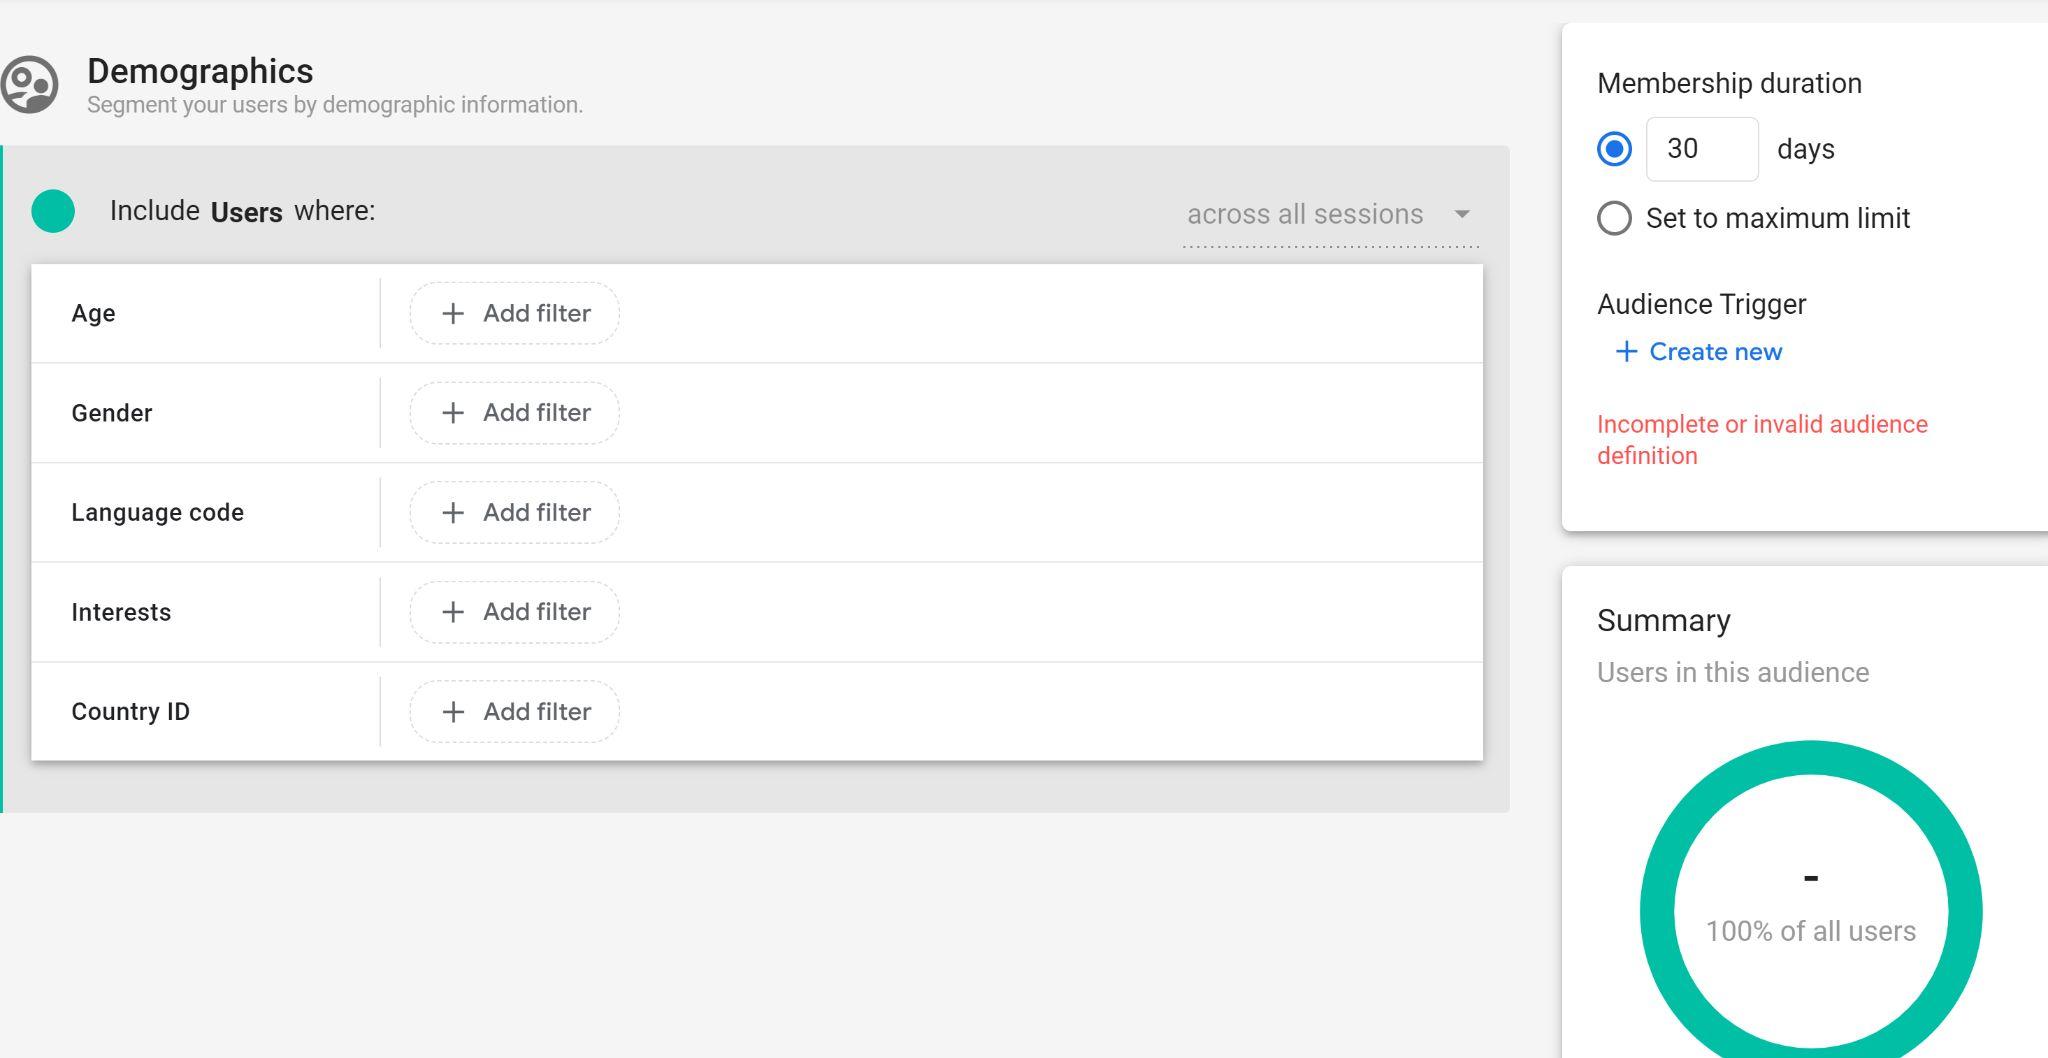
Audience templates are partially configured audiences that already identify a set of dimensions and/or metrics that form the basis of widely applicable audiences for app- and web-based businesses.
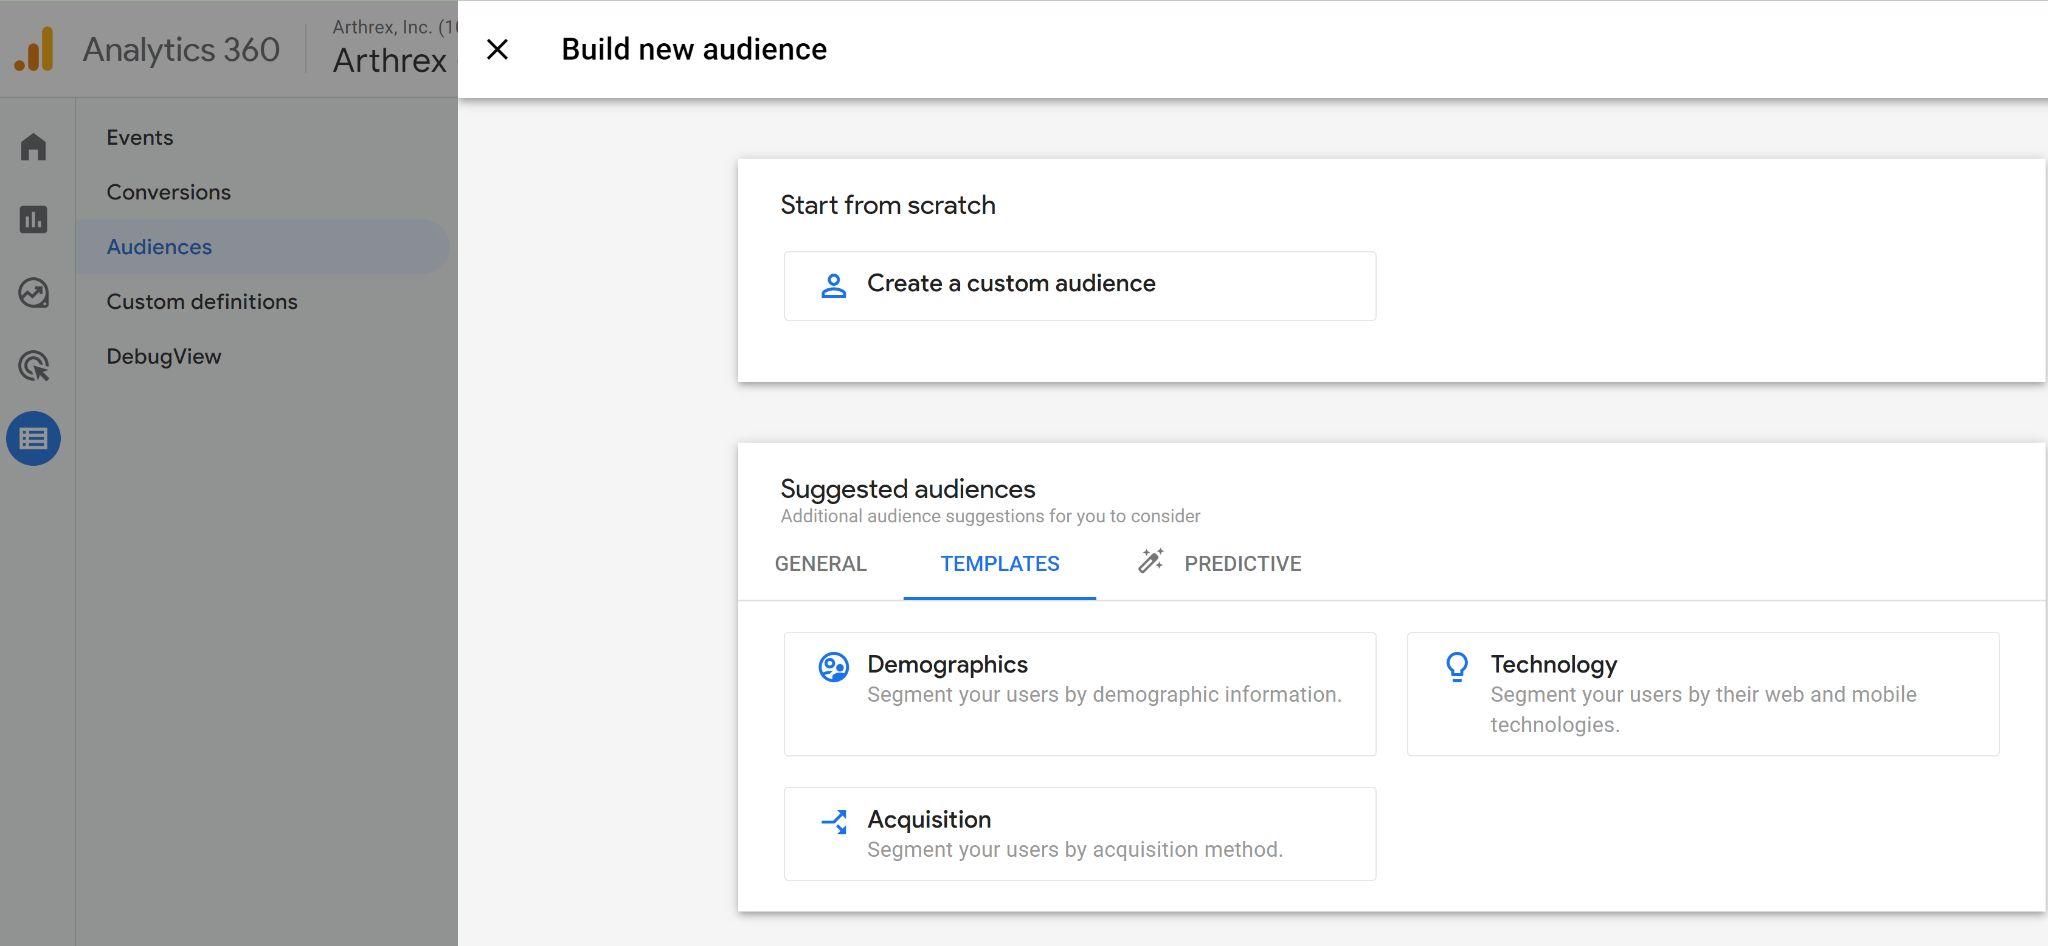
For example, the Demographics template includes the Age, Gender, Language, Interest IDs, and Location dimensions that you can use to define a particular audience in which you're interested. Using this template, you supply the operators and dimension values that define the audience you want, e.g.: Age exactly matches 18-24; Gender exactly matches female; etc.
After you complete the audience definition, enter a name, and click Save.

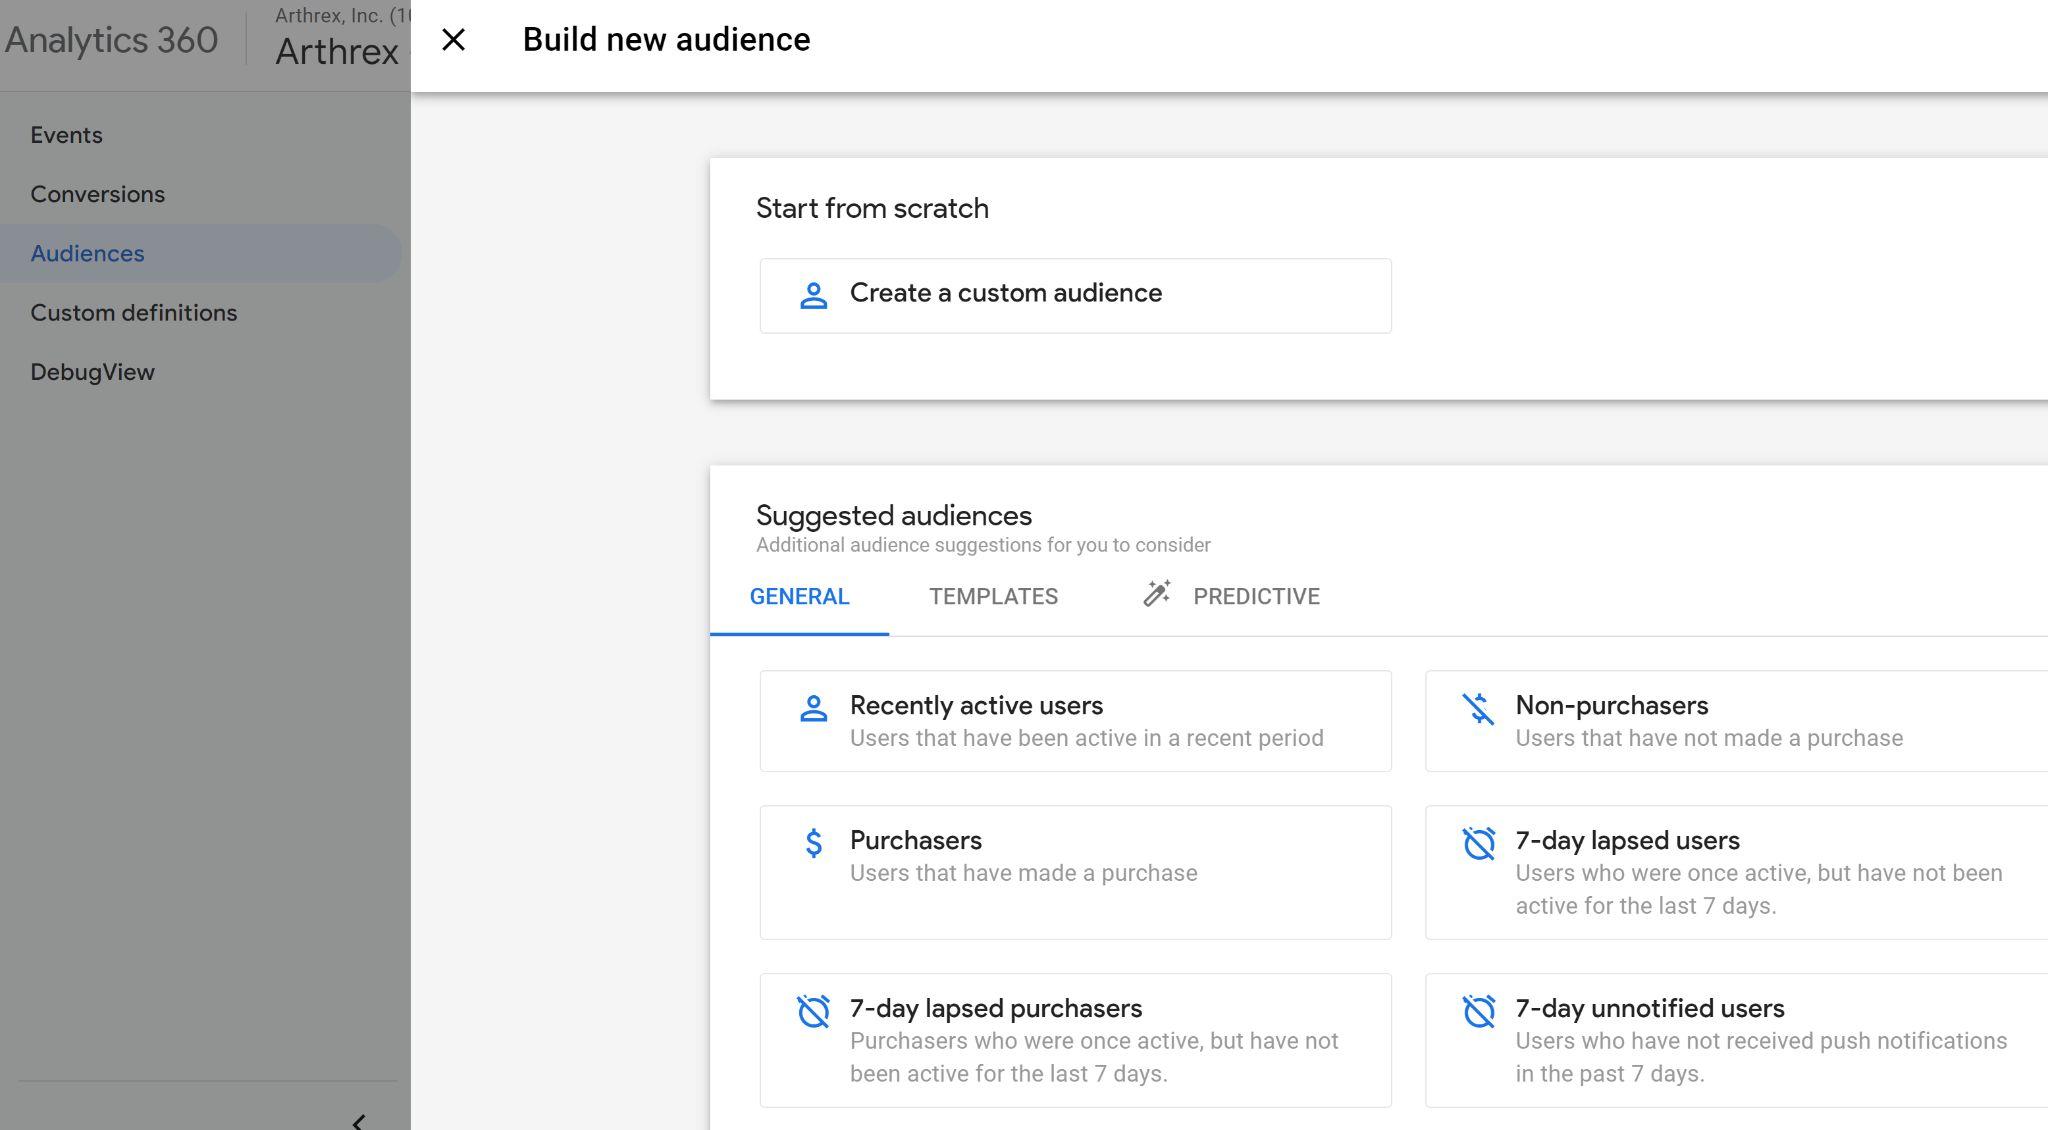
Analytics also provides a number of fully configured audiences that you can use as is or modify if necessary. These suggested audiences are based on the categories you specify for your apps in Apple's App Store and in Google Play and on the industry category you specify when you configure a property. Learn more

For example, the Recently active users audience is defined as follows: Include Users when (event =) user_engagement
You can use the audience as is, or you can add conditions or sequences, or change the membership duration as necessary.
Use the default name or enter a new name, then click Save. For information on working with suggested predictive audiences, see Predictive audiences.
Step 1: Click New audience.
Step 2. Click Create a custom audience.
Step 3. Enter a name and description for the audience.
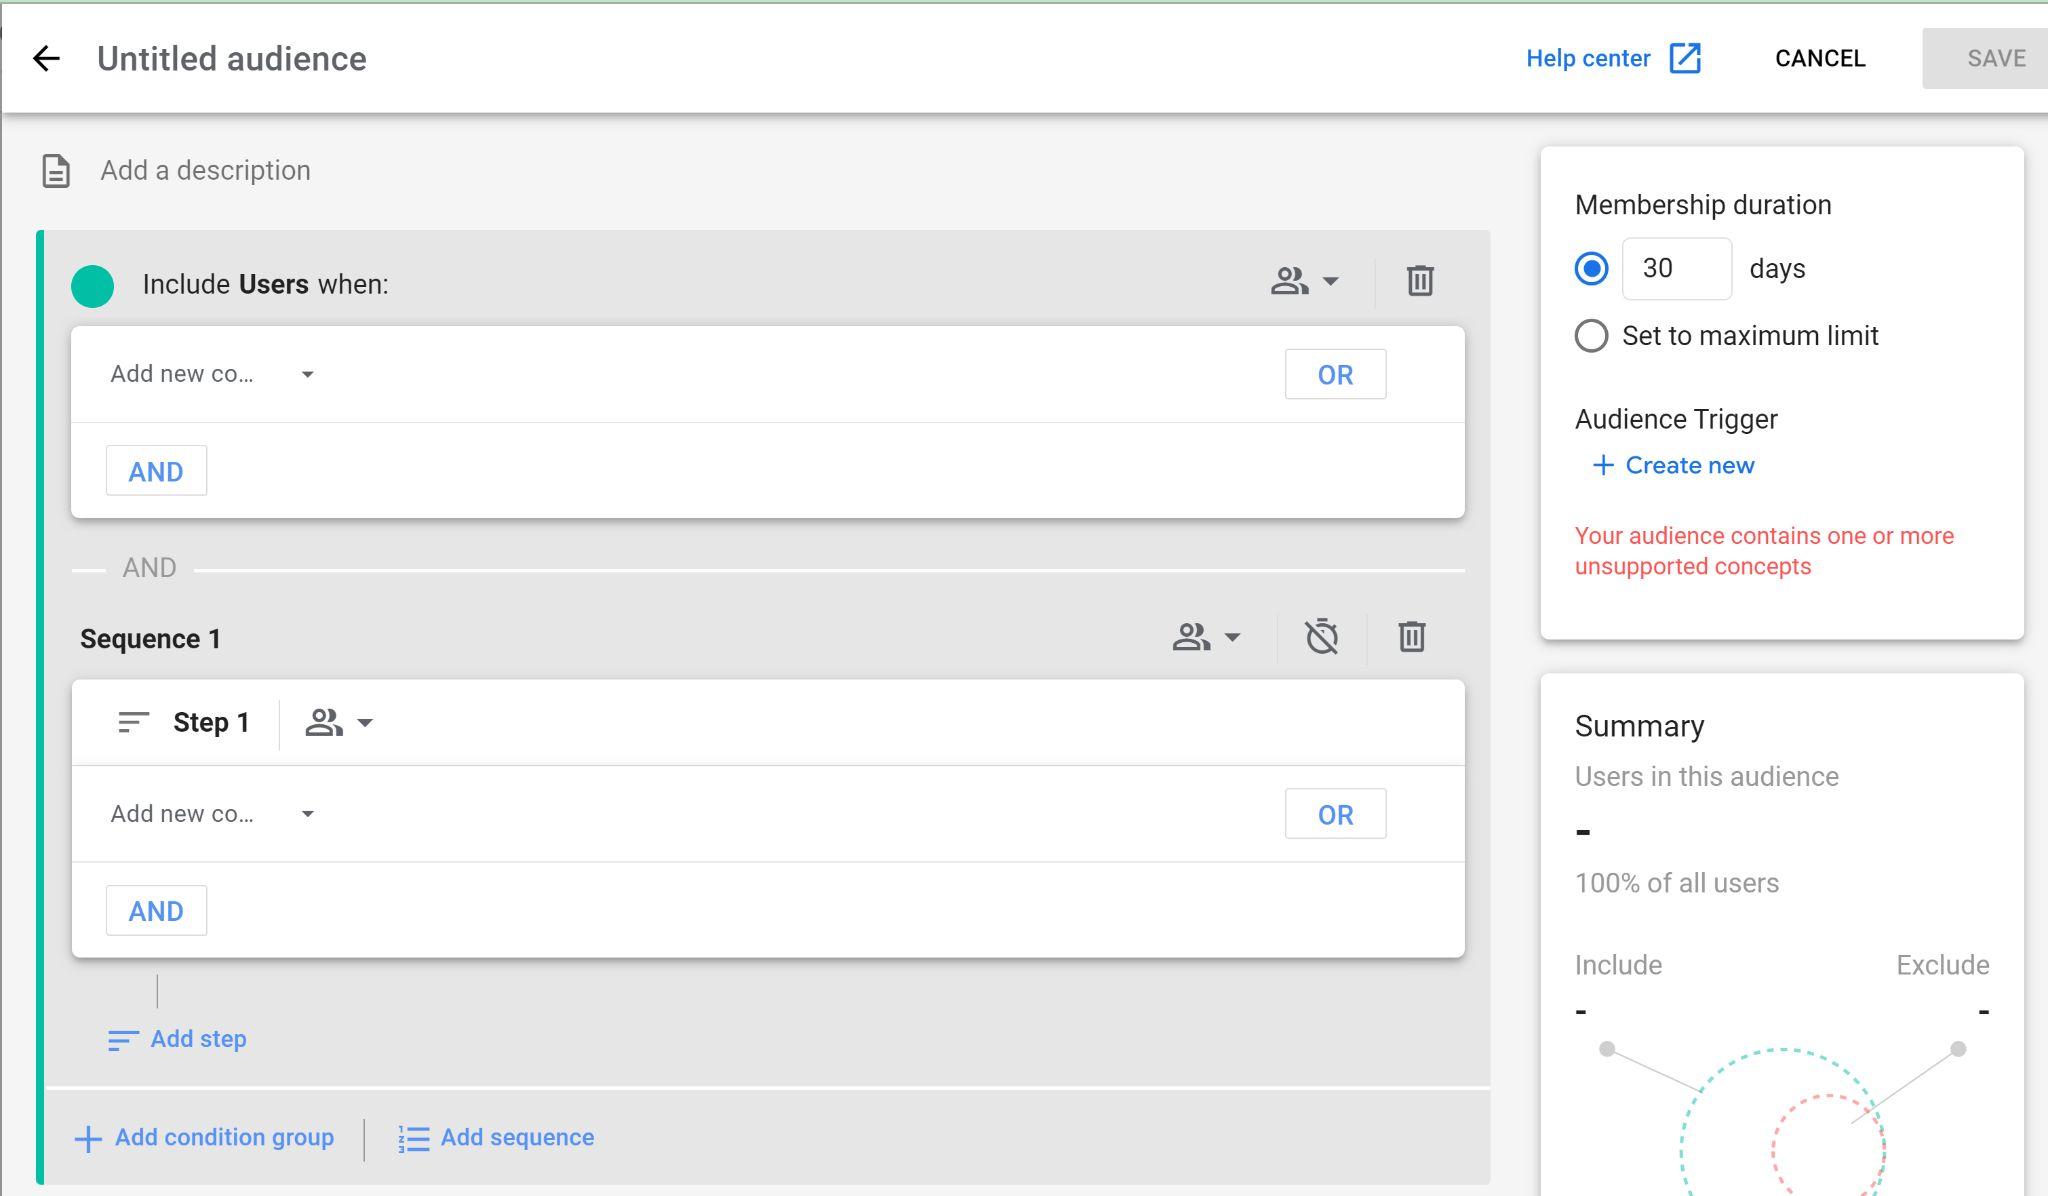
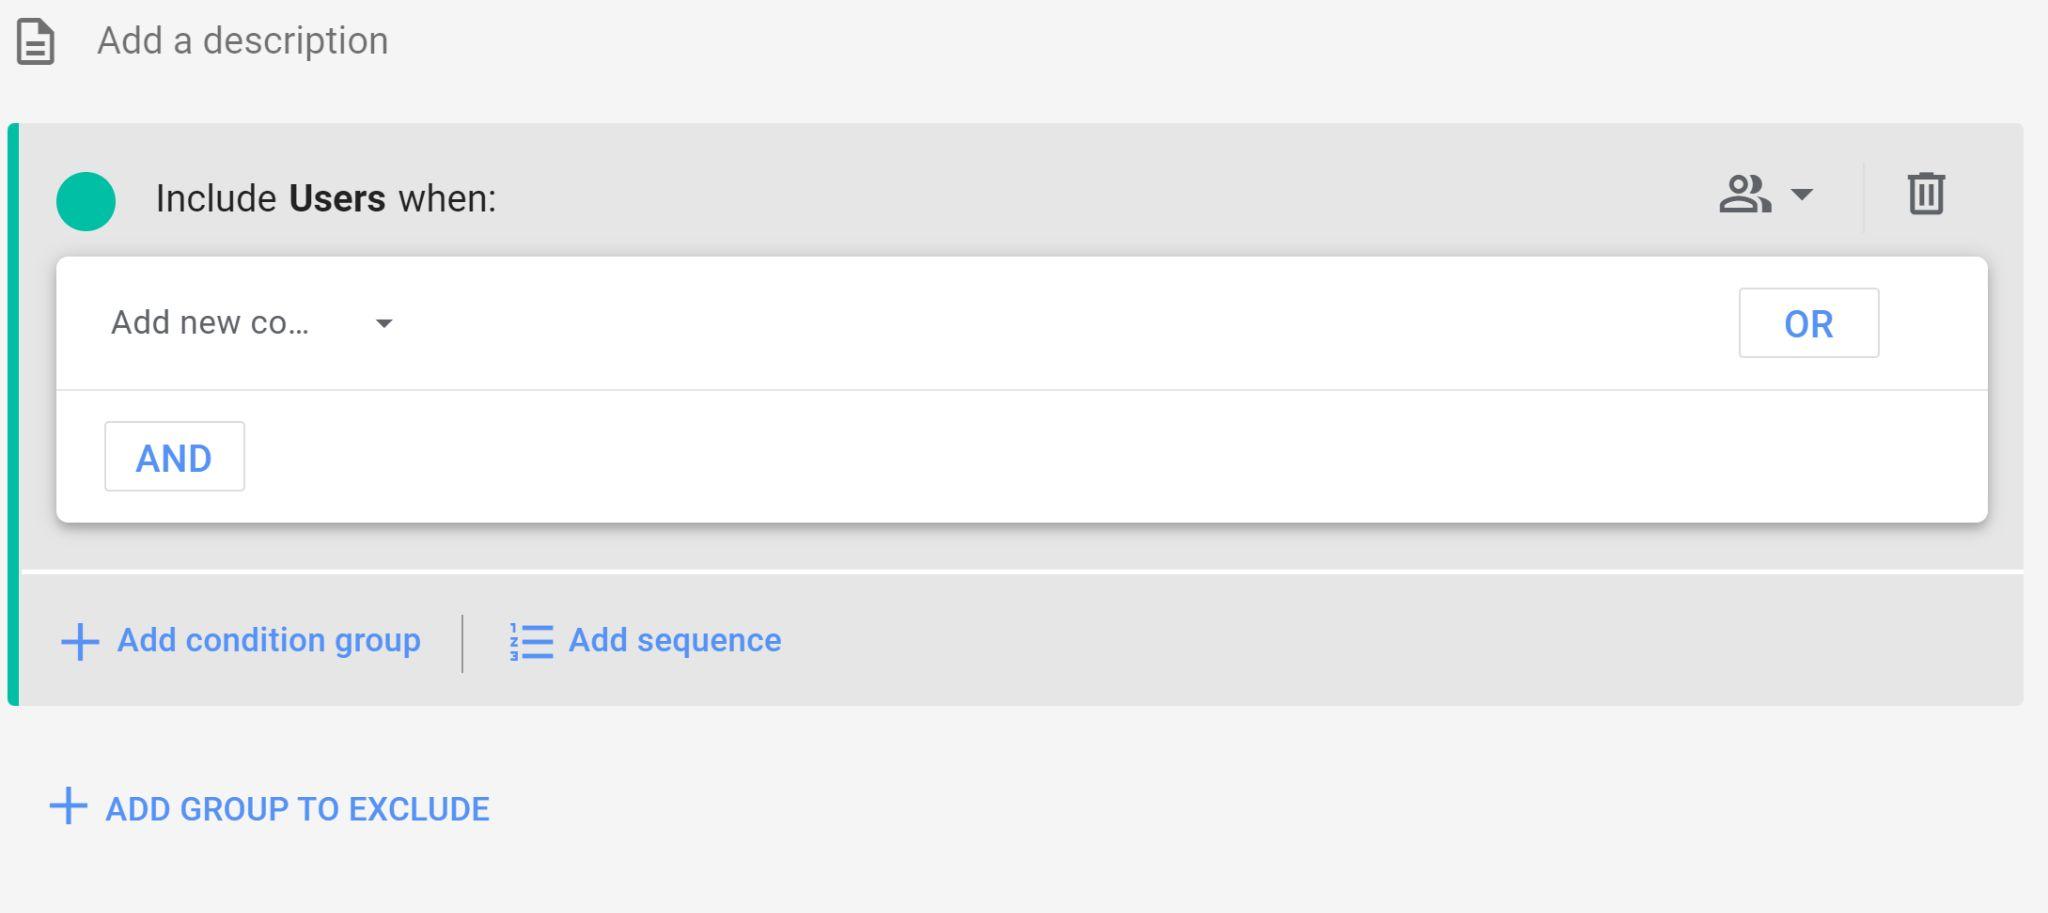
Step 4. Click Add new condition to add users who meet conditions based on dimensions, metrics, and events. (see next slide for more details)
Step 5: Click Add condition group to add another condition.
Set the scope of the sequence: Across all sessions, Within the same session.
Set Time Constraint to ON, and define the time period in which the whole sequence must occur (e.g., 30 Minutes).
Set the scope for Step 1: Across all sessions, Within the same session, Within the same event.
Configure the condition for Step 1.
Click Add step for each additional step you want to include in the sequence.

Step 6: Click Add sequence to add users who meet conditions that occur in a specific order, and optionally within a specific time period.
For example: Step 1: first_open, Step 2: in_app_purchase.
See examples of using this part of the audience builder.
● Select is indirectly followed by if the additional step can occur any time after the previous step.
● Select is directly followed by if the additional step has to occur immediately after the previous step.
● Select Within to define the maximum amount of time between steps.
● Set the scope for the step.


Step 7: Click Add group to exclude to create a condition that excludes specific users. Select Temporarily exclude users when to exclude users from the audience during periods when they meet the condition. Select Permanently exclude users when to exclude users from the audience if they've ever met the condition. Users are first evaluated by INCLUDE conditions, and then any EXCLUDE conditions. If they meet the EXCLUDE conditions, they are not added to the audience.
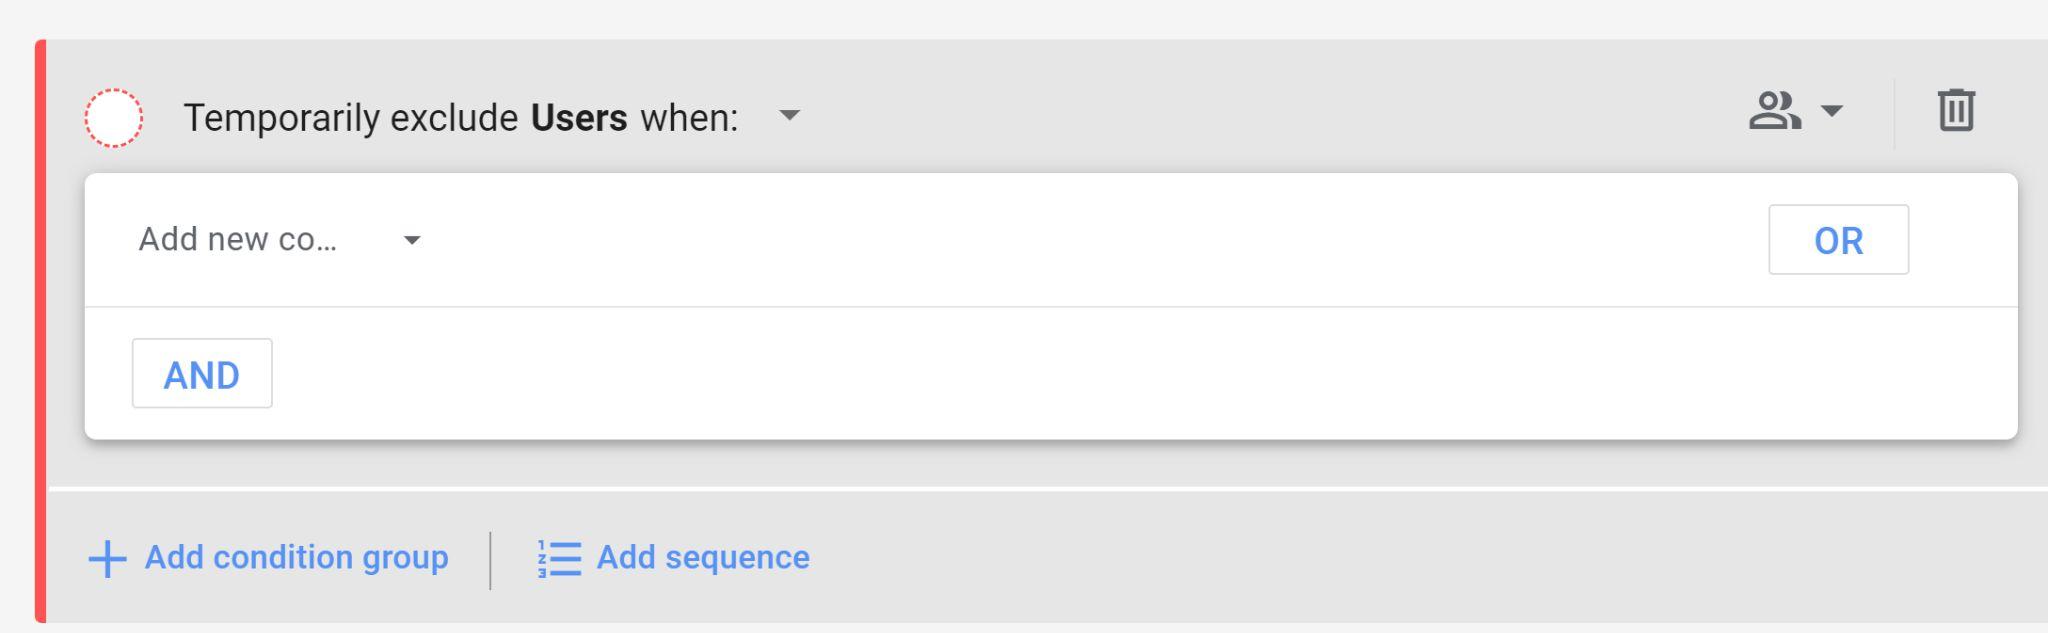
See examples of using this part of the audience builder.
Step 8: Membership duration: Max 540 days/18 months from the time user is added to audience last.

Reset on new activity: When enabled, the membership audience duration is limited to 14 months.When disabled, it overrides max audience duration to 14 months (or 2 months in future when user data TTL rolls out and customer explicitly selects 2 months).
Each time you engage in behavior that meets the criteria for being included in the audience, your membership duration is reset to the full value of this option.
For audiences exported to other products, GA retention settings no longer have control. The receiving product will apply their own policies.
Step 9: Click Save to save your conditions and create the audience.
Explorations: Custom Report Building

To create a Free Form report follow these steps:
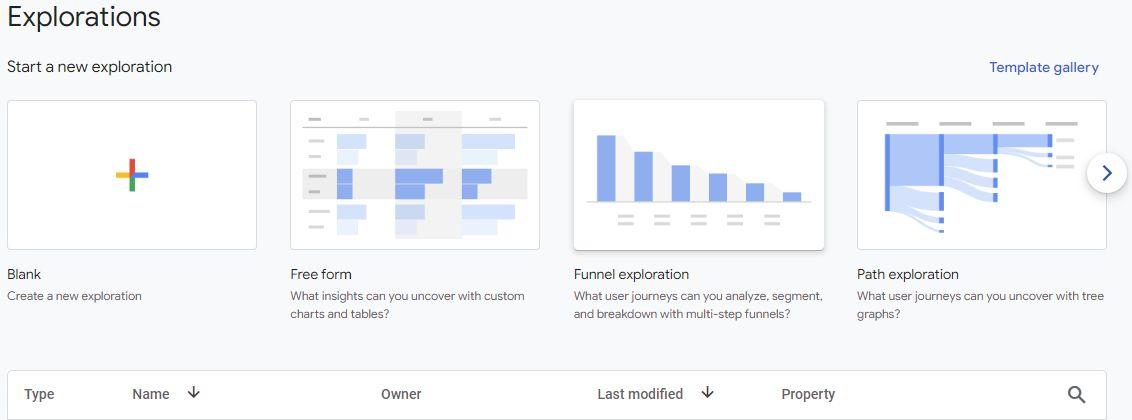
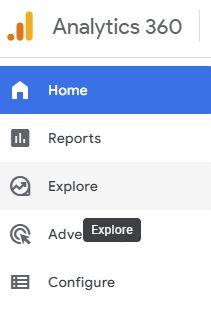
1. In the left-hand navigation in GA4 go to ‘Explore’
2. Click ‘Free Form’ in the provided tiles


To create a Shopping Funnel follow these steps:
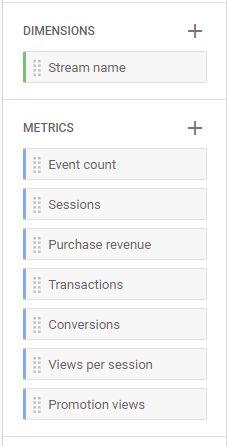
3. In the ‘Variables’ column click the ‘+’ icon beside ‘Dimensions’ (or Metrics) to add dimensions and metrics to use in your report
4. Drag the dimensions and metrics into the ‘Tab Settings’ column.
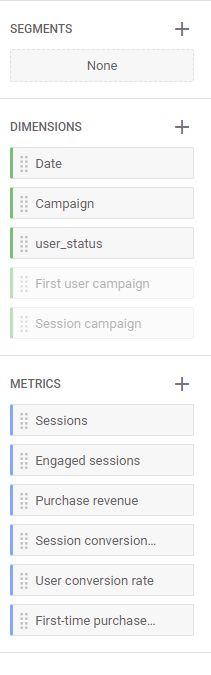
Dimensions can be used as rows and columns in your report. Metrics can be used as values.

You can change several settings to further refine your report. You can:
● Change the ‘cell type’ from a horizontal bar chart to a heat map.
● Increase the number of displayed rows
● Add a segment to isolate for a subset of data
● Add a filter to include/exclude matches to your rule
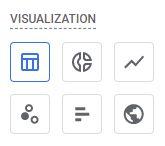
You can also change the visualization type inside the Free Form report (in the ‘Tab Settings’ column) to:
● Donut chart
● Line chart
● Scatterplot
● Bar chart
● Geo Map
Note: Changing the visualization type will remove dimensions and metrics to suit the visualization
To create a Path Exploration report follow these steps:
1. In the left-hand navigation in GA4 go to ‘Explore’
2. Click ‘Path Exploration’ in the provided tiles
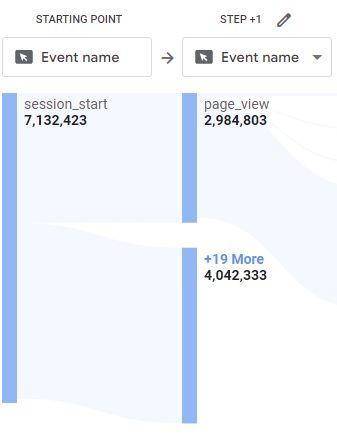
3. In the Path Exploration visualization tab, click the boxes below each step to specify the node type for each step.
4. If you click the ‘start over’ link in the top right corner, you can begin from a blank report and opt to specify a new start point OR build a reverse path by specifying an end point.
A reverse path is useful for finding out how users got to a particularly valuable page or interaction (if you use an event as your end point). It’s arguably a more valuable insight and worth trying.
To create a User Explorer report follow these steps:
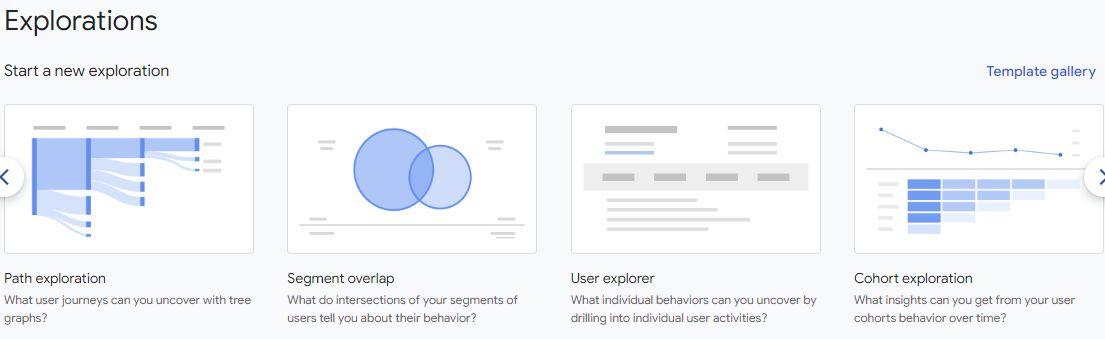
1. In the left-hand navigation in GA4 go to ‘Explore’

2. Click ‘User Explorer’ in the provided tiles (you may need to use the arrows to show the option)
3. In the Variables column, add the desired dimensions and metrics to your list using the ‘+’. ‘App-instance ID’ is a pre-filled required dimension.
4. In the User Explorer data table, click on an ‘App-instance ID’ to view the details of that users sessions on your site.
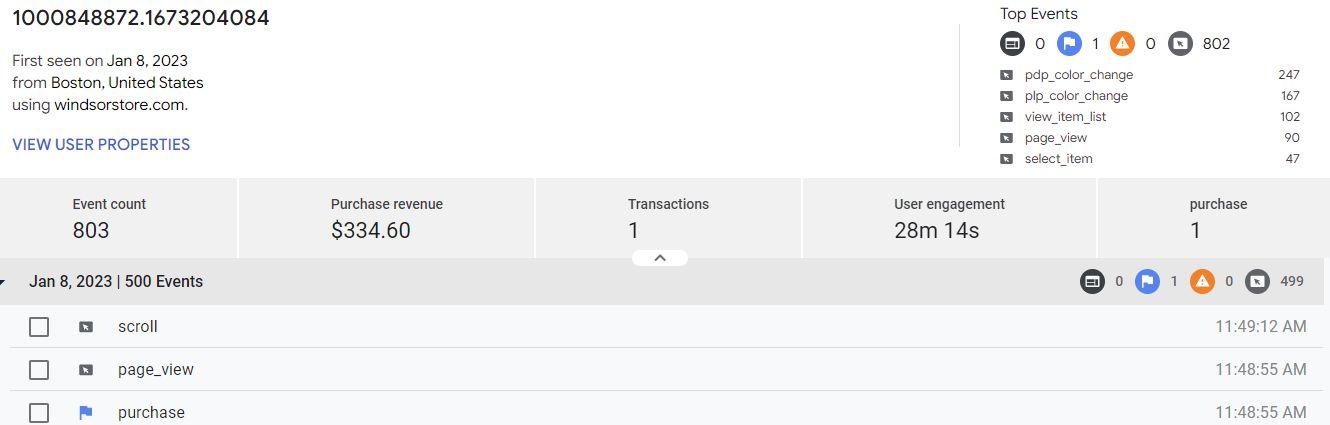
The provided summary will show you all the event that occurred during each user session. Flags represent conversions.
To create a Cohort Exploration report follow these steps:
1. In the left-hand navigation in GA4 go to ‘Explore’
2. Click ‘Cohort Exploration’ in the provided tiles (you may need to use the arrows to show the option)

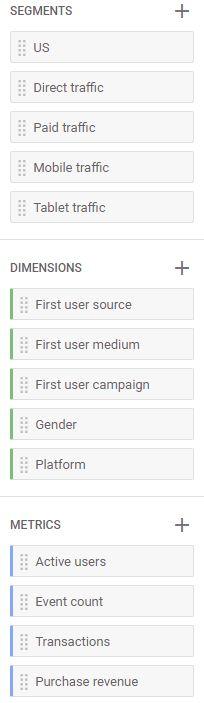
3. In the Variables column, add the desired dimensions, metrics and segments to your list using the ‘+’.
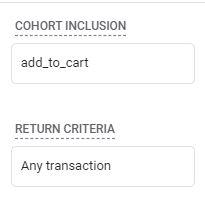
4. In the ‘Tab Settings’ column, choose a ‘Cohort Inclusion’. This is the event (or event groups) that needs to be triggered during a session to include a user in the cohort being analysed. Next, choose a ‘Return Criteria’. This is the event (or event group) that needs to be triggered to register a user as having ‘returned’ These 2 configurations bound your cohort.
5. In the ‘Tab Settings’ column, choose a ‘Calculation’. This is how user activity across the exploration period contributes to the metric calculation in each cell.
You can choose:
Standard - each cell includes all cohort users who meet the return criteria regardless of what they do in other periods. The metric displayed in the cell is the total for that individual period.
Rolling - each cell includes all cohort users who meet the return criteria for that period as well as all previous periods. The metric displayed in the cell is the total for that individual period.
Cumulative - each cell includes all cohort users who meet the return criteria in any period in the exploration. The metric displays the cumulative total value for each period.
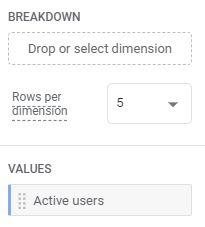
6. In the ‘Tab Settings’ column, you can also add a breakdown dimension, and a metric in the ‘Values’ section
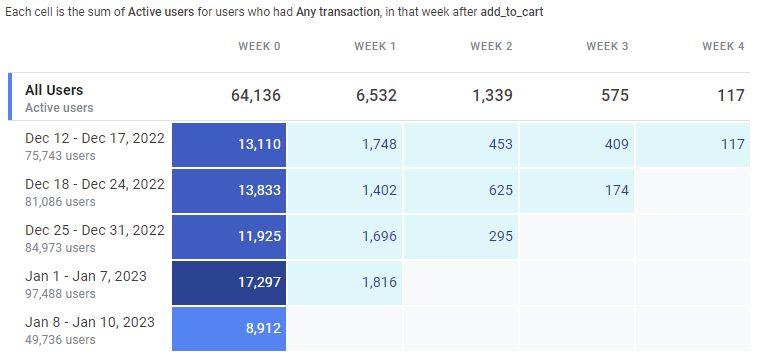
7. In the Cohort Exploration, you will now see how many of your users (or other chosen metric) that are included in each cohort.
Day/Week/Month 0 represents the time period that a user was acquired. If a user completed a transaction, for example, during week 0, they made a purchase on their first visit.

To create a User Lifetime report follow these steps:
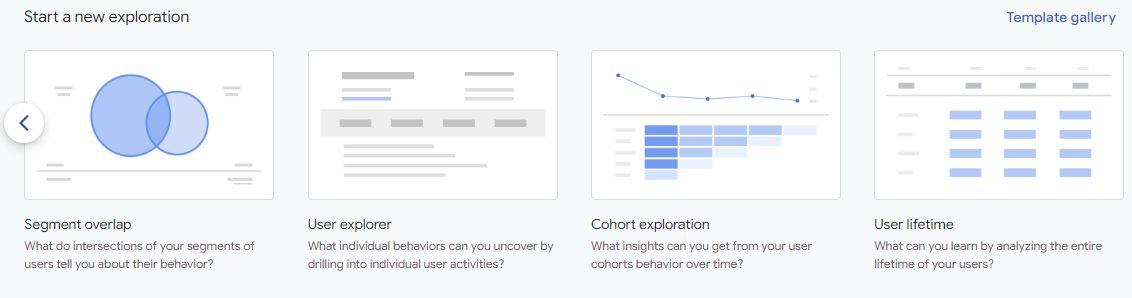
1. In the left-hand navigation in GA4 go to ‘Explore’

2. Click ‘User lifetime’ in the provided tiles (you may need to use the arrows to show the option)

3. In the Variables column, add the desired dimensions, metrics and segments to your list using the ‘+’.
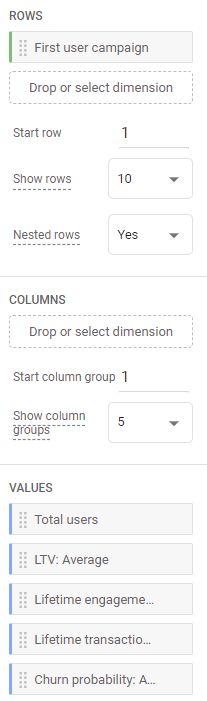
4. In the ‘Tab Settings’ column, drag and drop dimension(s) into your ‘Rows’ and ‘Columns’ (optional) section. Drag and drop metrics into your ‘Values’ section.
The User Lifetime Report is very much a Free Form Report that has user lifetime values and configuration and interaction with the report follows the same steps.
6. In the ‘Tab Settings’ column, you can also add a breakdown dimension, and a metric in the ‘Values’ section
7. In the Cohort Exploration, you will now see how many of your users (or other chosen metric) that are included in each cohort.
Day/Week/Month 0 represents the time period that a user was acquired. If a user completed a transaction, for example, during week 0, they made a purchase on their first visit.
To create a Segment Overlap report follow these steps:
1. In the left-hand navigation in GA4 go to ‘Explore’
2. Click ‘Segment Overlap’ in the provided tiles.


3. In the Variables column, add the desired segments, breakdown dimensions and metrics using the ‘+’.
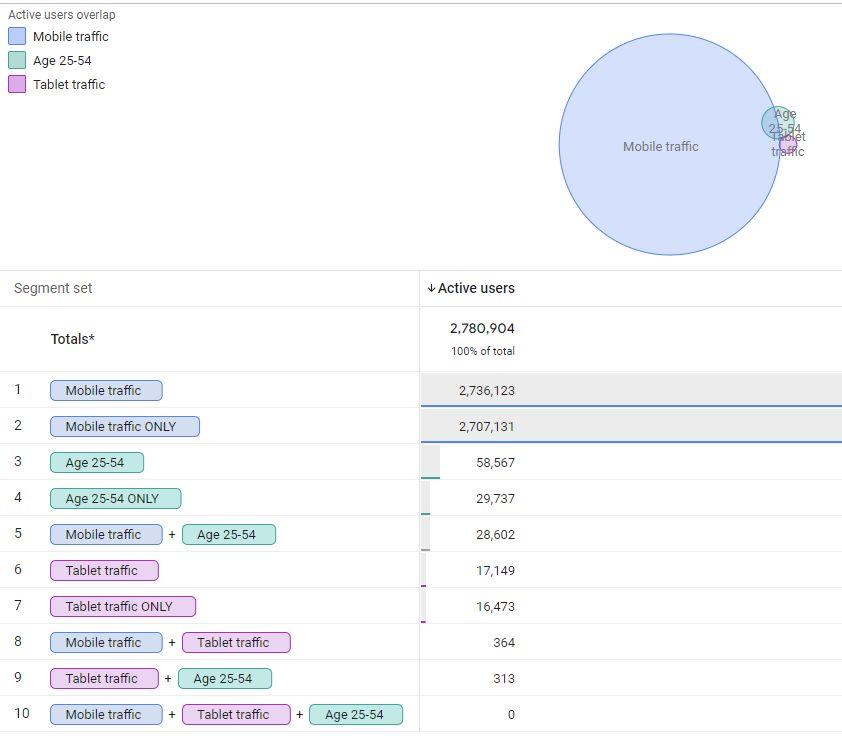
4. In the ‘Tab Settings’ column, drag and drop the segments into the ‘Segment Comparisons’ section. Add a dimension into your ‘Breakdowns’ (optional) section. Drag and drop metrics into your ‘Values’ section. The segment overlap report will then show you a data table and visualization that breaks down each variant of your choices and provides a value.
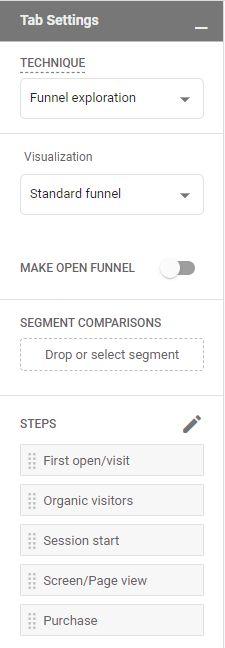
To the right you will find some example steps and events to define this funnel.
The Shopping Funnel can be customized to the insight you are looking for. These steps are provided as a starting point, feel free to customize and edit as you see fit.
You can also make funnels to see how users proceed after interacting with a site feature if you were curious how effective your new hero is at converting, for example.
In this scenario you would want to add step and determine an event for a click on your hero after the first and second step.
To create a Shopping Funnel follow these steps:
1. In the left-hand navigation in GA4 go to ‘Explore’
2. Click ‘Funnel Exploration’ in the provided tiles
To create a Shopping Funnel follow these steps:
3. In the ‘Tab Settings’ column click the pencil icon beside ‘Steps’
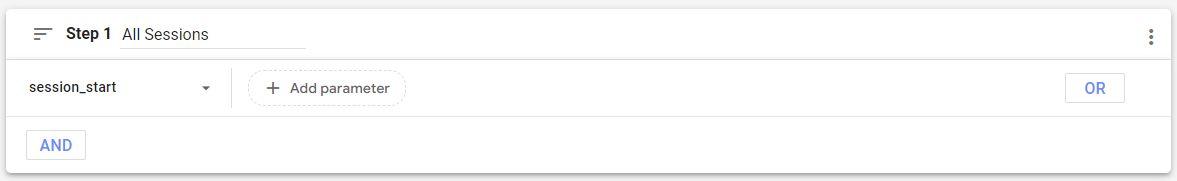


4. Define each step in your funnel.
You can use any dimension you like to specify what that ‘step’ in your funnel is using the drop-down. Use the ‘+’ to specify a parameter.
For a general funnel, you likely want to choose the event ‘session_start’ from the drop-down and leave the ‘add parameter’ selection blank as your first step.


5. Continue to define steps in your funnel.
You can use the top row to specify if the next step must directly or indirectly follow the previous one and how much time can elapse between completed steps. This allows you to have a strictly defined or loosely funnel.
To create a Shopping Funnel follow these steps:
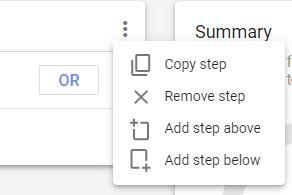
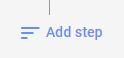
6. Add additional steps as required. You can make a funnel that is larger than the default of 5 steps. Click the ‘Add step’ button at the bottom of the list of steps to add a step at the end. You can also add a step in between existing steps using the 3 dots button on an existing step.
Play around with strictly and loosely defined funnels and timing to see how the results change. ‘Directly followed by…’ is generally only appropriate for very specific analysis where you want to analyse very specific user behaviour.
To create a Checkout Funnel follow the same steps as the Shopping Funnel, however, this time define steps that would only happen during the checkout process.
To the right you will find the recommended steps and events to define this funnel. Note: You may want to exclude the ‘Session Start’ step if you are interested in only seeing sessions that started a checkout to do checkout abandonment analysis.
To create a Shopping Funnel follow these steps:
3. In the ‘Tab Settings’ column click the pencil icon beside ‘Steps’
4. Define each step in your funnel.
You can use any dimension you like to specify what that ‘step’ in your funnel is using the drop-down. Use the ‘+’ to specify a parameter.
For a general funnel, you likely want to choose the event ‘session_start’ from the drop-down and leave the ‘add parameter’ selection blank as your first step.
5. Continue to define steps in your funnel.
You can use the top row to specify if the next step must directly or indirectly follow the previous one and how much time can elapse between completed steps. This allows you to have a strictly defined or loosely funnel.
To create a Shopping Funnel follow these steps:
6. Add additional steps as required. You can make a funnel that is larger than the default of 5 steps. Click the ‘Add step’ button at the bottom of the list of steps to add a step at the end. You can also add a step in between existing steps using the 3 dots button on an existing step.
Play around with strictly and loosely defined funnels and timing to see how the results change. ‘Directly followed by…’ is generally only appropriate for very specific analysis where you want to analyse very specific user behaviour.

The Shopping Funnel Report is set out with your steps in order from left to right. Your first step is on the far left and your last step is on the far right.
The report has blue bars that represent the number of users at each step. These should go down progressively as you move from left to right (unless your site is doing an exceptional job converting!). Beside each Step name there is a %. This is the number of users that progressed from the previous step.


The table below shows you more detail on the Users, Completion rate, abandonments and abandonment rate. You can also add a Breakdown dimension to get more detail about your step data (e.g. adding in Device will breakdown each row in the table into the 3 device types).
Learning places where your users are dropping out of your funnel can help you identify opportunities for refining your site experience.
The Shopping Funnel Report is set out with your steps in order from left to right. Your first step is on the far left and your last step is on the far right.
The report has blue bars that represent the number of users at each step. These should go down progressively as you move from left to right (unless your site is doing an exceptional job converting!). Beside each Step name there is a %. This is the percentage of users that progressed from the previous step.
The table below the bars shows you more detail on the Users, Completion rate, abandonments and abandonment rate. You can also add a Breakdown dimension to get more detail about your step data (e.g. adding in Device will breakdown each row in the table into the 3 device types).
Learning places where your users are dropping out of your funnel can help you identify opportunities for refining your site experience.