Group 4-7
Year 2 | Semester 2
BA Arch
Department of Architecture
School of Design and Environment
National University of Singapore
AY2022/2023

Group 4-7
Year 2 | Semester 2
BA Arch
Department of Architecture
School of Design and Environment
National University of Singapore
AY2022/2023
Measuring & Experiencing
AR1329 | Climate. Ecology & Architecture
Prof. Heinzelmann Florian
Mr. Joel Lau
Huang Zitao
A0239208A
Xu Chenxiao
A0239094X
Wang Tianyun
A0238022R
Zhang Xuanqi
A0236544A
SECTION 1 | SITE ANALYSIS
Oasis Terraces
SECTION 2 | 4 CONDITIONS
Forest Park
Aircon Alley
Sealed Surface
SECTION 3 | INDIVIDUAL ROOM
Zitao's Room at PGPR
Chenxiao's Room at RVRC
Tianyun's Room at RC4
Xuanqi's Room at Jurong East HDB

The new neighbourhood centre and polyclinic at Punggol was envisioned together by, “Serie Architects” and “Multiply Architects” in 2017.
The design concept is to construct a light and open frame that accommodate multiple programs and functionalities, in conjunction with the slopped terrace that knit together the community and the landscape.


On the waters edge is an 800sqm sheltered community plaza with a 4-storey-tall column-free clear space.
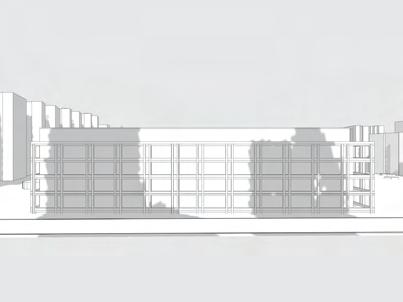
 Rendered view of 11am on Jan 27, 2023, the date of site visit
The C-shape massing creates a self-shading effect for the central "courtyard".
The central green area slopes down towards the waterway, allowing for light and air to penetrate the building.


 Water Playground
Hammock Deck
Jumping Water Jets
Garden Cabana Deck
Oberservation and Findings:

September 1700
In March and September, the sun is exactly above the Equator and travels along a similar sunpath. The terrace and roof experiences more direct and stronger sunlight, and are expected to have higher luminance and temperature. Throughout the year, the east facade of Oasis Terraces is shaded by its neighbouring buildings in the morning. In June, when the Earth's north pole is at its maximum tilt, Oasis Terraces's west facade has a longer exposure to the sun.


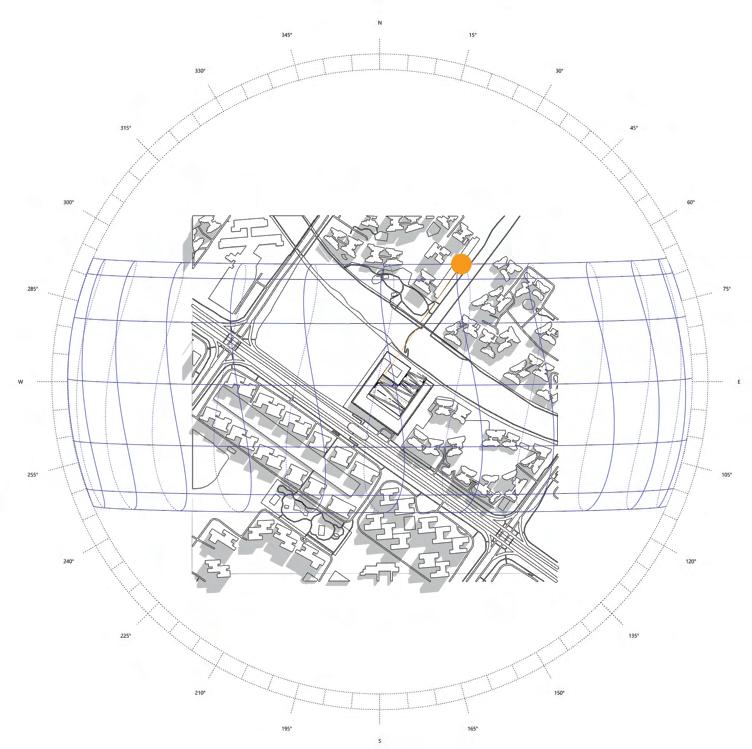

Due to the building's orientation, the west facade of Oasis Terraces is heated more by the afternoon sun in the first half of the year (from March to September). Especially in June, from 4pm to 6pm, the west facade is fully exposed to the sun.
The south side of the building is connected to Oasis LRT station. Yet in December, there would be some sun glare at noon.
The presence of neighboring HDBs blocks Oasis Terraces and prevents it from the morning sun glare especially in the second half of the year (from September to next year March).


As the neighboring buildings cast shadow on the east facade of Oasis Terraces, we expect it to be have less sun glare. However, the annual glare simulation shows otherwise. The luminance level is still too high to be tolerable. Thus there is still a need for sun shading.
Both east and west facades actually use concrete wall rather than full glazing for a more comfortable working environment of 500 lux. The simulation of both facades with the solid concrete wall justifies its effectiveness.



Annual wind rose shows that prevailing winds come from northeast and south, which correspond to Oasis Terraces' orientation and typology. Together with the south wind, it appears that cross-ventilation is likely to form to cool the entire atrium.


Thus we hypothetise that Oasis Terraces is designed such that the slope increases wind velocity and drives air flow especially at the ground floor.
January wind direction tallies with site visit measurements and experiences.


In order to verify our hypothesis on the massing strategy, we compared the terrace slope with a void and a rectangular box on the site location respectively.
Test 1: No building on the existing terrain
Test 2: Building massing as a 6-storey-high flat rectangle
Observation: Wind speed increases dramatically and abruptly around the borders of the rectangular massing.
Test 3: Actual design, which contains a slope
Top View (left)
Isometric View (right)
Observation: The increase in air velocity along the terraces is more gradual. A low pressure zone down the atrium is also created to draw air in, evident in the less dense tracing lines that envelope the rectangular massing.
Conclusion: The slope facilitate air flow and venturi effect is set up on the ground floor.


Level 6 (Rooftop)
East Corridor
Temperature: 28.5°C
Relative Humidity: 70.9%
Wind Speed: 1.2-2.5m/s
Luminance: 35 klux (10 klux under the shade)
Level 6 (Equipment room)
Along South Corridor
Temperature: 30°C
Relative Humidity: 68.9%
Wind Speed: 2.1m/s
Luminance: 7831 lux -69 klux
Level 6 (Rooftop)
East End, towards the River
Temperature: 30°C
Relative Humidity: 68.2%
Wind Speed: 2.3m/s from the river
Luminance: 16.7-41.1 klux
Level 6 (Rooftop) Gym, West Side

Temperature: 31.4°C
Relative Humidity: 62.8%
Wind Speed: 0.5m/s
Luminance: 4779 lux -53.6 klux
Level 6 (Rooftop)
East Garden


Temperature: 29.8°C
Relative Humidity: 66%
Wind Speed: 3.9m/s
Luminance: 10.7 klux
Level 6 (Rooftop)
Sealed Surface, West End
Temperature: 31°C
Relative Humidity: 61.4%
Wind Speed: 2.4 -5.5m/s
Luminance: 61.4 klux
Level 5
East Corridor
Temperature: 30°C
Relative Humidity: 63%
Wind Speed: 1.2m/s
Luminance: 500 lux
Level 3 (LRT Entrance)


Sheltered Sealed Surface
Temperature: 28°C
Relative Humidity: 61.4%
Wind Speed: 0.6m/s
Luminance: 36 klux
Level 5 (Terrace) Water Playground

Temperature: 29.5-31°C
Relative Humidity: 70%
Wind Speed: 2.3 -3.3m/s
Luminance: 60 klux (20 klux under the trees)
Level 4 (Terrace)


Rain Garden
Temperature: 30°C
Relative Humidity: 65%
Wind Speed: 4m/s
Luminance: 20 klux
Level
Temperature: 27°C
Relative Humidity: 71.5%
Wind Speed: 1m/s
Luminance: 100 lux
Level 1 (Atrium)


Community Plaza
Temperature: 26.7°C
Relative Humidity: 70.7%
Wind Speed: 1.5m/s
Luminance: 13.4 klux
2 (Staircase) towards Shopping MallIn order to make climatic data more visually readable and easier to understand, we have created radar diagrams and defined five dimensions.
The four measurable dimensions are luminance, wind speed, temperature and humidity. The fifth dimension is green-to-sealed surface ratio. It is estimated and added so as to differentiate data collected from green space and sealed man-made visually.
Being inside and outside the community plaza have different experiences. Near the river bank, the wind speed is higher and temperature is lower.
The radar diagram is meant to describe the differences visually using shapes or patterns.


The sets of data collected at Oasis Terraces tally with the general environmental condition in Singapore, where better natural ventilation is needed for optimal comfort. In other words, higher wind speed is needed to lower the high humidity level.
Among all the locations, rooftop park and gym are closest to the comfort zone. Here, a link between activity and choice is location is drawn. The rooftop with good natural ventilation fulfill the requirements for exercising, to bring in fresh air and take away excess heat and water vapor.
Increase in Relative Humidity Increase
 Purple Squares: Singapore's Condition
Rooftop Garden and Gym
Oasis Terraces has a characteristic and consistent use of pergola on its rooftop as a replacement of conventional fully-covered shelter.

Although not protective from the rain, such device can reduce sun glare up to 80% based on measurements.
Gym and east garden are the top two most comfortable places among all, largely due to the pergola that provide shade and also facilitate air flow.
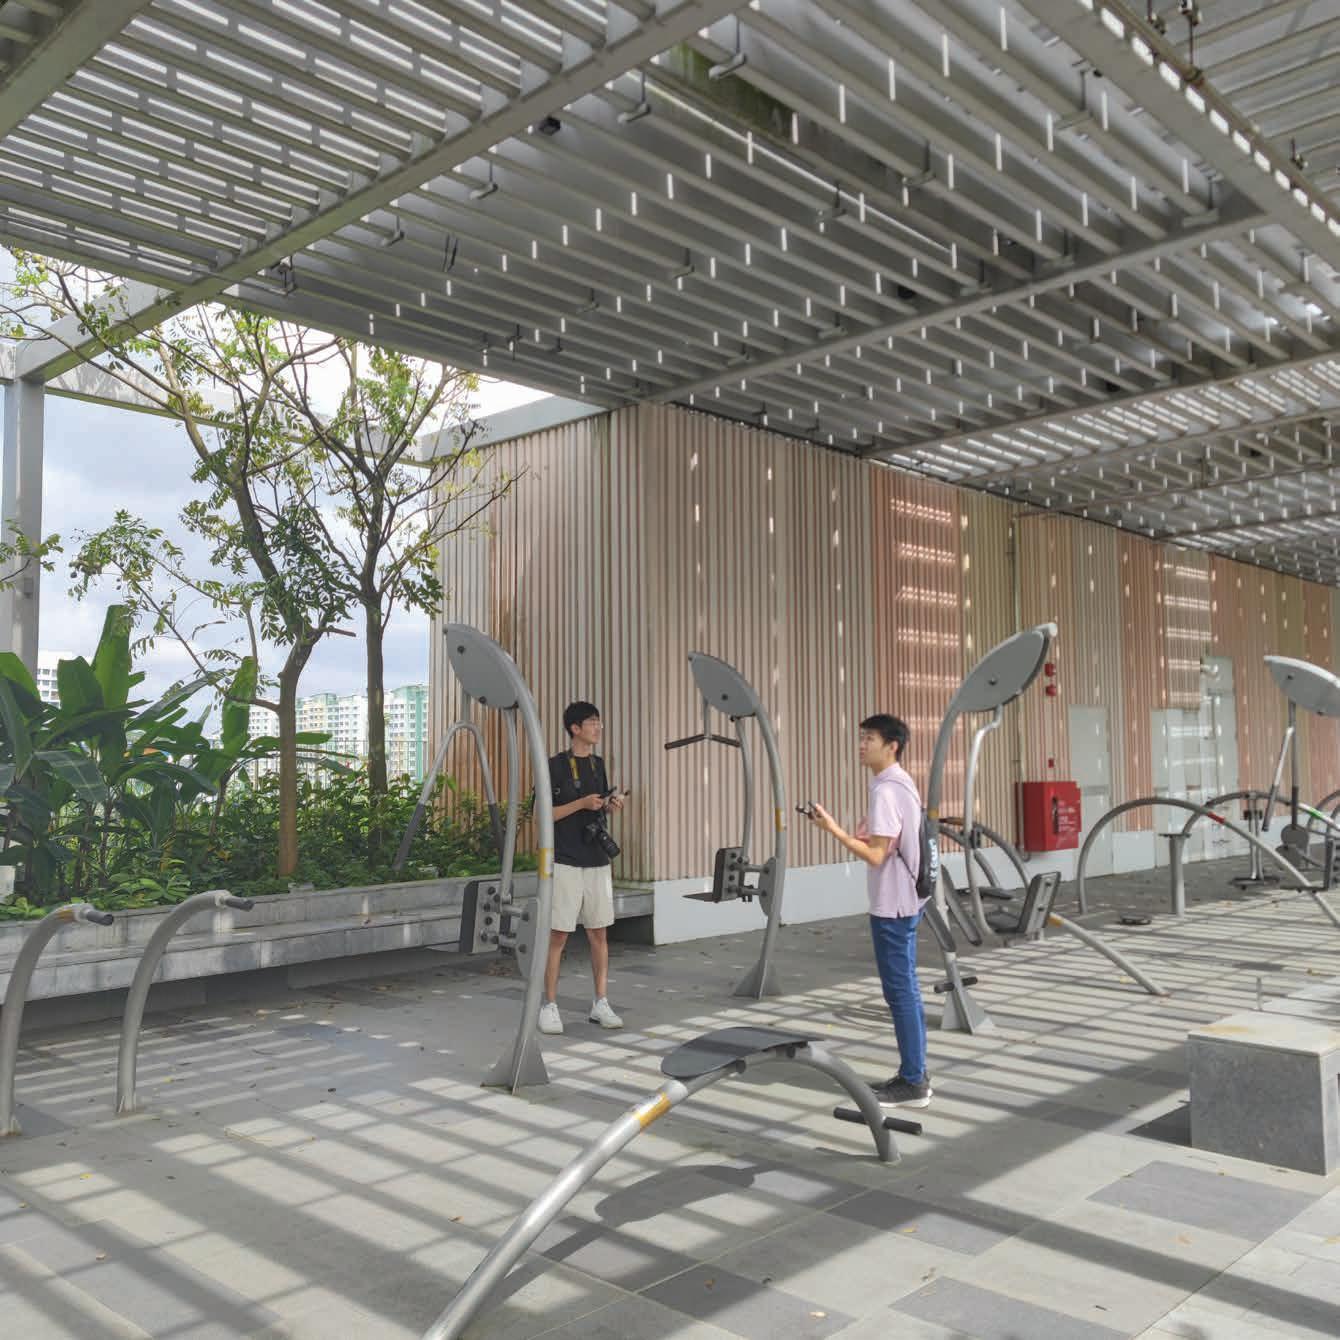
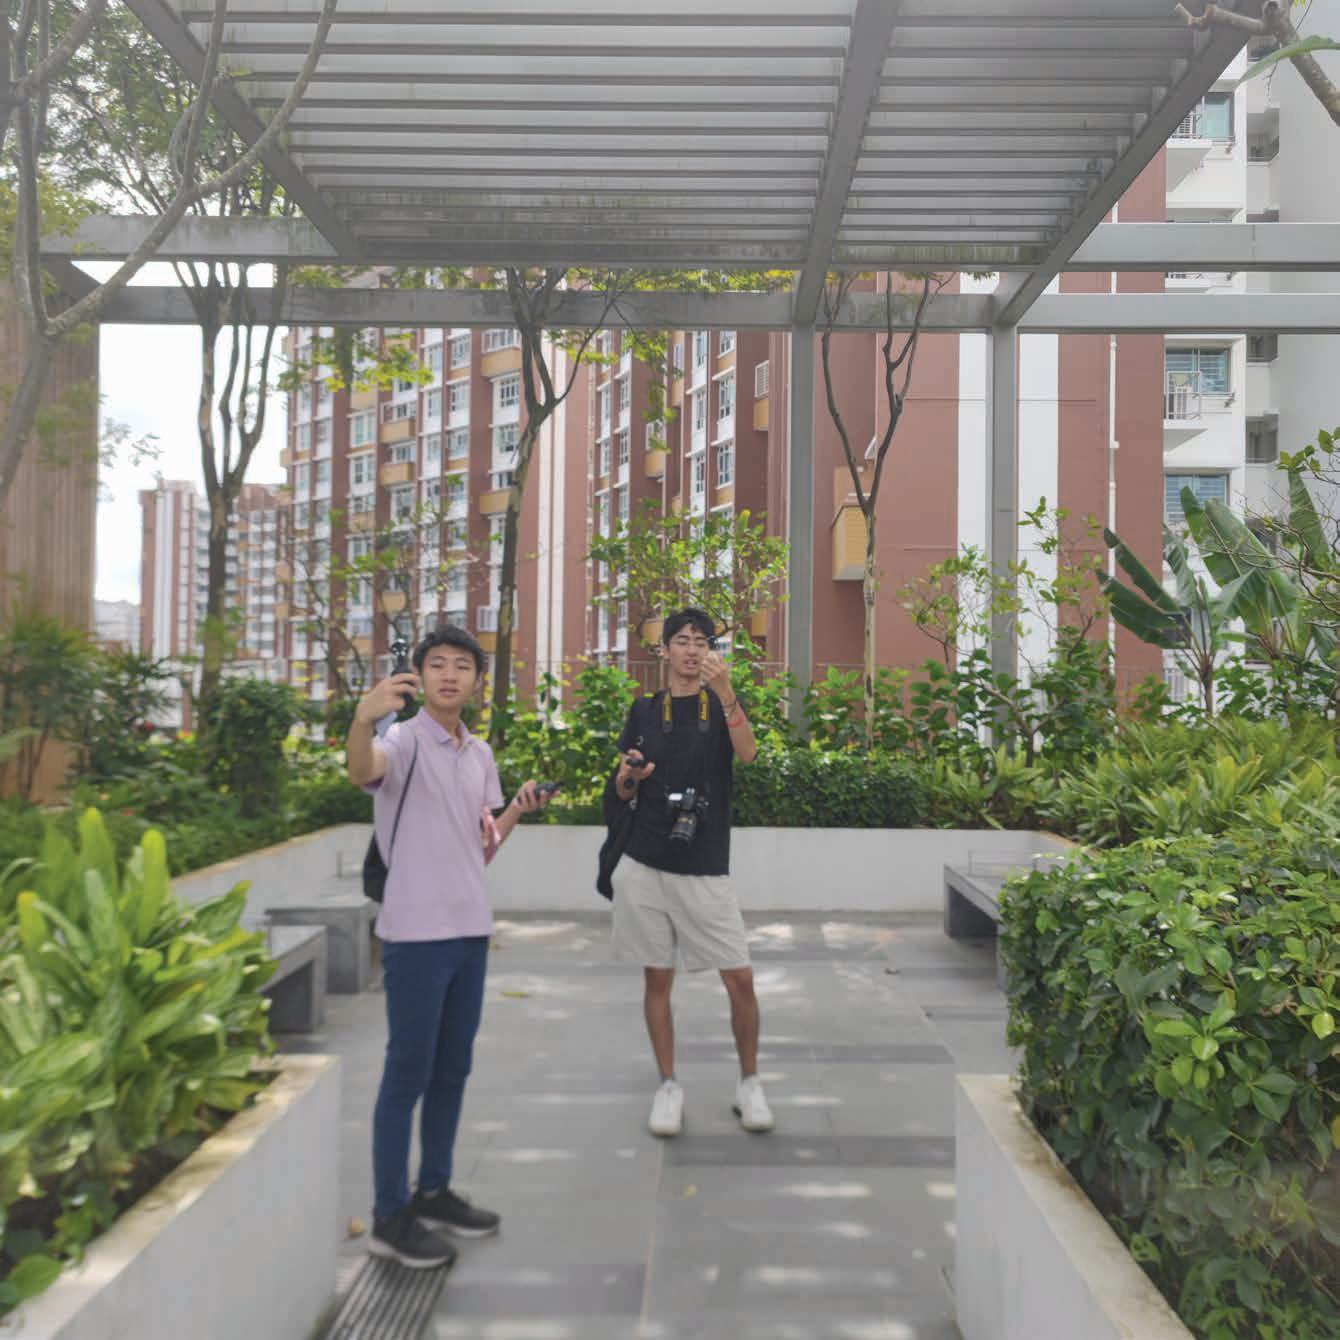


The design leverages on the high wind speed at rooftop to evaporate humid air generated at gym and greeneries.
Wall are recessed to create corridor or balcony so as to reduce sun glare. Yet the additional layer of translucent black roller blind makes the space gloomy and somewhat depressing.
To improve, operable louvres could be used to cature the beauty of light and shades.

Atrium or community plaza does not perform as good as we expected. The 4-storey high space is stuffy and warm because the full-height glass panel between plaza and terraces hinders the air flow.

A possible solution is to use monsoon window to replace the glass, so that the plaza is protected from rain and has good ventilation.
 Rooftop Sealed Surface Rooftop Gym
Rooftop Garden at Southeast Corner
Rooftop South Corridor
Level 5 East Corridor
Level 5 East Corridor
Ground Floor Atrium
Ground Floor Atrium
Annual Average Luminance of Selected Regions: 26882 lux
Annual Average Luminance of Entire Rooftop: 32156 lux
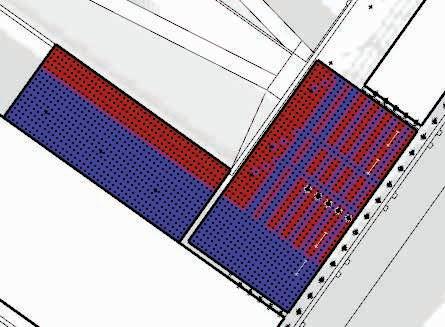


Through it is still bright at rooftop especially in the afternoon, the pergola shading devices have effectively reduce a significant percentage of sun glare, as evident in the clear color distinction between the shaded and unshaded areas.


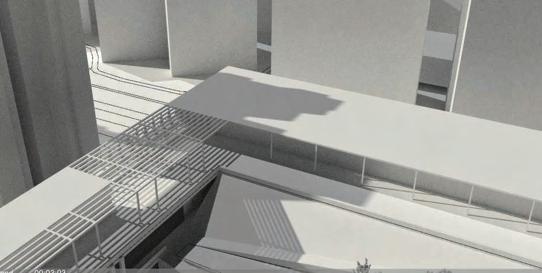


Rooftop Garden at Southeast Corner


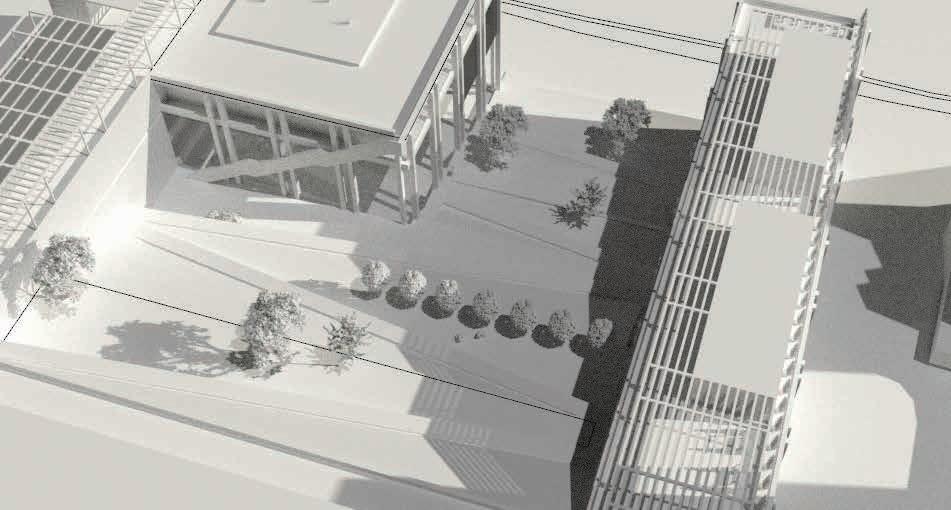


Self-shading effect of the C-shape massing is justified, as shown in blue regions. While unshaded terraces appear very bright and hot in the simulation result, the actual situation is better with the trees.

Recession in facade reduces a portion of sun glare but black blinds are still needed mainly in the afternoon. The necessity of using blinds is illustrated on the left, as they lower the brightness by over 80%.


Annual Average Luminance without Blinds: 10717 lux
Annual Average Luminance with Blinds: 1871 lux
Annual Average Luminance without Blinds: 9438 lux


Annual Average Luminance without Blinds: 7733 lux
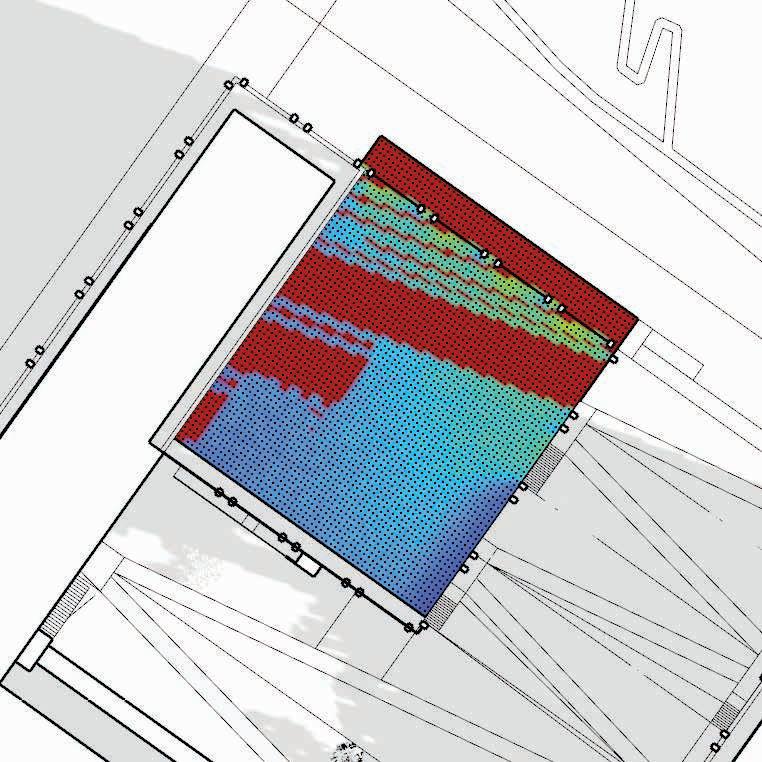


Inside and outside the plaza has a large difference in luminance level. Thus the plaza may feel dark due to such comparison, though it is mostly above 1000 lux. Similar to corridors, blinds are incorporated but this time the shading effect of blinds is less obvious as they can only cover two fifths of the height.


Bishan Park
Little India Chinatown
Bayfront
Bukit Timah Nature Reserve Pulau Ubin Forest 1 Aircon Alleys Sealed Surface Forest 2 Park
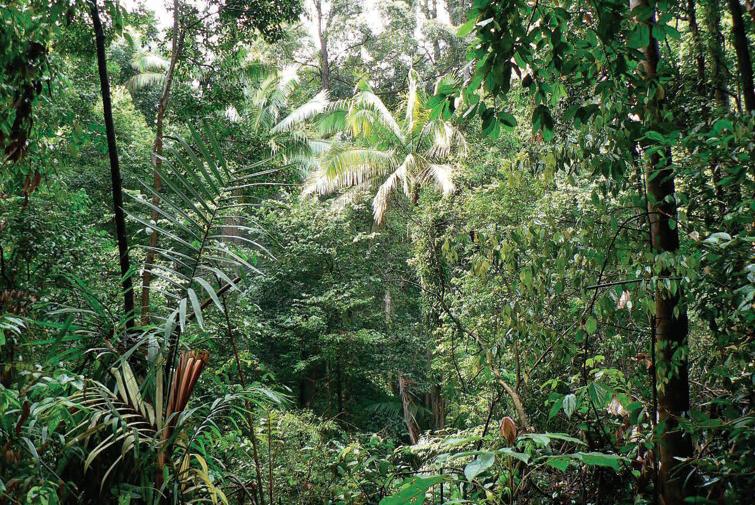


Aircon


Sunny, Measured on Jan 27


Sunny, Measured on Jan 27


Rainy, Measured on Jan 23
Rainy, Measured on Jan 23
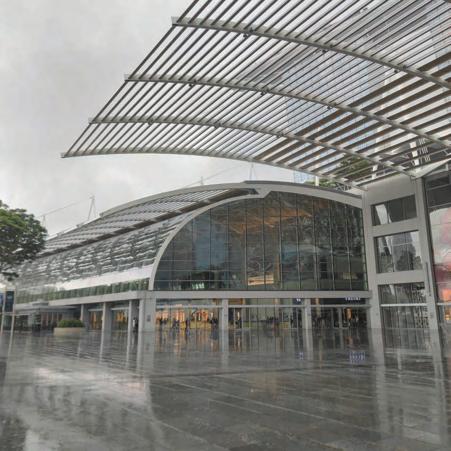


On the psychometric chart, the data points of Oasis Terraces largely overlap with those of park, aircon alley and sealed surface. They stray away from the forest data points, which are closer to the comfort zone in general.

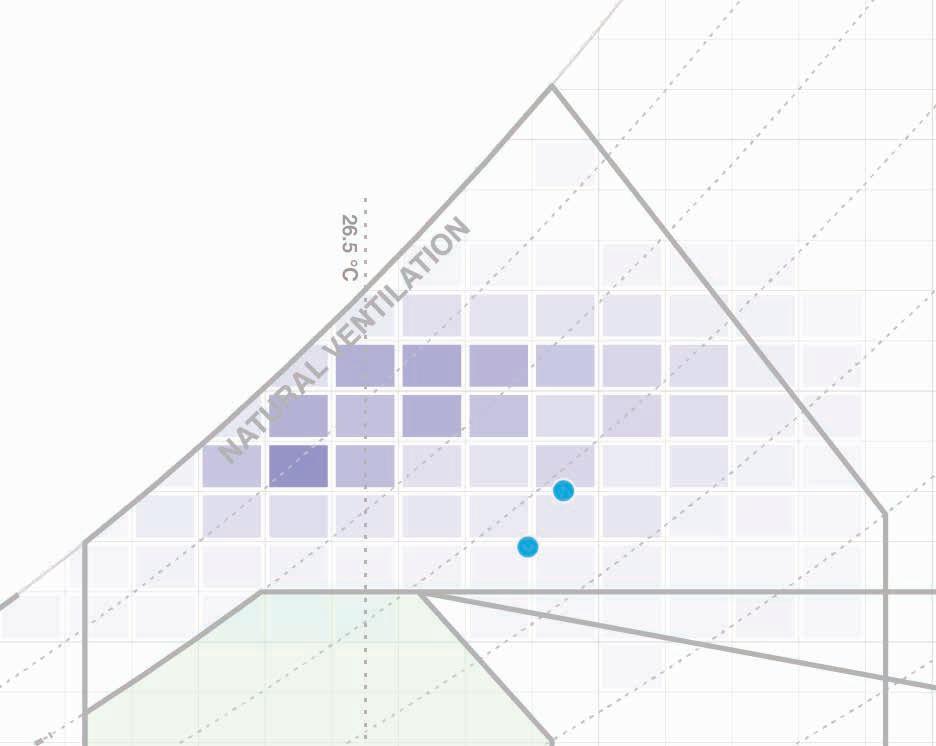


However, that does not imply that Oasis Terraces and these locations give visitors the same sensation. Based on our physical experience, the rooftop of Oasis Terrace, for example, was much more cooling and comfortable than the sealed surface even though the data points overlap. This is because the rooftop of Oasis Terraces has good natural ventilation, which improved the comfort level there. In other words, the intervention suggested by the psychometric chart is already in place.

Chenxiao's Room at

 Tianyun's Room at RC4

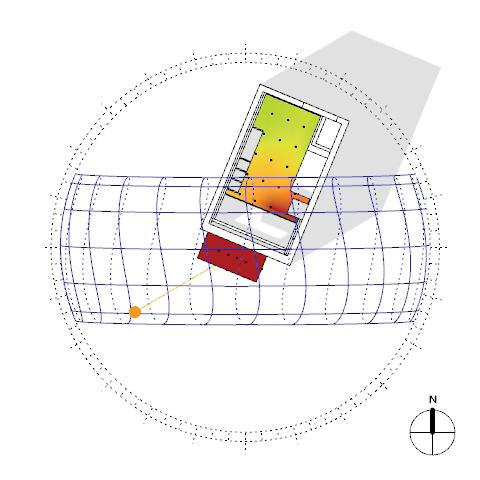
Residential College 4 (RC4) is located at the north end of NUS University Town. It is next to College of Alice and Peter Tan (CAPT) and former Yale-NUS College. Surrounded by many low-rise buildings including New Town Secondary School, RC4 is rather exposed to direct sunlight, hardly shaded by neighboring buildings.
My room located at level 9 is usually bright and hot in the afternoon. Thus this report focuses on the afternoon sun glare analysis.


RC4 is slightly only shaded by Yale-NUS and CAPT in the late afternoon about 1.5 hour before sunset.

Morning sun is only observed at CAPT side not at RC4.
RC4: North and south facades are not exposed to low-angle sunlight, thus only has overhangs.


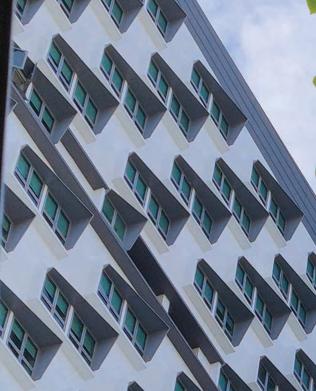


Tembusu College: Half-Surrounding Shading to protect from the sun glare in the early morning and late afternoon

Each overhang has a specific width of 760mm, which is roughly half of the full height of the window.
 My Room at Level 9, south-facing


Why does the wind close my door only in the second half of the year?
Can I not close my window when it rains?
The diagram shows Level 9 layouts and wind direction in the first half of the year. In the second half of the year, the wind direction reverses (from south to north instead). When the south wind is heavy especially on rainy days, it can shut the door of my room.


The wind direction also affects the direction of rain. In other words, from January to June, even if I do not close my window, the rain would not be blown into my room, whereas from June to December, I have to close the window otherwise my bed would be wet.
Suites usually have their doors closed, so cross-ventilation mainly occurs in the corridor.
Where should I take the measurements?
4. Door
Measure with the door open to understand the air flow and ventilation. The measurement also serves as a comparison between indoor and semi-outdoor environments.


2. Bed

Although I spend less time here during daytime (7am7pm), this is an important location to evaluate its comfort level.
Three layers of sun-shading devices:
1. Desk
This is a place where I spend most of my time. It is expected to be the most comfortable spot as the fan is directly above and there is a good distance from the window.
3. Window Brings in lighting and wind. It is where the shading devices start to function.

On sunny days single ventilation driven by the ceiling fan works better than cross ventilation driven by wind because of the L shape corridor.

As hot air is less dense and rises, the fan can effectively speeds up air flow, thus it works better than wind.
However, on overcast days when the ex terior, meaning the corridor or outside the window is much cooler (about 2°C) than the interior, 1 and 2 which are in the middle of the room are warmer than 3 and 4.


Annual average luminance of accessible corridor at eye level (1200 mm): 1048 lux


My room with blind fully open
My room is generally bright with blinds fully open (on sunny days), but the sun glare is largely imperceptible. Yet, I have the habit of leaving my blind half open to achieve a comfortable brightness level for working and resting (around 300 lux).

In the afternoon, due to the orientation of the building and the lower sun angle, sunlight is converged to a point between the desk and the bed that is super hot.




As sun glare mostly occurs in the early morning or late-afternoon due to the low sun angles, it seems that the beauty of sunrise and sunset is overlooked. For me, they are meaningful and special moments that mark the start and end of my day. They decorate my room, every day, so that my room is truly livable, not only in climatic aspects, but also in a psychological way.
 Watching the shadow of my plant gradually fades away as the sun rises is a pleasant and soothing experience.
