WAIPAHU TRANSIT-ORIENTED DEVELOPMENT INFRASTRUCTURE ASSESSMENT REPORT
IDENTIFYING CAPACITIES, NEEDS AND OPPORTUNITIES AUGUST 2019
PREPARED BY SUWAN SHEN
ASSISTANT PROFESSOR, DEPARTMENT OF URBAN AND REGIONAL PLANNING, UNIVERSITY OF HAWAIʻI MANOA IMELDA CARLOS
GRADUATE RESEARCH ASSISTANT PLAN 642 URBAN INFRASTRUCTURE PLANNING
STUDENTS: BRANDON SOO, ELIZABETH DIONNE, JOHN CANNER, KISHOR BHATTA, MATTHEW FERNANDEZ, MILES NISHIOKA, MINTU MIAH, RAFAELA DE MELO BARROS, SILVIA SULIS, WESLEY BRADSHAW
Page intentionally left blank.
TOD COLLABORATION STUDY
2
TABLE OF CONTENTS
EXECUTIVE SUMMARY
OF THE PROJECT ORGANIZATION OF THE REPORT FINDINGS
PART I: INTRODUCTION AND BACKGROUND
CHAPTER 1: INTRODUCTION
Existing Conditions: Transportaion Roadway Network Sidewalk and Crosswalk Bike Lane Bus Operation and Facility Existing Conditions: Sewer System Existing Conditions: Drainage Network
CHAPTER 2: COMMUNITY NEED ASSESSMENT
Community Survey
PART II: FUTURE SCENARIO ANALYSIS
CHAPTER 3: BUILD-OUT ANALYSIS
Maximum Build-out Scenario Travel Demand Parking Stormwater Runoff Sewer Projection
CHAPTER 4: SUITABILITY ANALYSIS
Multi-modal Transportation Green-Infrastructure
PART III: RECOMMENDATIONS
CHAPTER 5: BEST PRACTICES
Transportation Stormwater Management Sewer Management
CHAPTER 6: FINDINGS AND RECOMMENDATIONS
INFRASTRUCTURE ASSESSMENT
06 OVERVIEW
POLICY RECOMMENDATIONS ACKNOWLEDGEMENTS 09
10
10 Background
21
24
24
34
45
45
58 REFERENCES 60 3
TOD COLLABORATION STUDY 4
LIST OF TABLES AND FIGURES
FIGURE 1: TOD MAP RAIL ROUTE
FIGURE 2: MAP OF THE STATE PARCEL
FIGURE 3: MAJOR ROAD/STREETS IN MOKUOLE ST./FARRINGTON HWY
FIGURE 4: MAJOR ROAD/STREETS IN WAIPAHU ST./FARRINGTON HWY
FIGURE 5: SIDEWALK FARRINGTON HWY.
FIGURE 6: CROSSWALK FARRINGTON HWY.
FIGURE 7: MAP OF BIKE FACILITIES
FIGURE 8: MAP OF BUS FACILITIES
FIGURE 9: MAP OF SEWER FACILITIES
FIGURE 10: MAP OF STORMWATER FACILITIES
FIGURE 11: DRAINAGE CONDITION IN FARRINGTON HWY.
FIGURE 12: MAP OF FLOOD ZONES
FIGURE 13: MAP OF 3.2 SEA-LEVEL RISE EXPOSURE
FIGURE 14: MAP OF COMMUNITY FAVORITE PLACE
FIGURE 15: MAP OF COMMUNITY MOST OFTEN USED PLACE
FIGURE 16: MAP OF COMMUNITY LEAST FAVORITE PLACE
FIGURE 17: SEVERITY OF ISSUES: TRANSPORTATION
FIGURE 18: SEVERITY OF ISSUES: GREEN INFRASTRUCTURE
FIGURE 19: DESIRED IMPROVEMENT: TRANSPORTATION
FIGURE 20: DESIRE IMPROVMENT: GREEN INFRASTRUCTURE
FIGURE 21: ZONING MAP NO.8
FIGURE 22: MAP OF STATE PARCELS
FIGURE 23: TRIP GENERATION CALCULATION STEPS
FIGURE 24: INTENSITY-DURATION-FREQUENCY (IDF) CURVE FOR 10 AND 100-YEAR RETURN PERIOD
FIGURE 25: ZONING MAP TOD
FIGURE 26: RUNOFF FLOW RATE AND GREEN SPACE
FIGURE 27: SUITABILITY ANALYSIS STEPS
FIGURE 28: TRANSPORTATION SUITABILITY ANALYSIS FACTORS
FIGURE 29: TRANSPORTATION SUITABILITY ANALYSIS SCHEMATIC DIAGRAM
FIGURE 30-31: TRANSPORTATION SUITABILITY ANALYSIS RESULT
FIGURE 32-33: GREEN INFRASTRUCTURE SUITABILITY ANALYSIS RESULT
FIGURE 34-35: POTENTIAL LOCATIONS FOR GREEN INFRASTRUCTURE PROJECTS
FIGURE 36: GREEN INFRASTRUCTURE SUITABILITY ANALYSIS FACTORS
FIGURE 37: GREEN INFRASTRUCTURE SUITABILITY ANALYSIS SCHEMATIC DIAGRAM
TABLE 1: MAXIMUM BUILD-OUT SCENARIO
TABLE 2: ROAD SEGMENT AND NUMBER OF TRIPS
TABLE 3: ROAD SEGMENT AND NUMBER OF TRIPS OF ≤ 10% TRIPS
TABLE 4: PARKING ESTIMATION
TABLE 5: RUNOFF CALCULATION FORMULA
TABLE 6: STORMWATER RUNOFF DATA AND SOURCE
TABLE 7: SEWER CALCULATION FORMULA
TABLE 8: CURRENT AND FUTURE ESTIMATION OF WASTEWATER SERVICE
TABLE 9: SUITABILITY ANALYSIS DATA AND SOURCE
TABLE 10: TRANSPORTATION SUITABILITY ANALYSIS FORMULA
TABLE 11: TRANSPORTATION SUITABILITY ANALYSIS CRITERIA AND WEIGTHTING
TABLE 12: GREEN INFRASTRUCTURE SUITABILITY ANALYSIS FORMULA
TABLE 13: GREEN INFRASTRUCTURE SUITABILITY ANALYSIS CRITERIA AND WEIGTHTING
TABLE 14: GUIDELINESS FOR MINIMUM PARKING TOD
INFRASTRUCTURE ASSESSMENT
5
EXECUTIVE SUMMARY
Overview of the Project
Supported by University of Hawaii Community Design Center (UHCDC) and State of Hawaii Office of Planning, this project provides infrastructure planning suggestions for the City & County of Honolulu and the State of Hawaii to meet the established goals for Transit Oriented Development (TOD) in Waipahu, particularly for the state-owned land. Through a graduate course PLAN 642 Urban Infrastructure Planning, students and graduate assistant in Urban and Regional Planning department (DURP) at the University of Hawai‘i Mānoa (UHM) participated in the project and obtained service learning opportunities through academic instruction, site visit, and interaction with the practitioners, government agencies, and the general public. The project is part of a teaching practice and outreach initiative led by the UHCDC. The initiative provides a platform for students, faculty, and partnered professionals to collaborate on interdisciplinary applied research, planning, and design projects that serve the public interest. This project particularly addresses the infrastructure concerns for the statewide TOD development using Waipahu as a case study.
The project is organized into three phases; review of the existing condition and community needs, future demand analysis, and policy recommendations. In the first phase, students evaluate the existing condition in field trips under the guidance of practitioners from state and city and county agencies. To understand the community’s perception and needs for infrastructure improvements, they also conducted a community survey during the field trip. In the second phase, students and graduate assistant collected data, interviewed key stakeholders, and applied the analytical methods learned in PLAN 642 to estimate the future travel demand, stormwater runoff, and sewer discharge for the build-out scenario. Lastly, to address the problems identified, best practices are reviewed to make suggestions for the study area. Suitability studies are conducted using geographical information system to find the most suitable areas for implementing the suggestions.
Organization of the Report
The report is comprised of seven chapters in three parts, covering an overview of existing conditions, capacity and community needs assessment, estimation of future demand, best practices review, and suggestions of policy tools.
This Executive Summary begins the report, summarizes objective of the report, findings, and policy recommendations. The remainder of the report is divided into three parts:
Part I: Introduction and Background - comprises two chapters summarizing the current condition of infrastructure and facilities in Waipahu, and the prevalent issues and needs for improvement revealed through existing study review and community survey;
Part II: Future Scenario Analysis - is composed of two chapters on build-out analysis and suitability analysis. The build-out analysis is conducted for a maximum development scenario based on current TOD zoning and stakeholder interview. The analysis estimates the future travel demand, parking needs, stormwater runoff, and sewer projection. The suitability analysis then identifies areas in need of improvements given the identified problems;
Part III: Recommendations - summarizes the lessons learned and policy suggestions considering local characteristics, city goals, and the review of best practices from the literature.
TOD COLLABORATION STUDY
6
Findings
1. For transportation planning, it is found that a maximum build-out scenario for the state parcel in Waipahu would significantly increase the traffic on adjacent roads, especially for Mokuola street and Waipahu street. The maximum development would also increase the parking demands by seven times. To reduce the congestion and fulfill the needs for parking, either the capacity of the adjacent roads and parking lots needs to be expanded or strategies promoting non-auto based trips need to be prioritized.
2. To facilitate non-auto travel in particular, there are high needs to improve the multimodal transportation facilities along Paiwa St., Farrington Hwy, Awainui St., Mokuola St. Farrington Hwy. Awalau St., and Farrington Hwy.
3. For stormwater management, development of state parcels and the TOD area in general would increase the overall stormwater runoff in the watershed by 12.6%, which would make the existing flooding problem worse. However, to solve the flooding problem, would require efforts at the watershed scale. Without upstream mitigation, grey infrastructure or retention/detention ponds, it would need approximately 80% of the TOD development to be green spaces/pervious surfaces in order to keep the future runoff at the current level.
4. Suitability analysis identifies areas such as such as Waipahu Depot, Farrington Hwy and the state parcels are suitable for green infrastructure in the watershed.
5. For wastewater discharge, under the maximum build out scenario, the state parcels could generate almost eight times the current sewer discharge. Considering the capacity of 24’’ sewer main is 1.78 times of the 18’’ sewer main, it means that if the current volume/capacity ratio for the 18’’ sewer main exceeds 17.8%, there would be a need to upgrade the 24’’ sewer main pipe in future.
6. Finally, there is a need to examine the condition and needs for other utilities such as water and power if data become available in future.
Policy Recommendations
1. Improve of public transit, pedestrian, and bicycle facilities and services. Waipahu TOD would benefit from a reduction in future traffic and parking needs if public transit and walking friendly environment are prioritized. It is recommended to improve the an extensive network of pedestrian and bicycle facilities, add more bus connections with more frequent services, and implement strategies such as bus-only lanes where possible;
2. Encourage shared and adaptable parking. To reduce and accommodate the future parking needs, it is recommended to eliminate minimum parking requirements, implement districtlevel parking maximum, adopt regulations and incentives encouraging shared-parking, as well as regulations allow new parking structures to be adaptable to other uses to anticipate the emerging trends (e.g. autonomous shared vehicles, sea level rise). Compact mixed-use development as one objective of the TOD, is a catalyst for increasing parking efficiency and reducing the amount of parking needed in the area;
INFRASTRUCTURE ASSESSMENT
7
3. Adopt Green Infrastructure. Both the existing study and students’ community survey suggest the community’s strong interest in walkability, provision of green spaces for recreation, and the needs to mitigate flooding. Green infrastructure has the potential to address all these concerns. It is recommended that planners consider greenways, green corridors, green spaces, green roofs in TOD areas if possible. Although green infrastructure could not solve the area’s flooding problem by itself, it has the potential to reduce the stormwater runoff and fulfill the community’s needs if implemented correctly;
4. Evaluate decentralized Wastewater System. Given the potential significant increase in sewer discharge, besides the expensive upgrade of the pipelines in centralized wastewater system, it is recommended to examine the possibility of using decentralized wastewater treatment, which can reduce the overflow incidents from centralized system and have the technical flexibility to relocate and adapt to the changing climate if extreme weather becomes more frequent. Decentralized sewer that put emphasis on wastewater recycling system can also reduce the demand on public water infrastructure and water resources.
TOD COLLABORATION STUDY
8
ACKNOWLEDGEMENTS
This project was made possible through funding from the University of Hawaii Community Design Center and the State of Hawaii Office of Planning.
Stakeholder engagement was essential to the success of this project. We would like to thank those who supported and participated in this research over the past year:
• State of Hawaii Office of Planning;
• Honolulu Authority for Rapid Transportation;
• City and County of Honolulu, Deptartment of Transportation Services;
• City and County of Honolulu, Department of Planning and Permitting
• City and County of Honolulu, Deptartment of Facility and Maintenance;
• City and County of Honolulu, Department of Environmental Services;
• City and County of Honolulu, Office of Climate Change, Sustainability, and Resiliency
• Oahu Metropolitan Planning Organization
• State of Hawaii Dept. of Health;
• State of Hawaii Dept. of Transportation;
• We would like to express our gratitude for all the valuable support, devotion and constructive comments from Senator Donovan Dela Cruz, Leo Asuncion, Harrison Rue, Lee Sichter, Ryan Tam, Andrew Tang, Dean Sakamoto, and many others.
Research of the principal investigators was supported by students and faculty from Urban and Regional Planning Department at the University of Hawai i. We would like to thank the graduate research assistant and the students in PLAN 642 from Department of Urban and Regional Planning, Department of Civil Engineering, and Department of Geography and Environment: Imelda Carlos, Yamato Milner, Kristin Dembia , Brandon Soo, Elizabeth Dionne, John Canner, Kishor Bhatta, Matthew Fernandez, Miles Nishioka, Mintu Miah , Rafaela de Melo Barros, Silvia Sulis, Wesley Bradshaw.
INFRASTRUCTURE ASSESSMENT
9
BACKGROUND
PART I: BACVKGROUND ANALYSIS
CHAPTER 1: INTRODUCTION
Supported by University of Hawaii Community Design Center (UHCDC) and State of Hawaii Office of Planning, this project intends to examine the current condition and future needs of urban infrastructure in Waipahu Transit Oriented Development (TOD) area, particularly for the state owned land, and provide suggestions to the City & County of Honolulu and the State of Hawaii to facilitate future infrastructure planning. To achieve this objective, this chapter starts with an examination of the existing condition of urban infrastructure (i.e. transportation, sewer, drainage facilities) in Waipahu region. By reviewing the existing studies, collecting and visualizing the appropriate data, this chapter provides the study background and serves as the foundation for the analyses in the following chapters to identify the needs and opportunities for future infrastructure development.
BACKGROUND
In response to the congestion challenges and the State’s concerns for long term sustainability, the Honolulu Authority for Rapid Transit (HART), a semi-autonomous local government agency initiates the Honolulu Rail Transit project. The project consists of a 20-mile long elevated fixed guideway rail system with 21 stations (see figure 1), aiming to mitigate traffic congestion between a long stretch of transportation corridors, connecting Ala Manoa Center in the central urban core of Honolulu to East Kapolei in West O‘ahu.
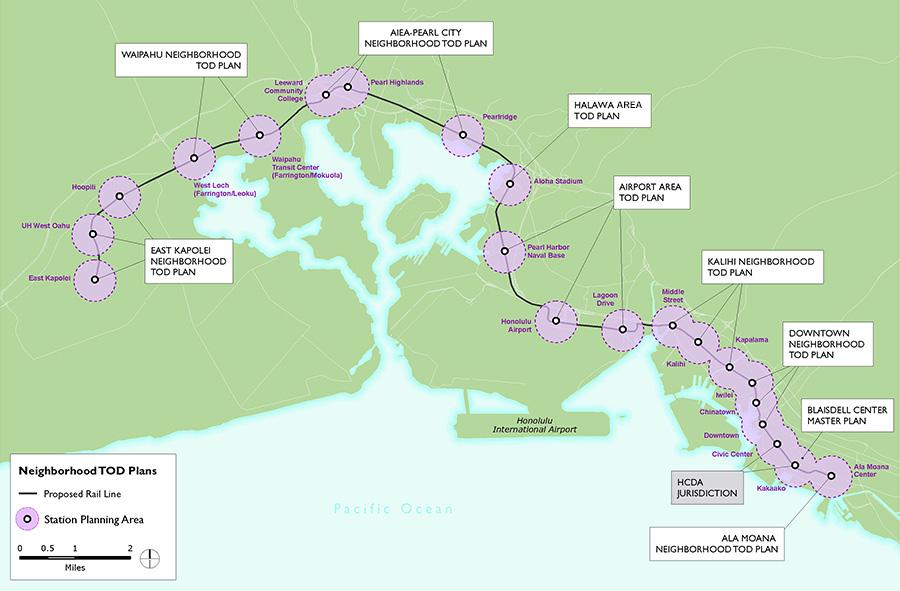
Figure 1. TOD map rail route (source: City and County of Honolulu, 2016).
Since the State of Hawai‘i is the largest landowner along the 20-mile rail transit corridor, owning approximately 2,000 acres of land within a half-mile radius of the 21 stations, it provides an unique opportunity for the state as a land owner to lead the TOD development to address challenges such as environmental sustainability, affordable housing, neighborhood revitalization and social justice issues., To facilitate the planning for the TOD development, Act 130, Session Laws of Hawai‘i, 2016, leads to the establishment of the State TOD Council to coordinate and facilitate the TOD Planning among state agencies, and to foster greater collaboration between the state and the city and county.
TOD COLLABORATION STUDY
10
However, questions remains about existing urban infrastructure’s ability to accommodate the planned development. As a pilot project, this project focuses on exploring the capacities, needs, and opportunities for the existing urban infrastructure to accommodate the future growth in TOD area using Waipahu in central Oahu as a case study. Waipahu is a town of over 41,000 population locating in Central O‘ahu. The average annual vehicle miles traveled (VMT) per household is 21,000, with 9 percent of residents commuting to work via public transit1.The average commute time to work for Waipahu residents is 36 minutes2. Waipahu has a walk score of 49, all indicating it is car-dependency3
Along the 20 miles corridor, two stations are planned for the town of Waipahu. Several plans have been created for future development in Waipahu area. The most recently adopted plans for Waipahu TOD are the Waipahu Town Neighborhood TOD plan and Waipahu Town Action Plans led by the City and County of Honolulu Department of Planning & Permitting (DPP). These plans communicate social facets within the local community and translate the community’s concerns into short and long-term visions, design guidelines, and a set of near-term strategies for neighborhood improvement.
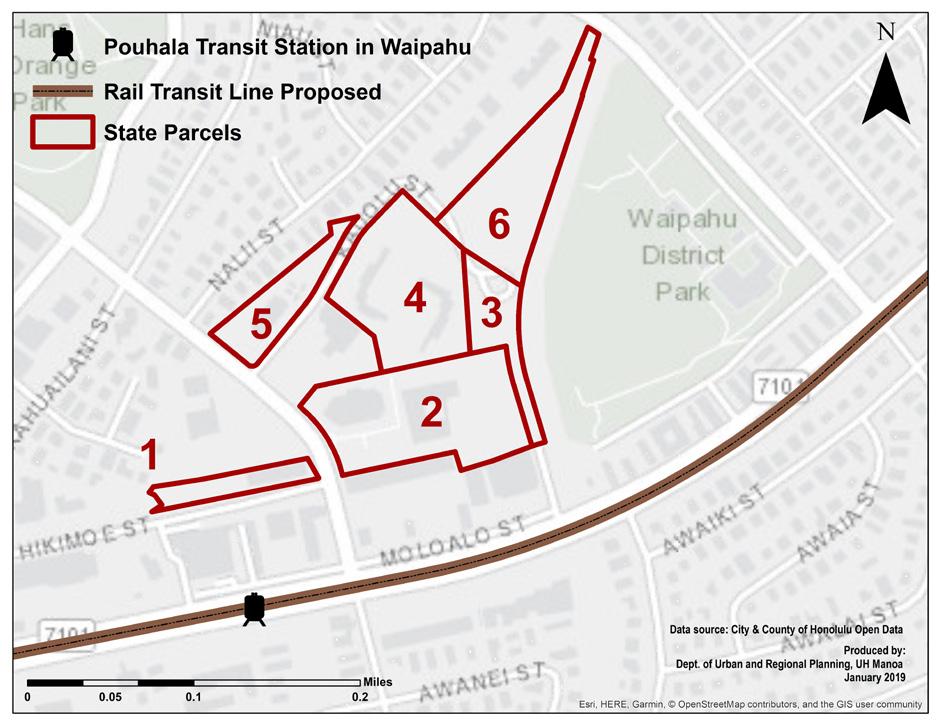
Figure 2. Map of the six state-owned parcels in TOD area.
Waipahu Neighborhood TOD Plan 2014 is a vision plan based on a series of community planning effort. The plan set out six guiding principles for Waipahu neighborhood, including maintaining the local character of the place, enhancing the “green network”, creating a safe pedestrian-first environment, providing mixed-income housing, inter-modal transportation network, creating a mixed-use village-like setting in the core areas.
Waipahu Town Action Plan 2017 describes key goals, projects, and strategies identified by the community to improve the area around the future Pouhala Transit Station. The plan identified eleven near term actions, including six priority actions and area-wide actions such as Waipahu Transit Center upgrade, street lighting upgrade, connecting Hawaii’s Planation Village to Waipahu Town Core, implementing placemaking strategies, address areawide flooding, and establishing areawide wayfinding4
The prevailing themes of both plans are centered on promoting connectivity, accessibility, and
1 H+T Factsheet. (2017). Location efficiency metric.
2 U.S Census. (2018). Quick facts Waipahu CDP, Hawaii.
3 Walk Score. (n.d). Walk score cities in Hawaii.
4 City and County of Honolulu. (2017). Waipahu Town Action Plan, p.4.
INFRASTRUCTURE ASSESSMENT
11
safety. One of the key objectives of the Waipahu Town Action Plan is to reshape streets as places for pedestrian-based activity and alternative modes of movement to automobiles. To support multi-modal options, the plan calls for more walkable streetscapes through the provision of street furniture, shade trees, landscaping features, pedestrian and bicycle facilities, better street crossings, and better street lighting at night.
In addition to these two plans, Bill 74 (2015) of the City and County of Honolulu is equivalently relevant as it describes City’s plans for TOD. Bill 74 establishes a blueprint for TOD special districts island-wide. The objectives of the TOD special district are to promote multimodal transportation, a mixture of activity and housing types around the rail transit stations, more compact development and appropriate densities to support transit ridership rates, streetscape amenities and architectural features that create a comfortable environment for pedestrians and bicyclists and reduce minimum parking requirements. The goal of such regulations is to support the creation of vibrant, mixed-use developments, and quality community gathering places around transit stations, as well as to support alternative transportation modes other than private motor vehicles.
With these in mind, this study focuses primarily on infrastructure needs assessment for the eastern station in Waipahu, known as Pouhala Station, with particular attention to the six parcels owned by various state agencies within half-mile radius of the rail station (see figure 2). These parcels currently serves as the Waipahu Civic Center (parcel 2), retail businesses (parcel 1), Hawaii Housing Finance and Development Corporation (HHFDC) (3,5,6) and Hawaii Public Housing Authority (HPHA) (parcel 4). By exploring the future development potential and the associated infrastructure needs for these state owned lands, this report intends to offer infrastructure planning recommendations to help the State of Hawaii to achieve the planning goals identified in the aforementioned Waipahu Town Action Plan, Waipahu Neighborhood TOD Plan, and Bill 74.
TOD COLLABORATION STUDY
12
EXISTING CONDITIONS
The following section provides information on the existing conditions of infrastructures in Waipahu pertaining to transportation, wastewater, and drainage facilities. It is worth noting that the Pouhala rail station and part of the surrounding TOD area are in the relatively low-lying areas, which are often impacted by flooding during intense rainfall. The infrastructures, both above and underground, may be subject to sea-level rise (SLR) impacts and other climate hazards in the near future.
TRANSPORTATION Roadway Network
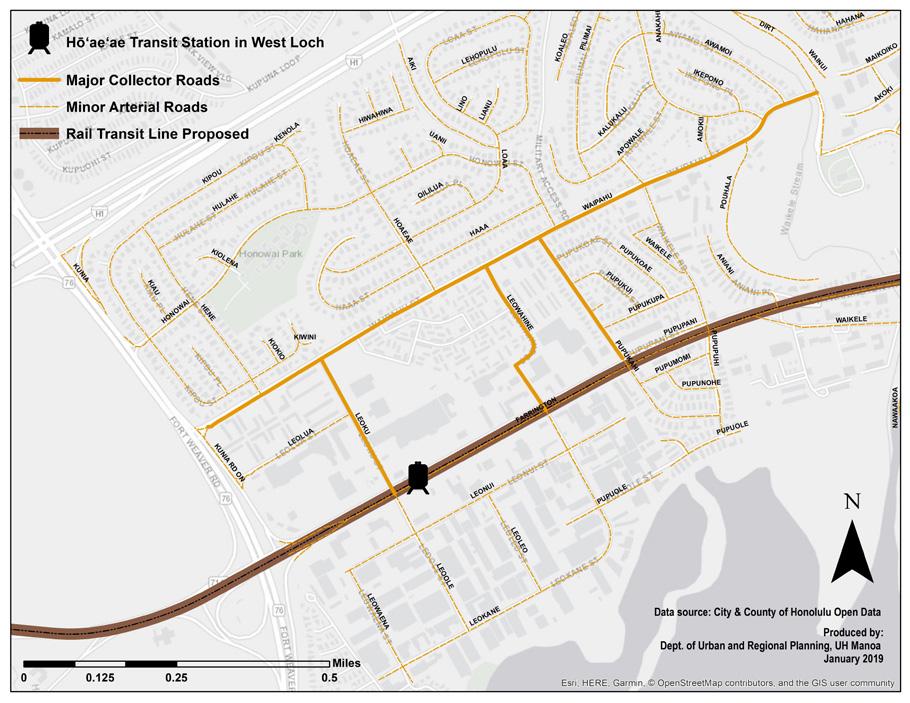
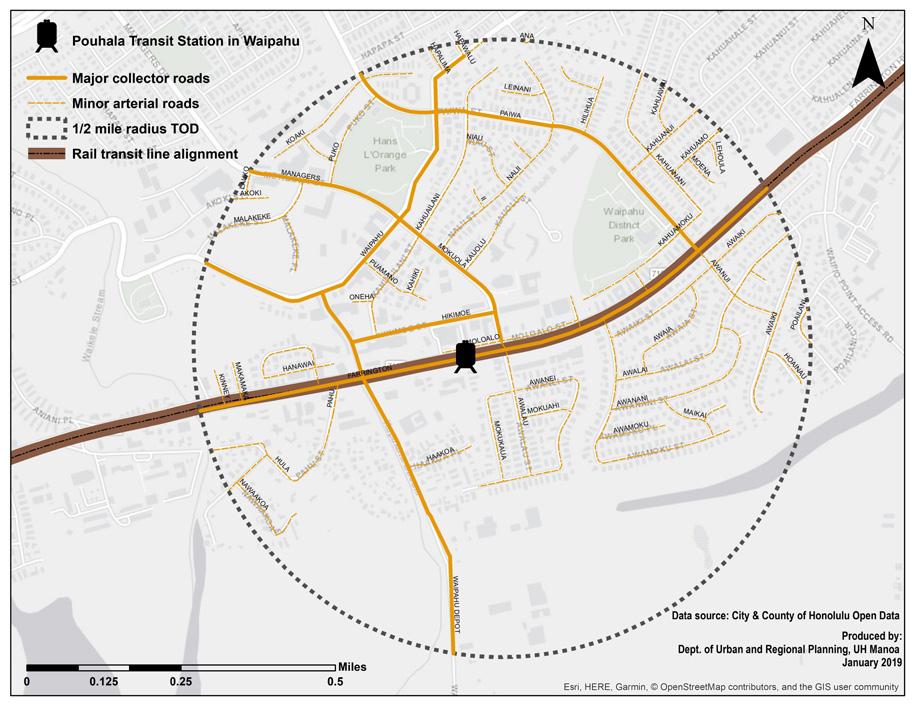
The study area is surrounded by four arterial roads (i.e. Farrington Highway, Kamehameha Highway, Kunia Road and Waipahu Street) and several collector streets. Farrington Highway is a prime arterial. Kamehameha Highway and Kunia Road are both north-south major arterial roadways situated within the east and west fringes of Waipahu. Between the H-1 freeway and Farrington Hwy, minor arterial Waipahu Street traversing in an east-west direction. North-south major collector streets are Paiwa Street and Waipahu Depot Road. Mokuola and Leoku Streets traverse in a north-south direction (see figure 3 & 4). The rail station is proposed near this intersection along Farrington Hwy. Most local roads have limited connectivity with surrounding
Figure 3. Major road and streets in Mokuola St./Farrington Hwy.
Figure 4. Major road and streets in Waipahu St./Farrington Hwy.
INFRASTRUCTURE ASSESSMENT
13
BACKGROUND
land use. In the Waipahu Neighborhood TOD Plan, it is reported that Due to the lack of exclusive bus lanes, traffic queue jump lanes, transit signal priority treatments, and left-turn lanes, the level of service (LOS) for Farrington Hwy is significant worse than LOS on other adajcent roads5 .
Sidewalk and Crosswalk
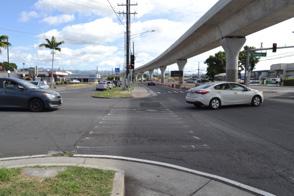
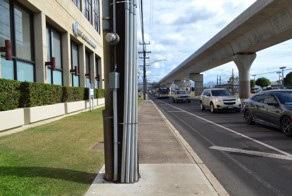
The Waipahu Neighborhood TOD Plan Existing Condition Report6 shows over 90% of the streets within a one-quarter mile of the Farrington/Leoku station have sidewalks on both sides of the road with an average width of between four to six feet. The site visit of PLAN 642 class confirms that there are sidewalks on Farrington Hwy, Mokuola St., Hikimoe St., and Waipahu Depot St but also reveals some problems. Although most of the adjacent roads have sidewalks, some segments (e.g. Depot Road) are covered by long grass and shrubs, which restrain their accessibility and walkability. There is also an inconsistency in sidewalk width. Additionally, in some locations (see figure 5 and 6) utility poles are placed in the middle of the sidewalks. Besides affecting the public right of way, these obstructions limit awnings and sidewalk signage, which are common amenity in walkable urban center or TOD area.
TOD COLLABORATION STUDY
Figure 5. Condition of sidewalk on Farrington Hwy. (Source: Imelda Carlos 01/19)
Figure 6. Condition of crosswalk on Farrington Hwy.
5 LLP Pollacks, V.M.W. (2007). Waipahu neighborhood transit-oriented development plan, Existing Condition Report. 6 LLP Pollacks, V.M.W. (2007). Waipahu neighborhood transit-oriented development plan, Existing Condition Report. 14
Bike Lane
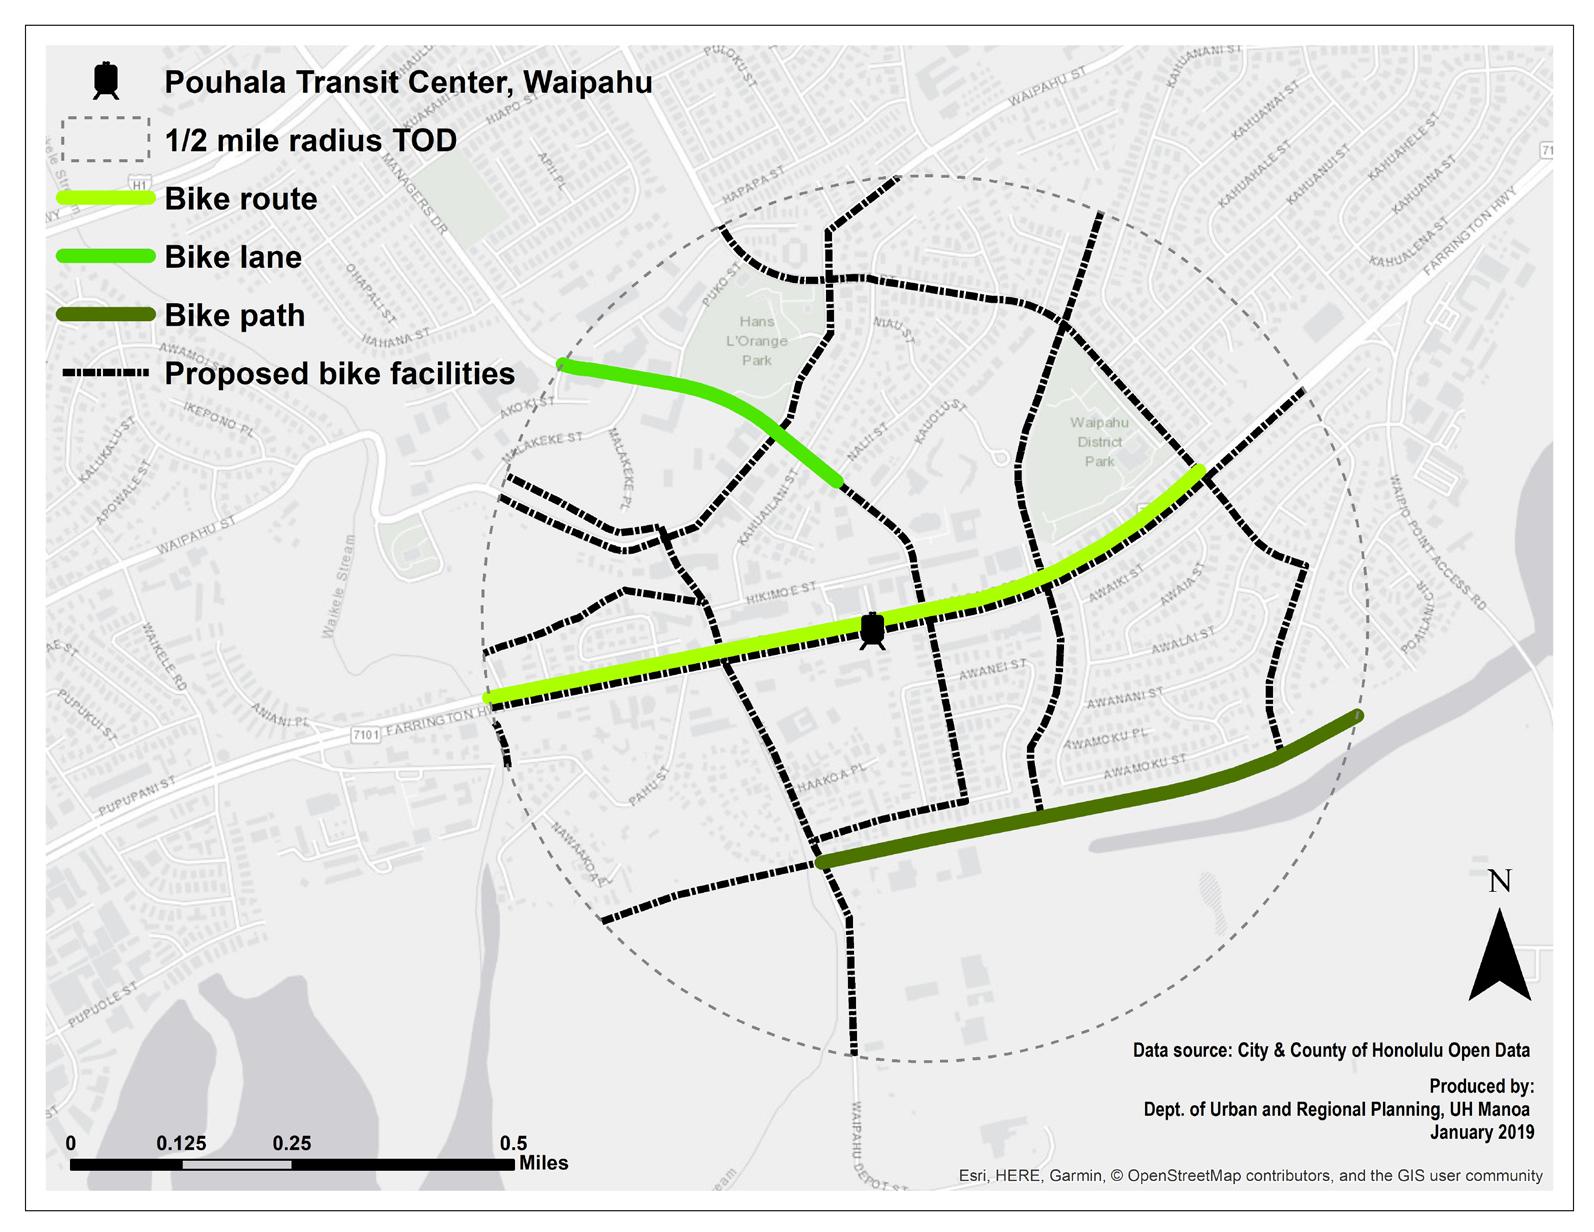
Bike facilities is generally classified as bike path (off street path exculsively for non-motorized use), bike lane (on-street striped exclusive bike lane), and bike route (on-street shared lane). Currently, there are 9 miles existing bikeways in Waipahu region, whereas 3.7 miles locate within the half-mile TOD area. The 3.7 miles of bike facilities consist of 2.1 miles bike route, 0.75 miles bike lane, and 0.8 miles bike path (see figure 7). There are isolated bike route along Farrington Hwy, a short bike lane along upper Mokuola St., and a separate Pearl Harbor bike path. No presence of bike lanes in the upper, Mauka side of Waipahu area. Due to the disconnection, the connectivity of bike facilities in the TOD area is not good. Besides the limited coverage and poor connectivity, field observation discovers the lack of appropriate signs and markers on the existing facilities. For example, there is lack of clear white dash mark lines on bike lanes and no signage for the bike route on Farrington Hwy. This problem would affect the visibility of the facilities, user comfort, and safety.
Despite these problems, a total of 17.7 miles proposed bike routes would significantly enhance connectivity between existing bike facilities. Along Mokuola St. starting mauka or the northern of Nalii Street, a new bike lane is constructed to connect the Manager’s Drive Bridge and Lumiaina street. Another proposed 0.3-miles section on Nalii St. would connect the existing bike lane with the route on Farrington Hwy. The proposed bike facilities would cover areas such as Waipio Park, Paiwa St., and Makalena golf course stream path, providing connection between Pearl Harbor bike path, the Western terminus of Waipio Park Rd., and Waipahu St.
Bus Operation and Facility
Currently, the City and County of Honolulu operate O‘ahu’s island-wide bus system, known as TheBus, with some fixed routes operations. TheBus operates 104 routes ser ving most regions of the island including Leeward side, Makaha to Waipahu. There are nine bus routes currently travel in and out of Waipahu, through the transit center on Hikimoe St. with stop #432 and stop
INFRASTRUCTURE ASSESSMENT
Figure 7. Map of bike facilities in TOD area.
15
Figure 8. Map of bus facilities in TOD area.
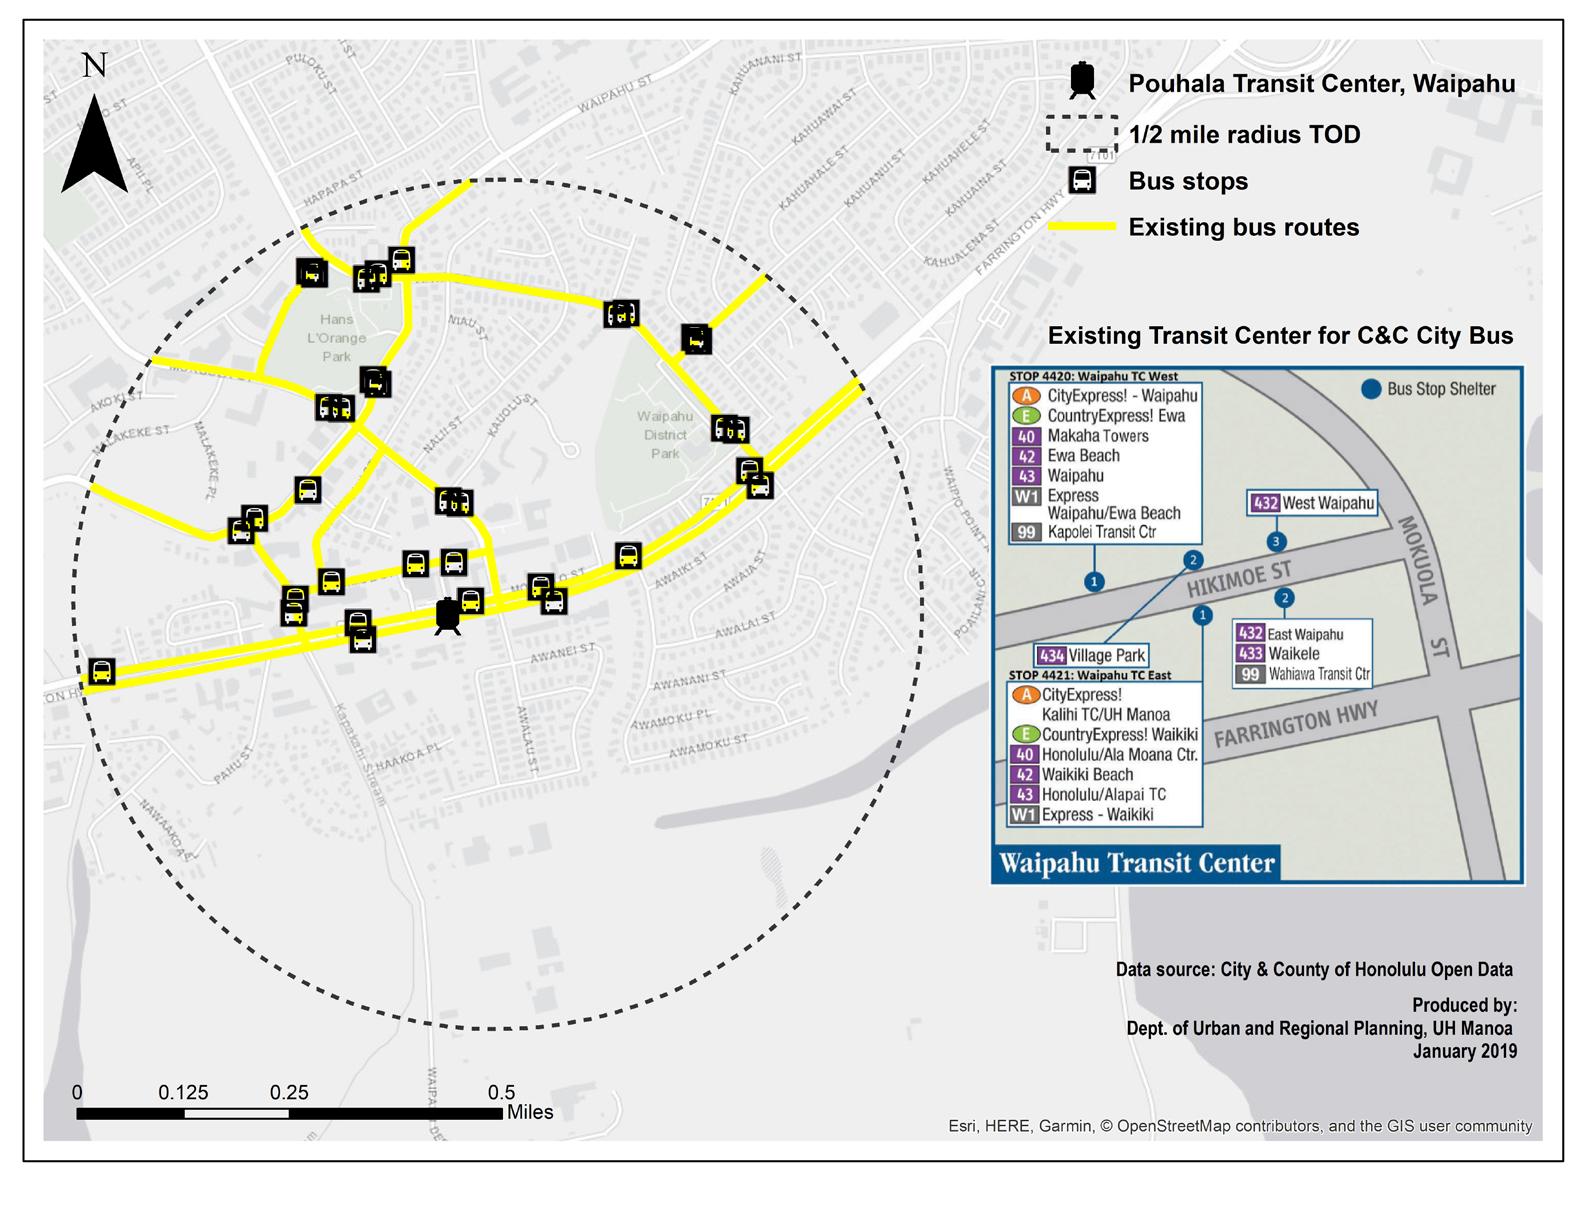
#433 on both sides of the road7. There are a total of 34 bus stops within the half-mile TOD area and 104 bus stops within Waipahu region (see figure 8). There is no bus stop along the arterial streets in the neighborhood at the makai side of Farrington Hwy. In future, several changes are anticipated for bus facility in the area, particularly for the transit center on Hikimoe Street, such as the modification of the curb width and layover space for buses8
SEWER SYSTEM
Most of the wastewater in Waipahu flows towards the Waipahu Wastewater pump station. The pump station is designed to accommodate the projected flows up to year 20209. Currently, the sewer system is adequately serving a population of 198,000 within Central O ahu, and 28,000 of those are from Waipahu.
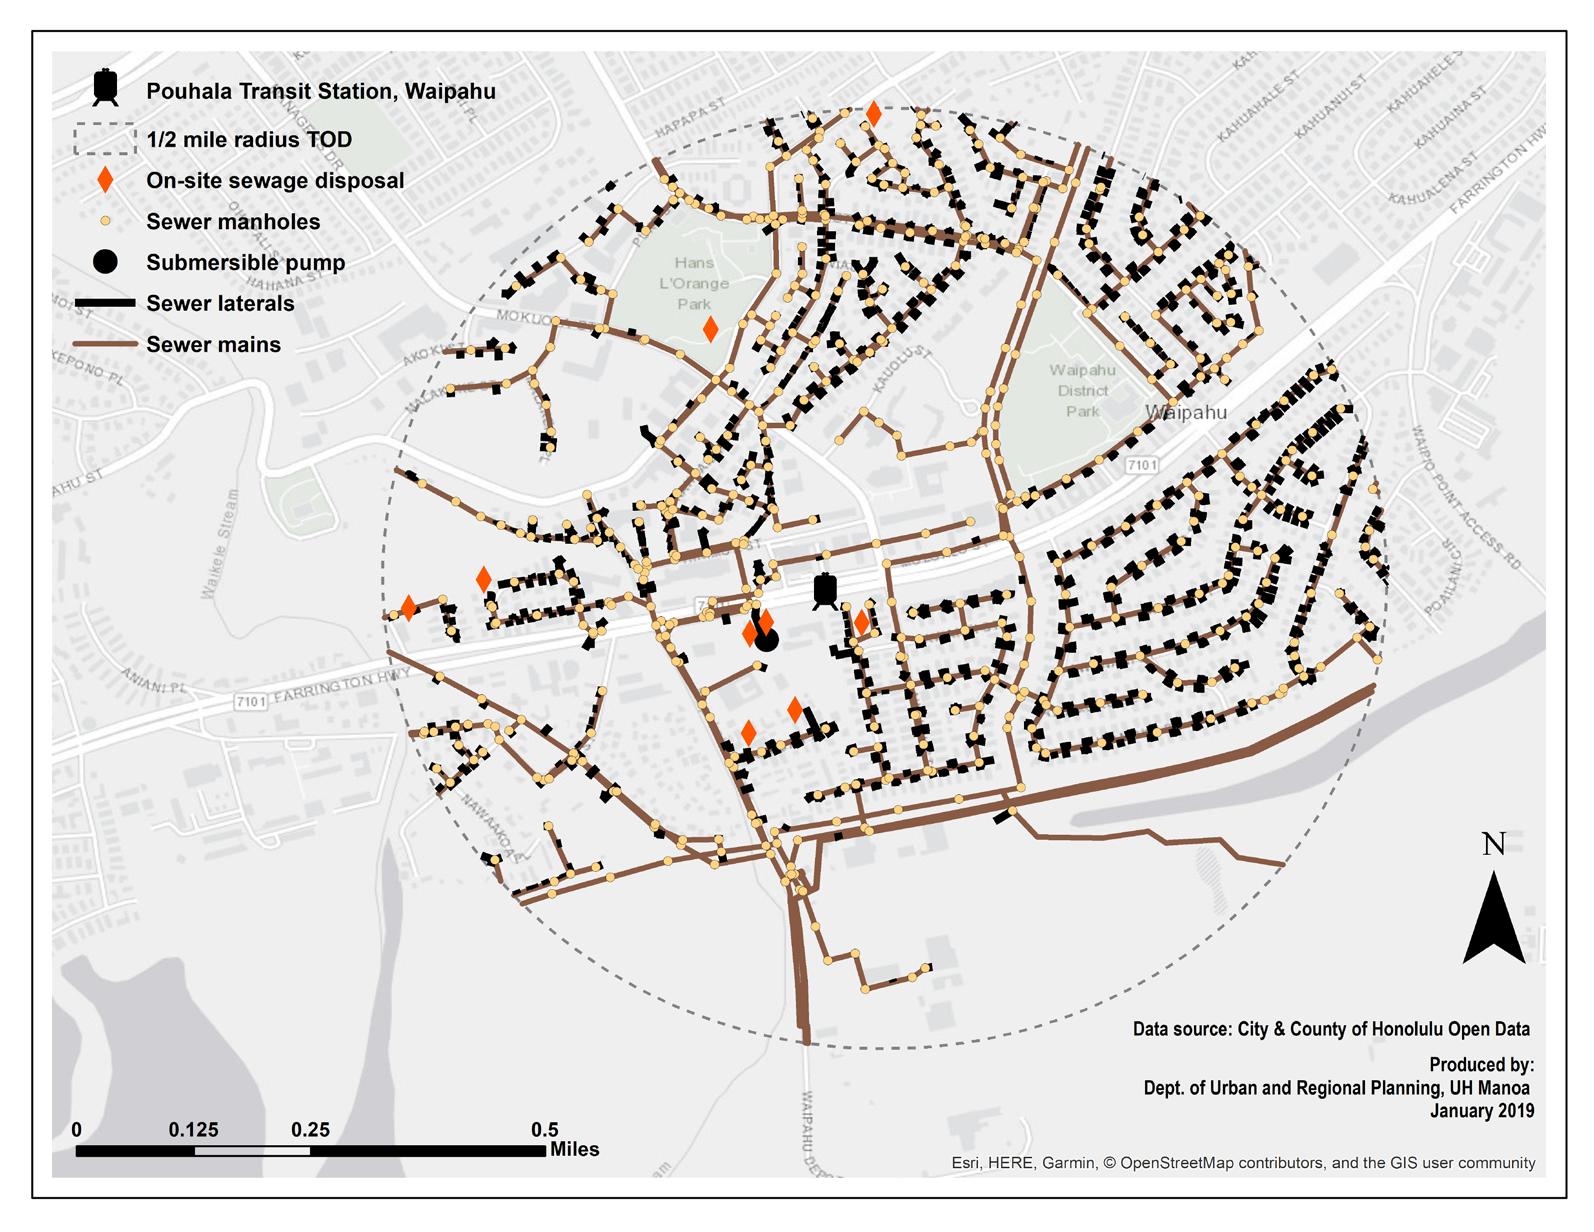
The current capacity of the Wastewater Treatment Plant is reported as 51 MGD (millions of gallons per day)10 based on a maximum design to meet the needs of a population of 424,000 residents and 133,176 employments11. Intensified development in the TOD area is expected to increase wastewater flows, which may necessitate needed upgrades to the pump station. Figure 9 shows the extent of current sewer infrastructure system and the location of on-site sewage disposal (OSDS) in half-mile TOD area: 573 manholes, 1302 sewer laterals, 582 sewer mains, 9
7 City and County of Honolulu Department of Planning and Permitting. (2017).
Oahu pedestrian plan: Honolulu complete streets, p.27.
8 City and County of Honolulu Department of Planning and Permitting. (2017).
Oahu pedestrian plan: Honolulu complete streets, p.27.
9 1995 Environmental Assessment for the Waipahu Wastewater Pump Station Modification.
10 2001 service boundary Facility Plan.
11 LLP Pollacks, V.M.W. (2007). Waipahu neighborhood transit-oriented development plan.
TOD COLLABORATION STUDY
16
OSDS, and 1 submersible pump.
In Waipahu, most of the identified Onsite Sewage Disposal Systems (OSDS) are classified as a cesspool or a Class IV OSDS, meaning that wastewater is directly discharged into a seepage pit with no treatment. The identified cesspools have a risk score of 3-4, with 5-6 being the level that could adversely affect human health and the environment. Many of the OSDS are in close proximity to Waikele and Kapakahi Streams. In the event of heavy rainfall, potential discharge into these water bodies could affect the water quality in the area.
Currently, there is no data available on the water quality for Kapakahi stream from the Hawai‘i Department of Health (DOH). Measurements of surface water quality conducted between 19751977 at the USGS gage station on Waikele Stream (source of Kapakahi Stream) indicate that its waters “exceed state standards for nitrate, phosphorus, and turbidity” at that time12. Since no remediation programs have been undertaken for the stream, it is unlikely that the water quality has improved.
Figure9.MapofsewerfacilitiesinTODarea.
DRAINAGE NETWORK
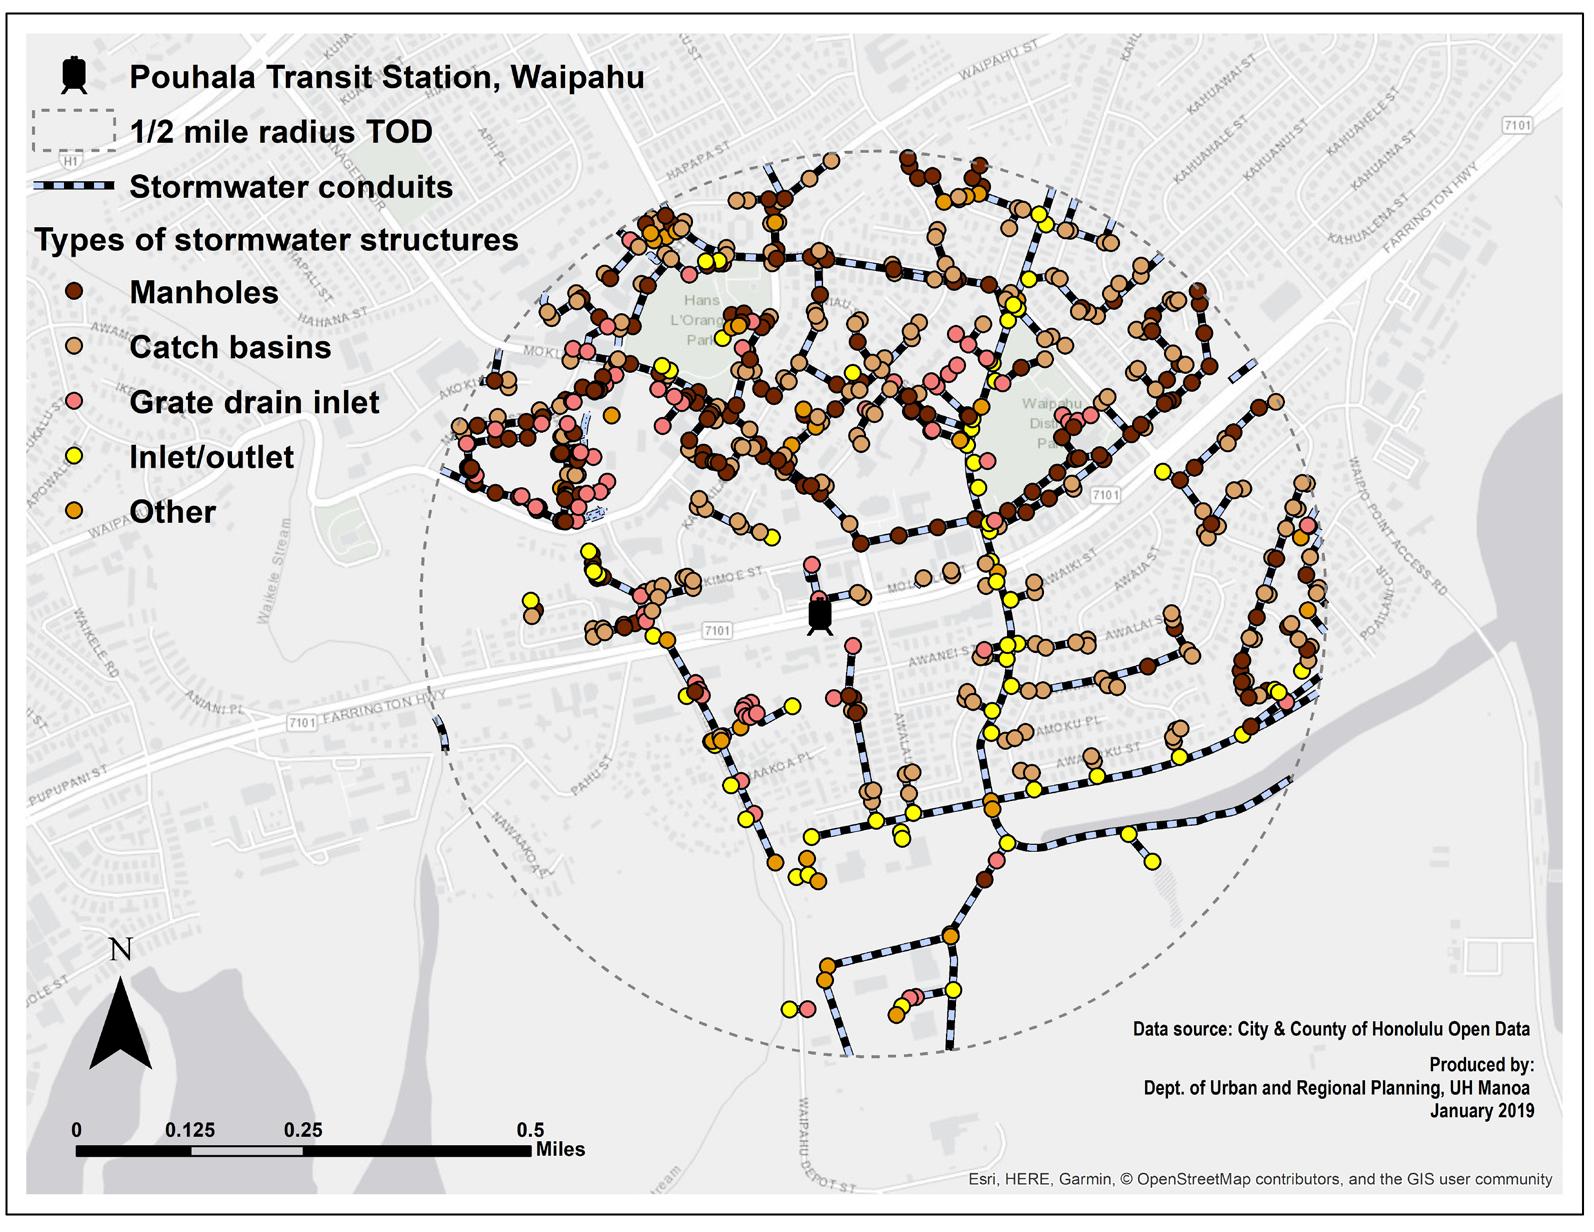
The stormwater collection system in Waipahu contains various stormwater infrastructure: 180 manholes, 236 catch basins, over 70 grates, inlets, and outlets (see figure 10). The flow rates range from 0.3 - 8.5 m3/s. Most of the stormwater conduits that move water out of the area are the Wailani Drainage Canal, Kapakahi Stream, and a few of reinforced concrete pipes, which are
12 1995 City and County of Honolulu Department of Wastewater Management.
INFRASTRUCTURE ASSESSMENT
17
all fed by the numerous inlets, grates, and catch basins.
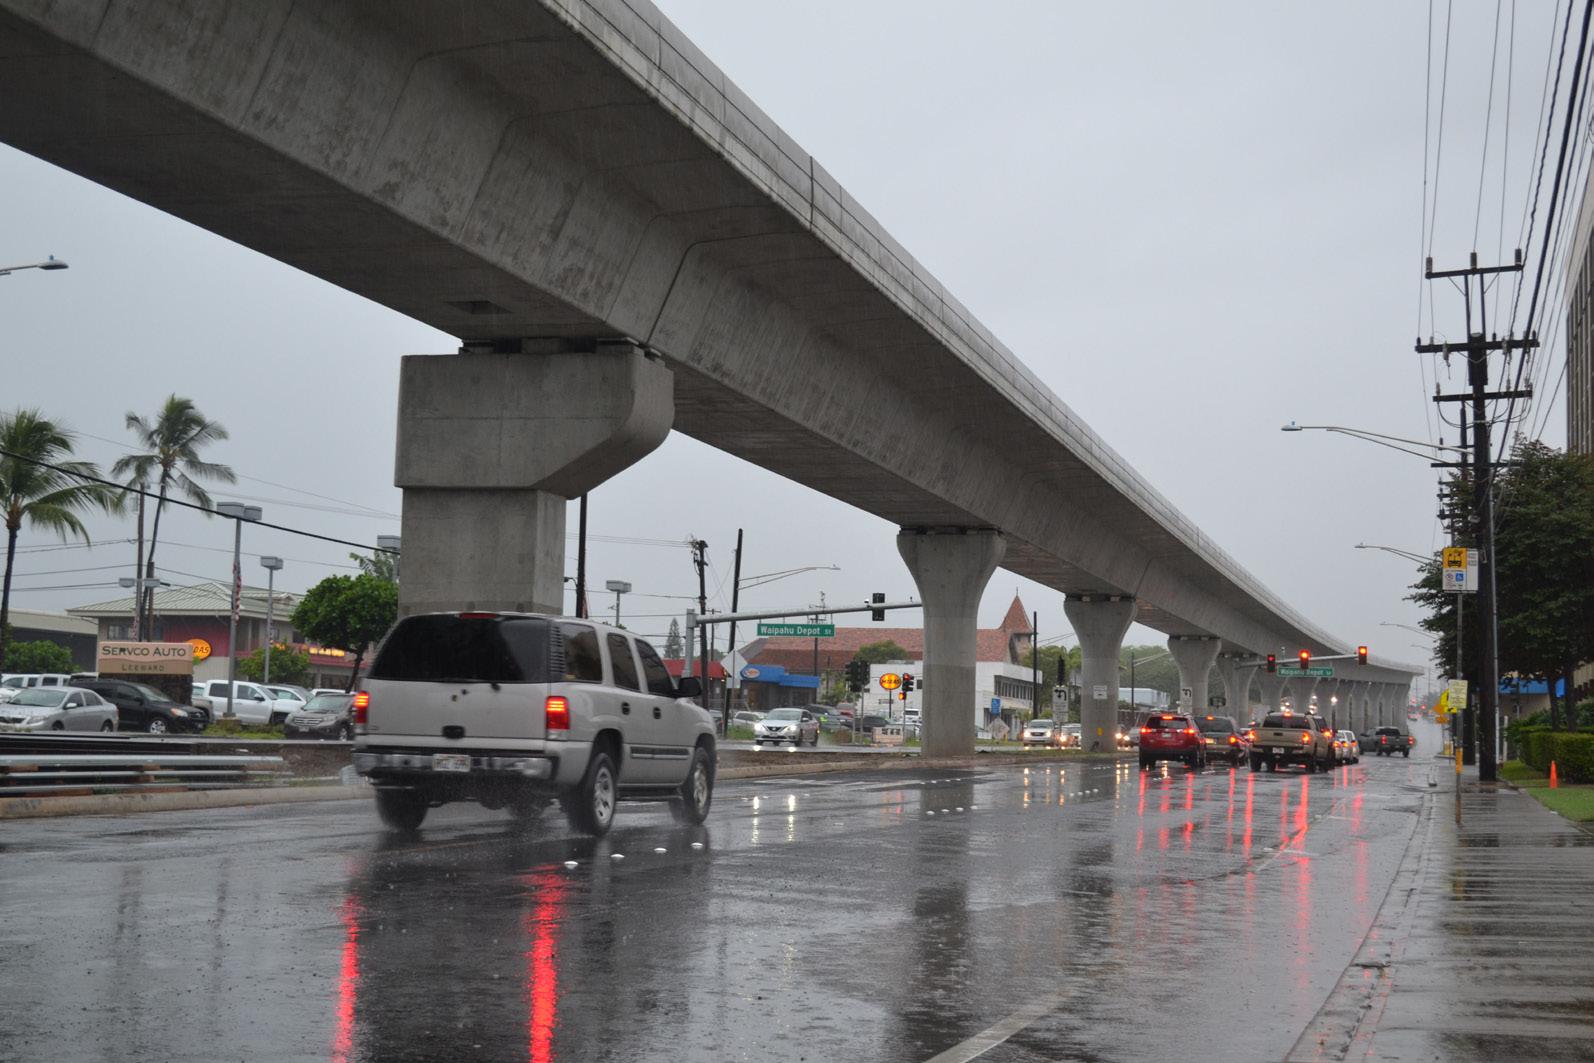
The collected water is released into Pearl Harbor, near and around the Pouhala Marsh. Operating separately from the sewer system, the stormwater system does not pass through any cleaning facility; hence the debris and particulates that enter the system are discharged directly into the ocean. Stormwater that does not drain into the ground becomes sur face runoff that flows directly into the area’s surface waterways, or puddle due to various pockets of low-elevation or is directed into storm drains (see figure 11).
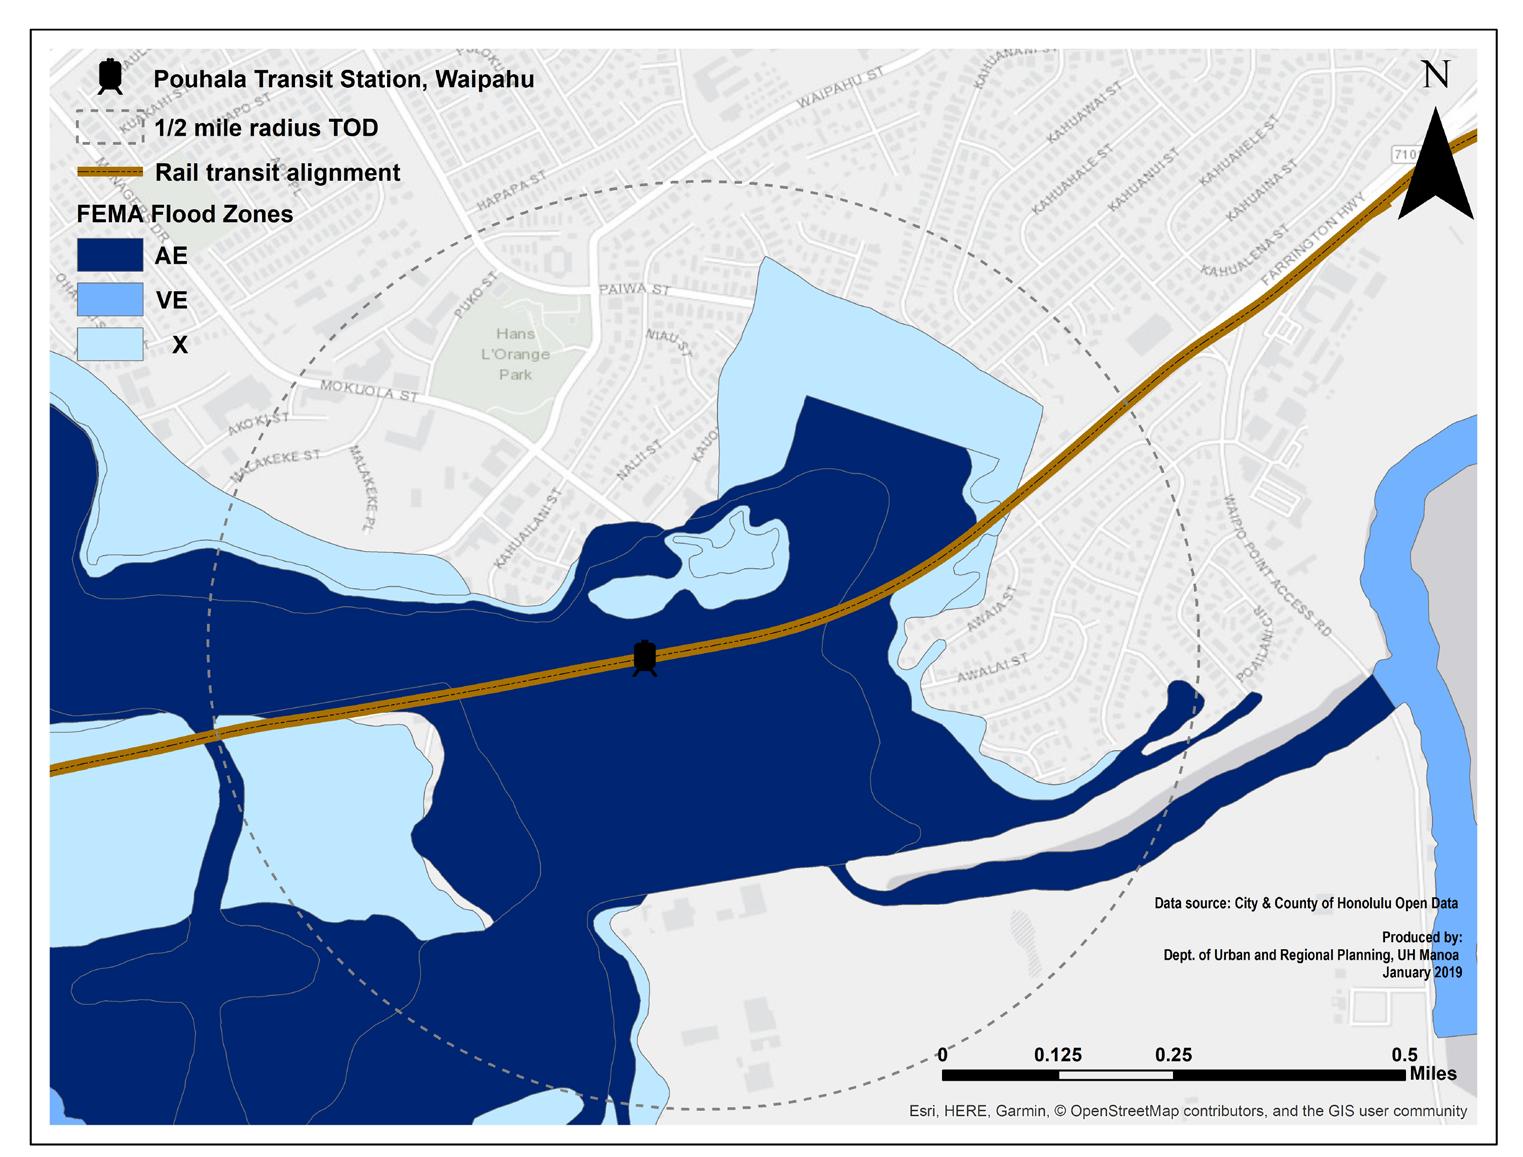
The Pouhala Rail Station has significant drainage issues. Figure 12 shows sites locating in the Zone AE (floodway) of the Flood Insurance Rate Map (FIRM) system and displays flooding impact due to a 100-year riverine flood event (1% annual occurrence). Properties in Zone AE are considered to be at high risk of flooding under the National Flood Insurance Program. Therefore, the floodway must remain free of (new) encroachments since it actively conveys flood waters from the confluence of Waikele Stream, Kapakahi Stream, and the Wailani Flood Control Channel. Additionally, the combined carrying capacity of the three drainage ways (with Waikele Stream being the primary contributor) is inadequate for a 100-year storm event and water spills out of the defined channels and into the area shown by figure 12.
The City and County of Honolulu Stormwater Management Program Plan (2016) is designed to reduce, to the maximum extent, the amount of stormwater containing pollutants entering and ultimately discharging from the DOT-HWYS MS4 into the streams, rivers, and ocean13. In the plan, as well as indicated by the Department of Planning & Permitting, projects that require best management practices (BMPs) measure to maintain or restore pre-development hydrology are projects that contain developments such as restaurants, retail malls, land disturbances greater than 1-acre, and buildings over 100 feet in height14. These developments may be included in the future development plans of the Pouhala TOD area.
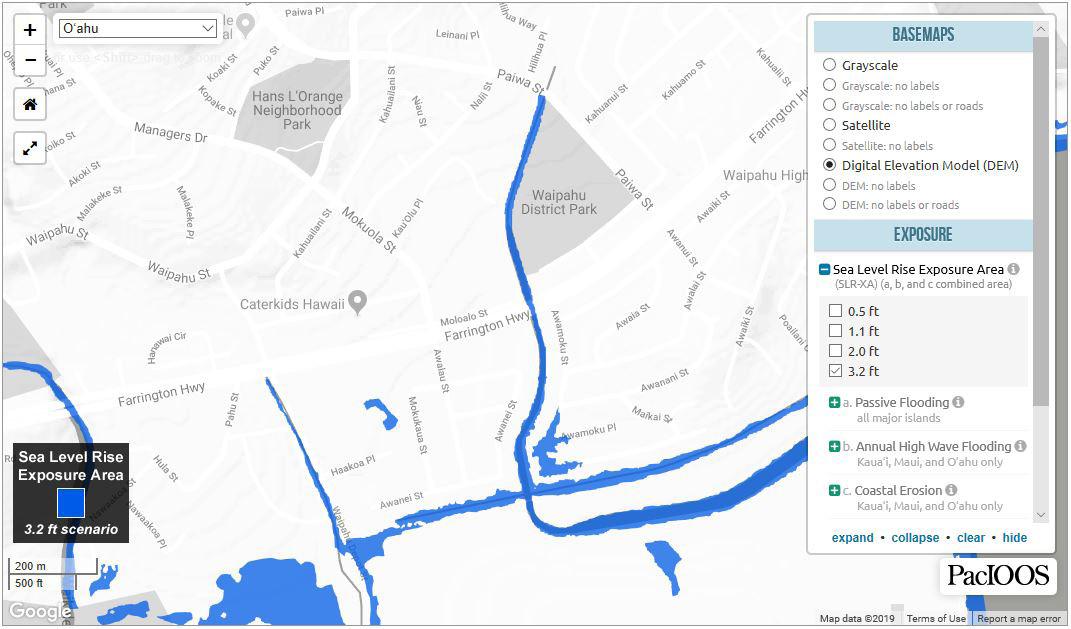
Stormwater runoff is affected not only by the amount of rainfall but also the perviousness of the surfaces. Pervious or vegetated surfaces allow rainfall to penetrate the soil and could slow the rate of runoff to stormwater drains. Currently about 61% or more of the surfaces around the Pouhala station are classified as impervious, which do not permit water to infiltrate into the ground. The flooding problem could become worse if more surfaces become impervious with the proposed TOD development without properly addressing the stormwater runoff. The City and County’s Stormwater Management Program Plan (2016) identifies low-impact development as the primary treatment for projects that generate one acre or more of impervious surfaces. Finally, Pouhala Rail TOD area is not immune to the flooding from the climate-induced sea level rise (SLR). Figure 13 displays the potential flooding in the area under a medium 3.2-foot sea level rise scenario. Flooding due to SLR has the potential to clog stormwater infrastructure, damage properties, and negatively impact the livelihoods of Waipahu residents. It is an issue that will need to be considered for future development.
13 and 14
State of Hawaii Department of Transportation, Highway Division (2015). Management.
TOD COLLABORATION STUDY
18
INFRASTRUCTURE ASSESSMENT
Figure 10. Map of stormwater facilities in TOD area.
Figure 11. Condition of the drainage in Farrington Hwy post heavy rainfall (photo taken 10/17 during site visit of PLAN 620).
19
TOD COLLABORATION STUDY
Figure 12. Map of different flood zones in TOD area.
Figure 13. Map of 3.2 sea-level rise exposure in TOD area.
20
CHAPTER 2: COMMUNITY NEED ASSESSMENT
This section describes the need assessment, documenting common problems that could affect the study areas’ socio-economic and ecological conditions.
COMMUNITY SURVEY
Public participation and local knowledge are the keys to efficient infrastructure planning. The information input from residents can provide insights on, e.g., the types of places the residents find pleasant, calming, accommodating, inconvenient, unsafe, etc., the types of activities they appreciate, and the types of environment supporting or impeding these activities15
To better understand the condition in the study area, students in PLAN 642 conducted two short community surveys during their site visit. The survey participants were randomly selected in public gather places (e.g. parks, community centers, marketplace, bus stops, library) near the proposed rail station. A total of 70 people participated in two surveys. 21 participants were surveyed for their opinions on transportation problems. 49 were surveyed for their perception for green spaces and drainage issues in Waipahu.
The survey uses rating questions to assess participants’ key concerns, quality of existing infrastructures, and desired improvements. The rating questions enable survey respondents to rate on the of 1-6 (least severe to most severe, least important to most important, least desirable to most desirable). The survey also used map to collect location information for the most utilized community facilities , their most/least favorite places, and places/facilities that need upgrade and improvement (see figure 14-16).
Figure 17-20 portray the results of community survey. About 90 % of survey respondents ranked traffic congestion as the number one issue in the neighborhood, followed by inadequate parking, bus stops, unsafe sidewalks, and bike lanes. Similarly, the information from community survey for green space and drainage issues indicated safety as the most concerned issue. The safety problem includes flooding, crime, street light, pedestrian and bike facilities safety. While the desired improvements is based off of the issues being raised, it is worth noting that more respondents felt urgent to see improved parking and more bus stops, followed by the provision of linear open space such as parks and multi-use natural greenways rather than a typical street corridor.
We need to acknowledge that due to the time constraint, a limitation of this needs assessment exercise is the small sample size. Increase the sample size would make help to ensure the results are representative. However, despite the small sample size, the survey helped the students to better understand the local concerns and revealed some issues that are consistent with previous studies in the area. In the Waipahu Community Survey (2012), DPP used a larger random sample of 2,700 residents who lived within a half mile of the Waipahu and West Loch Transit Centers. The top two concerns relating to mobility are sidewalks and parking. Approximately 60% of residents, particularly homeowners wanted to see improved sidewalks, as well as those who live near the Waipahu transit center, whereas 45% of respondents, particularly those who live closer to the West Loch station wanted more car parking16. These all reinforce community’s desire for better walkability, better corridor, and solutions for insufficient parking.
15 Juhola, S., Driscoll, P., Mendler de Suarez, J., & Suarez, P. (2013). Social strategy games in communicating trade-offs between mitigation and adaptation in cities. Urban Climate, 4, 102–116.
16 City and County of Honolulu Department of Planning and Permitting. (2017). Rail station connectivity for TOD Waipahu, p. 16-17.
INFRASTRUCTURE ASSESSMENT
21
Figure 14. Map of community favorite place from PLAN 642 survey.
Figure 15. Map of community most often used place from PLAN 642 survey.
Figure 16. Map of community least favorite place from PLAN 642 survey.


TOD COLLABORATION STUDY
22


INFRASTRUCTURE ASSESSMENT
Figure
17. Average Rating of the Severity of transportation problems. Figure 18. Average Rating of the severity of issues rated to green spaces Figure 19. Survey of the desired improvement in transportation. Figure 20. Survey of the desired improvement in regarding green spaces.” 23
PART II: FUTURE SCENARIO ANALYSIS
CHAPTER 3: BUILD-OUT SCENARIO
This chapter delves into an analysis of the maximum development scenario based on existing TOD zoning and stakeholder interview. Under the maximum build-out scenario, it provides estimation of travel demand, parking needs, stormwater runoff, and wastewater discharge on the six state parcels and larger Waipahu.
MAXIMUM BUILD-OUT SCENARIO
According to the State Strategic Plan for Transit Oriented Development, Hawai’i Public Housing Authority (HPHA) is exploring the possibility of expanding development in state parcels near the Ho‘olulu and Kamalu elder housing projects. Currently, these buildings provide 112 and 109 units respectively. however, plans to increase density around the rail stations may add more public housing units up to 1000. Bill 76 (2015) provides a zoning map in which the business mixed-use and apartment mixed-use maximum height restrictions are stated (see figure 21).
The Hawai’i Housing Finance and Development Corporation (HHFDC), which owns a majority of the parcels near Pouhala transit station. Although with strong support towards sustaining TOD principles and objectives, HHFDC does not have any official plans for the parcels17. Currently, there is parking lot marked as AMX-2 with a maximum height of 45’. Based on the TOD zoning, there is a possibility that HHFDC develops the parcel equivalently as the adjacent Plantation Town Apartments. There is also a potential to remodel the current civic center into an elementary school to serve a much larger future population.
Based on these development potential and assumptions, a maximum buildout scenario (see table 1) was produced to explore whether the current infrastructure would be sufficient for future development18. Because the purpose of this analysis is to determine if the current or future infrastructure can support a maximum buildout, the largest possible floor area ratio (FAR) and heights were used for parcels zoned BMX and AMX19
Just for infrastructure needs estimation purpose, some simplified assumptions were made. These assumptions only represent a best guess by the researchers based on existing data and best available information. The assumptions may not be accurate to future conditions and does not represent any agency plans.
As is standard practice in building vibrant TOD communities, the new zoning in the Pouhala TOD is mostly mixed-use with much higher maximum heights and FAR allowances. The maximum height for BMX-3 is 60 feet while AMX-2 is 45 feet. The maximum FAR for BMX-3 zoning is 2.5, but 3.5 was used for the calculation given the potential bonuses granted for social benefits to the community such as public space or a high percentage of affordable units20
The 1,000-unit public housing project detailed in the State TOD Plan was assumed an average unit size of 450 ft2 based on the average sizes of the Ho’olulu and Kamalu existing units. Any other residential units that are not public housing projects were assumed a unit size of 600 ft2 based on the average size of a mid-rise apartment in Waipahu. Both office and retail were assumed a unit size of 1000 ft2. In mixed-use developments, the first floor was assumed
17 PLAN 642 Interview (03/2018).
18 Build-out scenario was generated using primary and secondary data.
19 BMX = business mixed-use; AMX = apartment mixed-used.
20 BMX-3 = community business mixed-use; AMX-2 = medium density apartment mixed-use.
TOD COLLABORATION STUDY
24


INFRASTRUCTURE ASSESSMENT
Figure 21. Zoning map No.8 Waipahu (source: City and County of Honolulu).
Figure 22. Map of the six state-owned parcels in TOD area.
25
retail. The first floor of BMX was calculated by assuming each floor is 10 feet and finding the proportions based on the maximum height. So, the first floor would be of the total height of the building. AMX was calculated assuming each floor is 9 feet and maximum height is 45 feet.
In the build-out scenario, 1,000 units are included in HPHA’s central parcel, HHFDC build out the parking lot parcel similar to that of the Plantation Town Apartments, the civic center is converted into an elementary school, and the library remains in place. The total area was calculated by multiplying the square footage of the parcels by maximum FAR under zoning. Given these assumptions, we generate a maximum build out scenario with a rough estimation of the square footage and number of development units (see table 1).
Table 1. Maximum build-out scenario of the six state-owned parcels (see figure 22 for state parcels)
*HPHA public housing units ** similar size as Manoa Elementary School *** information obtained from library through phone call
PARCEL AREA (Ac) AREA
FAR TOTAL AREA
FAR) TYPE Retail
OFFICE
RESIDENTIAL (ft
#RETAIL UNIT #OFFICE UNIT #DWELLING UNIT SCHOOL (ENROLLMENT) LIBRARY LIBRARY
1 0.811 35,345 3.5 123,706 BMX-3 20,618 103,088 0 21 103 0
2 4.511 196,512 3.5 687,793 BMX-3 0 0 0 0 0 0 550** 17,000***
3 1.312 57,151 3.5 200,028 BMX-3 33,338 0 166,689 33 0 278
4 3.783 164,787 3.5 576,756 BMX-3 0 0 576,756 0 0 1000*
5 1.394 60,723 3.5 212,529 BMX-3 354,22 0 177,108 35 0 295
6 3.038 132,335 1.9 251,437 AMX-2 50,287 0 201,149 50 0 335
FAR = floor area ratio
Largest FAR [3.5] is used which include bonuses granted
TRANSPORTATION: TRAVEL DEMAND
The build-out scenario was used to estimate the total number of trips for travel demand estimation using Institute of Transportation Engineers (ITE) Trip Generation Manual21. To match the categories in ITE manual, it is assumed that AMX-2 zoning would generate trips at a rate similar as the mid-rise apartment, office development would be similar as general office, and retail units are similar as shopping centers. Again, these assumptions may not be accurate, but are based on the best estimation. Due to the lacking access to trip distribution data, the assumption made being that all trips are 50% in and 50% out of Waipahu22. It is also assumed that the background traffic growth rate for a two-lane road is 1.0% a year, while the background traffic growth rate for a four lane-divided road is 2.3% a year. The average annual daily traffic numbers were obtained in the GIS dataset provided by State DOT. Data on Mokuola St. was
21 Calculation for travel demand was done by PLAN 642 students using Trip Generation 7th Edition ITE manual, and GIS data from the State Office of Planning website.
22 Using Trip Generation 7th Edition ITE manual.
TOD COLLABORATION STUDY
(ft 2 )
(ft 2 *
(ft 2 )
(ft 2 )
2 )
26
not available; hence it is assumed that the street has the same average annual daily traffic as Waipahu St. See figure 23 for trip generation calculation steps and table 2 for number of trips estimated.
Number of trips of roadway section Waipahu
GIS 2013)
Trips generated due to TOD; average per 1,000/ ft2
Manual)
trips* growth/year
2018 trips + Trips generated by TOD Project Impact
Figure 23. Trip generation calculation steps
Table 2. Road segment and number of trips generated using ITE manual.
Segment
New segment trip (NTT * Distance %)
2013 Counts**
Background 2018 (2013 * growth) Background + Project (2018 + new segment trips)
Farrington Hwy 7,186 32,429 36,334 43,520
Paiwa St. 5,133 26,891 28,263 33,396
Waipahu St. 4,106 9,878 10,382 14,488
Mokuola St. 4,106 9,878 10,382 14,488
**HPMS GIS data
Table 3. Road segment and number of trips generated of ≤ 10% trips using ITE manual.
Segment
Estimated 2018 trips without TOD (2013 * growth)
New segment trips generated due to TOD
Trips required (for only 10% increase) % of increased trips required to be pedestrian and bike trips (for increase to be ≤ 10%)
Farrington Hwy 36,334 7,186 3,633 51%
Paiwa St. 28,263 5,133 2,826 5 %
Waipahu St. 10,382 4,106 1,038 25%
Mokuola St. 10,382 4,106 1,038 25%
Total 85,361 20,531 8,536 42%
To understand how the maximum development on the state parcels would affect the level of service (LOS) on the adjacent roads, Table 3 compared the projected traffic to a 10% increase in current Annual Average Daily Traffic (AADT) in replace of the roadway capacity information due to lack of data. Table 3 estimates that overall 42% of the new trips generated has to be non-auto trips to limit the increase of vehicular traffic within 10%. This target requires significant improvement in the walkability of the region and a fundamental change in the urban environment. An enormous amount of work is needed to improve the streets, facilities, and services for non-auto travel.
INFRASTRUCTURE ASSESSMENT
(HPMS
(ITE
2013
(until 2018)
27
TRANSPORTATION: PARKING
Parking needs are estimated based on the build-out scenario (see table 1). The estimates are done using parking generation coefficients from the ITE parking generation report24 . It is worth noting that the parking generation rates in the TOD area would likely to be lower than the rates in the manual. However, the ITE rates represent the best available information for parking estimation given the lack of empirical local data. Table 4 summarizes the estimated parking for different types of land use for the state parcels under current and the build-out scenario.
It was assumed that the apartment buildings in the area would have the same parking rate as the urban mid-rise apartment. This coefficient came out to be 1.2 parking stalls per dwelling unit. The retail uses the same parking coefficient as shopping center: 3.96 per 1,000 ft2. The parking rate for urban office building is 2.47 stalls per 1,000 ft2. For the elementary school in parcel #4, the school size in terms of sqft would be similar as Manoa elementary school. Therefore, we estimate the total number of students to be 550 similar as Manoa elementary school and the parking rate is 0.17 parking stall per student. Finally, the library creates 0.42 stalls per 1000 ft24 .
Using the ITE standard rate, it is estimated that the current needed parking is 445 and future required parking is 3,199, which is seven times current demand. Using google map satellite image, it is found that there are currently 572 onsite parking on these state parcels. The future parking needs would be five times the existing parking.
Table 4. Parking estimation generated using ITE manual.
Land use type
Parking ratio Unit Parking generation Existing Parking
Current Kamalu and Honolulu 1.2 221 units 265 423
The Dept. of Accounting and General Services (DAGs) 2.47 69.9 ksqft 173 114
Library 0.42 17 ksqft 7 35
Total 445 572
Future Mid-rise apartment
1.2 1,908 units 2,290
Retail 3.96 140 kft2 553 Office 2.47 103 kft2 255
Elementary school 0.17 550 enrollment 94
Library 0.42 17 k sqft 7
Total 3,199
TOD COLLABORATION STUDY
23 Institute of Transportation Engineers (ITE) Parking Generation Report, the 4th Edition. 24 Square footage for the library was obtained by conversation through a phone call.
28
STORMWATER RUNOFF
This section presents a rough assessment of surface runoff for the TOD area, which is a smaller portion of Waikele watershed. Great attention is paid to two focused areas: the larger Waipahu areas and the state-owned parcels. Surface runoff is an significant factor affecting the development of floods, soil erosion, and other hydrological hazards25
According to the Waipahu Community Survey, at least 1 in 10 respondents experienced flooding issues whenever there is a rainstorm, and 1 in 10 had flooding problems at least once a year26 . The proposed development could further increase the amount of impervious surface, which will contribute to more surface runoff unless mitigation and BMPs are carefully implemented to alleviate the issue. Addressing the flooding issues, particularly at Farrington/Mokuola, is a nearterm recommendation mentioned in the Waipahu Neighborhood TOD Plan given the situation that many historical and cultural resources, as well as existing homes and businesses, are currently at risk27
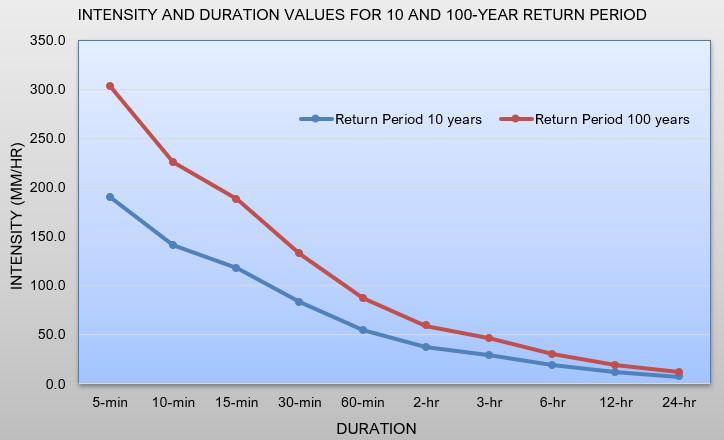
This analysis uses a simplified approach to estimate the peak discharge from drainage basin using Rational Method Equation28 (see table 5). For the analysis, the peak runoff discharge is calculated using formula in Table 5. The runoff coefficient is obtained from American Society of Civil Engineers (ASCE) Manual29 . the land use type is classified according to the current TOD zoning and the build out scenario. The rainfall intensity is looked up using the selected precipitation return period, preciptation intensity-duration-frequency curve, calaculated time of concentration for the study areas (Table 5). The selected return period for this study is 10 year and 100 year return period to prepresent the common design standard used for stormwater facilitie and the extreme scenario respectively. The Intensity-duration-frequency (IDF) curve (Figure 24) for 10-year and 100 year return period precipitation is generated using station record data from NOAA’s National Weather Service (NWS)30
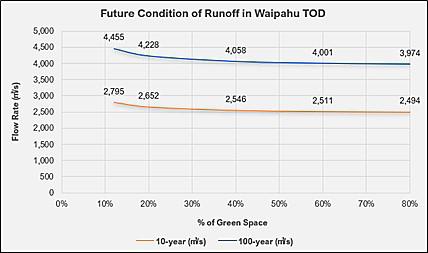
The total peak runoff is calculated for both Waipahu TOD and the state parcels under a vaerity of scenarios, including current condition, build-out scenario, and different levels of green space coverage in future. Table 6 summarizes the peak discharge for Waipahu TOD area and state parcels under the current condition. Figure 26 presents the peak discharge for Waipahu TOD area and state parcels under the build-out scenario and with different percentage of green space coverage. In the present condition, Farrington highway and streets in low-lying areas are prone to flooding. The large amount of impervious surface, particularly in retail, residential and parking areas have contributed to the stormwater runoff in Waipahu region.
High coverage of green space has the potential to mitigate the issue; the current TOD zoning (see figure 25) sets about 12% green spaces in the area, which will generate approximately 2,795 m3/s runoff for the 10-year return period flood event. If we want to keep the flow rate of the TOD development at the current level (2483 m3/s) only using green spaces in TOD areas, the Waipahu TOD development need to have about 80% of the development incorporate green spaces or green roof (see figure 26).
25 Vojtek, M., Vojteková, J. (2016). Flood hazard and flood risk assessment at the local spatial scale: a case study. Geomatics, Natural Hazards and Risk 7(6).
26 City and County of Honolulu Department of Planning and Permitting, 2012.
27 LLP Pollacks, V.M.W., 2014, p.5.
28 Rational formula is a more simplified calculation technique, however, it should only be applied to drainage areas smaller than 80 ha.
29 American Society of Civil Engineers and Water Pollution Control Federation, 1969. Design and Construction of Sanitary Storm Sewers. ASCE Manuals and Reports on Engineering Practice no. 37 and WPCF Manual of Practice no. 9.
30 http://www.nws.noaa.gov/.
INFRASTRUCTURE ASSESSMENT
29
Table 5. Peak runoff formula
RUNOFF DISCHARGE Q = 0.0028 * C * i * A
Where: Where: Q = peak runoff rate (m 3/s)
C = runoff coefficient
= rainfall intensity (mm/h)
A = total area (ha) (by different land use) 0.0028 = Conversion factor (m 3,h/mm, ha, s)
c = maximum distance (m) flow rate (m/s)
c = time of concentration31
Table 6. Current condition surface runoff
Current condition 10-year (m3/s) 100-year (m3/s)
Waipahu TOD 2,483.4 3,957.3 State parcels 8.90 14.17
Figure 24. Intensity-duration-frequency (IDF) curve combined for 10 and 100-year return period. (Source: National Weather Service, NOAA)
Time of concentration is the time required for water to travel from the hydraulically most remote point of the basin to the point of interest.
TOD COLLABORATION STUDY
i
t
t
31
30
Figure 25. Zoning map in TOD showing different land uses.
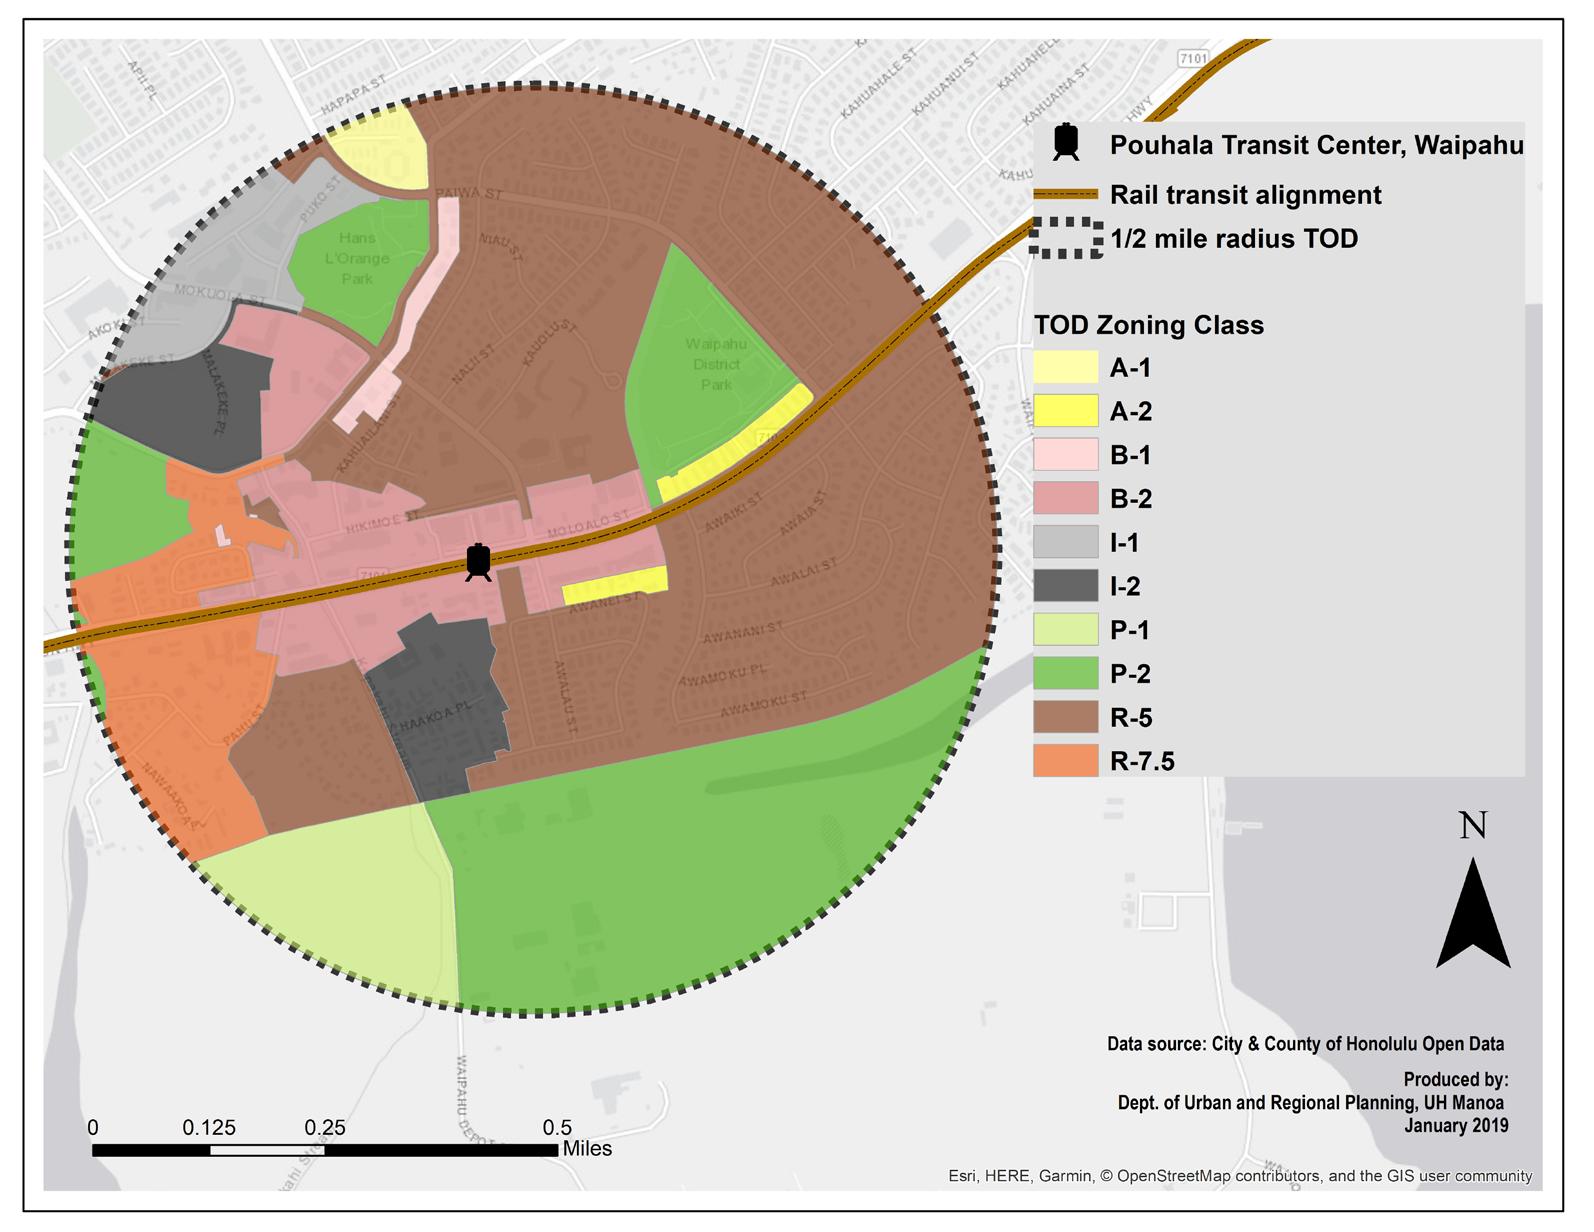
Figure 26. Run-off flow rate when combined with green space.
INFRASTRUCTURE ASSESSMENT
31
Table 7. Data used for calculating stormwater runoff Data Source
digital elevation model (DEM) National Oceanic and Atmospheric Administration (NOAA) Land use zoning City and County of Honolulu Open Geospatial Stormwater structure City and County of Honolulu Open Geospatial Rainfall data National Weather Service, NOAA
The overall assessment of runoff indicates maximum build out development of state parcels and the TOD area would increase the overall stormwater runoff in the watershed by 12%, which could make the existing flooding problem worse. Enforcing green infrastructures (e.g. green corridors, green roof) in the proposed TOD zoning could help to reduce the excessive discharge to some degree. Although it is difficult to eliminate the flooding problem using green infrastructure in the TOD development only,
green infrastructure is a viable option to enhance stormwater management in the TOD area. Not only could green infrastructures reduce and purify stormwater discharge at its source, but also deliver other environmental, social, and economic benefits if implemented appropriately. The next sections would look at the best practices for green infrastructure and identify suitable areas to implement green infrastructure in Waipahu.
WASTEWATER PROJECTION
Currently, Waipahu TOD area is served by the Honouliuli wastewater treatment plant. Besides Waipahu, the Honouliuli treatment plant also serves the entire Ewa region. It has a total of 16 pump stations, 46,877 serviced laterals, 15,592 manholes, 0.08 miles force mains, and 511 miles gravity mains. With the adopted TOD zoning, the population and overall density are projected to increase.
The design of future wastewater system should follow the most recently approved (i.e. July 2017) wastewater design standards provided by City and County of Honolulu Department of Environmental Services32. The design standards specifies the average daily per capita wastewater flow as 70 gallons per capita per day (gpcd) and provides a reference table for population density by capita per acre (cpa) for various land uses33 . However, the standard lacks density factor for the institution such as library, the proposed school, and the current residential (R-5) zoning. Given the lack of the density information and population projection, it is better to use flow factors by land use rather than per capita for flow estimation. Therefore, we adopted the flow factors in Design Manual 34 provided by WSSC (i.e. Washington Suburban Sanitary Commission, one of the largest water and wastewater utilities in the nation) to estimate the current and future Base Sanitary Flow (BSF). The current and future wastewater BSF for various types of land use in the TOD area is estimated using the formulas in Table 8. Table 9 presents the details of estimation using current land use information and the future build out scenario. Although Peak Sanitary Flow (PSF) rather than the BSF are usually used to design new sewers, BSF provides a good starting point to compare the current and future flow. Furthermore, PSF could be easily obtained using the BSF multiplying a flow factor (i.e. 2.5, according to City and County of Honolulu’s standard).
32 Wastewater system design standards, City and County of Honolulu, July 2017, available at http://www.honolulu.gov/ cms-env-menu/site-env-sitearticles/19971-wwm_wwdesignstandardsdetails.html.
33 Chapter 2. Design of Gravity Sewers. Wastewater system design standards, City and County of Honolulu, July 2017, available at http://www.honolulu.gov/rep/site/env/wwm_docs/DESIGN_STANDARDS_-_CHAPT_2_FINAL.pdf.
34 WSSC Design Manuals (2008), Appendix “C“ WSSC Design Criteria for Sewer Systems. Table “19a” Development Flow Factors – By Dewlling Type. Table “19c” Development Flow Factors – by Specific Use. Available at https://www. wsscwater.com/files/live/sites/wssc/files/PDFs%206/AppendixC2008_65235.pdf.
TOD COLLABORATION STUDY
32
According to the estimation, the future BSF could be about eight times the current flow under the maximum build-out scenario. On the state parcels, there are a total of 16 sewer mains with diameters ranges from 18 to 24 inches, 2 sewer laterals with diameter of 6 inches, and 13 sewer manholes. Given the volume for larger sewer mains is 1.8 times of the smaller sewer main pipes, if the current volume/capacity ratio in the smaller sewer main pipes is larger than 23%, there would be a need to upgrade the bigger sewer main pipe under built-out scenario.
Additionally, in Waipahu region, most of the wastewater flows through the Waipahu Wastewater Pump Station (WPS) (tax map key: 9-3-002:009) towards the downstream treatment plant of Honouliuli WWTP. This pump station has been in service since 1963. According to the Environmental Assessment for the Waipahu Wastewater Pump Station Modification (1995), the pump station can accommodate flows up until the year 2020. The average design flow is at 6.00 million per gallon (mgd), with a maximum design flow of 13.00 mgd, and peak design flow at 16.00 mgd. Currently, the pump station is adequate for a population of about 198,000 people within Central Oahu, and 28,000 of those customers are from Waipahu 35. With the proposed density changes in the TOD area, the capacity of the Waipahu Pump Station should also be examined when regional population projection is available.
Table 8. Formula for sewer calculation
BSF= #dwelling unit (DU) * BSF/DU *DU is considered as Multi-Family Dwelling Unit (MFDU)
BSF = Unit * Flow Factors
Table 9. Current and future estimation of wastewater service in TOD area
Current condition
(For non-residential)
(For non-residential)
Unit Occupancy ft2 Flow Factors BSF (per day)
Kamalu and Hoolulu 221 units
130 BSF/DU 28,730
The Dept. of Accounting and General Services (DAGs) 69,900sqft 0.093 gpsqft 6500
Library * 17,000 sqft 0.10 gpsqft 1,700
Total 36,930
Future Condition
Residential 1,908 units
130g BSF/DU 248,040
Office 103,088 sqft 0.20 gpsqft 20,617
Retail 139,665 sqft 0.048 gpsqft 6,704
Elementary School 550 students 15 gpc 8250
Library * 17,000sqft 0.10 gpsqft 1,700
Total 285,311
35 According to the Environmental Assessment for the Waipahu Wastewater Pump Station Modification (1995).
INFRASTRUCTURE ASSESSMENT
33
CHAPTER 4: SUITABILITY ANALYSIS
Demand analysis in Chapter 3 reveals that under the built out scenario there are potential shortfalls in road capacity, parking, and wastewater infrastructures, and a significant increase in stormwater runoff due to more impervious surfaces. Given the limited land availability under the built out scenario, it is difficult to expand certain infrastructure such as the roads and parking facilities. To address these problems and accommodate the community needs identified in Chapter 2, we suggest prioritizing improvements in multimodal transportation facilities and adopting green infrastructure when possible. Improving multimodal transportation facilities could help to promote non-auto travel and reduce the needs for additional road and parking facilities. Green infrastructure, if designed properly, could provide the means to reduce stormwater runoff, improve water quality, fulfill the community’s needs for open spaces, parks, greenways, and great bike trails all at the same time. To facilitate the strategic planning of these strategies, this section conducts two GIS-based suitability analyses to 1) prioritize where to improve multimodal transportation facilities in the TOD area, and to 2) identify the most suitable places in the adjacent three watersheds (i.e. Kapakahi, Wahiawa, and Waikele) to implement green infrastructures. Suitability analysis is a commonly used decision-making tool for planners to identify the most or least suitable locations for a specific land use purpose 36. By integrating a variety of factors, suitability analysis provides planners a unitary view of the interaction between the environmental processes and development activities. Figure 27 describes the general process for suitability analysis, which often involves the selection of the suitability criteria, determining the weight of each criterion, calculating the suitability index in GIS environment, visualization and interpretation of the suitability maps. Table 10 summarizes the data and data source used in the following suitability analyses.
Table 10. Variables and data source for suitability analysis.
Data/variables Data Source
Population American Census Survey (2014) Census tracts
Census blocks
Bus stops City and County of Honolulu, Open Geospatial Data Portal (2018b) Bike facilities City and County of Honolulu, Open Geospatial Data Portal (2018b)
Place of interest City and County of Honolulu, Open Geospatial Data Portal (2018b)
Zoning City and County of Honolulu, Open Geospatial Data Portal (2018b)
Land ownership City and County of Honolulu, Open Geospatial Data Portal (2018b)
Parks City and County of Honolulu, Open Geospatial Data Portal (2018b)
Streams City and County of Honolulu, Open Geospatial Data Portal (2018b) Crash/accident Hawaii Department of Transportation
Cloud Numetric for Crash and Safety Analysis (2012-2014)
Tree canopy National Land Cover Database (2011)
Impervious surface National Land Cover Database (2011)
Community favorites University of Hawai‘i, PLAN 642 (Urban Infrastructure) Site Visit (2018)
Improvement sites University of Hawai‘i, PLAN 642 (Urban Infrastructure) Site Visit (2018)
ESRI (n.d).
TOD COLLABORATION STUDY
36
34
Figure 27. Steps in suitability analysis.
SUITABILITY ANALYSIS: MULTIMODAL TRANSPORTATION
This section conducts a suitability analysis with the intent to facilitate the achievement of the following objectives:
a. Improve multimodal transportation (i.e. bus, bike, pedestrian) service accessibility, comfort and efficiency;
b. Maximize redevelopment potential through land use and transit integration, recognizing transfer points as “multimodal hubs” that provide a seamless transition between travel modes, and reducing conflicts between pedestrians, bicyclists, and motorists or car users through the identification of safe, direct pathways to desired destinations;
c. Achieve a multimodal transportation network for Waipahu;
d. Increase safety for pedestrians and bicyclists.
Table 11. Criteria and weighting for multi-modal transportation analysis.
Criteria Sub-criteria (factors) Weight Value
Demand Population density 0.11 normalized population density Employment density 0.11 normalized employment density
Place of interest 0.11 0 = outside 1,000feet
1 = within 1,000 feet
Supply Bike facilities 0.165 0 = within 1,000 feet
1 = outside 1,000 feet
Bus stops 0.165 0 = within 1,000 feet
1 = outside 1,000 feet
Safety Crash 0.33 Normalized crash counts
Table 12. Transportation suitability analysis formula
TRANSPORTATION SUITABILITY =
Where:
Pop = Population density
E = Employment density
PoI = Place of interest
Bi = Bike facility
Bu = Bus Stop
C = Crash
INFRASTRUCTURE ASSESSMENT
Pop (w) + E (w) + PoI (w) + Bi (w) + Bu (w) + C (w)
Select
criteria Determine Weight Index Calculation Suitability Map 35
Figure 28. Factors used to compute multimodal transportation suitability analysis.
Collection and collation of data
Selection of appropriate factors
Standardization of factors
• Weight factors
Raster-based computation
• Analysis tool (extract, proximity)
• Spatial analyst tool (distance, reclass, density)
• Conversion tool (to raster)
• Normalize data
Standardization of factors
• Evaluate suitability
Result analysis
• Suitability map of potential multimodal transportation

Figure 29. Transportation suitability analysis procedure.
• Define population and employment density
• Identify place of interest
• Document bike and bus services
• Accident count
TOD COLLABORATION STUDY
36
Essentially, the locations where people go to school, library, retail, cultural attraction, park, etc., are weigh-in factors. For example, in 2005, the Congress created the Safe Routes to School (SRT) program to improve safety and increase the number of children walking and biking to and from school through education efforts, encouragement programs, and road improvements at or near schools. It is equally important to take into consideration where people live and work. More walking trips can be made in areas with higher population and employment density if good facilities are provided. High-density place also serves more populations. Additionally, traffic safety for pedestrians and bicyclists is another major factor for consideration.
As a result, the suitability analysis considers factors such as existing multimodal transportation infrastructure accessibility, point of interest in the region, population density, and traffic safety, which could be classified into three criteria: community demand, infrastructure supply, and safety concerns. The analysis would prioritize areas for multimodal facilities improvement if it has higher population density, higher employment density, within 1000 feet to point of interest (e.g. school, grocery store, parks, hospital, etc.), with no bike facilities within 1000 feet, no bus stops within 1000 feet, and more traffic accidents.
Figure 28 shows the factors and sub-criteria used to conduct the multi-modal transportation suitability analysis. Table 11 lists the weighting and value for each criterion. Without expert inputs, the three criteria are weighted equally and the sub-criteria are also weighted equally within each category. Figure 29 outlines the schematic diagram for the analysis procedure. All sub-criteria factors have been standardized and normalized to have a value between 0-1. Table 12 describes the formula to calculate the suitability index.
RESULT (figure 30-31):
The results of the transportation multimodal suitability analysis indicate special attention and improvements should be prioritized to the several areas within the larger Waipahu region. Scoring values range from 0.4 (red) which shows the most suitable for improvement to 0.2 (green) as the least suitable. Areas in need for improvment are generally located along Farrington Hwy, inland between Managers Dr. and Paiwa St., as well as east of Waipahu in between

INFRASTRUCTURE ASSESSMENT
Figure 30. Multimodal transportation suitability map for the larger Waipahu area.
37
Figure 31. Multimodal transportation suitability analysis showing places that are suitable and least suitable within Waipahu 1/2 mile TOD area.
Waipahu St. and Farrington Hwy.
Among these areas identified, areas between Paiwa St. - Farrington Hwy - Awainui St., Mokuola St. - Farrington Hwy. - Awalau St., and Farrington Hwy. - Waipahu Depot, are included due to multiple crashes involving vehicle and pedestrian/bicyclist. Although bike facilities are present in these locations, they could be upgraded to further promote the safety of bike users. Other places along the streets should be given attention due to lack of sidewalks. O‘ahu Pedestrian Plan (2017) suggest residents are 65% more likely to walk in a neighborhood with sidewalks. Furthermore, special attention should be given to improve the Mauka side residential area’s multimodal accessibility to the TOD area.
SUITABILITY ANALYSIS: GREEN INFRASTRUCTURE

Green infrastructure refers to a series of vegetated spaces, facilities or elements that are engineered to mimic natural processes and are used to provide ecosystem ser vices and environmental benefits to humans, flora and fauna37. In the context of sustainability, green infrastructure becomes particularly important as it could be used to address the triple bottom line (social, environmental/ecological, and financial) comprehensively. Addressing issues using green infrastructure solution require consideration of best management practices (BMPs) that are multifunctional, meaning they can provide many ecosystem services at once (e.g. evapotranspiration, carbon sequestration, or reduced temperatures), and interact with the social, cultural, economic and environmental of one place38. Multifunctionality should be the basis of design and planning green infrastructure. This dynamic should be the framework to ensure that green infrastructure is beneficial not only to the environment, but also individual, families, and communities, and to the economy.
37 Environmental Protection Agency, 2017; Young et al., 2014.
38 Benedict, 2006; Landscape Institute, 2017; Pakzad et al., 2016; Tzoulas et al., 2007; Weber et al., 2006.
TOD COLLABORATION STUDY
38
Table 12. Criteria and weighting for green infrastructure suitability analysis.
GREEN INFRASTRUCTURE SUITABILITY =
(w) +
Where:
+
(w) +
I = impervious surface
= flow accumulation
FA = tree canopy
Pop = population density
CF = community favorites
IS = improvement sites
= zoning
L= land ownership
= proximity to park
+
+
(w)
Table 13. Criteria and weighting for green infrastructure suitability analysis
Criteria Sub-criteria (factors) Weight Value
Physical Impervious surface 0.11 Percentage of impervious surface coverage
Tree canopy 0.11 normalized value with 0 as highest coverage and 1 as lowest coverage
Flow accumulation 0.11 normalized flow accumulation value, 1 as highest Community Population density 0.11 normalized population density, 1 as highest Community favorites 0.11 1 if selected, 0 if not
Improvement sites 0.11 1 if selected, 0 if not
Implementation Zoning
0.11 0.2 = residential
0.4 = high density residential
0.6 = medium density apartment, Business mixed-use
0.8 = low density apartment, Neighborhood business, Community business, Industrial, district
1 = preservation, Agriculture, Federal and military
Land ownership 0.11 0.5 = private lands
1 = public lands
Proximity to existing green space 0.11 0 = within 1,000 feet
1 = outside 1,000 feet
INFRASTRUCTURE ASSESSMENT
I
C (w)
FA
Pop (w) + CF (w) + IS (w) + Z (w)
L (w)
P
C
Z
P
39
This section conducts a suitability analysis to identify the most suitable places to implement green infrastructure in the study area and adjacent watersheds. Because green infrastructure works better at the watershed scale, the suitability analysis covers four watersheds adjacent to Waipahu TOD area, namely Waikele, Honouliuli, Kapakahi, and Waipio watersheds. It considers physical environment, implementation feasibility, community preference and benefits to address the multifunctionality. figure 36 lists the criteria and factors considered in green infrastructure suitability analysis. Criteria are selected based on academic literature review. For physical environment, this suitability analysis considers factors such as imper vious surface, flow accumulation, and tree canopy coverage. It prioritizes places with more impervious surface, less tree canopy coverage, and more flow accumulation to target places that are more likely to be flooded and has less absorption capacity. For community preference and benefits, it includes population density and community’s inputs on favorite sites and areas for improvement. The analysis prefers areas that are frequently used by the community, have been identified as in need of improvement, and have the potential to serve more population. Finally, from implementation perspective, it considers the zoning, land ownership, and proximity to existing green spaces. It assigns higher weights on places zoned as preservation or low-density apartment/business/ mixed-use, government owned land and without green spaces, and gives lower weights on places zoned as residential, private land, and within 1000 ft of existing green spaces.
Table 13 shows the weight and value for each factor. All criteria and sub-criteria are weighted equally. The value of each factor has been standardized and normalized to between 0-1. Table 12 presents the formula for suitability index calculation. Figure 37 describes the schematic diagram for the analysis procedure.
Figure 36. Factors used to compute green infrastructure suitability analysis.

TOD COLLABORATION STUDY
40
Collection and collation of data
Selection of appropriate factors
Standardization of factors
• Weight factors
• Reclassification
Raster-based computation
• Analysis tool (extract, proximity)
• Data management tool (general)
• Spatial analyst tool (distance, reclass, density, hydrology, math)
• Conversion tool (to raster)
• Normalize data
• Raster calculator
Multicriteria evaluation
• Evaluate suitability
• Create multi-category suitability map
Result analysis
• Suitability map of potential green infrastructure
Figure 37. Green infrastructure analysis procedure.
RESULT (figure 32-33):
• Define population and employment density
• Identify impervious surface, tree canopy, flow accumulation, existing space/ park
• Understand zoning and land use types
Document land ownership
The results of the green infrastructure suitability analysis based on the nine factors combined indicate that specific locations in Waipahu and the TOD area are more suitable to implement green infrastructure than the others. Scoring value range from 0.86 (red shaded) which indicates high suitable for improvement to 0.04 (green shaded) for the least suitable. Generally, areas along Farrington Hwy, and between Queen Liliuokalani Fwy and Farrington Hwy are the most suitable. These locations are best suited for bioswales, permeable pavements, and green roofs type of green infrastructure. The location along Farrington Hwy was identified as one of the best suited areas for bioswales due to the stormwater runoff and flooding issue that occur adjacent to the rail station, as well as its land use type. Figure 34-35 depict the currently underused small pockets at the proposed locations (e.g., sidewalk setbacks and central corridor under the rail structures), where the area’s stormwater management may be enhanced with green infrastructure. Other places with retail, office and high-rise apartment land use are selected for possible implementation of green roofs. These locations currently have higher percentage of impervious surface and less green space. In particular, the state parcels near the rail station could be a suitable area to implement green infrastructure. However, in order to eliminate the flooding problem in the lower watershed, green infrastructure and stormwater facilities in the whole watersheds need to be improved. It is worth noting that the suitability identified in this analysis is the general suitability. Green infrastructure types and functionalities differ across
INFRASTRUCTURE ASSESSMENT
•
41
Figure 32. Green infrastructure suitability analysis showing places that are suitable and least suitable of the larger watershed area.

Figure 33. Green infrastructure suitability analysis showing places that are suitable and least suitable within ½ mile TOD area.

TOD COLLABORATION STUDY
42

INFRASTRUCTURE ASSESSMENT
Figure 34-35. Example of potential locations for green infrastructure projects.
43
TOD COLLABORATION STUDY 44
PART III: RECOMMENDATIONS
CHAPTER 5: BEST PRACTICES
This section provides review of best practices for transportation policies, stormwater management, and sewer infrastructure development with the intent to support future infrastructure decision making in Waipahu TOD area. The objective of this section is to identify the potential policies tools to address the problems identified in Part II. Build off of the recommendations prepared on the 2014 Waipahu Neighborhood TOD Plan developed by the City and County of Honolulu, Department of Planning and Permitting, this section generally put emphasis on: 1) consolidation of parking, 2) establishment of connected greenway network and open spaces, 3) boulevard treatment along Farrington Highway, and 4) consideration for decentralized sewer system.
TRANSPORTATION
One of the goals of TOD is to encourage the use of alternative modes of transportation, such as walking, biking, and public transport, in replace of the private vehicles trips. Farrington Hwy experiences high traffic jam on a daily basis, particularly during peak hours. Congestion has been one of the most concerning issues in Waipahu. One important question to ask is whether the rail alone will be enough to foster significant changes in travel behavior
The TOD special district ordinances give the City authority to dictate lower parking requirements for residential developments. However, since there are no required set ratios, parking provision is more of a project by project basis. The minimums recommended in the TOD special district guidelines (see table 14) allows the developers to create parking that is in conformance with the land use and cost-effective, and hence, saving the developers a substantial amount of money. It is therefore considered a development bonus. The developers who want to develop in TOD areas that are not yet special districts will need to get the interim planning development-transit (IPD-T) permits. The IPD-T also requires developers to create multimodal use environment and limit automobile use. However, the built out analysis shows there is still a potential for significant increase in traffic and parking needs with future development. Despite the existing policies, it is important to identify strategies that could help to alleviate the potential traffic and parking problems. This section provides a review of two best practices related to promoting multimodal transportation and reducing parking needs, with success stories in Concord, Massachusetts and Vauban, Germany.
Off-street parking requirements for dwelling OR lodging units
Floor area of unit Requirement
INFRASTRUCTURE ASSESSMENT
300 ft2 or less 0 301 – 600 ft2 0.5 601 – 800 ft2 0.75 Over 800 ft2 1 Table 14. Guidelines for minimum parking recommended in TOD area. 45
Best Practice 1: Shared-parking
Shared parking is a land use/development strategy that optimizes parking capacity by allowing complementary land uses to share spaces, rather than reserving separate spaces for separate uses. Shared parking could be a potential solution to accommodate parking space in a more sustainable way, limiting the underused spaces and can potentially reduce parking requirement by 20-40%. Overabundance of parking could be eliminated, hence gives room for a mixed-use, compact development to thrive. In addition, shared parking will create positive and vibrant economic, social, and environmental benefits. The construction and operation processes may involve private developers; however, it is suggested that shared parking remain within the government’s jurisdiction for long-term transport planning purposes39
Shared parking could be successful in Waipahu’s case if implemented properly. Shared parking could be implemented in Waipahu if attention is given to:
1. Revise the current local ordinances that emphasize the minimum parking requirement (MRP), and instead offer incentives and create directives to develop shared parking.
2. Change ordinances and barriers that inhibit the possibility of applying shared parking initiative.
3. Conduct more detailed parking estimation once the development plan is more in shape by doing a) feasibility studies, b) understanding community traffic patterns, c) understanding supply vs. what is being used, d) evaluating the price of parking as a lever that can change parking demand.
4. Evaluate zoning laws where parking is not limited to certain land uses (e.g clustered businesses and other uses where parking is private).
5. Outreach to educate car owners and tenants on bundled parking and associated savings.
TOD COLLABORATION STUDY
39 ITDP, n.d, p.1
46
Best Practice 1: Shared-parking
Success Story: Vauban, Germany
In mixed-use developments, a parking area can more efficiently serve multiple locations and activities simultaneously. For example, instead of needing two parking lots to accommodate an office space that has peak demand during the week at day time, and an entertainment venue that has peak demand in the evenings, late at night and on the weekends, a single parking lot could accommodate both.
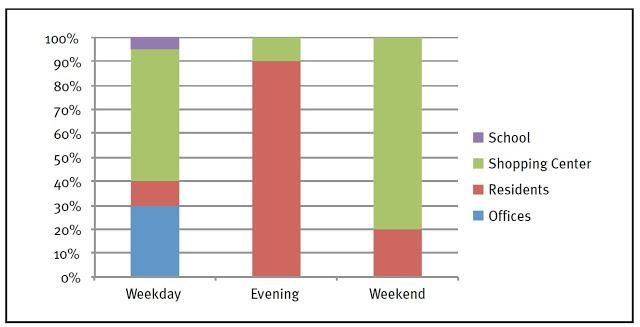
A successful case study of reduced parking requirement with shared parking in a small sustainable town of Concord, Massachusetts is a decent example. The Concord Commons development comprises three mixed-use building with retail space, office space, a 180-seat restaurant, and 20 rental apartments. The zoning required 146 parking spaces for the mix of uses proposed. However, the developer negotiated a 15% parking reduction by demonstrating shared parking strategies. Approximately 15 spaces are dedicated to commuter parking. The Planning Board negotiated a reduction in the impervious lot area from 2.15 acres to 1.93 acres, which allowed for a landscaped garden amenity for residents. A landscaped pathway was incorporated by the developer connecting Sudbury Road to the station platform, providing a more walkable connection to the town center. Finally, because the Concord Common development directly abuts an established residential neighborhood, the developer designed the building facing the residential street at a scale that blended well with the existing housing and provided a vegetative green buffer between the parking lot and the neighborhood.
In practice and models, a reduction of 20-40 percent in the number of needed parking stalls can be anticipated by implementing shared parking in TOD district, rather than requiring parking needs to be met on site. It is imperative to identify the funding mechanism, potential locations for new parking structures, and existing parking facilities that could be enhanced for shared use. For shared parking to be feasible, it must be easy for people to walk between the shared parking structure and the different facilities or activities associated with the shared parking site, and there must be agreements and coordinated parking management practices between the entities sharing the parking space.
Source: www.mass.gov/envir/smart_growth_toolkit
INFRASTRUCTURE ASSESSMENT
47
Best Practice 2: Car free development
The car free development is an innovative and yet radical solution that has been implemented in some large urban areas in European countries as a measure to reduce congestion. It spatially and fiscally separates parking and often is designed in conjunction with other congestion reducing measures such as car clubs, lift share schemes, etc. This policy advocates for car-free or low car provision at the neighborhood level, and as a result, residents are encouraged to use other attractive transportation alternatives including bike, bus, rail-based transit system, etc. Car free development is perceived as a direct response to the challenge of a sustainable transport future.
Nevertheless, car free development is a radical concept and might not be implemented in a relatively near future, it is best considered as a longer-term sustainable solution. Challenges will persist in Waipahu in terms of implementing parking-free block policy and design measures given this nature of the residents as being car-dependent society, and as a result of historical development patterns.
However, building district parking structures at peripheral locations surrounding the TOD central districct could be an option. The good design and connectivity of walkways/bike path could be another thing to learn to reduce auto trips in Waipahu. For this recommendation to be actionable and at a policy-level, several attentions need to be given to:
1. Evaluation of development project within the existing planning regime and current land use challenges, for both Waipahu region-wide and street specific.
2. Barriers and opportunities for the integration of car-free policy in TOD, as well as its implications for planners, developers, business owners, and private enterprise.
3. Education and public participation in terms of creating potential benefits of the car-free neighborhood. Similar to public meetings that were conducted in the past in Waipahu, communities can formulate a shared vision as part of a proactive public sector planning process. Residents are more likely to welcome the future changes at their neighborhood with participation and shared vision. A well-designed and properly implemented policy, even partly car-free development can increase overall safety and boost walkability in Waipahu.
TOD COLLABORATION STUDY
48
Best Practice 2:Car free development (Cont.)
Success Story: Concord, MA
The city of Freiburg, Germany has always emphasized the quality of its surrounding environment. In the area of transport, many innovative ideas including the car-free block have had successful implications. In the small city of Vauban, with a total population of 5,000 people, there has been a considerable reduction in car ownership since 2010; 40% of the parkingfree household do not have a car, and 41% of car-owners use a bicycle more than they did before moving into an area. An Association of CarFree Living was established to administer this system. In years before, parking ratio of less than 0.5 per housing unit was implemented only to satisfy the Baden Wurttemberg Land Law, which required every home to have access to a parking space. Since the implementation of car-free policy, approximately 57% of residents in car-free households gave up their car when they moved to Vauban.
Vauban, like some cities in Germany, only allows car access into the residential street for picking up and dropping off. The same rules apply to surround the streets in the residential block, and residents are provided with on-site underground parking. Since parking areas are limited and separated from the housing units, car owners have to park in one of the peripheral garages, which has associated fee-based on the land value and the cost of construction. A total of 470 spaces are made available in two peripheral parking garages, each of which currently costs 18,500 EUR and with additional 70 EUR for monthly maintenance. The premium price to maintain parking space has been one of the most critical factors of changing lifestyle. Today, the roads have been used for a multi-purpose social gathering place, a play street, and a safe pedestrian
walkway and bicycle path, although there is also designated bike paths somewhere.
With the successful implementation of car-free policy, the authority, however, does not leave residents with no options. The city of Vauban has offered other attractive alternatives to a car such as a rail-based transit system, which operates extensively and frequently, and high-quality non-motorized transport infrastructure. Since 1998, Vauban has opted-in for more sustainable planning practices, mimicking the City of Freiburg which has had several achievements since 1960; the exclusion of cars, reduced city center parking with fees up to 2.20 EUR per hour, provision of 1,000-space bike storage facility, and city-wide 30 km/h or lower speed limits are among their transportation policies. Being the most celebrated “model sustainable districts,” Vauban emphasize not only car-free development, but also the creation of a colorful district with a strong sense of community, the use of solar energy and renewable woodchip district heating, and extensive provision of green space and communal garden.
Source: https://3gozaa3xxbpb499ejp30lxc8-wpengine.netdna-ssl.com/wpcontent/uploads/2014/07/26.-092211_ITDP_NED_Vauban.pdf
INFRASTRUCTURE ASSESSMENT
49
STORMWATER MANAGEMENT
One of the most prevalent issues in Waipahu is the stormwater runoff. Generally, areas along Farrington Hwy, and between Queen Liliuokalani Fwy and Farrington Hwy receive substantial amount of runoff and are often flooded during torrential rain. Puddles that are created along Farrington Hwy apparently posed unaccommodating experience for residents and sidewalk users. Public health impacts may be present due to bacteria and disease-causing organism carried by urban stormwater runoff40. The runoff analysis under Need Assessment indicates that the proposed development in Waipahu will not likely to sustain the amount of stormwater produced.
To address this issue, several Best Management Practices (BMPs) can be used to manage stormwater runoff, improve air quality, or more in the conservation, creation, and restoration of ecosystem processes and functions. In particular, green infrastructure is effective stormwater management practices and is usually strategically employed to decrease and/or disconnect impervious surfaces. Integrating green infrastructure into urban fabric represents an effective way to manage stormwater volume and reduce flooding. However, besides physical feasibility, multiple features need to be considered for the implementation of green infrastructure strategies such as green roofs, as well as lot or site scales (such as rain gardens, permeable pavement, or bioswales), or district/neighborhood scale . In particular, understanding the role of social and ecological elements within their context and their interplay across dimensions is essential to provide meaningful and useful benchmarks for the design and implementation of green infrastructure systems, as well as for building long-term, flexible processes of sustainability into urban systems. The section presents two best practices using green infrastructure to achieve stormwater management as well as multiple social benefits with success stories in Normal, Illinois and Seattle, Washington.
TOD COLLABORATION STUDY
40 EPA, n.d 50
Best Practice 3: Stormwater roundabout
There have been several cases where developers use low impact developments at roundabouts. The stormwater roundabout is modern example showcasing solution to reduce stormwater impacts while building a sense of place and serving as powerful tool to promote green infrastructure. The design of stormwater roundabout typically limits paved surfacing or impervious area and creates a balance between vehicle needs and green space. It favors the idea of promoting usability and public right-of-way. The design also leverages the spaces that are not accessed by vehicle (center, splitter islands, buffer areas) to be transformed into porous sidewalks and bioretention facilities.
Stormwater management regulations are a major requirement for construction projects across the United States. With green infrastructure like stormwater roundabout, stormwater management could be an opportunity to not only excellently coping with the excessive runoff, but aslo enhancing the character of the community through placemaking elements. In order to set a stage for initial process and implementation of such strategies in Waipahu, attention need to be given to these following key points:
1. Zoning and land use configurations and whether the current and future development could provide spaces for implementation of such strategies.
2. Coordination between key stakeholders in terms of initial design, construction, and maintenance, and any financial cost and benefits sharing associate with the project(s).
3. Challenges for implementing the runoff water management on different types of surface which is often underestimated by developers and contractors.
INFRASTRUCTURE ASSESSMENT
39 ITDP, n.d, p.1
51
Best Practice 3: Stormwater roundabout (Cont.) Success Story: Uptown Circle. Normal, IL
In transportation engineering, roundabouts served as good traffic operation and considered safe when appropriately designed. In Normal, Illinois, the Uptown Circle, the naturallycleansed stormwater roundabout, has provided environmental, social, and economic benefits, hence, this centerpiece of an urban redevelopment project was honored by the Illinois Chapter of the American Society of Landscape Architects (IL-ASLA) in 2011, and the President’s Award in the urban category, which is also known as the highest recognition awarded. The Uptown Circle serves an example of successful design in the urban area regarding serving multiple functions; cleanses and re-circulates stormwater into a public fountain, improves traffic circulation at a busy five-street intersection, and provides community green space41
The Uptown Circle stormwater management has successfully incorporated innovative elements such as ultraviolet light that treats the collected stormwater, which then used to irrigate the neighborhood’s streetscape, filtration bogs on either side of the circle, and a structural cell system. The following is the process of this stormwater management:
• Water goes through a filter that traps excess debris
• Water is filtered, then travel through an ultraviolet sanitizer
• Ultraviolet light energy acts as microorganism removal, but without using chemicals that is harmful to human and animals.
• Water is pumped up through the bog plants, which absorbs sediments and remaining toxins
• Water is then pumped up and ends up in the fountain pool, where communities enjoyed as a social gathering place.
The project generated multiple social, environmental, and economic benefits, which makes it worth imitating. The Federal Highway Administration (FHA) projected a reduction in traffic accidents by 35 percent, and 75 percent reduction in pedestrian and vehicular conflict points because of the project. According to the Landscape Architecture Foundation, the Uptown Circle stormwater management has saved up to over $7,000 annually in potable water cost by capturing 1.4 million gallons of stormwater from a 58,800 square feet area and reusing it for irrigation. Besides, it prevents a similar amount of rainwater from entering the municipal storm sewer by diverting the runoff from the impervious surface such as sidewalks into tree
wells and planter areas augmented by underground structural cells, which simultaneously recharges groundwater. In term of economic benefits, there has been an increase in the property values in the Uptown tax increment financing district by $1.5 million within one year (2009 - 2010), which translates into over 30 percent increase since 2004.
The Uptown Circle has been embraced as a new symbol and focal point in the community of Normal Illinois. The highperformance infrastructure that integrates multiple elements such as roadways, stormwater management, and public space, are some things along the line the town of Waipahu is looking for in terms of building vibrant, sustainably driven, and the future of multi-modal transportation center will connect residents and pedestrians to several transportation modes such as bus, train, and bike routes.
Source: https://www.landscapeperformance.org/case-study-briefs/uptownnormal-circle-and-streetscape
American
TOD COLLABORATION STUDY
41 Green, J. (2010). Sustainable roundabout manages stormwater and traffic. The DIRT:
Society of Landscape Architects 52
Best Practice 4: Green roof
Green roofs are also known as eco-roofs and roof garden, a layered system of roofing typically involves waterproofing, drainage materials, and support plants. Green roofs are intended to retain stormwater on the roof surface before it is conveyed into the local stormwater system42. Eco-roofs provide multiple ecosystem services including stormwater management, increased carbon sequestration, urban heat island mitigation, and increased local biodiversity43. Green roofs have the potential to mitigate flooding, while also reducing energy cost44. Buildings that have green roofs installed are energy efficient in both tropical and temperate climates due to the fact green roofs can absorb and insulate. Green roofs are most effective in cooling buildings in hot climates and have been documented cooling standard concrete buildings by 1-3 degrees Celsius. Still yet green roofs have even better potential to mitigate stormwater runoff. Green roofs could lead to 60% runoff mitigation for extensive green roofs and up to 100% for intensive green roofs45
Waipahu already experienced high levels of flooding due to impermeable surfaces, and this is expected to worsen with future weather conditions. Green roofs have the potential to mitigate flooding and stormwater runoff, while also reducing energy cost. Under the full build-out scenario, expected as the TOD zoning, Waipahu could have over 3 million ft2 available for green roofs. Green roofs stand to serve a high level of functionality in the Waipahu TOD area, particularly when in conjunction with bioswales and renewable energy.
The small scale, non-extensive type of green roof could be implemented in Waipahu as part of pilot project. Further attention needs to be placed on:
1. Place-specific green roof development (old development vs. more retrofits, new development), and design that fit the specific requirements of building in Waipahu. Furthermore, although green roofs have the potential to retain high percentage of rainfall, meeting targets during extreme weather events will be instrumental to successful implementation.
2. Initial cost breakdown since green roofs tend to be eliminated from early plans due to high cost and uncertain availability of material and maintenance commitment.
3. State coordinated development plans and incentives for green roofs project to be carried out via public-private partnership (PPP).
42 EPA. (2009). Green roofs for stormwater runoff control.
43 McIntosh, A. (2010). Green roofs in Seattle.
44 Berardi et al.. (2014). State-of-art analysis of the environmental benefits of green roofs.
45 Berardi et al.. (2014). State-of-art analysis of the environmental benefits of green roofs.
INFRASTRUCTURE ASSESSMENT
53
Best Practice 4: Green roof
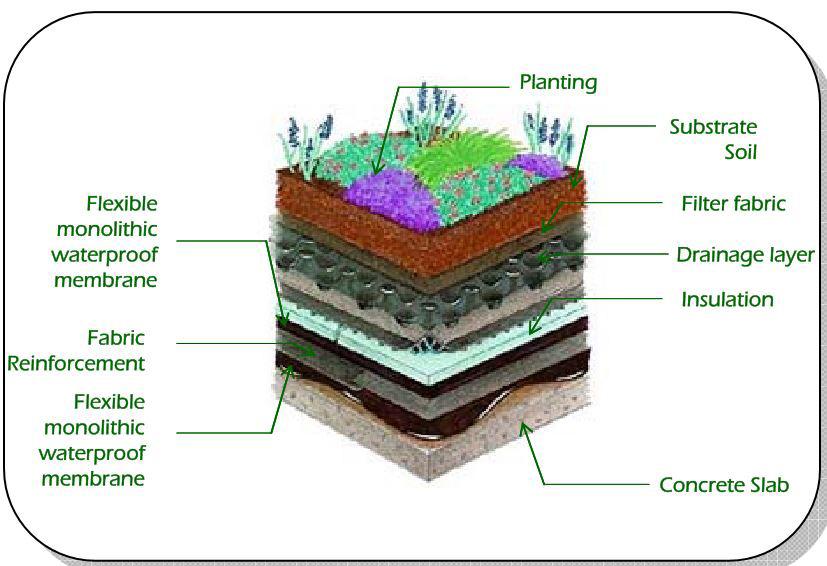
Success story: Seattle City Hall, Seattle, WA
Most of the Seattle’s existing green roofs are found in centrally located neighborhood, with an assortment of small-scale projects in northern neighborhoods, for residential usage (McIntosh, 2010, p.4). According to 2009 survey, Seattle’s total green roofs have reached 62, ranging from extensive (e.g 186,270 ft2 area), intensive (148,069 ft2 area), and combination with some large rooftop gardens (McIntosh, 2010, p. 6). The owner of Seattle City Hall green roof, the City of Seattle has been successfully maintained and sustained the vitality of 13,200 ft2 green roofs since its establishment in 2003. One of the reasons leading to the realization of the iconic green roofs in the city is to decrease combined sewer overflows, peak flows, improve stormwater runoff water quality, and combat urban heat island and improve air quality. The collection of a variety of drought-tolerant plants planted in the roof; Frosty Morn, Sedum reflexum, June grass, etc., has helped with the runoff that goes into a 30,000 ft3 rainwater collection cistern. This water is then used for toilet flushing and irrigation of other landscaping. It has a joint venture design team of several well-known architects along with green roof engineer and contractor.
Source: https://www.kingcounty.gov/~/media/depts/dnrp/solid-waste/greenbuilding/documents/KC_Green_Roof_case-study.ashx?la=en
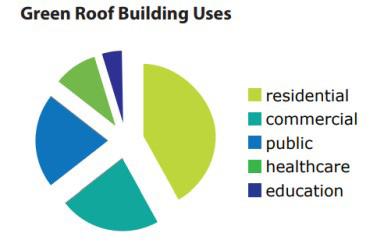
TOD COLLABORATION STUDY
54
SEWER MANAGEMENT
Most of the wastewater that enters the system flow toward the Waipahu Wastewater Pump Station. Currently, the pump station can only accommodate flows up until the year 2020. Currently, the sewer system is adequate for a population of about 198,000 people within Central O ahu. About 28,000 of those customers are from Waipahu46. The current capacity of the Wastewater Treatment Plant is reported as 80 MGD (millions of gallons per day) based on the service boundary of the 2001 Facility Plan and based on a future design population of 424,000 (residents) and 133,176 (employment)47. Density changes in the TOD area are expected to result in increased wastewater flows, which may necessitate needed upgrades to the pipelines and pump station. If the upgrade is necessary in future, the shortcomings of the old paradigm could provide an opportunity to be alternatively shifted to water management that is more multifunctional, decentralized, integrated, restorative and adaptive.
Sustainable urban projects on wastewater treatment that are undertaken in major cities, for example, New York, demonstrate what can be done to reduce demand on public water/ wastewater infrastructure and water resources. For a wastewater treatment to be sustainable, it is imperative that the system is viewed in a broader sense, taking into account not only cost and treatment performance energy aspect, but also recycling and social issues48. The old paradigm of highly centralized sewage, segregated, linear, extractive and inflexible are no longer work in some big cities and are relatively unsustainable due to the vast amount of energy used. In addition, the pollution from the effluent it has caused toward the rivers is staggering and continuing to threaten the ecological viability of the surrounding areas. In the face of rapid development, decentralized wastewater treatment sometimes could provide cities and municipalities a more sensible solution. This section provides a best practice of decentralized wastewater system.
According to the Environmental Assessment for the Waipahu Wastewater Pump Station Modification (1995)
Van Meter Williams Pollack LLP., 2007
Jenssen et al. (2007). Sustainable wastewater treatment. International Conference on Natural Resource and Environmental Management, and Environmental Safety and Health.
INFRASTRUCTURE ASSESSMENT
46
47
48
55
Best Practice 5: Decentralized Wastewater System
Decentralized wastewater treatment can be managed as stand-alone facilities or be integrated with centralized sewage treatment system. EPA describes this system as consist of multiple approaches for collection, treatment, and reuse of wastewater for different level of development types (individual dwellings, apartment buildings, industrial, businesses, communities). This system is usually costeffective and operates in a more sustainable mode since water is constantly filtered and reused for household purposes. However, decentralized system needs a careful design and proper maintenance to deliver optimum benefits. Decentralized wastewater promotes the idea of environmental protection and stewardship, improving public health and water quality, and helps communities reach the triple bottom line of sustainability49.
49 EPA, n.d.
Given the future environmental challenges (i.e. sea level rise and coastal hazards) and the nature of wastewater facility in Waipahu, it is essential that new developments incorporate a more long-term, cost—effective, sustainable solution to wastewater management, which should allows for flexibility in management in the area. Decentralized wastewater treatment and reuse of domestic wastewater in Waipahu could be implemented with special attention to:
1. Funding and resources to invest and manage wastewater project, selection of the most appropriate technology that fit into Waipahu’s need, as well as experience for design and construction by the private sector.
2. Operation and maintenance once the system is built, as well as inspection, monitoring and program evaluation components.
3. Strict effluent standards, national laws and license regulations.
4. Public involvement and awareness since the clear environmental and public health goals are vital for developing, implementing and sustaining the system.
TOD COLLABORATION STUDY
56
Best Practice 5: Decentralized Wastewater System
Success story: Battery Park, Manhattan, NY
The Battery Park city has been an example of sustainable urban development. One of the objectives has been to minimize water consumption by reusing it for multiple building systems through sewage treatment. Battery Park encompasses 92 acres of urban infill, with approximately 20 million square feet of mixed-use development, is currently managed by the Battery Park City Authority (BPCA). The first project incorporating a decentralized system of wastewater reuse was implemented in one of the eight buildings it serves. For example, the Solaire high-rise residential of fewer than 300 units that have been operating since 2003 is using treated water as the solution to sustainable sewage. It is reported that the treated water that was initially utilized for flushing toilet is now used for cooling tower, sidewalk maintenance, and irrigating its green roof. In recent years, the water reuse systems were approved for laundry.
Water treatment involves technical processes and advanced technology that is being powered with hollow fiber microfiltration membranes, ultraviolet light disinfection, and biological nitrogen removal to comply with New York City Department of Buildings direct water reuse standards. Water and Wastewater International provides a comprehensive treatment process description.
These systems are considered the most significant green components installed in the building’s basement. The total design for the sewage system is 165,000 gallons per day (gpd). According to the Water and Wastewater International, the systems have generated positive and concrete results;
they account for over 50% water consumption reduction50 compared to NYC apartment buildings unequipped with water reclamation systems, and over 60% reduction in wastewater discharge. Additionally, it uses 35% less energy than a similar structure designed to New York state’s code requirements, and 65% less electricity during peak demand hours. It has been consistent throughout a few years. In addition to water reuse system, this technology captures stormwater and stores it in a 10,000-gallon tank, which then used to maintain green infrastructure in the building and minimize flash flooding due to storm drain overflow51
50 D’Amato et al., n.d; Zavoda. (2006). 51 Zavoda, M. (2006). NYC high-rise reuse proves decentralized system works. WaterworldP water and wastewater international.
Source: https://www.nsuwater.com/case-studies/battery-park-city/
INFRASTRUCTURE ASSESSMENT
57
CHAPTER 6: FINDINGS AND RECOMMENDATIONS
This chapter summarize the analysis and findings resulted from build-out scenario and need assessment pertaining to issues being raised in Waipahu and TOD and proposes recommendations based on the suitability analysis and best practice review.
In coping with 21st-century challenges such as increased energy cost, climate change, increased drought frequency, ecosystem health, and natural service deterioration, etc., Waipahu could apply integrated infrastructure planning, design, management using systems at various scales, based on context-specific sustainability objectives that emphasize low -impact design and best management practices (BMPs). Key takeaways from this study include:
1 Existing roadway capacity, parking facilities, stormwater facilities, and sewer pipelines in the Waipahu TOD area may not be sufficient to accommodate a full build-out future scenario in general.
2 Transportation Infrastructure
• A maximum build-out scenario for the state parcel based on the TOD zoning would significantly increase parking demands in the area and the traffic on adjacent roads (e.g. Mokuola street and Waipahu street).
• To reduce the congestion and promote non-auto trips, pedestrian/bicycle/transit facilities along Paiwa St., Farrington Hwy, Awainui St., Mokuola St. Farrington Hwy. Awalau St., and Farrington Hwy should be prioritized for multimodal transportation facility improvement. Waipahu TOD would benefit from a reduction in future traffic and parking needs if public transit and walking friendly environment are prioritized. It is recommended to improve the an extensive network of pedestrian and bicycle facilities, add more bus connections with more frequent services, and implement strategies such as bus-only lanes where possible.
• To reduce and accommodate the future parking needs, it is recommended to eliminate minimum parking requirements, implement district-level parking maximum, adopt regulations and incentives encouraging shared-parking, as well as regulations allow new parking structures to be adaptable to other uses to anticipate the emerging trends (e.g. autonomous shared vehicles, sea level rise). Compact mixed-use development as one objective of the TOD, is a catalyst for increasing parking efficiency and reducing the amount of parking needed in the area.
3 Stormwater management
• Development of state parcels and the TOD area would increase the overall stormwater runoff in the watershed by 12%, which could make the existing flooding problem worse.
• The flooding problem is mostly caused by urban imperviousness in the whole watershed. Without upstream mitigation or additional stormwater facilities, it would need approximately 80% of the TOD development to be green/pervious surfaces in order to keep the future runoff at the current level.
• Adopt Green Infrastructure when possible. Both the existing study and students’ community survey suggest the community’s strong interest in walkability, provision of green spaces for recreation, and the needs to mitigate flooding. Green infrastructure has the potential to address all these concerns. It is recommended that planners consider greenways, green corridors, green spaces, green roofs in
TOD COLLABORATION STUDY
58
TOD areas if possible. Although green infrastructure could not solve the area’s flooding problem by itself, it has the potential to reduce the stormwater runoff and fulfill the community’s needs if implemented correctly.
• Suitability analysis identifies areas such as Waipahu Depot, Farrington Hwy, and the state parcels as the most suitable places to implement green infrastructure in the watershed.
4 Wastewater Facilities
• Under the maximum build-out scenario, the state parcels could generate almost eight times the current wastewater flow. It is very likely that the 24’’ sewer main pipe needs to be upgraded in the future.
• Given the potential significant increase in sewer discharge, besides the expensive upgrade of the pipelines in centralized wastewater system, it is recommended to examine the possibility of using decentralized wastewater treatment, which can reduce the overflow incidents from centralized system and have the technical flexibility to relocate and adapt to the changing climate if extreme weather becomes more frequent. Decentralized sewer that put emphasis on wastewater recycling system can also reduce the demand on public water infrastructure and water resources.
5 Finally, there is a need to examine the condition and needs for other utilities such as water and power when data become available.
INFRASTRUCTURE ASSESSMENT
59
REFERENCES
Baer, W. C. (1997). General plan evaluation criteria: An approach to making better plans. Journal of the American Planning Association, 63(3), 329-344.
Bäcklund, P., & Mäntysalo, R. (2010). Agonism and institutional ambiguity: Ideas on democracy and the role of participation in the development of planning theory and practice—The case of Finland. Planning Theory, 9(4), 333–350.
Berardi et al.. (2014). State-of-art analysis of the environmental benefits of green roofs. Applied Energy, 115, p. 411-428.
Car Free Housing. (n.d). Car free development. Retrieved from http://www.carfreehousing.org/ whatis.html
City and County of Honolulu Department of Transportation Services. (2017). Rail station connectivity for transit-oriented development (TOD) - Waipahu
City and County of Honolulu Department of Transportation Services. (2017). O‘ahu Pedestrian Plan: Honolulu Complete Streets
City and County of Honolulu Department of Planning and Permitting. (2012). Waipahu community survey
Commercial Shared Street. Retrieved from: https://nacto.org/publication/urban-street-designguide/streets/commercial-shared-street/
Delvaux, B., & Schoenaers, F. (2012). Knowledge, local actors and public action. Policy and Society, 31(2), 105–117.
D’Amato, V. (n.d). Integrated water resource management. Conservation Technology Information Center Webinar. Retrieved from https://engineering.purdue.edu/watersheds/webinars/ wastewater2010/D'Amato%20integrated%2012-9-10r1.pdf
Environmental Protection Agency. (2017). Key actions in the national water program strategy. Retrieved from https://cfpub.epa.gov/watertrain/moduleframe.cfm?parent_object_id=2537
Environmental Protection Agency. (n.d). Decentralized wastewater treatment: a sensible solution. Retrieved from https://www.epa.gov/sites/production/files/2015-06/documents/mou-intro-paper081712-pdf-adobe-acrobat-pro.pdf
Environmental Protection Agency. (n.d). Decentralized wastewater treatment: a sensible solution. Retrieved from https://www.epa.gov/sites/production/files/2015-06/documents/mou-intro-paper081712-pdf-adobe-acrobat-pro.pdf
Environmental Protection Agency. (2009). Green roofs for stormwater runoff control. Retrieved from https://www.nps.gov/tps/sustainability/greendocs/epa%20stormwater-sm.pdf
ESRI. (n.d). Suitability analysis. Retrieved from https://doc.arcgis.com/en/community-analyst/ help/suitability-analysis.htm
Green, J. (2010). Sustainable roundabout manages stormwater and traffic. The DIRT: American
TOD COLLABORATION STUDY
60
Society of Landscape Architects.
Green Business Certification Inc. (n.d). Multipurpose parking structures. Retrieved from: http:// www.gbci.org/sustainable-buildings-designing-multipurpose-parking-structures
Greenroofs.com. (n.d). Seattle City Hall. Retrieved from http://www.greenroofs.com/projects/ seattle-city-hall/
Hawaii State Department of Transportation - Highways Division. (2015). Stormwater Permanent Best Management Practices Manual. Stormwater Management Program.
Honolulu.gov. (n.d). Leeward region: Honouliuli wastewater basin. Retrieved from http://www. honolulu.gov/rep/site/env/wwm_docs/wwm_honouliuli.pdf
H+T Factsheet, 2017, Location Efficiency Metric. Retrieved from https://htaindex.cnt.org/factsheets/?focus=cbsa&gid=139
Institute for Transportation & Development Policy. (n.d). Shared parking. Retrieved from https:// www.itdp.org/wp-content/uploads/2014/12/Shared-Parking_ITDP.pdf
Jenssen, P.D., Vrale, L., Lindholm O. (2007). Sustainable wastewater treatment. International Conference on Natural Resources and Environmental Management and Environmental Safety and Health. Retrieved from https://www.researchgate.net/publication/228812977_SUSTAINABLE_ WASTEWATER_TREATMENT
Jeu, P. (2010). Green roof in Seattle. Retrieved from https://www.seattle.gov/util/cs/groups/ public/@spu/@conservation/documents/webcontent/02_015898.pdf
Juhola, S., Driscoll, P., Mendler de Suarez, J., & Suarez, P. (2013). Social strategy games in communicating trade-offs between mitigation and adaptation in cities. Urban Climate, 4, 102–116
Kamalu-Ho`olulu Elderly Housing. Retrieved from: http://hawaiiaffordable.com/wp-content/uploads/2011/06/Kamalu-Hoolulu-State-Elderly-RentalApplication.pdf
Landscape Architecture Foundation. (n.d). Land Performance Series: Uptown Normal Circle and Streetscape. Retrieved on November 27, 2018 from https://www.landscapeperformance.org/ case-study-briefs/uptown-normal-circle-and-streetscape
Marritz, L. (2011). Uptown Circle project honored with IL-ASLA award. Deep Root. Retrieved on November 27, 2018 from http://www.deeproot.com/blog/blog-entries/uptown-circle-in-honoredwith-il-asla-award
McIntosh, A. (2010). Green roofs in Seattle. Retrieved from https://www.seattle.gov/Documents/ Departments/OSE/Green-Roofs-In-Seattle.pdf
National Association of City Transportation Officials (NACTO-B). Urban Street Design Guide
National Urban Research. (2012). A report on the city of New York’s existing and possible tree canopy. Retrieved from https://www.nrs.fs.fed.us/urban/utc/local-resources/downloads/ TreeCanopy_Report_NYC2010.pdf
INFRASTRUCTURE ASSESSMENT
61
Pandya, S. (2017). Sustainable Buildings: Designing Multipurpose Parking. Retrieved from https://parksmart.gbci.org/sustainable-buildings-designing-multipurpose-parking-structures
Young, R., Zanders, J., Lieberknecht, K., Fassman-Beck, E. (2014). A comprehensive typology for mainstreaming urban green infrastructure. Journal of Hydrology, 519, 2571–2583. Retrieved from https://doi.org/10.1016/j.jhydrol.2014.05.048
Urban Sustainability Directors. (2015). Maximizing urban-core parking with private-public and private-private parking agreements. Retrieved from https://www.usdn.org/uploads/cms/ documents/2015usdnconvening_summary.pdf
U.S. Census, 2018. Quickfacts Waipahu CDP, Hawaii. Retrieved from https://www.census.gov/quickfacts/fact/table/waipahucdphawaii/LFE305217#LFE305217
Van Meter Williams Pollack LLP., Weslin, Decisions Analysts Hawaii Inc, and Bills Engineering. (2007). Waipahu Neighborhood Transit-Oriented Development Plan
Zavoda, M. (2006). NYC high-rise reuse proves decentralized system works. Waterworld: Water and Wastewater International. Retrieved from https://www.waterworld.com/articles/wwi/print/ volume-21/issue-1/features/nyc-high-rise-reuse-proves-decentralized-system-works.html
TOD COLLABORATION STUDY
62
INFRASTRUCTURE ASSESSMENT 63

