Trending Technologies
Also in this issue:

WELCOME TO THE ZONE
Welcome to the zone with the new Precision 5000 Series mobile workstations, where creativity flows uninterrupted. Featuring immersive InfinityEdge display, up to Intel ® Core™ i9 processor and Dell Optimizer for Precision.

Learn more at Dell.com/Precision
As a special thank you to the AUGIWORLD community, you can find exclusive offers from Dell at Dell.com/AUGI


From the President
HAPPY NEW YEAR! I HOPE ALL OF YOU HAD A BLESSED HOLIDAY SEASON!
Our January issue of AUGIWORLD is aimed at trending technologies. Even though we are all in different industries, all these industries have one thing in common, and that is technology change.
I think of what technology was like when I was a child (home phones, cassette players, microwaves), again when I got my first “career” job in 1989 (286 computers, car phones), and even 15 years ago (Facebook and social media). It never ceases to amaze me how different the world of technology is today. I would never have imagined thirty years ago (when I was 24), that we would be able to use cameras to capture millions of points to create digital models of the ground and buildings!
Constant technology change is something that we all have learned to live with, it’s a significant part of our lives. Especially with the phones and mobile devices we have access to.
Within our industries, we see augmented & virtual reality, robotics, cloud-based software, cloud-based project collaboration, machine learning, and too much more to list here.
What technology is changing your industry right now? What technology is changing your personal life right now? What can we do to use technology to improve the lives of human beings?
These questions remind me of something that Steve Jobs said “It’s not faith in technology. It’s faith in people.”
People (we) make the technology run, we are the ones that invent(ed) it, we can make it bring people together, use technology to improve our industries, and improve our lives.
Sincerely, KaDe
AUGIWORLD
www.augiworld. com
Editors
Editor-in-Chief
Todd Rogers - todd.rogers@augi.com
Copy Editor
Isabella Andresen - isabella.andresen@augi.com
Layout Editor
Debby Gwaltney - debby.gwaltney@augi.com

Content Managers
3ds Max - Brian Chapman
AutoCAD - Tracy Chadwick
AutoCAD Civil 3D - Shawn Herring
BIM/CIM - Stephen Walz
BricsCAD - Craig Swearingen
Dassault Systèmes - Rafael Testai
Tech Manager - Mark Kiker
Inside Track - Shaun Bryant
Advertising/Reprint Sales
Kevin Merritt - salesmanager@augi.com
AUGI Executive Team
President KaDe King
Vice-President
Frank Mayfield
Treasurer Todd Rogers Secretary Kim Fuhrman
AUGI Board of Directors Eric DeLeon Kimberly Fuhrman KaDe King Chris Lindner
Frank Mayfield Todd Rogers Scott Wilcox
Publication Information
AUGIWORLD magazine is a benefit of specific AUGI membership plans. Direct magazine subscriptions are not available. Please visit www.augi.com/ account/register to join or upgrade your membership to receive AUGIWORLD magazine in print. To manage your AUGI membership and address, please visit www.augi.com/account. For all other magazine inquires please contact augiworld@augi.com
Published by:
AUGIWORLD is published by Autodesk User Group International, Inc. AUGI makes no warranty for the use of its products and assumes no responsibility for any errors which may appear in this publication nor does it make a commitment to update the information contained herein.
AUGIWORLD is Copyright ©2023 AUGI. No information in this magazine may be reproduced without expressed written permission from AUGI.
All registered trademarks and trademarks included in this magazine are held by their respective companies. Every attempt was made to include all trademarks and registered trademarks where indicated by their companies.
AUGIWORLD (San Francisco, Calif.)
ISSN 2163-7547



3ds Max: Industry Insights
Figure 1
3D continues to make enormous strides, becoming integral to many industries. E-commerce, for example, continues to implement 3ds Max work and web technology to benefit their customers and partners. The e-commerce market is massive, and 3D is helping in many areas:

• Customers get a better online shopping experience with the ability to view a digital product from any angle in any setting.

• 3D eliminates the cost of renting studios or purchasing lighting and camera equipment for product shots.

• 3D content can be reskinned and repurposed for multiple uses.
• High-resolution 3D content is helpful for marketing and media.
• Automated platforms help customers and
creators submit 3D content quickly, affordably, and potentially without ever contacting anyone to get started.
• 3D content is more sustainable, eliminating waste and promoting reuse.
Figure 4
The list and demand for 3D content continue to grow. Companies are integrated content for every product related to interior design, fashion, beauty, apparel, automotive, grocery items, and more. They are providing their partners and customers tools to load and view products in efficient and immersive ways. For example, automotive and shoe companies are already known for the ability for customers to view customized options before purchase. Furniture companies are working to provide customers the ability to position furniture in their homes by augmenting reality with customized style options.
Small businesses and entrepreneurs are also increasing their adoption of 3d content in exciting ways. An entrepreneur in Texas created their fashion products with personalized labels and bottles while starting production, marketing, and orders. Another in Florida created a rubber duck (and cat) that released bath soaps incrementally and wanted a model to verify it would pass choak tests. A generator company wanted their invention modeled for cleaner marketing and business materials. Someone in
Arizona used 3D to produce a customized cat toy that looked like fishing lures, and a fishing rod company used 3D to promote fishing rod accessories. It takes imagination and hard work, but 3D has become a tool for many people to reach and promote their dreams.
If you want to get started in the e-commerce world with 3ds Max, I recommend reviewing Jose M. Elizardo’s introduction located here: https:// area.autodesk.com/inspire/articles/e-commerceworkflows-with-3ds-max

Brian Chapman is a 3D Artist located in Las Vegas building 3D content for the AEC industry, games, film, entertainment, and software development. Brian can be reached at pictelforge@gmail.com

Bricsys® 24/7: Powerful, simple, and intuitive CDE for collaborations in AEC
Recently, Rahul Kejriwal, CEO at Bricsys®, highlighted Bricsys’ roots in Belgium and its mission to give users the best CAD and collaboration software.

“We all know the story of Bricsys® started right here, in Ghent, our home, exactly 20 years ago. Ghent is also home to one of Europe’s best universities and feels like a place where people are fueled with optimism to make things better. This optimism inspires Bricsys’ motto ‘Build Better’”
Rahul presented Bricsys’ vision to deliver the most accessible design, modeling, and collaboration software tools for AEC, engineering, and manufacturing, including Bricsys® 24/7, and spoke out against the inflexible and high-cost licensing models for CAD software, negatively impacting digital adoption in the Construction sectors particularly, and said, “Bricsys will never trap your data in walled gardens ... we will offer new and flexible business models to serve users who need the best, most accessible
1
design, modeling and collaboration software.”
Ladies and Gentlemen, Bricsys® 24/7.
WHAT IS BRICSYS® 24/7?
Bricsys® 24/7 is a cloud-based common data environment (CDE) for document management and workflow automation. A simple, powerful CDE platform for real-time construction project-data visibility. Bricsys® 24/7 offers role-based security and unlimited users to help ensure that the right document is in the right hands at the right time.
The updated Bricsys® 24/7 cloud CDE platform has made workflows intuitively easy for all stakeholders and product owners to automatically manage data and documentation for projects, with real-time visibility of mission-critical information.
WHY BRICSYS® 24/7?
Bricsys® 24/7 can be utilized in a variety of ways.
• Document Management
• As a simple document management and hosting platform for your construction projects.
• Project Management Information System
• As a project management information system, utilizing our automated workflows and custom forms to handle project management tasks.
• Common Data Environment
• As a common data environment for all contract documents, drawings, and project workflows enabling transparency for all stakeholders and bridging the design and construction phases.
WHO CAN USE BRICSYS® 24/7?
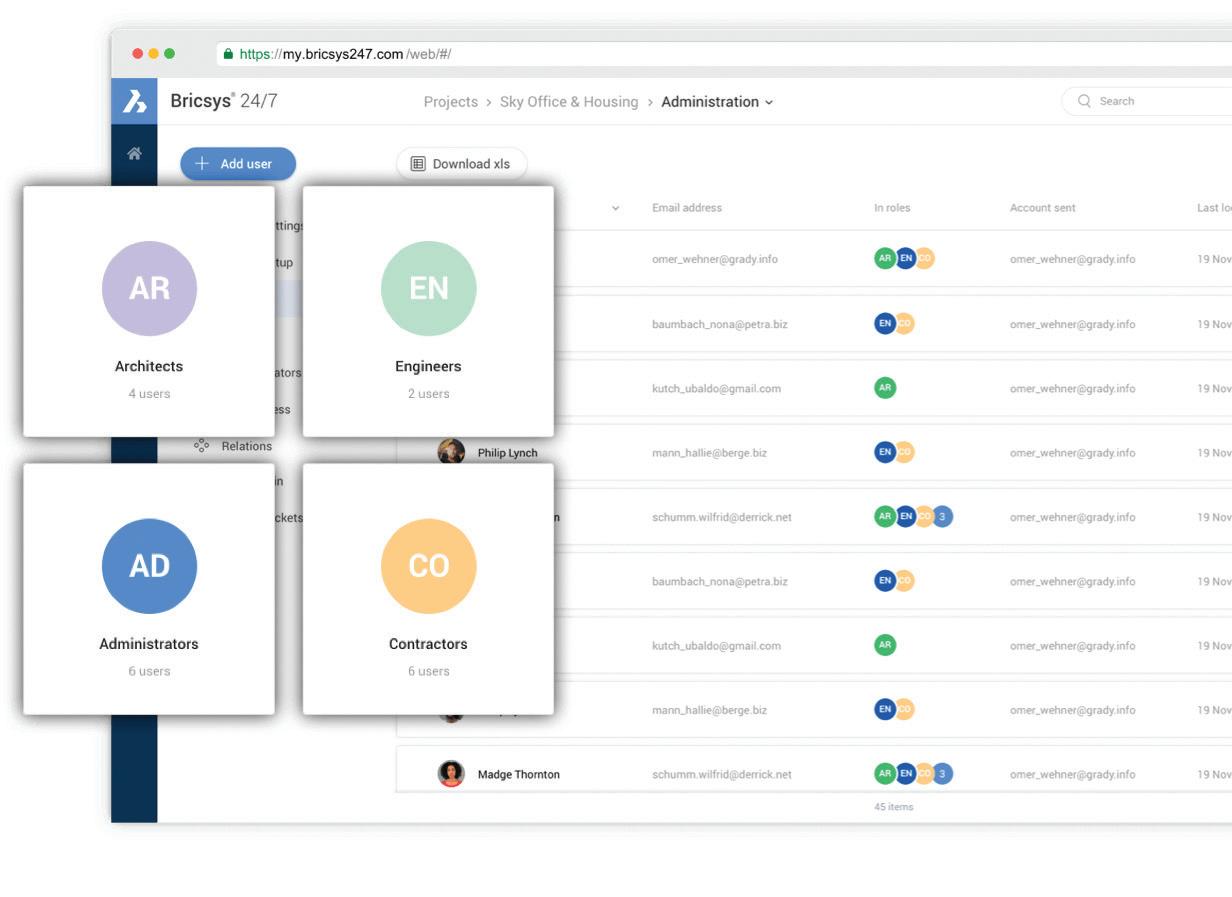
When working with different team members, you want to make sure that the right data is in the right hands. 24/7 makes this possible through rolebased access control.
User control permissions through an unlimited number of users and roles. Roles give a group of individuals specific access to folders and features based on their function in the project. Build roles effortlessly for each type of user via 24/7’s tablebased administration panel. Every project member can access the Bricsys® 24/7 file store, with their folder access rights based on their role in the project. Every file action is recorded and tracked securely, to ensure that the total history of a document is available to administrators and process auditors.
Bricsys
HOW TO USE BRICSYS® 24/7
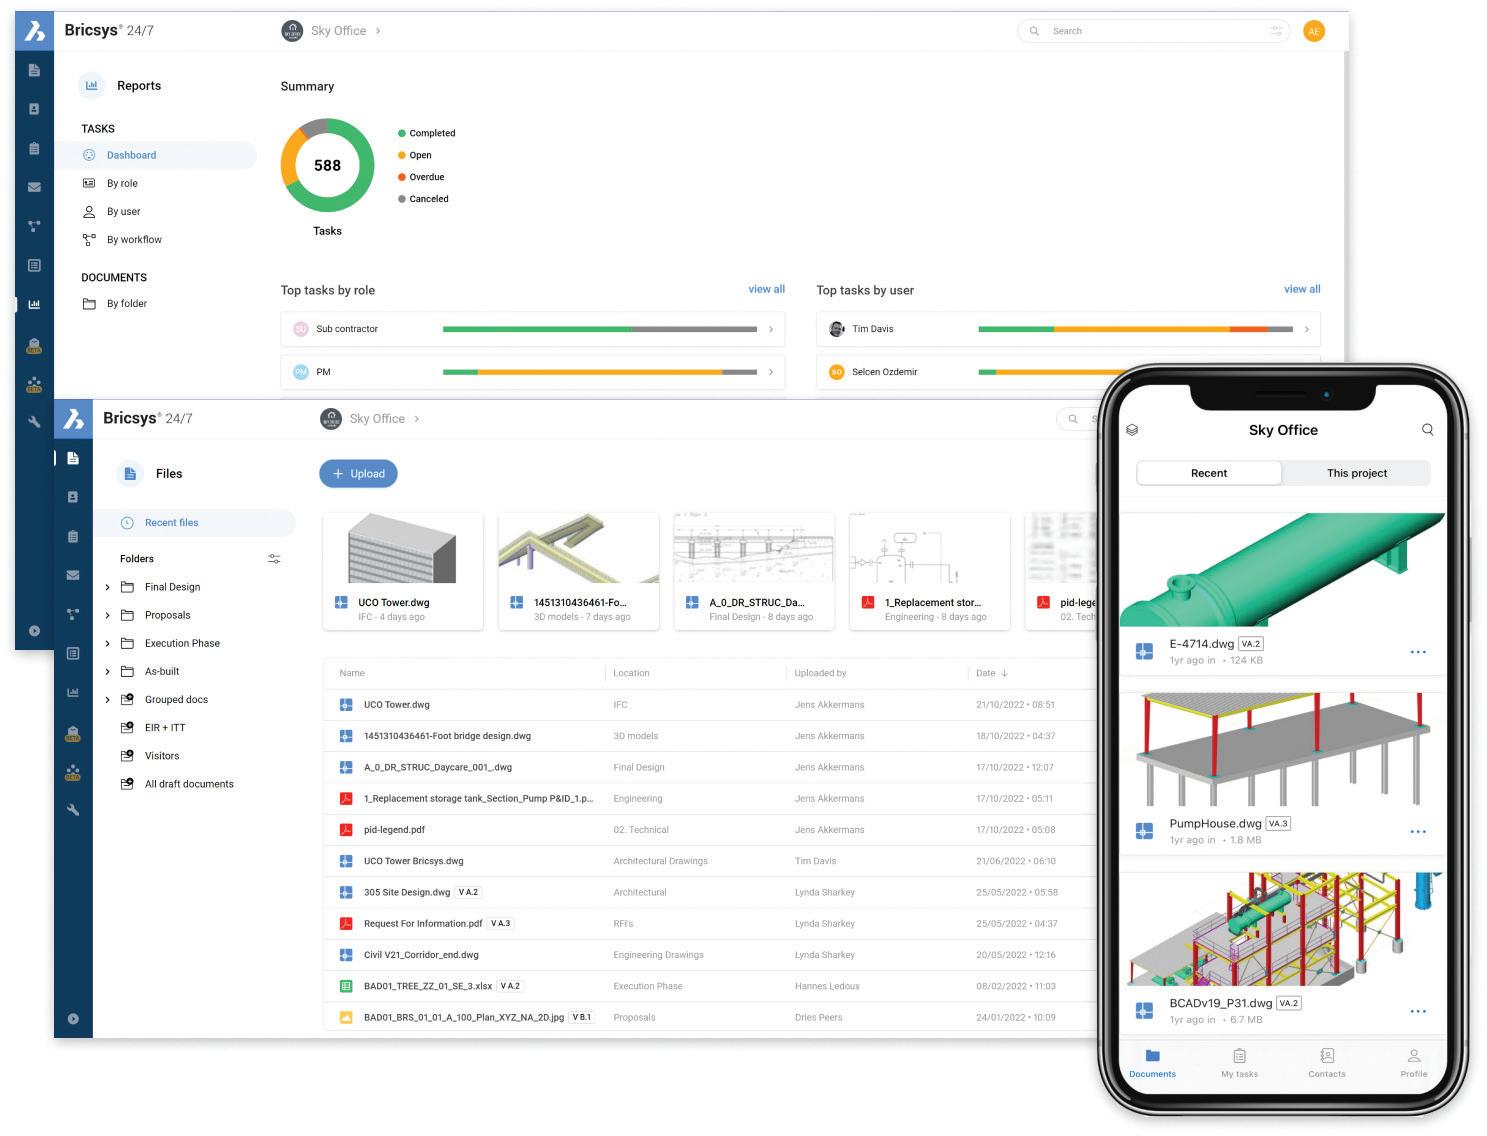
Bricsys® 24/7 can be used by anyone, with minimal training thanks to its highly visual controls. Set up workflows, manage files, and easily share documents with project collaborators.
A simple drag-and-drop option allows copying a folder or a folder structure straight into Bricsys® 24/7. This way you can easily set up a 24/7 project based on the folder structure already on your device or server. Need a project status update? The graphical workflow viewer gives everyone a proper overview of the current project files and project task status.
BRICSYS® 24/7 MOBILE APP.
Upload, view, markup, and comment on 2D drawings, supporting over 70 file formats. Upload and view any file when you are at the office, in the field, or on the road. Your up-to-date projects are right in your pocket with the Bricsys® 24/7 Mobile App.
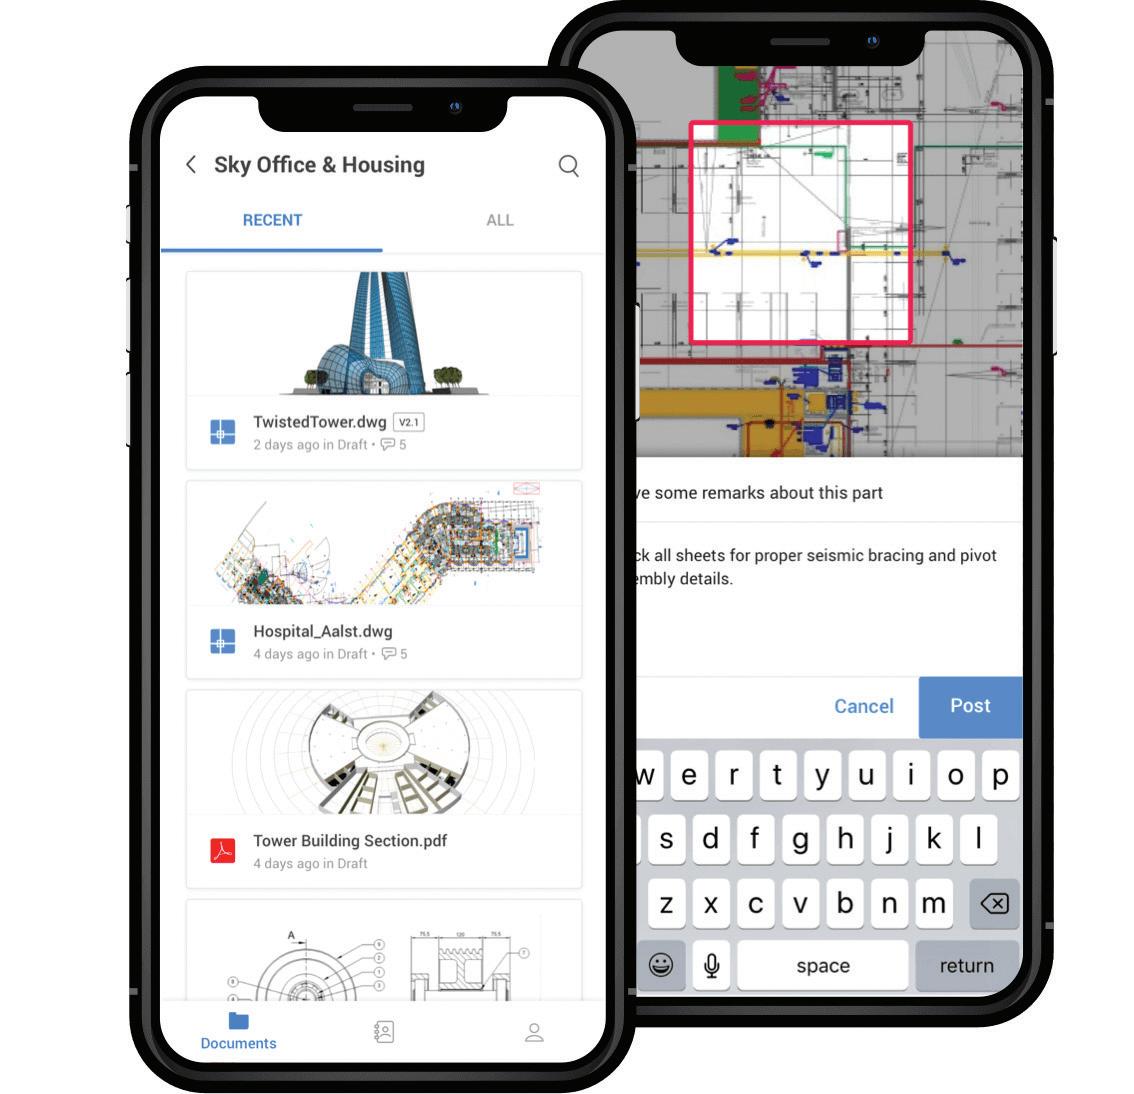
Figure 3
24/7 allows the ability to rename files on upload so they are consistent with project naming conventions, which aligns with ISO19650.
24/7 offers tremendous flexibility to capture, search and organize files by metadata. Thanks to Cooperlink CONNECT, Bricsys® 24/7 users can automatically upload, record, and archive documents in real-time from Microsoft SharePoint to Bricsys® 24/7, reducing the time expended manually saving files and re-encoding metadata. Adding pre-structured metadata to a file can be set as a requirement at upload, by attaching custom forms to project folders.
24/7 keeps track and simplifies file changes, versions, and logs all modifications in a detailed activity log. See who did what, when, on a per-file basis. Create, edit, and manage workflows to automate common document management and release tasks.
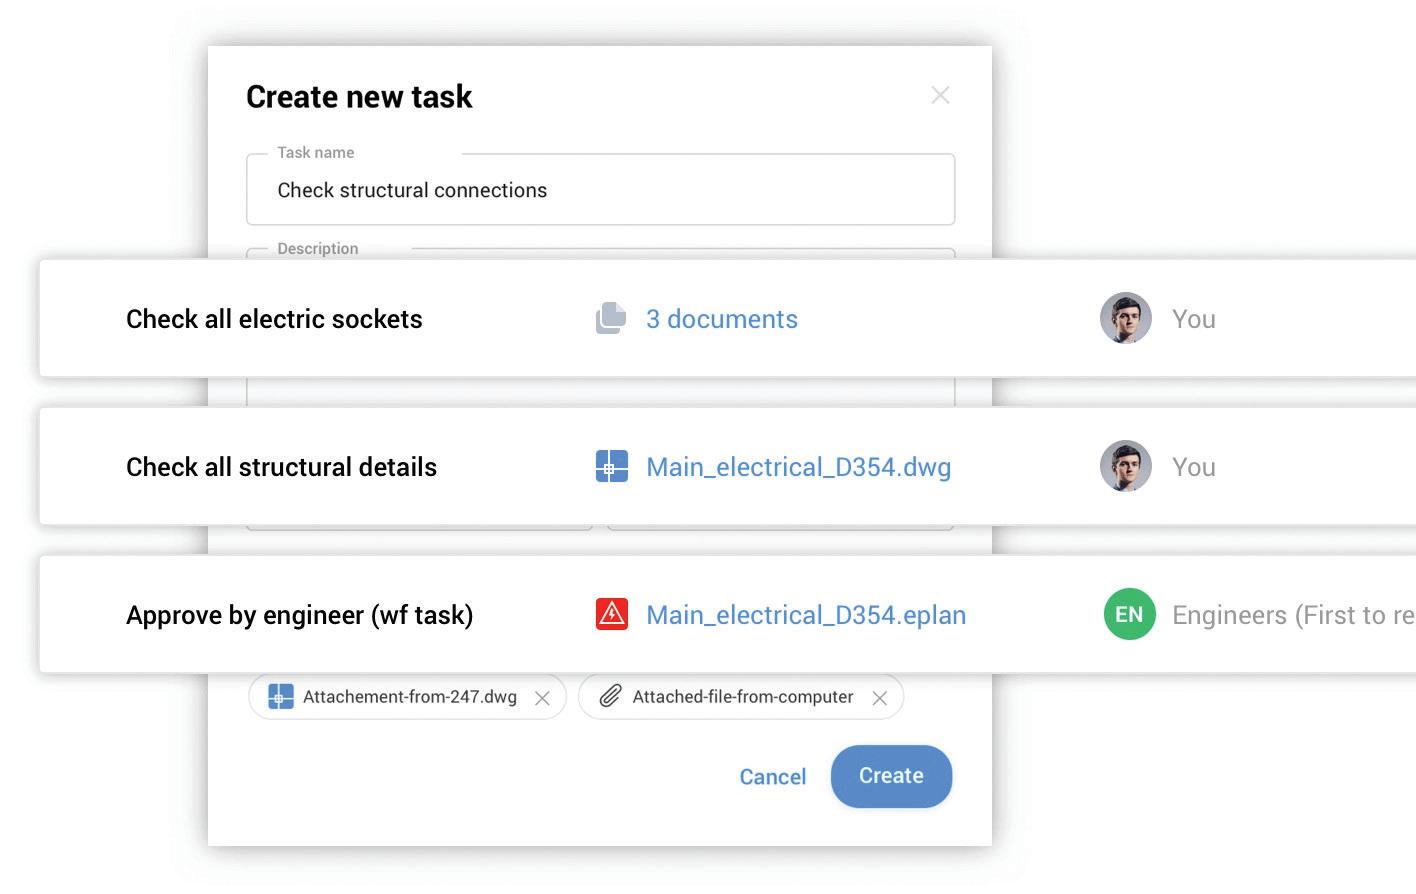
Globally manage documents, with access from anywhere. Share them with your teams internationally and view files on any device. Ideal for those working on the move or across time zones.
Figure 4
The Bricsys® 24/7 Transfer Tool helps you transfer complete folder structures between your local file system and the Bricsys 24/7 service. The split-screen user interface allows you to upload or download files via a simple drag-and-drop paradigm.
HOW IS BRICSYS® 24/7 TRENDING TECHNOLOGY?
Bricsys® 24/7 is used by many different companies and agencies from construction companies to law firms. This state-of-the-art technology yields huge dividends when owners and construction project managers can explore real-time project visibility with OxBlue professional construction camera services. Capture activities 24 hours every day by pairing OxBlue with our Bricsys® 24/7 to unlock additional capabilities, such as 2D and 3D viewing, document management, and markup with AI and automated workflows.
Speaking of workflows, workflow automation is simple in Bricsys® 24/7 with the graphical workflow editor. Adding documents to a workflow
folder automatically enters them into the workflow. Currently, is there anything trendier than compliance? There is no easier way to ensure project management compliance than by unlocking the power of Bricsys® 24/7.
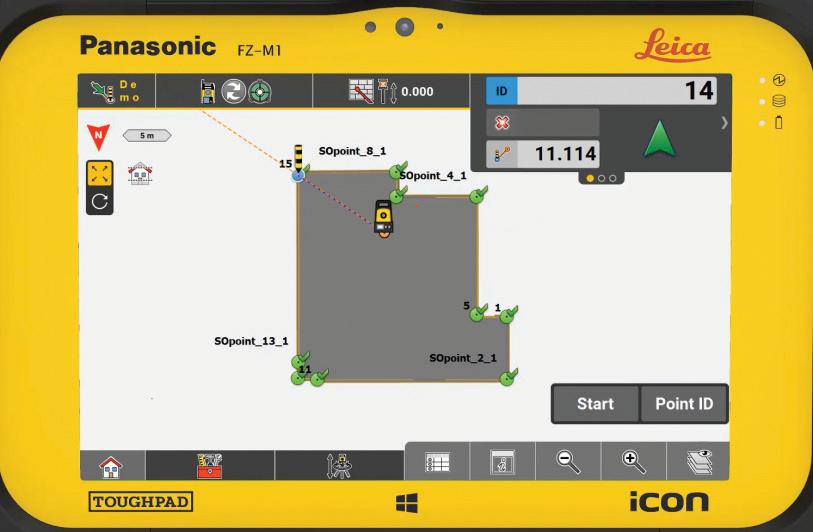
And it is now easier than ever to work better, faster, and smarter with the power of Bricsys® 24/7 and Leica iCON Field.
Want to Know more?

Bricsys® (www.bricsys.com), part of Hexagon, is the global technology company that creates the BricsCAD® family of computer-aided design (CAD) products and the Bricsys® 24/7 CDE collaboration platform. We are committed to the success of our customers by offering cost-effective, missioncritical CAD software with industry-leading product support. Established in Belgium in 2002, Bricsys® NV has approximately 300 employees around the world, partners in more than 80 countries, and 1,200 registered application developers.
Figure 5
Getting data into 24/7 for use in the field is as simple as drag and drop, and the automatic notification makes it easy to make sure that the correct people are notified. Create a report to send back to the office from the home screen and/or create various deliverables, such as a stake-out PDF report to confirm how well the points on site were laid out and preview the report. Discover how to connect the office and field for construction layout with Bricsys® 24/7 cloud-collaboration solution and Leica iCON field software and hardware. Increase your efficiency with the simplest, most accurate construction-layout solutions available.
BRICSYS IS TRENDING UPWARD
Bricsys® has been in the software circuit for over two decades now, and Bricsys® 24/7 has made significant progress toward replacing your current CDE. Some refer to it as a real-life David and Goliath battle for CAD users who need affordability and performance. Instead of hijacking users’ data or slinging stones at the competition, Bricsys® has been building better.
A prime example is Bricsys® 24/7 which is a project collaboration platform with proven success in the complex worlds of architecture, engineering, and construction. Powerful, simple, and intuitive CDE for collaborations in AEC.
Mr. Craig Swearingen is a Global Implementation Specialist and Consultant with Bricsys BricsCAD® and has over 20+ years in the CAD and Engineering Industry. In his current role, Craig provides migration and implementation guidance, strategies, and technical assistance to global companies who desire an alternative CAD software solution promoting the reduction of design software costs while increasing productivity. As a former technician and Cad Manager, Mr. Swearingen understands the importance to have the right tools to do the job. He previously spent 19 years in the civil engineering world as a technician, Civil 3D & CAD power user, and became a support-intensive CAD/ IT manager in high-volume production environments.
Craig is a longtime AUGI member (2009), Certified Autodesk AutoCad Professional, and enjoys networking with other CAD users and providing CAD and design solutions on LinkedIn.

Projecting Objects and Adding Crossings to Profile Views in Civil 3D

INTRODUCTION:
The “Project Objects To Profile View” and “Add Crossings To Profile View” commands in Civil 3D can be used to display and/or portray data/ information in many unique ways. The commands also have the flexibility to be used on many types of data and features.
The following feature types may be projected using “Project Objects To Profile View”
• Autodesk Civil 3D objects – points, feature lines, and survey figures
• AutoCAD objects – points, blocks, MView blocks, 3D solids, and 3D polylines
The following feature types may be added as crossings using “Add Crossings to Profile View”
• Alignments, Profiles, Feature lines, Survey figures, and 3D polylines
In this article, I will share a few examples of styles and their use cases that I have leveraged over the years.
PROFILE VIEWS:
Both of these commands will require a Profile View to host the Projections/ Crossings, and in turn, the Profile View will require a parent Alignment.

Profile View styles are found in the settings menu under Profile View.
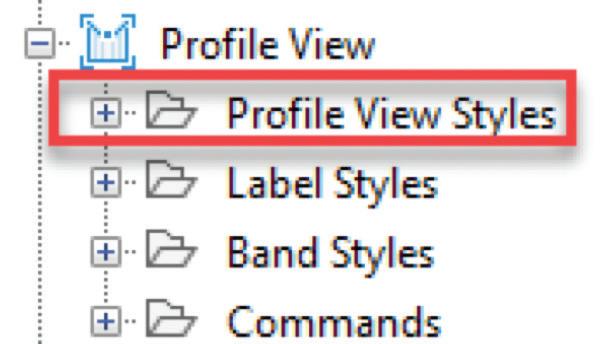
A couple Profile View styles that I frequently use are shown below.
A. This style only has the bottom axis line display on and it is layered the same as the parent Alignment. This is generally used to display materials along an Alignment, for example, a cable or a pipe.
B. This style only has the bottom axis line display on and it is layered with a no plot layer. This is a general use style that can be used to display many different types of data along the Alignment, for example, property ownership, utility crossings, or other topographic features.
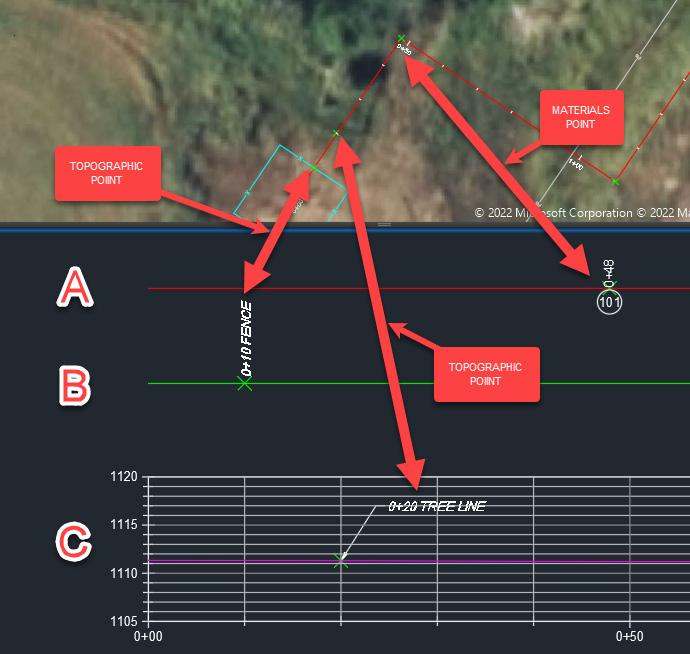
C. This style is your typical graph displaying stationing across the bottom axis and elevation on the left and right axis. This style is used to display both proposed and existing ground Profiles, but can host other data along the Alignment as well.
As you can see in styles A and B, a Profile View doesn’t need to be a graph representing data in relation to elevation.
Civil 3D
Other unique examples of this might be a Profile View intended to display depth of an object with the left and right axis displaying values 0’ (ground) to -10’ (10’ below ground).
A Profile View intended to display the circumference of an object with the left and right axis displaying values 0 degrees to 360 degrees.

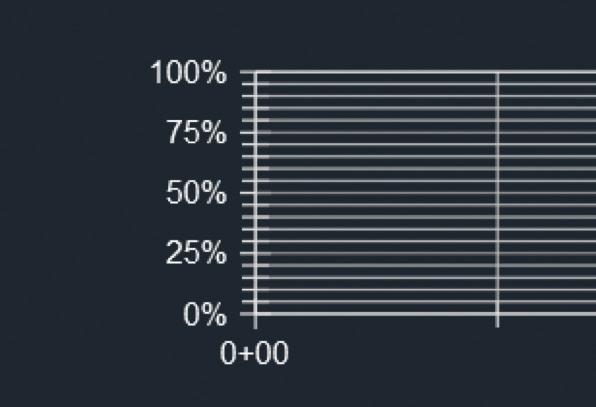
Or even a Profile View intended to display integrity management data with the left and right axis displaying values 0% to 100%. I have even used Profile Views to display things like voltage readings.
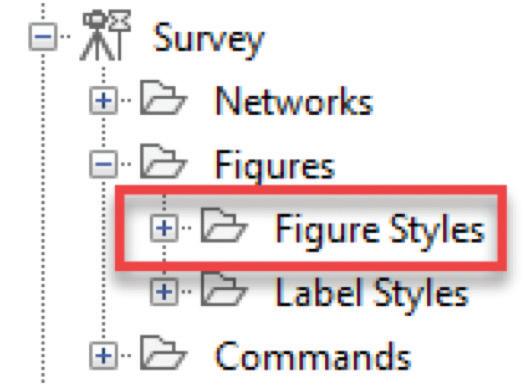
Survey Figure styles are found under Survey and Figure Styles.
PROJECT OBJECTS TO PROFILE VIEW:
Once the Profile View(s) are set, they can then host many different features and data types through the Project Objects To Profile View command.
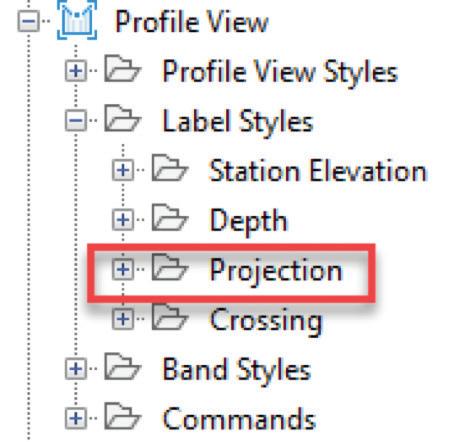
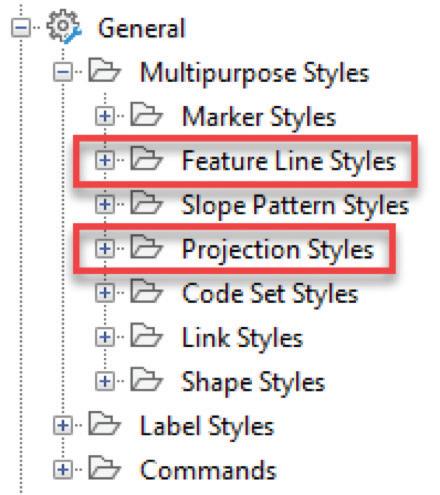
Projection styles can be found in a few locations within the settings menu.
Feature Lines, Blocks, 3D Solids, and 3D Polyline styes are found under General and Multipurpose Styles.
Points styles are found under Profile view and Label Styles.

First lets touch on linier objects like Feature Lines, 3D Polylines, and Survey Figures. These object types all will be shown as lines in your profile view and can get a bit convoluted if they are not parallel to the host Alignment. That said, when parallel, they can be used to display relative elevations of objects like roads, rail roads, ditch centerlines, and utilities as they relate to the parent Alignment.
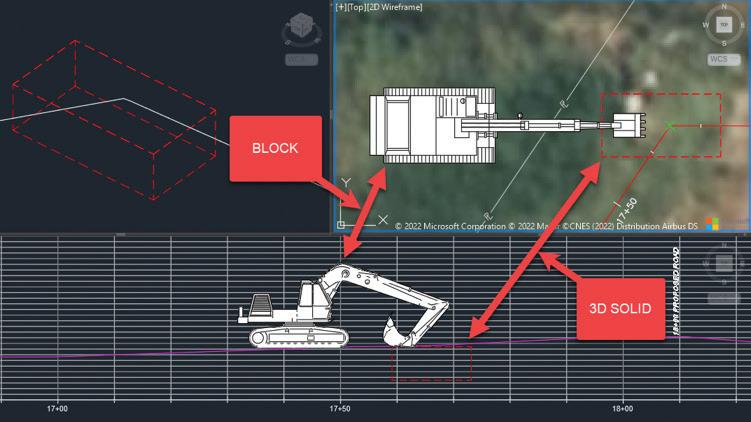
Next 3D solids, these can really help portray an environment if structures like buildings are added as solids, or perhaps excavations pits are modeled as solids to portray construction methods along the parent Alignment.
Blocks and Multiview blocks can also be leveraged to add additional detail and accuracy to a drawing. This could be anything from an existing tree, proposed signage, to an excavator as shown in figure 01 along side our 3D Solid excavation pit.
Lastly, and perhaps the most customizable and flexible are Points. Points can even be projected as Blocks to make things more interesting yet.
Below is an example of a Point projected with a block in its label style to display a material bubble.
ADD CROSSINGS TO PROFILE VIEW:
These can also help accurately call out information along an Alignment like utility crossings, property crossings, property ownership, road crossings, etc.

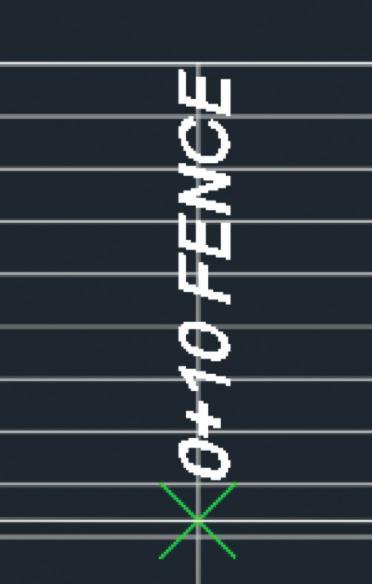
In addition to the Project Objects To Profile View command, there is the Add Crossings To Profile View command. I’ve found this option to be less customizable than projecting objects, but it does have unique capabilities in the types of information it can display, and it can be the preferred method for calling out linear objects that cross the parent Alignment in a perpendicular manner.
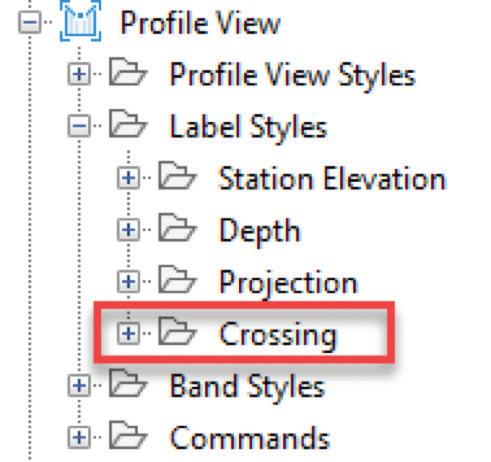
Crossings styles are found in the setting menu under Profile view and Label Styles.

Civil 3D
Types of information that can be called and displayed using this method include:
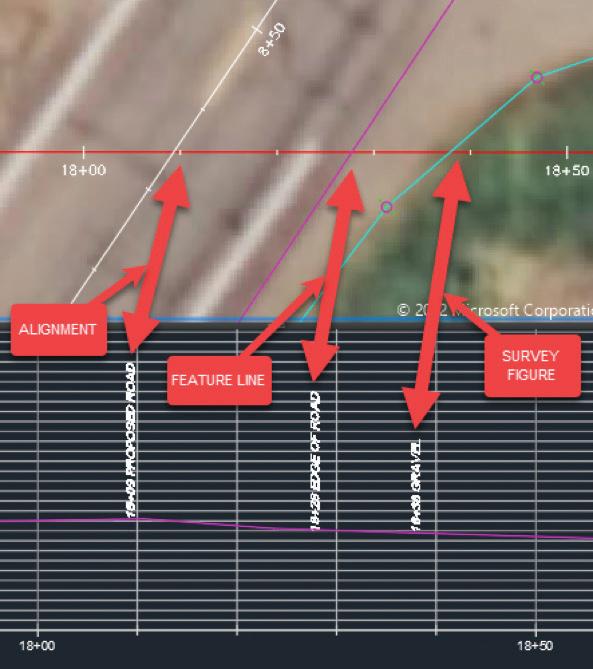
Source Layer can be great for labeling 3D Polylines and Feature Lines representing items like edge of road and existing utilities. Additonally, Source Object Name can be great for labeling other Alignments, Profiles, and Survey Figures.
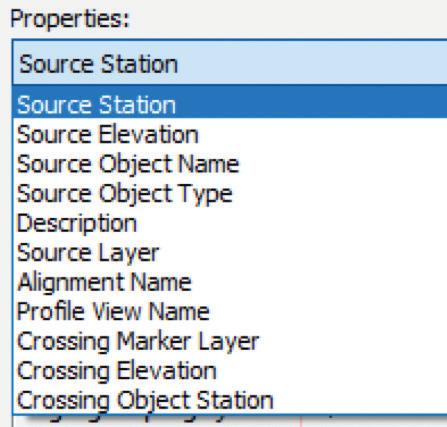
CONCLUSION:
In conclusion, there are seemingly endless possibilities when it comes to pairing Profile View styles with projected objects and crossings. With many types of AutoCAD and Civil 3D features supported, you can incorporate a workflow that enhances your current process and uses your existing data, instead of completely reinventing the wheel. Additionally, you can develop unique and improved ways for displaying your data, leveraging these tools and a little outside the box thinking. These tools can also become great efficiency and accuracy boosters for you and your practice.
Jacob Matuseski is the Oil and Gas Pipelines and Stations CAD Lead within HDR’s Resources Business Group, a global leader in Engineering, Architecture, Environmental and Construction services. Jacob has been in the AEC industry for 12 years with 11 years’ experience in the oil and gas industry, during this time he has managed multidisciplinary teams of technicians and designers from project inception to as built. In Jacobs current role, he is responsible for the development of CAD standards, understanding and utilizing client CAD standards, monitoring and forecasting design personnel workloads, technology advancement and implementation, and quality assurance. Jacob can be reached for comments or questions at Jacob. Matuseski@hdrinc.com or on LinkedIn.

Basic members have access to:
• Forums
• HotNews (last 12 months)
• AUGIWorld (last 12 months) DUES:
AUGI
AUGI
Student members have access to:
• Forums
• HotNews (last 24 months)
• AUGIWorld (last 24 months)
•
Professional members have access to:

• Forums
• HotNews (full access)
• AUGIWorld (full access and in print)
• AUGI Library
•
Onboarding
Well, you must have hired someone. Now it is time to welcome them to the firm. Most of what I would tell you about onboarding, you probably already know. People have been onboarding new employees for a long time and most companies or managers have a method or checklist or whatever. You can find so many ideas on the web if you look. Standard stuff such as: locations of bathrooms, break room, exit paths, etc. Running them past HR to make sure all paperwork is complete. Introduce them to the staff, explain the company culture, core values, expectations… Review job duties. You get it. Lots to do. And is you short change the effort, the new hire may not flourish as hoped.
BUT… The hard part is not knowing what to do… it is having time to actually do it. Since you just hired someone on, you likely have been swapped with more things to do than can get done. The last thing you want to do is add another chore of getting someone up to speed. And, you don’t have the time to do it. You have a backlog of projects, problems to fix, fires to put out. That is why you hired someone to help. Now it means more work for you. It is short term, but it is more work.
What happens is, and it happens to me, you don’t do it. You start off with good intentions, but fail to follow through on all of it. The first week might go as planned, but then things derail, you get pulled in other directions and the person is on their own to figure it all out. You are just too busy to make it all come about.
I am not going to give you the list of tasks for onboarding. What I am going to give you a list of concepts that your new hire needs to keep in mind. These can help them and you at the same time. They can improve your support efforts, get the new person connected, clarify areas that confuse them and make them part of the solutions that
you are eager to have them put in place. Here is my list of how you want to frame their interactions as they are onboarded. You have a fresh set of eyes seeing everything for the first time. Don’t let that perspective be wasted.
PLEASE ASK QUESTIONS
You know I always encourage questions. Make sure the new hire knows that you want them to ask as many questions as they want. You cannot remember to tell them everything or even know what might be on their mind, so they should speak up. Tell them to ask questions about anything and everything. Ask them if they have any questions at the end of all conversations. And get them to ask the best question of all… ‘Why?’ They need to know why things are done the way they are, or why someone is doing this or that. We tend to pass on the what and how, but include the why (if they forget to ask).
TELL US WHEN SOMETHING LOOKS FUNNY
They should be made comfortable telling you when something doesn’t look right, sound funny, or does not make sense. A lot of times, things are done in a way that may not make sense unless the full story is known. And sometimes we think things make sense when they actually do not. When a new hire flags something that does not sound right, listen to why they think it is unique before you tell them why it is the way it is. And be willing to have another look if you can’t really stand behind your reasons for the current situation.
DON’T THINK THAT THE WAY THINGS ARE IS BECAUSE WE WANT IT THAT WAY
I actually say that to new hires. You don’t want them to think something is weird and keep it to
themselves. Just because something is done one way, does not make it right or best. It’s just the way it’s done now. Then ask them if they have an alternate way. Notice I did not say “better way”. The way you do things may be best for your firm, and not others. Don’t qualify the question expecting them to have a proven “better way”. Just get their ideas out of their head and think it through. The areas to discuss may include team structure (who does what), configurations, tools used, timing of processes, steps in a process, or things that are not done (“we don’t do that here”). If they have an improvement, let them offer it.
ENCOURAGE THEM TO SHARE THEIR IDEAS
You hired them because they were solid candidates with a good head on their shoulders, so get them to tell you what is in that head. Everyone comes with prior experiences that worked for them or their firm. You need to find out what they did. It might improve your processes. Encourage them to share before they are asked. Most new hires are eager to share a good practice or two.
HISTORY LESSONS ARE NOT REASONS
When new hires ask questions about something, I give them a history lesson. I fill them in on why it is like this. What happened in the past that got us here and maybe who was involved in the decisions made. All of this is just a framework for discussion. I never say, “Because we have always done it that way,” even if it is true – lol. The history lessons are not reasons to continue if the decisions of the past not longer apply. Even good decisions change over time. The current situation may have been a short-term fix that outlived its usefulness. It may be a patchwork of several employees attempts to make it work. It may a migration that was not fully completed as other fires came up. All of these are history lessons and not reasons to stay the course.
TELL US WHAT YOU DID AT OTHER FIRMS
I always ask, “How was it done at your last job?” Wording it like this allows them to tell you without it becoming a judgement of good or bad. They may add that to the reply, which helps you gain their perspective. There is a wealth of untapped information in the experiences of your new
hire and you want to mine the depths when you can. The new hire has seen the decision, implementation and outcome of the efforts of a tech team and can bring their successes and lessons learned to your initiatives.
AND BE THANKFUL
When you bring on a new hire, make sure you express thanks to everyone as far up the ladder as you can. Your boss is first, then others. If you see the CEO in the hallway, tell them thanks. It is important to let people know that you appreciate them letting you hire someone into the firm.
REPORT BACK ON PROGRESS
Report back to your boss on the progress that has been made since the new hire was in place. Give it a month or two and mention to them the projects that have been completed or started and how the new staffer has helped. Report on the first success the new hire made within weeks. If they finished up a long-standing task that needed completion, tell the boss they got it done.
When it is all said and done, new hires strengthen your firm and bring new vitality to your company. The process is long and challenging, but the reward will be worth it.
Mark Kiker has more than 30 years of hands-on experience with technology. He is fully versed in every area of management from deployment planning, installation, and configuration to training and strategic planning.
A former AUGI Board member, President and Executive Director, he is an internationally known speaker and writer, having written for AUGI World since 2015. Mark is currently serving as Chief Technology Officer for SIATech, a nonprofit public charter high school focused on dropout recovery. He maintains two web sites, www. caddmanager.com and www.bimmanager.com.

Making Sense Of Our Data With Microsoft’s Power BI
Where’d all of this Data come from and what do we do with it?

INTEGRATIONS WITH MICROSOFT’S POWER BI
Data extraction and reporting tools are nothing new to folks in the BIM | CIM world; however, products and integrations that are able to ingest our Data continue to morph, providing much more visually appealing options to us. Microsoft’s Power BI is a perfect example as one of the (relatively) more recent options that the BIM | CIM communities are flocking to. Additionally, many vendors (both
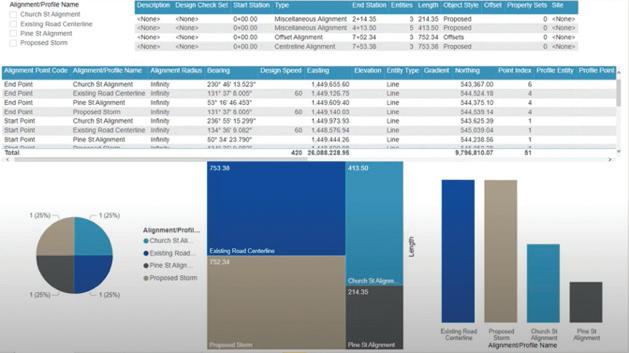
small and large) supporting the AEC Industry, are developing connected solutions directly integrated with design authoring tools that allow for seamless data migrations with minimal to no data loss into Microsoft’s Power BI.
On the surface, some of the immediate benefits to leveraging Microsoft’s Power BI include:
1. Frees up valuable time for production staff. Whether you’re a technician, designer, modeler, engineer, architect, or other, introducing ways to extract data seamlessly from our BIM | CIM designs allows production staff to put more focus and effort on actual design and modeling processes.
2. Share visual reports and dashboards securely. Engineers/Architects and all project stakeholders are able to review, interrogate, and analyze design Data without having to install a design authoring tool that they are likely not as familiar with.
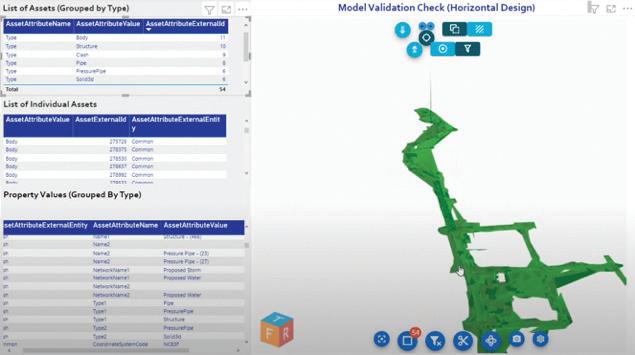
3. Collaboration with comment and issue tracking. Project design teams and additional stakeholders are able to provide feedback based on the reported Data being surfaced in dashboards, resulting in increased efficiencies and reaction times to achieve conflict resolution.
4. View up-to-date Data with ease. Whether dynamic connections are established, or a re-extraction of Data is required to replace existing reports that the Power BI dashboards are reading, viewing up-to-date Data within this environment is a painless process.
Beyond these immediate benefits, Microsoft’s Power BI allows for multiple interactive and customizable viewing capabilities and connections to be hosted in one, or multiple, dashboard(s). Programmable and Automated solutions are enabling BIM | CIM designs to be viewed, interrogated, and manipulated in a userfriendly collaborative environment, where we can connect additional sources of Data to continue building into our model and Data federation, putting us on a trajectory where many are starting to view Microsoft’s Power BI as a potential Digital Twin solution.
DATA – WHAT IS IT GOOD FOR? ABSOLUTELY EVERYTHING
Asset Data
Thinking about the dashboarding concept from a high-level, what other types of Data can we report related to our BIM | CIM designs? Are we only
limited to the Data directly associated with our modeled geometry within our BIM | CIM designs?
Not exactly. Data itself has also taken on a new life, as there are now many different interpretations as to what Data means depending on what it will be purposed for. When it comes to BIM | CIM designs, we have the In-Production aspect of Data where we can leverage it for labeling, tabling, and reporting purposes. Then comes the Review aspect, where we can leverage tools to extract Data from our BIM | CIM designs into more of a report format. Once Data has been extracted, we can look at additional ways we can leverage this data and integrate with solutions like Microsoft’s Power BI.
From there, we have many common applications and use cases where Data associated with our BIM | CIM designs are already being leveraged, which could include things like Quantification, Cost Estimation, Design Review, Model Validation, etc. Most of these applications of Data are fairly straight forward, as our design authoring tools are equipped to provide these capabilities with relative ease. Outside of the design environment, Data associated with our BIM | CIM designs are further being leveraged for Construction, Asset Management and
Facility Management purposes, with majority of instances easily integrated with Microsoft’s Power BI.
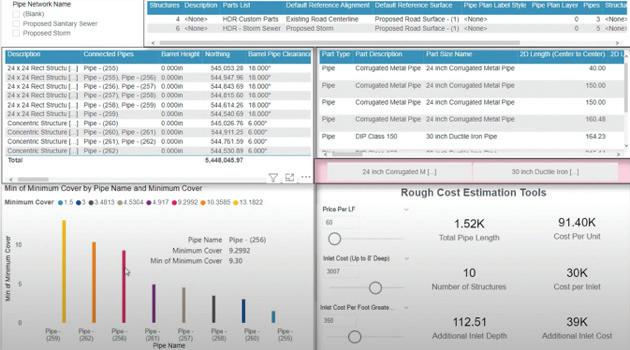
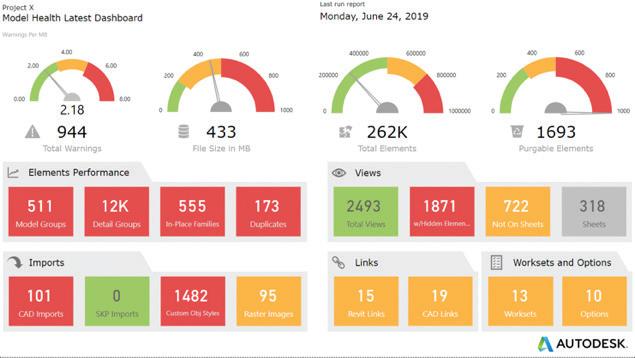
Model Performance Data
Another aspect of Data that’s been gaining a lot of attention lately is associated with model performance. Model performance Data has the potential to include anything from analyzing project file sizes, to counting the number of modeled components in a particular file, to evaluating how many purgeable elements exist in your files, to missing reference links, to exploded geometry…and well beyond. Although this type of analysis of curated Data associated with our models and files may be a bit re-active in nature, it can help us truly understand our current state and provide insight as to how production staff are developing models.
Model performance is a critical component that can have many implications on a project’s delivery, as it can strongly affect production efforts, budgeting, scheduling, and more. Leveraging model performance Data allows us to properly mitigate design file complications to maintain high levels of modeling efficiency for production staff, with the added benefits of
avoiding potential corruption of files and Data, and reduction in rework, later on down the road. Understanding that this concept isn’t as straight forward and requires a bit of innovative thinking and programming to acquire this type of Data, we could be seeing a monumental shift in how
we are approaching designs and managing our models in general.
Individual Performance Data
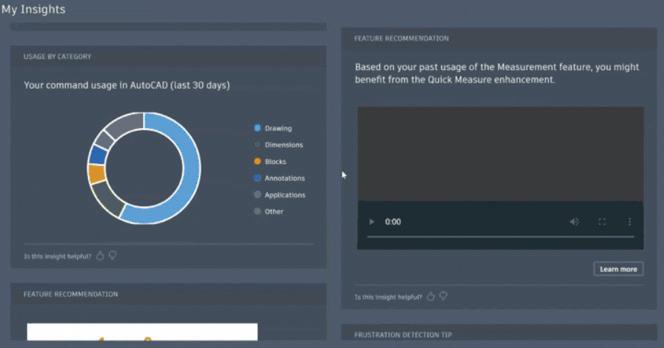
A newer aspect of Data that has been gaining a
lot of attention lately is specific to how production staff members perform on a project design. This type of Data collection and analysis is constantly monitoring individuals’ design and modeling habits and will even go as far as to provide upskilling or workflow recommendations to improve design and modeling habits. In order to be confident in the recommendations being provided, the Artificial Intelligence side of this will need to compare an individual’s modeling habits and commands being performed against a rather large sample set.
Taking the Artificial Intelligence side of this Data collection and mining a bit further, we move into the exploration of leveraging this Data for Predictive Design, Analysis and Performance. With confidence levels increasing in Data collected as we increase the size of our Data Lakes, we can deploy mechanisms that will provide recommendations as production staff are invoking specific commands or workflows, which essentially moves us from a reactive approach to a proactive approach. This predictive and proactive approach will provide that just-in-time training to design and production staff, which will most certainly affect model performance as well.
IN SUMMARY
Regardless of the Data being mined, Microsoft’s Power BI has certainly found a home across AEC. In turn, new careers, trades, and specialties are being introduced as well with a focus of understanding, processing, surfacing and managing Data being mined.
From the outside looking in, it appears as though we’re on a trajectory where Data and Artificial Intelligence has the potential to replace the need for us to think throughout the progression of our BIM | CIM designs, maybe to the point where Automation will then take over and generate our designs for us. Yes, this may be a bit extreme to think, but is it?
Does this mean that production staff will need to consider a new career path to become a Data Analyst or Scientist? Not at all. Although there’s no harm in becoming more familiar with and educating ourselves with Microsoft’s Power BI and other dashboarding tools to understand how Data is being ingested and analyzed, there will continue to be a reliance for new Data to
be collected to continue improving production and everyday workflows. And with all major design and collaboration platforms continuing to introduce new tools, workflows, integrations and overall product enhancements, the Data being mined will continue to evolve as new metrics are introduced.
Stephen Walz is, not only the BIM | CIM Content Manager for AUGIWorld Magazine, but also the Digital Design Lead within HDR’s Applied Technology Office, a global leader in Engineering, Architecture, Environmental and Construction services.

Stephen has been in the AEC Industry since 2003, and with HDR since 2004 supporting multiple offices and regions and now support all Business Groups and Market Sectors across HDR at a corporate level. In Stephen’s current role, his primary focus is to work with HDR’s Business, Technical and IT Leadership, as well as our technology vendors, to identify, evaluate and implement new platforms/tools/ technologies supporting BIM | CIM processes and workflows, drive consistency with how HDR is leveraging various tools and platforms, and identifying ways to build skillsets and overall awareness across HDR to better serve their clients.
Stephen can be reached for comments or questions at Stephen.Walz@hdrinc. com or subscribe to his YouTube Channel for BIM | CIM, Data Integration, and Visualization workflow video demonstrations.
SketchUp Ways to Use SketchUp in Your Business
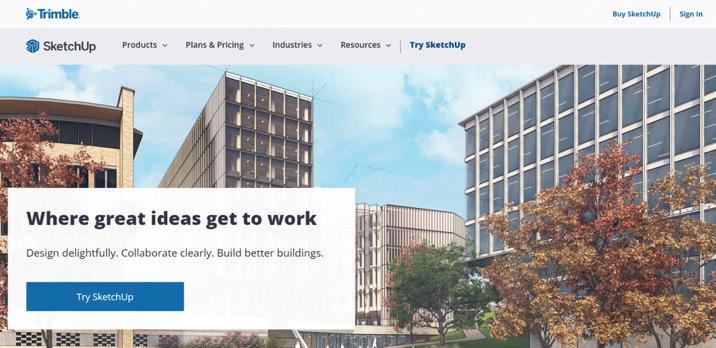
Figure 1
Sketchup introduces the world to the 3-Dimensional generation of AI as captured in the screenshot displayed in Figure 1 and located here:
Sketchup.com
SketchUp is an online 3D design program that allows you to create virtual buildings and models. It’s beneficial for architects, designers, builders, and
by: Tony Ojungoanyone who wants to visualize concepts before they are brought to life in the real world.
Using SketchUp in your business can have so many benefits! Whether you are a contractor planning new construction or a home remodeler dreaming of different ways to update your spaces, there’s a great chance that using SketchUp will help you achieve your goals. Here are some great ways you can use SketchUp in your business.

WHAT IS SKETCHUP?
SketchUp is a free and user-friendly 3D modeling software available on the web that can benefit anyone who wants to learn how to create 3D models. It can be likened to Google Earth in its scope as it enables users to explore and visualize anything from buildings and townships, gardens and agricultural fields, parks, beaches and resorts, lodges, hotels, etc.
WHY LEARN SKETCHUP?
It is a very versatile software for anyone who wants to learn how to model. It can benefit Architects, Interior Designers, Landscape Architects, Civil Engineers, Surveyors, Teachers, or anyone who wants to learn how to trace, design, or create 3D models.
Along with various features available in the software, SketchUp also has an online community where people across the globe share their SketchUp models. Users can also export their models to various file formats like SketchUp8, SKP (SketchUp 6 format), 3DS, .dgn, .png, .jpg, .pdf, and .xml. SketchUp Community
Sketchup beginner tutorial - Youtube
BENEFITS OF INCORPORATING SKETCH UP IN YOUR BUSINESS
Create 3D Models for Marketing
A big reason many architects and designers choose to use SketchUp is to create 3D models for marketing purposes. A 3D model is a virtual representation of your building or interior space that can create marketing materials like product galleries, websites, or videos.
A 3D model can also be used to create 3D printed models that can be given away as giveaways or displayed in stores or offices. 3D models can also be used for social media marketing to share a project for clients, customers, or potential clients to see and imagine what your space or business looks like.
Create a 3D model - Youtube
BUILD DASHBOARDS WITH SKETCHUP
SketchUp can be a helpful tool for visualizing
business data, like creating dashboards containing graphs and data visuals to help you understand your business’s performance.
You can create a dashboard that shows how many orders your company has received, how many items are in the queue, how many employees you have, how much inventory you have left, and how much money you have made each day.
In addition, you can create a specific dashboard for your manager and another dashboard for your team to see how they are performing. As a result, SketchUp can help you understand your business and make better decisions.
How to build a Dashboard - Youtube
COLLABORATE WITH TEAM MEMBERS
Many designers and architects use SketchUp to collaborate with others. For example, if you are a contractor or a builder, you can use 3D models to communicate with clients and team members about specific aspects of their projects or spaces.
You can also use SketchUp to share potential construction or design project funding with your bank. You can use SketchUp to create blueprints and drawings that show your funding details, like the cost of materials and labor.
The more detail you put into the model, the easier it will be for the bank to understand and approve your funding application.
Collaborating with the team - Youtube
TRAIN STAFF OR VOLUNTEERS
Another great reason to create 3D models with SketchUp is to develop training materials for your team members or volunteers. For example, if you are a designer and want to train your team members on how to use the software.
SketchUp is helpful if you want to train your employees on new policies, procedures, or business methods.
Sketchup tutorial for beginners-Youtube
SketchUp
HOST EVENTS AND WORKSHOPS
If your business involves hosting events or offering workshops, you can use SketchUp to create a virtual model of your space. For example, create a spatial model with a blue or green screen to portray your surroundings or areas you want your guests to focus on.
You can also create a model of your guests or participants to include their faces and other details to help communicate your message.
Creating a model - Youtube
BORROW TOOLS AND RESOURCES FROM OTHER USERS

Another great way to use SketchUp in your business is to find other SketchUp users in your industry or geographic area to find custom tools and resources. Connecting with other SketchUp users via forums, Facebook groups, or LinkedIn groups is easier than you think.
SketchUp Community
RECOMMENDED LEARNING RESOURCES
There are many resources available online that help you learn SketchUp. Some of the most popular and well-reviewed ones are:
The SketchUp Learn Series - This free tutorial series from the SketchUp community is beneficial as it explains SketchUp concepts step-by-step. It also has a forum where you can interact with the author.
SketchUp For Beginners – This blog is also an excellent resource for beginners as it guides you through setting up a SketchUp account, importing models, creating 3D drawings, and much more. The author explains all the concepts and also includes real-world examples.
How to Use SketchUp - This tutorial from Architectural Visualization demonstrates how to set up a SketchUp account, import 3D models, and create 3D drawings.
How to Draw a House - This tutorial from the SketchUp community explains how to create 3D drawings of houses using SketchUp.
CONCLUSION
IN YOUR WORK AS AN ARCHITECT, ENGINEER, OR BUILDER
USE SKETCHUP
SketchUp can be used for various reasons when it comes to using SketchUp in your work as an architect, engineer, or builder. For example, if you are planning a remodel or a new construction project, you can use SketchUp to create 3D models of your project.
SketchUp can help determine how much materials and labor you need for your project. In addition, when working as an architect, engineer, or builder, it can be beneficial to use SketchUp to create 3D models of your project to help visualize how it will look.
SketchUp can also create 3D models of your tools and equipment to help visualize how they will fit into your project.
Preparing for architechtural modeling-Youtube
Whether you are a designer, contractor, builder, or architect, there’s a great chance that using SketchUp will help you achieve your goals.
With so many benefits, it’s easy to see why many people love using SketchUp in their businesses. First, getting started with SketchUp is easy. From there, you can create 3D models and visualize your ideas and projects before bringing them to life in the real world!
Tony is a versatile, senior writer with 3+ years of experience writing blogs, articles, website content, and Copywriting. He provides high-quality and SEO-optimized content in B2B, SaaS, Technology, and Business. His strategy is to do extensive research and produce engaging content. Tony can be reached at tonnyonyango@gmail. com or connect with me on LinkedIn



Trending Technologies with GIS Data & Autodesk!
The gap between survey, engineering, and GIS has been narrowing year over year as long as I’ve been in the industry. I used to make a joke that GIS actually meant Get It Surveyed!! Although funny, I no longer see them as all separate silos. And Autodesk and ESRI have continued to strengthen their partnership and really focus on placing BIM and GIS at the center of every project.
This article explores then many ways of utilizing GIS data in your everyday workflows. From simply dropping in shapefiles, to connecting with the Autodesk Connector to ArcGIS GeoBIM.

KISS (KEEP IT SIMPLE STUPID!) METHOD
The most often used method(s) for importing GIS data into Civil 3D are pretty simple. The GOOD method of simply typing in MAPIMPORT or the
BETTER method of simply dragging and dropping the data onto your screen and utilizing the FDO options work great, and we’ll talk about the BEST methods coming up.
MAPIMPORT
This is a great way to utilize GIS data if you don’t want any connection online or to local databases. This also works out great if you’re looking to insert the linework for drafting purposes (lines, polylines, points, etc.). But you still get the extended information from the data itself!
Workflow
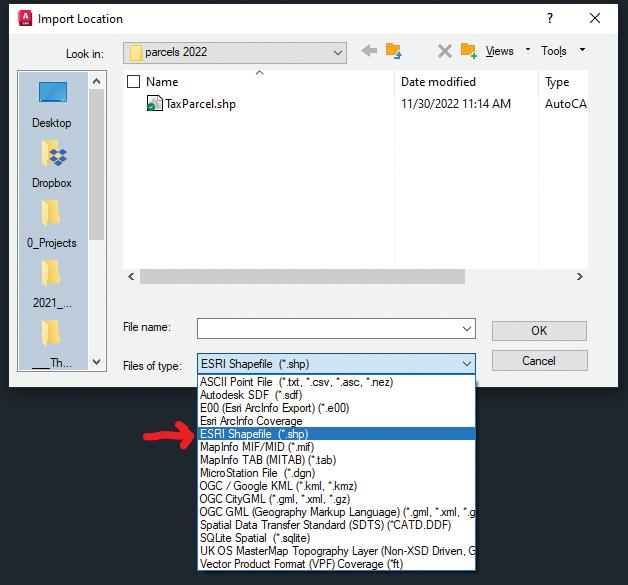
1. Type MAPIMPORT into your command line.
2. Change the “Files of Type” to your data type, mostly commonly used is SHP (Shapefile)
3. Select your data file and choose OK.
4. Here you can do the following before import:
a. Filter it by defining a window or using the current display on screen.
b. Data
i. Select under data where it says <none>
ii. This will allow you to create the object data and choose which object data you want to attach to the object properties.
c. Change layer or create new.
d. Import Polygons as closed Polylines and more!
e. Select OK!
TASKPANE / FDO CONNECTIONS
My favorite command in Civil 3D is MAPWSPACE! For the non-GIS user types, this gives you an immediate set of tools available for use, without switching workspaces or really knowing much about how to use GIS data.
Workflow
1. Type in MAPWSPACE into your command line.
a.
Turn on TASK PANE
This turns on the TASK PANE, where you can select the Data silo button and connect to all sorts of Data Connections. You can explore all the options available to you, but these connections can be life savers!
Continuing on with the BETTER method, in my opinion, by dragging and dropping your SHP file onto your model space screen. I’ll use a county TaxParcel SHP file for my example, but this can be done with literally anything! I use it a lot for parcels and utilities, especially in the early stages of a project.
2. From File Explorer, simply select your SHP file (AutoCAD Shape Source) and drag it to model space. Once released, the data will import into Civil 3D and the layer will show up in your Task Pane!
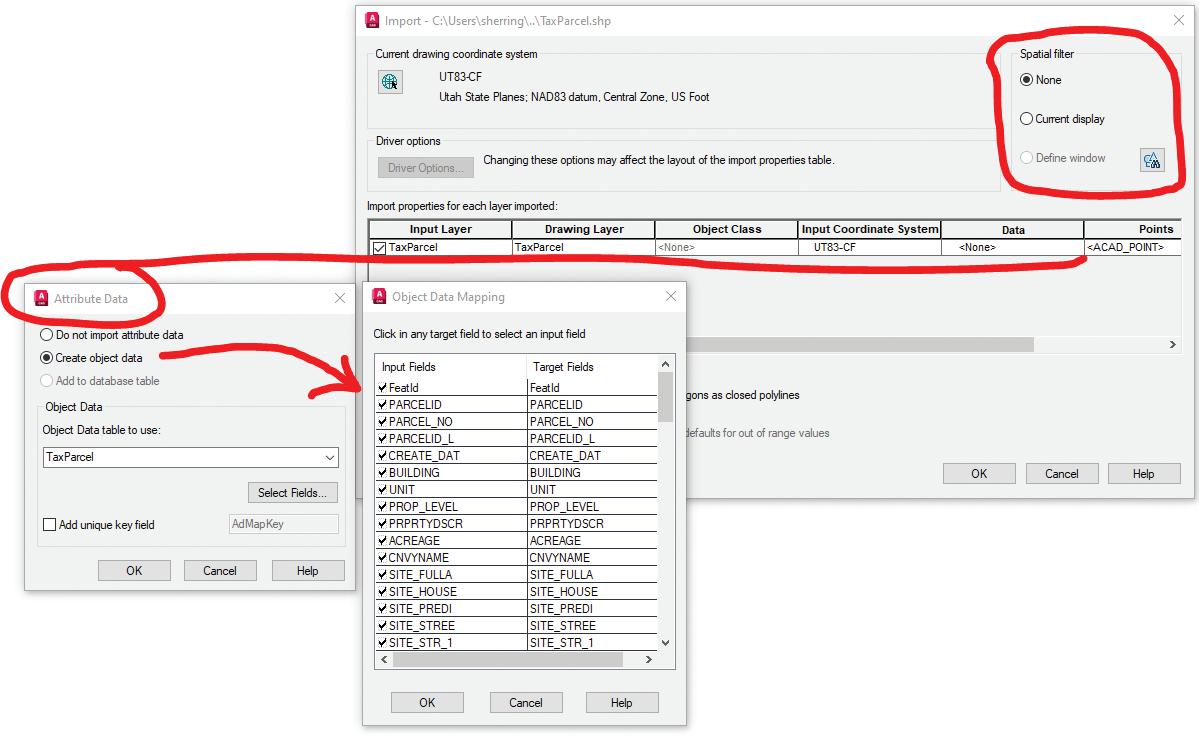
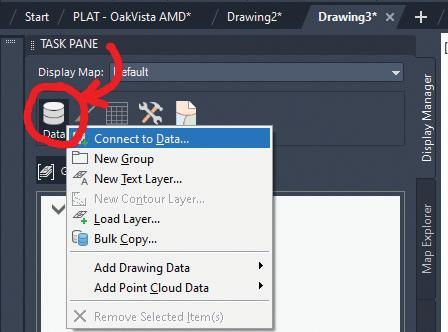
Easy right? Now the real fun begins! You now have, and I’ll use a clinical term, a SI$% TON of data and tools at your disposal! Let’s explore a few of them.
Let’s say a client calls in and is looking for a 2-acre parcel in a certain area of town and needs a quick concept plan.
3. Right click on the TaxParcel in the Task Pane.
4. Choose from the list “Query to Filter Data”. This will allow us to focus our data search on a certain area, based on either a certain parameter (zip code, town, etc.) or based on drawing in an area of interest.
5. Choose the Locate on Map drop down, and choose “Touching Any Part of Rectangle)
6. Draw on your screen the area you want to focus on.
7. Select OK.
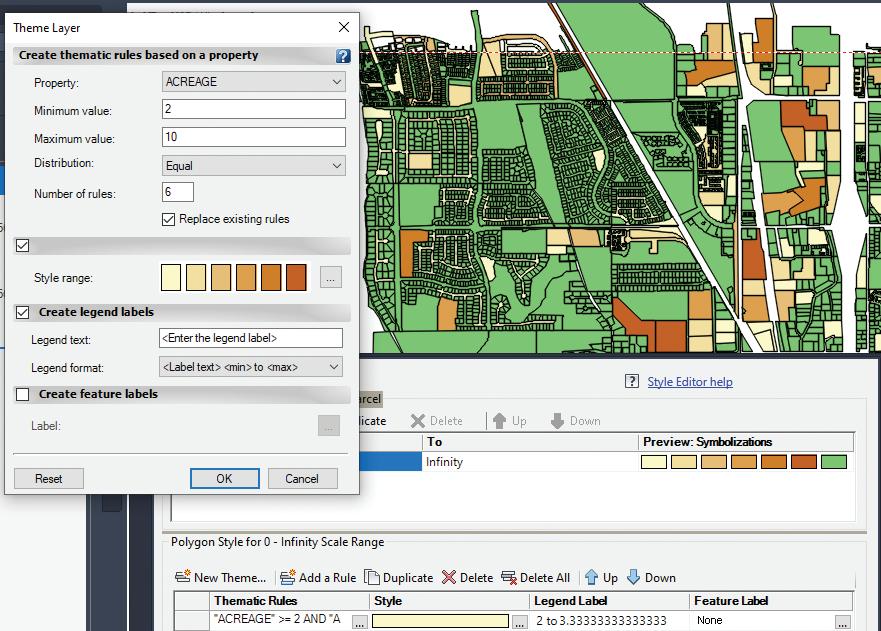
Now that you have narrowed your search to a certain area, let’s “theme” the database to show parcels based on size!
1. Right click on the TaxParcel in the Task Pane. Choose Edit Style to launch the Style Editor Dialog Box.
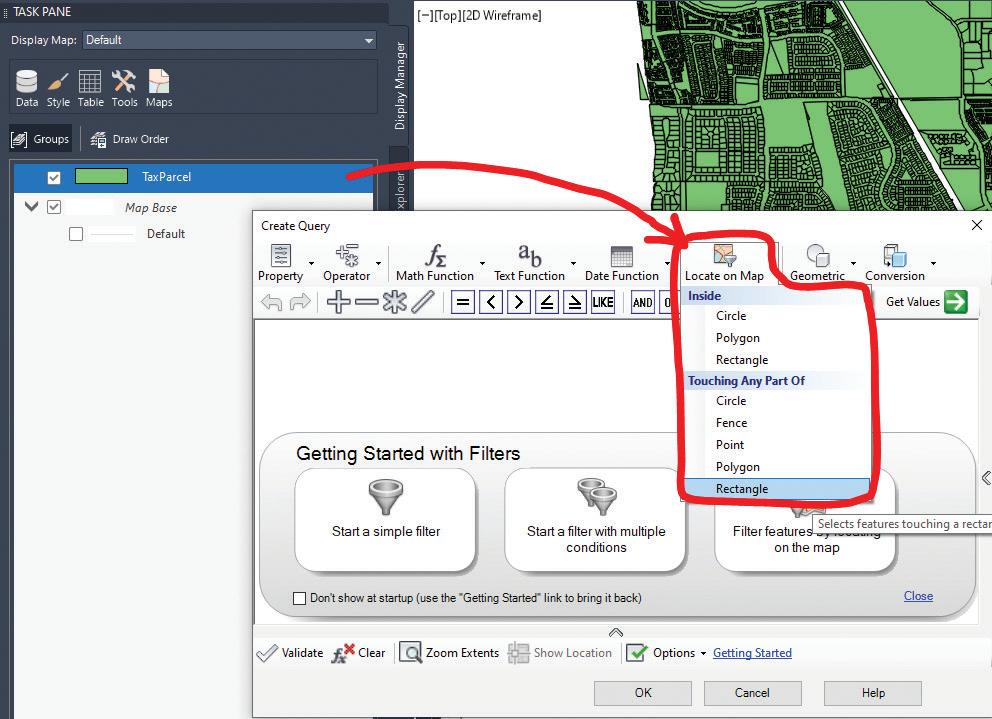
Autodesk Civil 3D
2. Select “New Theme” as shown below.
3. Now, we will filter the data to change the display to show us parcels broken out by acreage. We want to display parcels that are between 2 and 10 acres, by using the ACREAGE attribute and an equal distribution of 6 ranges.
4. Change your settings as shown below, then select OK!
You now have a beautiful map showing your client which parcel map is worth taking a look at! You can then extract the map objects as polylines, turn them into parcels and utilize Civil 3D parcel tools to quickly break out some concept plans.
EXTRA CREDIT: Select any parcel shown, right click and choose Show Data Table! Look at all that info! Go back to the Edit Style options and add labels!! Some cool stuff here, so explore around and check out all the functionalities!
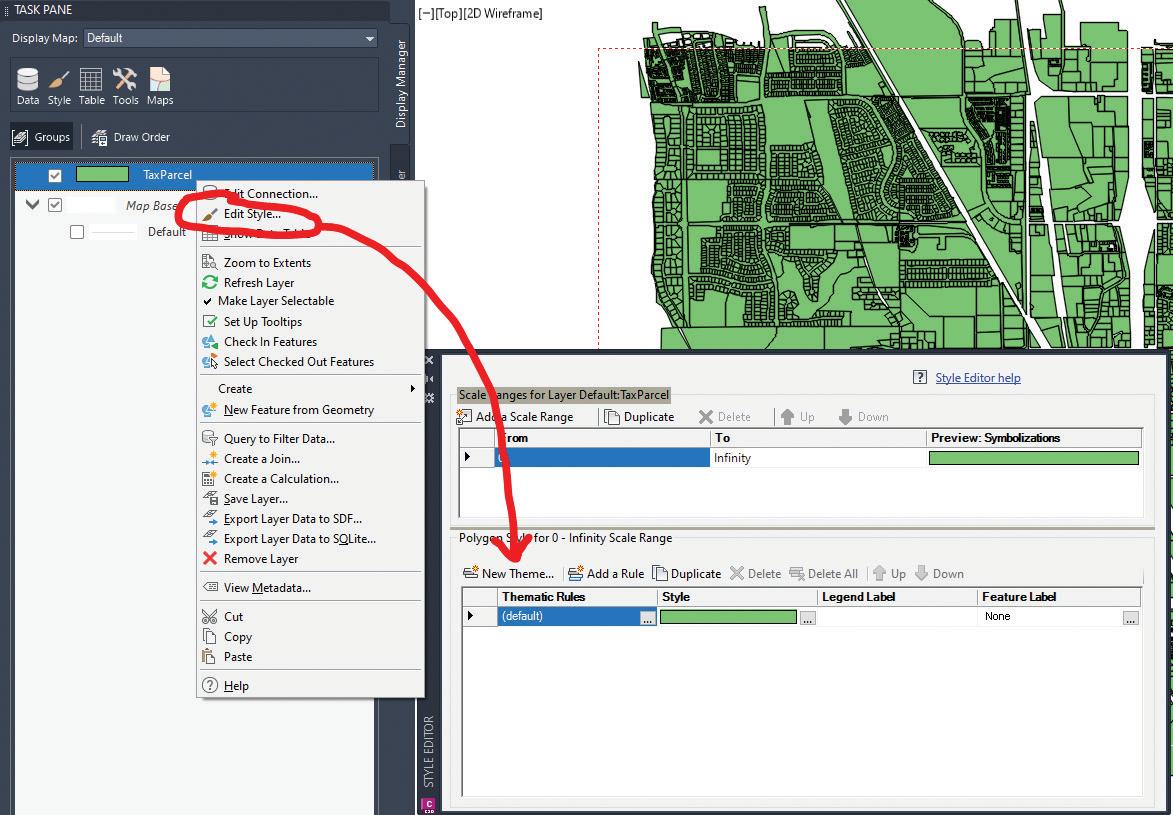
AUTODESK CONNECTOR FOR ARCGIS
The Autodesk Connector for ArcGIS is the first step toward realizing the vision of the partnership between Autodesk and Esri to integrate BIM and GIS workflows.
In Civil 3D 2023, this tool can be found on the Insert Tab of the Ribbon, within the ArcGIS panel. This is the BEST method in my opinion if working with a lot of GIS data and wanting to ensure that both your design and GIS systems contain the same information.
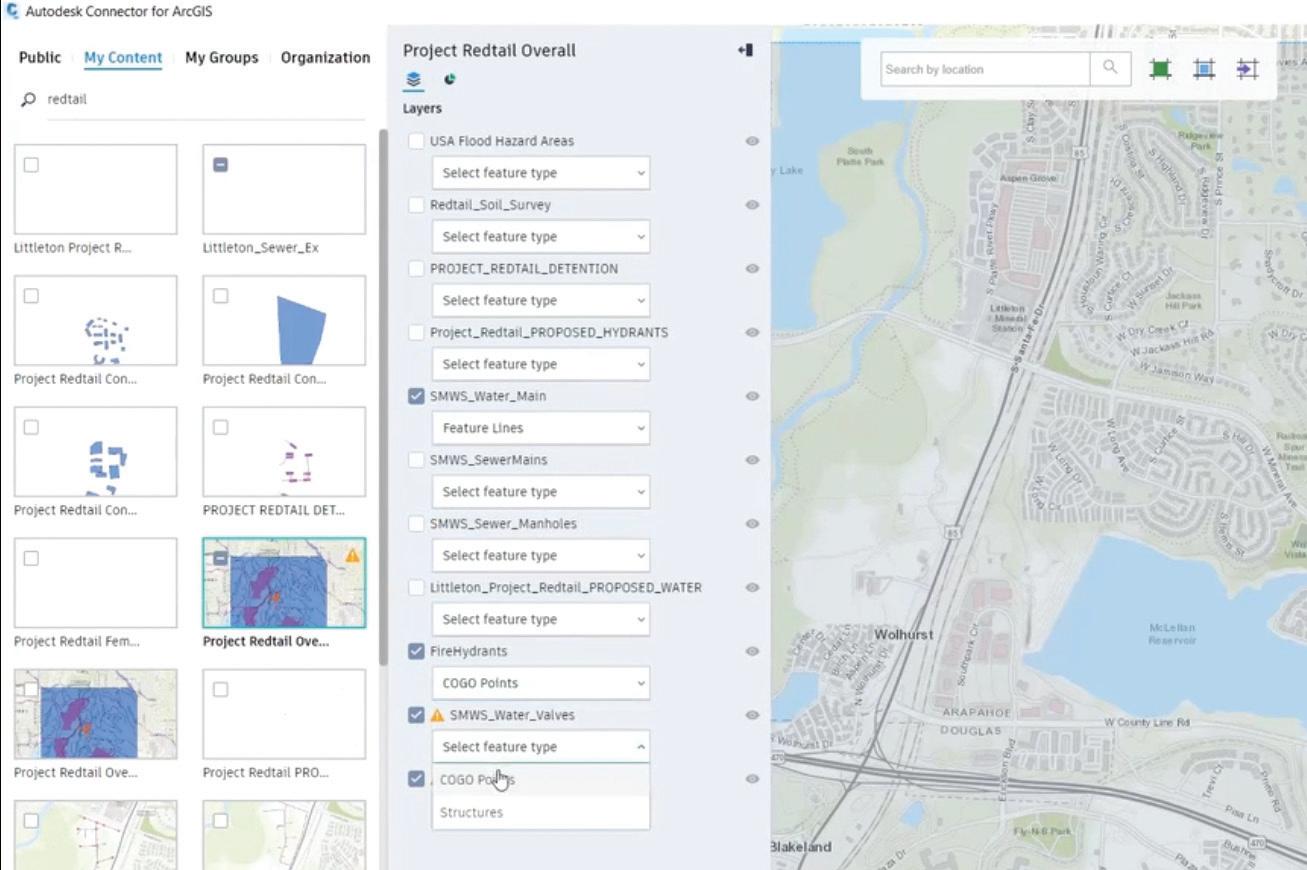
Using this window, you can bring ArcGIS data into your drawing as Civil 3D objects.

If you have an ArcGIS account, you are prompted to sign into your account to access your data before this window is displayed. If you don’t have an ArcGIS account, you can sign in as a guest to access public data.
Using the controls at the top of the map you can search for a certain area, and then define an area of interest. Specify the data to bring into Civil 3D by browsing available datasets for the selected area of
Autodesk Civil 3D
interest using the Public, My Content, My Groups, and Organization filters.
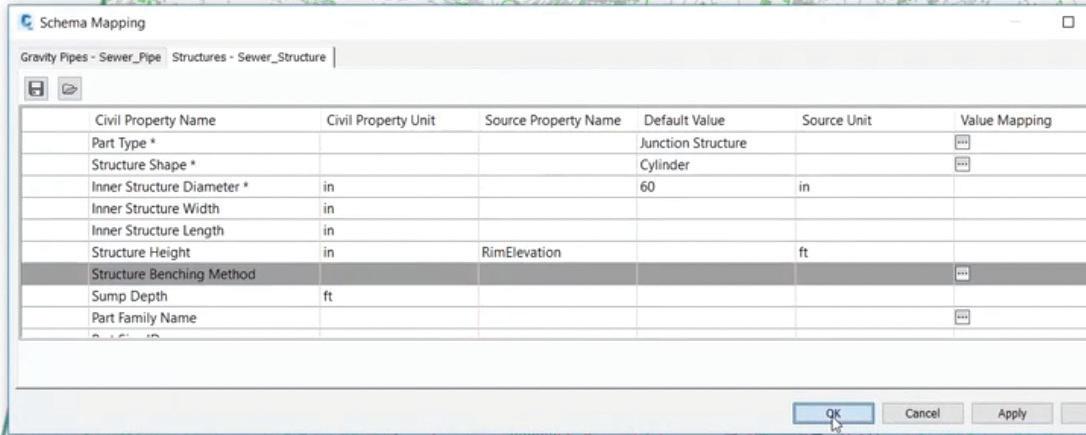
Once selected and inserted, items such as pipes and structures come in and are converted into Civil 3D Pipe Networks by utilizing the Pipe Network Schema Mapping dialog!
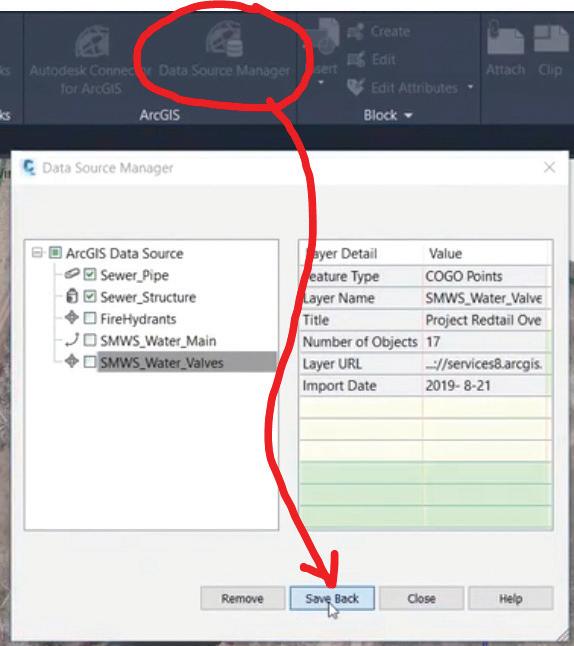
But this isn’t just a 1-way street!! You can edit your data in Civil 3D and “Save Back” to your ArcGIS online model!
Simply adjust your data, a sewer or storm drain network for example, and select the “Data Source Manager”. From there, you can choose what data updates you’d like to push back to ArcGIS and simply select SAVE BACK.
There is so much more we could explore here. We could take over this entire magazine with 50 pages dedicated to this workflow!
WHAT IS ARCGIS GEOBIM?
Something we all need to look more into, myself included, is a new offering from Esri that is built on the ArcGIS platform called ArcGIS GeoBIM. GeoBIM connects ArcGIS to the Autodesk Construction Cloud (ACC), providing a cloud-tocloud solution that helps architecture, building and civil engineering, and construction teams make more informed decisions from planning and design through delivery and operations. GeoBIM provides for the development of task specific web-based applications that leverage information in ArcGIS and in the ACC. These webapps can consolidate project and portfolio-level data, including design models, supporting documentation, GIS data, and issues, into information rich visual representations of the project.
How does ArcGIS GeoBIM work with Autodesk software?
ArcGIS GeoBIM enables web-based applications to be developed which dynamically connects GIS data from ArcGIS Online or ArcGIS Enterprise with project design and documentation information from collaboration software built on the Autodesk Construction Cloud.
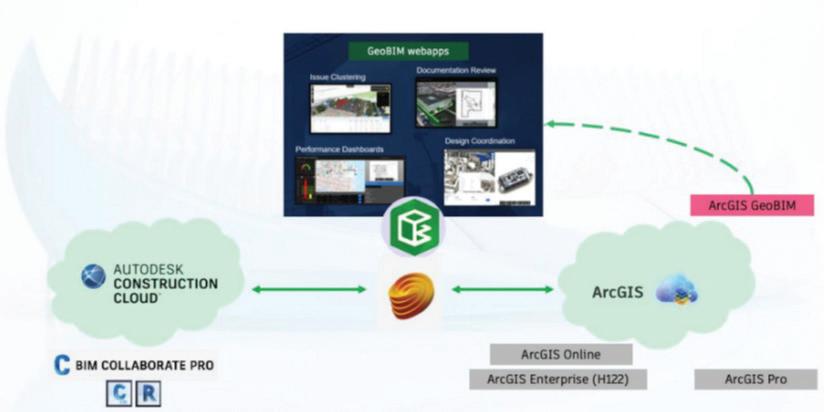
For example, a GeoBIM webapp could be developed that allows users to explore a project within a 2D or 3D map that contains buildings and other assets being worked on for the project along with information about the surrounding area and GIS boundaries. The user could then click on an object within the project extent to open a window to the Autodesk Construction Cloud viewer that displays the latest project information.
In the next edition of AugiWorld, we will take a super in-depth dive into GeoBIM!
CONCLUSION
GIS is a beast!! There is a reason why GIS users (and GIS degrees) are some of the most sought-after individuals in the marketplace right now. While there are a ton of GIS capabilities in AutoCAD, Map 3D, Civil 3D and Infraworks, they are just scratching the surface on what you can really do by utilizing GIS in your project workflows. Hopefully this helps remind you of some of those capabilities and piques your interest in some of the more advancing technologies we will highlight coming up soon.
Thank you!
Shawn has been a part of the design engineering community for roughly 15 years in all aspects of design, construction and software implementations. He has implemented and trained companies across the Country on Civil 3D and other infrastructure tools and their best practice workflows. Shawn can be reached for comments or questions at sherring@ prosoftnet.com.

Welcome to AUGIWORLD Inside Track! Check out the latest opportunities to advance your skills, processes, and workflows in your firm with the most current AEC-related software and hardware updates available.
The theme of this issue is trending technologies, so I have come up with some apps that bring in some of the cool stuff that relates to some of the new technology that is going on in the AEC industry right now. It relates primarily to the links between the physical (buildings, sites, and topography) and how we can utilize that physical information in 3D modelling and even develop a digital twin.
The Autodesk App Store is full of these types of apps, not just the ones I mentioned. Make sure you search the store, as I’m sure you will find many apps that will help you work smarter, not harder when it comes to these emerging technologies. Also, bear in mind that Autodesk also has numerous apps of their own that address these technologies as well.
So, on that note, here are this month’s picked and mixed opportunities to advance your skills, processes, and workflows with the most current industry-related software and hardware updates available.
LEICA BLK3D
https://apps.autodesk.com/BIM360/ en/Detail/Index?id=651773290078992
7726&appLang=en&os=Web BIM 360
When reporting issues from field to office, Autodesk® BIM 360® has very powerful tools to do so. In the field, the user can report an issue by location, type, text, and photo. This issue can be assigned to the responsible user. With the BLK3D integration, the user can add real measurable information to the issue. This means a human error in measurements or forgotten measurements are eliminated. When the issue is reported, the assignee has all the required information to respond.
To be able to use the BLK3D integration, the user must have a Leica BLK3D imager and a BIM 360 integration software package for BLK3D. Please visit the following website for more information: https://shop.leica-geosystems.com/learn/realitycapture/blk3d
NOTE: The app is compatible with BIM 360 Docs.
We have all been there when a measurement is not quite right or has been forgotten in the transition from site to document. BLK3D removes that area of error.
LIDAR TOPOGRAPHY
https://apps.autodesk.com/RVT/en/ Detail/Index?id=705615533998621884
&appLang=en&os=Win64
Autodesk Revit
Version: 2023, 2022, 2021, 2020, 2019
Topography is a high-performance topography creator that imports and interprets high-density Lidar airplane scans that are freely available online. The result is a topographical surface that can be used in tight curve intervals and provide an accurate terrain description. Architects and engineers can now work with free raw data surpassing old-fashioned low-density topographic curves from old CAD cartography. The benefits are a higher-quality model quickly that realistically describes your project’s terrain. You can also save money by using free laser scan Lidar datasets instead of buying inaccurate and expensive old fashion cartography. Links to Lidar sources are supplied in the program.
This app processes millions of point cloud datasets in a matter of seconds and allows you to take full advantage of a multi-core processor to speed up the creation of your terrain.
The main features of the app are:
• Imports very large point clouds with millions of points as uncompressed LAS or compressed LAZ formats.
Create topographic models with different density levels in accordance with your data source and requirements.

• Advanced algorithm to correctly interpret and isolate the terrain data from complex laser scans.
• Fully optimized to computers with multi-core processors for quicker results.
• Allows accurate geographical placement of topographic points in relation to the coordinate of your Autodesk® Revit® internal point.
• Possible to export the processed terrain as a CSV dataset for external use in other software.
NOTE: This app uses a custom installer (and not the standard App Store installer).
PHOTOGEODWG PRO
https://apps.autodesk.com/ACD/en/ Detail/Index?id=627172471935049959
7&appLang=en&os=Win64
Autodesk AutoCAD
Version: 2019, 2018, 2017, 2016
Autodesk® Civil 3D® Version: 2019, 2018, 2017, 2016

Never forget why or where you snapped a project photo. Whether you are walking miles of roadway to capture existing conditions, documenting sidewalk accessibility, or working on a signage inventory, PhotogeoDWG can instantly build your documentation and help when you want to share it with your design team.
PhotogeoDWG assists by showing you the location where you took the photo with a marker rotated to match the orientation you were standing in when you took the photo. The app will place a raster reference of the photo in the drawing, and it will automatically insert labels into your drawing.
This cool app will give you complete documentation in minutes instead of days!
3D digital twin. You only need the Cupix Capture mobile app and a 360° camera. Mount the 360° camera on your hard hat (or just hold it on a selfie stick), walk through your job site, and let Cupix take care of the rest! After uploading your capture, Cupix will automatically create a Google Street View-like 3D digital twin of your job site, which you can walk through online and share with your colleagues from our SiteView virtual job site viewer.
Add SiteView deep links to your Autodesk® BIM 360™ documents related to the job site. These links will open SiteView to the exact location your BIM 360 document is referring to. Even when your team members are offsite, they can make better-informed decisions by using Cupix digital twins as a spatial context to understand issues and reports in BIM 360. This minimizes possible miscommunications between different teams working on the same project.
CupixWorks users can also create BIM 360 Issues and RFIs while virtually walking the project site within CupixWorks SiteView and mark the locations of these issues with 3D coordinates within the space. These BIM 360 annotations within SiteView are directly linked to their corresponding documents in Autodesk BIM 360 Docs. As colleagues navigate the 3D digital twins of the job site, they can view any BIM 360 annotations within and open the annotations in Autodesk BIM 360 to respond or view additional details.
CUPIXWORKS

https://apps.autodesk.com/BIM360/ en/Detail/Index?id=8710031147690278
530&appLang=en&os=Web
BIM 360
CupixWorks is a machine vision-powered application built for the AEC industry. It transforms 360° photos and 360° videos into a
The construction industry continues to face new challenges. During this difficult time when travel is restricted, and only a certain number of personnel are allowed at each project site, the conventional way of job site documentation using text, 2D drawings, and disconnected 2D photos is especially not enough to fully communicate all the necessary details about what is really happening at the job site.
CupixWorks is an incredible suite of tools that allow you to transform physical data into that elusive digital twin!
If you have some news to share with us for future issues, please let us know. Likewise, if you are a user of a featured product or news item and would like to write a review, we want to know. shaun.bryant@cadfmconsult.co.uk


