TOOLKIT


In June 2017, in conjunction with the Federal Highway Administration and other Cities, the Indianapolis MPO held a Vision Zero Peer Exchange.

The goals of the peer exchange were to discuss different issues experienced in different areas of the country, foster exchange of information, focus on barriers, obstacles, and successes, identify opportunities to build or expand programs and create resources and tools for others interested in Vision Zero. Representatives from many different communities in a range of sizes, geographies, and locations attended. Topics discussed included Partnerships and Collaborations; Baseline Data and Tracking; Communication and Outreach; and Moving from Plan to Progress.
Out of that Peer Exchange, the Indianapolis Metropolitan Organization discussed a strategy to provide support to communities in central Indiana. This included the Joint Policy and Technical Committee passing a resolution supporting Vision Zero and creating a Vision Zero Resource Toolkit. The Indianapolis MPO Vision Zero Resource Toolkit provides a wide-range of resources that a community can use to implement aspects of Vision Zero in their community with the goal of reducing the number of deaths and serious injury to zero. Elements in the Resource Toolkit included partners in Central Indiana to collaborate with, education materials to educate the elected official, professional staff, and the public about the importance of Vision Zero and how to reduce the number of deaths and serious injuries down to zero, data to collect to evaluate areas in the community that might be unsafe for pedestrians and cyclists, design solutions to address roadways, signage, and lighting, implementation and enforcement actions, and evaluation standards to benchmark a community’s progress.
Vision Zero is a strategy to eliminate traffic-related fatalities and injuries, while increasing safe, healthy, equitable mobility for all.
Across the country, communities are committing to Vision Zero, which, in addition to setting the goal of zero traffic deaths or severe injuries, also commits communities to a fundamental shift in how they approach traffic safety and roadway design.
Vision Zero is a system-based approach that improves infrastructure for vehicular, bicycle, and pedestrian traffic. The goal is to provide safe, healthy, and equitable mobility for everyone.
Vision Zero is a strategy to eliminate traffic-related fatalities and injuries, while increasing safe, healthy, equitable mobility for all. Across the country, communities are committing to Vision Zero, which, in addition to setting the goal of zero traffic deaths or severe injuries, also commits communities to a fundamental shift in how they approach traffic safety and roadway design.
Vision Zero is a system-based approach that improves infrastructure for vehicular, bicycle, and pedestrian traffic. The goal is to provide safe, healthy, and equitable mobility for everyone.

Vision Zero started in Sweden in 1997 and has proven to be a successful tactic across Europe. It started as road policy stating that loss of life is an unacceptable price to pay for the luxury of mobility. This approach puts emphasis on addressing the road design and faults within it instead of placing blame on the driver for the collision. Sweden has one of the lowest annual rates of road deaths in the world, and fatalities involving pedestrians have fallen nearly 50 percent.
Vision Zero is still relatively new to the United States. New York City was the first American City to adopt a Vision Zero Action Plan and approach in 2014 to combat traffic related fatalities and serious injuries. Slowly, other cities across the U.S. have been adopting action plans of their own to try and increase safety for all modal users.
The Vision Zero Network is a nonprofit campaign started in 2015 to help communities reach their goal of eliminating all traffic fatalities and severe injuries. The network brings together leaders
in health, traffic engineering, police enforcement, policy and advocacy to develop and share winning strategies and to support strong, distributed leadership for policies and practices that make Vision Zero a reality1. For more information about Vision Zero, please visit: https://visionzeronetwork.org/about/what-is-visionzero/.

In June 2017, in conjunction with the Federal Highway Administration and other Cities, the Indianapolis MPO held a Vision Zero Peer Exchange. The purpose of this was to provide more training to address Vision Zero in a community through different mechanisms, foster exchange of information, focus on barriers, obstacles, and successes, identify opportunities to build or expand programs and create resources and tools for others interested in Vision Zero. Representatives from many different communities in a range of sizes, geographies, and locations attended. Topics discussed included Partnerships and Collaborations; Baseline Data and Tracking; Communication and Outreach; and Moving from Plan to Progress.
Out of that Peer Exchange, the Indianapolis Metropolitan Organization determined to help the communities in their service
1 Vision Zero Network Website Https://visionzeronetwork.org
area address Vision Zero, the most thoughtful and organized way would be to create the Vision Zero Resource Toolkit. The Indianapolis MPO Vision Zero Resource Toolkit provides a widerange of resources that a community can use to implement aspects of Vision Zero in their community with the goal of reducing the number of deaths and serious injury to zero. Elements in the Resource Toolkit included partners in Central Indiana to collaborate with, education materials to educate the elected official, professional staff, and the public about the importance of Vision Zero and how to reduce the number of deaths and serious injuries down to zero, data to collect to evaluate areas in the community that might be unsafe for pedestrians and cyclists, design solutions to address roadways, signage, and lighting, implementation and enforcement actions, and evaluation standards to benchmark a community’s progress.
There are multiple ways to address the goals of Vision Zero in a community. Many communities have chosen to approach Vision Zero as a tactical approach to road design to reduce traffic related deaths and serious injuries. While this tactical approach involves physical design solutions, other communities, have focused on how policy, education, and enforcement has played a role in affecting behavior, helped motorists understand a change in rules, or allow a law to become more effective because resources are available for enforcement. In each approach, that jurisdiction could see measure the impact of their approach. Which is why there is not one approach that can be taken to reduce traffic deaths and serious injuries.
Instead each community has to assess its overall transportation system and determine whether a systematic, systemic, and site specific approach is needed. Once that is determined, then a series of tools and tactics are available to accomplish those goals. This is the purpose for the creation of the Indianapolis MPO Vision Zero Resource Toolkit.
This Resource Toolkit is the first of its kind in the United States where multiple resources are located together for elected officials, professional staff, community advocates, the general public, and media can go to find a wide range of information about Vision Zero. The Indianapolis MPO has created a series of resources that provides education about Vision Zero, highlights common design and policy strategies, and offers other valuable information such as data collection, benchmark, partnership, communication and outreach strategies and links to other resources.
This resource is aimed to direct the user through a series of resources ranging in variety of topics. Each of these sections contain information for anyone looking for solutions to reoccurring transportation problems. These documents will house information relating to design and policy strategies to increase road safety for all mode users.
Purpose of Vision Zero and Where to Start: These sections gives a user an overview of the Indianapolis MPO Vision Zero Resource Toolkit and where to start based on the approach and issues to be addressed.
The History and Importance of Vision Zero: This resource gives a broad overview of the history of Vision Zero across the world, a typical perspective of a user of each mode, and the importance of
implementing Vision Zero in Central Indiana.

Data Collection and Benchmarks: This resource examines traffic related data at the national, state, and local levels to express the importance of roadway and other transportation improvements. Sources are provided for where to go to collect and access data, how to interpret, and use that data.
Communications: How to communicate the Vision Zero goals of a community goals of is as important as the various strategies themselves. This resource focuses on the tools, templates, techniques, message creation, and branding materials needed to implement Vision Zero in the community.
Policy Strategies: Sometimes design countermeasures alone do not reduce fatalities and injuries, at times, education or changes in policy are needed. This resource focuses on the legislative, educational, policy, and enforcement strategies a community could deploy with design strategies or alone to try and change behavior within their community.
Design Strategies: This resource addresses specific countermeasures that can be implemented that would reduce the incidence of crashes within a community. This resource identifies common transportation issues and problems and provides multiple options to address those issues through design-based solutions.
Resources: This resource contains links to external sources for more specific information on Vision Zero related sources, action plans from across the country, road safety information, public health information, and more.
The decision matrix helps users determine where to go for information in the Vision Zero Resource Toolkit including how to gather data and evidence, what goals could be developed for vision zero, how to gain support of elected officials, or determine if a countermeasure is needed. Depending on the issues or the desired approach, the decision matrix acts as a guide to focus the user on the most relevant resources to address that issue. In the following matrix, a user should find an “X” in the cross reference to the resource page will best address the topic or issue. By clicking on the “X” you should be redirected to the appropriate link.

I want to find out more information about vision zero.
How can vision zero be incorporated into our planning process?
I want to find out about specific design solutions to a problem we are having?
Who do I talk to about an issue we have at an intersection or on our road?
How do I collect data to support installing a stop sign or other traffic calming measures in our neighborhood?
What types of design options can our community make to the roadway to make it safer for pedestrians and bicyclists?
I want my Council to adopt a Vision Zero Resolution.
Why aren’t police out ticketing people who speed through my neighborhood?
Are there any tips I can share with the public about safely riding scooters in our community? X X
What kind of benchmarks should we set to determine if our solution is working?
I want to prepare talking points for a County Commissioner for a ribbon cutting ceremony.
This page intentionally left blank.
Vision Zero is a strategy designed to identify dangerous road conditions and eliminate traffic fatalities and serious injuries. The ultimate goal is to reduce the total number of crashes that occur.
Vision Zero is a system-based approach that improves infrastructure by identifying dangerous road conditions for vehicular, bicycle, and pedestrian traffic. The ultimate goal is to eliminating traffic deaths and serious injuries by providing safe, healthy, and equitable mobility for everyone. This is not just specific to vehicles but also bicyclists and pedestrians but also includes motorcycles and electric scooters. Communities that encourage the use of multiple modes of transportation face challenges when addressing multiple modes and often emerging modes such as the electric scooters and autonomous vehicles. This resource section explains the history of Vision Zero, the challenges and conflicts communities face with multiple modes of transportation, and how Vision Zero aims to address these challenges while focusing on safety, affordability, and equity for all users.

Vision Zero started in Sweden in 1997 and has proved successful across Europe. It started as a road policy that the Swedish parliament adopted believing that loss of life is an unacceptable price to pay for mobility. The system-based approach works to enhance safety by assessing roadway system designs rather than the fault of drivers. By addressing multiple influences of a transportation system such as policy, infrastructure
1 New York City Vision Zero Website, July 2020
design, vehicle technology, behavior modification through education, and enforcement, Vision Zero has been a successful strategy for working towards the elimination of deaths and serious injuries caused by vehicles. Sweden has one of the lowest annual rates of road deaths in the world, and fatalities involving pedestrians has fallen nearly 50 percent.
Vision Zero took hold in the US around 2013 when the approach of Sweden and Europe were gaining traction and being discussed as options to reduce fatalities. New York City was one of the first US
City’s to implement an action plan under new Mayor Bill de Blaiso in January 2014.1 Soon after, many other large US cities were starting to discuss how to address traffic crashes and fatalities. In 2015, the Vision Zero Network was formed. The nonprofit campaign is a partnership network that brings together many different entities to share strategies, enforcement, policy, and best practices to make Vision Zero a reality. In early 2016, the Vision Zero Focus Cities program was launched by the Vision Zero Network to foster collaboration between the 10 early-adopter cities. This
What is Vision Zero?

collaboration would lead to the sharing of data, ideas, leadership development that could be shared more broadly with communities across the US.
Since its formation, the Vision Zero Network continues to grow with additional funding support from various non-profits to support additional training, research, resources such as case studies, webinairs, and a resource library. The Vision Zero Network also has a recognition program for communities to be recognized as “Vision Zero Community”2.
For more information about Vision Zero Network, please click here.
Proving equal access to transportation options across a community are critical for a high quality of life and to promote the health and safety of individuals who live in a community. Oftentimes, there are segments of the population, vulnerable populations, that are disproportionately impacted by lack of facilities, a safe environment, or modal choices. This leads to equity issues in a community,
2 Vision Zero Website, July 2020
or environmental justice. Environmental justice is the fair treatment and meaningful involvement of all individuals of all people regardless of race, color, national origin, or income, with respect to the development, implementation, and enforcement of laws, regulations, and policies.
When undertaking transportation improvements and using federal dollars, the federal government requires federal transportation projects to address the impacts to low-income and minority populations. The MPO has identified seven underserved or vulnerable populations that should be evaluated to determine how a project might impact them. These underserved/vulnerable populations include minority, lowincome, English as a second language, no college degree, zero car households, people over 65, and those with physical limitations.
One of the ways to compact inequity is to ensure that all individuals have a voice in the process. Equity cannot be an “add-on”. The planning process must be planned from the beginning with an idea of how underserved or vulnerable populations will be served. While vision zero is a data driven approach, its important have qualitative information
to add a richness or connection to that approach that brings life to the data with real stories and experiences why vision zero matters. These stories can only be gathered in person.
Today, there is some distrust of institutions like the government and law enforcement. Community partners such as a local chamber of commerce, churches, and other groups can help bridge the gap. Enforcement of policies and laws related to vision zero could increase tensions in these areas that are distrustful. Instead, professional engineers and planners and elected officials must be bold enough to look at design elements and other features that would protect and promote safety over using punishment to try and curb behavior.
Changing the way processes have been led and how underserved/vulnerable populations have been engaged with and treated must be addressed. Thoughtful collaboration with the community and other community and business leaders will ensure that the right solutions fit the needs and the transportation problems of a community without creating environmental justice issues. The goal is to give everyone a voice in the process and to provide the opportunity for all
to have a choice in a safe and reliable transportation network.
The Center for Active Design states that “Humans will make mistakes, but a welldesigned system should help minimize the impact of those mistakes.” While this may be the case, engineers and planners alike agree that well-designed systems that elicit lower speed limits, increased visibility of pedestrian crosswalks (wellmarked), and separated bike lanes are just a few design solutions that can reduce the incidence of crashes at a site specific location or poorly designed intersection. But when Vision Zero is implemented systemically across the community through a variety of approaches including policy, design, education, outreach and communication, and implementation, that is when a community will move the needle on reducing crashes and injuries eventually eliminating them all together.
Vision Zero assumes that everything is to be done in order to prevent people from being killed or seriously injured while near roads and traffic – but also that no one person is perfect, and that accidents and
crashes will happen regardless of road safety infrastructure and design. Roads should be designed for multiple modes and with the intention of people in mind (not just cars) to reduce the possibilities of crashes from happening that result in serious injuries and fatalities. One way of looking at the true mission of Vision Zero is to realize that accidents cannot be complete eliminated, because humans are involved, but the consequences of human behavior should not result in serious injuries or death.
To learn more, click here.
Each community has so many miles of roadway that has been constructed and maintained. Most of these roads are used daily by cars and trucks of all sizes, morning and night. Depending on the driver and where they reside, the community and thereby roadways maybe familiar or may pose a challenge because the driver is unfamiliar with the area and roadway network. This familiarity, as well as the choices a driver makes on a route, is a primary cause crashes and fatalities. This increases in an urban environment where there are more distractions and a driver is unfamiliar with the area.
It is the driver’s responsibility as the
operator of a motor vehicle to follow traffic laws and be alert for motorcycles, bicycles, scooters, and pedestrians. The driver should always give these other modes the benefit of the doubt because oftentimes, in a crash, they sustain more injuries. So what are some things vehicle operators can do:
/ Pause and wait before turning
/ Slow down and drive the speed limit. Go slow in school zones.
/ Avoid distracted driving
/ Look for bicycles or scooters before opening your door
/ Give bicyclists and pedestrians the right of way in crosswalks
/ Use caution when approaching bicyclists and leave at least three feet of passing room
While Vision Zero places emphasis on the need to focus on the drivers, bicyclists, and pedestrians of the world, many people who focus on road safety in Sweden have noticed a missing piece to it: motorcycles. The Swedish Motorcyclists’ Association (SMC) was founded in 1963. They realized the need
What is Vision Zero? /
to work with road safety and inform motorcycle owners, safety officials, and elected officials in order to be able to influence decisions.
There was some initial controversy when Vision Zero was established. Since the focus was on vehicles, bicyclists, and pedestrians and motorcycles were not specifically stated, advocates wondered if motorcycles would be accepted as a vulnerable mode similar to bicycles and pedestrians instead of like a vehicle. Although motorcycles have been accepted as a vulnerable, there is still a lack of focus on them in Vision Zero initiatives including I policies and when designing the transportation system.
While this is pre-establishment of Vision Zero and could be considered a very early form of working with officials to increase road safety to reduce collisions, motorcyclists are sometimes overlooked due to the nature of the vehicle they ride. While the vehicle itself is harder to drive because it has two wheels, the driver of a motorcycle understands the increased risk of danger that comes with driving a motorcycle instead of a vehicle. Along with this, motorcycles must think and act differently while in traffic.
While admirable to put focus on the design of the road for vehicles and pedestrians
to increase safety, motorcyclists must pay attention to the changing environment of the roadway in areas that are implementing these strategies as they are often overlooked when it comes to an education group. While the Vision Zero campaign works to ensure that motorcyclists are not restricted nor discriminated against, many of the plans that have been completed in the U.S. do not have anything specific related to motorcycles or motorcycle safety. Questions about universal helmet laws, high visibility attire, and the future of motorcycling have been raised by motorcycle advocates and are still unanswered.
San Francisco might be the first city to begin to look at motorcycle safety as an addition to their Vision Zero Plan. Motorcycle usage has increased and therefore has resulted in an increase of serious injury or death. Educational campaigns targeting motorcycle riders have been started, but often these educational campaigns are better served for vehicular drives and the community as a whole to increase awareness of motorcycles on the road. San Francisco’s campaign educates targeted populations about defensive driving and other measures to alter individual behaviors to prevent crashes, unsafe speed, unsafe passing, and driving under the influence.
To learn more about San Francisco’s program, click here.
Montana is another state working to address the same issues with motorcycle crashes. “More than 80 percent of all reported motorcycle crashes result in injury or death and motorcycle riders are almost 30 times more likely to be killed in a crash than a passenger vehicle occupant.” Motorcycles often take the blame for a crash with a vehicle but driving defensively could be a solution for motorcyclists and vehicle drivers alike. Montana has offered safety tips for both drivers and riders. These include the following:
/ Keep your full attention on driving and avoid distractions.
/ Allow the motorcycle the full width of a lane at all times.
/ Always signal when changing lanes or merging with traffic.
/ If you see a motorcycle with a signal on, be careful and always ensure the motorcycle is turning before proceeding.
/ Check all mirrors and blind spots for motorcycles before changing lanes
or merging with traffic, especially at intersections.
/ Always allow more following distance — three to four seconds — when behind a motorcyclist, which gives them more time to maneuver or stop in an emergency.
/ Take a motorcycle safety course.
/ Wear reflective or brightly colored protective gear and a DOT-compliant helmet.
/ Obey all traffic laws and be properly licensed.
/ Use hand and turn signals at every lane change or turn.
/ Ride in the middle of the lane where you will be more visible to drivers.
/ Use caution and slow down when approaching left turns or intersections.
/ Observe speed limits.
/ Never ride distracted or impaired.
For more information, click here.
Bike and scooter sharing have become a popular method of transportation for people within urban areas. Where owning a personal vehicle and driving might not be desired in highly walkable areas, or where someone might not have the means, bike and scooter sharing has provided a quick, easy mode of transportation to supplement public transportation or to use for short trips. This has also been a solution in solving a problem called “the last mile.” Where public transportation might take a person close to their final destination, the final destination could still be a 15 –20-minute walk away from the nearest stop. Bike and especially scooters have been a quick and affordable way of helping people get to their destinations conveniently.
Electric scooters were introduced back in 2012 with a moped-styled vehicle design but did not take off until 2017 when Bird and Lime introduced dockless electric kick scooters. In 2018, scooters became so popular that the year became known as “the year of the electric scooter” due to the increasing popularity, fundraising, and value. Uber and Lyft has now added their own electric scooters. Uber and Lyft are the largest ride-sharing companies in the United States and Bird and Lime are
the largest scooter-sharing companies on the market right now.
Now that more cities are placing emphasis on multimodal uses, electric scooters have been the perfect addition to test how well they work. The theory of it makes sense, but in practice and reality, there are increasing issues that have left local government officials developing ordinances to set parameters under which scooters can operate in their community. Parking scooters has been a controversial issue across the country as many people have just left them laying on the ground where they ended their destination. At times that was in the public right-of-way jeopardizing safety for pedestrians and vehicles. Many communities now limit where parking of scooters can occur in the public right of way to ensure there is enough space for pedestrians to safely.
Multiple personal stories involving injuries, crashes, and even fatalities have left city officials looking for ways to ensure safety when using electric scooters. Many community ordinances set rules on where they can be used, where they are restricted from going, where they can be parked, how they had to be parked, whether they can be on sidewalks and trails, and whether helmets are required. Some communities
have even considered the complete elimination of their use due to the inability to determine where they belong. The introduction of this technology has been very controversial despite the increasing popularity and use of them. Are electric scooters more of a safety hazard than a solution to equitable mobility?
While scooters increase mobility opportunities for people, not everyone in a community has equal access to scooters. Mobility inequity occurs when access to scooters are limited to underserved areas due to location placement or requires a cellphone to access the scooter. Many companies locate scooters and bike shares in parts of the community that have more ease of accessibility and typically are destinations. Though the ease of use and low prices of using the electric scooters and bike share increases equitable transportation, equitable use is reduced as location, parking, and other restrictions limit access.
Safety is the number one concern that communities are looking at for all people and mode users. While ordinances may vary from community to community, generally the same rules apply across the nation involving safety. Websites encourage users to be aware of their surroundings, wear helmets for safety,
and obey the local ordinances and rules of the road. Specifically, the City of Indianapolis, passed an updated ordinance that prohibited the use of electric scooters on sidewalks, greenways, and trails such as the Monon and Cultural Trail. They are required to be used on the road and in bike lanes.
The world of electric scooters is new for most people and especially local governments for addressing safety concerns. Electric scooters can reach up to 15 miles per hour which arguably is too fast to allow on sidewalks and trails but could be considered dangerously slow when sharing a lane with a vehicle. Many communities look to their police force for enforcement, but it is low on their priority. Pedestrians may feel unsafe if users of scooters are traveling past them at a relatively high speed, drivers might feel unsafe sharing the road, and specifically scooter users during peak travel times might feel unsafe riding in the road with increased drivers.
/ Cannot ride on the sidewalks, trails, or greenways
/ Must ride in the streets following normal traffic laws:
/ Can ride in the bike lane
/ Cannot travel the wrong way down a one way street
/ Like a car, you must ride with the flow of traffic. You cannot ride the electric scooter in the oncoming traffic lane
/ Helmets are recommended by not yet required
/ Electric scooters must be parked leaving four feet of clearance on the sidewalk
Additionally, the Bird and Lime scooter websites say:
/ Must be 18 or older to operate the electric scooter
/ Must have a valid driver’s license
/ Should wear a helmet
/ Follow traffic laws
For more information regarding the usage of electric scooters in Indianapolis, please click here.
To read about Indianapolis scooter laws and accident laws, click here.
Electric scooters are pretty easy to use. Although Bird and Lime are the only available scooters available in Indianapolis, other scooter brands all basically operate the same when using them.
/ Register with the app
/ Scan the QR code to unlock (usually $1)
/ Pay a fee per minute of use
/ When you are done, scan the QR code to stop using Bird’s website states that are committed to the Vision Zero mission of making mobility safer, healthier, and more equitable for everyone on the road. Scooters are provided as alternative modes of transportation while potentially reducing the total number of vehicles on the road. Such alternative encourage cities to invest in safety infrastructure that is beneficial for everyone.
For more information about this topic, and sources used, check out these articles:
/ Lyft Launches a Scooter Service. Uber is Close Behind.
/ After more than 20 Injuries in September, Scooter Rule Enforcement begins in Indianapolis.
/ How Scooters have Changed Indianapolis after 1 Year.
/ Scooters Banned from Indy Sidewalks.
/ Scooters are a Huge Problem for Cities. No One knows how to Solve it yet.
/ Scooter-Sharing has Problems. When will American Cities Solve them?
/ E-Scooters Captivated IU Students. But more than 75 have been Hurt so far.
/ Scooter aren’t the Problem, User Behavior is say Councilor.
While changing behavior in adults is more difficult to achieve educating the young could have long term benefits. The Safe Routes to School have been around for years. The purpose of the program is to help communities increase safe passage for school children to walk from nearby neighborhoods to their local school.
The Vision Zero and Safe Routes to School programs work well when partnered together. Advocating for the safety of children often has a higher likelihood of being funded than just suggesting improved street corridors or requesting infrastructure improvements. The educational component that can be used while conducting the Safe Route Study can include not only the neighborhood but also the children in having them identify safety issues on their way to school or home. By shifting the train of thought of children to safety, and starting early, good habits and behavior can be formed and reinforced as they get older and start to drive.
What is Vision Zero? /
To read a case study about School Zone Traffic Calming in Portland, Oregon, click here.
Driving is the most used mode of transportation for people across the United States.
Indianapolis was designed with the intention that people would use automobiles as their primary mode of transportation. Recently, Indianapolis has begun making efforts in prioritizing safety for pedestrians and addressing multiple modes of transportation. Expanding upon the current infrastructure, Indianapolis is focusing on public transit options, as well as working towards providing adequate bike lanes and sidewalks. The bike and scooter share programs have also created demand for the increase and maintenance of infrastructure across the city. These new additions have brought attention to new problems not just for Indianapolis but across Central Indiana, the state, and the nation. Determining the best solutions to existing problems
and trying to prevent new problems from occurring is something that a Vision Zero approach can work to accomplish throughout communities.
Through the City of Indianapolis Pedestrian Safety Planning document, goals been determined for the area. This 2020 Plan focuses on a multitude of things ranging from transportation choice to programming. The Pedestrian Plan is important for Indianapolis because through this list of goals and objectives, it creates an opportunity for other communities to follow in Indianapolis’ footsteps.
Based on the data that has been collected, five key project types that have been determined:
/ along the roadway,
/ across the roadway,
/ off-street,
/ major barrier removal, and
/ placemaking.
This document can help prioritize development and infrastructure improvements by looking at the collected data. However, Indianapolis has a large budget gap between the amount of
money in the Transportation Budget and what it would cost for repairs and a full build-out across the city. Priority areas have been determined to start making these improvements across the city.
Indianapolis has determined that a Vision Zero approach would be a beneficial step in the right direction to reducing fatalities and serious injuries and has set a goal for eliminating them, over the next 10 years. Data shows that although the number of collisions have remained steady over the last 10 years, fatalities have increased by 50%. Using Vision Zero strategies, Indianapolis can begin to work towards their goal of decreasing crashes within the next 10 years.
Indianapolis will not be the first American city to adopt a Vision Zero outlook; New York City was the first to adopt a Vision Zero plan and has a multi-pronged approach that emphasizes enforcement, street design, and legislative proposals dealing with safety. Minnesota, Utah, and Washington also have implemented similar approaches and seen a 43%, 48%, and 40% decrease in traffic fatalities.
From 2015-2016, the state of Indiana saw a decrease in pedestrian fatalities (16.3% decrease). However, the US average increased 7% during that same time. Pedestrian fatalities increased each year from 2014-2016 nationally, will a 22% increase from 2014 to 2016.
Indiana has been taking some initiative through behavioral change. The City of Bloomington uses educational efforts using Indiana University’s campus. Grant funds are used by law enforcement agencies to enforce traffic laws for everyone. A lot of the enforcement takes place in school zones before and after school hours. The Alliance for Health Promotion works with Indianapolis to make sure pedestrian signals are working properly and adding pedestrian safety zones throughout the city.
For more data sources and information, check out these links below:
/ Association for Safe International Road Travel
/ Traffic Safety Facts: 2016 Data
/ Centers for Disease Control and Prevention: Motor Vehicle Injuries
/ Indiana Crash Statistics
/ Indiana Traffic Safety Facts: Indiana Crash Facts 2017
/ State of Indiana Fiscal Year 2017 Traffic Safety Annual Report
/ Driver Knowledge: Car Accident Statistics in the U.S.
A Vision Zero City meets the following minimum standards:
- Key are engaged.

This page intentionally left blank.
Vision Zero is a data driven approach which makes data collection vitally important when setting goals and then tracking them over time. Not only is data used to help determine what strategies are beneficial to implement, but it helps to identify common patterns where a community could be proactive in preventing serious injuries or fatalities from occurring.
Data collection needs to be detailed and accurate, and partners should be identified to assist with collecting or sharing the data they have collected with various government jurisdictions and law enforcement. Allowing resources to be made available to the public could help to create a larger awareness of issues and identify areas that might have higher incidence of accidents or areas that are underserved by transportation facilities, or areas where “close call” crashes might occur because rarely, if ever, are these reported. Additionally, once strategies have been implemented tracking is needed to determine if the strategy is working or not. Accurate reports of crashes and near-misses is just one step in making a community more safe.
Vision Zero is a data driven approach making data collection vital to this process. In nearly all cases where change is reactive, data is used to support the changes based on this information and patterns identified by using that data. The same should be done for communities looking to be proactive in their approaches to prevent collisions. For this to be accomplished to the best of a community’s ability, data must be recorded frequently and accurately through the help of the local government, police, and the public.
This is an effort that should be completed through the communities elected officials, community departments, and community partnerships. Creating ways that make it easier to collect this information and analyze it will make defending those proactive choices easier. Each of these groups has a role to play when it comes to recording information accurately:
/ Some cities across the nation have set up an online portal with an interactive map to report near-misses and crashes. This helps to report information in real time without the fear of making an unwarranted 911 call.
/ DOT’s, MPO’s, and local health partners are working with law enforcement to enhance police accident reports for crashes. Currently, misinformation comes from reports with missing information that either has been omitted or is not accurate based on the actual situation. Currently, the IMPO has been working to clean up central data from 2015-2018. The have produced maps and a dashboard called the Central Indiana Incapacitated & Fatality Crash Dashboard which can be found here.1
/ The public knows the community the best. It is next to impossible for elected officials and police officers to know where the worst intersections or stretches of road are unless there are continual crashes happening. Near-miss incidents are almost never reported to authorities and there is a huge misrepresentation of what happens in the streets of lowincome or minority areas. It is critical that elected officials, department staff, public health officials, and law enforcement build trust within neighborhoods and communities to talk with the public about the transportation system and the streets, intersections, and crossings that might not be the main roads used for primary travel that are unsafe. This allows for site specific changes to be identified and additional funding to be allocated towards infrastructure improvements and increase the quality of life for that area.
A study done by Harvard T.H. Chan School of Public Health showed that police often underreport bike or pedestrian issues and, unfortunately, found underrepresentation of statistics involving people of color. Sometimes, hospital data is more accurate in understanding the real numbers because they were not captured and recorded in police data. Collision data is often skewed by a hesitancy to report incidents. Near misses or other incidents for fear of making an unwarranted 911 call are usually not reported. Hospital records are another source of information for recording where, how, and what kind of crash/collision happened, especially for pedestrian and bicycle related collisions.
In response to this, a number of cities have asked residents for help and to share their insights and observations for road safety through crowdsourced maps. These maps work to fill the gaps in city and community traffic data not recorded by leveraging community knowledge through easy to use and anonymous tools. These interactive maps allow anyone to report a crash, accident or problematic issue/ near-miss and have that data recorded, uploaded to the internet, and for public record. Indianapolis has an interactive map that is updated by the MPO and has crash data from 2015 – 2018 recorded based on the definition of what an “incapacitating injury” is.
The MPO hired The Corradino Group to correct the location of the Automated Reporting Information Exchange System (ARIES) for the incapacitating and fatal crash records. This was done by going through police reports and making sure that the location described in the police report was the same as the point on the map. Over 15,000 of these records have been corrected, and data from 2012-2018 was available. Due to the change in definition of “incapacitating injury,” data from 2012 – 2014 was remove from the crash data site, or dashboard, but the information can still be obtained upon request. Although this map is interactive, users cannot submit their own data or information using this specific dashboard.
To visit the dashboard, which records data from across eight counties, please click here.
The Harvard Kennedy School published an article describing data collection and programs that worked towards helping to predict changes both in efforts for finding crash patterns before they happened and working to change the roadway before and analyzing the changes and potential crash risk if a certain change in the roadway were to be made.
There are multiple ways of collecting data from analyzing traffic patterns and existing crash data to look for patterns where crashes are more likely to occur, to conducting walk audits to evaluate all transportation and infrastructure conditions along a specific path. Multiple resources exist to help teach these tactics whether it be a community-led event or city or town-wide initiative.
A few ways to collect data are:
/ Recording the collision location on a map based on police and hospital reports
/ Interactive mapping for the public
/ Completing walk audits
/ Analysis of videos using traffic cameras or simulated videos
/ Data analysis of past collision data to identify patterns and where they are occurring/most likely to occur
/ Analysis of driver behavior through studies and social experiments
/ Analysis of pedestrian and bicyclist behavior through studies and social experiments
Read the full Harvard Kennedy School here.
Boston launched a driver competition which ran from fall of 2016 to early 2017 in an effort to understand and collect driver behavior and information. Human error is responsible for around 90 percent of traffic crashes. This competition was accessible to anyone with a smart phone and was a free mobile application that anyone could download. It was developed through a partnership between Boston’s Vision Zero Task Force, the Mayor’s Office of New Urban Mechanics, and Cambridge Mobile Telematics, a data sensing company, that provided drivers with feedback based on acceleration, braking, cornering, and phone distraction. Each week, the app scored the drivers on a sale of 0-100 and the city gave prizes to the stop drivers, most improved, new app users, and people who took car-free trips, and finally awarded a grand prize at the end of the competition.
The competition had a huge impact on driver behavior; of the 1,100 people who participated, their phone distraction dropped by 47 percent and speeding decreased by 35 percent. If these statistics could be achieved throughout a whole city, the chances of collisions could be significantly reduced.
San Francisco built upon this concept, offering a tool that uses sensors in smartphones to capture and analyze information on driver habits. It can sense when a driver brakes, accelerates abruptly, how fast a driver is going at any moment, whether they are driving aggressively or distractedly, and even when they have recently stopped at a bar. The tool can be used to coach drivers on how they can drive more safely.
While these social experiments may not be the most practical approach in all communities, studies and analysis of the data may still be representative of similar behavioral traits of drivers in smaller communities.
Setting benchmarks in a community is important as it relates to understanding data and determining if strategies have worked. Benchmarking is creating a goal to achieve within a set time frame and being able to measure that goal. These benchmarks should be set for different intervals depending on the time frame of your goal. It is important to remember that monitoring these goals is vital throughout this process as well – known as benchmarking.
Benchmarking is the logical next step to measure how effective strategies are working. This can be accomplished through the analysis of data from year to year, to identify patterns of where strategies are effective and accomplished state goals, others do not, or where unintended results occur based on those changes. Benchmarking allows a community to take a pilot project or implementation of a strategy in a small area and identify other places in the community where similar or the same project or strategy can be implemented to achieve the same outcome.
Benchmarking results should be accessible to the public. Through this benchmarking, and sharing of data and results, communities with similar issues can use this information to help them determine if certain solutions will work in their community.
Benchmarking can completed many different ways; using paper, machines, hand held devices, website, etc. The device chosen should be the most accurate and easiest to keep track of the goals. Some communities might choose to analyze data monthly, others on a semi-annual basis, and others might only be once annually. San Francisco uses a spreadsheet to record all incidents https://data.sfgov.org/City-Management-and-Ethics/ScorecardMeasures/kc49-udxn. A score card was used in this situation and updated as frequently as necessary with data. Other communities may use the overall data to see if they’re reaching goals set in their plans. All of this benchmarked data is analyzed and summarized into a progress report.
The Massachusetts Vision Zero Coalition releases Vision Zero Progress Reports which assesses the City of Boston’s implementation strategies and the results. These are yearly reports which include score cards which evaluates how well the goals are being met through a graphic summary.
Click here to view the City of Boston’s Progress Reports:
/ 2016 progress report
/ 2017 progress report
/ 2018 progress report
Other cities and communities have begun committed to Vision Zero after seeing progress reports that prove that these changes can help increase public safety and safer driving conditions. Many places have used these progress reports to explain how their efforts are working towards the overall goals set within a plan. While these plans may be Vision Zero Action Plans with an ultimate goal of reaching zero traffic fatalities and series injuries, some are working towards the overall reduction by a percentage.
Whether a community wants to strive for zero traffic related fatalities or injuries and become a Vision Zero recognized community, progress reports can show the progress a community is making and if it is heading in the right direction.
Another example is to the right. Boston’s progress reports are more graphic in nature to identify which initiatives are being worked on, are making progress, and what needs improvement.

New York City uses a spreadsheet to detail the same information and to keep track of what initiatives have been started, are in progress, or have not been started. An example of a scorecard might look something similar to what New York City has done to benchmark their progress. The link to their scorecard is here.
Scorecards can be tailored based on the community or based on modal data for vehicles, bicycles, or pedestrians. There is no formal way to organize these scorecards and measure a communities goals. As long as a community records data and information accurately, determining if the strategies and solutions being deployed should be easier to assess.
This page intentionally left blank.
This component has been developed to provide communication materials which can help to influence behavioral change across multiple channels. The materials included in this component can be tailored to local elected officials, state legislators, media outlets, technical professionals, community leaders, advocates, and members of the public to showcase effective messaging in addition to strategies to create change. These materials as part of the overall vision zero campaign can:
/ Influence policy and legislation
/ Change organizational practices
/ Foster coalitions and networks
/ Educate providers
/ Promote community education
/ Strengthen individual knowledge and skills
There are several different audiences that can use this communications section. These include the following groups and the roles they might take in using or advocating for Vision Zero in the community.

Metropolitan Planning Organizations (MPOs) are large parts of our lives and the regional economy through the planning and programming decisions they make. There are 407 MPOs in the U.S., one for each urbanized area with 50,000 or more people. City and community engineers and planners are on the front lines in the fight against traffic deaths, and the role of MPOs is receiving increasing attention as more people across the country acknowledge the travesty of preventable loss of lives on our roadways. Last year, according to the National Safety Council, an estimated 40,000 people lost their lives and more than 4 million more were injured on U.S. roadways. And traffic deaths disproportionately affect those in communities of color, low-income communities, youth, the elderly, and those walking and biking.
Through regional planning, funding, and policy, MPO board members with technical expertise are uniquely positioned to understand Vision Zero and champion its cause to elected officials with legislative power. The people at the heart of these organizations know the issues unique to their community, and have the knowledge to make recommendations of how to implement the principles of Vision Zero in a way that is likely to
win over elected leadership and make meaningful impact. They will need additional guidance to make sure that they make these points in a persuasive manner, but can be powerful allies.
Mayors, as well as town and city council members, play a critical role in committing a community to Vision Zero, whether through legislative action or in direct partnership with other members of their communities. Once the commitment to pursuing a Project Vision Zero-friendly agenda is made, many elected local leaders have worked to invest resources from their communities to mobilize the right agencies — and top leaders —within the city to turn talk into action in a lasting and meaningful way.
Overall, elected local leadership plays the most important role in setting the vision, communicating priorities to the departments carrying out the work, ensuring funding aligns with goals, establishing the structure for collaboration and action, and fostering a climate that both celebrates successes and holds stakeholders accountable to the urgency of achieving Vision Zero. All materials must be made to use by MPOs, but easily viewable and understandable by elected civic officials across the state of Indiana and beyond.
Attached to mayoral leadership through governmental power, but with a voice to affect change on a larger, statewide scale, these individuals can seek out a cause and shine a spotlight on it to enhance the effectiveness of a campaign. By making a commitment to advance the principles and cause of Vision Zero,
state legislators and lawmakers will be able to take effective steps in conjunction with local governments to make recommended steps a reality.
With greater emphasis on Vision Zero initiatives and goals, on a number of local levels and to some extent on the statewide level, Vision Zero will additionally generate new interest among tertiary audience members.
Having seen the impact of preventable traffic fatalities or injuries, either to someone they know personally or simply to members of their community, these individuals are eager to speak out and effect change to impact this widespread problem. Beyond listening, changing their own driving habits, and using their networks to spread the word and change cultural habits on an individual level, community activists want to interact with legislators and lawmakers, putting pressure on them and making a difference on a structural level as well.
Spreading the high impact of traffic deaths among marginalized groups and the preventable nature of these fatalities and injuries will draw their interest. The more data these activists will have access to, the more they will have to latch onto and share on their personal networks. A dedicated fact sheet will be a shareable tool that could have an outsize impact for them to share with their own networks. While journalists have access to traditional media platforms, community activists are active on a more grassroots level and spread messaging focused on social media and direct community action. They will help to change habits and put pressure on elected officials.
The following resources are available to download and customize and use to advocate for Vision Zero in your community.
A rich collection of organizations with multiple viewpoints, community partners take an active role in the life of the community. From members of law enforcement, to educational organizations, to nonprofit organizations like AARP and United Way, to civic and economic organizations like chambers of commerce, community partners all have a direct interest in ensuring that the community stays safe, active and traversable. The level of impact that community partners can have varies, from direct policing action and awareness-raising, to community events and information gathering. They form the connection between government and individuals, spreading the word and furthering the Vision Zero agenda.
With multiple facets of trusted and important statuses within their communities, members of this audience segment will each have a focus they will want to stress above all. This will require a more diverse and personalized approach to communications, especially when it comes to the distinction between law enforcement and other organizations. However, each can help to influence elected leaders, as well as be a lynchpin in organizing community activists and spreading awareness to journalists and community members.
Members of the news media and journalistic community will naturally have interest in any matter that’s generating discussion amongst the people with the legislative authority to impact
change. The goal of eliminating all traffic fatalities and severe injuries, while increasing safe, healthy, equitable mobility for all is high-minded and ambitious, and could generate interest in and of itself.
In downloadable action plans and tool kits, this campaign will provide public-facing data and tools related to road injuries and fatalities, a matter that is literally life and death and should generate interest among this audience. In turn, they can provide a platform to reach out to members of the public, who can impact cultural change on a wider level.
From changing driving habits, to pressuring legislators to take proven steps to increase road safety, the public has the power to push this agenda. Ultimately, it is the public that Vision Zero is attempting to protect, so creating interest among them will be key to sustained action that reaches beyond a rapid news cycle. Messaging will need to be easy to quickly understand, and provide concrete steps that need to be undertaken while providing the outlets that have the power to enact those changes. With the help of the public, Vision Zero will continue to make an impact into the future.
The following resources are available to download and customize and use to advocate for Vision Zero in your community:
/ Learn how to conduct and host a community meeting here.
/ To tailor one-page fact sheets towards a particular audience, click the links below:
/ Technical MPOs
/ Elected officials
/ Community partners
/ Community advocates
/ To learn about op-eds and how to write a piece that gains reader attention, click here.
/ For press release examples, click the links below:
/ Government announcement
/ Community partner organization
/ To view the social media toolkit, learn how to create successful social media account(s), and learn tips and tricks for running the account(s), click here
/ Ideas for building a Vision Zero website of your own can be found here.


Document Fonts
Roboto Regular (+Italic)
ABCDEFGHIJKLMNOPQRSTUVWXYZ
abcdefghijklmnopqrstuvwxyz 0123456789
ABCDEFGHIJKLMNOPQRSTUVWXYZ
abcdefghijklmnopqrstuvwxyz 0123456789
Roboto Bold (+Italic)
ABCDEFGHIJKLMNOPQRSTUVWXYZ
abcdefghijklmnopqrstuvwxyz 0123456789
ABCDEFGHIJKLMNOPQRSTUVWXYZ
abcdefghijklmnopqrstuvwxyz 0123456789
Decorative Font
Tungsten Bold
ABCDEFGHIJKLMNOPQRSTUVWXYZ
abcdefghijklmnopqrstuvwxyz 0123456789
Logo Font


Tungsten Medium | Size 62 for Name (see example)
ABCDEFGHIJKLMNOPQRSTUVWXYZ
abcdefghijklmnopqrstuvwxyz 0123456789


CMYK 0, 0, 0, 90
RGB 65,64,66
HEX #414042

CMYK 0, 23, 99, 0

RGB 255, 199, 16
HEX #FFC610

There are multiple strategies which effectively reduce the incidence of crashes within a community.
This resource section will identify various policy, program, and enforcement strategies that can help change behavior, improve awareness, or ensure policies are followed and more effective. While there are multiple solutions, no one strategy is the correct or definitive solution to eliminate deaths and serious injuries. The policies, programs, and enforcement strategies work best partnered with at least one or more additional strategies to be the most effective in achieving the vision zero goal(s ) set for your community. Policy strategies are organized into several different sections including legislation, policy, and other strategies.
There is no solve-all solution for preventing collisions of any type, but there are ways to work to enforce a safer environment for drivers, bicyclists, and pedestrians through laws, enforcement, and education. The following pages will discuss some tactics that can be used within your community to work towards increasing safety.
There has been an increase in distractions since the beginning of the automobile industry. Constant evolution and innovation of technology is a problem for all modal users. Although cell phones are a proven distraction for individuals. Many states and even some communities have enacted some form of “hands free” law where individuals cannot have their phone in their hands at any point during the time they are behind the wheel of a vehicle. Hands free legislation is mandating that drivers avoid the use of handheld electronics while operating a motor vehicle to increase safety and driver alertness. This is especially important as technology becomes an ever-growing part of everyday life.
Indiana has had a no texting while driving law since 2011. The purpose of the law was to address distracted driving but posed a challenge for police officers to enforce it and it did not reduce crashes due to distracted driving1. Eventually the courts found the law to be too narrow in
scope to be enforceable. So, on July 1, 2020, Indiana enacted a hands-free law where Indiana motorists could no longer hold electronic communication devices in their hand while operating a vehicle. This would include devices such as cell phones, tablets, and smart watches. Phone calls, texting, and other activities that you would use these devices for are not permitted to be used while in a driver’s hand. Indiana is not the 25 state to have enacted such laws.
Hands free ordinances or legislations should recognize that drivers still might need the use of these devices for navigation and potentially audio content. Hands-free use of the device should be permitted so long as it is mounted to the dash or synced with the vehicle in some manner to reduce the need of the driver to remove their attention from the road.
However, drivers can be lulled into a false sense of security. Hands free phones requirements fail to address the underlying problem which is diverting a driver’s attention from the road. Numerous studies have shown that even with a phone mounted in a vehicle or connected via Bluetooth, the mere act of talking on the phone distracts the driver,
1Indiana Department of Transportation. (July 9, 2020). Hands Free Indiana. www.in.gov/indot/4063.htm 2 Indiana Department of Transportation. (July 9, 2020). Hands Free Indiana. www.in.gov/indot/4063.htm
making them situationally unaware of what is happening around them.
The State of Indiana already has a law that requires seat belts for every occupant of a vehicle. Seat belts are a safety measure for everyone within a vehicle to prevent death and a serious injury in a crash however, even in 2020 there are motorists who still do not wear a seatbelt. Although there is no reason to revise this law, enforcement is the key to safety. Seat belts can reduce the likelihood of adults dying in a crash by up to 45 percent and cut the risk of serious injury by 50 percent.2 Children especially should be restrained, and fines are assessed depending on the situation if a motorist is pulled over. What has been proven time and time again, is that seat belts save thousands of lives every year by restraining drivers and passengers within a vehicle instead of being ejected during a crash.
Indiana has a “primary” seat belt law that requires any occupant of a vehicle, who is 16 years or older to be properly restrained in a seat belt. Additionally, for persons under 16, they must be properly
restrained in a seat belt, child safety seat, or “child restraint system”. The law applies to all passengers of a vehicle whether they are the driver or passenger.
Since Indiana has a primary law, that means law enforcement can pull a motorist over if the officer suspects a driver or passenger is not wearing a seat belt. Enhanced enforcement operations like “Click It or Ticket” have been successful in reminding drivers and their passengers to wear their seat belts. However, the most successful method to implement the requirement of seat belts is education and technology.
Many car manufacturers have installed audible warnings inside a car to indicate to the front seat driver and passenger that their seat belt is not buckled. While technology has advanced and provides a good reminder to put a seatbelt on, new generations still should be educated to the safety reasons of wearing a seatbelt.
drivers why seat belts are important and the latest statistics of how seat belts saves lives.
When driving down the interstate, there are still many motorcycle drivers and riders who do not wear helmets. Some of the most common reasons for this is that the helmets are expensive, heavy, hot, strain the neck, feel suffocating, and limit head and neck movements. However, the risk of injury and death is greater for a motorcyclist if involved in a crash. When a motorcycle crashes the rider lacks the protections of an enclosed vehicle, so that increases their chance of injury or death. In 2017, the number of deaths on motorcycles was 27 times the number of deaths in cars, however there was a 3 percent decrease in the number of motorcycle deaths from 20163. In 2017, the number of motorcyclists killed from states that did not have universal helmet laws (57 percent) was approximately 7 times greater than those states than did have universal helmet laws. while not wearing helmets, seven times greater than 57 percent of the motorcyclists
Education campaigns such as PSA’s on the news, messages scrolled on transportation billboards on interstates, community safety fairs, and education as part of a vision zero program remind 3 Dept of Transportation (US), National Highway Traffic Safety Administration (NHTSA). (October
killed were from state that did not have universal helmet laws as compared to only 8 percent in states with universal helmet laws.
Currently, the Indiana state law requires all motorcycle riders under the age of 18 to wear helmets when driving or riding on a motorcycle. Indiana’s universal helmet law was repealed in 1977. As statistics show, Indiana motorcyclists are more likely to have a higher incidence of death because of no universal helmet laws in Indiana. The best outcome regarding safety is to legislate helmet-wearing for all riders, promote improvements in the quality of helmets through enforcement of standards, and public education. Likewise, educating riders about the importance of wearing protective clothing and the protection they can offer muscles and skin against abrasions, reduce the risk of burns from contact with hot metal and prevent and reduce the severity of fractures. However, motorcyclists often will not wear protective clothing due to the cost and the perception of discomfort.
http://www-nrd.nhtsa.dot.gov/Pubs/811387.pdfCdcpdf
A resolution is typically used to express a legislative’s body’s opinion or intent about a particular issue or topic a community is facing. Oftentimes communities use resolutions to educate the public about critical issues and send a strong signal to the public and state and federal legislators that people care about certain issues.
However, sometimes there is not enough clarity on what an outcome should be on an issue or how to resolve the issue. Mayor, Council, School Board, Homeowners Association, or others may be more comfortable stating their support for or against a particular issue using a resolution instead of passing an ordinance.
The Indianapolis Regional Transportation Council (IRTC) Joint Policy and Technical Committee approved Resolution Number 18-IMPO-022 on December 12, 2018. Resolution Number 18-IMPO-022. The MPO policy resolution supported a
regional vision zero initiative to reduce motorist, bicyclist, pedestrian, transit user, and other transportation-related deaths and serious injuries to zero. Unlike other resolutions previously adopted for performance measures, this one does not have a mandate.
*Indianapolis Metropolitan Planning Organization Transportation Policy Committee was previously known as the Indianapolis Regional Transportation Council (IRTC) when the Vision Zero Resolution was passed.
While a resolution is typically the first start to implementing vision zero, resolutions do not require action and are not enforceable. A resolution is a nonbinding, official statement. A resolution typically has a main motion with whereas clauses stating the reasons for a policy, position, or action. These clauses or statements that begin with “WHEREAS”, and are statements documenting facts, or existing conditions, the change that needs to occur, the authority of the body making the resolution, and a call for a specific action or program with a timetable.
Supports of vision zero know that the typical approach to transportation mobility safety is not enough anymore and a fundamental shift in philosophy and approach to traffic are needed. However, that is easier said than done. Most communities, agencies, or nonprofits who want to enact vision zero policies, a plan, design solutions or merely support others start with a strong policy resolution. Many of the resolutions for vision zero have been an overall resolution supporting the goals of vision zero. These resolutions often start out with stating that fatalities are not acceptable, the action that needs to be taken, and that the legislative body supports the goals of vision zero.
/ Some facts or statements to consider in a resolution:
/ Percent pedestrian fatalities of total traffic fatalities
/ Number of total pedestrian crashes per fatalities per year
/ Percent of pedestrian crashes occurring outside the intersection
/ Safety is a priority for all road users.
/ Crossings are essential to a complete network for pedestrian mobility.
/ Pedestrian safety is part of overall quality of life and improved public health.
/ Improvements to pedestrian safety often improve safety for all road users.
Planning is at the core of every community and every system. It forms the policy basis for what communities want to do for the next 20 years in their community. There are many different types of plans that can be created to address a range of needs in a community in which elements of Vision Zero could be incorporated into or a community could create a specific Vision Zero Action Plan. This section will summarize the various types of plans and how Vision Zero could be incorporated.
A Comprehensive/Land Use Plan is a 20-year policy document that layout out how a community will develop over the next 20 years. It illustrates the quantity, quality, type, and location of various land uses. Indiana has minimum requirements for a plan as permitted by the 500 series of Title 36-7-4 of the Indiana Code. A
community’s comprehensive plan must include:
/ A statement of objectives for the future development of the jurisdiction;
/ A statement of policy for the land use development of the jurisdiction; and
/ A statement of policy for the development of public ways, public places, public lands, public structures, and public utilities.
Most comprehensive have other elements including parks, natural resource protection, health and wellness, character and identity and transportation. Transportation is often an integral part of the comprehensive plan because land use and transportation are inherently linked. The land use intensity and location directly affect recommendations and improvements to a multi-modal system. Incorporating vision zero elements including goals, principals, analysis of the transportation system, and recommendations are a natural evolution of the transportation element.
Resources: / APA Indiana Citizen Planning Guide:
Chapter 7 Comprehensive Plans
/ Local Comprehensive Plans
/ Subarea Plans
A Vision Zero Plan is an implementation plan that is concrete, and action driven based on the needs of the community. It is focused on building equitable access to a community-wide multi-modal transportation system by addressing the problems both systemically and site specially, increasing safety, and reducing traffic related deaths and injuries.
A Vision Zero Action Plan is comprised of nine components. These components are not the only things to consider, but they are critical for Vision Zero to be effective.
/ Political commitment – The highest-ranking local officials (mayor, city council, city manager, etc.) must make an official and public commitment to a Vision Zero goal of eliminating traffic fatalities and severe injuries among all road users (including people walking, biking, using transit, and driving) within a set time frame. This should include passage of a local policy that states clear goals, commits to
a timeline, identifies stakeholders, and demonstrates commitment to community engagement, transparency, and equitable outcomes.
/ Action plan – Vision Zero Action Plan (or strategy) is created within one year of initial commitment and is implemented with clear strategies, owners of each strategy, interim targets, timelines, and performance measures.
/ Multi-disciplinary leadership – An official Vision Zero task force is created and charged with leading the planning effort for Vision Zero. The task force should include, at minimum elected officials, community leaders, business owners, and department heads including Planning, Fire, Emergency Services, Public Works, District Attorney, Office of Senior Services, Disability, and the School District.
/ Equity – stakeholders commit to both an equitable approach to Vision Zero by establishing inclusive and representative processes, as well as equitable outcomes by setting measurable benchmarks to provide safe transportation options for all road users in all parts of the
city.
/ Cooperation and collaboration
– A commitment is made to encourage meaningful cooperation and collaboration among relevant governmental agencies and community stakeholders to establish a framework for multiple stakeholders to set shared goals and focus on coordination and accountability.
/ Systems-based approach – leaders commit to and prioritize a systemsbased approach to Vision Zero by focusing on the built environment and policies that influence behavior, as well as adopting messaging that emphasizes that these traffic losses are preventable.
/ Community engagement –The Vision Zero task force plans meaningful community engagement, such as public meetings, workshops, online surveys.
/ Data-driven – stakeholders commit to gather, analyze, utilize, and share reliable data to understand traffic safety issues and prioritize resources based on evidence of the greatest needs and impact.
/ Transparency – The process is transparent to stakeholders and the community, including regular updates on the progress on the Action Plan and performance measures, and a yearly report (at minimum) to the local governing board.
Source: https://visionzeronetwork.org/ about/vision-zero-network/
Bike & Pedestrian Plan and transportation plans are specialized transportation plan. Bike and pedestrian plans focus on bike and pedestrian connections throughout the community, whereas transportation plans focus on all modes of transportation and sometimes include bike and pedestrian systems as well. While these plans focus on the integration of multimodal options into the transportation systems, in the past, vision zero was not specifically discussed, but many of the principles might have been incorporated throughout.
Both types of plans use a systems-based approach. A systems based approach takes into account the needs of community, the existing conditions, the
strengths, the deficiencies, and develops recommendations and strategies based on a set of criteria like costs and safety in order to create the most efficient, safe, and best possible environment for all transportation users. Determining a strategy or strategies to implement will likely be data-driven choices based on traffic counts and reports of accidents. Talking with elected officials and directors of other departments, such as engineering, planning, and parks will also be of value in order to determine feasibility and what realistically would be a good approach. Gathering support from people in the community is also critical. Especially reaching out to underrepresented communities, including minority populations, lowincome households, the homeless, and those that don’t have access to transportation options are critical when creating plans as they are the ones who often have the greatest need.
Updating transportation and bike and pedestrian plans to incorporate the principles of vision zero will not alter the systems-based approach. As a community’s needs change over time, traffic patterns and development will alter infrastructure needs. Additionally, as roadway improvements occur, additional infrastructure improvements could be done at the same time. Vision
Zero’s safe systems approach allows communities to move beyond crash data and look forward to identifying what areas are potentially unsafe and try to prevent them before they happen. So things such as separated bike lanes incorporated into a road improvement, multi-use trails with an enhanced crosswalk to connect a neighborhood with a school, and adding lighting along a dark corridor are things that should be considered during the planning phase.
Resources
/ Local Transportation Plans
/ Local Bikeways/Walkways/Transit Plans
/ Regional Bike/Pedestrian Plans
Transit is a broad term used to cover bus, bus rapid transit, and light rail. Transit is another option to move people from one area of a community to another. The IMPO has documented a need in Central Indiana for mass transit and where it should be located. The MPO has conducted numerous studies working with a number of communities and local and regional partners on the effort. They have mapped out a strategy for implementation, sought legislation,
and secured funding to construct the redline to provide the first leg in Marion County. For other transit plans and how it connects to the larger transportation system and it can be incorporated into vision zero principles see the MPO’s website or the Central Indiana Transit Page.
Resources:
/ Regional Transit Plans
/ Central Indiana Transit Plan
The Highway Safety Improvement Plan helps states plan highway safety improvement projects using a performance-driven process, implement those projects, evaluate the effectiveness, and annually report on the status of the implementation efforts. Many communities have a state-owned highway that run through or adjacent to their community. Coordination with INDOT becomes critical in planning and addressing safety in the community. Incorporating recommendations for state owned roadway into a local plan can help to get the state to help make the changes
and infrastructure improvements to the portion or stretch of roadway that is in the community.
Resources:
/ Regional Roadway Plans
/ State Highway/Corridor Plans
/ INDOT HSIP Plan
A complete streets approach integrates people and place in the planning, design, and operation of the transportation network. Complete street ordinances ensure that streets are designed to allow all modes of transportation to provide safe, convenient, healthy, and equitable mobility options for all users of the road. The National Complete Streets Coalition promotes policies and practices that promote street design are safe for all road users regardless of mode of transportation, age, ability, race, or income. Therefore, complete
streets ordinances are policy component of vision zero which allows a lot of the design strategies to be incorporated into practice thru the ordinance.
There is no singular design prescription for a complete street. A complete street in a suburban area will be different than a rural community versus a suburban community. A complete street may have narrow travel lanes, wide sidewalks, an on-street bike lane, a special bus lane, and frequent and safe cross walks such as median islands, or accessible pedestrian signals. All these elements must be determined based on the transportation goals of the community, the available right-ofway, and the development character that is existing and that is desired in the future. Extra consideration should be given to vulnerable populations where basic facilities might be deteriorating, missing, or insufficient. Typically, its these vulnerable populations who rely on alternative modes of transportation to access work, healthcare, education, childcare, and shopping.
Resource: National Complete Streets Coalition
One of the principles behind vision zero is that death and severe injuries are unacceptable. People deserve a safe multi-modal system and it is the government’s responsibility to ensure that a safe environment is present and maintained. There are multiple factors within design that can influence people’s choices including modal options available, perceived safety, speed, and enforcement. Design guidelines and regulations are one way to help control a few of these factors.
Most streets are designed for vehicles and moving them from point a to point b in the most efficient, but safe manner. Pedestrians and cyclists are secondary to vehicles and oftentimes motorists become distracted which is what causes crashes. Other times, the design of the roadway, environmental conditions, or lack of experience, ability, or understanding of the transportation system also results in crashes. Sometimes, a motorist is traveling too fast because there is nothing within the roadway design that forces a motorist to stay at a safe speed for the roadway. In any of these cases, the transportation system should be designed to ensure
that resulting crashes do not result in people being killed or seriously injured.
Vision Zero is a shift in focusing on just education to change behavior and focusing on changing the systems that influence polices and the built environment – key factors which affect behavior and the choices users make. Federal, state, regional, and local agencies, planning public works and departments, and nonprofits like the National Complete Streets Coalition, Health By Design and others are starting developing design guidelines and regulations to standardize how mobility systems are designed and constructed to safely accommodate multiple modes.
Prior to developing any guidelines or regulations, it is best to develop policy that sets the basis for regulations. Public input, data and benchmarking is often needed to develop that policy. Other items in this section such as resolutions and long-term plans will help set the framework for the guidelines and regulations and ensure they are supported by elected officials, the public, and potentially a court of law.
Roadway design must prioritize
safety of all modes of transportation while considering site or system context, intended behavior, and the most physically vulnerable. Roadway design does encourage or discourage certain levels of speed. Traffic calming measures have shown to have an impact of reducing speed. So, while emergency vehicle access is necessary; wide, unobstructed streets encourage higher levels of speed and a comprise is needed to achieve the community’s safety goals.
The Vision Zero Streets Design Standard was developed by Transportation Alternatives based on solutions available in New York City Department of Transportation Street Design Manual. “It was developed to embody the Vision Zero principles while reducing motor vehicle traffic, increase accessibility, and protect the most vulnerable users of the street. To qualify as a Vision Zero Street, a design must achieve three core functions4:
/ Discourage speeding by design
/ Encourage waking, biking, and/or public transit use;
/ Provide accessibility to all, regardless of age or physical ability”
4 Vision Zero Streets website, July 7, 2020. https://www.visionzerostreets.org
Resources:
/ USDOT Complete Streets
/ Smart Growth America
/ National Association of City Transportation Officials
/ Global Street Design Guide
/ Designing Streets for Kids Guide
/ Fitzpatrick K, Carlson P, Brewer M, Wooldridge M. Design Factors that Affect Speed on Suburban Streets. Transportation Research Record: Journal of the Transportation Research Board 2000;1751:18–25.
https://safety.fhwa.dot.gov/ speedmgt/ref_mats/fhwasa09028/ resources/TRR1751-DesignFactors. pdf
/ Complete Streets: Best Policy and Implementation Practices summarizes successful policy and implementation practices based on the examination of 30 communities across the country.
/ Complete Streets in the Southeast: A Tool Kit, a partnership between AARP Government Affairs, Smart Growth America, and the National
Complete Streets Coalition, is a how-to guide for implementing Complete Streets.
Data collection is important to gauging trends of roads and determining solutions to problems that are be occurring. Data collection can help identify potential solutions based on the amount of traffic on a roadway, the context of the area, or the types of crashes. Vision zero is about a data driven process to reduce deaths and severe injuries to zero. Without data and benchmarks to assess what is working and what isn’t, some efforts would be futile.
Elected officials should be the ones to set the commitment to data collection when making the commitment to Vision Zero. Data provides the only fact-based evidence to understand whether a tactic or strategy is truly working. It is important to remember that all information regarding crashes should be recorded – not just vehicle crash data. The
surrounding area context plays a large role in why accidents might be occurring more frequently, even if traffic volumes are not high. Weather could also play a factor. Therefore, it’s so important to document this information to determine if it was truly human error, environmental, or a design flaw.
Additional information can be found in the Data Collection and Benchmarking handout here
Education is the best way to increase awareness and change behaviors. Although the educational aspect relies on individuals to become more aware of their surroundings and adopt safe practices into their day-to-day lives, education can begin at young ages and continue throughout life.
Continued education over time can have a longer lasting effect and reduce crash rates. It is important that education is not just “car” specific. Walking and bicycling and encouraging different safety tactics such as wearing a helmet or looking both ways before crossing the street is important to teach people, especially at a young age. There are numerous
organizations that have developed safety programs to incorporate lessons into activities at school. Some of tactics include:
/ At school for children and teenagers to learn about safety
/ Making a roadway safety class part of school curriculum
/ Providing teachers with proper training (in schools and driver’s education)
/ Offer parents information to reinforce ideas in their homes
/ Parents leading by example when children are around
/ Providing supervision at crossings and other necessary locations
/ Pedestrian skill training sessions open to the public
/ Education that continues throughout all primary and secondary education
National Highway Traffic Safety Administration
This site contains a number of great facts and statistics that can be used
to educate the public. There is a video about safely walking in a community that is for all ages. There is also 10 Walking Safety Tips that can be put on a laminated card to hand out at “Night’s Out” events. 9 Driving Safety Tips that law enforcement could use when issuing a warning citation to remind drivers of some of the dangers of driving. There are also walkability checklists, how to create walkable communities, how to be a safety advocate and so much more.
Besides creating a plan or adopting a resolution, some communities may decide to become a recognized Vision Zero Community. According to the Vision Zero website, there are criteria that need to be met in order to become a recognized community with a Vision Zero Action Plan or Strategy:
/ Community sets a clear goal of eliminating traffic deaths and serious injuries among all road user within a set time frame.
/ Publicly, the Mayor or legislative
body, officially commits to Vision Zero within a set time frame and directs appropriate city staff to prioritize the work.
/ A Vision Zero Action Plan/Strategy is adopted, or the legislative body has committed to creating one in a set time frame and it will focus on being data driven, equitable, and include a process for community input.
/ Key Community Departments, such as public works, planning, public health, and law enforcement, are actively engaged as leaders and partners in the process to develop the Vision Zero Plan, implementing it, and evaluating and sharing progress.
/ A Vision Zero Task Force, including the agencies listed above, as well as community leaders, nonprofits, and stakeholders meet regularly to lead and evaluate efforts.
The laws established by the legislative body are only effective if the people using the roadways believe there are consequences associated with breaking
them. Motorists, cyclists, and pedestrians alike should have an understanding of the laws and the repercussions of breaking them. There are two twos of deterrence, general and specific. General deterrence occurs when users obey the rules of the road because they perceive that there is a significant risk of being caught and penalized if they do not follow the rules. Specific deterrence occurs which users break the rules of road and is punished and stops breaking the rules because of the punishment. So, the punishment itself was the deterrence and not the rules themself. Most police departments want general deterrence because they do not have the resources to have officers on the road all the time to catch motorists breaking the law. To promote general deterrence through enforcement police should focus on:
/ publicizing events where officers will be on the roads to look for violations to ticket
/ have a quiet campaign that Is unpredictable and difficult for motorist to avoid (i.e. dui checkpoint)
/ a mix of highly visible and less visible activities
/ continued over a long duration
A part of enforcement, however, must be education. Enforcement influences behavior. Therefore, if drivers are being punished for their actions there should be a component of education that will focus on bringing about awareness of the impact of the behavior not only in that immediate instant, the enforcement, but afterward in the follow up, the education. This cannot be just for the motorist who disobeyed the law, but for those who were with the motorist.
Enforcement is a necessary part of roadway safety; however, officers cannot be present on every roadway or intersection. Because of this, police should work with the engineering department and focus on those intersections or roadways that have a higher incident of crashes, tickets, and complaints for speeding. Police could focus their attention and resources to have a greater impact and improve awareness and safety. Typical enforcement actions for police to target include:
/ blood alcohol limits
/ speed limits
/ disobeying traffic signals or signs
/ hands free
/ seatbelt use
/ helmet wearing
/ driver license expiration/plate expiration
/ vehicle roadworthiness
Crashes occurs for several reasons including poorly designed roads, distractions in the vehicle, or weather conditions. Lack of enforcement could be also be a factor. Even if a person is ticketed for speeding, it doesn’t have a lasting effect, and there is a likelihood that a person could speed again and just not be caught. Police officers hope that when they issue a ticket or a warning that a driver will slow down and obey the law.
Sometimes, increasing the fines for a weekend for speeding in a section of road is a great way of working towards encouraging people to pay more attention and obey the law.
Likewise, sometimes rewarding people for obeying the law can also create awareness and force others to change
their behavior. Once such situation occurred in Seattle. A police officer was about to retire, and he decided to give drivers who stops to let people cross in the cross walk a $10 gift card from a local restaurant. In one hour, 34 people were rewarded for their behavior and three years later it became part of Seattle’s Vision Zero initiative where this program was targeted for several different locations including an elementary school, a busy bridge crossing, and a bike lane downtown.
Increasing penalties means increasing enforcement. Most police departments do not have the resources to station police offices or safety officials at key intersections or known “speed” zones. Many communities have turned to technology to automate that function, but it has not been without controversy.
Many communities have placed automatic speed signs that tell a user how fast they are driving through a neighborhood. This hope is that this device will deter drivers from speeding through the neighborhood when they realize how fast 30 miles per hour really is. Other communities are thinking about automated speed enforcement implementation. The City and County
of San Francisco conducted a survey in 2015 of cities from around the country and reported the findings and lessons learned in this document here.
For many communities though, the most important lesson for any penalty whether it be from a police officer, through technology, a penalty or reward, engaging the public early and educating them about the options are key to the success of any safety program.
Funding for any infrastructure project is a major hurdle in any community, let alone for the enforcement of laws. Public agencies prioritize funding resources based on a variety of criteria including cost, safety, available funding, location of project, complexity, etc. Identifying yet another plan to create can oftentimes lead to lack of support even though principals like vision zero are critically important.
Education and creativity are critically important as well as funding to bring about the support of elected officials in the implementation of vision zero tactics and strategies. Whether it is creating a plan, or incorporating principals and
goals into an existing plan (see Section on Plans) flexibility on the part of professional engineers, planners, public health officials, and community activists will be needed to think outside the box to figure out ways to fund vision zero projects.
While vision zero has historically been approached as a transportation led endeavor, linkages to public health have been critical. In some cities, such as New York, San Francisco, and Chicago, vision zero has been identified as a public health crisis since it is the leading cause of death. While the purpose of this was to complete more research, it can also be used to secure funding to make improvements where that research can be linked directly to health issues, especially in underserved communities.
Private-public partnerships are also encouraged for both vision zero initiatives for things like creating a plan, enforcement, or public outreach or for specific countermeasures and working with a developer to change a design to be more pedestrian friendly. This could be a win-win situation where an area of the community becomes more accessible and pedestrian friendly and the developer achieves a higher return on the investment because the process was quicker, property values increased, and
the community supported the project. Other design elements to consider include streetscape enhancements, providing shared parking, bike parking, transit stops, or adding sidewalks/multiuse trails in a place where none exists is something that local governments should explore as opportunities arise. Even if the time is not right to develop the improvement at the time, setting the funds aside (called fees in lieu of) is an opportunity to make the improvement in the future.
Funding can come from many different sources the community’s general fund, specialized funds like Tax Increment Financing Districts (TIF), Local Option Income Taxes (LOIT), state and federal funding such as grants and low interest loans, and community nonprofit grants such as community foundations, banks, major employers. For many of these funding sources some type of plan is needed that shows future improvements. Having a dedicated fund for different implementation strategies, specifically related to transportation, and linked to a capital improvements plan is also very beneficial for a community.
There are numerous opportunities for a community to take advantage of, but what
is required is for someone to research these opportunities. Some state and federal dollars and already allocated through the MPO, which is prioritized and allocated through the MPO’s Long Range Transportation Plan and Indianapolis Regional Transportation Improvement Program . Many of the state, federal, and community grants have numerous requirements that must be met. Some might have a dollar amount match, some might be only construction, some might focus on a specific aspect such as sustainability or children and schools, and there could be a time frame under which the funds must be used. In some case, grants could be paired with one another to be used as a match. The fine print must be read carefully!

Implementation strategies as tools to improve the safety and experience of all users in a community.
There are multiple strategies which effectively reduce the incidence of crashes within a community. This section will identify different issues and problems that may be occurring within the community and provide ways of addressing them with designbased solutions.
Note: While there are multiple solutions, no one strategy is a correct or definitive solution, and work best partnered with at least one or more additional strategies to be the most effective in achieving the goal(s) set for you community.
Countermeasures should be thought out prior to the implementation of them. These changes are usually the result of data analysis as discussed in the previous section.
Countermeasures should be thought out prior to the implementation of them. This can be done through temporary installations to test and see if the countermeasure is effective, or it can be done through data interpretation to determine what the best approach for installing countermeasures is. While not all countermeasures can be temporary depending on scale, location, and the countermeasure strategy, design elements can be implemented at various levels. This means that, after analysis of a site or data as a whole, local officials must determine the
best countermeasure(s) for either one specific site, a few sites, or sites across a whole community.
These are broken down into various approaches:
/ Site Specific: Deploy countermeasure at one problematic location
/ Systemic: Deploy countermeasures at locations with the greatest risk
/ Systematic: Deploy countermeasures at all locations
Each approach is completely dependent on the situation a community is facing. Updating signage is something that would likely be done community wide, while installing a round-a-bout would be more site specific.
A design strategies matrix will help to determine various approaches for what conditions are most appropriate to use them, as well as a cost category, if it can be a temporary installation, and how it can be best implemented with each of the approaches listed above.
Determining risk factors will be done through analysis of data primarily but can be done using a visual audit as well. A visual audit is when a person or group of people go and examine an area, stretch of road, and/or intersection where a crash or accident happened. The person or group is then to determine if there were any factors that may have contributed to the crash or accident such as a covered stop sign, lack of road signage, low visibility of a curve, faded lines on the roadway, etc. This information is then recorded through pictures and notes, and eventually corrected in the near future.
Data analysis of crash data is specifically important as crashes may be specific to current road conditions such as wet pavement. This might call for additional measures to be taken to increase road traction, or even evaluate how water is draining in the area to know how to best approach the problem.
The matrix has been organized by the type of physical design strategies and problems they are most effective in combating. This does not mean that strategies will not overlap or be the same when looking at various modes of transportation. Most strategies will work towards creating a safer environment for all types of transportation and not be specific to just one mode. Additionally, the design strategies will be most effective when partnered with another strategy or even policy.
Along the top axis, you can find the conditions for which a crash happened. Each of the conditions will try to best align with the design strategies that are countermeasures to reduce the chances of crashes happening again.
Additional information involving the design strategies, including cost and how to best administer them within a community are addressed. The matrix focuses on where the countermeasures are most applicable as well, if it best used in a rural or urban setting, or a highway strategy.
For more information regarding pedestrian and bicyclist safety countermeasures, click here.
Temporary Approach: countermeasures that can be “tested” to determine success before finalizing the change (with various exceptions)
Systematic Approach: countermeasures are implemented at all locations (across the community)
Systemic Approach: countermeasures are implemented at locations with the greatest risk (specific locations within the community)
Site Specific Approach: countermeasures are implemented based on crash data that supports continual crashes at one specific site that needs to be addressed (one location within the community)
Cost is determined based on one installation (i.e. one round-a-bout, one shareduse path, one crosswalk, etc.) and is further explained in each countermeasure section.
Low-cost ($0-$99,999)
Medium cost ($100,000 - $499,999)
High cost ($500,000 and up)
Range of costs (depending on level of implementation)
This page intentionally left blank.

Reducing the posted speed limit will work to potentially slow down motorists’ speeds which will increase safety and decrease crashes.
Lowering the posted speed limit ideally will encourage people to drive more slowly. This is a low-impact and cost-effective approach; however, reducing the posted speed limit alone likely will not have much effect on the safety of the road for all users. Speeds traveled are based on the driver’s perception of the road and surrounding environment. Therefore, a combination of smart street design and the reduction of speed limits is the best approach and will yield the best results.
Pairing this strategy with others that include road dieting, or the addition of detailing or speed bumps would likely make this a more successful approach. Keeping speed limits within reason is also important. Residential roads, narrow roads, and areas with more development along the sides of streets would be better for a lower posted speed limit. Areas that are more rural and have wider lanes make sense for a higher posted speed limit.
Speed limits are often subject to change based on studies and redefined based on the 85th percentile (speed) that drivers are found driving. This is called “prevailing speed” and is the major consideration for setting speed limits because it is the “safest” speed that 85 percent of drivers are driving. Speed limits should be adjusted based on the majority of what drivers are driving down a corridor or within a defined stretch of road.
Source disclaimer - the article by SEHInc no longer seems to be available but additional information about speed limits is available. A short article with discussion points on the original source article can be found here. One additional source to view about speed limits with similar information can be found here
Although decreasing speed limits might not be the best strategy to implement first, it should be noted that adjusting the speed limit based on other changes should be done after road design and traffic calming techniques are implemented. This is still a useful tactic when trying to discourage slower driving speeds where they do not make sense and prevent significant speeding in areas (highways mainly).
Using this strategy alone likely will not have much of a lasting effect at creating a safer environment for pedestrians, bicyclists, and drivers. Motorists drive speeds they feel comfortable and safe with depending on the design of the road. Ultimately, posting a lowered speed limit sign will not have a lasting effect that keeps speeding at bay. Instead, the likelihood of traveled speeds remaining the same without other action is greater than if the physical design of the road was changed in some manner.
It is important to note that drastically changing the speed limits more than five miles per hour could cause more harm than do good. Engineers set speed limits on roads that make sense for the road and surrounding context itself. There are different classifications of roadways which determine the likelihood of a higher or lower posted speed limit – often determined by the amount of access points and chances of pedestrians and bicyclists being present. Arterial roads have higher speed limits and fewer access points (on and off ramps to a highway), collector roads which can have higher speeds but more access points (country roads), and local roads which have lower speed limits but high access points (neighborhood streets with driveways and downtowns). Speed limits realistically should only be set at five miles per hour (mph) below what is recommended by an engineer. It is possible that decreasing a posted speed limit more than the recommended five mph might lead to an increase in traffic crashes.

Low-cost
Boston, Massachusetts lowered their city street speed limits by just 5 mph in January 2017. Throughout that time, Boston advertised this change through social media and other traditional media outlets.

Boston looked at the vehicles that exceeded the speed limits at 25, 30, and 35 mph and evaluated the odds associated with the new posted speed limit of 25 mph. Researchers found that the odds of drivers exceeding the multiple speeds decreased, with the largest being in drivers who drove over 35 mph. Drivers who drove over 35 mph dropped 29.3%, those who exceeded 30 mph decreased 8.5%, and those who drove over 25 mph fell only 2.9%.
What this study did not evaluate was the crash reports in Boston after the reduction of speed, which is the next step. However, higher travel speeds are likely to increase the risk of injuries or death when a crash occurs. This happens because the faster a car is moving, the less reaction time a driver has. Reducing the speed limit allows for a longer reaction time and can reduce the severity of a crash when it does happen. Click here for the full article.
Adding sidewalks throughout a neighborhood, downtown, or community provides a safe and equitable way to get from place to place without being in the direct line of traffic.


Sidewalks help to create a safe path for people to walk along that keeps them separated from motorized traffic. Around 4,500 pedestrians are killed in traffic crashes with motor vehicles a year in the United States. Of these, eight percent are caused from pedestrians walking along the roadway and can be prevented. By providing sidewalks or walkways that are separated from the travel lanes, these fatalities could be reduced by 88 percent. Roadways without sidewalks are more than twice as likely to have pedestrian crashes than at sites with sidewalks on both sides of the street. Creating sidewalks also allows for pedestrians to be comfortable while out walking along a street. By removing pedestrians from the travel lanes, traffic flow is increased.
Sidewalks can increase the health of a community. Pedestrians will start to feel like their needs are being met along a roadway, and potentially begin to encourage more people to get out and walk from place to place. People often will begin to use sidewalks when they are provided, and it serves as a source of exercise which helps aid in increased physical and mental wellbeing. Sidewalks paired with public transit also increases the transportation options a person can use; especially if a car is not available.
Today, it is normal to see neighborhoods without sidewalks. This is partly due to the change in development out in the suburbs and going from an urban environment to a suburban environment. The idea was that people who moved to these suburbs did not have amenities nearby, and therefore would drive to wherever they needed. Sidewalks were not developed because of the idea that the cost and maintenance of them would not be cost effective and people would never need to use them. However, statistically it has been proven that pedestrian-motorist crashes are more than twice as likely to occur in places without sidewalks; this includes neighborhood roads.
Many people who moved out to the suburbs were wanting to escape the urban feel, and so sidewalks were opposed because it was “too urban” for a place that residents wanted to keep “rural.” Other arguments include people don’t walk so they won’t be used, losing yard space for the installation of sidewalks, constant maintenance especially during the winter season, and that sidewalks can be a detracting factor in a neighborhood and decrease property values.
Despite these reasons that residents might be opposed to having sidewalks in neighborhoods, it is proven that people with access to sidewalks are more likely to be active because they have access to the amenity. Also, a residential property with a sidewalk and even street trees are likely to sell for more and faster because they increase property values, not decrease them. Sidewalks usually are not installed on private property unless the owner of the land wants to install them personally. Many sidewalks are installed in the right-of-way that is owned publicly, therefore the owner is not losing their property to a public use for all to use.
Sidewalks not only benefit the value of a home, but also retail properties. Retail properties with access to sidewalks will usually see and increase in their net operating income because of access (more walkable properties).
Sidewalks are more for the public benefit and equity of providing all users with a safe route to get from place to place. In areas without sidewalks, pedestrians are not a priority and are discouraged from walking there. Additionally, safety is a big concern because when vehicles are driving down the street, the person must move out of the way but may not have a safe place to move to.
Providing sidewalks will often result in the use of them because they provide a perception of safety for users. People gravitate towards areas with sidewalks because of this perception. Despite common arguments for not wanting sidewalks, the added benefit of them greatly outweighs the arguments and creates a more livable community. To learn more about common misconceptions about sidewalks, please click here.
Low-cost
It should be noted that sidewalks are more expensive to install as a standalone project as opposed to included with a road construction project that is larger in scale. Projects can be combined into one large one too which can work in conjunction with other jurisdictions or localities and prices will decrease.
To reduce the lane width and encourage drivers to slow down. To reduce the number of lanes along a stretch of road to allow for multiple transportation opportunities.

Road diets are something that have been an increasing strategy for towns and cities to adopt. They focus on the idea of removing a lane or lanes and using that space for other purposes. One way of doing this is to reduce lane width. Historically, lane width has been wider to accommodate faster travel speeds as well as to provide a space for loading and unloading. To combat this, research has found that lanes as little as 9-feet wide do not restrict traffic flow and encourage people to drive slower because of the close proximity to other cars. Reducing the number of lanes in general is also part of road dieting where the lane(s) would ideally be used for another use. This could be used for the widening of sidewalks, creation of a dedicated public transit lane, or even putting in protected bike lanes.
The most popular road diet adaption is to reduce four-lane roads down to three-lanes, with a center turn lane and one lane in either direction.
One common reason for not implementing road diets is that they can lead to congested roads. Traditionally, decreasing a two-lane road into a one-lane road with any number of modifications from the expansion of sidewalks, creation of a bike lane on either side, or even a center turn lane creates a more restricted environment for drivers. In an article from 2015, one city in Florida (Gainesville) decided to reverse their road diet. After a trial run with the lane reduction, it was decided that the road diet caused more problems for drivers in reality than originally predicted and the added amenities were not used to their full potential the way the city had hoped it would be. To read the article, click here.
Another common reason to not implement a road diet is that they can lead to residential roads being used as a pass-through or cutthrough for drivers. Neighborhood roads often are not designed to handle high levels of driving (meaning they do not see the same traffic patterns as a major roadway does). Neighborhood roads are not able to withstand the constant wear-and-tear of higher traveled and reinforced collector and arterial streets making it expensive to fix in the long term.
Despite this, studies of road diet projects have found that reducing the number of lanes decreases vehicle crashes from 19-52 percent. Speeds are often decreased because of the environment and road dieting often does not reduce the limit of drivers who can use the roadway. By taking away the left-hand lane, drivers cannot take on a mindset of “driving faster” to get around people and tend to drive safer based on the immediate change of the environment.
Additionally, road diets are most commonly applied to streets that are not facing a “capacity” issue. Therefore, implementation will not create congestion on the road or increased traffic for local and neighborhood roads. They can encourage multi-modal use by providing a safe space for bicyclists to use to roadway without having to be in a driving lane.
Road diets do not work in all situations and studying the traffic counts and patterns should be done prior to implementation. Restriping the road for a trail run, similar to what was done in Gainesville, Florida, can be good in the interim to determine if it should become a permanent installation. This is a cost-effective way to study driver habits on the roadway.
Low-cost
Road dieting for a four to three-lane conversion can cost around $46,000.
Surface Transportation Program (STP)
Highway Safety Improvement Program (HSIP)
Others that could be a part of funding include: sources such as pedestrian and bicycle programs and transit grants and Safe Routes to School grants for Road Diet installations

Genesee County, Michigan adopted a Complete Streets program in 2009 which promoted road diets. The Genesee County Metropolitan Planning Commission assessed every 4-lane road in its jurisdiction to convert them to 3 lanes. They started by working on roads that saw lower volumes of traffic per day (6,0008,000 vehicles) and worked their way up to roads that saw 15,000 vehicles per day.
Overall from 1996-2007, Genesee County saw a decrease in crashes where road diets were implemented.

Where traditional speed limit reduction might not be the most effective, the introduction of speed bumps or humps signify and cause driver speed reduction because of the introduction of an upcoming obstacle in the roadway.

Speed bumps are a form of traffic slowing infrastructure intended for slower speed limit area. They are more aggressive than speed humps causing a higher decrease in traffic speeds. They are suited more for parking lots and driveways. They can be anywhere from 2 to 4 inches high and have a much shorter travel distance than speed humps, making them more abrupt and resulting in more of a “bounce” when the vehicle drivers over it. Unfortunately, taking speed bumps too fast can cause damage to a vehicle which makes it critical that people slow down. These bumps can reduce speeds from 2 to 10 miles per hour. Signage should accompany speed bumps to alert drivers of the upcoming obstacle.
Speed humps are similar to speed bumps, varying only slightly. They are used in pedestrian zones on local or collector roads and usually found around playgrounds and in school zones (neighborhoods as well) where excessive speeds will harm
pedestrians. Unlike speed bumps, speed humps are less abrupt and usually placed in a series along a corridor to maintain slower speeds. They are anywhere from 3-4 inches high (at the pinnacle point) and 12-14 feet wide, with a ramp length of 3-6 feet (circular top). These humps can reduce driver speeds from 15-20 mph. Signage should accompany a speed bump when constructed to warn drivers of the obstacle that they are approaching.
Speed bumps/humps might not be the best investment depending on the location. Speed bumps/humps can make things difficult for people parking on streets, street cleaners, and plows during the winter. They also might cause problems for emergency vehicles (firetrucks and ambulances) and their response times. The introduction of speed bumps/humps could divert traffic to another street, causing the existing problem to move instead of being solved. The cost of continued maintenance might not be the most effective use of funds either because of the constant wearand-tear of drivers having to encounter them. Drivers might try to avoid the obstacle all together, thereby rendering the bump/hump ineffective (spacing).
They can however be used as a temporary installment as a measure for working to reduce speeds. Unfortunately, it might take a period of conditioning individuals to drive slower speeds (depending on the location) which could be counterproductive in the long run. The removal of a speed bump/hump can also be expensive which could prevent the installation of one or more from ever being considered.
Low-cost
Speed bumps and speed tables cost on average $2,500 (ranging from $1,000 to $6,900 depending on size, materials, design, and drainage conditions).

Where traditional speed limit reduction might not be the most effective, the introduction of speed tables/raised crosswalks signify and cause driver speed reduction because of the introduction of an obstacle the driver must interact with.
Raised crosswalks or speed tables are similar to speed bumps in that they are both elevated a few inches above the pavement to reduce driver speed. But unlike speed bumps, they raise the whole vehicle and are flat-topped, often longer than speed bumps, and are more suitable for higher speed areas. Typically, these crosswalks are 3-3.5 inches high, 22 feet in length, and are located in areas with speed limits ranging from 25-45 mph. They can be used as a raised midblock crossing; which allows for safer pedestrian crossing in the middle of a roadway. These developments can be found near schools, parks, smaller commercial corridor sections, and other similar destinations.
Signage should accompany a raised crosswalk to warn drivers of the sudden height change, as well as to warn them to be on the lookout for pedestrians. These crosswalks should be installed in areas where there is a significant pattern of pedestrian street crossing (i.e. the middle of a block with development on both sides). Crosswalks can be designed with pavers or other distinctive materials that help define the crosswalk. Speed tables
are designed to increase driver awareness of pedestrians, and make drivers slow down more than if they were approaching a speed hump.
Strategies to consider when introducing a new crosswalk include a setback to allow drivers a longer reaction/slow down time to avoid collision with a pedestrian and adding some type of reflectors or lights to increase visibility in the evening. Medians and safety islands could also be built in to create a safer crossing.
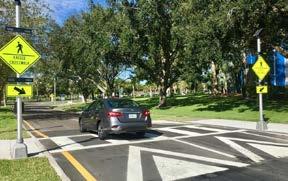
Speed tables do not always work in certain locations. They should never be installed on a sharp curve, coordination between operators of emergency services and public transit should be done, drainage problems might occur due to the installation of them depending on the location, they can increase noise from trucks, and they can be expensive to maintain.
To learn more about raised crosswalks and possible conflicts, click here.
A short report, Do Speed Tables Improve Safety?, by W. Martin Bretherton Jr., P.E., illustrates a study from 2003 which observed 43 speed tables installed in 1994 and 1995 in Gwinnett County, Georgia. The data collected analyzed crash data from two years before and after the 1994 installations and three years before and after the 1995 installations. Although the study did not look at crash rates, it was concluded that crashes tend to be irregular making it hard to determine if speed tables actually helped decrease crash rates or increased the chances of them happening.
Low-cost
Speed bumps and speed tables cost on average $2,500 (ranging from $1,000 to $6,900 depending on size, materials, design, and drainage conditions).
A neighborhood in Naples, Florida was experiencing a high use of their residential roads and speeding. Located near the coast, Seventh Avenue traditionally experienced high traffic and speeding because of people who used their neighborhood as a cut-through to get to the beach. Before any measures were taken to reduce speed, average driver speed was 33 mph and they had approximately 8,000 vehicles through per day. The residents of 7th Ave. went to the City, a traffic study was conducted, and applied multiple strategies to slow traffic including medians, landscaping, and a speed table. After the improvements, another study was done which determined that the traffic count reduced from 8,000 to 5,000 vehicles per day and average speed dropped from 33 mph to 22 mph.
To bring to the driver’s attention the speed they are driving comparative to the posted speed limit along the road.
Speed monitors are useful in areas where it is important to direct a driver’s attention to the speed they are driving. These are more likely to be found near schools where drivers should be more cautious of children and teenagers crossing the street. Other areas might include construction sites and zones, college campuses, and busy residential roads. Some speed monitors are solar powered which means less electrical use.
One benefit of them is that they can be used in place of speed bump and humps as a traffic calming measure. This is beneficial because snowplows and emergency services don’t have to look out for a physical obstacle. However, while speed monitors are a proven method for slowing traffic speeds, they might not always have the desired speed reduction that a physical traffic calming measure would result in.
There are not many, if any, problems associated with this strategy. Speed monitors usually are not mobile, which makes installation of them permanent in an area. Studies have show that slowing traffic down with reduce the chances of a fatal accident from occurring. Radar signs/speed monitors are a proven traffic calming measure which raises awareness of the speed a driver is going. Studies have repeatedly shown that when a radar sign is present, speeders will slow down up to 80% of the time. Typical average speed reductions are seen from anywhere to 10-20%, and compliance with the posted speed limit will increase anywhere from 30-60%. To learn more, click here.
Low-cost
Cost between $2,500-$7,000 depending on the type/style. On average for roadside installation, each monitor costs between $2,500-$3,500.
Bellevue, Washington installed 31 stationary radar signs as of January 2009. They had a budget of $50,000 to devote to traffic safety technologies and decided that the use of stationary radar signs would be a good opportunity for investment. The City relied on police enforcement to address speeding issues and concerns on streets that did not qualify for other traffic calming measures. These streets were primarily arterial with a posted speed of 30 mph or saw traffic volumes of greater than 3,000 vehicles per day. Speed radars were installed in these areas and began to expand to other streets that did not meet either of these criteria and could accommodate for other traffic calming techniques.
Three studies were done to determine the effectiveness over time. The first study was done for all 31 existing radar signs after having been installed from 1 – 3 years. Several locations showed little speed reductions during the first installation, and one even showed an increase in speeds. The second study focused on 22 located where signs had been in place for two or more years. These studies showed an increase in the effectiveness of the signs. It should be noted that some of the speed radars were replaced or repaired if they were not working well. The third study was done for ten locations where the radar signs had been there for six or more years. During this study, the radars showed an increase in effectiveness and have not lost effectiveness over time.
This study shows that motorists are starting to correct their driving habits and speeds when necessary. The public perception also remains positive with growing requests for new installations of these radar signs. The City has put funding aside in anticipation for repairs and replacements or upgrades for each sign every seven years.

To provide a safe area for pedestrians when crossing the road, to help manage left-hand turning pocket with narrower or fewer lanes, and to provide space for landscaping.
Similar to pedestrian safety islands, roadway medians usually reside in the middle of a roadway and can serve as pedestrian refuge. Medians are used for the narrowing of roads and provide a place for landscaping which can help reduce the speed of drivers. There are a few ways to design medians:
/ A painted median flush with the road surface, with little to no construction; or
/ A raised median, which is a higher cost; or
/ A depressed median, which is a higher cost.
Medians are likely to be the most useful on high volume, high speed roads as opposed to lower speed roads. Medians should not replace potentially better solutions such as wider sidewalks, bicycle lanes, buffer strips, and on-street parking depending on the areas that are having problems that need to be addressed. To learn more, click here.
Where no median is present, islands can be used as a measure to narrow the roadway. These work well in mid-block locations or neighborhood entrances as well.
Studies have found that medians are a proven countermeasure of keeping pedestrians safe and reducing the likelihood of a crash.
Implementation issues that might occur are:
/ Median barriers can restrict traffic flow if a vehicle breaks down;
/ Can restrict access for emergency vehicles;
/ Potential dangerous pedestrian activity in the middle of the roadways;
/ Ends of medians must be well designed or could be a potential safety hazard; and
/ Signage must be visible to prevent drivers from driving on the wrong side of the median barrier.
The cost for adding a raised median is approximately $15,000 to $30,000 per 100 feet, depending on the design, site conditions, and whether the median can be added as part of a utility improvement or other street construction project.
Luten Avenue in Staten Island, New York wanted to address some safety concerns along the street. The New York City Department of Transportation wanted to implement a road diet by reducing the 4-lane roadway to a 2-lane roadway with a center median and parking lanes. Due to the location of this road, it did experience heavy pedestrian activity and some access to residential areas.
The goal of this road diet was to reduce speeds of vehicles driving by because of a fatal accident with a student. Using information, the NYCDOT was able to narrow the road from 2 lanes down to one with a painted center median and parking lanes.
Studies have shown that after the road diet, vehicles exceeding the speed limit decreased by 34% southbound and 21% northbound along Luten Avenue.


Create pedestrian refuges to provide a safer means of crossing high-traffic streets. These are seen on some two-lane roads, but usually on three or more lane roads where higher speeds discourage a pedestrian and bicyclist friendly environment.
Pedestrian safety islands reduce the amount of time a pedestrian or bicyclist will spend in an intersection. They can be used on wide or narrow roads but are implemented in areas where high traffic volume and speed make crossing difficult or unsafe. They should be at least 6 feet wide, but larger is better if the location allows for it. The cut-through or ramp of a pedestrian safety island should also be the same width of the crosswalk (or smaller if it cannot be the same). An extension past the crosswalk is also preferable since it acts as a “protective obstacle” for people on the island. Additional features can include curbs, bollards, reflectors, etc. Landscaping would require additional maintenance to ensure driver and pedestrian visibility.
Where there are intersections which are unsafe or have underused spaces, a curb could be extended to fill the underused space creating opportunities for a plaza or other pedestrian oriented space. This extension often realigns roadways and intersections increasing safety for all roadway users. Crosswalks and other bicycle and pedestrian facilities should be reconstructed and striped. The construction of this extended curb can often shorten distance for pedestrian crossings, creates right angle intersections, reduces roadway pavement, and establishes a new space which nearby businesses or the city may utilize.
Pedestrian safety islands are beneficial for pedestrians who need to cross roads that might not have a signalized crosswalk, is a wide intersection, or helps people who might not be able to cross a street within the time before the signal changes for drivers. With that being said, common issues with pedestrian safety islands are that they need to be visible during all points in the day and evening. This is both important for the safety of the pedestrian or bicyclist but also for the driver to avoid potential damage to their vehicle.
They should also only be installed in intersections that see a high demand for pedestrian and bicyclist crossing. They also should not narrow lanes too much especially where cyclists might be present. It is important to account for potential problems that might occur like turning patterns. When designing pedestrian safety islands, it is important to account for people who might have disabilities or are mobility impaired. Certain design features will need to be included in order to accommodate for the blind or are in wheelchairs (as well as providing enough room to maneuver through the island).
Low-cost to medium cost
Specifically, for crossing islands alone - costs ranging from $6,000 to $9,000. If raised and with landscaping, it can be anywhere from $10,000 to $30,000. Materials used also cause the cost to vary.
In New York City, Adam Clayton Powell Jr. Boulevard was historically known for being a dangerous street to cross. High speeds and traffic volume paired with the 100-foot right-of-way discouraged people to cross the street because of the fear of getting hit. The right-of-way had three lanes in either direction (12 feet wide), a 9-foot parking lane on either side, and a 10-foot median island.
A study of one section showed prior to any project implementation that 62% of drivers exceeded the 30 mph posted speed limit, with speeds reaching as high as 52 mph. Due to an increase in driverpedestrian related collisions and fatalities, NYC Department of Transportation (DOT) looked into where these accidents were occurring and trying to find a way to combat the problem.
Part of the redesign of the road involved trying to find a way to shorten the distance pedestrians had to walk to cross the street. One of the strategies implemented was to preserve the 10-foot median but widen it at the intersections to shorten the crossing distance. Previously, the median stopped short of the crosswalks, but the redesign extended the medians into the crosswalk with an addition 8-foot width on one or both sides. This means the median increased from 10 feet to either 18 or 26 feet total near the crosswalks and allows for a larger safety barrier for pedestrians.

Restriping (repainting) lines in the roadways, adding reflectors, and adding rumble strips will help increase driver visibility and awareness of where they are within a travel lane and potentially prevent drive-offs and collisions with others.


Restriping (repainting) road markings, adding road surface reflectors, and adding rumble strips are all effective measures for drivers that can increase awareness of their location in the travel lane. Road markings are a continuous source of information for drivers. Without proper designation, crashes can occur because of a lack of visibility or knowledge of the edge of a road causing a drive-off or collisions with other cars from driving over the center line or when a T-intersection or cross road is not properly signified based on road markings. This is especially dangerous in the evening hours where sunlight is limited or nonexistent and on country roads or even highways.
/ Restriping lines with reflective paint will help increase both visibility and driver awareness of their location in the travel lane.
/ Adding reflectors within a center line or even to use as dividers of lanes on a multi-lane road helps the driver to be aware especially if paint has faded. They are durable and longer lasting than reflective paint. They can be used in multiple different places and even programmed for uses such as a flashing signal for pedestrian crosswalks in roadways or when approaching curves.
/ Rumble strips are particularly useful along higher speed roads with shoulders. This allows for drivers to know if they are not within the travel lane by “rumbling” their vehicle to alert them of their location.
These strategies work for all road types. Rural roads likely would see much more benefit from painting lines with reflective paint to note the edges of the roadway rather than having rumble strips implemented because they are less likely to have a paved shoulder (if any shoulder) attached to the edges). This should not discourage future development, however, of roadways and instead serve as a measure for increasing visibility along roadways that have minimal lighting and low visibility.
These all work in tandem with each other and other strategies within this section.
Benefits of restriping and adding reflectors are that they don’t prohibit or cause conflicts with emergency services. Unlike other physical barriers, these measures can be driven over and not cause delay. There are multiple types of reflectors that can be installed including reflectors that will not be damaged by a snowplow during the winter months.
They are also flexible. Lines can be repainted to change the way traffic flows. This is often how road diets are done if a median is not used. Complete streets also use this strategy when adding bike lanes to either or both sides of the street.
When rumble strips are installed along shoulders, the pavement conditions do not change. Instead, rubble strips experience degradation the same way a roadway would, or if installed on a shoulder that is already damaged and degrading, will degrade faster.
Unfortunately, inclement weather can cause multiple problems. Rumble strips likely will loose their effectiveness on shoulders if they are covered in ice or snow. If roads are not plowed, lines will not be visible either making it even more important to be aware of your surroundings while driving. To read more about this topic, click here.
Low to high cost depending on how extensive the implementation is.
Caltrans (California DOT) is in the process of restriping over 50 thousand miles of state highways within the next 10 years. They have decided that to widen the traffic lines from 4 inches to 6 inched with a paint that is brighter and longer lasting than before. It was first done in Sacramento in 2017 along I-80. The paint was used as an experiment to see if it would last under the wear and tear of heavy traffic and test it’s durability. After seeing the success, it is now being made into a state-wide movement.


The paint is made using glass beads so as light rays enter, they are reflected to the drivers to see the lines better on the road. This allows for enhanced reflectivity when light from headlights hits it and when in rainy weather conditions.
Caltrans is using this as a potential cost-effective measure and to enhance safety by having wider traffic strips. They also are adopting a policy that requires a specific amount of reflectivity to ensure better site during inclement weather conditions and evening hours to increase visibility. This will hopefully enhance safety for older drivers and truck drivers too.
To increase friction on pavement for motorists to help maintain better control while drive in both dry and wet conditions.
High friction surface treatment (HFST) is a tactic to help maintain control while driving. HFST works provide pavement friction in areas where critical braking or corner maneuvers are generally going to wear down the pavement. When excessive braking occurs, pavement can become polished and cause vehicles to lose control. HFST works to counter this result.
This surface treatment is a high-quality aggregate that is applied to the pavement using a polymer binder to restore and maintain pavement friction. It is usually applied to roads in areas that have potential to be a high-risk crash site or areas that already are high risk. Local and collector streets are generally good areas to consider HFST but are not limited to other areas. High volume intersections, interchange ramps, and selected segments of interstate alignments would benefit from these treatments as well. To learn more, click here.
Research shows that there are not many problems associated with this strategy. When applying HFST to roads, especially around the centerlines or edge lines of roads, markings will need to be painted back on. Thermoplastic adheres well to the treatment and will last longer when applied to the textured surface of HFST. Pavement marking tape should be avoided however, since it does not apply well to textured surfaces.
Common issues that have been seen are primarily due to an installation step. A list of issues that might reduce the effectiveness of the treatment can be seen below:
/ Improper mixing of the epoxy,
/ The roadway having significant cracking underneath the bonding making it not the best location for the treatment to be applied,
/ Ambient requirements might have been ignored while being installed, or
/ Roadways might be “too new” (asphalt that less than 30 days old) or applied to concrete without proper cleaning.
Low-cost
In 2013, the State of Kentucky recognized that improvements needed to be made to the road infrastructure in order to reduce the number of roadway departures/run-off road crashes. Kentucky’s rural, mountainous terrain can be problematic for many drivers and the Kentucky Transportation Cabinet wanted to address these safety concerns.
After reviewing a variety of low-cost safety options in both wet and dry conditions, the KYTC (Kentucky Transportation Cabinet) started an initial program to improve skid resistance on roads by using high friction surface treatment. The program proved to be successful, showing a 69% decrease in skid-related crashes and fatalities on roadways treated with HFST.
This resulted in a statement program at over 75 location (2010) to improve pavement friction. Sites were selected based on crash data analysis to ensure appropriate placement.

Bollards and bike lane delineators will provide a physical barrier between one object and another to try and prevent collisions from occurring.
Bollards and bike lane delineators serve as traffic lane dividers to create visual and physical separation between roadway users and to reduce collisions. Bollards and delineators are either impact resistant or non-impact resistant. They can be permanent or semipermanent and made of multiple materials such as steel or hard plastic.
Bollards and delineators are used as a traffic calming technique to protect pedestrians and bicyclists. These installations are versatile and can be used to prevent parking or direct traffic in construction zones preventing motorists from changing lanes. They can also be installed with reflective properties increasing their visibility at night.
Types of bollards include:
/ Steel pipe bollards – set and filled with concrete to provide impact resistance from vehicles. To learn more about the benefits of steel bollards, click here
/ Removable bollards – installed so they can be removed from the ground when necessary but do not provide enough impact resistance to stop a vehicle.
/ Retractable bollards – these are similar to removable bollards but are more expensive; they can retract into the ground and be covered to prevent any tripping accidents from pedestrians. To learn more about the benefits of retractable bollards, click here.
/ Flexible bollards – composed of plastic polymer, they can bend up to 90 degrees upon impact and return to their original form.
/ Collapsible bollards – adjustable posts that can collapse or fold-down on impact and be placed back up.
Bike lane delineators are a type of bollard usually placed on the edge of a bike lane to add visible separation between the driver and the bicyclist space.
The problem with bollards and delineators can be the cost of longterm maintenance. Though not the most expensive to implement, constant repair to ensure they look good and are effective can be costly. This is especially dependent on the area in which they are installed and conditions in which they are being damaged. This could potentially not be a solution for all areas.


Low to medium cost depending on the strategy and extensiveness of installation

Increase driver awareness of intersections to increase safety.
Adding reflective backplates to traffic signals help to increase contrast for improved visibility both during the day and night times. They are good for people who might be colorblind and work well during power outages by providing the reflection of headlights, signifying the intersection. It is a low-cost safety treatment that can be implemented throughout communities.
Red light running is a large problem across the nation. This can be due to a driver attempting to speed through a light to avoid stopping, or it can be in part to not seeing that there is an approaching signalized intersection. Retrofitting these traffic signals can increase driver visibility especially during the late evening/early morning hours when visibility is diminished.
Despite not being the most effective countermeasure in reducing collisions, it is a proven safety measure that still reduces crashes and unintentional traffic violations. To learn more, click here.
Much of the research done has not resulted in conflicts with this strategy. The foreseeable problem with the strategy would be the need to shut down an intersection for a period of time while being installed – but it might only last up to a few hours.
This has been a proven countermeasure in reducing crashes by alerting the driver of the signal and creating a longer reaction time to reduce the speed of vehicles when approaching an intersection.
INDOT (Indiana Department of Transportation) changed over 300 traffic signals in southern Indiana in 2016. This decision was part of a statewide effort to reduce crashes at intersections with traffic signals specifically.

The $300,000 contact was finalized and traffic lights were replaced along U.S 31 in Greenwood, U.S. 50 in Seymour, and State Road 46 in Bloomington.
Columbia, South Carolina was facing a problem where drivers were driving through signalized intersections due to low visibility. The low visibility at these intersections resulted in a high number of collisions and which the South Carolina Department of Transportation took notice of. To combat the low visibility, they installed yellow retroreflective boarders around the perimeter of the face of the existing signal backplates at thee intersections in June 2005.
As a result, all intersections saw a decrease in late-night/early morning crashes (a 49 percent decrease). Total crashes decreased 28 percent overall after retrofitting these signals. This was a lowcost solution that was relatively quick to install (two hours per intersection).
To create separation and delineation of space in roadways for multiple uses.
Distinguishing uses of roads through different colors and materials is an effective way of increasing driver awareness. A common use of this method is using brick pavers in crosswalks, which creates contrast between the pavement and crosswalk. This designates not only a setback for cars to stay behind but signifies the total space pedestrians and bicyclists are allotted on the street.
Asphalt offers flexibility in construction, maintenance and rehabilitation. It’s easy to work with and is long lasting for creating smooth roadways for travel.
/ Asphalt is the most prevalent, least expensive and easiest to install. The drawback to this material is the higher need for maintenance and its potential for deforming under the weight of large vehicles.
/ Concrete is a durable and low maintenance material. It often holds up against heavy trafficking and large vehicle traffic. This material is more expensive but generally outlives asphalt.
/ Pavers are a unique and noticeable change in the roadway often indicating to drivers to slow down and expect pedestrian traffic. The most commonly used paver types are made of concrete, brick and stone (granite also known as cobblestone). This change in material also brings a difference in color, texture, and comfort of ride. Creating a rougher drive can decrease vehicle speeds and cause drivers to use these zones more cautiously. The downside is over time these pavers could become loose and require maintenance, uneven surfaces could create difficulties for pedestrians, cyclists, and differently abled persons.\
To learn more about street design, click here.
Some cities are painting their streets to guide people to safety as well. This can be a temporary/interim test to see if the strategy works for your community, this can be used to beautify a corridor or part of the community as well. Colors can help direct a driver where to go or which lanes they are allowed to be. A couple examples would be like marking out a red lane for bus transportation only or using stencils to mark what major roadway you are traveling on.
There are a few drawbacks between material differentiation. One of the most common is the increase in maintenance for materials, like brick and cobblestone, which can be damaged over time and require small components to be reset. The other drawback is the additional cost for installation and maintenance. These materials require more time and expertise to install properly.
Paint is cheap and effective but depending on the extent a city or community is using it,it can be costly to keep up depending on the overall wear and tear of the road. It can be a great alternative to beautifying a space and creating a unique place. Despite this, it can be cost effective and used only temporarily to distinguish right-of-way.
Low to high cost depending on the extent of which a community is implementing this strategy.

To increase driver awareness of pedestrian crossings, and to increase safety for pedestrians crossing the street.


Crosswalks are essential for bike and pedestrian safety. There are multiple painted crosswalk solutions, all of which are easier for drivers to see: zebra stripes; combination designs with vertical stripes across the width of the intersection and two horizontal lines on both sides (create an outline); and full-color crosswalks (where the whole width of the crosswalk is colored).
Crosswalks do not always need to be repainted; however, it is recommended that painting be done strategically in certain situations. The following cases serve as a guide for determining if a crosswalk needs to be repainted:
/ Where there is conflict between pedestrians and vehicles;
/ If the intersection is non signalized but is a main pedestrian route and maybe have gaps limited due to traffic flow;
/ If it is a school route;
/ If it is a midblock pedestrian crossing; or
/ If there is no other place for a pedestrian to cross and it is not readily apparent.
Crosswalks are not always a safe countermeasure for pedestrians and bicyclists. This is especially true for larger, higher traveled and higher speed roads. Although pedestrian safety islands and medians can be helpful in creating a designated space for people who are using the crosswalk, drivers can be at a disadvantage. Left-hand turns can prove to be difficult for some if pedestrians or bicyclists are located within a blind spot.
One way of combating this issue would be to have a delayed signalized intersection for drivers. This is a low-cost solution that could delay a left-hand turn signal as to not overlap with the crosswalk signal that would give pedestrians and bicyclists the right of way. This is an effective measure for smaller intersections with lower speed limits as well – not only for larger multi-lane roads. This could become a common practice for intersections that have designated left-hand turn lanes.
COST:
Low-cost

Allow pedestrian and bicyclists a proper signalized time for crossing streets safely.
Most pedestrian crashes occur while attempting to cross the street By installing a push button countdown (signalized crosswalk) and making them audible to encourage inclusion and compatibility for multiple users, the signal will graphically and audibly let the pedestrians know when it is safe to cross. The signals must be timed to offer pedestrians a long enough block of time to cross the road before the signals change to allow traffic to pass through.
Push button countdowns can be used at mid-block locations and incorporated where there are existing traffic signals at intersections. Pedestrian phasing (leading pedestrian intervals) should be encouraged for setting up timers to continue to reduce the potential conflicts between pedestrian and motorists.
Some issues can arise regarding push button countdowns for instance pedestrians tend to use cross at locations close to their destination rather than at crosswalks. Fencing, planters, or other barriers can be used to discourage crossings outside of crosswalks. If there is not properly lighting, warning, or signage some motorists may not see pedestrian crossing points in time to react. Street parking can also hinder visibility of pedestrian crossing zones and should not be permitted near the intersection or mid-block crossing.
Low to medium cost depending on the extent to which this would be implemented and if new construction would have to take place.
A study done in 2000 in Lake Buena Vista, Florida used controlled and treatment sites with a countdown signal to evaluate the effects of countdown signals. This study did not go into crash data but did look into pedestrian behavior to determine if the countdowns were effective.
Multiple intersections were studied over a period of time. Ultimately, the study looked into pedestrian compliance with the walk signals, pedestrians who ran out of time, and pedestrians who started running when a flashing “don’t walk” display appeared.

The study concluded that there were both positive and negative effects on pedestrian behavior at the treatment sites in comparison to the control sites. For the purpose of the study, it was determined that countdown signals were not recommended for use at a standard intersection in Florida but that they should be tested out at other signalized intersections.

To increase pedestrian safety by allowing them the ability to cross at an intersection and increase their presence before vehicles are given right of way to travel through or turn at a traffic light.
Leading pedestrian/bicycle intervals (LPI) help create pedestrian and bicyclist presence in an intersection anywhere from three to seven seconds before a traffic light turns green and gives vehicles the right of way. This allows for vehicles turning left to have increased awareness of those crossing while giving priority to pedestrians and bicyclists and increasing safety at intersection crossings. When bike lanes are present within a street, bike signal priority can also be implemented to prevent conflict with a turning vehicle and a bicyclist going straight through the intersection.
They should be used at intersections with a history of conflict. The pedestrians and turning volumes have to be high enough to warrant additional dedicated intervals for pedestrian crossing.
LPIs require adjustments to the existing signal timing making this a low-cost solution. It has also been recorded that they can reduce pedestrian-vehicle collisions up to 60 percent at intersections that
have adopted this strategy. This strategy can also work well paired with curb extensions to increase pedestrian visibility; especially at high-conflict intersections.
A common reason a leading pedestrian interval might not be implemented is because of the idea that they will increase vehicle delay. There is a reduction of time allotted for vehicles to drive through which will delay and decrease the number of vehicles that can travel through a light cycle. Although LPIs are focused on pedestrian safety, congestion should also be accounted for in some instances. This could lead to unintended consequences such as aggressive driving and an increase in running red lights. Safety should be balanced for the intersection and all it’s users, not just a specific party.
Analysis of an intersection should be done prior to installation of an LPI.
Low-cost
A leading pedestrian interval was created at three signalized intersections in downtown St. Petersburgh, Flordia. Studies were done prior to and after the installation to collect data and determine if an LPI was a good strategy to implement. No public outreach or marketing was done throughout the study to ensure that the results would not be biased.
When the LPI was implemented, a three second interval was given to pedestrians before the traffic light turned green for vehicles. All intersections had posted speed limits of 30 miles per hour and carried high volumes of traffic.
After the study concluded, there were 44 pre-treatment observation periods at all three sites. On average, there were between two and three conflicts per 100 pedestrians with some having up to five conflicts. After the LPI was installed, 34 of the 41 sessions had no conflicts – no more that two conflicts were recorded per session per 100 pedestrians. This dramatic decrease in conflicts can likely be attributed to the pedestrian right of way with the introduction of the LPI. Pedestrians were also less likely to yield to vehicles during this time. Continuing on, no reduction in intersection effectiveness for vehicles was detected either. The LPI was kept past the study and results show that there was an increase in pedestrian comfort and safety and increased perceived safety too.
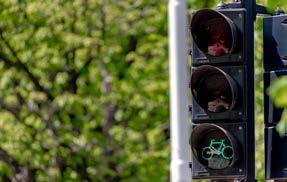
To protect pedestrians and bicyclists on the sidewalks of intersections by extending them and reducing the time and distance of crossing a street.
Curb extensions are traffic calming measures used to extend sidewalks at intersections and narrow roadways. They reduce the amount of time and distance a pedestrian or bicyclist has to spend crossing the street. Vehicle drivers can also better see pedestrians and bicyclists crossing since the extension aligns with the parking lane and does not prohibit visibility where it otherwise would without the extension.
Curb extensions are usually accompanied by no parking or stopping signs and with visual reinforcement such as painted road markings, barriers, bollards, or planters and benches. They are also paired with other traffic calming measures such as rumble strips or speed bumps.
They are usually implemented in downtowns, neighborhoods, and residential streets when necessary. Curb extensions have other purposes as well, where they can be used for bus bulbs (the area where a person waits to get on a bus) or implemented at midblock crossings (known as pinchpoints) to reduce the distance a person must cross. To read more, click here
Similar to leading pedestrian intervals, unintended consequences may occur. Because curb extensions likely will reduce the flow of traffic by slowing it down and potentially partner with bulb outs (bus bulbs), drivers could become aggressive and potentially run red lights. This could create an unsafe environment for pedestrians and bicyclists crossing the street and cause conflicts and congestion with traffic turning right onto the perpendicular street if there are vehicles in the middle of an intersection waiting to get through.
Low cost
Curb extensions cost from $2,000 to $20,000 per corner depending on design and site conditions including drainage.
SE Division Street in Portland, Oregon acts as a through street with various land uses lining it. Over time, the street became a destination point for people to visit with an increase in neighborhood retail shops and more use from pedestrians and bicyclists. Despite having a posted speed limit of 25 mph, drivers were exceeding it, driving anywhere from 26-31 mph. Travel lanes replaced curbside parking during rush hour and were underutilized.
Through an in-depth multi-year design and outreach process, the City of Portland worked with multiple teams on a plan for improving the corridor and planning for growth over the next 20 years. The street was redesigned with better travel lanes, curb extensions, marked crossing, improved bus stops, on-street bike parking, bioretention planters, and large trees.

By eliminating lanes, space was able to be reclaimed for other uses such as sidewalk improvements with added ramps to make sure the walkways were ADA compliant. Trees were used for shade and beautification, and stormwater management played a large role for development. By incorporating stormwater facilities with the curb extensions, it helped manage excess stormwater runoff from the street and keep pedestrians safe by reducing crossing distance and enhancing pedestrian visibility for the drivers.

To provide a space for bicyclists in the street with vehicles that is safe for travel.
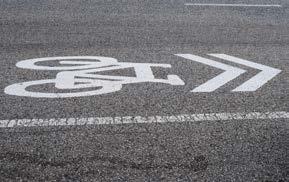
Shared lane markings (SLMs), commonly known as sharrows (combination of “share” and “arrow”), are road markings used to indicate a shared space between bicyclists and vehicles. The road marking helps to indicate roadway segments that are appropriate for bicyclists and what part of the road is safest for them; and largely encourage vehicles to share the road with bicycle users.
Sharrows are not considered a substitute for bike lanes, cycle tracks, or other separation strategies where space permits. However, sharrows do not require additional street space – only paint to designate the travel lane for the bicyclists.
This could potentially cause problems for drivers in that they would have to slow down to accommodate for the bicyclist(s) on the road. Maintenance of these roadway segments in important to assure that the paint does not fade; and that the location is correct to avoid the “door zone” and is between the wheel treads as to not cause more wear to the road markings.
Low cost
To provide a space for bicyclists to feel safe traveling from place to place near motor vehicle traffic areas.

Bike lanes are smaller designated lanes specifically in the roadway for bicyclists. Multi-use trails will sometimes have designated bike and pedestrian separation as well. Bike lanes provide a safer space for bicyclists to ride without the fear of getting hit, or at least provide a designated space for them to be out of the way of cars and pedestrians where a separated bike lane might not be available along sidewalks. Riding on city streets with motor vehicles can be dangerous at times, especially without designated bike lanes, but for those who prefer to travel by bike, it is critical to keep them safe by reducing risk of a crash.
Low cost
A study was conducted on the on-street bicycle lanes on New York City streets which had been installed prior to 2007 to determine the whether they had an impact on crash rates. They collected police reports on crashes before and after the installation. They found that the addition of bicycle lanes did not increase crash rates even with the lanes encouraging a new form of transportation to conflict with pedestrian and vehicular traffic. In fact, it was found that there was a decrease in crash rates where bicycle lanes were installed. In most cases they saw roughly 30 percent decrease in all crash types along the roadway segment. At intersections overall accidents went down by 18 percent however, some pedestrian and bicycle crashes did show an increase in crash rates likely related to the increase in use of these bicycle facilities.

To provide a space for bicyclists to feel safe traveling from place to place near motor vehicle traffic areas.

Unlike parallel bike lanes, separated/protected bike lanes provide a protective barrier between them and automotive traffic, creating a safer environment for bicyclists. These cycle lanes are appropriate for higher speed roads with higher traffic volume. This separation from motor traffic offers an added safety and comfort for travel. These bike lanes should be located along the sidewalk with parking and driving lanes beyond the barrier. There are multiple methods to separate the bike lanes from motor traffic, painted buffers, flexible delineators, raised curbs, planters, parking lanes, etc. are all viable strategies. Each strategy will depend on the current conditions of the road, available right-of-way, and budget available.
/ If not properly maintained the riding surface could become a hazard for cyclists.
/ These bike lanes should be within the roadway and level with it and not located at the grade of the sidewalk to avoid pedestrians using these paths creating potential conflicts.
Moderate cost

Provide a multi-lane protected bike lane for the efficient movement of bicycles and improving cyclist connectivity.
Bike lanes typically only travel one direction and align with automotive traffic. Two-way separated bike lanes, or cycle tracks, are unique in they permit two directional movement of bicycle traffic on the same side of the roadway. This type of protected bike lane reduces the necessary buffers for two directional bicycle traffic instead of creating two separate protected bike lanes on either side of the road. Two-way separated bike lanes are still separated from automotive and pedestrian traffic through painted buffers, bollards, raised median, raising the bike lanes, etc. These types of bike lanes are appropriate for higher speed roadways because they reduce the opportunities for collision with automobiles. This also offers a safer area for inexperienced cyclist to utilize the city’s bicycle network.
For more information, the Hillsborough MPO Bicycle Facility Selection Toolkit has explanations for various implementation strategies as they relate to bike safety.
Potential conflicts that could occur include driveways and curb cuts where drivers could collide with cyclists, at intersections if there is not proper signalization to dictate the movement of the various roadway users, the potential need to reach a destination located on the opposite side of the bike lane, cyclist speeds often vary greatly and thus ample space for passing is needed, and the potential for an increasing the likelihood of cyclist on cyclist collisions especially if ample space for passing other cyclists is not provided.
Moderate to high depending on the level of implementation.
To create a public pathway away from vehicular traffic dedicated to pedestrians and bicyclists and allow for alternative safe travel and recreational options for people.
Designated trails and bridges that are located away from the roadway to allow for a safer means of travel not only create safer travel for pedestrians and bicyclists but increase quality of life for surrounding areas. Creating a space and travel lanes that are not meant for vehicular traffic can greatly reduce the chances of collisions and fatalities.
Bridges are particularly useful in these situations because they can create a whole space that avoids potential collision with vehicles. They are designed to cross perpendicularly to the street and still connect pedestrians and bicyclists to amenities or other access points. These bridges are also used to navigate other obstacles
that would be otherwise difficult, such as rivers, next to vehicular traffic.
Trails and bridges work best when they connect to existing bikeped infrastructure, future bike-ped development, are near parks, public transit stops, schools, job centers, and neighborhoods. This encourages people to use them while also providing access to multiple amenities and places. Retrofitting can be useful –especially if there are unused railroad tracks or bridges than be used as a trail for public use. This strategy can improve quality of life for all people and encourage better physical and mental health for those who use it.
While designing or retrofitting bridges and trails for public use, safety is the most important aspect both for people using it and the need for emergency services to be able to access people in case of an accident or other emergency. Despite being a nonvehicle friendly amenity, vehicles should still be able to get through without many problems.
Convenience for a person to use a pedestrian bridge specifically could play a factor into the possibility of it not being used. Studies have been done that show people favor convenience over safety when it comes to wanting to take the shortest distance. One way to combat this would be to invest in beautification of a pedestrian bridge or by redirecting trails to make navigating to roadways more difficult.
Some bridges will ultimately not have an easy way of getting up them – some are designed with stairs or ramps that cause pedestrians and bicyclists to avoid the bridge all together and take a path that is at grade-level instead. This can result in putting a person in the way of traffic decreasing the usefulness of the bridge.
One of the most common argument for public use trails is that people will not use them. Like sidewalks, when provided they will be used and the ultimately can increase property values and bring in more income to retail services located along a trail.
/ Bridges: high cost
/ Trails: low-high cost depending on plan
The Indianapolis Cultural Trail, located in the heart of downtown Indianapolis, Indiana, is a huge success story showcasing the benefits of a shared-use path.

Leaders wanted to make it easier for people to visit the city’s cultural districts that are spread across the city away from the downtown. Through a private-public partnership, an eight-mile trail that makes a loop around the downtown and connects five cultural districts and neighborhoods and the city’s greenway system.

Since the trail has been finished, over one billion dollars has been generated for the city.
Top image: Monon Boulevard | Carmel, IN
Bottom image: Indianapolis Cultural Trail | Indianapolis, IN


Improve the safety of pedestrians crossing the street where long block segments exist with limited safe crossing opportunities present.
A Pedestrian Hybrid Beacon or Hawk Signal Crossing is a combination of a beacon flasher and a traffic control signal for marked crosswalks. Pedestrian press the button activating the beacon, and approaching drivers see a flashing yellow light indicating they should slow down, and be prepared to stop for a pedestrian. The flashing yellow light is followed by a solid yellow period, and then solid red, requiring drivers to stop at a marked line, similar to a typical traffic signal. Once the solid red light has been established, a “walk” signal is illuminated, indicating safe crossing for the pedestrian. During this period, the motorist is required to stay stopped until the crosswalk is clear of pedestrians. Pedestrian Hybrid Beacons should only be used at mid-block crossings.
Top image: Source
Bottom image: Source
These signals are newer traffic control measures and driver and pedestrians alike are not as familiar with their use. Potential conflicts will occur when pedestrians do not follow the prescribed crossing indicator and begin walking before the motorist have been indicated to come to a complete stop or without pushing the button to activate the light cycle.


Moderate cost
Top image: Source AZPM
Bottom image: HAWK treatment in Tucson, AZ Source
Increase cyclists visibility and safety at intersections.

Bike boxes are designated zones in front of the vehicle stop bar at signalized intersections. These zones are meant for the cyclists to wait at the intersection for the phasing to change at the light. This space improves visibility of cyclists at intersections and decreases the likelihood of collisions from through traffic and those turning at the intersection. This queuing of riders also offers experienced or faster cyclists the opportunity to pass the slower cyclists reducing potential conflicts within the bike lane. Bike boxes that extend across the entire intersection can assist cyclists in making left turn movements. This placement can also decrease the encroachment of motorists into crosswalks.
Potential conflicts could arise with right turn movements by motorists who encroach into bicycle and pedestrian zones. To avoid this, it is recommended that these intersections restrict turning movements during red light phases.
Low cost
Improve the safety of cyclists at multi-lane intersections which are performing left turn movements.

Two-stage turn queue boxes are used at intersection for cyclists attempting to turn left. This is most useful at multi-lane signalized intersections. Typical bike lanes are not conducive to left turn movements which cross multiple lanes because it requires them to merge into traffic. With a two-stage turn queue box the cyclists turning left stop in the intersection in the queue box aligning with the desired bicycle facility and waits for the light to shift.
This intersection configuration is much safer for cyclists however it does add time their travel as they may have to wait though two light cycles.
Low cost
Increase awareness and visibility of other vehicles, pedestrians, and bicyclists by clearing the sight line of obstructions near intersections and crosswalks.
Obstructed sight lines can cause many problems for drivers, bicyclists, and pedestrians. Specifically for drivers, reaction times and stopping distances can be greatly reduced and cause more serious or fatal crashes. By reducing the obstructions and creating a clear line of sight, a driver will be more aware of the surroundings. Additional signage to warn the drive of upcoming intersections or crosswalks will also help prepare a driver of an approaching stop and increase awareness.
Sight distances are particularly important for areas that see high pedestrian and bicyclist traffic crossing roads. Removing vegetation or creating an embankment are ways of increasing sight distances. In some cases, road construction (realignment) might need to be done where it would be otherwise impossible to create more visibility. This could be more costly but ultimately safer.

Some issues involving this strategy are as follows:
/ Can get costly if road reconstruction or realignments are required and land acquisition is needed to address it;
/ Some intersection approaches might give the perception of higher approach speeds and result in unintended outcomes;

/ Reducing sight distances in specific areas could encourage reduced approach speeds, but careful maintenance must be taken with this approach;
/ Intersections often have a larger sight line because of the location and angle, requiring the driver to look outside of the “normal” viewpoint (side windows); and
/ Make sure and maintain that all traffic signs and signals are not obstructed by vegetation or street furniture.
Low to medium cost depending on the level of construction required.
Improve driver awareness of curves, oncoming intersections, hidden drives, etc. through the use of signage that is easily seen at all points throughout the day.
Signage is an important component for motorists and other roadway users. Signage provides information for location and direction; warning of upcoming roadway features; and instructs the motorist on proper usage of the roadway. The placement and quantity of signage on roadways is typically based on engineering specifications, studies, or best judgement related to traffic volume and roadway features, such as the curvature of roads. Signage acts as an important guide and warning for drivers in countless situations keeping them aware of their surroundings.
Sign visibility is important to allow motorists proper time to react. Retroreflectivity is an important feature of signage at night. Retroreflectivity is the optical phenomenon where the rays of light are reflected directly back to its source. This allows drivers to more easily see signage and reduces sign glare on adjacent properties. The level of retroreflectivity can determine whether a driver misses a sign and potentially causes a crash. Retroreflectivity should be evaluated to ensure that signs are clearly visible from a distance offering proper time to stop if needed. Putting signage in combination with one another has shown a decrease injury related
crashes and non-injury related crashes. Partnering warning signs (turn/advisory speed signs) with others will continually bring attention and give information to the driver.
When motorists approach a curve signage may be needed to properly warn motorists of its severity. Chevron alignment along curves help to signify the sharpness of a curve. Chevrons should be installed four feet above the roadway surface and outside the curve, in line with the approaching traffic. Spacing of chevrons are determined by the curve radius and advisory speed. This tactic has seen a decrease in crashes when installed on rural highway curves. Directional arrow signs can also be used to define sharp curves. Usually they will appear on the outside of the curve per direction for the curve/turn. It is suggested that these signs could be used in combination with chevrons and/or doubled up to increase awareness.
The size of the signs themselves should also be thought about for the areas in which they will be located. The minimum size of signs is not recommended by the Manual on Uniform Traffic Control Devices (MUTCD) but allow them on low-speed roads where the reduced size is still adequate for the warning or if physical conditions prevent the installation of a larger sign. Oversized or larger signs should be used in special applications where speed, volume of traffic, or other factors result in the need for a larger sign (determined on studies or an engineer’s recommendation).
Doubling up on signage would involve installing a second identical sign on the left side of the roadway (instead of just one sign on the right). Doubling signage increases the chances of a person seeing the sign and responding appropriately, and potentially will increase visibility in case of an obstruction of the sign located on the right side of the roadway.
Constant maintenance will be required to check on visibility. Making sure that trees or other vegetation don’t cover the sign and that they are up to their retroreflectivity standards will be important.
Low cost
Top image - signage that is clear of any foliage
Bottom image - retroreflective signage to highlight an upcoming curve


Improve pedestrian safety and reduce the number of crashes at designated crossings.

Implementing flashing signage or ground lights at crosswalks can improve the visibility and likelihood of motorists to stop for crossing pedestrians. These flashing lights can be installed in new or existing signage above or in the roadway. Embedded crosswalk flashers are located in the roadway on the pavements surface. By installing flashing lighting at crossings raises motorist awareness of potential pedestrians and reduces speeds near these points. These installed lighting can always be flashing, or they can be programmed to turn on when pedestrians push a button.
Some issues that may arise to the use of flashing lighting at pedestrian crossings are that pedestrians will typically cross where it is most convenient for them even if a crosswalk is nearby, depending on visibility drivers may need advanced warning of the pedestrian crossing they are approaching to improve response times, and parking should be removed near pedestrian crossings
to improve sight distances. Embedded crosswalk flashers, depending on their design, can be difficult to maintain during winter months. Flashing signage can be less affective if it is on constantly because some motorists may ignore the warning. Lighting that only is applied during certain times of the day or when activated may be more affective.
Low to medium cost depending on the range of implementation
San Jose, California desired to determine what kind of crosswalk recognition works best in their community. The City tested two different crosswalk safety measures, flashing beacons and ground flashers. Both were installed to similar roadways and driver stopping distances and percent of vehicles which yield were recorded. At the end of the study San Jose found that both flashing beacons and crosswalk ground flashers increased the braking distance of vehicles approaching the intersection. In most cases doubling the braking distance. However, the embedded crosswalk flashers were found to have the greatest success in getting drivers to yield to pedestrians crossing. The number of drivers yielding quadrupled within a six-month period. Embedded crosswalk flashers work in some communities, but it can increase roadway maintenance costs. Street sweepers and snow removal equipment would have difficulties avoiding these flashers and could easily damage them. This makes them difficult to implement in cities with a temperate climate.
Click here to view the PDF.

Improve pedestrian and bicycle safety by providing adequate lighting which improves visibility of all parties. By raising visibility, drivers are more likely to see the pedestrians and cyclists reducing the likelihood of a collision.
Improving lighting means increasing the quality and quantity of lighting along pedestrian and bicycle corridors; and at intersections to improve visibility and reduce potential collisions. In addition to reducing collisions with vehicles, it can also improve the perception pedestrians have for the corridor’s comfort. Lighting is an important factor in improving pedestrian perception of safety. Dim lighting is not sufficient and limits the perceived and real safety; and visibility along roadways and trails discouraging walking at night.
About two-thirds of pedestrian fatalities happen at night under low-light conditions. By increasing lighting, these statistics can change dramatically. Roughly 50 percent of these fatalities can be reduced just by increasing lighting. Various analysis of multiple studies have concluded that improved street lighting reduces crime by drawing public attention to the location.
Lighting can be unique to a place; it does not have to be specific to LED bulbs and overhead lighting. Incorporating lighting into safety and design features such as bollards not only help create a safer
space for pedestrians to be, but brings attention to a driver for where people could be; this is useful practical when done near crosswalks or large event or gathering spaces.
Lighting can be used to define a specific area within the community. Light features in a downtown, along a corridor, and within neighborhoods create an identity that can be used to increase the sense of place within that area. Specifically, programmable lighting enhances the identity and nighttime interest of locations (downtowns and other popular spots around the community). Lighting can be used as an attraction, be used on building exteriors for special occasions, and used for public art displays.
For more information, click here
Some conflicts could be associated with light infiltration into nearby residences. This light trespass or light glare could cause disruptions or nuisances for those adjacent to the lit streets. There are methods to counteract these conflicts such as full cutoff lighting, “Smart Lights” or motion sensing lighting which is normal dimmed but raises the light level when a pedestrian is present.
Moderate to high cost depending on the level of implementation.
One example in San Francisco, CA estimated that it would cost roughly $610,000 to furnish and install 34 poles (pedestrian-scaled lighting specifically) spaced 50 feet apart around a rail station. However, the costs vary depending on the type and placement of lighting.
Seattle, Washington has a unique situation when it comes to addressing lighting in their city. No single department or entity owns and operates street lighting. The main implementer is the Seattle City Light and Seattle Department of Transportation. The City however, recognized its importance and is striving to fund lighting through the general fund in the future. Seattle also sets the light levels and quality requirements that are to be upheld in the right-of-way. The City prioritized lighting placement based on the following criteria
/ Pedestrian demand (based on land uses as generators or attractors of pedestrians);

/ Socio-economic status (with traditionally under-served areas prioritized); and
/ Street segment classification (importance in pedestrian network)
Seattle also decided to engage with their residents and hoped to gather data and information through other processes and plans to get residents and organizations to identify priority areas to focus attention on and so the City can update the Pedestrian Lighting Plan. The plan also recommends a number of design guidelines for the actual lighting design to reduce light pollution; appropriate placement; design of the fixture and its appropriateness in its specific context.
To read the Seattle Department of Transportation’s Pedestrian Lighting Citywide Plan (2012), click here.
The goal for adding street trees and other vegetation is to create a visually appealing edge condition and barrier for motorists to decrease driving speeds and protect pedestrians.
Landscaping, especially street trees, create a more enjoyable and safer walking environment for pedestrians. This helps to form visual walls and create a barrier which helps drivers distinguish their (driving) environment from the shared environment. This will potentially lower the crash rates in areas and encourage slower driving speeds as drivers will likely be more aware of their surroundings.
Aside from safety benefits, there are countless health benefits and it can help boost the local economy. Landscaping should be done in areas that are pedestrian friendly, which makes downtowns or corridors with shops and restaurants and ideal location. Not only will people feel safe walking down the sidewalk, but businesses might see an increase in visitors and an increase in their property value. This will trickle into neighboring properties as well. To read more about additional health and safety benefits, click here.
In a study conducted by Texas A&M and the Seoul Development Institute, found that “[T]here is a correlation between certain types of landscape treatments and reduction in crash rates” creating a safer environment when planted in appropriate locations which do not impede sight lines. 1 Some studies have indicated that the mere presence of vegetation can be a calming measure which can help alleviate stress of drivers which in turn improves driving quality of the driver.
Lowering vehicle speeds is a method to increase pedestrian and cyclist safety but does it work to protect them when vegetation and street trees are located within the right of way? Several studies have indicated that where pedestrian amenities and vegetation are present improve safety of drivers, pedestrian, and cyclists alike. One study conducted in Florida compared local crash rates between two identical roadways, one with streetscape improvements and one without. The results indicated “for midblock crashes (11% fewer), injuries (31% fewer), and fatalities (none versus 6). Pedestrian and bicyclist injuries were likewise fewer in the improved road sections.”
To read “Design of Safe Urban Roadsides: an Empirical Analysis” by Eric Dumbaugh, click here
To read “The Street Tree Effect and Driver Safety” By Jody Rosenblatt Naderi, Byoung Suk Kweon, Ph.D., and Praveen Maghelal, click here.
The traditional standard of thinking for engineering roadways is that trees are to be avoided. The main reason is to reduce the number of obstacles which are at the edge or within the right-ofway. Street trees and other vegetation can be are hazards to sight lines at intersections and private drives. They also are dangerous when motorists do collide with them often resulting in a severe or even fatal accident depending on the speed of the vehicle.
Additionally, the relationship between crashes and trees is not very well understood. It is difficult to prove that street trees prevent crashes from happening. It is important to understand driver behavior in connection with roadside features. It could be argued that adding more to the environment for a driver to pay attention to could increase the crash risk and rates.
One thesis study from 2017 by Maggie Harthoorn at the University of Nebraska-Lincoln concludes that there is a relationship between street trees and roadway safety. The study looked at crash severity in Des Moines, Iowa and ultimately determined that there is no significance between the density of street trees and frequency of the crash rates despite there being a relationship between street trees and roadway safety. A lot of this comes down to human error. However, there is a positive relationship between street trees and crash severity. This unfortunately means that street tress increases the risk of crashes being more severe. When planting street tress, location needs to be a top priority and receive additional consideration as to try and prevent the possibility of increased crashes.

Low to moderate cost depending on the implementation level. One planting can cost from roughly $250 - $600 including maintenance for the first three years. They are generally planted anywhere from four to eight feet from the curb.
Additional landscaping costs will also vary depending on the plantings (flowers and shrubs).
Improve intersection linemarkings and establish a clear stopping point for vehicles safely at intersections to permit safe movements of other vehicles, cyclists, and pedestrians whether it be at a signalized or signed intersection.
The improvement of intersection visibility is important to improve the safety of all roadway users. Motorists can miss signage if it has low visibility especially when there are no or faded lane markings. When stop bars, lane markings and even parking linemarkings are delineated it can greatly improve motorist driving patterns and awareness of intersections to reduce crashes and speeds.
The worst case scenario is that a road user might not realize an intersection is present and collide with another user (often at high speeds). Intersection delineation works to direct the driver to a clear path at an intersection. Sometimes median islands are used to help protect pedestrians and bicyclists from drivers, other times bollards may be used. Commonly, linemarking (painting lines) is the most used approach to direct a vehicle where to go.
To learn more, click here.
To view the “Toolbox on Intersection Safety and Design” by the Institute of Transportation Engineers and U.S. Department of Transportation Federal Highway Administration, click here.
A potential conflict could arise when old lane markings are in different or in conflict with new ones; the old linemarkings should be removed properly through grinding or other appropriate method to avoid motorist confusion or misusing lanes at an intersection.
A case study performed in Winston-Salem, NC was performed to test the effectiveness of low cost intersection improvement strategies. The goal was to improve safety at stop sign controlled intersections through the use of stop ahead signs and improved intersection linemarkings. The linemarkings added were double yellow centerlines (up to 50 feet) and stop bars (12 inches wide) to the existing intersections. These strategies were show to reduce the average crashes per year by roughly 48 percent.

To reduce the speed that drivers make right turns, to reduce the distance that pedestrians must cross to get across the street, and to increase driver awareness of pedestrians by increasing visibility.
One the most common vehicle-pedestrian crash types are due to a right-turning vehicle hitting a pedestrian. Wide turn radius permits greater turning speeds for drivers which can result in a shorter time to react to pedestrians and cyclists in their pathway. One solution is to reduce curb radii at intersections to force slower turning movements. By tightening or reconstructing the corner to force a driver to navigate a tighter turn will result in slower right turns. In addition to reducing the turning speed of the vehicle, it can also reduce the distance pedestrians travel across an intersection decreasing the likelihood of interactions with vehicles.
Curb radii should be designed to accommodate for the types of vehicles using the roadway. Everything from semis, buses, fire
trucks, to other personally owned vehicles. Effective curb radii should be used based on the vehicles using the road and the setting in which the intersection is located. The smallest practical curb radii should be used whenever possible (between 5 – 10 feet). An appropriate effective radius for urban streets with high volumes of pedestrians is 15 – 20 feet. For arterial streets with a substantial volume of turning buses and trucks, the radius increases to 25 – 30 feet.
For more information on how reducing the curb return and curb extensions are designed and work, click here
Reducing curb radii can create safer environments for pedestrians however, it can also create limitations for larger vehicles. Trucks, buses, emergency vehicles may have difficulty at narrow intersections with small curb radii which could cause conflicts with pedestrians. These large vehicles cannot make sharp turns and could result in these vehicles driving on the curb potentially damaging it or hitting pedestrians.

Low cost
Construction can range from $15,000 to $40,000 per corner depending on site conditions.
Keep traffic flowing without the need for stopping at an intersection, while also reducing the number of potential collision points.
Round-a-bouts have proven to be safer than traditional stop sign or signal-controlled intersections. They are designed with characteristics that make a driver more aware and drive slower than at a traditional intersection. Round-a-bouts are designed with:
/ Channelized approached,
/ Yield control at all entries,
/ A counterclockwise circulation of all vehicles that enter the circle, and
/ Appropriate geometric curvature to encourage slower travel speeds through the intersection and are the center island.
With a round-a-bout, traffic is moving slower than it would through a standard intersection. It is physically is designed to make a driver slow down when approaching and entering the circular intersection. With this decrease in speed, round-a-bouts help maintain constant movement and traffic flow since there is less “stop and go” while driving through. The perception of a driver wanting to get through a traffic light is also eliminated
because traffic lights are not present. The chances of a collision (specifically a T-bone collision) decreases because of the same movement through the intersection.
Though the installation of a round-a-bout might seem expensive, it is comparable to installing a digital traffic signal, but the upkeep and electrical costs are much less expensive.
Similar to round-a-bouts, traffic circles work in a similar way. The main differences are, the use of a stop sign versus yield signs at all entrances; and the angle of approach. Also, round-a-bouts can be one or multi-laned; traffic circles usually work best when they are one lane. Traffic circles are better for pedestrians and bicyclist crossing because during a stop, a driver is likely looking around at their surroundings. This increases awareness of the drivers to look for pedestrians or bicyclists as opposed to yielding to oncoming traffic that might already be in or entering the circle. There are two different mindsets when changing the type of signage at the entrance to the circular intersection.
Some might argue that changing a signaled intersection to a round-a-bout might make the intersection less efficient because the capacity will decrease. However, round-a-bouts are designed to move traffic through them while allowing for the same capacity of traffic as prior to its installation while maintaining a slower speed and decreasing the times a driver must stop.

Location is a big factor in developing round-a-bouts. While adding a round-a-bout is up to the city/community and planners, they do require heavy construction. This makes round-a-bouts better suited for less dense traffic situations. Suburban cities and more rural communities might be better suited to take on round-about development than higher density cities, but it should not discourage developing round-a-bouts.
Moderate cost
Although the prices do range depending on the location and design of the round-a-bout, on average one round-a-bout is estimated at roughly $250,000. However, some designs can be as low as just under $200,000 and go up to roughly $500,000 per round-a-bout.

Carmel, Indiana is one of the most well-known communities that have implemented round-a-bouts in their community. The questions is, are these traffic improvements providing the benefit they were intended for? Carmel has replaced a significant number of its signalized intersections with roundabouts since 1996 in the hopes to save money for the city and its motorists while reducing traffic incidents.
As of 2019 the City contains more than 125 roundabouts. Due to the development of all these round-a-bouts, the city has seen a reduction of crashes that result in injury by 80 percent and a total reduction in crashes by 40 percent at locations where round-abouts are implemented. A study indicated that in 1996 the average number of accidents averaged to roughly 7 injuries for every 1,000 residents. This number has decreased by 2017 with 2 injuries for every 1,000 residents (data extrapolated to cover the year after analyzing 15 days of traffic accidents). This decrease in accidents has occurred even with an increase in population from 31,808 in 1996 to 92,475 in 2017.
Maryland state conducted a study at five different locations where round-a-bouts were installed. Each of these round-abouts were installed at intersections that were originally twoway stop-controlled intersections that saw high collisions. The study examines the crash data prior to and after round-a-bout conversion at these sites over a 15-year period (1990-2007) but the observation periods ranged between five to 13 years.
As a result, all intersections saw either a decrease in fatal crashes or remained the same over this observation period. Injury related crashes also decreased by 79 percent or higher at all intersections. Two intersections did see a slight increase in total crashes (one or two more than what was counted during the before installation study), but otherwise the results remain positive for decreasing the total number of collisions. Overall, total crashes decrease 69 percent, injury related crashes decreased 88 percent, and fatal crashes decreased 100 percent.
Overall, Maryland did not experience implementation issues with installation of the round-a-bouts. Average costs during this time ranged from $194,000 to roughly $500,000 per round-a-bout depending on the location.
This page intentionally left blank.
AUSTIN, TEXAS
City of Austin: 2016-2018 Action Plan
May 2016
Vision Zero ATX
More information about Austin’s Vision Zero Action Plan
City of Boston Transportation Department: Vision Zero Boston Action Plan
February 2016
City of Boston Vision Zero
Vision Zero Chicago: 2017-2019
June 2017
City of Chicago: Vision Zero Chicago
FORT LAUDERDALE, FLORIDA
Vision Zero Fort Lauderdale Five-Year Action Plan: Zeroing in 2022
Vision Zero Fort Lauderdale
Vision Zero Los Angeles County: A Plan for Safer Roadways
2020-2025
November 2019
City of Los Angeles Vision Zero
Vision Zero Action Plan 2014
New York City Vision Zero
Portland Vision Zero 2-Year Update
June 2019
The City of Portland: Vision Zero Action Plan
December 2016
Vision Zero San Francisco: Two-Year Action Strategy 2017-2018
Vision Zero SF Action Strategy
Vision Zero SF
Vision Zero: Seattle’s Plan to End Traffic Deaths and Serious Injuries by 2030
Seattle Department of Transportation: Vision Zero
Vision Zero Action Plan, Part 1
December 2015
Vision Zero Action Plan, Part 2
D.C. Vision Zero
INDIANAPOLIS METROPOLITAN PLANNING ORGANIZATION (MPO)
Website
INDIANAPOLIS DASHBOARDS & REPORTS
Website
INDIANAPOLIS 2015-2018 FATALITY AND SEROUS (INCAPACITATING) INJURY CRASH DATA INTERACTIVE
MAP
Interactive Map
INDIANAPOLIS: REGIONAL BIKEWAYS PLAN
Website
INDY MOVES 2018
Plan
2020-2023 INDIANAPOLIS REGIONAL TRANSPORTATION IMPROVEMENT PROGRAM
Plan
VISION ZERO RESOLUTION: INDIANAPOLIS
METROPOLITAN PLANNING ORGANIZATION
PDF Resolution Document
INDIANAPOLIS/MARION COUNTY PEDESTRIAN SAFETY ACTION PLAN
PDF Plan Document
Website
The Vision Zero Network is a nonprofit collaborative network that focuses on promoting the movement of Vision Zero. Their website contains a number of resources for communities including goals, resolutions, counter measures, case studies, plans, a list of communities who are designated as a Vision Zero City, and best practices by agencies and communities who are working to eliminate traffic facilities and serious injuries.
Website
Urban Street Design Guide
NACTO is an association of 84 major North American cities and transit agencies that exchange transportation ideas, insights, and practices. NACTO’s approach to transportation issues aims at helping to build cities as places for people with safe, sustainable, accessible, and equitable transportation choices. Their website and guides help others learn about transportation solutions and strategies to issues on a variety of topics including street design, data, and vehicle optimization.
Website
Office of Safety
USDOT and FHWA provides guidance over the constructions, maintenance, and preservation of the Nation’s highways, bridges, and tunnels. They also conduct research and provide technical assistance to State and Local agencies to improve safety and mobility and encourage innovation. The website contains this informations, along with recent news articles and updates, strategies, case studies, and additional programs and resources for agencies to use and reference. These resources may be about common issues and statistics, laws and regulations, and federal aid and funding essentials.
Website
The Pedestrian and Bicycle Information Center provides resources and strategies to help communities learn, understand, and work towards creating a shared, multi-modal environment. Pedestrian and bicyclist safety is the focal point of this site and is broken down into specific topics such as bike share, complete streets, and equity to help guide your search. Additional case studies and resources can be found to help others implement these designs and strategies into their own community.
Website
Smart Growth America is a non-governmental advocacy organization that supports the National Complete Streets Coalition. Smart Growth America provides resources to support the development and implementation of Complete Streets policies.
Website
The DOT FHWA hosts every state’s current SHSP which provides a comprehensive plan that provides a comprhensive framework for reducing highway fatalities and serious injuries on all public roads. This website link also has information and links to legislation/ guidance and noteworthy practies.
Website
FHWa‘s HSIP helps states plan highway safety improvement projects using a performance-driven process, implement those projects, evaluate the effectiveness and annually report on the status of the implementation efforts. This website link also has information and links to legislation/guidance, noteworthy practices, and other resources.
PDF Document
US Department of Transportation Federal HIghway Administration Transportation Safety Planning, Report #FHWA-SA-18-024, August 2018.
This guide assists Metropolitan Planning Organizations, local communities, and affiliated transportation agencies and stakeholder to use a safety planning process to work towards the zero deaths and injuries vision. This document is a step-bystep guide to develop, implement, and evaluate regional or local safety plans and highlights noteworthy practices, present safety considerations, and show how safety practitioners engage in safety planning efforts, analyze data, set goals and targets, identify strategies, prepare a document, and evaluate the effectiveness of the plan.
PDF Document
US Department of Transportation Federal HIghway Administration, Report #FHWA-SA-17-072, July 2018
This document was made by the Federal Highway Administration (FHWA) as a part of the Safe Transportation for Every Pedestrian (STEP) program. STEP’s purpose is to help transportation agencies address crashes by promoting countermeasures with known safety benefits at uncontrolled crossing locations.
PDF Resolution Document
VISION ZERO RESOLUTION: CITY OF ALEXANDRIA, VA
PDF Resolution Document
VISION ZERO RESOLUTION: CITY OF BEECH GROVE, IN
PDF Resolution Document
SAFE AND HEALTHY STREETS: COMMISSION OF RICHMOND, VA RESOLUTION
PDF Resolution Document
ELEMENTS
PDF Document
One chapter of the Better Streets: San Francisco Plan that provides elements and strategies for landscaping along streets to make a usable space for people. Streetscape elements discussed in the chapter include: urban forest, stormwater management, lighting, paving, site furnishings, and utilities and driveways.
To view the whole plan, click here
PDF of the Study
This study investigates geometric, roadside, and traffic control device variables that may affect driver behavior along four-lane roadways in suburban networks.
PDF of Study
This study focuses on safe speeds and highlights efforts in Portland, OR. Policy and design strategies to encourage safe speeds and result in safer conditions for all roadway users are explored.
PDF of Plan
This document was developed to assist policymakers, community members, and professionals, particularly who work in transportation, law enforcement, and public health, to develop, implement, measure, and communicate clear, meaningful expectations for Vision Zero.
PDF of Report
This report was done in support of Vision Zero in which the City’s goal is to eliminate traffic deaths by 2024. To inform the City’s advancement of the Automated Speed Enforcement programs, the San Francisco Controller’s Office administered a survey in June 2015 to multiple Vision Zero cities across the country. The key findings are about various program implementation approaches and reported effectiveness of the technology from the cities that were surveyed.
PDF of Report
This fact sheet contains information about motor vehicle crashes and fatalities based on data from the Fatality Analysis Reporting System (FARS). The statistics cover various topics such as environmental characteristics, speeding, age, and helmet use and effectiveness.
Website
This toolkit is a guide for incorporating a Complete Streets approach into local planning, design, and construction processes and documents.
