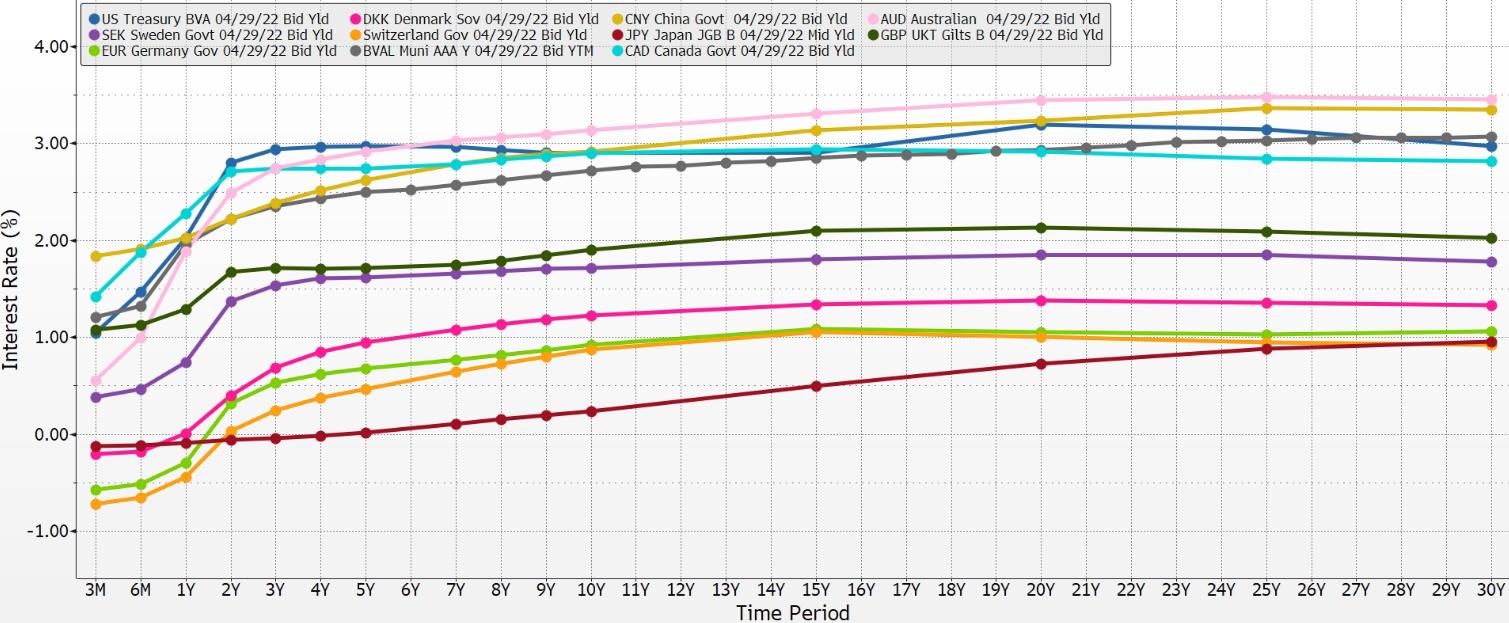
Table B: Every Date for a Specific Curve This final slide is a summary of all the data, shown in a different format. The currencies are on the left axis, and dates are the horizontal array at the top of the slides. The z-scores are found in the far-right columns. Again, the gravitation to bunching is shown. We can also see the outliers in the z-scores. These slides are all derived from market-based prices that were listed and obtained via a Bloomberg terminal data system. Analysts can guess at the forces that changed these prices. We do that as well. We can draw conclusions about how the market dampens the activity and transfers volatility to the currencies. How the mechanism will evolve remains to be seen.
One Sarasota Tower: 2 N. Tamiami Trail, Ste 303 Sarasota, FL 34236
|
T: 800.257.7013
|
F: 941.960.2047
75


